Urban Wasteful Transport and Its Estimation Methods


1
College of Surveying and Geo-Informatics, Tongji University, Shanghai 200092, China
2
Guangdong Techno-economy Research and Development Center, Guangzhou 510070, China
*
Author to whom correspondence should be addressed.
Sustainability 2018, 10(12), 4562; https://doi.org/10.3390/su10124562
Submission received: 15 October 2018
/
Revised: 17 November 2018
/
Accepted: 29 November 2018
/
Published: 3 December 2018
(This article belongs to the Special Issue Sustainable Road Transportation Planning)
Abstract
:The paper studies urban road traffic problems from the perspective of resource science. The resource composition of urban road traffic system is analysed, and the road network is proved as a scarce resource in the system resource combination. According to the role of scarce resources, the decisive role of road capacity in urban traffic is inferred. Then the new academic viewpoint of “wasteful transport” was proposed. Through in-depth research, the paper defines the definition of wasteful transport and expounds its connotation. Through the flow-density relationship analysis of urban road traffic survey data, it is found that there is a clear boundary between normal and wasteful transport in urban traffic flow. On the basis of constructing the flow-density relationship model of road traffic, combined with investigation and analysis, the quantitative estimation method of wasteful transport is established. An empirical study on the traffic conditions of the Guoding section of Shanghai shows that there is wasteful transport and confirms the correctness of the wasteful transport theory and method. The research of urban wasteful transport also reveals that: (1) urban road traffic is not always effective; (2) traffic flow exceeding road capacity is wasteful transport, and traffic demand beyond the capacity of road capacity is an unreasonable demand for customers; (3) the explanation that the traffic congestion should apply the comprehensive theory of traffic engineering and resource economics; and (4) the wasteful transport theory and method may be one of the methods that can be applied to alleviate traffic congestion.
1. Introduction
Urban transportation is the artery of a city, which sustains the history, civilization, and development of a city. However, under the dual influence of rapid urbanization and motorization, urban traffic congestion, which affects the whole world and is difficult to overcome, arises. Urban traffic congestion refers to a phenomenon in which a car is crowded and the speed is slow, usually appearing at holidays or commuting peaks [1]. This situation often occurs in the world’s major metropolitan areas, highways connecting the two cities, and areas with high car usage [2]. The Texas Transportation Institute of United States, estimated that, in 2000, the 75 largest metropolitan areas experienced 3.6 billion vehicle-hours of delay, resulting in 21.6 billion litres in wasted fuel and $67.5 billion in lost productivity, or about 0.7% of the nation’s GDP [3]. In Canada, according to the Toronto Board of Trade, in 2010, Toronto is ranked as the most congested city of 19 surveyed cities, with an average commute time of 80 min [4]. Although China’s urbanization process started late, it has been rapid. Urban traffic congestion in China is increasingly serious and continues to expand rapidly from one road to entire road networks, from neighbourhoods to entire cities, and from a small number of cities to most cities [5,6]. In order to solve the problem of traffic congestion, many scholars not only adopt a series of traffic engineering technology to make traffic improvement, but also launch a large number of traffic science studies to carry out theoretical and methodological innovation. In general, the study of urban transportation is mainly reflected in the following aspects:
Research in urban traffic science: Early urban traffic science research mainly concentrated on the theory and method of modern urban traffic planning and design [7,8,9], and then gradually established the theoretical framework and compilation technology of urban traffic science [10,11,12]. With the development of the times, the study of urban transport has gradually shifted to the planning and methods of sustainable development [13]. The research of these scholars is of great significance to the establishment of a comprehensive transport system and the best benefits of transportation.
Research in traffic flow: Attempts to produce a mathematical theory of traffic flow date back to the 1920s, when Frank Knight first produced an analysis of traffic equilibrium, which was refined into Wardrop’s first and second principles of equilibrium in 1952. Later, with the gradual improvement of traffic flow research, its research contents are also expanding. From establishing traffic flow models with mathematical methods [14,15,16,17,18,19,20], it is gradually extended to the study of traffic flow operation safety [21,22,23] and the relationship between traffic flow and service level [24,25,26,27].
Research in urban traffic congestion: Traffic congestion occurs when a volume of traffic generates demand for space greater than the available street capacity [28]. The study of urban traffic congestion mainly involves the mechanism of congestion generation [29,30], the law of congestion propagation [31,32,33], the control of congestion dissipation [34] and the influence of urban spatial structure and land use pattern on urban traffic [35].
In general, urban traffic research has gone through many stages, from urban traffic structure optimization research to road network and its capacity research, to modern urban traffic management research, and then to intelligent transportation research [36]. Undoubtedly, traffic science research provides valuable theoretical and methodological support for improving urban traffic, promotes scientific layout of urban road network, optimizes urban traffic structure and traffic environment, standardizes urban traffic order, enlarges traffic capacity of road network, and improves road capacity. However, these studies are still insufficient to give a completely reasonable theoretical explanation of urban traffic congestion and some operational problems in practice.
Compared with the previous studies, innovations of the paper are as follows: (1) This paper uses resource science theory to study the scarcity of traffic resources that is not discussed in traffic science. The scientific problem of “urban wasteful transport” is put forward, and the scientific definition of this academic term is given; (2) combined with the analysis of traffic flow theory, the quantitative discrimination method between the wasteful transport and normal transport is obtained, and the estimation method of wasteful urban transport is derived; and (3) the innovation of urban traffic theory and method in this paper provides a new knowledge base for explaining urban traffic congestion and the “Law of peak-hour expressway congestion”, and also provides a new method for efficient use of road resources to alleviate or solve urban traffic problems.
The remainder of the paper is organized as follows. First, Section 2 presents the definition and connotation of wasteful transport. Section 3 presents the theoretical framework and methodology of our research. Section 4 is the empirical research. Section 5 presents the results of empirical case study in this paper. Section 6 discusses some questions of the article. Finally, Section 7 concludes the paper.
2. Definition and Connotation of Wasteful Transport
2.1. Resource Science Theory
According to the theory of resource science, human activities cannot be separated from resource exploitation and utilization [37,38]. Resources are limited relative to human needs, and demand exceeds supply. Every project requires the common support of a variety of resources [39]. Except for human utilization levels, project efficiency often depends on a reasonable combination of resources. As revealed by the “cannikin law” [40], the capacity of a cannikin is determined by the shortest piece of wood. When several kinds of resources are used, the results of human activities are determined by the least amount of resources. Furthermore, such resources are considered scarce resources when the supply does not fulfil the need.
2.2. Resource Composition of Urban Transport System
The fundamental purpose of an urban transportation system is to meet the travel demand and material flow needs in urban areas. According to existing theories of traffic engineering, the resources for urban transportation systems can be divided into road resources, ancillary facility resources, parking lots, and vehicles [41,42,43,44]. Road resources extend throughout the city and are designed to a certain width for pedestrian vehicles on the ground. Road resources also include the space under roads and the other components of the network system also support traffic such as roadbeds, roads, bridges and culverts, ditches, retaining walls, slope protection, and fences [45]. Ancillary facility resources are connected to roads and ensure the safe, orderly and convenient operation of traffic. These resources include signal control facilities at intersections, road signs, road markings, and so on. Parking lots are parking locations for vehicles [46]. A vehicle is a machine that transports passengers or cargo and is manipulated to achieve space transfer [47].
2.3. Analysis of the Scarcity of Urban Transport Resources
Road resources depend on the supply of land [48]. The scarcity of urban road resources is increased by limitations on the natural and economic supplies of land, the fixed and irreplaceable spatial locations, and the constraints of urban spatial structure and scale. Ancillary facility resources are manufactured products that are simple and convenient to install and can be manufactured according to demand [49]. Thus, they are not scarce. Parking lots have the same features as road resources and are, therefore, scarce. Whether vehicles are scarce is determined by the level of social and economic development and the development of the vehicle manufacturing industry [50]. If the social economy is backward, then the vehicle manufacturing capacity is low, and vehicles are scarce. Conversely, if the social economy is developed and manufacturing is advanced, then vehicles are not scarce. In short, road resources and parking lots are scarce resources, vehicles are conditional scarce resources, and ancillary facilities resources are not scarce.
2.4. Definition of Urban Wasteful Transport
Wasteful transport analyses should be based on scarce transportation resources because if there is no scarcity, then there is no need to examine or reduce the waste. In the industrial age, the combination of strong manufacturing capacity and social purchasing power mean that vehicles are no longer scarce [51]. Absolutely scarce road network resources undoubtedly become the only determinant of urban traffic capacity under the existing traffic structure and technical conditions. In other words, the urban traffic capacity is the appropriate traffic capacity that the road network system can bear.
Wasteful transport analyses may also focus on the potential of scarce resources and the relationship between transport supply and demand [52]. In cities of a certain scale, especially large cities and megacities, road networks are already built. Even considering all existing engineering and technical measures, the expansion of road resources will be unusually slow, and its potential will remain extremely limited. The corresponding increase in traffic capacity is also slow and limited. However, the rapid development of the social economy has driven continuous, rapid, and dramatically increasing growth in the transport demand, indicating that the imbalance between supply and demand will become increasingly prominent. To achieve the urban traffic development goal of “meeting travel needs”, severe constraints on traffic capacity will be encountered, and methods for managing the increasing transportation demand should be developed.
Wasteful transport also needs to consider the operational consequences of occupying scarce resources. To ensure the necessary operation quality with intensive use of road networks, the traffic volume must achieve the ideal capacity so that the use mode of road networks can meet traffic needs. For congested roads or road networks, transportation volume is more meaningful than traffic volume.
Wasteful transport also needs to consider the nature of its manifestations. Unlike normal traffic, it is the amount of extra plugging that exceeds the appropriate traffic density and results in a drop in operational quality.
Therefore, we believe that wasteful transport is the additional traffic flow which occupies the scarce traffic resources, and causes the normal traffic volume of road sections or road networks dropping or even traffic congestion.
2.5. Connotation of Wasteful Urban Transport
Wasteful transport is an integral part of traffic flow and represents the traffic flow that exceeds the road or road network capacity. This additional flow increases traffic density, resulting in the road traffic density exceeding the optimal traffic density and in lower average vehicle speeds and lower traffic volumes. Moreover, in such conditions, the traffic density may reach a blocking density in which no vehicles can move. Such a waste of scarce transportation resources is a typical characteristic of wasteful transport. This waste can quietly transfer wasteful consequences to all users of the road network and even to society and city governments.
Another implication of wasteful transport is the wasteful traffic volume caused by additional flow. Compared with the additional flow, the wasteful traffic volume, which is shown in the form of traffic deceleration and congestion, is not equal in quantity, although it is related to the additional flow. In some cases, a small amount of additional flow may result in significant wasteful traffic volume.
Wasteful transport also refers to certain modes of transportation. For example, observing from the utilization efficiency of scarce road resources, it is obviously a mode of transportation that uses the same road area but can only achieve a small volume of traffic.
3. Theoretical Framework and Methodology
3.1. Theoretical Framework
The theoretical study of urban wasteful transport is an interdisciplinary theoretical study, which involves three aspects:
Resource science theory applicable to urban traffic research, including resource combination theory supporting human activity practice projects, resource scarcity theory, and “cannikin law” restricting resource utilization efficiency.
Theoretical analysis of resources in urban transport systems, including analysis of resource composition of urban transport systems, resource combination effects of urban transport system operations, and analysis of scarce resources of urban transport systems.
Basic theoretical research on wasteful transport in cities, including the scientific definition of urban wasteful transport, the connotation analysis of urban wasteful transport.
3.2. Methodology
In the busy road sections, because the traffic density is high, the speed of the car is restricted by the preceding vehicle. In this state, motorcades run in non-free car following operation. The method of evaluating the waste of road sections cannot simply apply the traffic flow model of general highway and expressway. Suitable method should be determined by the car following theory and its model. The comprehensive research methodology used here include quantitative discrimination between wasteful and normal transport and methods of estimating waste. Quantitative discrimination is divided into three steps. First, based on the car following theory, the model of flow-density function is derived. Secondly, the parameters of the model are determined through traffic survey data. Finally, the flow-density function is applied again to find the boundary between wasteful and normal transport. The amount of waste is estimated by calculating the difference between the optimal flow and the actual flow.
3.2.1. Quantitative Discrimination between Wasteful and Normal Transport
Urban traffic flow has a high density and a small vehicle spacing, and the vehicles in the convoy are subject to the speed of the lead car. The operation of this flow is a non-free state of the car following operation [53,54].
According to the car following model [55,56]:
where is the acceleration of the th vehicle after the delay time , is the difference between the th vehicle position and the th vehicle position at (as the average distance between the front of the vehicle), is the difference between the th vehicle speed and the th vehicle speed at time, and is the reaction sensitivity coefficient. Taking the integral on both sides of Equation (1) and after a moderate transformation, a mathematical model describing the traffic flow can be obtained:
where is the speed, is the vehicle density, is the blocking density and is the traffic flow. By differentiating on in Equation (3) and setting , we can obtain the following: ; ; ; and . , , and are the maximum flow rate, the best speed and the best density, respectively. Therefore, Equations (2) and (3) can be rewritten as follows:
Equation (5) is a quadratic function with a parabolic curve (Figure 1), and this curve can reflect the flow-density relationship of high-density traffic. According to Equation (5), we can obtain the following: and .
In the flow-density curve (Figure 1), the slope of the line connecting the arbitrary point on the curve to the origin(O) is the speed at the point. And is the slope of tangent at the origin (O), which is the free-flow velocity at . As the density increases, the slope of the connection decreases. The traffic flow increases continuously until , the peak of the curve, and the traffic flow reaches the maximum. From point , as the density increases, the speed of the car decreases, and the traffic flow decreases until point , where the speed is zero and the traffic flow is also zero. is the blocking density, at which the density reaches the maximum and the vehicle speed is zero. The vertex is the clear demarcation point of the curve, and the vertex is the traffic capacity or the maximum traffic flow, and the corresponding vehicle speed and density are the best speed and best density, respectively. The segment from origin (O) to on the left side of the vertex, in which density and flow increases but crowding does not occur, shows that the traffic capacity is sufficient to meet the traffic demand. Based on the to segment on the right side of the vertex, increases in density do not improve traffic and reduce traffic flow quickly, thereby resulting in road congestion. Thus, the traffic capacity cannot be realized normally, and cannot meet the traffic demand.
In the curve segment from the origin (O) to , the trends and relationships among the speed, density and flow represent the normal relationship between traffic parameters. The curve segment from point to represents the abnormal traffic flow-density relationship. For the abnormal traffic trajectory, the section of the curve from to , the trend of steady operation after the flow reaches is forced to change to a parabolic type because of the influx of additional flow. The direct result is that the traffic density increases and the speed decreases. A greater density corresponds to a shorter distance between the front of the vehicle. The interaction between vehicles leads to a loss of freedom of movement until the blocking density is reached. The trends and relationships among the speed, density and flow of the curve segment from point to are abnormal, thus depicting the operation of a wasteful traffic situation. The main effects of wasteful transport after the influx of additional flows are road space resource waste, excess fuel consumption, environmental pollution, and lost time caused by parking delays and operational delays.
Figure 1 shows that is the boundary value of normal transport and wasteful transport. The average density and average speed are characteristic parameters that reflect normal transport and wasteful transport. When and , there is normal transport; when and , there is wasteful transport.
3.2.2. Methods of Estimating Waste
The target of urban wasteful transport studies is “additional flow”. However, additional flow is complex and variable, and it is impossible to directly measure and track its operations and change trends. Based on the definition, connotations and characteristics of wasteful transport, we can analyse and measure the impact value and then explore its existing forms and classify its possible types.
Additional flow must be studied under the assumption that the layout of the urban road network is rational and that the traffic service and management level are excellent. Under such conditions, the amount of normal traffic slow down and traffic jams are the main signs of additional flow (when the traffic flow is expressed as or ). Transportation engineering theory reveals that even if congestion is not observed, the traffic density exceeds the optimal density, the vehicle operating speed decreases, and traffic flow slows down [57,58,59]. Moreover, this theory shows that the change in traffic flow, which is the scientific basis for judging the occurrence of additional flow and wasteful transport, is more sensitive than congestion. “Wasteful transport” refers to the loss of normal traffic flow caused by the additional flow. Let represent the normal traffic flow during the period of time , and let represent the actual traffic volume; then, the wasteful transport volume can be expressed as follows:
Urban traffic congestion usually occurs in partial road sections and at certain intersections.
(1) Estimation of partial road sections waste
Equation (5) is the flow-density model derived from the transport theory, and it is suitable for urban traffic volume research. The traffic demand in the additional flow area is strong. If interference does not occur, then the maximum value of normal traffic flow can reach . Thus, and the actual traffic . Therefore, when and , the waste of a road section is calculated as follows:
(2) Estimation of signalized intersections waste
At intersections, especially busy intersections, the traffic flow does not follow the flow-density relationship but is instead constrained by the combined effect of the “green time ratio” and design capacity of the intersection [60]. Therefore, the normal traffic flow is estimated by the design capacity. Signalized intersections include at least two vertical planes, one of which is the basic plane, and its waste () is as follows:
The other plane called the vertical plane is perpendicular to basic plane, and its waste () is as follows:
Thus, the waste of a signalized intersection is as follows:
where , , , and are the design capacity of straight lane, straight right lane, straight left lane, and straight left and right lane of the basic plane, is the actual traffic volume of the basic plane; , , , and are the design capacity of straight lane, straight right lane, straight left lane, and straight left and right lane of the vertical plane, is the actual traffic volume of the vertical plane.
(3) Estimation of roundabout waste
Then, is as follows:
where is the average width of the roundabout entrance (unit: m), is the weaving segment width (unit: m), is the ratio of weaving vehicles to all vehicles in the weaving segment (unit: %), is the weaving segment length (unit: m), and is the actual capacity of roundabouts (unit: pcu/h).
4. Empirical Research
Although traffic management in Shanghai is stricter than in most cities of China, traffic congestion still occurs in some sections because of the high traffic flow. The typical section of the empirical study should have the following characteristics: (1) busy traffic; (2) good closure, less interference from the outside; (3) straight and flat; (4) with a length that can meet the occupancy of at least one motorcade. According to these requirements and through the actual investigation of Shanghai’s urban traffic, the Guoding Road section is selected as the research object from many alternative sections. This section presents a longer interval, less interference and high traffic volume (Figure 2). The length of the selected road section is 520 m, and it is a two-way and four-lane road without intervals in the middle and with a separate bike lane. Daily transportation, especially during peak hours, is heavily congested, with vehicles running under high-density conditions.
4.1. Data Resources
Data are derived from the road traffic investigation and include raw data, modelling data, and waste analysis data. The traffic investigation aimed to obtain speed, time headway and vehicle density data. Using smart phones with a stopwatch function, notebooks, markers, etc., we conducted the survey from 26 to 31 July 2017 (Monday, Wednesday, and Thursday) from 7:00 to 8:00, which represents the peak traffic period. In the weekend, the number of cars contained in a motorcade was small, and the interval between motorcades was large. We used counting method to get traffic flow of 901 vehicles per hour and 875 vehicles per hour on 29 and 30 July, respectively. In general, the traffic density was small, and there was no wasteful traffic. Monday is the first working day in which the traffic flow is heavy. Therefore, Monday is the focus of the study. The situation is consistent from Tuesday to Friday. We randomly selected Wednesday and Thursday as research time. In the middle of the selected Guoding Road section, which is not affected by bus stops or pedestrians, line AB is delimited, which is consistent with the driving direction. And the length of line AB is 27.8 m. The time required for the first car to pass through line AB and the time when the following cars arrive at point B were measured. According to the car following theory [63], the speed of the first car or the motorcade is as follows: (km/h); the time headway is ; and the traffic density is , where is the number of vehicles. According to the record form (Table 1), the calculation results of the first motorcade data are as follows: = 37.75 (km/h) and = 42 (vehicles/km).
The above operation was repeated to obtain investigation data on the second, third… motorcades. Finally, 28 sample data are obtained under the premise of strict screening (Table 2).
4.2. Calculating the Road Section Optimal Flow
Traffic flow consists of single drivers and vehicles, and its characteristics are influenced by the drivers, road factors and overall environmental impact. The relationship between velocity and density is random, and individual samples show unique behaviour and cannot reflect commonality. Using the samples from Table 2, the road traffic relationship model between and is built to reflect the traffic law of the study section. Curve fitting using the type of Equation (4) yields:
Obviously, = 29.26 (km/h); the traffic relationship between flow and density of Guoding Road is as follows according to Equation (5):
Clearly, the above equation is a quadratic equation. According to the nature of the Equation (13) and the Fermat’s theorem [64,65], the derivative is 0 when taking the extreme value. Differentiating on in Equation (13) and set , then, . Finally and can be substituted into Equation (13) to obtain the optimal flow: (vehicles/h).
5. Results
Based on the obtained , , and values, the quantitative discrimination results between wasteful transport and normal transport, the probability of occurrence and the volume of waste can be analysed and estimated.
5.1. Identification of Wasteful Transport
Theoretically, according to the research above, if and at any time, then wasteful transport occurs; otherwise, normal transport occurs.
The results of the sample analysis (Table 3) show that samples 9, 23, 25, and 28 satisfy the conditions that and , indicating that these samples are of the wasteful transport type. The conditions of the remaining samples represent the normal transport type.
5.2. Occurrence Probability of Wasteful Transport
The occurrence probability of wasteful transport can be calculated by the formula, where is the number of wasteful transport samples and is the total number of samples. Thus, = 14.29%.
5.3. Estimation of Wasteful Transport Volume
The traffic flow ) in samples can be calculated using Equation (13). Then the wasteful transport volume () can be obtained by Equation (6). According to the calculation, the wasteful transport volume in sample 9 is 12 vehicles/h; the wasteful transport volume in sample 23 is 2 vehicles/h; the wasteful transport volume in sample 25 is 60 vehicles/h; the wasteful transport volume in sample 28 is 130 vehicles/h (Table 4).
6. Discussion
The premise of discussing wasteful transport is that many conditions are in an ideal state, and urban transport is related to many factors, such as urban planning, road network layout, land use, traffic structure, traffic environment, and traffic management. Since the reality is extremely complicated, the real situation of urban wasteful transport may be more diverse. Therefore, there is still a certain academic deficiency in the wasteful transport analysis of macroscopic urban road networks. However, for any particular road segment, the analysis method, quantitative model, and analysis procedure of wasteful transport are applicable, that is, the research results of the paper are universal in microscopic research, such as road sections or intersections. There are many ways to apply this concept to urban traffic practice. For example, according to road capacity additional traffic demand should be limited; additional flow can be diverted to the surrounding road sections; private cars should be reduced by changing the traffic structure. Of course, how to implement this concept specifically needs to be analysed in combination with the actual situation. This is also our future research direction.
With rigorous academic attitude, we have carefully drafted a follow-up research plan. In addition to the verifiable research on the results of empirical analysis in the project, the future systematic research content is also determined. These follow-up studies mainly involve: (1) urban wasteful traffic classification; (2) the mechanism of wasteful transport and its influence effect; (3) characteristics and production mechanism of wasteful transport; and (4) the technical method system of wasteful transport research, including the system dynamics method of its production mechanism and the evaluation method of its impact effect. We have carried out research on some important contents and achieved stage results.
7. Conclusions
The theoretical basis for explaining urban traffic congestion or falling into the strange circle of “Law of peak-hour expressway congestion” lies not only in the field of traffic engineering technology, but also in the category of scarce knowledge of resource economics. In the resource composition of urban transportation system, roads are scarce resources. The operation capacity of urban traffic depends on the support ability of road resources.
The traffic flow beyond the carrying capacity of road is wasteful transport. The connotation of wasteful transport includes extra traffic which exceeds the optimum traffic density, the loss of normal traffic flow under the interference of extra traffic, and the traffic modes which occupy the same road resources but can only complete less traffic volume.
Wasteful transport can be quantitatively studied using mathematical models. The flow-density function of urban road sections should be derived from the car following theory. The boundary between wasteful and normal transport can be found by determining its parameters through traffic survey data. The optimal speed and optimal density corresponding to the optimal flow are the characteristic parameters that determine the wasteful transport. When and , there is normal transport, and when and , there is wasteful transport. The difference between the maximum traffic and the actual traffic is wasteful transport volume. By calculating the loss of normal traffic flow, it can more directly reflect the harm caused by wasteful transport.
The concept of wasteful transport provides new technical ideas for scientific management of urban transportation. From the perspective of urban management, to implement this idea, the government, urban traffic command centre and transportation department should coordinate and cooperate with each other. The urban traffic command centre finds waste traffic sections through automatic monitoring devices and calculates the waste. On one hand, the centre should report road sections with long-standing serious waste to the government. The government determines the appropriate number of vehicles from the aspect of traffic planning to limit the additional traffic demand. The government can also increase the number of buses to reduce or eliminate wasteful traffic. On the other hand, the centre should inform the transportation department of road sections with short-term waste. The traffic police can divert vehicles to the surrounding road sections or increase the number of shared bikes temporarily.
This paper uses resource science theory to study the scarcity of traffic resources which has not been discussed in traffic science, and puts forward the scientific problem of urban wasteful transport. The scientific definition of this academic term is given, and its connotation is classified. Through in-depth research, quantitative analysis methods for wasteful transport which include how to distinguish the boundary between wasteful and normal traffic and how to estimate the amount of waste are found. Through empirical research, the optimal flow, the occurrence probability of wasteful transport and the wasteful transport volume of Guoding section in Shanghai are calculated. Finally, from the perspective of the government, the specific means of implementing this idea are raised. Generally speaking, the research results of this paper can help to improve the theoretical system of urban traffic, and help to alleviate the problem of urban traffic congestion.
Author Contributions
Investigation: Q.T.; methodology: X.C.; software: J.L.; supervision: D.S.; writing—original draft: B.Z.
Funding
This research received no external funding.
Conflicts of Interest
The authors declare no conflict of interest.
References
- Bando, M.; Hasebe, K.; Nakayama, A.; Shibata, A.; Sugiyama, Y. Dynamical model of traffic congestion and numerical simulation. Phys. Rev. E 1995, 51, 1035–1042. [Google Scholar] [CrossRef]
- Hennessy, D.A.; Wiesenthal, D.L. Traffic congestion, driver stress, and driver aggression. Aggress. Behav. Off. J. Int. Soc. Res. Aggress. 1999, 25, 409–423. [Google Scholar] [CrossRef]
- The Texas Transportation Institute of United States. Cruising for Parking. Available online: http://shoup.bol.ucla.edu/CruisingForParkingAccess.pdf (accessed on 27 August 2018).
- Spears, J.; Kalinowski, T. Toronto Commuting Times Worst of 19 Major Cities, Study Says. Available online: https://www.thestar.com/yourtoronto/yourcitymycity/2010/03/30/toronto_commuting_titim_worst_of_19_major_cities_study_says.html (accessed on 20 October 2018).
- Sun, J.; Liu, Q.; Peng, Z. Research and analysis on causality and spatial-temporal evolution of urban traffic congestions—A case study on Shenzhen of China. J. Transp. Syst. Eng. Inf. Technol. 2011, 11, 86–93. [Google Scholar] [CrossRef]
- Sun, C.; Luo, Y.; Li, J. Urban traffic infrastructure investment and air pollution: Evidence from the 83 cities in China. J. Clean. Prod. 2018, 172, 488–496. [Google Scholar] [CrossRef]
- Migdalas, A. Bilevel programming in traffic planning: Models, methods and challenge. J. Glob. Optim. 1995, 7, 381–405. [Google Scholar] [CrossRef]
- Marchand, B. Pedestrian traffic planning and the perception of the urban environment: A French example. Environ. Plan. A 1974, 6, 491–507. [Google Scholar] [CrossRef]
- Black, J. Urban Transport Planning: Theory and Practice; Routledge: London, UK, 2018. [Google Scholar]
- Daganzo, C.F.; Geroliminis, N. An analytical approximation for the macroscopic fundamental diagram of urban traffic. Transp. Res. Part B Methodol. 2008, 42, 771–781. [Google Scholar] [CrossRef]
- Janson, B.N. Dynamic traffic assignment for urban road networks. Transp. Res. Part B Methodol. 1991, 25, 143–161. [Google Scholar] [CrossRef]
- Arabi, M.; Porkar Rezaeie, P.; Ahmadzadegan, M. Evaluation of the performance of intelligent vehicles and their role in controlling and reducing urban traffic in North Khorasan Province. Int. J. Inf. Secur. Syst. Manag. 2018, 7, 797–800. [Google Scholar]
- Feng, S.; Shen, X.; Hu, B. Optimization of traffic demand management policy in China: Towards a sustainable mode split. Transp. Plan. Technol. 2018, 41, 198–210. [Google Scholar] [CrossRef]
- Fernández-Isabel, A.; Fuentes-Fernández, R. Analysis of intelligent transportation systems using model-driven simulations. Sensors 2015, 15, 14116–14141. [Google Scholar] [CrossRef]
- Ramadhan, H.; Nugraha, I.G.B.B. Web-based macroscopic road traffic simulator. In Proceedings of the 2017 11th International Conference on Telecommunication Systems Services and Applications (TSSA), Lombok, Indonesia, 26–27 October 2017; pp. 1–6. [Google Scholar]
- Pyatkova, K.; Chen, A.S.; Djordjević, S.; Butler, D.; Vojinović, Z.; Abebe, Y.A.; Hammond, M. Flood Impacts on Road Transportation Using Microscopic Traffic Modelling Techniques. In Simulating Urban Traffic Scenarios; Springer: Cham, Switzerland, 2019; pp. 115–126. [Google Scholar]
- Daganzo, C.F. Requiem for second-order fluid approximations of traffic flow. Transp. Res. Part B Methodol. 1995, 29, 277–286. [Google Scholar] [CrossRef]
- Biham, O.; Middleton, A.A.; Levine, D. Self-organization and a dynamic transition in traffic-flow modles. Phys. Rev. A 1992, 46, 6124–6127. [Google Scholar] [CrossRef]
- Kerner, B.S.; Konhauser, P. Structure and parameters of clusters in traffic flow. Phys. Rev. E 1994, 50, 54–83. [Google Scholar] [CrossRef]
- Naito, Y.; Nagatani, T. Effect of headway and velocity on safety-collision transition induced by lane changing in traffic flow. Phys. A Stat. Mech. Appl. 2012, 391, 1626–1635. [Google Scholar] [CrossRef]
- Golob, T.F.; Recker, W.W.; Alvarez, V.M. Freeway safety as a function of traffic flow. Accid. Anal. Prev. 2004, 36, 933–946. [Google Scholar] [CrossRef]
- Berhanu, G. Models relating traffic safety with road environment and traffic flows on arterial roads in Addis Ababa. Accid. Anal. Prev. 2004, 36, 697–704. [Google Scholar] [CrossRef]
- Maze, T.H.; Agarwal, M.; Burchett, G. Whether weather matters to traffic demand, traffic safety, and traffic operations and flow. Transp. Res. Rec. 2006, 1948, 170–176. [Google Scholar] [CrossRef]
- Kerner, B.S. Experimental features of self-organization in traffic flow. Phys. Rev. Lett. 1998, 81, 3797–3800. [Google Scholar] [CrossRef]
- Kelly, F.P.; Maulloo, A.K.; Tan, D.K.H. Rate control for communication networks: Shadow prices, proportional fairness and stability. J. Oper. Res. Soc. 1998, 49, 237–252. [Google Scholar] [CrossRef]
- Bai, L.; Liu, P.; Chan, C.Y.; Li, Z.B. Estimating level of service of mid-block bicycle lanes considering mixed traffic flow. Transp. Res. Part A Policy Pract. 2017, 101, 203–217. [Google Scholar] [CrossRef]
- Xu, C.C.; Liu, P.; Wang, W.; Li, Z.B. Identification of freeway crash-prone traffic conditions for traffic flow at different levels of service. Transp. Res. Part A Policy Pract. 2014, 69, 58–70. [Google Scholar] [CrossRef]
- Holme, P. Congestion and centrality in traffic flow on complex networks. Adv. Complex Syst. 2003, 6, 163–176. [Google Scholar] [CrossRef]
- Kunz, F. Improving congestion management: How to facilitate the integration of renewable generation in Germany. Energy J. 2013, 34, 55–78. [Google Scholar] [CrossRef]
- Talukdar, B.K.; Sinha, A.K.; Mukhopadhyay, S.; Bose, A. A computationally simple method for cost-efficient generation rescheduling and load shedding for congestion management. Int. J. Electr. Power Energy Syst. 2005, 27, 379–388. [Google Scholar] [CrossRef]
- Long, J.C.; Gao, Z.Y.; Ren, H.L.; Lian, A.P. Urban traffic congestion propagation and bottleneck identification. Sci. China Ser. F Inf. Sci. 2008, 51, 948–964. [Google Scholar] [CrossRef]
- Liu, Z.; Liu, Y.H.; Wang, J.; Deng, W.W. Modeling and simulating traffic congestion propagation in connected vehicles driven by temporal and spatial preference. Wirel. Netw. 2016, 22, 1121–1131. [Google Scholar] [CrossRef]
- Saeedmanesh, M.; Geroliminis, N. Dynamic clustering and propagation of congestion in heterogeneously congested urban traffic networks. Transp. Res. Part B Methodol. 2017, 105, 193–211. [Google Scholar] [CrossRef]
- Zeng, Y.Y.; Xiang, K.; Li, D.S.; Vasilakos, A.V. Directional routing and scheduling for green vehicular delay tolerant networks. Wirel. Netw. 2013, 19, 161–173. [Google Scholar] [CrossRef]
- Williams, K. Spatial planning, urban form and sustainable transport: An introduction. In Spatial Planning, Urban Form and Sustainable Transport; Routledge: London, UK, 2017; pp. 15–28. [Google Scholar]
- Guerrero-Ibanez, J.A.; Zeadally, S.; Contreras-Castillo, J. Integration challenges of intelligent transportation systems with connected vehicle, cloud computing, and internet of things technologies. IEEE Wirel. Commun. 2015, 22, 122–128. [Google Scholar] [CrossRef]
- Baird, L.; Meshoulam, I. Managing two fits of strategic human resource management. Acad. Manag. Rev. 1988, 13, 116–128. [Google Scholar] [CrossRef]
- Lepak, D.P.; Snell, S.A. The human resource architecture: Toward a theory of human capital allocation and development. Acad. Manag. Rev. 1999, 24, 31–48. [Google Scholar] [CrossRef]
- Sperling, J.B.; Ramaswami, A. Cities and “budget-based” management of the energy-water-climate nexus: Case studies in transportation policy, infrastructure systems, and urban utility risk management. Environ. Prog. Sustain. Energy 2018, 37, 91–107. [Google Scholar] [CrossRef]
- Zhang, Y. The rethinking of the competitive strategy based on the Cannikin Law. J. Ningbo Inst. Educ. 2011, 13, 97–98, 123. [Google Scholar]
- Daganzo, C.F. The cell transmission model: A dynamic representation of highway traffic consistent with the hydrodynamic theory. Transp. Res. Part B Methodol. 1994, 28, 269–287. [Google Scholar] [CrossRef]
- Hunt, J.D.; Kriger, D.S.; Miller, E.J. Current operational urban land-use–transport modelling frameworks: A review. Transp. Rev. 2005, 25, 329–376. [Google Scholar] [CrossRef]
- Wilkinson, R.I. Theories for toll traffic engineering in the USA. Bell Syst. Tech. J. 1956, 35, 421–514. [Google Scholar] [CrossRef]
- Schönhof, M.; Helbing, D. Empirical features of congested traffic states and their implications for traffic modeling. Transp. Sci. 2007, 41, 135–166. [Google Scholar] [CrossRef]
- Agarwal, P.K.; Khan, A.B.; Choudhary, S. A rational strategy for resource allocation for rural road maintenance. Transp. Res. Procedia 2017, 25, 2195–2207. [Google Scholar]
- Moradijoz, M.; Moghaddam, M.P.; Haghifam, M.R.; Alishahi, E. A multi-objective optimization problem for allocating parking lots in a distribution network. Int. J. Electr. Power Energy Syst. 2013, 46, 115–122. [Google Scholar] [CrossRef]
- Halsey, W.D. MacMillan Contemporary Dictionary; MacMillan Publishing: London, UK, 1979; p. 1106. [Google Scholar]
- Thapa, R.B.; Murayama, Y. Land evaluation for peri-urban agriculture using analytical hierarchical process and geographic information system techniques: A case study of Hanoi. Land Use Policy 2008, 25, 225–239. [Google Scholar] [CrossRef] [Green Version]
- Lee, J.S.; Yun, D.G. The road traffic sign recognition and automatic positioning for road facility management. Int. J. Highw. Eng. 2013, 15, 155–161. [Google Scholar] [CrossRef]
- Amin, A. Extraordinarily ordinary: Working in the social economy. Soc. Enterp. J. 2009, 5, 30–49. [Google Scholar] [CrossRef]
- Hart, S.L. Beyond greening: Strategies for a sustainable world. Harvard Bus. Rev. 1997, 75, 66–77. [Google Scholar]
- Yang, H.; Bell, M.G.H. Traffic restraint, road pricing and network equilibrium. Transp. Res. Part B Methodol. 1997, 31, 303–314. [Google Scholar] [CrossRef]
- Ranney, T.A. Psychological factors that influence car-following and car-following model development. Transp. Res. Part F Traffic Psychol. Behav. 1999, 2, 213–219. [Google Scholar] [CrossRef]
- Brackstone, M.; McDonald, M. Car-following: A historical review. Transp. Res. Part F Traffic Psychol. Behav. 1999, 2, 181–196. [Google Scholar] [CrossRef]
- Gipps, P.G. A behavioural car-following model for computer simulation. Transp. Res. Part B Methodol. 1981, 15, 105–111. [Google Scholar] [CrossRef]
- Lenz, H.; Wagner, C.K.; Sollacher, R. Multi-anticipative car-following model. Eur. Phys. J. B Condens. Matter Complex Syst. 1999, 7, 331–335. [Google Scholar] [CrossRef]
- Ding, C.R. The Impact of Urban Spatial Structure and Land Use Pattern on Urban Transportation. Urban Transp. China 2010, 8, 28–35. [Google Scholar]
- Lamble, D.; Kauranen, T.; Laakso, M.; Summala, H. Cognitive load and detection thresholds in car following situations: Safety implications for using mobile (cellular) telephones while driving. Accid. Anal. Prev. 1999, 31, 617–623. [Google Scholar] [CrossRef]
- Salon, D. Neighborhoods, cars, and commuting in New York City: A discrete choice approach. Transp. Res. Part A Policy Pract. 2009, 43, 180–196. [Google Scholar] [CrossRef] [Green Version]
- Cova, T.J.; Johnson, J.P. A network flow model for lane-based evacuation routing. Transp. Res. Part A Policy Pract. 2003, 37, 579–604. [Google Scholar] [CrossRef] [Green Version]
- Chen, E.E.; Wardrop, R.L. Bayes sequential estimation in a life test and asymptotic properties. Commun. Stat. Theory Methods 1980, 9, 659–672. [Google Scholar] [CrossRef]
- Ji, N.; Zhang, J.; Guo, K. Mathematical model for designing the traffic circle control. Int. J. Innov. Comput. Appl. 2012, 4, 58–66. [Google Scholar] [CrossRef]
- Gazis, D.C.; Herman, R.; Rothery, R.W. Nonlinear follow-the-leader models of traffic flow. Oper. Res. 1961, 9, 545–567. [Google Scholar] [CrossRef]
- Teia, L. Fermat’s Theorem—A geometrical view. J. Math. Res. 2017, 9, 136–142. [Google Scholar] [CrossRef]
- Chernick, J. On Fermat’s simple theorem. Bull. Am. Math. Soc. 1939, 45, 269–274. [Google Scholar] [CrossRef]
Figure 1.
Flow-density relationship *. * Note: The curve in the figure is the fitting equation of the case used in this paper.
Figure 1.
Flow-density relationship *. * Note: The curve in the figure is the fitting equation of the case used in this paper.
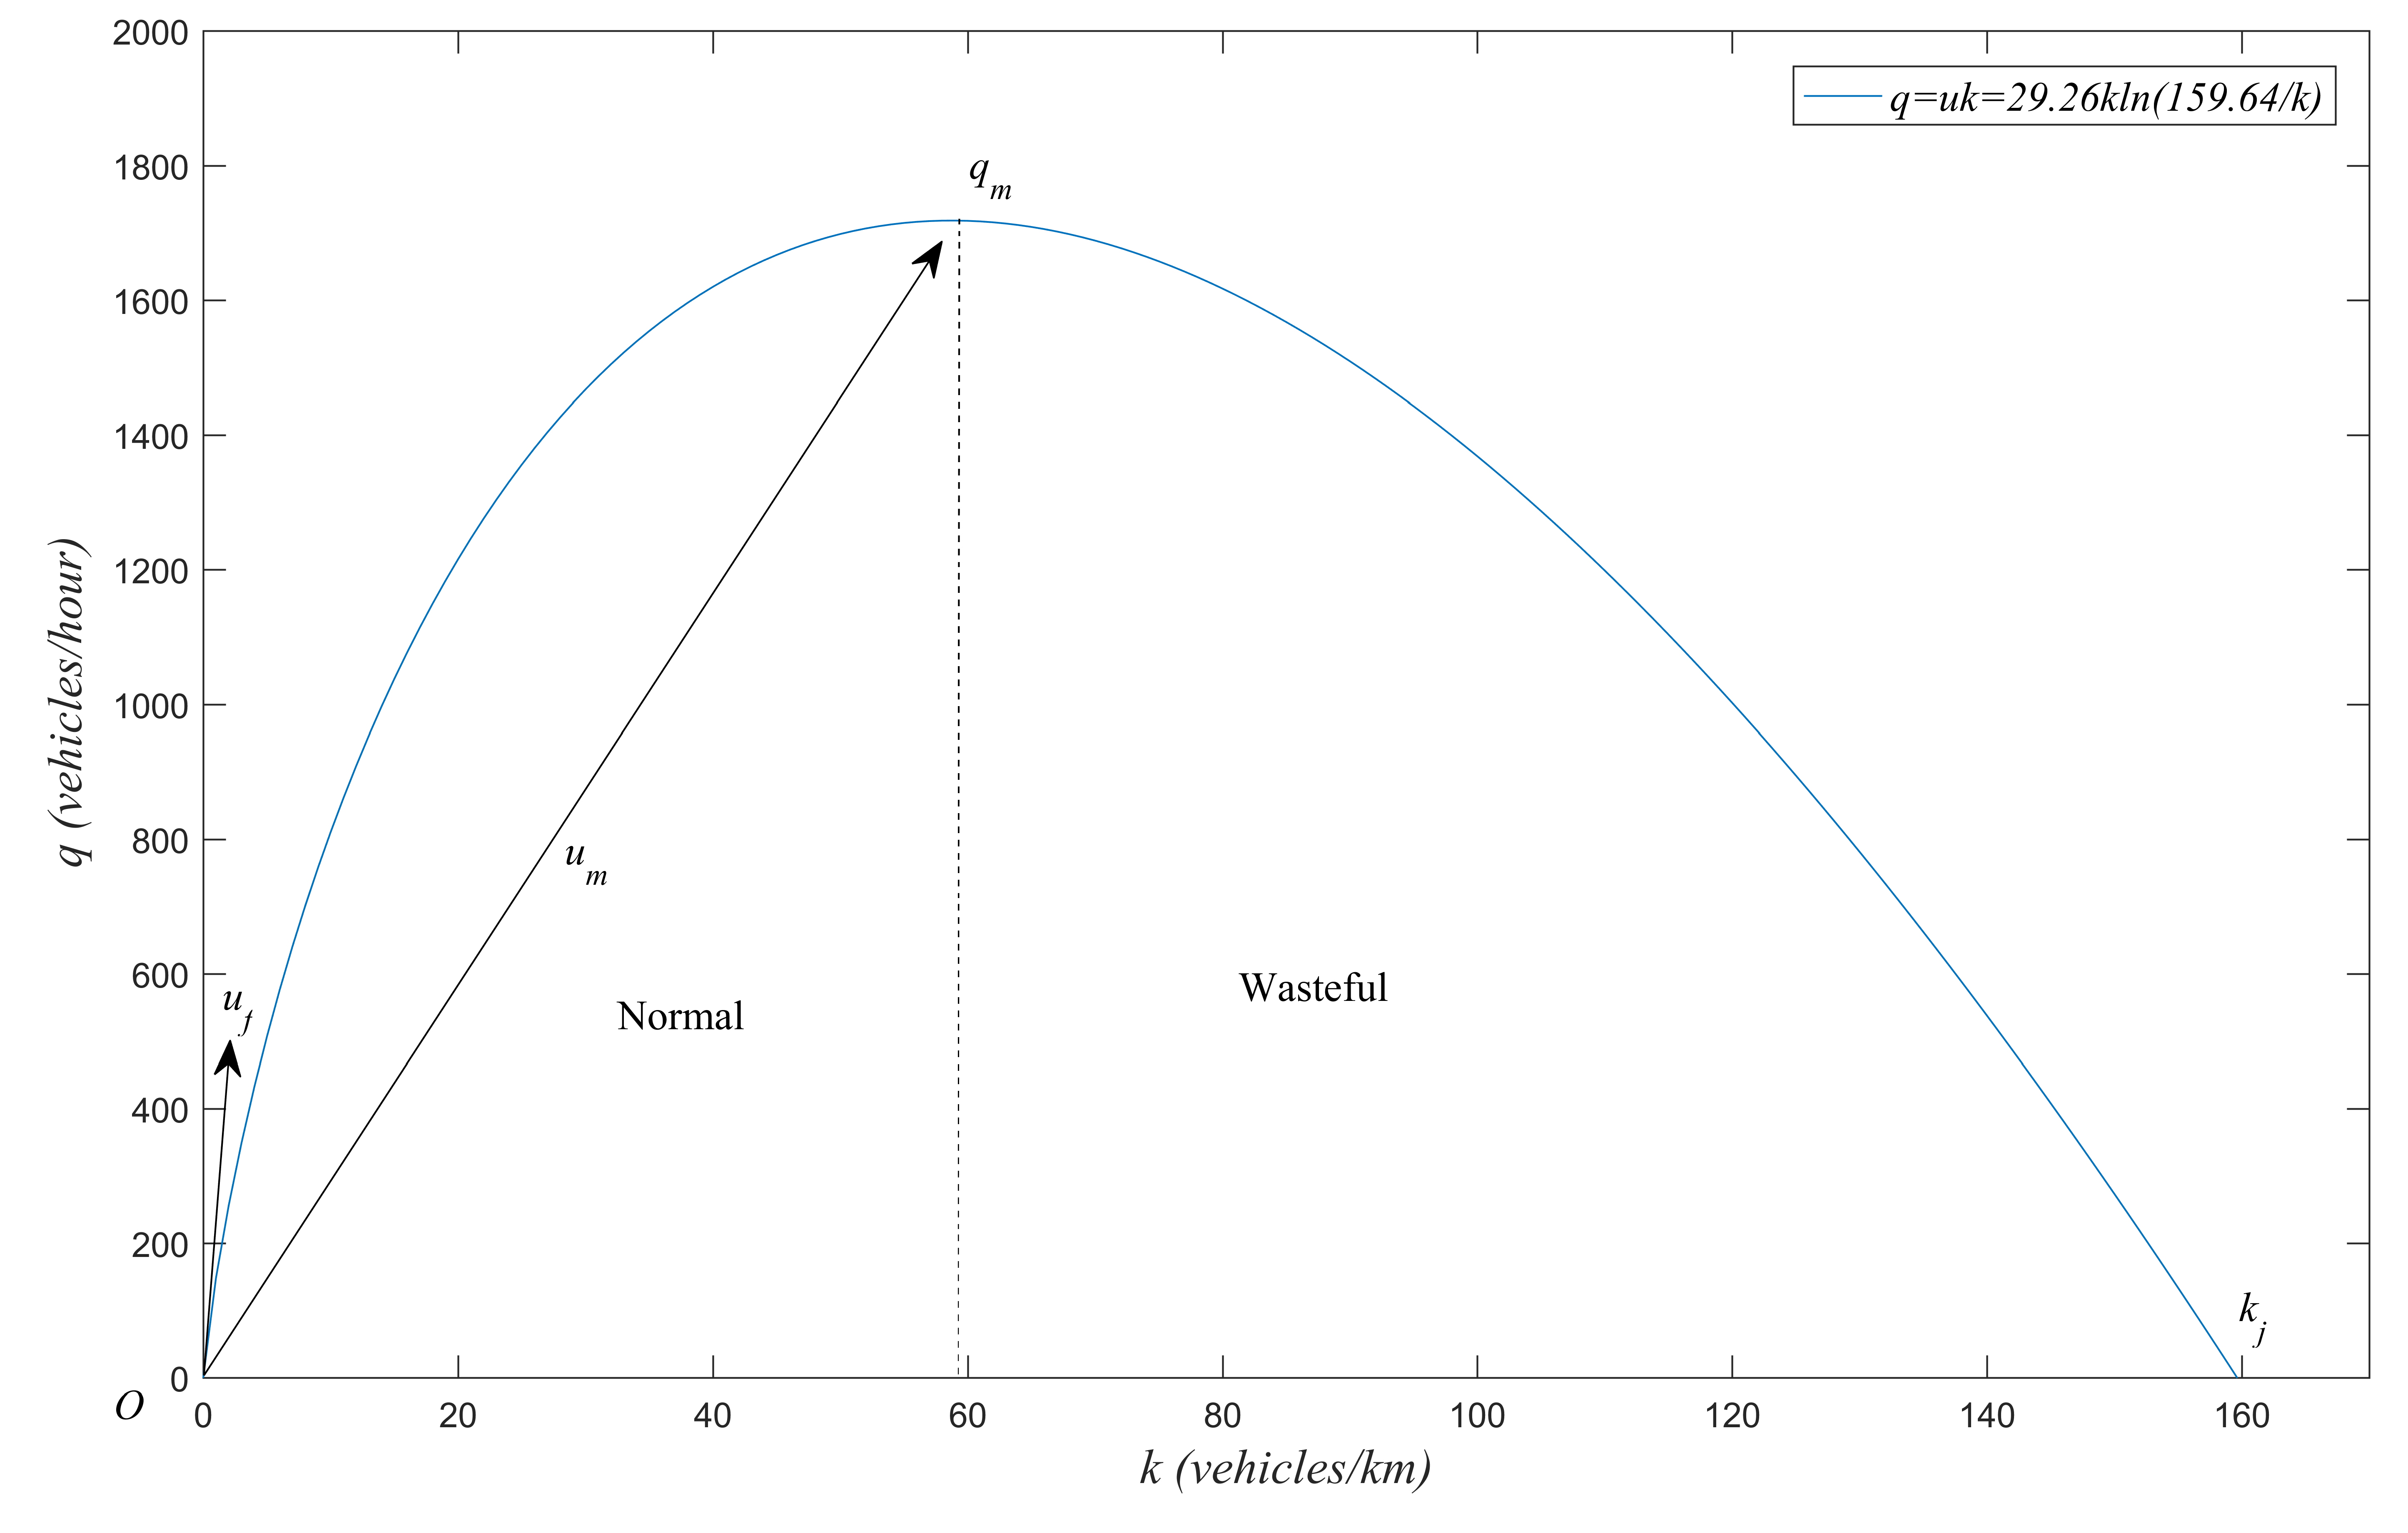
Figure 2.
Location map of study area.


Table 1.
Guoding road traffic investigation record form—the first sample (Unit: s).
| ith Car | Time Arriving at Point A | Time Arriving at Point B | Time Interval | ith Car | Time Arriving at Point A | Time Arriving at Point B | Time Interval | ||
|---|---|---|---|---|---|---|---|---|---|
| 1 | 0 | 2:35 | 2:35 | 2.583 | 10 | - | 23:24 | 2:09 | 2.150 |
| 2 | - | 5:18 | 3:23 | 3.383 | 11 | - | 25:45 | 3:01 | 3.017 |
| 3 | - | 7:49 | 2:31 | 2.517 | 12 | - | 29:15 | 3:10 | 3.167 |
| 4 | - | 10:42 | 3:33 | 3.550 | 13 | - | 32:39 | 3:24 | 3.400 |
| 5 | - | 12:58 | 3:23 | 3.383 | 14 | - | 35:26 | 2:47 | 2.783 |
| 6 | - | 14:46 | 2:28 | 2.467 | 15 | - | 37:44 | 2:58 | 2.967 |
| 7 | - | 17:02 | 2:16 | 2.267 | 16 | - | 40:35 | 2:31 | 2.517 |
| 8 | - | 18:43 | 2:21 | 2.350 | 17 | - | 42:26 | 2:32 | 2.533 |
| 9 | - | 21:15 | 2:32 | 2.533 |
Table 2.
Relationship sample data between and (Units: : km/h, : vehicles/km).
| 1 | 37.75 | 42 |
| 2 | 38.98 | 41 |
| 3 | 43.51 | 36 |
| 4 | 34.91 | 42 |
| 5 | 33.73 | 43 |
| 6 | 33.36 | 46 |
| 7 | 34.71 | 49 |
| 8 | 40.31 | 44 |
| 9 | 28.33 | 66 |
| 10 | 31.6 | 55 |
| 11 | 41.41 | 40 |
| 12 | 40.85 | 47 |
| 13 | 41.85 | 44 |
| 14 | 36.17 | 47 |
| 15 | 33.36 | 52 |
| 16 | 35.12 | 47 |
| 17 | 31.6 | 51 |
| 18 | 39.25 | 43 |
| 19 | 28.06 | 59 |
| 20 | 48.05 | 34 |
| 21 | 40.57 | 38 |
| 22 | 33.73 | 43 |
| 23 | 27.67 | 62 |
| 24 | 46.92 | 36 |
| 25 | 22.24 | 75 |
| 26 | 45.85 | 39 |
| 27 | 33.17 | 43 |
| 28 | 19.62 | 83 |
: The th sample; : average speed of each sample; : average density of each sample.
Table 3.
Waste traffic identification based on and .
| 1 | 2 | 3 | 4 | 5 | 6 | 7 | 8 | 9 | 10 | 11 | 12 | 13 | 14 | |
| + | + | + | + | + | + | + | + | − | + | + | + | + | + | |
| − | − | − | − | − | − | − | − | + | − | − | − | − | − | |
| 15 | 16 | 17 | 18 | 19 | 20 | 21 | 22 | 23 | 24 | 25 | 26 | 27 | 28 | |
| + | + | + | + | − | + | + | + | − | + | − | + | + | − | |
| − | − | − | − | 0 | − | − | − | + | − | + | − | − | + |
Table 4.
Estimation of wasteful transport volume (units: vehicles/h).
| 9 | 1706 | 1718 | 12 |
| 23 | 1716 | 2 | |
| 25 | 1658 | 60 | |
| 28 | 1588 | 130 |
© 2018 by the authors. Licensee MDPI, Basel, Switzerland. This article is an open access article distributed under the terms and conditions of the Creative Commons Attribution (CC BY) license (http://creativecommons.org/licenses/by/4.0/).
Share and Cite
MDPI and ACS Style
Cao, X.; Zhou, B.; Tang, Q.; Li, J.; Shi, D. Urban Wasteful Transport and Its Estimation Methods. Sustainability 2018, 10, 4562. https://doi.org/10.3390/su10124562
AMA Style
Cao X, Zhou B, Tang Q, Li J, Shi D. Urban Wasteful Transport and Its Estimation Methods. Sustainability. 2018; 10(12):4562. https://doi.org/10.3390/su10124562
Chicago/Turabian StyleCao, Xiangyang, Bingzhong Zhou, Qiang Tang, Jiaqi Li, and Donghui Shi. 2018. "Urban Wasteful Transport and Its Estimation Methods" Sustainability 10, no. 12: 4562. https://doi.org/10.3390/su10124562
Note that from the first issue of 2016, this journal uses article numbers instead of page numbers. See further details here.