Social Life Cycle Assessment: Specific Approach and Case Study for Switzerland
by
 ,
,
Evelyn Lobsiger-Kägi
1,2,* ,
,
Luis López
1,
Tobias Kuehn
1,
Raoul Roth
2,
Vicente Carabias
1 and
Christian Zipper
1 1
Institute of Sustainable Development, ZHAW Zurich University of Applied Sciences, 8400 Winterthur, Switzerland
2
RHYSearch, Center for Research and Innovation, 9471 Buchs, Switzerland
*
Author to whom correspondence should be addressed.
Sustainability 2018, 10(12), 4382; https://doi.org/10.3390/su10124382
Submission received: 27 August 2018
/
Revised: 14 November 2018
/
Accepted: 15 November 2018
/
Published: 23 November 2018
(This article belongs to the Section Social Ecology and Sustainability)
Abstract
:This article proposes a specific social life cycle assessment (S-LCA) approach, to be applied in a case study on energy production in Switzerland. The aim of the present study is to describe the social conditions along the global supply chains and to compare them with the social situation in Switzerland. Therefore, a specific S-LCA methodology was developed that combines a relevance analysis with a performance reference point (PRP) assessment. The relevance analysis is carried out to identify the most relevant unit processes and S-LCA indicators and the Swiss PRPs (SPRPs) are designed to compare the social issues along the value chain to the situation in Switzerland. The methodology was applied to two life cycle stages of the copper supply chain (resource extraction and wire production), relevant for the production of renewable energy technologies, where it was found that the most critical step is mining in the Democratic Republic of the Congo (DRC) due to the artisanal way of mining. The proposed methodology offers a comprehensive overview for the analysis of supply chains and the comparison of different life cycle phases. Nevertheless, the methodology can result in a very coarse resolution with low validity. However, if the data and the results are treated transparently, they provide meaningful information about the social conditions along the supply chain.
1. Introduction
The current levels of environmental degradation and especially the noticeable climate change have caused an increased sensitisation towards the importance of sustainable development. Also, the social impacts of the globalised economic system are emerging in different ways, for example, child labour, poor or even dangerous working and living conditions, or unfair wages. As a consequence, the debate on sustainable development has further developed; especially the need to measure and compare sustainability performance has increased. In this context, several methods to include all the components of sustainability were elaborated, each with a different view on the topic. A systemic perspective on energy technologies is applied in a multi-criteria decision analysis for sustainable energy decision-making [1]. For a more product- or technology-centred perspective, the life cycle assessment (LCA) methodology has partly established itself and proven its worth. First, the environmental LCA (E-LCA) method was developed to assess the environmental impacts of a product or service [2,3]. Second, based on the widely accepted triple-bottom interpretation of sustainability, the “life cycle thinking” approach was expanded to include economic and social aspects. In this manner, the economic and social “pillars”, life cycle costing (LCC) and a social LCA (S-LCA), respectively, were proposed. This paper focuses on the social aspects of sustainability to evaluate different (future) energy technologies, which is part of a project funded by the Swiss National Science Foundation (SNSF). The funded project deals with novel technologies for energy production, storage and distribution such as new generations of photovoltaic (PV) cells or CO2 methanation technologies and is based on the national Energy Strategy 2050, which “aims to contribute towards solutions that will ensure a sustainable energy policy for Switzerland” [4]. So, if these future technologies are to make a significant contribution to global energy requirements, issues of sustainability need to be addressed with increased urgency. Besides environmental impacts, socioeconomic aspects (e.g., social acceptance [5], safety risks for workers [6] and social risks of supply chains [7]) play an increasingly crucial role also in terms of compliance with the sustainability requirements stipulated in the global Sustainable Development Goals [8].
1.1. Social Life Cycle Assessment
The first attempts to integrate the social and socioeconomic criteria into the LCA were made in the early 1990s [9], giving way to the development of a methodology addressing the social dimension in sustainability and a variety of social issues such as poverty, population growth and income inequality. The purpose of a S-LCA is to provide information on social issues for decision-making and to help inform incremental improvements [10]. Although not as widespread as other LCA tools, the S-LCA is generating a growing interest, evidenced by an increasing number of related academic papers and case studies (for example, see [11,12]).
The S-LCA approach is used to evaluate the social impacts of a product [2] and has yet to be standardised. The first attempts to propose a common framework were published in 2009 by the United Nations Environment Programme/Society of Environmental Toxicology and Chemistry (UNEP–SETAC) with its Life Cycle Initiative and extensive “Guidelines for Social Life Cycle Assessment of Products” [10] (referred to hereafter as “the guidelines”).
The UNEP–SETAC guidelines specify 31 relevant subcategories as core elements of the methodology. These subcategories can be allocated to five important stakeholder groups for a S-LCA: workers, the local community, society, consumers and value chain actors [10]. Furthermore, UNEP–SETAC wrote the methodological sheets [13] to be used in parallel with the guidelines [10].
The UNEP-SETAC approach is purposely generalised in order to include all possible supply chains and it is explicitly stated that the methodology may be adapted “depending on data availability and the goal and scope of the study” [13]. The challenge lies, however, in how to adapt the methodology to fit appropriate goals and scopes. While the guidelines are a great first step towards undertaking social assessments, there are a number of limitations in the UNEP–SETAC S-LCA approach. For instance, there is no distinctive method for a relevance analysis, there are no defined methods for impact assessments and the actual impacts of the determined subcategories are not described (the UNEP–SETAC guidelines are currently under revision). Consequently there is a need for research and further development of the S-LCA methodology above all a prioritization step, a standardized weighting system and impact assessment is required [14].
To carry out a life cycle impact assessment (LCIA), two types of models (called characterisation models) can be used: type I and type II. Type II S-LCIA is based on causal effect chains (an example of a type II characterisation can be found in [2]). Those characterisation models are based on impact pathways, imply that the descriptions are mostly quantitative and represent causal effect chains like in E-LCA [15]. The problem of type II models is that “cause–effect relationships are not simple enough or not known with enough precision to allow [for] quantitative cause effect modelling” [10]. The Type I S-LCIA on the other hand does not make use of causal effect chains. The semiquantitative form of type I models allows for aggregation using a weighting system (for example, via so-called performance reference points (PRPs)), resulting in a subcategory indicator or index [16], which is used in this study as well.
1.2. The Proposed Specific Approach to the S-LCA and the Case Study
In our study, we developed a specific methodology to carry out an S-LCA for energy technologies that are not yet fully developed. As such, these products’ life cycles have great uncertainties regarding producers, intermediaries, resource extractors and recyclers. Therefore, we often do not have any data available regarding the indicators of social impacts such as wages per staff category, working hours (WHs) per week or the displacement of communities. The main goal of the proposed methodology is to get an idea of the possible social impacts and their extent and to give recommendations for future choices to make in the life cycle of a product. For example, what critical social issues should one pay attention to in a specific production step in a specific country?
In order to reach this goal, we propose a combined methodology (described in further detail in chapter 2) that starts with a relevance analysis and is followed by a specific type I characterisation to carry out the S-LCA. The novelty of this approach lies in the proposed relevance analysis, which takes into account the social hotspots of a country/sector and the relevance of the unit process in the whole life cycle. The social hotspots are identified with the social hotspot database (SHDB [17]), as proposed by the guidelines. The second novelty of the method is that it introduces specific PRPs for Switzerland to compare the issues under assessment. Thus, by conducting a relevance analysis, the required work for a S-LCA, which is generally very laborious [18], can be optimised in an in-depth analysis of the important issues followed by an evaluation compared to a given standard situation. In this study, the social situation in Switzerland has been selected as an RP. First, Swiss consumers are familiar with the situation in Switzerland and can thus benchmark the results in contrast to using international conventions, which are rarely known by the wider population. Second, the methodology is developed for application in Switzerland as this project is funded by the SNSF. Third, if a technology or product is developed and consumed in Switzerland, it should also be able to claim to meet Swiss standards along its entire value chain in order to avoid potential reputation risks. [19] Otherwise, non-accounted-for externalities are produced, which should be avoided according to federal sustainability criteria [20].
This method was applied to the value chain of a generic copper product (for energy technologies) as a case study, described in Chapter 3 and depicted in Figure 1. In this first effort, the social conditions relating to raw material extraction and wire production were examined.
2. Materials and Methods
The current study proposes a specific approach to operationalise the standardised methods of the guidelines and therefore only those aspects that are different from the guidelines or those are defined or operationalised in more detail are described in the following.
An overview of the proposed approach is given in Figure 2, where the relevance analysis is an important step of the inventory analysis and also provides information for the impact assessment.
2.1. Goal & Scope
The definition of the goal and scope of a study is crucial for every LCA (social, economic or environmental). We use the proposed methodology of the UNEP–SETAC guidelines for the Goal and Scope definition phase [10], therefore, we purposely refrain from giving a detailed description of this process. The main activities and topics to define in those two steps are mentioned in Figure 1 (Box Goal and Scope (UNEP–SETAC)), where the definition of the functional unit, the system boundaries and the activity variable are essentially.
The goal of our study was to investigate all stakeholder categories and all subcategories defined in the UNEP–SETAC guidelines. As we used the social hotspot database (SHDB [17]) as a main information source for the relevance analysis, we had to match the subcategories from UNEP–SETAC with the table themes and issues from the SHDB.
The following rules were applied in order to match the UNEP–SETAC subcategories to the table themes from the SHBD and, posteriorly, to choose the single issues:
- For each UNEP–SETAC subcategory, the best corresponding SHDB table theme in regard to content was assigned. The judgment of “best corresponding” was left to the practitioner.
- Multiple SHDB table themes per UNEP–SETAC subcategory are possible.
- For each SHDB table theme, only one issue is defined for assessment.
- The following criteria for defining the issues were applied:
- ○
- As general as possible (for example, total child labour instead of female child labour)
- ○
- Issues from the Social Hotspot Index were the priority
- Sector-specific issues are preferred.
As some of the UNEP–SETAC subcategories are very broad and the SHDB categories have more specific issues available, multiple SHDB table themes or issues per subcategory are defined. But for each UNEP–SETAC subcategory, one key indicator (KI; an issue from the SHDB) is defined to carry out the relevance analysis. A list showing the matched UNEP–SETAC categories and SHDB table themes and issues is provided in the supplementary material.
2.2. Relevance Analysis
Collecting the data needed for a social assessment of a whole product chain is a very demanding and laborious task [21]. Therefore, we propose a relevance analysis to focus the data-collection efforts on the relevant aspects. This analysis is carried out via a two-step evaluation at a unit process level for the life cycle of a product. The results of the two steps are multiplied with each other to obtain a social relevance number (SRN), which—if above a certain threshold—determines if the UNEP–SETAC subcategory is a relevant topic for a given process. This idea follows the same basic principle as in failure mode and effects analysis (FMEA) in risk management, where risks are assessed by means of pairing (multiplying) the probability of the occurrence of some event with the said event’s consequences to obtain the so-called risk priority number [22]. Analogously, the relevance analysis is carried out by looking at the social risks of a given country sector and pairing this to its relevance within the life cycle. In this way, multiplying social compatibility (SC) with the relevance in the value chain yields the SRN.
2.2.1. First Step of the Relevance Analysis: Social Compatibility
To conduct the first step of the relevance analysis, the unit processes are evaluated according to the different UNEP–SETAC subcategories. This first step of the evaluation provides an answer to the question “What is the risk of unit process x of sector y in country z being socially incompatible?”. In order to answer this question, we used information from the SHDB as described in Section 2.1.
The data in the SHDB are classified as risk assessments ranging from 0 (evidence of no risk), 1 (low), to 4 (very high), or as “not applicable” or “no data” (if no data for a sector-specific issue is available, switch to the corresponding country-specific issue). This SHDB rating (e.g., “Low”) is then paired to the SC description (“High social compatibility”), which, in turn, is classified according to the SC scale (“1”) described in Table 1. If the issues in the guidelines and the SHDB do not match, and the issue is considered relevant, further sources must be used, for example, desktop research.
2.2.2. Second Step of the Relevance Analysis: Unit Process Relevance
The second step of the evaluation answers the question: “How relevant is process x in respect to supply chain β?”In order to answer this question an activity variable is required to set the impacts of different processes in a uniform way along the supply chain and in relation to each other. We propose two possible activity variables: (i) added monetary value or (ii) WHs per unit process, which are also suggested in other publications [10]:
- Added monetary value (AMV in $): The more added value a single unit process has, the more important it is to investigate its social impacts. In this manner, the AMV of the unit process under assessment (AMVPS) is evaluated according to the discrete intervals proposed in Table 2. As such, the activity variable obtains a value from 1 to 4, with 1 being an insignificant added value and 4 a very significant added value.
- WHs: If the unit process is work-intensive then it is important to investigate it. WHs are measured in hours (h) and refer to the time a worker requires to carry out such a unit process. Analogously to the monetary approach, the WHs are evaluated on a discrete scale (see Table 2) and thus the unit process obtains a value from 1 to 4, where 1 is almost no worker time involved and 4 is very labour intensive. It is worth noting that for the case study in this paper, WHs were selected as the activity variable.
When carrying out the relevance analysis, a decision needs to be made regarding which activity variable to use depending on the goals of the study as well as on data availability. The next challenge is defining the set of intervals. Every product and supply chain is different and therefore setting the discrete scale is left to the practitioner’s expertise. To define the ranges for the discrete scale, literature research is needed, or, if available, the opinion of (industry) experts, for example, through a qualitative Delphi survey among experts. We used a first class of 0 to 1% and, thereafter, an increase of 5% intervals respective to the total amount of activity variable units (“$” or “hours”), as shown in Table 2.
For example, if the extraction of the needed amount of gold costs $40 and the total added value of the product’s life cycle is $500, then the unit process extraction of gold is valued at 8% and therefore it would fit into category 3: “high relevance”. The same logic applies if WHs are selected as the activity variable.
The activity variable, respectively the relevance of a certain unit process could also be used to estimate the impact of a specific value chain.
2.2.3. Calculating the Social Relevance Number
The SRN gives the overall relevance of each unit process for every subcategory. The SRN is simply calculated by multiplying the SC with the unit process relevance (UPR) category, as stated in Equation (1):
where:
SRN = SC ∗ UPR
- SRN: Social Relevance Number
- SC: Social Compatibility
- UPR: Unit Process Relevance
Since both SC and the UPR were defined with a maximal value of 4, the maximal SRN is 16 and the middle value is 4 (the multiplication of the middle values 2 times 2). We recommend setting the threshold of relevance for the SRN at between 4 and 6. Like this medium relevant subcategories in medium relevant unit processes are still to be considered further on, but a process with either low relevance in the value chain or high social compatibility is not judged as relevant. However, for different value chains the definition of this threshold is left to the practitioner.
If there is no data for the social compatibility, the SRN cannot be calculated; however the subcategory for this unit process is treated as relevant and will be further evaluated in the detailed inventory assessment.
2.3. Social Life Cycle Inventory
In the relevance analysis, the relevant subcategories for the relevant unit processes are identified. In the data-inventory step, data for these relevant subcategories for the specific unit processes are investigated. We propose using “unit process level” data [19] if possible. Because “impacts on people are naturally related to the conduct of the companies engaged in the life cycle rather than to the individual industrial processes…” [23], data should contain site- and company-specific situations for the subcategory indicator(s). If not available, sector- and then country-specific situations for the subcategory indicator(s) can be used.
In the best case, site- and company-specific data are publicly available or can be collected by interviews or questionnaires, as done previously [18]. If this is not possible, we suggest falling back on sector- or country-specific data sources (for example, statistical sources such as those in Table 3 or media and nongovernmental organisation (NGO) reports). Depending on the subcategory and the chosen indicator, the data are either qualitative or quantitative.
2.4. Social Life Cycle Impact Assessment
There are different methods to assess the social impact of a product, yet none of them has achieved consensus and established itself as the standard [40]. As no consensus presently exists on cause–effect relationships regarding social issues [21], we decided to use a type I characterisation model and use PRPs (SPRPs, see Section 2.4.1) as a weighting system, as recommended by the guidelines [10]. This allows for the assessment of the specific situation in comparison to a defined international or national benchmark [15]. In our case, where we have to assess energy technologies developed in Switzerland and that are meant to be operated in Switzerland in the future, we use the social situation in Switzerland as a reference value or benchmark. The method is not meant to quantify the social burden of a quantified amount of product, because well-documented and renowned impact pathways between activities within product systems and their impact on social well-being are still lacking [16]. Furthermore, it is not our intention to sum up social impacts merely in one single figure, which in the end does not represent the social problems of a product’s lifecycle comprehensively. And—more importantly—it should be noted that at the time of carrying out social impact assessments, and especially while bringing together issues and stakeholders, careful attention has to be paid at the time when using such aggregating scores. As these social issues are inherently sensitive topics, there is a risk of incurring cynical comparisons (for example, what is more severe: child labour or corruption?). That is why the impact assessment in our method consists of several data types on the most relevant issues along the lifecycle: SC, relevance in the lifecycle, an evaluation compared to SPRPs and a qualitative summary per subcategory and process step (with quantitative indicators where available and meaningful), because we believe that a qualitative summary is still more informative and meaningful than a number to describe a (complex) social situation. These four parts of the impact assessment—we call them a “social life cycle impact overview”—inform decision makers about the most relevant production steps regarding social risks, the comparison to the Swiss situation and the social situation and problems themselves.
2.4.1. Swiss Performance Reference Points
In this chapter, the definition of an SPRP is described in detail. In the methodological sheets [13], it is stated that the use of PRPs “allows [for] the evaluation of the position of the unit process assessed relative to the performance expected from an international convention, a Social Responsibility best practice guideline or even when compared to other countries.” Herein lies the contribution from this work. The performance of the unit processes is compared to the performance in Switzerland (for an explanation, see the Introduction), and the term SPRP is thus defined.
The advantage of the method is that Switzerland is a country where social conditions are considered as high or very high (for example, Switzerland has the world’s third highest Human Development Index ranking at 0.930 [28]). On the other hand, a disadvantage in making comparisons with a country with such a high reference value is that most other countries will be ranked with a negative indicator for most issues (see the indicator scale in Table 4).
On the basis of the UNEP–SETAC indicator suggestions, an indicator is selected for every subcategory. To choose convenient indicators, the following criteria were considered, keeping in mind that the general relevance of the data for a given issue has first priority:
- Quantitative: The data have to be clearly defined and shall be as quantifiable and objective as possible (that is, statistical data based on facts).
- Semiquantitative: If no quantifiable relevant data can be found, semi-quantifiable data shall be chosen (that is, composed of indicators from different organisations).
- Qualitative: If no quantifiable or semiquantifiable relevant data can be found, the situation has to be described qualitatively. This mainly involves assessing a given threat in a geographical region or the state’s efforts at fighting a given threat to human rights.
Quantitative data was given priority, because we believe practicability (time effort and data availability) is in a first attempt much higher than with qualitative data. However we strongly recommend integrating also qualitative data in the course of the more detailed data inventories.
In Figure 3, a schematic view of the general procedure for the selection of the indicators and the definitions of the metrics are provided.
Based on the UNEP–SETAC guidelines, the suggested indicators from UNEP–SETAC, the table themes of the SHDB [17], the available statistical data and the background of the above-mentioned prioritisation, a specific indicator has to be chosen. For each indicator, the reference value of Switzerland has to be calculated and the scale for the SPRP has to be defined. The procedure for the SPRP metric definition is further explained in the following sections.
Quantitativee and Semiquantitative Indicators
Quantitative indicators are mainly pure statistical data. For example, the rate of people with access to improved sanitation in respect to the total population as an indicator for access to material resources can be found in the World Health Statistics 2015 [29]. Semiquantitative indicators are, for instance, specific indicators and indexes from other organisations. For example, indicators from the CIRI Human Rights Data Project, are briefly explained in a past paper [28]. On the basis of such data metrics, generic PRPs can be defined. In Table 4, a standard possible PRP metric distribution is given for quantitative indicators following the methodology presented in Hsu et al. [40]. This methodology distributes the percentage difference between 1 and 5 points on a 0.5 scale, which means that there are 9 intervals. Herein, we prefer to distribute the data over 5 intervals from −2 to 2 in order to avoid unrealistic accuracy. As there exist not only “negative” social indicators (like percentage of forced labour) where a small number is positive, but also “positive” ones like local employment (percentage of workforce hired locally), where a large number is positive, two different scales for setting the PRP value had to be defined.
This is a simple method to transform every numeric data item into a PRP. Since it can be adopted as a standard method, it avoids biasing the data with subjective choices. On the other hand, attention has to be paid to the results because the metrics of the PRP results are not necessarily proportional to the severity of the threat. The three main possible distortion effects are:
- The range and the resolution of the original indicator are smaller than those of the PRP.
- -
- Example: Characteristic CIRI indicators are discrete and are often just between 0 and 2 or 3.
- -
- Possible solution: Reduce the PRP range and metric by transposing the original indicators to the PRP values (for example, an index with possible values of 0, 1 and 2 would become PRP −2, −1 and 0, as long as the reference situation has an index value of 2).
- The reference (Switzerland) which, per definition, scores 0 SRPR, has the maximal (or minimal) possible value of the original indicator. In this case, half of the SPRP scale cannot be used, which results in a loss of resolution.
- -
- Example: This is characteristic of CIRI indicators and statistical data expressed in rates where the reference values are near 100% or 0%.
- -
- Possible solution: Reduce the PRP range and use only half of the scale.
- The PRP may give the wrong idea about the situation when the defined percentage in Table 4 is not proportional with a real difference in the indicator.
- -
- Example: This can happen with many indicators, since there is no given reason for proportionality between the methodology according to authors of a previous paper [40] and the real indicator’s behaviour. This possible distortion is also the most difficult to recognise. Good practice involves taking a general view of the distribution of the total statistical data available and estimating how many countries would end up with which SPRP.
- -
- Possible solution: Define a specific scale for just this indicator on the basis of the indicator itself, international standards, or recommended practices. One strategy could be to check the statistical distribution and adjust the SPRP levels so that the nations are evenly distributed between the SPRP.
It is therefore wise to be careful and check every quantitative and semiquantitative indicator. For example, for the subcategory of secure living conditions, the indicator Fragile State Index (FSI) [33] from “The Fund for Peace” has been chosen. This indicator sums up 12 different specific indicators with a range from 1 to 10.
Qualitative Indicators
Qualitative indicators are mostly of the type “are there any means (any law, constitution, organisation or labels) to protect people from a given threat?” To create a PRP scale, this information has to be expressed anyhow in a relative manner. Thus, a differentiated set of questions is defined to make those qualitative indicators quantifiable (see Figure 4).
On the vertical scale (the response is yes), the “performance reference points’ dimension” is represented. For this dimension, by responding with “yes” or “no” to the “statement” and the “implementation” questions, the SPRP is assigned and ranges from −2 to 0. On the horizontal axis, the legislative level dimension is represented. Further details are given in the next section.
Prioritisation of Legislative Levels
It is difficult to use the full range of the PRP since the reference situation (Switzerland) is, per definition, in the middle of the range with a value of 0. Where it is more or less clear as to how to define the negative PRP values, this is not the case for the positive PRP values. This is mainly because the reference situation in Switzerland often has quite an ideal situation in terms of SC. But if there is a practical way in which to define how people can be further protected from the given threat, the positive values of the SPRP should still be used.
General Consideration of the Reference Situation Switzerland
In this study, Switzerland serves as a reference situation and thus, the question arises regarding if the respective constitutional principles, laws and regulations are enforceable and show a proper picture of the real situation in Switzerland. To assess this aspect, the Corruption Perception Index (CPI) from Transparency International [41] and the evaluation from Amnesty International (AI, [40]) regarding the state of human rights in Switzerland serve as information sources. In terms of corruption, Switzerland is among the best-rated nations in the world (that is, it is 5th out of 174 for the CPI). Also the Amnesty International Report 2016/17 [42] for Switzerland shows a positive picture for the legal situation in Switzerland. However some concerns regarding a sweeping new surveillance regulation and the treatment of asylum seekers are mentioned. Considering all this, it can be assumed that laws and constitutional principles in general are enforceable in Switzerland.
Example of Swiss Performance Reference Point Definitions
In the following section, we present an example of the UNEP–SETAC subcategories, sometimes with multiple indicators, and their respective SHDB issues, the situation in Switzerland and the defined SPRPs (see Table 5). The SPRP levels for (semi-) quantitative indicators were defined according to Hsu’s method [40]. The levels for the qualitative indicators were defined as follows: 0 is, per definition, the level of the situation in Switzerland, −1 is one level worse than in Switzerland and −2 is two levels worse than in Switzerland. The levels for the qualitative indicators are defined in Figure 4. The country-specific description under the “Situation in Switzerland” can be used as an RP for companies, sites and sectors. Even if the indicator means the existence of a specific law, convention or constitutional article, the SPRP level can be compared with company- or sector-specific situations, because if, for example, a law is enforceable in a specific country, one can assume that this is also the case in the assessed company. And if a law is not enforceable or nonexistent in a country, the situation in the company has to be evaluated specifically. For example, it has to be assessed if a company takes voluntary action to minimise the indicator’s negative impacts for stakeholders. If so, the company can be rated better than the country in general.
2.5. Interpretation
Interpretation is the most important thing but it is also a very difficult step in a S-LCA. Because data availability and data quality is often very low and impact pathways and long-term effects are very uncertain in social situations interpretation is a very demanding task. Because of that we refrain from aggregating the qualitative evaluation and the evaluation based on SPRPs and we also refrain from an aggregation of all subcategories.
Thus, we do not try in any way to prioritise which social impacts are more severe and sum them up in an aggregated index. Our purpose is to provide an overview of the relevant social issues and their situation in the specific life cycle as well as to make a comparison with the Swiss situation based on the SPRPs. Furthermore, the evaluation based on the SPRP is positive or negative, but positive impacts should not compensate for negative ones in an aggregation. For example, if a company provides a school for children, it would be awarded some positive points. Analogously, if the company uses child labour, negative points have to be assigned. However, the positive and negative points should not be summed in an index; in this way, we avoid compensation in the sense that providing a school is no excuse for resorting to child labour. The provided “impact assessment overview” of our approach to the S-LCA serves as a decision-making tool to inform us regarding which aspects in the life cycle are most urgent (that is, hotspots) and should thus be prioritised in terms of efforts being made towards social improvements. This is the main goal of the interpretation in our method. Obviously, the method does not serve as a tool for an SC comparison between different products.
3. Results of the Case Study
In this section we present the results of our case study, in which our S-LCA approach is applied. In this case study, we did not assess a whole product supply chain, but only two relevant steps in the supply chain, the extraction of copper and copper processing, as explained in the next chapter.
3.1. Goal & Scope
We decided to test the methodology by selecting a bulk material that fulfilled the following criteria:
- The material is present in most electric appliances.
- It is of importance for the energy industry.
- It is mined in both small (artisanal) and large-scale mining operations.
Thus, copper was selected. Copper is a metal present in most electric appliances as wire, piping, or other components. Due to its high electric conductivity and comparably low price, copper is indispensable for energy technologies. Copper is mined both in open-pit and artisanal mining operations and its initial provenance can no longer be proven after refining. The selected case study refers to a generic component that is manufactured in Switzerland, and the manufacturer purchases copper subcomponents from third-party manufactures. The manufacturing of this generic component requires 16 kg of processed copper wire, which we defined as the functional unit for this case study. Two life cycle phases were analysed: raw material extraction and processing. The assembly phase, that is, the assembly of the copper subcomponents into the device, takes place in Switzerland and was therefore disregarded. The reason for disregarding the assembly phase is that it was assumed that an average Swiss company carried out the assembly and that the laws and regulations are respected (see Section 2.4.1 for a general consideration of the reference situation in Switzerland). It was estimated that producing such a product requires a total of 70 WHs. The device has a total of 16 kg of copper that has to be mined and later processed. The mining takes place in Chile (on a large scale) and the Congo (artisanal) and the processing occurs in Turkey, taking into consideration the following considerations and assumptions.
After many unsuccessful attempts at tracing the copper components, it was clear that the traceability of the metal’s origins is very limited. However, to carry out a social impact assessment, knowing the provenance of the materials is required. Thus, we assumed a theoretical copper mix of 95% Chilean copper and 5% copper of Congolese origin. We selected a likely best-case scenario for an industrial mine in Chile for the raw material extraction phase, and a likely worst-case location scenario for an artisanal mine in the DRC, which is associated with many social risks [44]. For the processing (that is, wire production), a transition economy was selected. Turkey was purposely selected because of its ties to Europe.
The copper case study is presented on the basis of four exemplary subcategories to reduce complexity. The four subcategories with their respective KIs are:
- Delocalisation and Migration (DM)—KI: Risk that a country has not ratified international conventions or set up policies for immigrants
- Access to material resources (RM)—KI: Risk of no access to an improved source of sanitation
- Child Labour (CH)—KI: Risk of child labour in the sector
- Forced Labour (FL)—KI: Risk of forced labour in the sector
Since the results strongly depend on each other, a summarising table that relates to all steps was elaborated.
Table 6 presents the results of the relevance analysis, life cycle inventory and SPRPs. In the following sections, all steps of our S-LCA approach for the copper case are described.
3.2. Relevance Analysis: The Case of Copper
As described in Section 2.2, the relevance analysis was carried out in a two-step procedure, the first one being the SC and the second the UPR. For this purpose, the five stakeholder groups and their respective subcategories—as proposed in the guidelines—were listed, and the method described in Section 2.2.1 was applied.
The relevance analysis for the four exemplary subcategories is presented in Table 6.
3.2.1. First Step of the Relevance Analysis: Social Compatibility: The Case of Copper
By applying the method described in Section 2.2, the SC values were assigned. In the case study of copper, three of the selected four subcategories display a very high risk (value 4) in the Democratic Republic of the Congo (DRC) (see Table 6). For the subcategory “Delocalisation and Migration”—respectively for its KI—no data were found in the SHDB, and therefore the subcategory was considered as relevant. In the case of Chile, we observe a high risk (yet not critical, with a value of 3 out of 4) for delocalisation and migration. A medium risk was observed for forced labour. Material resources and child labour present a low social risk (with a value of 1). In the case of Turkey, some of the issues present as high risk, but they were not considered relevant following the assessment of the UPR.
3.2.2. Second Step of the Relevance Analysis: Unit Process Relevance: The Case of Copper
As mentioned in Section 2.2.2 (Second Step of the Relevance Analysis: Unit Process Relevance), the second step of the relevance analysis consists of defining an activity variable and measuring or estimating the data for it. In this case study, WHs per life cycle processes are selected as the activity variable due to better data availability.
Computing the WHs per kg of material is based on public data and some assumptions. The results should be used as an exemplification of the described method. For specific analyses, recent site-specific data should be used.
Since the mining or processing methods vary drastically according to different countries and mining methods, the procedure to calculate the amount of WHs per unit process is also different for each process. For example, in Chile, the production is measured in tons of mined copper, whereas in an artisanal mine in the Congo, it is measured in 50-kg bags of mined ore, and in Turkey, the material is only processed with a wire-drawing machine. For this reason, the information we gathered was related to the specific features of each process. With this information, we estimated the number of WHs per unit process. These results, sources and assumptions are summarised in Table 7, Table 8 and Table 9.
Before the arrival of the copper product in Switzerland, it was assumed that the metal was processed in a factory in Turkey. It was further assumed that a worker constantly operates a wire-drawing machine of the Niehoff M85 type that can process 1300 kg Cu per hour [50]. With these assumptions, it was calculated that it takes 0.012 h to process 16 kg Cu.
We do not claim that the calculated WHs represent the exact amount of time workers spend to finish the respective step in the value chain. We do, however, believe that this approach can relativize different production locations and work steps.
Lastly, we divided the total WHs of the finished product by the WHs per unit process. The obtained ratio was evaluated according to the ordinal scale in Table 10 to obtain the UPR.
The final results of the UPR can be found in Table 6.
3.2.3. Calculating the Social Relevance Number: The Case of Copper
To obtain the SRN we multiplied the SC and the UPR. This relevance analysis revealed which issues should be analysed in more detail. As mentioned in Section 2.2.3 (Calculating the Social Relevance Number), we recommend using a threshold of 4 to 6. For the current assessment, we set the threshold at 6; meaning that all issues with an SRN equal to or greater than 6 were analysed further in the social life cycle inventory (seeTable 6).
3.3. Social Life Cycle Inventory: The Case of Copper
For those process/subcategory combinations with an SRN greater than 6 or those that qualified as not available (n/a) (see Table 6), a qualitative assessment based on desktop research was carried out.
3.3.1. Mining in the Democratic Republic of the Congo
Delocalisation and Migration
Migration out of the Congo or in other parts of the country is a serious problem. By financing conflicts with the money from sold minerals, 2.6 million inhabitants have migrated to other countries because of bad living conditions [51].
Access to Material Resources
Child Labour
Child labour is a serious problem in artisanal mining. In many cases, rural child labour is found in mines and many children perform the worst forms of labour in general [55]. Even children have to carry heavy bags for up to 2 days [56]. Forced marriage is not unusual [52]. Furthermore, armed rebels force children to work without any salary. Other forms of slavery occur. Their parents are often trapped in “debt bondage slavery” [52].
Forced Labour
3.3.2. Mining in Chile
Delocalisation and Migration
International labour migration to the Chilean mining industry seems to be a rather marginal problem. There are regions with high percentages of immigrants, but not because of the mining industry itself [58].
Chilean legislation concerning immigration, however, is reactive and fragmented, because Chile is not a country with traditional immigration [58]. No reports or evidence for delocalisation or migration due to mining activities were found.
3.3.3. Processing in Turkey
All issues obtained a social risk number of less than 6.
3.4. Social Life Cycle Impact Overview: The Case of Copper
Having analysed the relevant impacts, the last step was to evaluate the SPRPs for every subcategory (here restricted to the KIs), according to the rules proposed in Section 2.4.1. The description of the SPRPs of the four exemplary subcategories (here restricted to the KIs) can be found in Table 11. The numerical evaluation based on the SPRP for the case of copper can be found with the other results in Table 6.
4. Discussion
The methodological approach to the S-LCA presented in this article is based on widely established guidelines [10] and therefore it is also based on the principles of the E-LCA; meaning that it is also aligned to the basic principles of the LCA (ISO 14001 and ISO 14040). The goal was to develop an efficient way to conduct an S-LCA. That is why a relevance analysis is included, which makes the inventory analysis process less effortful and time-consuming, which is also proposed by several other approaches [61]. The proposed novel relevance analysis is an adaptation of the failure mode and effects analysis (FMEA) and has proved to be more than a hotspot analysis because it shows not only the relevant issues along the supply chain but it also categorises the social risks into four categories and evaluates each process step according to its relevance in the life cycle. Judging the relevance of a certain social issue based on an activity variable was proposed also by former S-LCA studies [11,62], but can be seen as highly problematic, because it would appear to weight social consequences against each other. If product A contains 100 g of copper per functional unit and product B only 50 g, the result could be that product B has no problem with child labour, only because the amount of copper is not that relevant for the product’s value chain. But is one child working really a smaller social burden than two children working? In the first attempt, one would maybe agree, but the fate of an individual can hardly be compared to a statistical description of a social situation. Meaning that a lost childhood due to child labour under dangerous and exploitative circumstances is of endless severity, whether that is one or many children, and this cannot be accounted for in a simple calculation. Furthermore even the judgment if child labour actually is a bad circumstance for a society is difficult. In this study we based our impact assessment on the UNEP-SETAC guidelines, where child labour is treated as a negative impact, which it certainly is from the perspective of the individual child. But from the perspective of the family or the local society the wage of a working child may lead to a sufficient nutrition of the whole family or allows school attendance for its siblings.
After the relevance analysis, a comparison with the Swiss situation was carried out by means of the SPRPs. For this purpose, a 5-level scale (with integers ranging from −2 to 2) is proposed in order to describe how much the social situation under investigation deviates from the standard Swiss situation. It can be concluded that having such a scale not only enables the description of social aspects, it also does so in a way that is transparent, structured and can therefore be repeated and/or adapted to other countries. Performance Reference are used in other S-LCA studies as well [14], but here we used a specific country as a reference point, which we did not found in other studies.
It also has to be considered that the use of PRPs has two inherent disadvantages. Firstly, the data resolution at the national level of the different countries is too low and may not describe the social situation, for example, in a specific copper mine, accurately. Using a country average, as was the case in the present study, leads to a very broad assessment range. Even in a small country that is relatively homogenous like Switzerland, the resolution may still be inappropriate for comparing specific industry sectors or even factories. This phenomenon would be exacerbated if one were to use averages for larger countries. For example, the social conditions in urban California are very different from those in rural Louisiana. Furthermore, in the SPRP, a legal situation is often evaluated, but this is, in certain countries, far from the real situation or might differ from region to region, company to company or even from mine to mine of the same company. Thus, transparency in terms of data quality and data validity is very important.
The second great challenge posed by the use of PRPs is that the classification into five categories (from −2 to 2) also yields results with a very coarse resolution. This problem is aggravated by taking Switzerland as the reference, because most of the results would then lie in the negative spectrum. In this manner, the five SPRP categories turn out to be—very often—only three: 0, −1 and −2 (because the social conditions in Switzerland are better than in most countries). The authors are aware that this is a strong simplification and in some cases it can lead to meaningless results. For further improvements to the methodology, we propose using a broader scale. However, it is recommended that the results are handled according to the objectives of the study and that full transparency is always maintained.
This dilemma, previously described as the risk of low validity of the evaluation based on the SPRP, entails an additional, more qualitative evaluation to complement the social impact assessment.
The qualitative and quantitative information on the different subcategories was summarised and forms the impact assessment overview. With the proposed methodology, a prioritisation of the results was achieved and it provided qualitative and semiquantitative information for the most critical aspects. The methodological approach does not involve undertaking a quantitative and aggregated impact assessment because the methods and theoretical backgrounds to do so are still lacking. However, there has been a recent attempt to measure social outcomes with a set of indicators for need satisfiers and for human well-being [63]. The authors even defined thresholds for all the indicators, which does, of course, come down to subjective choice. However, thresholds mostly reflect the goal settings of different international organisations in the respective fields of action (for example, see World Bank [64], UN [65], and World Happiness Reports [66]).
Regarding our case study on copper, it was discovered that work in a mechanised mine does not guarantee decent social conditions. However, having a formal economy, that is, having a formal company that can be held responsible, might solve many of the problems. For instance, the risk of forced labour is reduced. Furthermore, since there is less human work involved (per kg copper), the damage to individuals is reduced, in contrast to an artisanal mine. For the mining process, it can be said that the results correlate with the expectations in the sense that it was proven that the conditions are much better in Chile than they are in the DRC.
One basic requirement to carry out a reliable S-LCA is the knowledge about the provenance of all raw materials and preproducts, which is at the moment still very limited for some raw materials.
5. Conclusions
This paper contributes to the development of the S-LCA methodology by presenting a combination of methods that is both efficient and informative. To achieve this, the methodology heavily relies on a two-fold relevance analysis (SC and UPR) and a very specific social RP; namely, the social conditions in Switzerland. With this benchmark, a numerical value was assigned from which insightful conclusions can be drawn. But we are convinced that a single number is not sufficient to assess a social situation. Therefore, we decided to include a qualitative summary of the most important social aspects of the product chain as part of the impact analysis.
Overall, this paper presents a contribution to the further development of a S-LCA methodology, which is accurate, meaningful and still practice-oriented. Regarding the further development of the S-LCA method it is essential to push forward a standardization of the impact assessment, above all a consistent weighting system with an appropriate consideration of the relevance in the supply chain. In this study we propose one opportunity to do so—with its advantages and disadvantages. Furthermore it is essential that the SHDB could be further developed and provides valuable generic inventory data. For future studies, it would be interesting to apply the proposed methodology not only for copper but also for other metals and materials. Ultimately, the goal is to apply the methodology for a specific product or technology with all its materials, production processes and supply chains, so that individuals and companies can make an informed choice and refuse to buy from companies who exploit people or harm local communities throughout the production process.
Supplementary Materials
The following is available online at https://www.mdpi.com/2071-1050/10/12/4382/s1, Table S1: Matching UNEP subcategories with Social Hotspot Database.
Author Contributions
Conceptualization, E.L.-K., L.L. and C.Z.; Investigation, E.L.-K., L.L. and T.K.; Methodology, E.L.-K., L.L. and R.R.; Writing—original draft, L.L.; Writing—review & editing, E.L.-K., V.C.. and C.Z.
Funding
This research was funded by the National Research Program “Energy Turnaround” (NRP 70) of the Swiss National Science Foundation (SNSF) grant numbers 407040_153944 and 407040_153981
Acknowledgments
The authors thank the three anonymous reviewers and Corinna Baumgartner for their valuable and constructive comments on an earlier version of this paper.
Conflicts of Interest
The authors declare no conflicts of interest. The funders had no role in the design of the study; in the collection, analyses, or interpretation of data; in the writing of the manuscript, and in the decision to publish the results.
References
- Wang, J.-J.; Jing, Y.-Y.; Zhang, C.-F.; Zhao, J.-H. Review on multi-criteria decision analysis aid in sustainable energy decision-making. Renew. Sustain. Energy Rev. 2009, 13, 2263–2278. [Google Scholar] [CrossRef]
- Neugebauer, S.; Traverso, M.; Scheumann, R.; Chang, Y.-J.; Wolf, K.; Finkbeiner, M. Impact pathways to address social well-being and social justice in SLCA—Fair wage and level of education. Sustainability 2014, 6, 4839–4857. [Google Scholar] [CrossRef]
- Jørgensen, A.; Finkbeiner, M.; Jørgensen, M.S.; Hauschild, M.Z. Defining the baseline in social life cycle assessment. Int. J. Life Cycle Assess. 2010, 15, 376–384. [Google Scholar] [CrossRef]
- Swiss National Science Foundation. Energy Turnaround Nationale Research Programme NRP 70; SNSF: Bern, Switzerland, 2015; Available online: http://www.nfp70.ch/en (accessed on 15 August 2018).
- Maxim, A. Sustainability assessment of electricity generation technologies using weighted multi-criteria decision analysis. Energy Policy 2014, 65, 284–297. [Google Scholar] [CrossRef]
- Shaaban, M.; Scheffran, J.; Böhner, J.; Elsobki, M.S. Sustainability assessment of electricity generation technologies using weighted multi-criteria decision analysis. Energies 2018, 11, 1117. [Google Scholar] [CrossRef]
- Zimmer, K.; Fröhling, M.; Breun, P.; Schultmann, F. Assessing social risks of global supply chains: A quantitative analytical approach and its application to supplier selection in the German automotive industry. J. Clean. Prod. 2017, 149, 96–109. [Google Scholar] [CrossRef]
- United Nations. Transforming Our World: The 2030 Agenda for Sustainable Development; United Nations: New York, NY, USA, 2015; Volume 16301. [Google Scholar]
- Wu, R.; Yang, D.; Chen, J. Social Life Cycle Assessment Revisited. Sustainability 2014, 6, 4200–4226. [Google Scholar] [CrossRef] [Green Version]
- UNEP-SETAC. Guidelines for Social Life Cycle Assessment of Products; UNEP-SETAC: Paris, France, 2009; Volume 15, ISBN 9789280730210. [Google Scholar]
- Benoît, C.; Norris, G.A.; Valdivia, S.; Ciroth, A.; Moberg, A.; Bos, U.; Prakash, S.; Ugaya, C.; Beck, T. The guidelines for social life cycle assessment of products: Just in time! Int. J. Life Cycle Assess. 2010, 15, 156–163. [Google Scholar] [CrossRef]
- Corona, B.; Bozhilova-Kisheva, K.P.; Olsen, S.I.; San Miguel, G. Social Life Cycle Assessment of a Concentrated Solar Power Plant in Spain: A Methodological Proposal. J. Ind. Ecol. 2017, 21, 1566–1577. [Google Scholar] [CrossRef] [Green Version]
- Benoît Norris, C.; Traverso, M.; Valdivia, S.; Vickery-Niederman, G.; Franze, J.; Azuero, L.; Ciroth, A.; Mazijin, B.; Aulisio, D. The Methodological Sheets for Sub-categories in Social Life Cycle Assessment (S-LCA); UNEP-SETAC: Paris, France, 2013. [Google Scholar]
- Chhipi-Shrestha, G.K.; Hewage, K.; Sadiq, R. ‘Socializing’ sustainability: A critical review on current development status of social life cycle impact assessment method. Clean Technol. Environ. Policy 2015, 17, 579–596. [Google Scholar] [CrossRef]
- Parent, J.; Cucuzzella, C.; Revéret, J.-P. Impact assessment in SLCA: Sorting the sLCIA methods according to their outcomes. Int. J. Life Cycle Assess. 2010, 15, 164–171. [Google Scholar] [CrossRef]
- Russo Garrido, S.; Parent, J.; Beaulieu, L.; Revéret, J. A literature review of type I SLCA: Making the logic underlying methodological choices explicit. Int. J. Life Cycle Assess. 2016, 23, 432–444. [Google Scholar] [CrossRef]
- New Earth Social Hotspot Database. Available online: http://socialhotspot.org/ (accessed on 15 August 2018).
- Hosseinijou, S.A.; Mansour, S.; Shirazi, M.A. Social life cycle assessment for material selection: A case study of building materials. Int. J. Life Cycle Assess. 2014, 19, 620–645. [Google Scholar] [CrossRef]
- Talantsev, A. A Systematic Approach to Reputation Risk Assessment. In Modelling, Computation and Optimization in Information Systems and Management Sciences; Le Thi, H.A., Pham Dinh, T., Nguyen, N.T., Eds.; Springer International Publishing: Cham, Switzerland, 2015; pp. 461–473. [Google Scholar]
- Interdepartementaler Ausschuss Nachhaltige Entwicklung (IDANE). Nachhaltige Entwicklung in der Schweiz: Ein Wegweiser; IDANE: Bern, Switzerland, 2012. [Google Scholar]
- Jørgensen, A.; Le Bocq, A.; Nazarkina, L.; Hauschild, M. Methodologies for social life cycle assessment. Int. J. Life Cycle Assess. 2008, 13, 96–103. [Google Scholar] [CrossRef]
- Austrian Standards Plus. ÖNORM ISO 3100:2010, 2nd ed.; Austrian Standards Instiute: Vienna, Austria, 2014; ISBN 978-3-85402-295-4. [Google Scholar]
- Dreyer, L.C.; Hauschild, M.Z.; Schierbeck, J. A framework for social life cycle impact assessment. Int. J. Life Cycle Assess. 2006, 11, 88–97. [Google Scholar] [CrossRef]
- Federal Statistical Office. Statistical Data on Switzerland 2015; Federal Statistical Office Section Dissemination and Publications: Neuchâtel, Switzerland, 2015; ISBN 9783303005309. [Google Scholar]
- Walter, P.; Herrmann, A.B.; Cangemi, V.; Murier, T.; Perrenoud, S.; Reutter, R.; Saucy, F.; Schmassmann, S. Arbeitsmarktindikatoren 2015; Bundesamt für Statistik: Neuchâtel, Switzerland, 2015; ISBN 9783303032763. [Google Scholar]
- Kraszewska, K.; Knauth, B.; Thorogood, D. Indicators of Immigrant Integration: A Pilot Study; Publications Office of the European Union: Luxembourg, Luxembourg, 2011; ISBN 978-92-79-20238-4. [Google Scholar]
- Eurostat. The Measurement of Poverty and Social Inclusion in the EU: Achievements and Further Improvements; UNECE: Geneva, Switzerland, 2013. [Google Scholar]
- UNDP. Human Development Report 2015: Work for Human Development; United Nations Development Programme: New York, NY, USA, 2015. [Google Scholar]
- World Health Organisation. World Health Statistics 2015; World Health Organisation: Geneva, Switzerland, 2015; ISBN 9780874216561. [Google Scholar]
- The Organisation for Economic Co-operation and Development (OECD). Health at a Glance 2015: OECD Indicators; OECD Publishing: Paris, France, 2015; ISBN 978-92-64-24351-4. [Google Scholar]
- Cingranelli, D.L.; Richards, S.D.L.; Clay, C.K.C. CIRI Human Rights Data Project: Short Variable Description, 2013.
- Cingranelli, D.L.; Richards, S.D.L.; Clay, C.K.C. CIRI Data 1981–2011. Available online: http://www.humanrightsdata.com/p/data-documentation.html (accessed on 15 August 2018).
- Messner, J.J.; Haken, N.; Taft, P.; Blyth, H.; Lawrence, K.; Graham, S.P.; Umana, F. Fragile States Index 2015; Fund for Peace: Washington, DC, USA, 2015; pp. 1–40. [Google Scholar]
- UNESCO Institute for Statistics. Data Centre: Out of School Children. Available online: http://uis.unesco.org/en/topic/out-school-children-and-youth (accessed on 15 August 2018).
- Diallo, Y.; Etienne, A.; Mehran, F. Global Child Labour Trends 2008 to 2012; IPEC: Geneva, Switzerland, 2013. [Google Scholar]
- Business Social Compliance Initiatie (BSCI). BSCI Code of Conduct; Foreign Trade Association: Brussels, Belgium, 2014. [Google Scholar]
- UNICEF. Child Labour Database. Available online: https://data.unicef.org/topic/child-protection/child-labour/ (accessed on 15 August 2018).
- Sano, H.; McInerney-Lankford, S. Human Rights Indicators in Development. A World Bank Study; The International Bank for Reconstruction and Development: Washington, DC, USA, 2010; ISBN 9780821386040. [Google Scholar]
- United Nations Human Rights. Human Rights Indicators: A Guide to Measurement and Implementation; United Nations: New York, NY, USA, 2012; ISBN 9211541980. [Google Scholar]
- Hsu, C.-W.; Wang, S.-W.; Hu, A.H. Development of a New Methodology for Impact Assessment of SLCA. In Proceedings of the 20th CIRP International Conference on Life Cycle Engineering, Singapore, 17–19 April 2013; pp. 469–473. [Google Scholar]
- Transparency International Corruption Perceptions Index 2014: Results. Available online: https://www.transparency.org/cpi2014/results (accessed on 16 August 2018).
- Amnesty International. Amnesty International Report: The State of the World’s Human Rights; Amnesty International: London, UK, 2017. [Google Scholar]
- Die Bundesversammlung der Schweizerischen Eidgenossenschaft. Bundesgesetz über die Ausländerinnen und Ausländer, 2015th ed.; Die Bundesversammlung der Schweizerischen Eidgenossenschaft: Bern, Switzerland, 2005. [Google Scholar]
- Human Rights Watch. Democratic Republic of Congo Events of 2017. Available online: https://www.hrw.org/world-report/2018/country-chapters/democratic-republic-congo (accessed on 22 January 2018).
- Tsurukawa, N.; Prakash, S.; Manhart, A. Social Impacts of Artisanal Cobalt Mining in Katanga, Democratic Republic of Congo; Institute for Applied Ecology: Freiburg, Germany, 2011; Volume 49. [Google Scholar]
- Vanbrabant, Y.; Burlet, C.; Goethals, H.; Thys, T. Multidisciplinary characterisation of heterogenite—Oxidized cobalt ore deposits (Katanga Province, Democratic Republic of Congo). In Proceedings of the Colloque Quête des Ressources II, Tervuren, Belgium, 1–3 December 2010. [Google Scholar]
- Meersohn, S. La producción de cobre de Minera Escondida fue de 97.103 toneladas. Area Minera 2017. [Google Scholar]
- Bechtel. Escondida Phase IV. Available online: http://www.bechtel.com/projects/escondida-phase-iv-expansion/ (accessed on 16 August 2018).
- Dirección del Trabajo. ENCLA 2014. Informe de Resultados Octava Encuesta Laboral; Salinero Berardi, J., Ed.; Dirección del Trabajo: Santiago de Chile, Chile, 2015. [Google Scholar]
- Demirer Kablo. Demirer Manufacturing Process. Available online: http://www.demirerkablo.com/demİrer/factory-manufacturing-process.aspx (accessed on 19 January 2018).
- Manhart, A.; Schleicher, T. Conflict Minerals: An Evaluation of the Dodd-Frank Act and Other Resource-Related Measures; Institute for Applied Ecology: Freiburg, Germany, 2013; Volume 49. [Google Scholar]
- Zorba, L.; Sarich, J.; Stauss, K. The Congo Report: Slavery in Conflict Minerals; Free the Slaves: Washington, DC, USA, 2011. [Google Scholar]
- Jeska, A. Sklaverei im Kongo: Arbeiten, wo der Teufel Wohnt. Available online: https://www.welt.de/politik/ausland/article106139906/Sklaverei-im-Kongo-Arbeiten-wo-der-Teufel-wohnt.html (accessed on 16 August 2018).
- Grown, C. How Mining Affects Women in the Democratic Republic of Congo. Available online: https://www.weforum.org/agenda/2015/09/how-mining-affects-women-in-the-democratic-republic-of-congo/ (accessed on 30 January 2018).
- ITUC. Report for the WTO General Council Review of the Trade Policies of Democratic Republic of Congo; ITUC: Geneva, Switzerland, 2010. [Google Scholar]
- Source Intelligence. What are Conflict Minerals? Available online: https://www.sourceintelligence.com/what-are-conflict-minerals/ (accessed on 16 August 2018).
- Heath, N. How Conflict Minerals Funded a War That Killed Millions, and Why Tech Giants Are Finally Cleaning Up Their Act. Available online: https://www.techrepublic.com/article/how-conflict-minerals-funded-a-war-that-killed-millions/ (accessed on 16 August 2018).
- Coderre-Proulx, M.; Campbell, B.; Mandé, I. International Migrant Workers in the Mining Sector; International Labour Office: Geneva, Switzerland, 2016; ISBN 978-92-2-128888-6. [Google Scholar]
- Bundesversammlung der Schweizerischen Eidgenosseschaft. Bundesgesetz über die Arbeit in Industrie, Gewerbe und Handel, 2013th ed.; Die Bundesversammlung der Schweizerischen Eidgenossenschaft: Bern, Switzerland, 1964. [Google Scholar]
- Bundesversammlung der Schweizerische Eidgenossenschaft. Konvention zum Schutze der Menschenrechte und Grundfreiheiten, 2012th ed.; Bundesversammlung der Schweizerische Eidgenossenschaft: Bern, Switzerland, 1974. [Google Scholar]
- Martínez-Blanco, J.; Lehmann, A.; Muñoz, P.; Antón, A.; Traverso, M.; Rieradevall, J.; Finkbeiner, M. Application challenges for the social Life Cycle Assessment of fertilizers within life cycle sustainability assessment. J. Clean. Prod. 2014, 69, 34–48. [Google Scholar] [CrossRef]
- Ekener-Petersen, E.; Finnveden, G. Potential hotspots identified by social LCA—Part 1: A case study of a laptop computer. Int. J. Life Cycle Assess. 2013, 18, 127–143. [Google Scholar] [CrossRef]
- O’Neill, D.W.; Fanning, A.L.; Lamb, W.F.; Steinberger, J.K. A good life for all within planetary boundaries. Nat. Sustain. 2018, 1, 88–95. [Google Scholar] [CrossRef]
- World Bank Group: International Development, Poverty, Sustainability. Available online: https://www.worldbank.org/ (accessed on 16 August 2018).
- United Nations. Available online: http://www.un.org/en/index.html (accessed on 16 August 2018).
- Helliwell, J.F.; Layard, R.; Sachs, J.D. World Happiness Report 2018, New York, NY, USA, 2018.
Figure 1.
Simplified copper supply chain and potential risks along the supply chain.

Figure 2.
Steps of a S-LCA, based on a past paper [10], revised and extended with the addition of a relevance analysis.
Figure 2.
Steps of a S-LCA, based on a past paper [10], revised and extended with the addition of a relevance analysis.
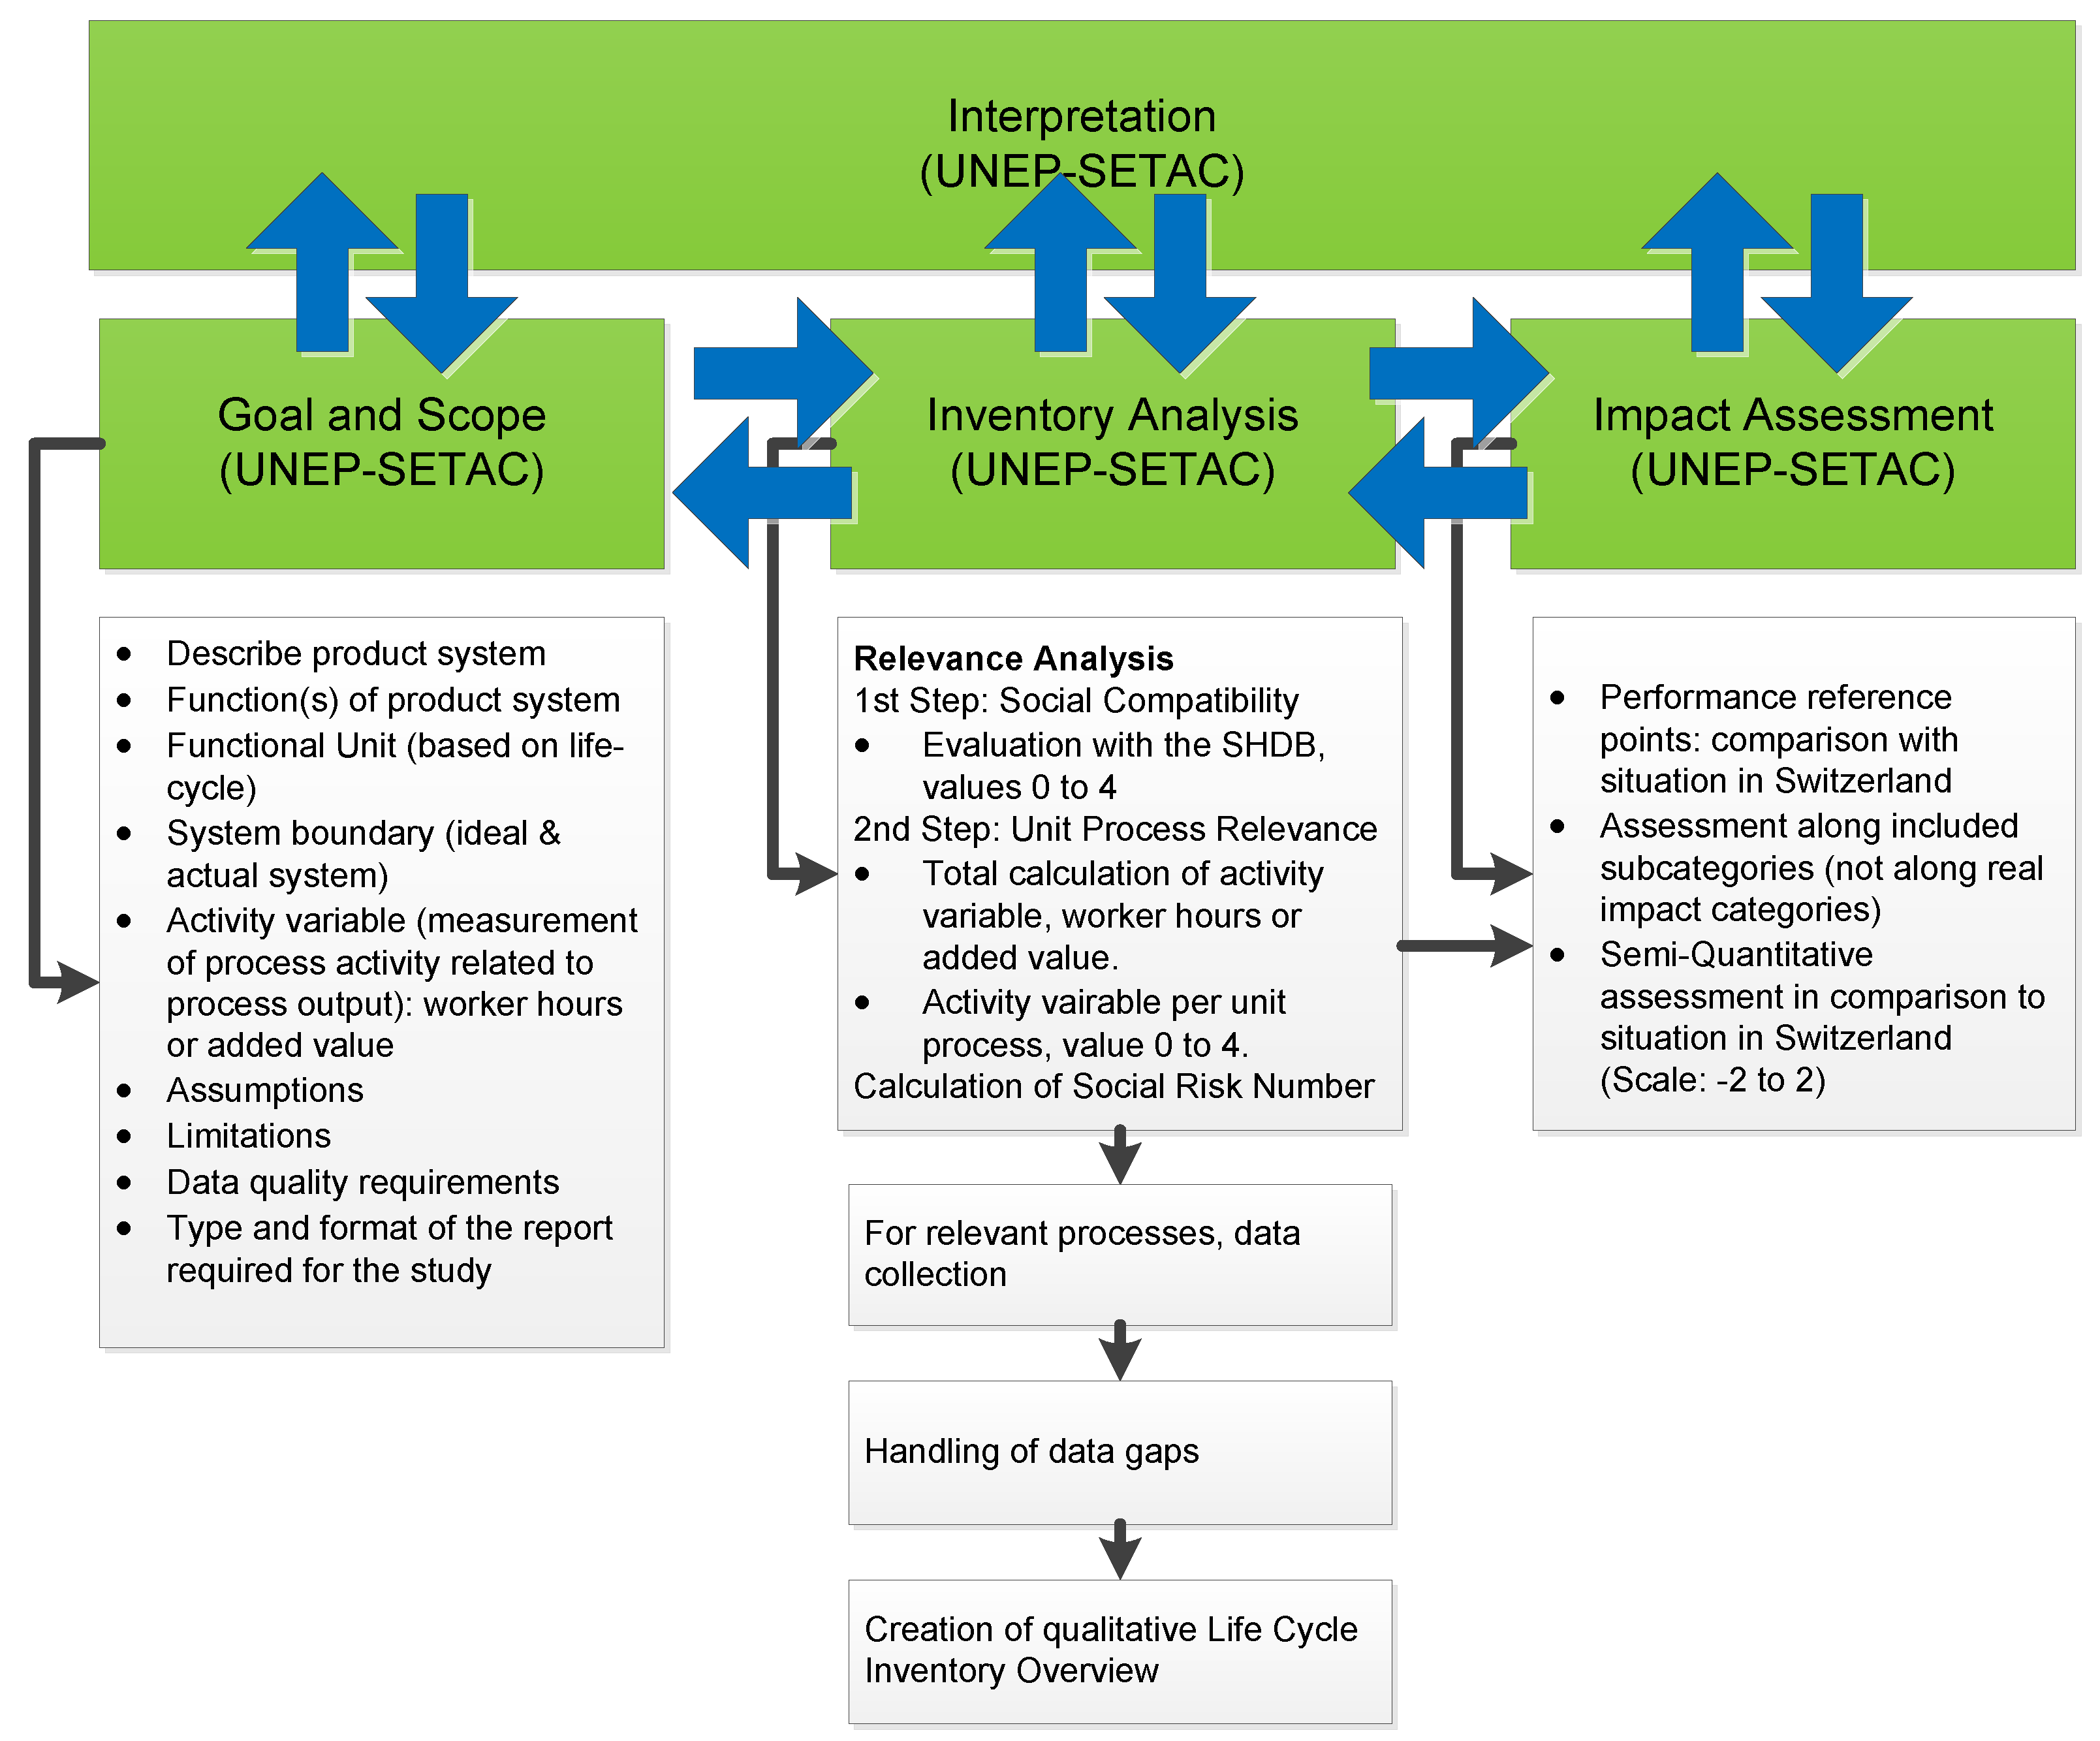
Figure 3.
Procedure for choosing and quantifying indicators. At the decision level (rhombus), 1 means quantitative, 2 means semiquantitative, and 3 means qualitative.
Figure 3.
Procedure for choosing and quantifying indicators. At the decision level (rhombus), 1 means quantitative, 2 means semiquantitative, and 3 means qualitative.
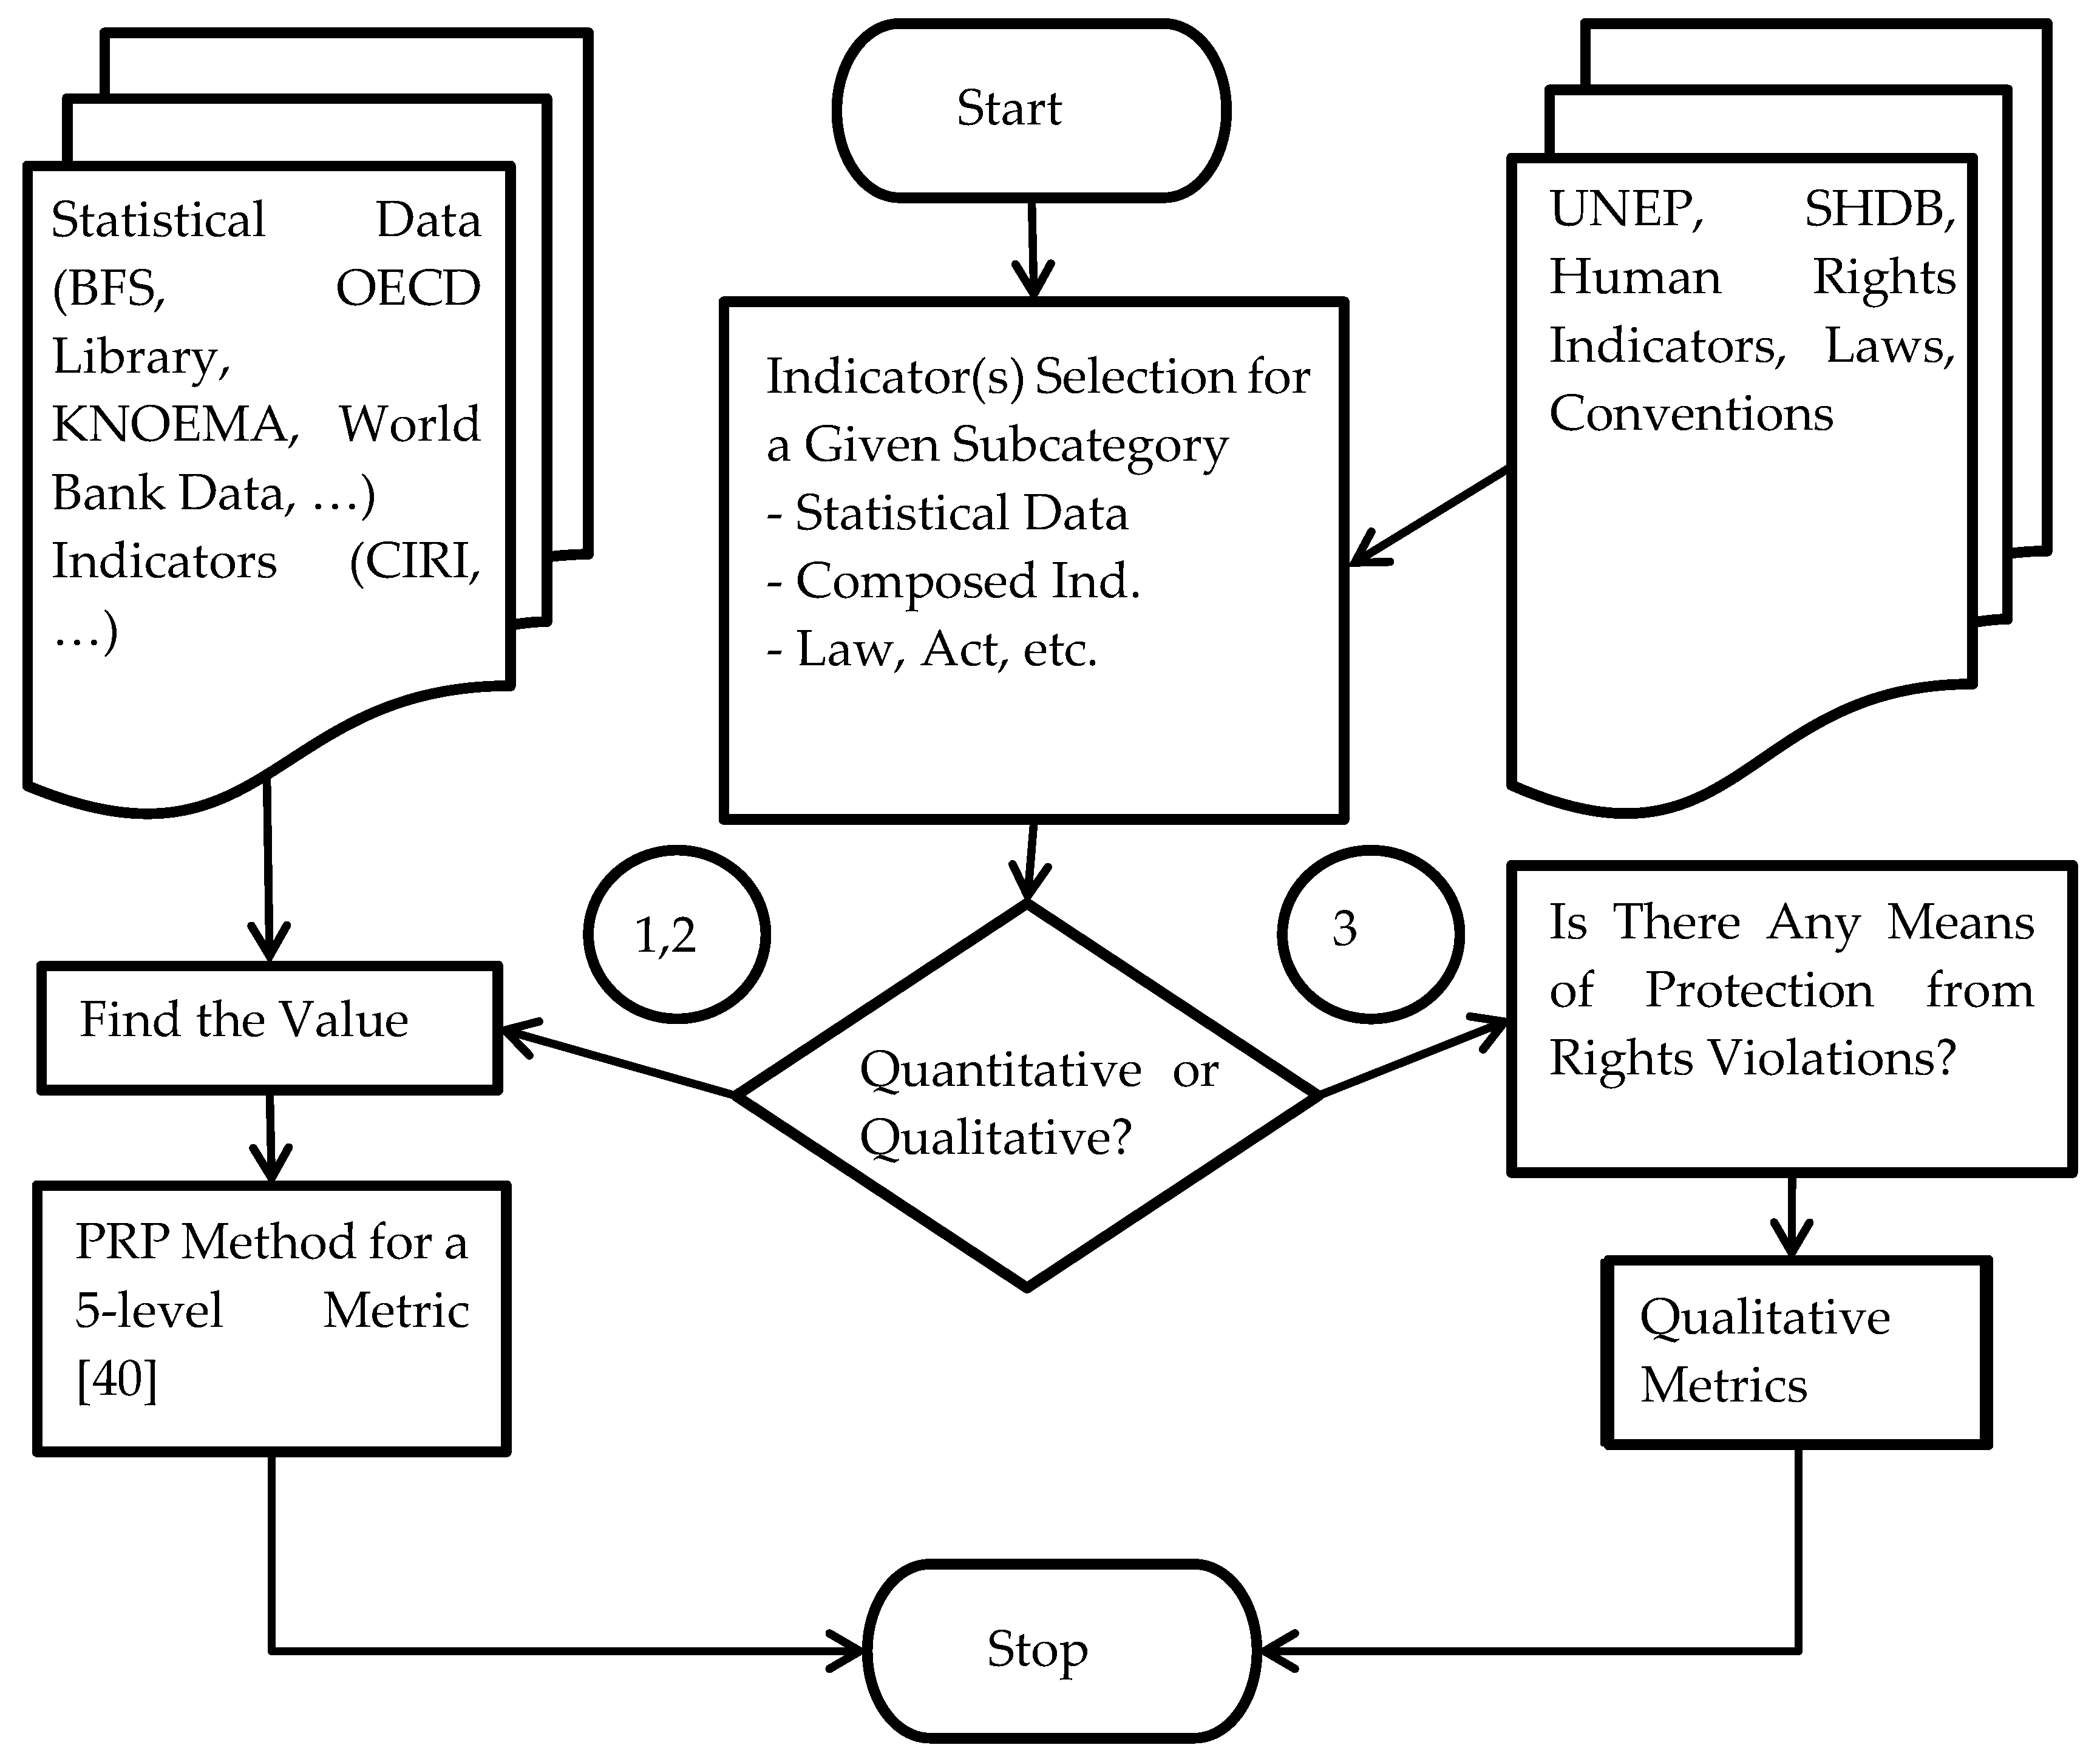
Figure 4.
Setting the performance reference point (PRP) levels.


Table 1.
Weighting scale for social compatibility (own source).
| SHDB Rating | Social Compatibility | Category Social Compatibility |
|---|---|---|
| Evidence of no risk | Very high social compatibility | 0 |
| Low | High social compatibility | 1 |
| Medium | Limited social compatibility | 2 |
| High | Low social compatibility | 3 |
| Very high | Very low social compatibility | 4 |
| No data | Unknown social compatibility but considered relevant due to lack of information | n/a |
Table 2.
Weighting system for relevance in the life cycle (own source).
| Activity Variable’s Threshold of Cruciality in % | Relevance in Life Cycle | Unit Process Relevance (UPR) |
|---|---|---|
| >0 to 1% | Low relevance | 1 |
| 1% to 5% | Medium relevance | 2 |
| 5% to 10% | High relevance | 3 |
| >10% | Very high relevance | 4 |
| No data | Possibly high relevance | 1 to 4 (according to own estimation) |
Table 3.
Suggestions for statistical data and index sources.
| Organisation | Main Publications/Data Sets | Online Sources |
|---|---|---|
| Federal Statistical Office | Statistical Data on Switzerland [24] Labour market indicators [25] | www.bfs.admin.ch |
| Eurostat | Indicators of Immigrant Integration—A Pilot Study [26] The measurement of poverty and social inclusion in the EU: achievements and further improvements [27] | www.ec.europa.eu/eurostat |
| United Nations Development Program | Human Development Report 2015 [28] | www.hdr.undp.org |
| World Health Organisation (WHO) | World health statistic 2015 [29] | www.who.int/gho/en/ |
| The Organisation for Economic Co-operation and Development (OECD) | Health at a glance 2015: OECD Indicators [30] | www.oecd-ilibrary.org/ and data.oecd.org/ |
| CIRI Human Rights Data Project | CIRI Human Rights—Short Variable Description [31] CIRI Data Online [32] | www.humanrightsdata.com |
| The Fund for Peace | Fragile States Index [33] | www.fsi.fundforpeace.org/ |
| United Nations Educational Scientific Cultural Organisation (UNESCO) | UNESCO Institute for Statistics [34] | www.data.uis.unesco.org/ |
| International Labour Office | Global child labour trends 2008 to 2012 [35] | www.ilo.org/ |
| Business Social Compliance Initiative | BSCI Code of Conduct [36] | www.bsci-intl.org/ |
| United Nations International Children’s Emergency Fund (UNICEF) | UNICEF Child labour database [37] | www.unicef.org/ |
| The World Bank | Human Rights Indicators in Development. A World Bank Study [38] | www.worldbank.org/ |
| United Nations Human Rights (UNHR) | Human Rights Indicators: A Guide to Measurement and Implementation [39] | www.ohchr.org |
Table 4.
Performance reference point (PRP) metrics for quantifiable indicators (adapted from a past paper [40]).
Table 4.
Performance reference point (PRP) metrics for quantifiable indicators (adapted from a past paper [40]).
| Observation | PRP Value | % of Reference for Positive Indicator | % of Reference for Negative Indicator |
|---|---|---|---|
| Really worse than reference | −2 | <25% | >175% |
| Worse than reference | −1 | 25–75% | 125–175% |
| Same as reference | 0 | 75–125% | 75–125% |
| Better than reference | 1 | 125–175% | 25–75% |
| Really better than reference | 2 | >175% | <25% |
Table 5.
Example of Swiss performance reference points (SPRPs) for the United Nations Environment Programme/Society of Environmental Toxicology and Chemistry (UNEP–SETAC) subcategory “Delocalisation and Migration“ with a quantitative (indicator 1) and a qualitative indicator (indicator 2).
Table 5.
Example of Swiss performance reference points (SPRPs) for the United Nations Environment Programme/Society of Environmental Toxicology and Chemistry (UNEP–SETAC) subcategory “Delocalisation and Migration“ with a quantitative (indicator 1) and a qualitative indicator (indicator 2).
| Indicator 1 (Quantitative) | Indicator 2 (Qualitative) | |||||||
|---|---|---|---|---|---|---|---|---|
| Subcategory | Delocalisation and Migration | |||||||
| Example of Indicators UNEP | Integration for migrant workers | |||||||
| SHDB Issue | Risk that a country has not ratified international conventions or set up policies for immigrants | |||||||
| Explicit Indicator | Foreign unemployment/total unemployment | Is there a law regulative for the immigration and integration of immigrants? Does it promote integration? If yes, does it seem to be enforceable? | ||||||
| Situation in Switzerland | 7.9%/4.4% = 1.8 [24] | The federal law on foreigners [43] defines the admission (Art. 3) and the integration (Art. 4) of immigrant workers. What is decisive for admission is the interest of the national economy, whereby it is explicitly stated that sustainable integration and the social environment are crucial aspects. | ||||||
| Swiss Performance Reference Points Levels | −2 > 3.15 | −1 > 2.25 and <3.15 | 0 > 1.35 and <2.25 | +1 > 0.45 and <1.35 | −2 < 0.45 | −2 There is a law on immigration, but it does not really promote integration | −1 There is a law, it promotes integration, but it does not seem to be enforceable | 0 There is a law, it promotes integration and it seems to be enforceable |
Table 6.
Summary of the results for the copper case study: The relevance analysis (first and second steps), life cycle inventory assessment and the Swiss performance reference point (DM = Delocalisation and Migration, MR = Material Resources, CH = Child Labour, FL = Forced Labour).
Table 6.
Summary of the results for the copper case study: The relevance analysis (first and second steps), life cycle inventory assessment and the Swiss performance reference point (DM = Delocalisation and Migration, MR = Material Resources, CH = Child Labour, FL = Forced Labour).
| LCA-Phase 1: Raw Material Extraction | |||||||
|---|---|---|---|---|---|---|---|
| Process 1: Copper Mining | |||||||
| 1st Step Social Compatibility | Activity Variable Value [% of total Working Hours] | 2nd Step Unit Process Relevance | Social Relevance Number | If Relevant, Qualitative Assessment of Sector | SPRP | ||
| DM | Congo, DR | n/a | 2.3% | 2 | n/a | Relevant | −1 |
| Chile | 3 | 1.7% | 2 | 6 | Relevant | 0 | |
| MR | Congo, DR | 4 | 2.3% | 2 | 8 | Relevant | −2 |
| Chile | 1 | 1.7% | 2 | 2 | Not Relevant | 0 | |
| CH | Congo, DR | 4 | 2.3% | 2 | 8 | Relevant | −2 |
| Chile | 1 | 1.7% | 2 | 2 | Not Relevant | 0 | |
| FL | Congo, DR | 4 | 2.3% | 2 | 8 | Relevant | −1 |
| Chile | 2 | 1.7% | 2 | 4 | Not Relevant | 0 | |
| LCA-Phase 2: Production | |||||||
| Process 2: Copper Processing | |||||||
| 1st Step Social Compatibility | Activity Variable Value [% of total Working Hours] | 2nd Step Unit Process Relevance | Social Relevance Number | If relevant, qualitative assessment of sector | SPRP | ||
| DM | Turkey [h] | 3 | 0.02% | 1 | 3 | Not Relevant | 0 |
| MR | Turkey [h] | 2 | 0.02% | 1 | 2 | Not Relevant | 0 |
| CH | Turkey [h] | 1 | 0.02% | 1 | 1 | Not Relevant | 0 |
| FL | Turkey [h] | 3 | 0.02% | 1 | 3 | Not Relevant | −1 |
Table 7.
Calculation of worker hours per unit process for mining in the Democratic Republic of Congo.
Table 7.
Calculation of worker hours per unit process for mining in the Democratic Republic of Congo.
| Mining/DRC | Value | Unit | Source/Comment |
|---|---|---|---|
| Total time to finish product | 70 | [h/finished product] | Assumption |
| Mass copper in product | 16 | [kg Cu] | |
| Proportion provenance | 0.05 | [kg Cu DRC/kg Cu] | Assumption |
| Mass in unit process | 0.80 | [kg Cu] | |
| Worker hours per 50-kg bag | 11 | [h/bag] | Assumption based on a past paper [45] “11 to 26 worker hours per bag” |
| CuO concentration in ore | 0.14 | [h] | [46] |
| Pure Cu in CuO | 0.80 | [kg Cu/Kg CuO] | Stoichiometry |
| Pure Cu in 50-kg bag | 5.68 | [kg Cu/bag] | |
| Worker hours per kg Cu | 1.97 | [h/kg Cu] | |
| Hours per unit process | 1.57 | [h] | |
| % time of finished product | 2.3 | % | Therefore, the UPR is 2. See Table 6 |
Table 8.
Calculation of worker hours per unit process for mining in Chile.
| Mining/Chile | Value | Unit | Source/Comment |
|---|---|---|---|
| Total time to finish product | 70 | [h/finished product] | |
| Mass copper in product | 16 | [kg Cu] | |
| Proportion provenance | 0.95 | [kg Cu CL/kg Cu] | Assumption |
| Mass in unit process | 15.2 | [kg Cu] | |
| Mine production | 265,597 | [metric ton] | Production of 2016 [47] |
| Number of workers | 10,000 | [pers] | [48] |
| Hours per week | 45 | [h/week] | [49] |
| Weeks per year | 46.6 | [week/a] | [49] |
| Worker hours per kg Cu | 0.79 | [h/kg Cu] | |
| Hours per unit process | 1.2 | [h] | |
| % time of finished product | 1.7 | % | Therefore, the UPR is 2. See Table 6 |
Table 9.
Calculation of worker hours per unit process for processing in Turkey.
| Processing/Turkey | Value | Unit | Source/Comment |
|---|---|---|---|
| Total time to finish product | 70 | [h/finished product] | |
| Mass copper in product | 16 | [kg Cu] | |
| Proportion provenance | 1 | [kg Cu TR/kg Cu] | Assumption |
| Mass in unit process | 16 | [kg Cu] | |
| Machine processing capacity | 1300 | [kg Cu/h] | [50] |
| Number of workers | 1 | [pers/machine] | |
| Worker hours per kg Cu | 0.001 | [h/kg Cu] | |
| Hours per unit process | 0.012 | [h] | |
| % time of finished product | 0.02 | % | Therefore, the UPR is 1. See Table 6 |
Table 10.
Ordinal scale to obtain the unit process relevance.
| Unit Process Relevance | |
|---|---|
| 0 to 1% | 1 |
| 1 to 5% | 2 |
| 5 to 10% | 3 |
| 10% upwards | 4 |
Table 11.
Swiss performance reference points for the four selected issues.
| Subcategory | Evaluation of Switzerland | Performance Reference Point Levels |
|---|---|---|
| Delocalisation and Migration | The federal law on strangers [59] defines the admission (Art. 3) and the integration (Art. 4) of immigrant workers. What is decisive for admission is the interest of the national economy, whereby it is explicitly stated that sustainable integration and the social environment are crucial aspects. Moreover, Art. 4 states that the goal of the integration is the cohabitation of local and migrant populations based on the values of the federal constitution and reciprocal respect and tolerance | −2 There is a law on immigration, but it does not really promote integration −1 There is a law, it promotes integration, but it does not seem to be enforceable 0 There is a law, it promotes integration and it seems to be enforceable |
| Access to Material Resources | 100% of population (urban, rural and total) with access to improved sanitation facilities [29] | −2 < 25% −1 > 25% < 75% 0 > 75% |
| Child Labour | Art. 30 of the law on labour [59] prohibits the employment of people before their 15th birthday with reservations defined in paragraphs 2 and 3 | −2 The law does not protect children from working −1 The law protects children from working, but it does not seem to be enforceable 0 There is a law to protect children from working and it seems to be enforceable |
| Forced Labour | Art. 4 of the European Convention of Human Rights prohibits slavery, servitude and forced labour [60] | −2 No convention which prohibits slavery and forced labour has been signed/ratified −1 A convention has been signed/ratified, but it does not seem to be enforceable 0 A convention has been signed/ratified and it seems to be enforceable |
© 2018 by the authors. Licensee MDPI, Basel, Switzerland. This article is an open access article distributed under the terms and conditions of the Creative Commons Attribution (CC BY) license (http://creativecommons.org/licenses/by/4.0/).
Share and Cite
MDPI and ACS Style
Lobsiger-Kägi, E.; López, L.; Kuehn, T.; Roth, R.; Carabias, V.; Zipper, C. Social Life Cycle Assessment: Specific Approach and Case Study for Switzerland. Sustainability 2018, 10, 4382. https://doi.org/10.3390/su10124382
AMA Style
Lobsiger-Kägi E, López L, Kuehn T, Roth R, Carabias V, Zipper C. Social Life Cycle Assessment: Specific Approach and Case Study for Switzerland. Sustainability. 2018; 10(12):4382. https://doi.org/10.3390/su10124382
Chicago/Turabian StyleLobsiger-Kägi, Evelyn, Luis López, Tobias Kuehn, Raoul Roth, Vicente Carabias, and Christian Zipper. 2018. "Social Life Cycle Assessment: Specific Approach and Case Study for Switzerland" Sustainability 10, no. 12: 4382. https://doi.org/10.3390/su10124382
Note that from the first issue of 2016, this journal uses article numbers instead of page numbers. See further details here.