Review

Changing Consumption Patterns—Drivers and the Environmental Impact

Institute for Environmental Economics and World Trade, Leibniz University Hannover, Königsworther Platz 1, 30167 Hannover, Germany
*
Author to whom correspondence should be addressed.
Sustainability 2018, 10(11), 4190; https://doi.org/10.3390/su10114190
Submission received: 4 September 2018 / Revised: 7 November 2018 / Accepted: 9 November 2018 / Published: 14 November 2018

Abstract

:
Economic growth coupled with population increase and globalization have engendered structural changes in consumption patterns around the world. Contingent on their composition, these changes can be demanding on natural resources and pose unsustainable challenges for the environment. The paper aims to provide a general framework to assess the link between changing consumption patterns and their environmental impact by focusing on the rising beef demand in Vietnam. It draws from secondary literature and data to find that the increased beef demand in Vietnam is mostly met domestically, but there is a major dependency on imports. Within Vietnam, the rising demand has contributed substantially to the carbon footprint and land use and raised waste disposal concerns. To understand the impact of Vietnamese beef demand at the global level, the paper looks at Australia. Carbon footprint and land use are estimated to provide a perspective on the plausible scale of environmental damage that can be ensued in the future. Changes in consumption patterns are an integral part of our world and will play a significant role in determining the sustainable future of our planet. Therefore, it is important to attain a better understanding of the theme and its possible impact on the environment.

1. Introduction

The world is consuming food at a much higher rate than it is able to produce. It is estimated that if there are no changes in the existing consumption pattern, the world production of food would have to double in order to meet the demand by 2050 [1]. Despite the optimistic claims of abundant productive land [2], there is continuous soil degradation and use of fertile land for building activities [3,4]. Therefore, the only way to achieve this aim is by increasing yield productivity, which could exert higher pressure on the existing natural resources. Hence, food production needs to grow significantly, while the environmental footprint of agriculture should shrink substantially [5]. The inclusion of ‘sustainable consumption and production’ as one of the Sustainable Development Goals by the United Nations further stresses on the gravity of this issue.
This increase in demand is mostly driven by population increase and changing consumption patterns. The world population is expected to reach 8.6 billion by 2030, with Africa and Asia as the major contributors [6]. Though population growth might seem like the bigger culprit, consumption patterns could have a significant impact on future production levels, as well as on the environment. For instance, the increase in animal protein consumption registered a growth of 69% between 2003 and 2013, while the rate of population growth was around 29% for the same period [7]. In the last decade, many nations have witnessed rapid economic growth, which has translated into a bigger share of disposable income for the middle class. This phenomenon is even more pronounced in developing nations, where the booming production and service sectors have led to the masses getting richer and, consequentially, increased food demand and influenced consumption patterns. Additionally, globalization and urbanization have presented new options of food accessibility and food availability. There is a preference for semi-processed or ready-to-eat food, which is illustrated by the growing presence of fast food chains and convenience stores [8].
Overall, there is a visible movement towards more global products—food items that are traditionally not part of the staple diet. Fashion fads are also partially responsible for such behavior. Additionally, changes in consumption patterns can be motivated by ethical and environmental awareness. In this case, people consume food items that have a lower ecological footprint or are ‘animal friendly’ by adopting vegetarian or vegan diets. Though the latter form is a positive development, the overall phenomenon may not have the desired impact on the environment.
Changing consumption patterns combined with population increase and food insecurity concerns could pose challenges in terms of sustainability for the environment. When consumption behaviors change, they generally shift towards products that are not commonly available or are not produced in the required quantities in the area. Therefore, an increase in demand can engender major changes in production techniques, land use, land cover, and trade, at the regional and global level.
Interestingly, out of all food categories, the demand of meat has experienced the biggest increase worldwide. This is a concern for the environment because the livestock sector is identified as one of the biggest emitters of greenhouse gases [9]. In this regard, beef particularly deserves the most attention. With the highest carbon and land footprint, it is the most inefficient form of protein. Beef consumption is responsible for regional and global changes in environmental indicators and warrants policy intervention [10]. Many papers focusing on beef also establish the relation between increased beef demand in the world, especially North America, and deforestation in the Amazon [11,12,13].
Our paper presents a general framework based on secondary literature and data to explain the link between changes in consumption patterns and their impact on the environment. In order to achieve this aim, we focus on increasing beef consumption in Vietnam and the effect this has on the domestic natural resources. To capture the global environmental effect, we look at Australia, which is Vietnam’s consistent top beef exporter. The paper contributes to the literature in the following ways. Firstly, reviews or analyses in this area generally focus on regional impacts, while the global effects are not considered. Our framework proposes the inclusion of environmental impacts in the country of exports along with the country of demand when ascertaining the overall environmental impact. Additionally, no similar study is available for Vietnam which combines the two aspects of consumption patterns and environment.
The structure of the paper is as follows. In the next section, we present the conceptual framework and a detailed literature review on the topic. The third section focuses on Vietnam—its food history, the current scenario and increasing beef demand. We review the plausible impact of this increased demand in the fourth section. Conclusions and policy recommendations are presented in the last section.

2. Conceptual Framework and Literature Review

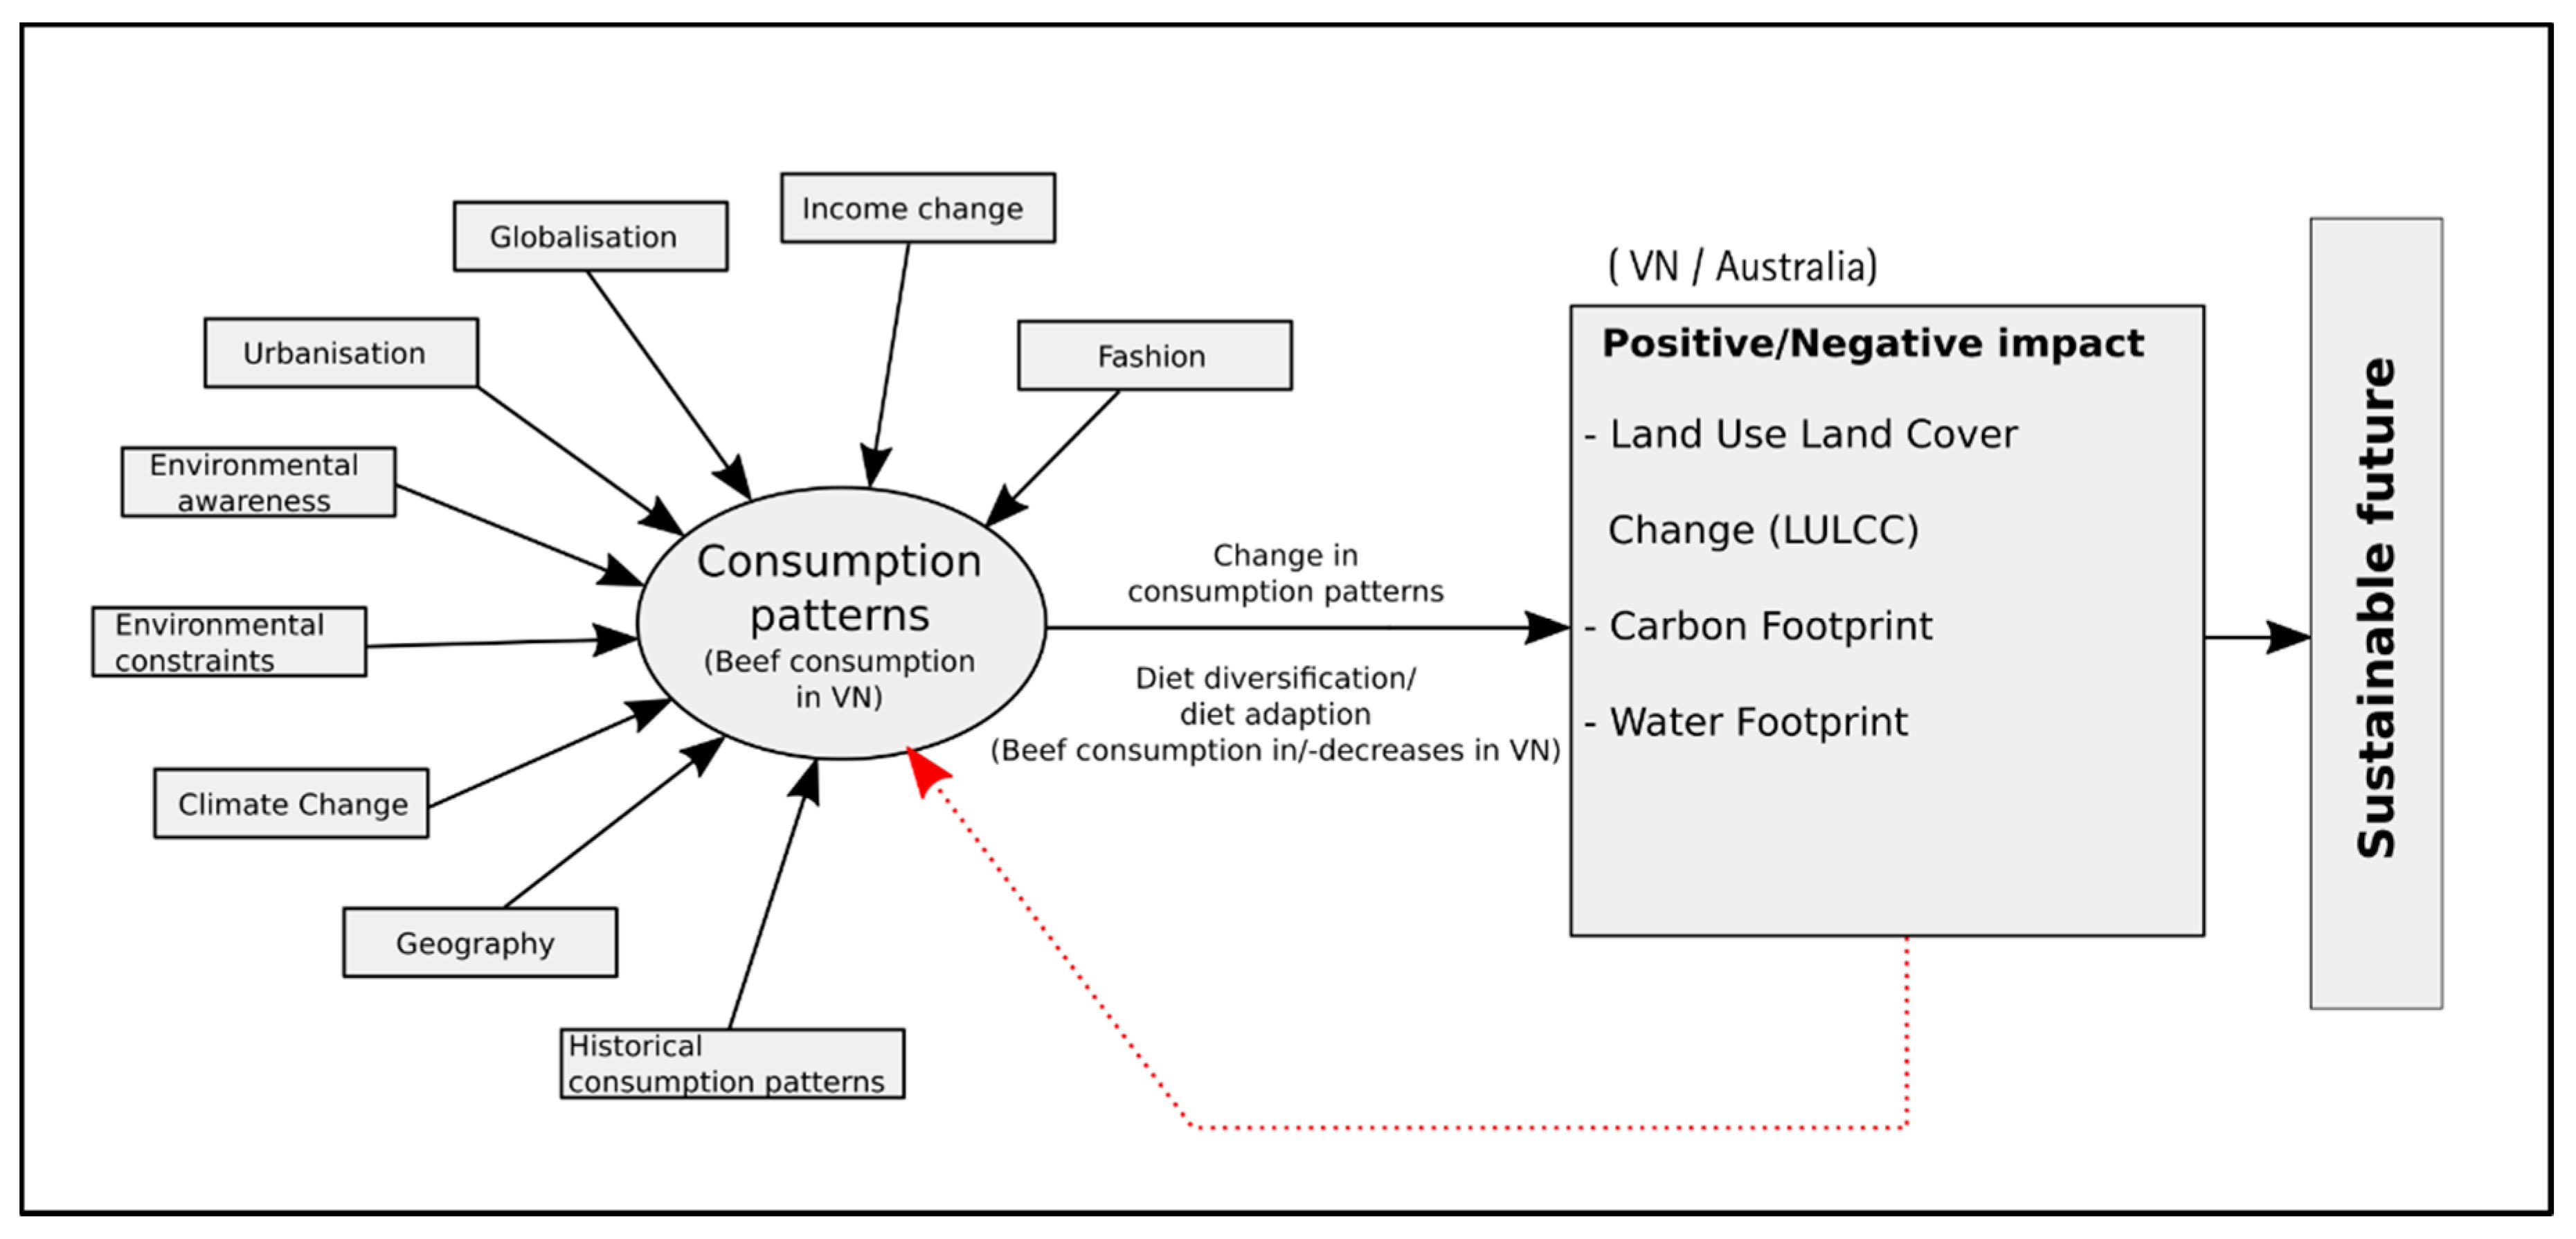
2.1. Conceptual Framework

Figure 1 lays down the basic objective of this study. We review the impact of changes in consumption patterns on the environment. Broadly, consumption patterns relate to the expenditure made by individuals on various categories of goods and services. In our case, we follow the definition by Gerbens-Leenes et al. [14] that consumption patterns are repeated arrangements of food that can be observed for a particular population group. Different areas around the globe are characterized by their unique eating habits. These are determined by religion, culture, norms, geography, personal preferences, and availability of resources. It is argued that consumption patterns are not static, but it generally takes a longer period of time to alter basic consumption behavior.
Changes in consumption patterns can be induced by numerous factors, such as income increase, urbanization, globalization, environmental awareness, convenience in terms of time and effort, environmental constraints, and the like. As most of these factors are complementary, it is hard to disentangle the individual effects. On the one hand, many countries are experiencing economic growth, which has led to a gradual increase in incomes. On the other hand, globalization and urbanization have eased access to food items [15]. With an increased purchasing power and availability, populations are being exposed to a different lifestyle, which in turn has changed their tastes and preferences. Bennett [16] too, in his seminal paper, establishes that as income increases, there is a decrease in budget allocation towards ‘starchy staples’ and people prefer a diversified diet.
While overall income increase coupled with globalization and urbanization can be identified as the main attributors to these changes, other reasons can also be highlighted. These vary amongst regions and could entail diet diversification or diet adaptation. When a population diversifies its diet or adopts non-traditional consumption behaviors voluntarily, it is called diet diversification [17]. For example, North America has witnessed major consumption variations that mostly come in waves. In recent years, their diets have moved from being highly wheat-oriented to alternative grains, such as kamut grains and millets, which have been considered ‘poor’ people staples for long. These can be majorly attributed to food fads or scientific awareness and are mostly associated with the richer class. By contrast, production advances and changing climate have propelled major dietary changes in Africa. In the Ivory Coast, new varieties of rice have replaced sorghum and even cacao in certain areas [18]. This has thus induced a change not only in the eating behavior, but also in the crop-growing behavior. This is an example of diet adaptation where people might be forced to alter diets [17]. It is, however, hard to disentangle the two behaviors of diet diversification and diet adaptation completely.
Additionally, different food items have varied requirements in terms of environmental resources. For example, meat products, especially beef, require more natural resources when compared to fruits and vegetables (refer to Figure A1). Therefore, the impact of the changes in consumption patterns is contingent on the composition of these changes. These could have positive or negative effects on the environment in the country where the demand is changing, as well as impact the environment of another country/countries if the good has to be imported. There can be widespread environmental consequences. In this paper, we only focused on emissions and land use land cover change (LULCC).
Carbon footprint measures the amount of greenhouse gas emissions due to a certain activity, while water footprint is the appropriation of fresh water resources in terms of volumes of water consumed and polluted during the activity [19]. In addition to these dimensions, it is also important to understand the impact of human activities that take place on the Earth’s surface on the environment using land use land cover change. LULCC relates to changes caused by human activities that impact the biophysics, biogeochemistry, and biogeography of the terrestrial surface and its effect on the atmosphere [13]. In simpler words, land cover change refers to changes in soil cover, vegetation and water, while land use change amounts to alterations in land utilization due to human activities [20]. These arise due to urbanization, deforestation, reforestation, and agricultural expansion. This is a highly regionalized phenomenon, but it could entail meso-level climatic effects and is highly correlated with ecological and carbon footprints. The flux of carbon from LULCC has been estimated at 12.5% globally [21].
While analyzing the changes in consumption, it is pertinent to acknowledge the degree of processing, mode of transportation, presence of red meat, use of pesticides, fertilizers, and storage methods for the food items [22]. Therefore, if the changes in consumption are more focused on animal protein, such as beef or products that have to be imported by air, these could lead to higher emissions [22] and a negative LULCC. However, if the changes are environment friendly, such as adopting a diet composed of products that need lesser natural resources or that are locally produced, it could be a great step towards sustainability. Furthermore, a more diverse diet could alleviate food insecurity concerns associated with many developing nations and improve people’s health by reducing conditions generated by mineral and nutrient deficiencies. In addition, it is possible that the impact of current consumption patterns on the environment could influence the future consumption patterns giving rise to a circular relationship. This is, however, not discussed in the paper. Given these points, our sustainable future is conditional on the composition of these structural changes in consumption patterns.

2.2. Empirical Evidence

Until recently, people were more likely to consume locally available resources [14]. However, considerable structural shifts in consumption patterns have been noticed all across the globe. This has prompted research in various directions so as to understand the patterns, the drivers, and the impacts of this phenomenon.
The world has been overconsuming in terms of calories as well as nutrients. ‘Overconsumption’ is notable in the case of proteins, which has aggravated the food gap. Ranganathan et al. [23] find that in 2009, more than 90% of the countries were consuming more protein than required (Figure 2). Additionally, the rate of increase of consumption of animal protein was much higher than that of plant protein.
The Asian subcontinent is growing at an unprecedented rate, with economies such as India and China as vanguards. The rising dragons of Vietnam and Thailand are also rapidly progressing on the economic growth trajectory. Asia is transitioning and this is also reflected in its diet. It is replacing its staple, rice, and consuming more like the West. Pingali [24] coins this as ‘Westernization of the Asian diet’. He identifies five characteristics of the changing Asian diet, which are also illustrated in various other studies. Firstly, there is a decline in per capita consumption of rice, which is a staple in many Asian countries. Asians not only produce, but also consume 90% of the world’s rice. However, recent evidence shows that rice consumption in this area has either decreased [25,26,27,28] or has become flatter [18]. In a study of 14 Asian countries, Ito et al. [29] find that income elasticity of rice has declined and rather become negative in certain cases. The change is also visible across rural and urban areas. While in rural areas, rice is classified as a normal good, it is identified as an inferior good in urban areas [30]. Secondly, there is an increase in wheat consumption. There is a higher preference for wheat-based products, principally amongst urban populations. People have been exposed to newer varieties of products due to availability of foreign goods in supermarkets or during their travels to other countries. It is estimated that in Vietnam and Thailand, there was an increase in wheat demand from 16.5 million t in 2012–2013 to 23.4 million t in 2016–2017, all of which had to be imported [18]. Thirdly, diet becomes more protein-dense. In these regions, a meat-based diet is considered a status symbol and, therefore, a big proportion of the increased income is spent on purchasing meat. Additionally, with the introduction of masses to western products, there has been a demonstrated preference for western products and diet [31]. This has boosted the consumption of red meat, or specifically beef. Fourthly, higher consumption of temperate zone products, such as fruits and vegetables, is noticed. Lastly, an increase in consumption of convenience products is observed. With lesser hours available from work and an increased number of women in the work force, there has been a preference for food products that require less time and effort to prepare. This has also led to a dramatic increase in the number of supermarkets and fast food chains that have made their way all across Asia. Pingali [24] argues that this has also influenced agriculture in these countries and has directed it on an ‘irreversible path leading away from traditional pre-occupation with cereal crop production towards a production system that is becoming increasingly commercialized and diversified’.
With this background, a strand of the literature also aims to analyze the environmental impact of these changes in consumption patterns. The availability of arable land is under stress due to industrialization, infrastructure development, and land degradation [32]. Agricultural land is declining at a rate of 7% per decade [33]. Considering the fact that different food items have different land and fresh water requirements, a structural change of diet could lead to increased pressure on the existing resources. Animal protein has one of the largest land requirements [34]—in particular, beef.
The increase in world beef demand leads to land use land cover change in two ways—by increasing feedlot production and managed grazing systems [10]. In order to expand feedlots, more agricultural land needs to be converted into feeding grounds. This is also linked to higher greenhouse gases. Many papers have looked into this aspect by focusing on the Amazon [11,12,13]. The forest received a major setback after Brazilian beef was given an ‘okay’ to be sold in the American and European markets. Since then, there has been constant deforestation to either develop pastures or to plant soybean, which is fed to the cattle. Beef also has the least efficient feedlot input–output ratio [23]. In a life cycle assessment (LCA) of six varied beef rearing techniques in Australia, Nijdam et al. [35] find that beef reared in extensive grasslands have the highest land use footprint. Cattle or beef has a low feed conversion and a slow reproductive cycle and these grasslands are mostly less productive than arable land. A carbon footprint in the range of 9 to 129 kg CO2 equiv. is associated with production of 1 kg of beef, while land use for beef cattle can go up to 400 square meters per kg. In comparison, 1 kg of pork produces between 4 to 11 kg CO2 equiv. and has a land use of up to 15 square meters per kg (Refer to Table A1). Furthermore, in the Amazon, the replacement of forests into pastures has decreased the net long wave radiation by 11% [13].
Various scholars have also tried to simulate different diets and assess their impacts on the environment. Scenarios such as adopting a less meat focused diet, shifting to vegetarianism, increasing feed to food production efficiency, reducing overconsumption of calories, and reduced food wastage are compared [7,23,36]. In general, most studies find that shifting to a more vegetable-oriented diet can help to reduce the stress on land and water [14,37]. Gerbens-Leenes and Nonhebel [14] exact the impact of changes in consumption patterns in specific areas. They find that if Europeans consumed meat like Americans, land requirement would increase by 17%. In the case of developing countries, if diets followed the path of the affluent countries, land requirement would have to double or triple to meet the demands. Food wastage management has also been identified as a major problem, especially in the case of developing countries [38]. According to the Food and Agriculture Organization (FAO) [39], one third of the total food produced in the world is either wasted or lost. Though it is not possible to avoid this completely, better management can be advocated. The literature also highlights the fact that changes in diets may not always have a negative impact. There has been a general sense of environmental awareness amongst certain proportions of the world. They have acknowledged the benefits of a vegetarian/vegan diet and are making environmentally sustainable choices [40]. Additionally, some studies assess the environmental impacts of various beef-rearing systems. Ridoutt et al. [41] compare carbon footprints across six systems to conclude that while European cattle and inland weaners systems produce lower emissions, the land use footprint is the smallest for Yearlings. However, just looking at the carbon footprint is not enough. For example, Subak et al. [42] conclude that though the US feedlot system is associated with more carbon emissions, it has lesser methane intensity compared to the African pastoral system.

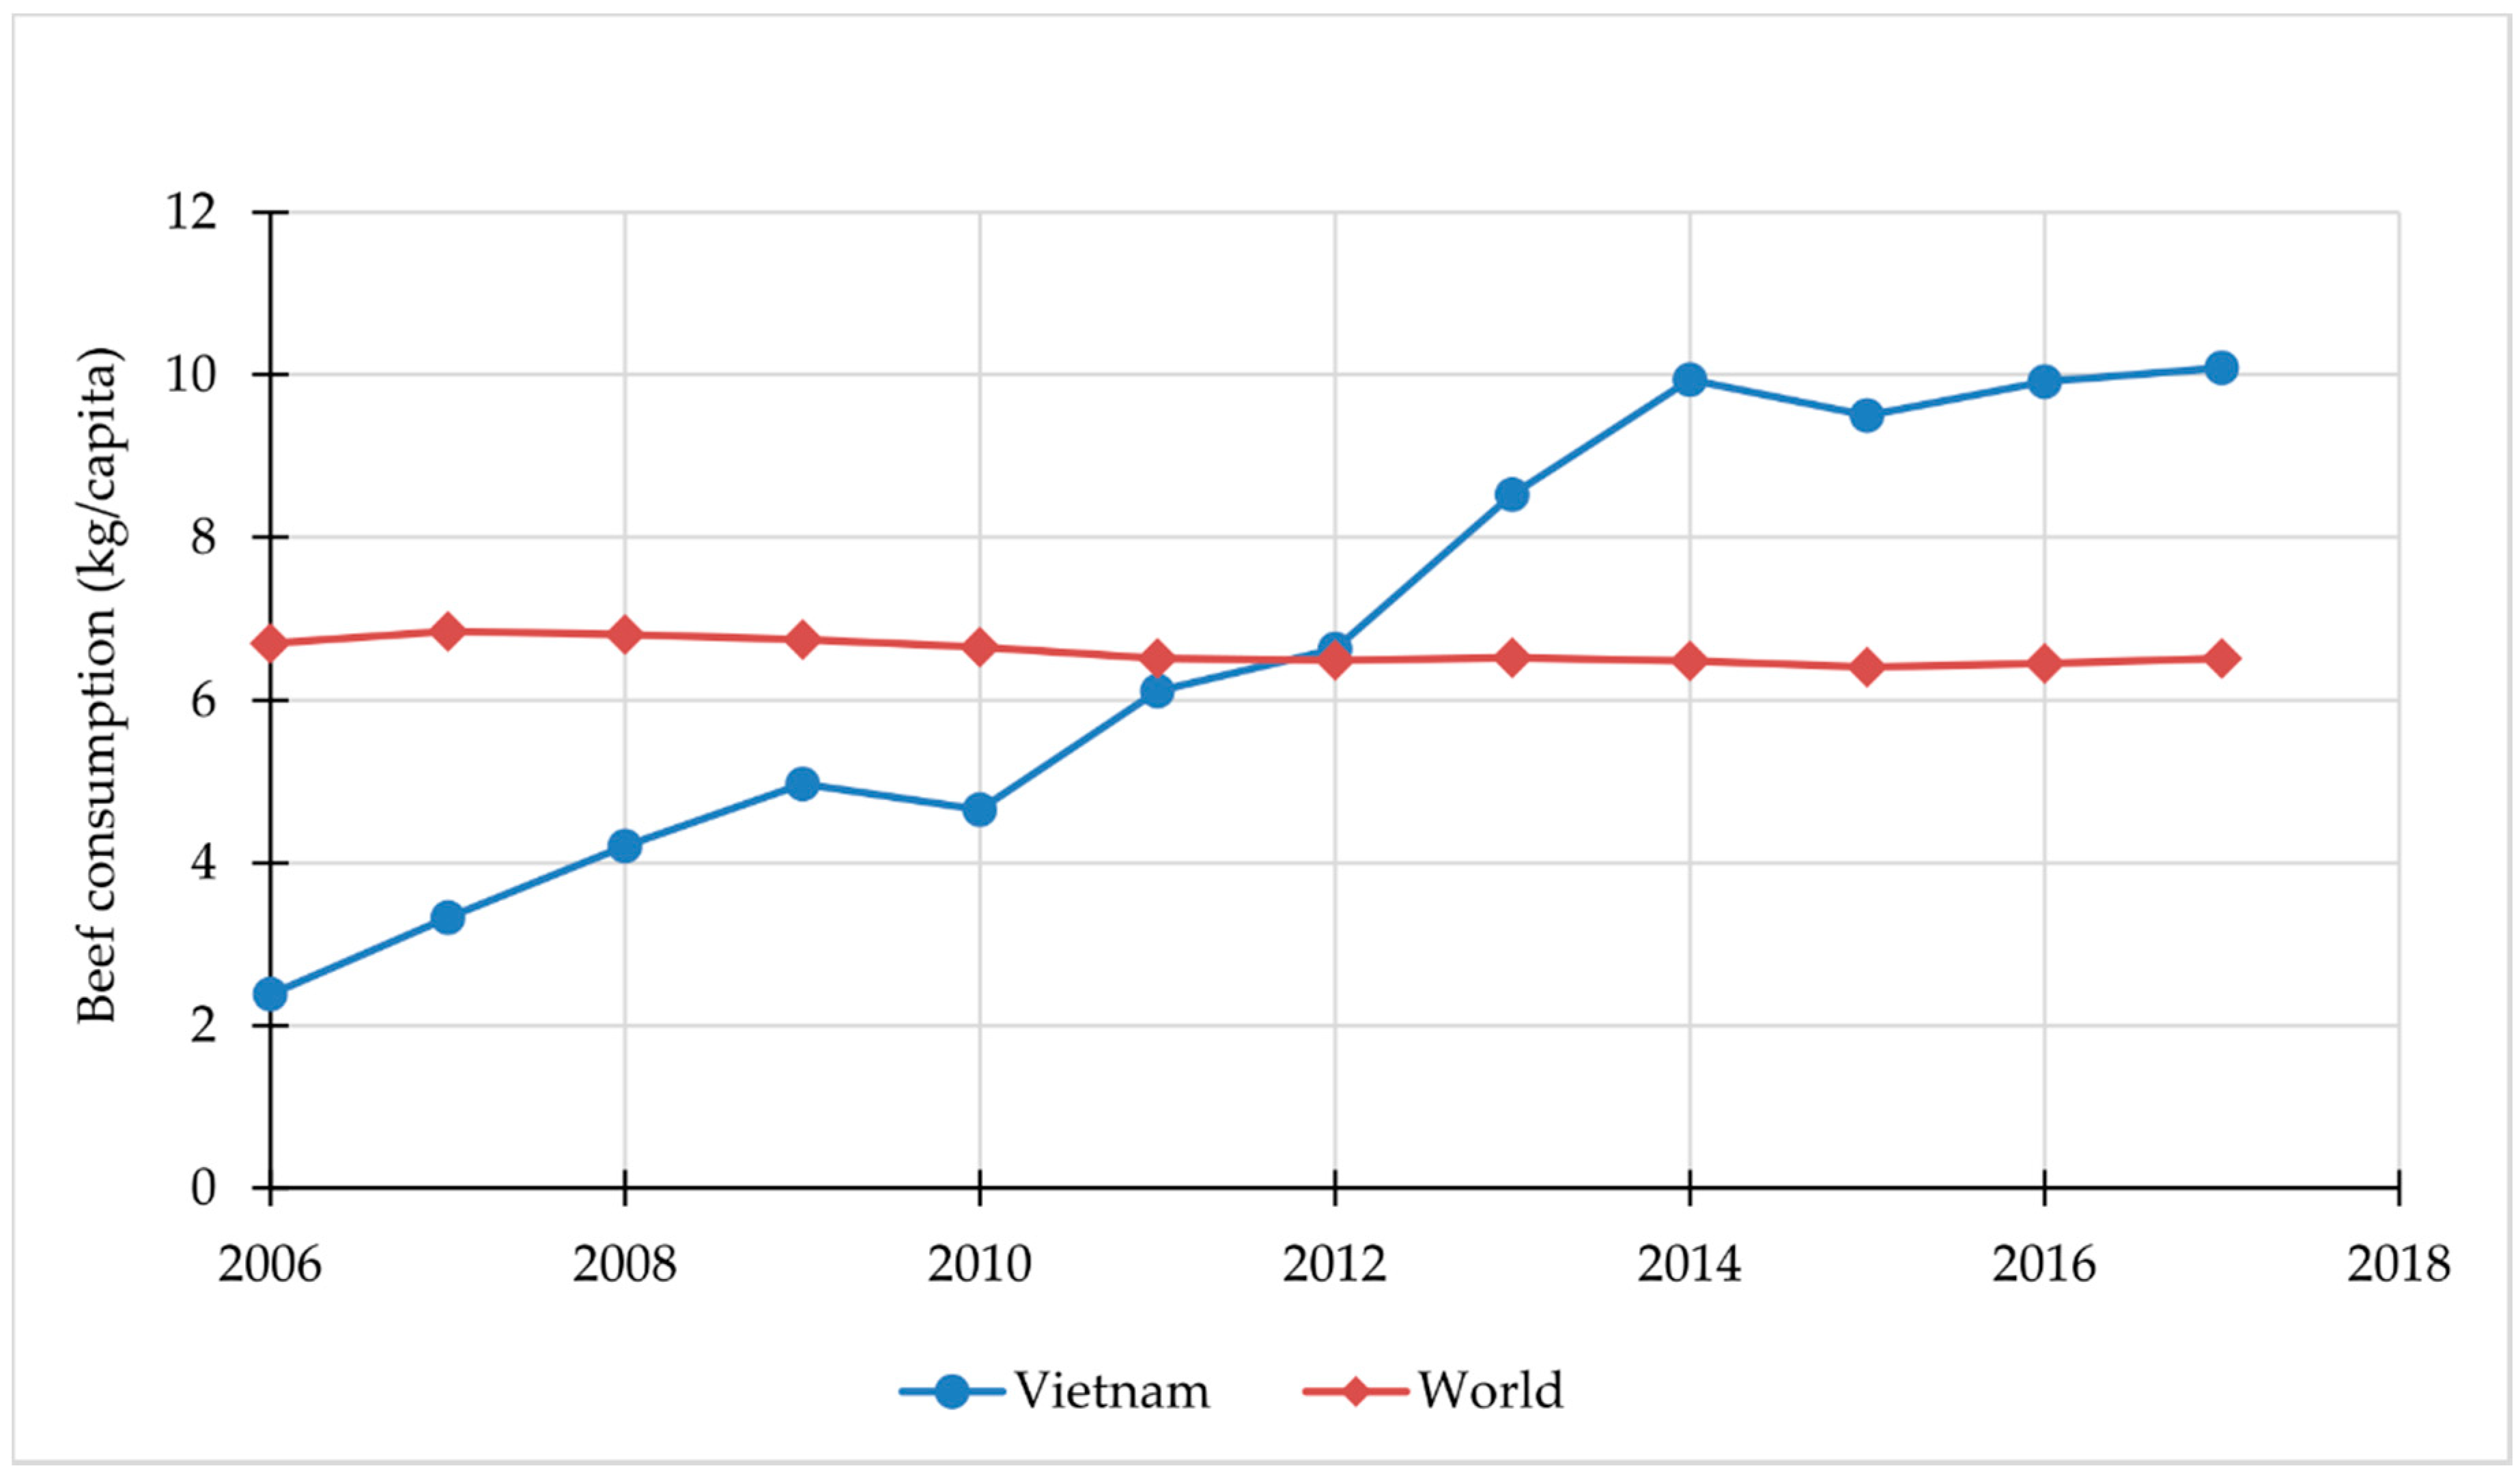
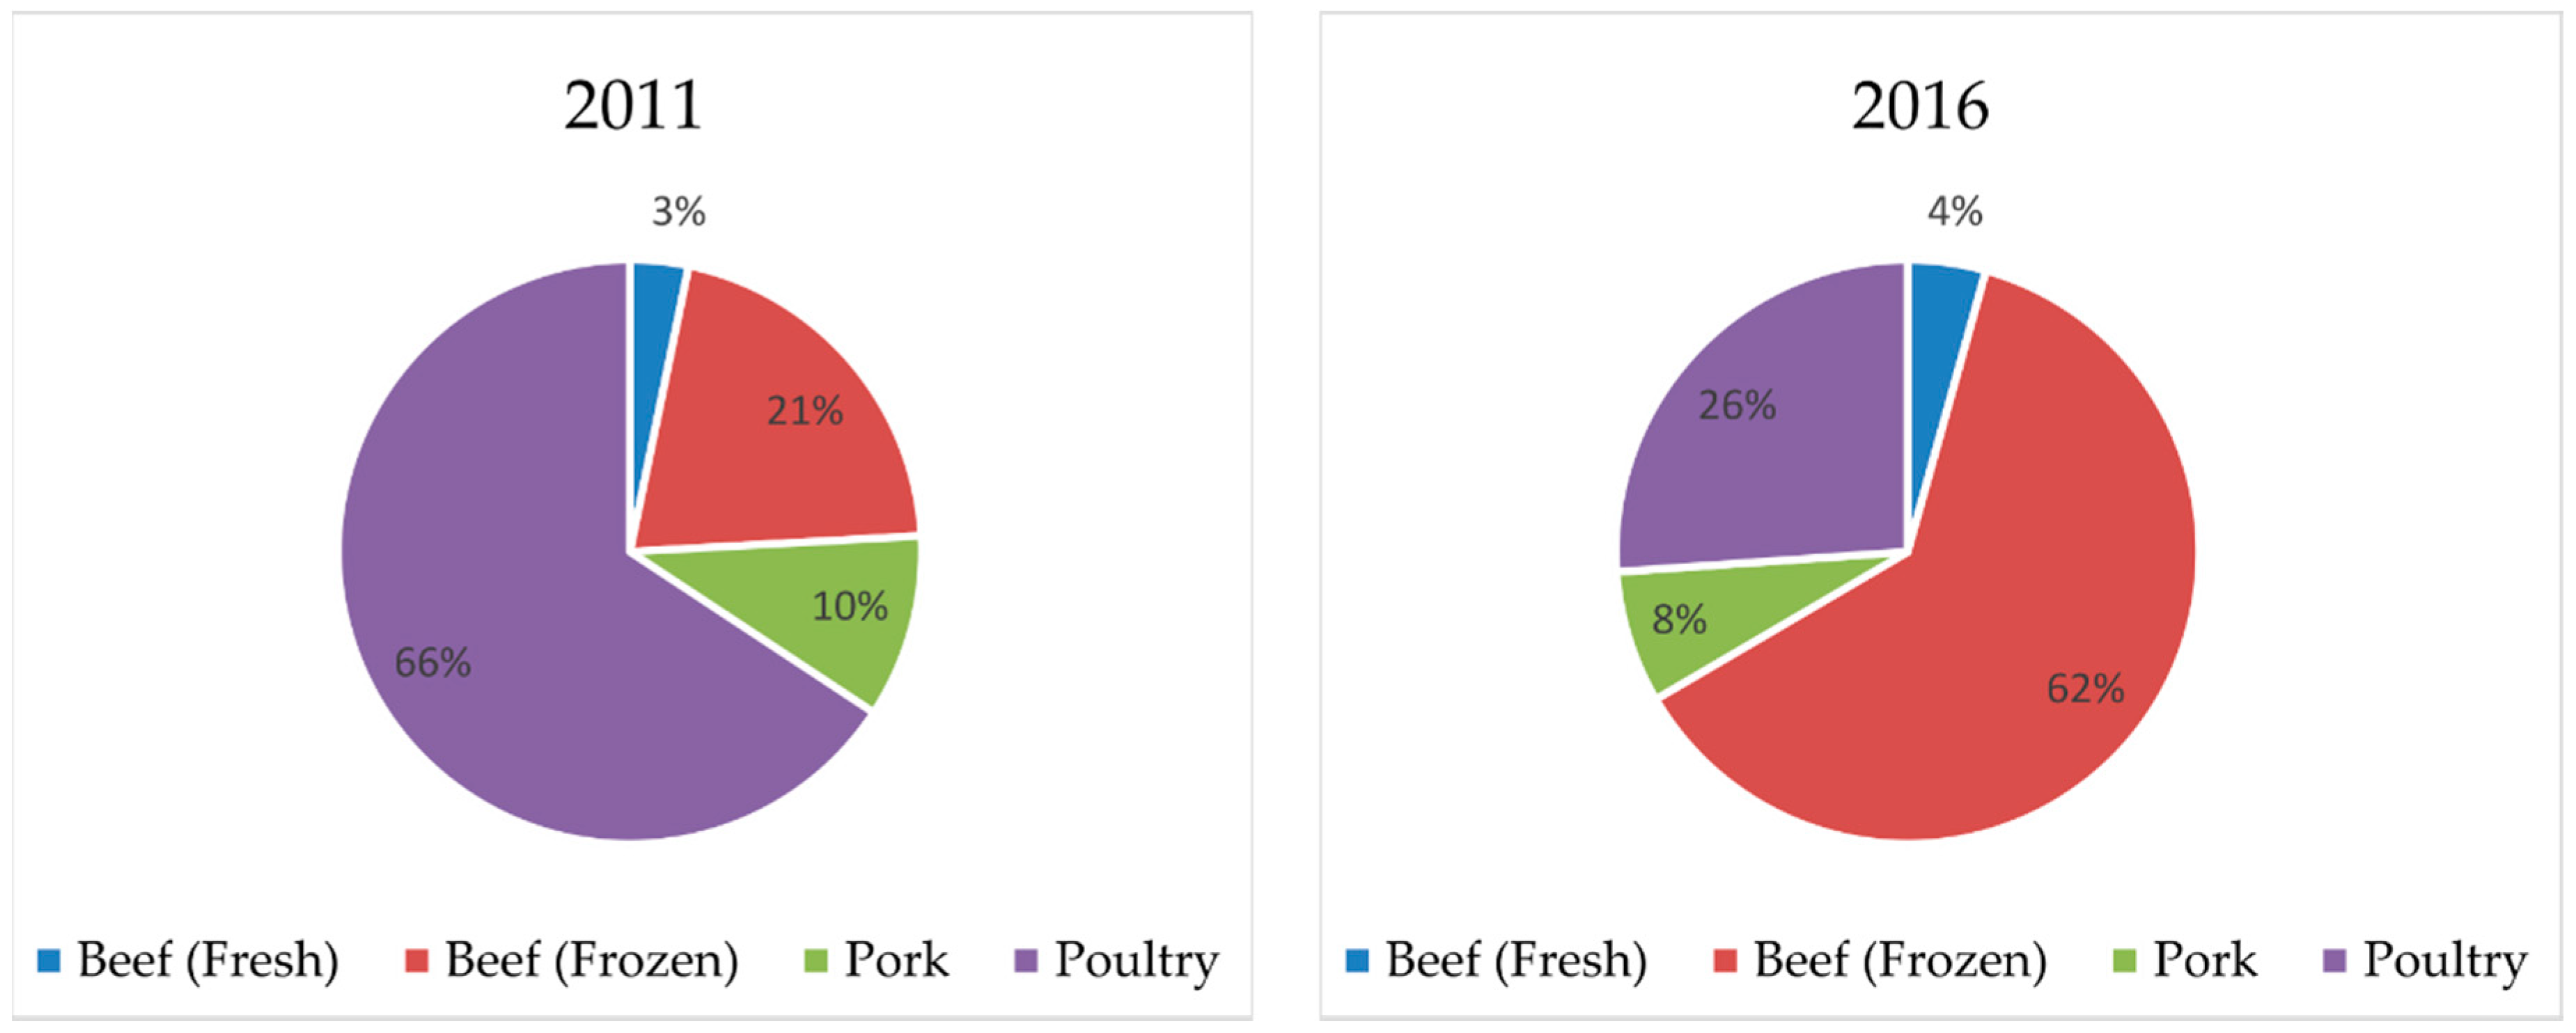
3. Case Study: Consumption and Production of Meat in Vietnam

Vietnam is an ethnically diverse country in South-East Asia with a population of about 95 million. The nation boasts abundant natural resources and is deemed one of the fastest growing economies in Asia, with an annual GDP growth rate of 6.5% and a gross national income per capita of US$ 2060 [43]. The total agricultural land area in Vietnam is about 10 million ha. Since 2000, about 700,000 ha has been converted from agricultural to nonagricultural (i.e., industry, hydropower, urban development) [44].
In the current paper, we review the link between the change in consumption patterns and its impact on the environment by focusing on the increasing beef demand in Vietnam. We use Vietnam as the example because of the following reasons. Firstly, high beef consumption is commonly associated with the West, like the United States and Europe. In reality, beef consumption in most developed countries has either peaked or is nearing saturation [23]. It is emerging economies, specifically in Asia, with high growth rates where demand is increasing. In addition, these are the countries that will experience the biggest population growth in the future. Vietnam is the perfect example in this regard. Secondly, while the transition of food habits in developed countries was gradual, which gave agriculture enough time to adapt, consumption shifts are much faster in emerging economies [45]. Therefore, the impact on the environment is expected to be stronger, which calls for prompt attention. Furthermore, the consumption of beef has increased fourfold in Vietnam in the last decade. As the country faces various constraints, such as topography and limited arable land, high input prices, and diseases, most of the beef has to be imported [46]. The Organization for Economic Cooperation and Development –FAO [47], in their recent statistics, also identified Vietnam as the country with the most rapid increase in beef imports. A further examination of this could provide insights into the trade implications. Lastly, around 42% of the Vietnamese population is engaged in the agriculture sector [48]. Changes in consumption behaviors could lead to changes in land use and hence affect livelihoods directly.
Vietnamese cuisine is determined by geography. The availability of alluvial deltas of the Red river and the Mekong provides the ideal setting for rice cultivation, while the presence of a long coastline encourages fish cultivation. At the same time, the diet has been influenced by many cultures, as well as the tumultuous history of the country. The Chinese invasion brought chopsticks and soy sauce. The French not only left a new script, but also baguettes and, most importantly, coffee. During the Civil War from 1954 to 1975 and the subsequent time period after the unification, there was a scarcity of food due to several reasons, including inefficient operation of state-owned agricultural cooperatives and ineffective institutional arrangements, such as land tenure [49]. The country started its renovation policy package known as ‘Doi Moi’ in 1986 and since then has achieved rapid economic growth [50].
Irrespective of the period, rice has always been the staple. The importance of the cereal can be judged from the fact that the same word is used for ‘rice’ and ’food’ in Vietnamese. Nevertheless, rice consumption is declining in the country [26,30,51]. While rural consumers view rice as a normal good, urban consumers consider it an inferior good [52]. The traditional diet, which is known to be composed of mostly starch and a little fat, is gradually being replaced by more animal protein. The per capita consumption of meat, sea food, and eggs is increasing [49]. This can be attributed to various factors, such as economic growth, increased income, rapid urbanization, and globalization [44]. Over the last decade, Vietnam has experienced a boom in the manufacturing and service sectors. The per capita income in Vietnam increased substantially from US$ 901 to US$ 2343 [43]. This increased income has augmented the share of food expenditure allocated towards protein, dairy, and vegetables. In addition, globalization has fostered the opening up of new supermarkets and fast food chains, which have eased access to products that are majorly protein-based. The country is also witnessing rapid urbanization of 3.4% per year [53], which has also contributed to exposure to newer products and more disposable income.
Overall, livestock consumption in Vietnam has increased from 3.5 million t in 2013 to 3.6 million t in 2014. It is one of the fastest changing sectors. Over the last 10 years, there has been an increase in livestock production, despite a decrease in the number of livestock rearing households due to livestock intensification [54]. The Ministry of Agriculture and Rural Development launched a ‘livestock restructuring’ program in 2013 to further this process. This includes steps such as redistribution of livestock, transformation of small-scale farm systems into large-scale setups, and enhancement of livestock value chains.
As visible in Table 1, pork is the main product of the livestock sector and production has been steadily increasing over time. It should be mentioned that, traditionally, pork is the main meat in Vietnam. Small-scale farmers also prefer rearing pigs as they can act as waste eaters and provide additional income with lower input costs.
Pork also remains the dominant form of meat in terms of consumption. However, demand of other products, especially beef, has witnessed a substantial increase in the last decade. The consumption of beef has been increasing at a rate of 4 to 5% annually. Figure 3 provides a better perspective on how fast beef consumption is increasing in relation to the world, using OECD statistics [56]. In their analysis of various beef farming systems, Stür et al. [57] also find that the country is experimenting with various setups and conclude that highland farms are most cost-effective.
Figure 4 shows the consumption and production of major meats in Vietnam. In general, there has been a rising trend in meat consumption and production. Additionally, as mentioned, pork surpasses the other meat forms on both the demand and supply side. While in the case of pork, production and consumption are balanced, there is a shortage of supply for beef and poultry.
The following reasons can be cited for this imbalance. Firstly, there are natural constraints to beef production in Vietnam. The topography of the country does not permit the development of new pastures or the expansion of existing farmlands. Secondly, the cost of production for beef is high, mainly due to the over-reliance on imported feed. According to a report published by the Ipsos Business Consulting [58], it costs US$ 2.53 to produce one kilogram of beef domestically, compared to US$ 1.77 when imported. Thirdly, buffalos and cattle are traditionally reared for dairy, farming, and as assets. Therefore, the slaughtering of beef is not preferred [31]. Additionally, there is a lack of proper management in the beef production sector [57]. Lastly, there is a preference amongst the masses towards foreign or imported products. In Table 2, it can be seen that the relative increase in cattle and buffalo production has been low. This can again be attributed to the above reasons.
Therefore, in order to meet this demand, Vietnam has been importing about 20% of its beef requirement. According to the Ministry of Agriculture and Rural Development, in 2017, Vietnam imported 262,300 live cattle and almost 42,000 t of beef and buffalo meat [59]. This is valued at more than US$ 410 million. When compared to US$ 25 million in 2010, this is a dramatic increase. Figure 5 shows the change in meat import composition and the import value for Vietnam in 2011 and 2016. The import value of beef was US$ 3.5 million in 2011 and rose to US$ 17 million in 2016. The increase in beef imports has been the strongest compared to other meat imports.
Beef imports in Vietnam can be classified into two types: Fresh meat and frozen meat. Fresh meat is used in high end restaurants and hotels, while frozen meat is utilized in big canteens.
Figure 6 and Figure 7 show the trends in import value for select countries. Australia has consistently been the biggest supplier of fresh meat to Vietnam. Trade agreements between the two countries have provided opportunities to import beef at low tariffs, hence facilitating a rise in demand. The United States also holds a substantial share in the market, although greater trade controls have hindered further growth [61]. The frozen meat market is dominated by India, followed by the United States. Vietnam is the biggest importer of Indian beef, though there are assumptions that not all exported beef is consumed in the country. Some part of it is processed and traded with China [62].

4. Impact of Changing Consumption Patterns

4.1. Domestic Impact of Increased Beef Consumption in Vietnam

Vietnam meets a major proportion of its beef demand domestically. This is bound to influence the emission levels and land use in the country. In 2016, the Vietnamese population was consuming 375,000 t of beef (refer to Figure 4). Using estimate ranges in Nijdam et al. [35] as default, we obtain a basic estimate of carbon footprint and land use that could be associated with the production levels. To estimate the 2050 scenario, we calculate the amount of beef Vietnam would have to produce for its population of 115 million [63]. We assume that the current pattern of beef consumption would not change. The results are presented in Table 3.
It can be seen that in 2016, the domestic production of beef led to emissions in the range of 3–48 million t CO2 equiv. and land use in the range of 2625–156,500 km2. In the 2050 scenario, the range of carbon footprint increases to 4–58 million t CO2 equiv. and land use increases to 3178–190,608 km2. Vietnamese beef rearing systems vary in terms of size and processing methods. However, small-scale or individual rearing systems with 1–6 cattle are more common. These are generally associated with a smaller carbon footprint and lesser land use. Therefore, we expect the actual values to lie more towards the lower bound of the given ranges.
Specific to land use, as illustrated in Figure 8, there has been a gradual increase in pasture land in Vietnam. However, it is unlikely that further expansion would take place. Vietnam only has 0.34 ha of arable land per capita of its agriculturally active population. This is about half of that in Cambodia, Myanmar, or the Philippines, and far below the global average of 3.7 ha per capita [44]. Additionally, the planted area for perennial crops has increased by about 7% per year, from 2.2 million ha in the early 2000s to 3.8 million ha in 2011–2013. This category includes many crops, and the most sizeable expansion has occurred for coffee and rubber [44]. Therefore, land is more likely to be used for agriculture or plantations, rather than being converted into pastures.
Another concern is derived from the waste disposal techniques of the country. Waste from livestock consists of organic matter, nutrients, suspended solids, and microorganisms [65]. When discharged inappropriately into rivers, lakes, and open areas, these can lead to pollution of soil, water, and air. Additionally, this can enter the food chain. Vietnam has about 18,000 breeding farms that are mostly developed spontaneously and are located in residential areas [66]. These lack disposal and treatment facilities. The country produces about 80 million t of livestock waste every year, which is generally disposed into rivers and lakes [54]. Cattle rearing was associated with about 39 million t of waste in 2008 [66]. Untreated wastes also generate greenhouse gases and affect soil fertility. A lack of technical solutions, policy instruments, and awareness have aggravated the problem [67].
Despite the negative aspects of the change in demand, there is a need to acknowledge the positives. As the Vietnamese diet has been traditionally composed of only carbohydrates, there has been a constant argument of food insecurity [68]. With increased protein and a more diverse diet, this problem can be solved. Figure 9 shows the average protein supply for Vietnam during the years 2000 and 2014. Average Food Supply is an indicator included in the FAO’s food security suite of indicators.
There is an increasing trend which indicates better availability of protein, hence improving food security. Moreover, there is an increasing presence of animal protein in this regard. Additionally, rearing of large livestock, such as beef and cattle, is associated with higher income effects and aids in reducing income inequality [47]. Therefore, the boom in the demand could benefit small-scale farmers if provided with sustainable infrastructure and policies.

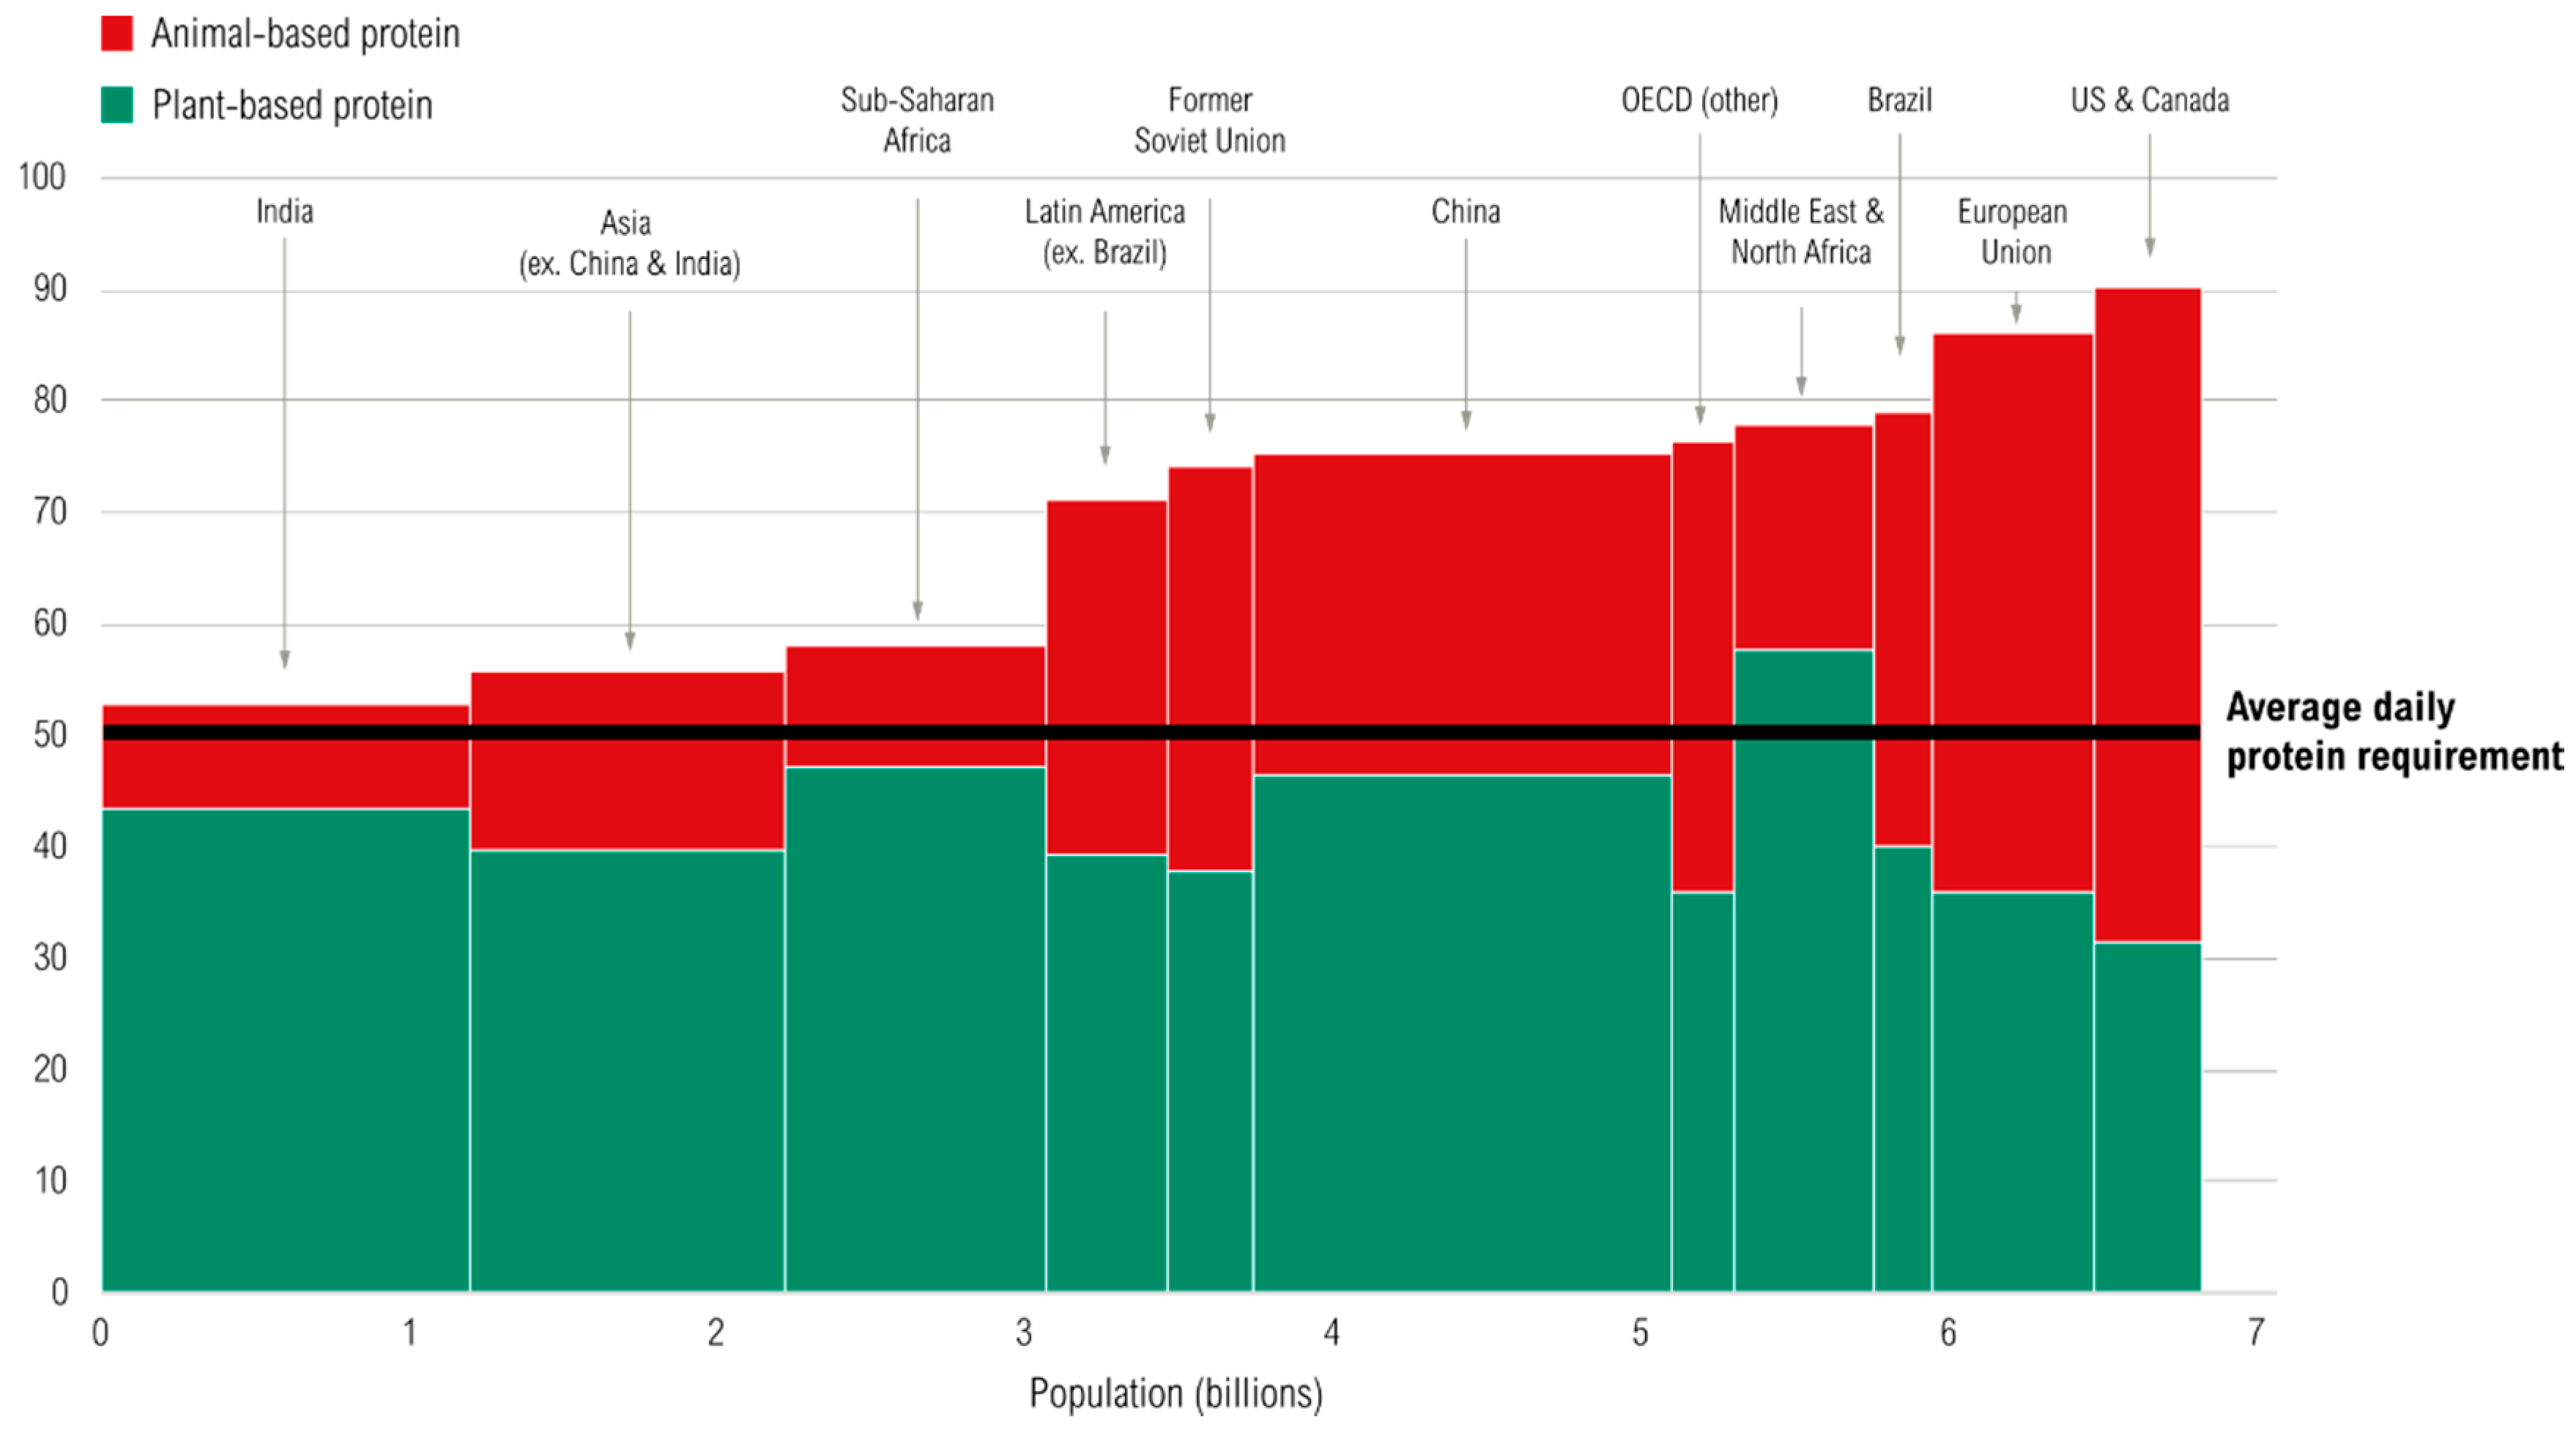
4.2. Global Impact of Increased Beef Consumption

In Vietnam, there is a special preference for foreign meat. Furthermore, it is cheaper to import beef than to produce it domestically. Therefore, it is expected that in the future, as beef consumption rises in Vietnam, the supply will become more import-dependent. This lends pertinence to examining the plausible global impacts of these dietary changes.
As mentioned earlier, Australia, India, and the United States are the major exporters of beef to the Vietnamese market. The paper, however, focuses on Australia due to the following reasons. Firstly, the beef production sector in Australia is constantly under scrutiny for environmental damage. The country is particularly sensitive to even small changes in beef production. In addition, it is one of the countries that have a net loss of virtual water in agricultural commodities [69]. Secondly, Australia has been consistently one of the largest players in the Vietnamese meat market. Almost 18% of live bovine export from Australia is to Vietnam [70]. Therefore, an increase in imports due to the rising beef demand in the country is most likely to affect Australia.
Australia is the third largest exporter of beef in the world [70]. The sector comprises 55% of agricultural businesses in the country and employs about 200,000 people. Queensland is the most important center and hosts 45% of Australia’s herd [71]. While cattle production adds almost 7.1 billion Australian dollars to the nation’s treasury, it has also led to various environmental concerns.
Australia produced greenhouse gas emissions of 529.9 million t CO2 equiv. in 2018 [72] and 16% of these were linked to agriculture [73]. Figure 10 illustrates the breakup of greenhouse gas emissions for the sector where 66% of the emissions are produced by enteric fermentation of ruminant meat such as beef. The beef sector, along with electricity, has the highest greenhouse emissions [74]. It is estimated that most of the county’s ecological footprint and 85% of land use emissions can be attributed to beef rearing [74].
In addition, beef production is held responsible for the major deforestation on the continent. The expansion of pasture lands has led to massive field-burning in the Savannah areas of Queensland [75]. This fact is supported by findings of Pielke et al. [13], who also mention that in Queensland, vegetation clearing was executed at a high rate of 500,000 ha per year between 2000 and 2004 to create new beef pastures.
Table 4 presents some basic results to illustrate the plausible impact of Vietnamese beef demand on the carbon footprint and land use in Australia. We again use estimate ranges from Nijdam et al. [35] as default. Australia exported 96,000 t of beef to Vietnam [60] in 2016, which met 23% of its total beef demand. To estimate the 2050 scenario, we make two assumptions. First, the consumption pattern of beef does not change in Vietnam. Therefore, as the population of Vietnam increases to 115 million [63], the estimated total beef demand will stand at 496,000 t. Second, Australia will continue to supply the same proportion of this demand. Hence, it will export 116,000 t to Vietnam.
In 2016, this led to a carbon footprint in the range of 0.8–12 million t CO2 equiv. and land use between 672–40,320 km2. In 2050, the carbon footprint would increase between 1–14 million t CO2 equiv., while land use would vary in the range of 798–47,880 km2. Many beef rearing styles are practiced across different regions in Australia and individual farming also expands to large areas [76]. Therefore, we expect that the actual values would lie towards the higher end in our estimates.
This provides some perspective on the plausible scale of environmental damage that can be caused in the future if the situation is not handled properly. Though it might not yet be at the levels of developed countries, beef demand in Vietnam is increasing at a rate of almost 3% per year [58]. In the next decade, the growing population and economy will fuel a further increase in beef imports. As Australia is the top exporting nation, this would have a major environmental impact on the country that already is being pestered by high emissions and large land use land cover changes.

5. Conclusions and Policy Recommendations

A convergence of diets is being observed all over the world. These changes in consumption patterns are being fueled by various factors, such as income increase, globalization, urbanization, fashion fads, and awareness, which vary across regions. In combination with the growing population and food security concerns, these could exert high pressure on the planet’s natural resources. As food items differ in resource requirements and, hence, impact the environment differently, the structure of these changes assumes great importance.
Our paper proposes a general framework (refer to Figure 1) that presents possible factors that could lead to changes in consumption patterns and the impact (both positive and negative) that these changes could have on the environment. Generally, papers in this regard analyze only regional effects. However, in this globalized world, a large proportion of local demands are met by exports and, therefore, our framework incorporates the environmental impact in export country/countries to account for the global aspect. To illustrate this, we look at the increasing beef consumption in Vietnam and its impact on the emissions and land use land cover change in Vietnam and its consistently top exporting nation, Australia.
Vietnam is an emerging economy that is witnessing a shift towards a protein-based diet. Beef consumption in the country has increased manifold. While most of this demand is being met domestically, there is a need to import. Therefore, the increased consumption of beef could have regional as well as global consequences.
We find that there is empirical evidence that the Vietnamese diet is becoming ‘westernized’ and there is an increase in meat consumption and production. This can be attributed to the higher disposable income, globalization, and the urban lifestyle influence. Additionally, the country is unable to meet the demand for beef domestically and imports from countries such as Australia, India, and the United States. This change in beef consumption has prompted an increase in pasture lands within Vietnam. However, it is unlikely that the trend will continue. The carbon footprint and land use associated with domestic production in 2016 were in the range of 3–48 million t of CO2 equiv. and 2625–156,500 km2, respectively. This will significantly increase in the next years. Furthermore, improper waste disposal is a challenge that can be linked to unavailability of technology and lack of awareness. In addition to understanding the domestic impact of this rise in beef consumption, we look at Australia’s beef production and its environmental impact. We find that, overall, beef rearing is responsible for a major proportion of Australia’s land and carbon footprint. A rough estimation is made to conclude that in 2016, Vietnamese beef demand led to a carbon footprint between 0.8–12 million t CO2 equiv. and a land use between 672–40,320 km2 in Australia. With a growing beef market, Vietnam could contribute significantly to the emissions and land use changes in Australia in the future.
This is a challenge for sustainability and, hence, the question arises - what can be done to attenuate the harmful impact of changes in consumption patterns or to harness the change in patterns to further support the aim of sustainability? There are some policy recommendations that are provided by the existing literature. Firstly, shifting to a diet that relies less on animal protein could provide long-term solutions. Many studies establish the positive effects of a vegetarian or a low animal protein diet. Secondly, a substitution of beef with more sustainable forms of protein, such as poultry and pork, can also be advocated. Specifically relating to beef, adopting production systems that are more compatible with the environment could offer concrete solutions. With regards to Vietnam, a better waste management system needs to be put into place while creating awareness about the consequences of improper waste disposal. The Government could also frame policies that support sustainable diets by promoting consumption of poultry, pork, or legumes, which exert less burden on natural resources. Lastly, harnessing the existing demand boom is also possible if small-scale farmers are introduced to apposite sustainable techniques.
The conceptual framework presented in the paper is able to illustrate the important facets of the overall phenomenon and highlight the pertinence of inclusion of ‘global impacts’. Though we examine the increasing beef consumption in Vietnam, the framework can be applied to analyze consumption patterns and their possible impacts in the context of both developing and developed countries. Furthermore, both the positive and negative impacts on the environment can be assessed for any food group. Future research could use it as a strong base to model and empirically assess various scenarios. An examination of changes in consumption patterns for lower income groups could entail fascinating results.
It is worth acknowledging that dietary changes are part of our world and can have life-altering impacts on the environment. Therefore, there is a need to better our understanding on the subject so as to direct these changes towards a sustainable future.

Author Contributions

Conceptualization, R.S., T.T.N., and U.G.; Writing—R.S.; Supervision—T.T.N. and U.G.

Funding

The publication of this paper was funded by the Open Access Fund of the Leibniz Universität Hannover.

Acknowledgments

The authors would like to thank the three anonymous referees for their valuable feedback and suggestions on the manuscript.

Conflicts of Interest

The authors declare no conflict of interest.

Appendix A

Figure A1. Varied resource utilization for different food items. Source: Ranganathan et al. 2016 [23].
Sustainability 10 04190 g0a1
Table A1. Carbon footprint and land use associated with various food items.
ProductCarbon Footprint (kg CO2-equiv. kg−1)Land Use (m2 y kg−1)
Beef9–1297–420
Pork4–118–15
Poultry2–65–8
Eggs2–64–7
Milk1–21–2
Seafood from fisheries6–226–17
Meat substitutes containing eggs and milk protein3–61–3
Meat substitutes containing only vegetables1–22–3
Source: Nijdam et al. 2012 [35]. Note: the figures display a range. The values were estimated in various papers in this field.

References

  1. FAO. Global Agriculture towards 2050; FAO: Rome, Italy, 2009. [Google Scholar]
  2. Nizeyimana, E.L.; Petersen, G.W.; Imhoff, M.L.; Sinclair, H.R.; Waltman, S.W.; Reed-Margetan, D.S.; Levine, E.R.; Russo, J.M. Assessing the impact of land conversion to urban use on soils of different productivity levels in the USA. Soil Sci. Soc. Am. J. 2001, 65, 391–402. [Google Scholar] [CrossRef]
  3. Alexandratos, N.; Bruinsma, J. World Agriculture: Towards 2030/2050: The 2012 Revision; FAO: Rome, Italy, 2012; Available online: http://www.fao.org/docrep/016/ap106e/ap106e.pdf (accessed on 10 October 2015).
  4. Gomiero, T. Soil Degradation, Land Scarcity and Food Security: Reviewing a Complex Challenge. Sustainability 2016, 8, 281. [Google Scholar] [CrossRef]
  5. Foley, J.A.; Ramankutty, N.; Brauman, K.A.; Cassidy, E.S.; Gerber, J.S.; Johnston, M.; Mueller, N.D.; O’Connell, C.; Ray, D.K.; West, P.C.; et al. Solutions for a cultivated planet. Nature 2011, 478, 337–342. [Google Scholar] [CrossRef] [PubMed] [Green Version]
  6. United Nations, Department of Economic and Social Affairs, Population Division. World Population Prospects: The 2017 Revision, Key Findings and Advance Tables; United Nations, Department of Economic and Social Affairs: New York, NY, USA, 2017. [Google Scholar]
  7. Behrens, P.; Kiefte-de Jong, J.C.; Bosker, T.; Rodrigues, J.F.D.; de Koning, A.; Tukker, A. Evaluating the environmental impacts of dietary recommendations. Proc. Natl. Acad. Sci. USA 2017, 114, 13412–13417. [Google Scholar] [CrossRef] [PubMed] [Green Version]
  8. Grote, U. Can we improve global food security? A socio-economic and political perspective. Food Secur. 2014, 6, 187–200. [Google Scholar] [CrossRef]
  9. Flysjö, A.; Cederberg, C.; Henriksson, M.; Ledgard, S. The interaction between milk and beef production and emissions from land use change—Critical considerations in life cycle assessment and carbon footprint studies of milk. J. Clean. Prod. 2012, 28, 134–142. [Google Scholar] [CrossRef]
  10. McAlpine, C.A.; Etter, A.; Fearside, P.M.; Seabrook, L.; Laurance, W.F. Increasing world consumption of beef as a driver of regional and global change: A call for policy action based on evidence from Queensland (Australia), Colombia and Brazil. Glob. Environ. Chang. 2009, 19, 21–33. [Google Scholar] [CrossRef] [Green Version]
  11. Kaimowitz, D.; Mertens, B.; Wunder, S.; Pacheco, P. Hamburger Connection Fuels Amazon Destruction1 Cattle Ranching and Deforestation in Brazil’s Amazon; Center for International Forestry Research: Jakarta, Indonesia, 2004. [Google Scholar]
  12. Nepstad, D.C.; Stickler, C.M.; Almeida, O.T. Globalization of the Amazon Soy and Beef Industries: Opportunities for Conservation. Conserv. Biol. 2006, 20, 1595–1603. [Google Scholar] [CrossRef] [PubMed]
  13. Pielke, R.A.; Pitman, A.; Niyogi, D.; Mahmood, R.; McAlpine, C.; Hossain, F.; Goldewijk, K.K.; Nair, U.; Betts, R.; Fall, S.; et al. Land use/land cover changes and climate: Modeling analysis and observational evidence: Land use/land cover changes and climate: Modeling analysis and observational evidence. Wiley Interdiscip. Rev. Clim. Chang. 2011, 2, 828–850. [Google Scholar] [CrossRef]
  14. Gerbens-Leenes, P.; Nonhebel, S. Consumption patterns and their effects on land required for food. Ecol. Econ. 2002, 42, 185–199. [Google Scholar] [CrossRef]
  15. Mendez, M.A.; Popkin, B.M. Globalization, Urbanization and Nutritional Change in the Developing World. J. Dev. Agric. Econ. 2004, 1, 220–241. [Google Scholar]
  16. Bennett, M.K. Wheat in National Diets; Wheat Studies; Food Research Institute: Stanford, CA, USA, 1941; pp. 1–44. [Google Scholar]
  17. Kennedy, G.; Nantel, G.; Shetty, P. Globalization of Food Systems in Developing Countries: Impact on Food Security and Nutrition; FAO: Rome, Italy, 2004. [Google Scholar]
  18. Of Rice and Men—A Circular Tale of Changing Food Preferences. The Economist. Available online: https://www.economist.com/international/2017/03/11/a-circular-tale-of-changing-food-preferences (accessed on 3 July 2018).
  19. Ercin, A.E.; Hoekstra, A. Carbon and Water Footprints—Concepts, Methodologies and Policy Responses; United Nations Educational, Scientific and Cultural Organization: Paris, France, 2012. [Google Scholar]
  20. Pham, T.-T.-H.; Turner, S.; Trincsi, K. Applying a Systematic Review to Land Use Land Cover Change in Northern Upland Vietnam: The Missing Case of the Borderlands: Review of Land Use Land Cover in Northern Vietnam. Geogr. Res. 2015, 53, 419–435. [Google Scholar] [CrossRef]
  21. Houghton, R.A.; House, J.I.; Pongratz, J.; van der Werf, G.R.; DeFries, R.S.; Hansen, M.C.; Le Quéré, C.; Ramankutty, N. Carbon emissions from land use and land-cover change. Biogeosciences 2012, 9, 5125–5142. [Google Scholar] [CrossRef] [Green Version]
  22. Carlsson-Kanyama, A.; González, A.D. Potential contributions of food consumption patterns to climate change. Am. J. Clin. Nutr. 2009, 89, 1704S–1709S. [Google Scholar] [CrossRef] [PubMed]
  23. Ranganathan, J.; Vennard, D.; Waite, R.; Dumas, P.; Lipinski, B.; Searchinger, T. Shifting Diets for a Sustainable Food Future; Creating a Sustainable Food Future; World Resources Institute: Washington, DC, USA, 2016. [Google Scholar]
  24. Pingali, P. Westernization of Asian diets and the transformation of food systems: Implications for research and policy. Food Policy 2006, 32, 281–298. [Google Scholar] [CrossRef]
  25. Huang, J. Demand for cereal grains in Asia: The effect of urbanization. Agric. Econ. 1993, 8, 107–124. [Google Scholar] [CrossRef]
  26. Pingali, P.L.; Rosegrant, M.W. Supplying Wheat for Asia’s Increasingly Westernized Diets. Am. J. Agric. Econ. 1998, 80, 954–959. [Google Scholar] [CrossRef]
  27. Fuller, F.; Tuan, F.; Wailes, E. Rising Demand for Meat: Who Will Feed China’s Hogs? China’s Food and Agriculture: Issues for the 21st Century/AIB-775 Economic Research Service/USDA; Prairie Swine Centre: Saskatoon, SK, Canada, 2007. [Google Scholar]
  28. Hsu, H.; Chern, W.; Gale, F. How Will Rising Income Affect the Structure of Food Demand? China’s Food and Agriculture: Issues for the 21st Century/ AIB-775 Economic Research Service/USDA; Prairie Swine Centre: Saskatoon, SK, Canada, 2007. [Google Scholar]
  29. Ito, S.; Peterson, E.W.F.; Grant, W.R. Rice in Asia: Is It Becoming an Inferior Good? Am. J. Agric. Econ. 1989, 71, 32–42. [Google Scholar] [CrossRef]
  30. Hoang, H.K. Analysis of food demand in Vietnam and short-term impacts of market shocks on quantity and calorie consumption. Agric. Econ. 2018, 49, 83–95. [Google Scholar] [CrossRef]
  31. Vietnam Meat Sector; EU-Vietnam Business Network (EVBN): Ho Chi Minh City, Vietnam, 2016.
  32. Gomiero, T.; Pettenella, D.; Paoletti, M.G. Is there a need for a more sustainable agriculture? Crit. Rev. Plant Sci. 2011, 30, 6–23. [Google Scholar] [CrossRef]
  33. Oldeman, L.R.; Hakkeling, R.T.A.; Sombroek, W.G. World Map of the Status of Human-Induced Soil Degradation: Global Assessment of Soil Degradation; International Soil Reference and Information Centre (ISRIC): Wageningen, The Netherlands, 1991. [Google Scholar]
  34. Gerbens-Leenes, P.W.; Nonhebel, S.; Ivens, W.P.M.F. A method to determine land requirements relating to food consumption patterns. Agric. Ecosyst. Environ. 2002, 90, 47–58. [Google Scholar] [CrossRef]
  35. Nijdam, D.; Rood, T.; Westhoek, H. The price of protein: Review of land use and carbon footprints from life cycle assessments of animal food products and their substitutes. Food Policy 2012, 37, 760–770. [Google Scholar] [CrossRef]
  36. Wirsenius, S.; Azar, C.; Berndes, G. How much land is needed for global food production under scenarios of dietary changes and livestock productivity increases in 2030? Agric. Syst. 2010, 103, 621–638. [Google Scholar] [CrossRef]
  37. Stehfest, E.; Bouwman, L.; van Vuuren, D.P.; den Elzen, M.G.J.; Eickhout, B.; Kabat, P. Climate benefits of changing diet. Clim. Chang. 2009, 95, 83–102. [Google Scholar] [CrossRef]
  38. Thi, N.B.D.; Kumar, G.; Lin, C.-Y. An overview of food waste management in developing countries: Current status and future perspective. J. Environ. Manag. 2015, 157, 220–229. [Google Scholar] [CrossRef] [PubMed]
  39. Food and Agriculture Organization of the United Nations. Available online: http://www.fao.org/save-food/resources/keyfindings/en/ (accessed on 5 March 2018).
  40. Gomiero, T. Food quality assessment in organic vs. conventional agricultural produce: Findings and issues. Appl. Soil Ecol. 2018, 123, 714–728. [Google Scholar] [CrossRef]
  41. Ridoutt, B.G.; Page, G.; Opie, K.; Huang, J.; Bellotti, W. Carbon, water and land use footprints of beef cattle production systems in southern Australia. J. Clean. Prod. 2014, 73, 24–30. [Google Scholar] [CrossRef]
  42. Subak, S. Global environmental costs of beef production. Ecol. Econ. 1999, 30, 79–91. [Google Scholar] [CrossRef]
  43. The World Bank Data. Available online: https://data.worldbank.org/country/vietnam (accessed on 6 March 2018).
  44. Transforming Vietnamese Agriculture: Gaining More from Less; Vietnam Development Report; World Bank Group: Washington, DC, USA, 2016.
  45. Gerbens-Leenes, P.W.; Nonhebel, S.; Krol, M.S. Food consumption patterns and economic growth. Increasing affluence and the use of natural resources. Appetite 2010, 55, 597–608. [Google Scholar] [CrossRef] [PubMed]
  46. Phi, D.X. Production of Bovine Meat in Vietnam—Opportunities for Exporting Thai Livestock; FFTC Agricultural Policy Platform: Taipei, Taiwan, 2016. [Google Scholar]
  47. OECD-FAO Agricultural Outlook 2016–2025; OECD-FAO: Paris, France, 2006.
  48. Do, T.L.; Nguyen, T.T.; Grote, U. Livestock production, rural welfare, & perceived shocks: Evidence from panel data for Vietnam. J. Dev. Stud. 2017. [Google Scholar] [CrossRef]
  49. Nguyen, T.T. Land reform & farm production in the Northern Uplands of Vietnam. Asian Econ. J. 2012, 26, 43–61. [Google Scholar] [CrossRef]
  50. Nguyen, T.T.; Bauer, S.; Grote, U. Does land tenure security promote manure use by farm households in Vietnam? Sustainability 2016, 8, 178. [Google Scholar] [CrossRef] [Green Version]
  51. Hoang, H.; Meyers, M. Rice Demand in Vietnam: Dietary Changes and Implications for Policy. In Proceedings of the 2015 Annual Meeting, Atlanta, Georgia, 31 January–3 February 2015. [Google Scholar]
  52. Dien, L.N.; Thang, N.M.; Bentley, M.E. Food consumption patterns in the economic transition in Vietnam. Asia Paific J. Clin. Nutr. 2004, 13, 40–47. [Google Scholar]
  53. Cira, D.; Dastur, A.; Kilroy, A.; Wang, G.H. Vietnam Urbanization Review; Technical Assistance Report; World Bank: Ho Chi Minh City, Vietnam, 2011. [Google Scholar]
  54. Dinh, T.X. An Overview of Agricultural Pollution in Vietnam: The Livestock Sector 2017; World Bank: Washington, DC, USA, 2017. [Google Scholar]
  55. General Statistics Office of Viet Nam. Available online: https://www.gso.gov.vn/default_en.aspx?tabid=778 (accessed on 1 April 2018).
  56. OECD Data. Available online: https://data.oecd.org/agroutput/meat-consumption.htm (accessed on 7 March 2018).
  57. Stür, W.; Khanh, T.T.; Duncan, A. Transformation of smallholder beef cattle production in Vietnam. Int. J. Agric. Sustain. 2013, 11, 363–381. [Google Scholar] [CrossRef] [Green Version]
  58. Vietnam Meat Market; IPSOS Business Consulting: Ho Chi Minh City, Vietnam, 2016; Available online: https://www.ipsos.com/sites/default/files/2016-08/meat-market-in-vietnam.pdf (accessed on 12 March 2018).
  59. Demand for beef up in Vietnam. Customsnews, 2018. Available online: https://customsnews.vn/demand-for-beef-up-in-vietnam-5829.html (accessed on 12 July 2018).
  60. UN Comtrade Database. Available online: https://comtrade.un.org/data/ (accessed on 19 June 2018).
  61. U.S. Meat Export Federation. Available online: https://comtrade.un.org/data/ (accessed on 8 June 2018).
  62. India is World’s Third-Biggest Beef Exporter: FAO Report; Indian Express: Noida, India, 2017. Available online: https://indianexpress.com/article/world/india-third-biggest-beef-exporter-fao-report-4772389/ (accessed on 19 July 2018).
  63. The World Bank Population Estimates and Projections. Available online: http://databank.worldbank.org/data/reports.aspx?source=Health-Nutrition-and-Population-Statistics:-Population-estimates-and-projections (accessed on 15 August 2018).
  64. Food and Agriculture Organization of the United Nations–FAOSTAT. Available online: http://www.fao.org/faostat/en/#data/TA/visualize (accessed on 7 March 2018).
  65. Cao, T.T.T. Livestock Waste in Coastal Areas Vietnam; Viet Nam Academy of Science and Technology: Hà Nội, Vietnam, 2015. [Google Scholar]
  66. Hai, H.T.; Tuyet, N.T.A. Benefits of the 3R Approach for Agricultural Waste Management (AWM) in Vietnam; IGES: Hayama, Japan, 2010. [Google Scholar]
  67. Roos, K.; Ru, J.; Zhou, W. An Innovative and Cost-Effective Solution for Livestock Waste Management in China, Thailand and Vietnam; International Finance Corporation- World Bank Group: Washington, DC, USA, 2012. [Google Scholar]
  68. Rutten, M.; van Dijk, M.; van Rooij, W.; Hilderink, H. Land Use Dynamics, Climate Change, and Food Security in Vietnam: A Global-to-local Modeling Approach. World Dev. 2014, 59, 29–46. [Google Scholar] [CrossRef]
  69. Grote, U.; Craswell, E.T.; Vlek, P.L.G. Nutrient and virtual water flows in traded agricultural commodities. In Land Use Soil Resource; Braimoh, A.K., Vlek, P.L.G., Eds.; Springer: Dordrecht, The Netherlands, 2008; pp. 121–143. [Google Scholar]
  70. Meat & Livestock Australia. Fast Facts: Australia’s Beef Industry; Meat & Livestock Australia: North Sydney, Australia, 2017. [Google Scholar]
  71. Lenzen, M.; Murray, S.A. A modified ecological footprint method and its application to Australia. Ecol. Econ. 2001, 37, 229–255. [Google Scholar] [CrossRef]
  72. Quarterly Update of Australia’s National Greenhouse Gas Inventory: March 2018; Department of Environment and Energy: Parkes, Australia, 2018.
  73. How Australia Accounts for Agricultural Greenhouse Gas Emissions. 2018. Available online: https://www.agric.wa.gov.au/climate-change/how-australia-accounts-agricultural-greenhouse-gas-emissions (accessed on 12 November 2018).
  74. Wood, R.; Dey, C.J. Australia’s Carbon Footprint. Econ. Syst. Res. 2009, 21, 243–266. [Google Scholar] [CrossRef]
  75. George Wilkenfeld & Associates Pty Ltd.; Energy Strategies. Australia’s National Greenhouse Gas Inventory 1990, 1995 and 1999—End Use Allocation of Emissions, Canberra, Australia, Australian Greenhouse Office; George Wilkenfeld & Associates Pty Ltd.: Newtown, Australia, 2002. [Google Scholar]
  76. Desjardins, R.; Worth, D.; Vergé, X.; Maxime, D.; Dyer, J.; Cerkowniak, D. Carbon Footprint of Beef Cattle. Sustainability 2012, 4, 3279–3301. [Google Scholar] [CrossRef] [Green Version]
Figure 1. Conceptual framework. Note: Example (Vietnam/VN) specific details are in brackets.
Sustainability 10 04190 g001
Figure 2. World protein consumption (g/capita/day, 2009). Source: Ranganathan et al. 2016 [23]. Note: The figure is a depiction of results under the GlobAgri model. The width of the bars is proportional to the population of the regions.
Sustainability 10 04190 g002
Figure 3. Beef consumption in Vietnam compared to worldwide beef consumption. Source: Own depiction using data from OECD [56].
Sustainability 10 04190 g003
Figure 4. Consumption and production of meat items in Vietnam. Source: Own depiction using data from Business Monitor International in EVBN [31].
Sustainability 10 04190 g004
Figure 5. Import values of meat items in 2011 and 2016 for Vietnam (%). Source: Own depiction using UN Comtrade data [60].
Sustainability 10 04190 g005
Figure 6. Bovine meat imports in Vietnam (chilled or fresh). Source: Own depiction using UN Comtrade data [60].
Sustainability 10 04190 g006
Figure 7. Bovine meat imports in Vietnam (Frozen). Source: Own depiction using UN Comtrade data [60].
Sustainability 10 04190 g007
Figure 8. Agricultural area in Vietnam. Source: Own depiction using FAOSTAT data [64].
Sustainability 10 04190 g008
Figure 9. Average protein supply. Source: Own depiction using FAOSTAT data [64].
Sustainability 10 04190 g009
Figure 10. Sources of greenhouse gas emissions in agriculture in Australia (%). Source: Own depiction using data from Department of Primary Industries and Regional Development, Australia [73].
Sustainability 10 04190 g010
Table 1. Livestock production in Vietnam.
2006201120122013201420152016
Live weight of buffaloes (thous. t)64888986868687
Live weight of cattle (thous. t)160287294285293300309
Live weight of pig (thous. t)2505309931603229335134923665
Slaughtered poultry (thous. t)344696729775875908962
Fresh milk (million l)216345382457550723795
Egg (million pieces)3970689773007755827188749446
Source: Own depiction using General Statistical Office (GSO), Vietnam data [55].
Table 2. Livestock population and increase in Vietnam.
Livestock PopulationBuffaloes (thous.)Cattle (thous.)Pigs (thous.)Poultry (Million)
20062921651126,855215
20112712 (−7.2)5437 (−16.5)27,056 (0.8)323 (50.3)
20122628 (−3.1)5194 (−4.5)26,494 (−2.1)309 (−4.4)
20132560 (−2.7)5157 (−0.7)26,264 (−0.9)317 (3)
20142521 (−1.5)5234 (1.5)26,761 (1.9)328 (3.2)
20152524 (0.1)5367 (2.5)27,751 (3.7)342 (4.3)
Preliminary 20162519 (−0.18)5497 (2.4)29,075 (4.8)362 (5.8)
Source: Own depiction using GSO data [55]. Note: Relative change in % in brackets.
Table 3. Carbon footprint and land use associated with total beef production in Vietnam.
Total Beef Production (thous. t)Carbon Footprint (Million t CO2 equiv.)Land Use (km2)
20163753–482625–156,500
2050454 *4–583178–190,680
Source: Own calculation. Note: * estimated domestic production using population projection for Vietnam from the World Bank [63]. Carbon footprint range: 9–129 kg CO2 equiv./kg of beef produced; Land use range: 7–420 m2/kg of beef produced (refer to Table A1).
Table 4. Carbon footprint and land use associated with total beef produced in Australia to be exported to Vietnam.
Total Beef Production to Be Exported to Vietnam (thous. t)Carbon Footprint (Million t CO2 equiv.)Land Use (km2)
2016960.8–12672–40,320
2050116 *1–14798–47,880
Source: Own calculation. Note: * estimated production using population projection for Vietnam from the World Bank [63]. Carbon footprint range: 9–129 kg CO2 equiv./kg of beef produced; Land use range: 7–420 m2/kg of beef produced (refer to Table A1).

