Article

The Relationship between the Physical Quality of Rice and the Market Price: A Case Study in Savannakhet, Laos, Using a Bayesian Approach

by
Kensuke D. Kawamura
1,*,
Hidetoshi Asai
1,
Shintaro Kobayashi
1,
Soukasdachanh Souvannasing
2,
Phonevilay Sinavong
2 and
Thavone Inthavong
2
1
Japan International Research Center for Agricultural Sciences (JIRCAS), 1-1 Ohwashi, Tsukuba, Ibaraki 305-8383, Japan
2
National Agriculture and Forestry Research Institute (NAFRI), P.O. Box 7170, Vientiane Capital, Lao PDR
*
Author to whom correspondence should be addressed.
Sustainability 2018, 10(11), 4151; https://doi.org/10.3390/su10114151
Submission received: 11 October 2018 / Revised: 3 November 2018 / Accepted: 6 November 2018 / Published: 12 November 2018
(This article belongs to the Special Issue Circular Economy in Industry 4.0)

Abstract

:
The visual characteristics of rice grains play a primary role in determining the market price, and are used for grading systems in many rice-consuming countries. Laos is a rice-consuming country in Southeast Asia, but it does not have a functioning grading system. This study investigated the relationship between the physical quality of milled rice grains and the market price based on the Bayesian approach in Savannakhet, Laos. We collected 30 rice samples and their market prices from 12 shops, including imported rice from Thailand and Vietnam. The rice samples were scanned using a Grain Scanner, and the proportion of head rice (HR, %) was determined using physical traits (length, shape, color, etc.) based on the ‘Thai standard’ grading criteria. The relationship between the HR ratios and market prices was modeled with the Bayesian approach. For Laos’s product, the market price and HR ratio were lower than those for Thailand’s product. Based on the Bayesian framework, the results of Markov Chain Monte Carlo simulations indicated that (1) the market price of Thailand’s product was mostly determined by the HR ratio, but other factors, such as aroma, were also suggested, especially in high-quality rice grains; (2) Laos’s product showed a positive correlation, but other factors had a greater influence on Laos’s product than Thailand’s product; and (3) no clear relationship was found in Vietnam’s product due to the limitation of a small number of samples, which was also considered a difference in consumer needs. These results indicated that the relationship between rice quality and market price for Laos’s product was unstable compared to that for Thailand’s product. To promote a more market-oriented agricultural sector, this pilot study has been broadened to examine other factors and extended to other cities or regions in Laos.

1. Introduction

Rice (Oryza sativa L.) is a major staple food and is traded worldwide [1]. Rice is also an important staple crop that provides food self-sufficiency and security to more than 182 million people in the mainland Southeast Asia countries of Cambodia, Laos, Thailand, and Vietnam [2]. From an economic point of view, rice plays a major role in international trade by bringing foreign currency revenues to rice-exporting countries and food supplies to meet the demands of rice-deficit nations. From a political point of view, rice has been used to artificially influence the market price and create social, economic, and political instability, as in the global rice crisis in 2008 [3,4].
For example, international commodity prices spiked in 2008, but in Vietnam, rice growers with small landholdings have gained little benefit from these elevated international and domestic food prices [5]. Vietnam is one of the biggest rice exporters, and employs a rice export strategy of selling high volumes of low-quality rice at low prices [6]. Many rice producers in the Mekong Delta, the country’s rice-producing belt, are also rice buyers. Small rice farmers can no longer improve their standard of living by increasing their rice yield. As a result, these farmers must rely more on off-farm sources of income and employment. These results suggest that the broad group of small rice growers is not benefiting from the rice exports, creating a socially unsustainable situation. Demont and Rutaert [7] explored the opportunities in the rice sector for sustainable value chain upgrading in Vietnam to guide the transition from a quantity-focused producer to a credible supplier of quality rice. Their results indicated three strategies for making rice value chains more sustainable: (i) embodying sustainability in the product through certified sustainable production labels; (ii) internalizing sustainable production standards through vertical coordination (e.g., contract farming); and (iii) disembodying sustainability through book-and-claim certificate trading.
Laos is among the major rice-consuming countries in Southeast Asia [8]. Although Laos achieved a self-sufficient rice production status in the late 1990s, and the national economy has continuously grown, rice remains the main staple food for people in Laos, and its demand is continuously growing [9]. For managerial aspects of rice production in Laos, it is important to promote sustainable rice production, improve farmers’ training, implement mechanisms to cope with natural hazards [10], and modernize agricultural practices [11]. In addition, the government of Laos plans to increase rice production not only for domestic consumption but also for export, with the goal of producing 4.7 million tons in 2020 and 5.0 million tons in 2025 [12]. To improve the sustainability of the rice sector in Laos, that is, to increase its export of rice, it is necessary to supply high-quality rice and to upgrade the value chain to become sustainable. However, there is no standard for rice price in the markets, and thus, it is essential to tackle this problem first.

The Relationship between Rice Quality and the Market Price

The physical quality of milled rice in the market is one of the most important characteristics that influence market value and consumer acceptance [13,14]. In particular, the visual characteristics of rice grains (e.g., size, shape, color) are the primary factors the drive market price and consumer purchasing behavior [15]. Therefore, the visual characteristics are used as the first selection criteria in varietal improvement programs [16,17].
The determination of the physical quality of rice is a key step for rice research and the rice industry, while traditional methods of visual inspection are labor-intensive and time-consuming. Therefore, various approaches have been developed to determine the physical traits of grain using imaging technology [18,19]. There are several methods to determine the shape of an object (such as grains of rice) from digital images, including image-processing-based only [20] or algorithmic methods [21] as well as three-dimensional approaches [22]. Zareiforoush et al. [18] performed a qualitative grading of milled rice grain using a machine vision system combined with metaheuristic classification approaches. Additionally, software has been designed for breeding efforts, such as the ‘SmartGrain’ [23], the Rice/Grain Analyzer software 6980 (Advanced Vision) (Osaw Industrial Products Pvt. Ltd., Haryana, Indian), and the GrainScan free software [24]. Moreover, several solutions have combined scanners and software for scanning and analyzing grain images, such as the Satake RSQI10A Grain Scanner (Satake, Hiroshima, Japan). Several major rice-producing countries, such as China, Thailand, and Vietnam, have applied imaging technologies to classify and grade milled rice based on the physical traits of the grain [25].
In Laos, however, there is no empirical evidence of the relationship between rice quality and price in the markets, and hence, no grading system exists. Laos has a population of approximately 7 million, with over two-thirds living in rural areas [26]. Laos is also highly dependent on agriculture, with approximately 70% of labor contributing to the agriculture sector [27]. Better market information for rice farmers will assist them in making better decisions to produce rice of an appropriate quality and maximize their returns [15]. To develop the criteria for determining rice grades in Laos, it is first necessary to clarify the relationship between rice quality and market price. Therefore, this study attempts to determine the visual characteristics of milled rice using imaging technology and its relation to market price as a case study in Savannakhet, which is located along the East–West economic corridor.
To date, many studies have been conducted to determine rice quality and its relation to market price or consumer preferences [14,15,28,29]. For example, Rachmat et al. [15] analyzed an empirical relationship between price and rice quality at a market in West Java, Indonesia, using a linear regression analysis. Their results indicated that rice color was the important parameter that determined consumers’ preference and consequently determined the price difference with a significant correlation between rice price and rice grade. Cuevas et al. [14] conducted a study to determine the contribution of grain quality to the rice price in two rural towns in the Philippines using a hedonic pricing analysis [30]. Hedonic pricing regressions are based on Lancaster’s “characteristics theory of value”, which can be used to measure the effects of parameters that cannot be directly quantified on the price. Thus, this method has been widely applied to investigate the effects of the extrinsic and intrinsic quality attributes of rice on market prices [14,31]. However, these attempts to fit models generally rely on approximate results, and inferences rely on asymptotic assumptions.
Recent advances in computing technology have made Bayesian modeling approaches computationally feasible. Markov Chain Monte Carlo (MCMC) methods can be used to obtain an ‘exact’ inference for these models [32]. In linear or generalized linear mixed models (GLMMs), random effects are typically assumed to have fully parametric distributions, such as the normal distribution. The application of a Bayesian approach provides a more flexible strategy that expresses parameters as a probability distribution [33]. This approach provides a great advantage for analyzing subjects affected by many factors, such as rice market prices, and it is easy to update and improve models by adding (a) parameter(s). Hence, as a first step towards evaluating the current market price in Savannakhet, Laos, we used a GLMM within a Bayesian framework using visual characteristics of rice grain as an explanatory variable.
The objective of this study was to evaluate the relationship between rice grain quality and price at a market in Savannakhet, Laos, using a Bayesian approach. In Laos, people consume a large amount of glutinous rice; however, in this study, we focused on only lowland non-glutinous rice, considering future international trade. To quantify the visual characteristics of milled rice, we used the Satake RSQI10A Grain Scanner and determined the proportion of head rice (HR, %) based on the “Thai standard” criteria due to the high similarity of the consumer rice preferences in Laos and Thailand. The HR ratio is computed based on shape (head rice, whole, broken kernels, immature kernels) and color (red, yellow, chalky, green, and damaged kernels) classifications for individual grains.

2. Materials and Methods

2.1. Study Area and Market Survey

The city of Savannakhet is located near the border of Thailand (Figure 1), and, thus, it has been developed as an economic link to Thailand. To identify the market price of milled rice (in Laos kip per kg), market surveys were conducted in 21–23 October 2016, in twelve selected rice shops: four shops (A–D in Figure 1) from the Seno market, five shops (H–L) from the Savanhxey market, and three other local shops (E–G) in Seno city. The Savanhxey market is located in the center of Savannakhet city and is the largest market, with five rice shops. The Seno market is a moderately sized market in Seno city that is located approximately 20 km northeast of Savannakhet city. In the markets, we purchased 1 kg of all of the rice types sold at the shop and recorded the selling prices. The purchased rice samples were used for grain quality evaluation by image processing.

2.2. Capturing Rice Grain Images and Determination of the HR Ratio

To determine the proportion of HR as a percentage of HR excluding defective rice (damaged, chalky, and colored rice), rice grains were scanned using the Grain Scanner (Satake Engineering Co., Ltd., Tokyo, Japan) (Figure 2). For each sample, 10 g of grain was scanned with three replicates (a total of 30 g of grain), and the HR ratio was computed as follows:
HR   ( % )   =   N H R N T × 100
where NT and NHR are the total number of grains and number of HR grains, respectively. Here, the HR was evaluated by the color and shape of the grain based on the ‘Thai standard’ criteria. For example, Figure 2c–e demonstrates the scanned grain images of Thailand’s products with different HR ratios and their market prices in Savannakhet, Laos. Thus, it is expected that there is a positive relationship between the HR ratio and the market price.

2.3. Statistical Analyses

Data handling and statistical analyses were performed using R statistical software ver. 3.4.1 [34]. Based on a GLMM with a Bayesian framework, the rice price could be estimated by
μ i =   a [ g k ] + b i [ g k ] x i
y i ~ N o r m a l ( μ i ,   σ )
where the response variable y (price) for sample i (1, 2, …, n) follows a normal distribution parameterized by mean μ, which is a linear function of x parameterized by a, b and the standard deviation σ. Additionally, it was presumed that the price was influenced by the country of origin (g) for k (1 = Laos, 2 = Thailand, and 3 = Vietnam).
To estimate the posterior distribution, an MCMC simulation was performed using the No-U-Turn Sampler (NUTS) [35], with the length of the MCMC chain for 3000 cycles after 1000 warm-up cycles, and the samples were saved every cycle. The number of chains was four. The MCMC simulation was performed using RStan ver. 2.14.1 [36] in R software.

3. Results and Discussions

3.1. Market Price and HR Ratio of Milled Rice

Based on the interviews at 12 rice shops in Savannakhet in 21–23 October 2016, a total of 45 samples and their selling prices in Laos kip per kg (kip kg–1) were obtained, which included 30 non-glutinous rice and 15 glutinous rice samples. In this study, we used 30 non-glutinous rice samples, including 13, 12, and 5 samples yielded in Laos, Thailand, and Vietnam, respectively (Table 1). The rice samples did not contain colored rice and were marketed as white rice.
As we expected, the market price in Laos (6653.8 kip kg–1) was lower than that in Thailand (7658.3 kip kg–1). The market prices ranged between 4,500 and 8,000 kip kg–1 (CV = 14.2) in Laos and between 5000 and 10,000 kip kg–1 (CV = 22.5) in Thailand. Laos has extensive export controls on its staple food, and the domestic price has been kept lower than the prices in trading partner areas, such as Thailand and Vietnam [37].
Similar to the market prices, the HR ratio of Laos’s product was lower (37.1%) than that of Thailand’s product (69.0%). To improve rice quality, researchers have historically focused on genetic plant improvements and the partial effects of component technologies on qualitative changes in grain [17,38]. Meanwhile, the improvement of milled rice grain quality in Laos needs to consider the entire postharvest system. From harvesting to the final production of milled rice at market, there are several operational steps, such as threshing, handling, dehusking, milling, and whitening. Rickman [39] reported that postharvest grain losses in developing countries are estimated to be 10–15%, and when combined with quality losses, there could be a total loss in dollar value at market of 25–50%. Rodents cause other significant damage to stored grain in village environments in Laos [40]. Grain breakage during milling is perhaps the largest cause of loss. In Southeast Asian countries, the average HR yield from commercial mills is 63% and can be as low as 53% from village-level milling [39]. In Laos, there are many rice mills throughout the country, but they are inefficient, and the finished product is of low quality. To improve the management of grain quality in Laos, the performance of rice mills needs to be improved, and training provided to farmers to show them how a focus on quality at all stages will improve the prices at market.
For Vietnam’s product, despite the highest mean HR ratio (56.2–91.6%), it had the lowest price (6,000–7,000 kip kg–1). Although the number of samples of Vietnam’s product was limited, this price difference might be considered a difference in consumer needs because the rice was sold in only 25 kg bag units, and most of the purchasers were restaurant owners. Nevertheless, further analysis with larger data sets is required in the future.

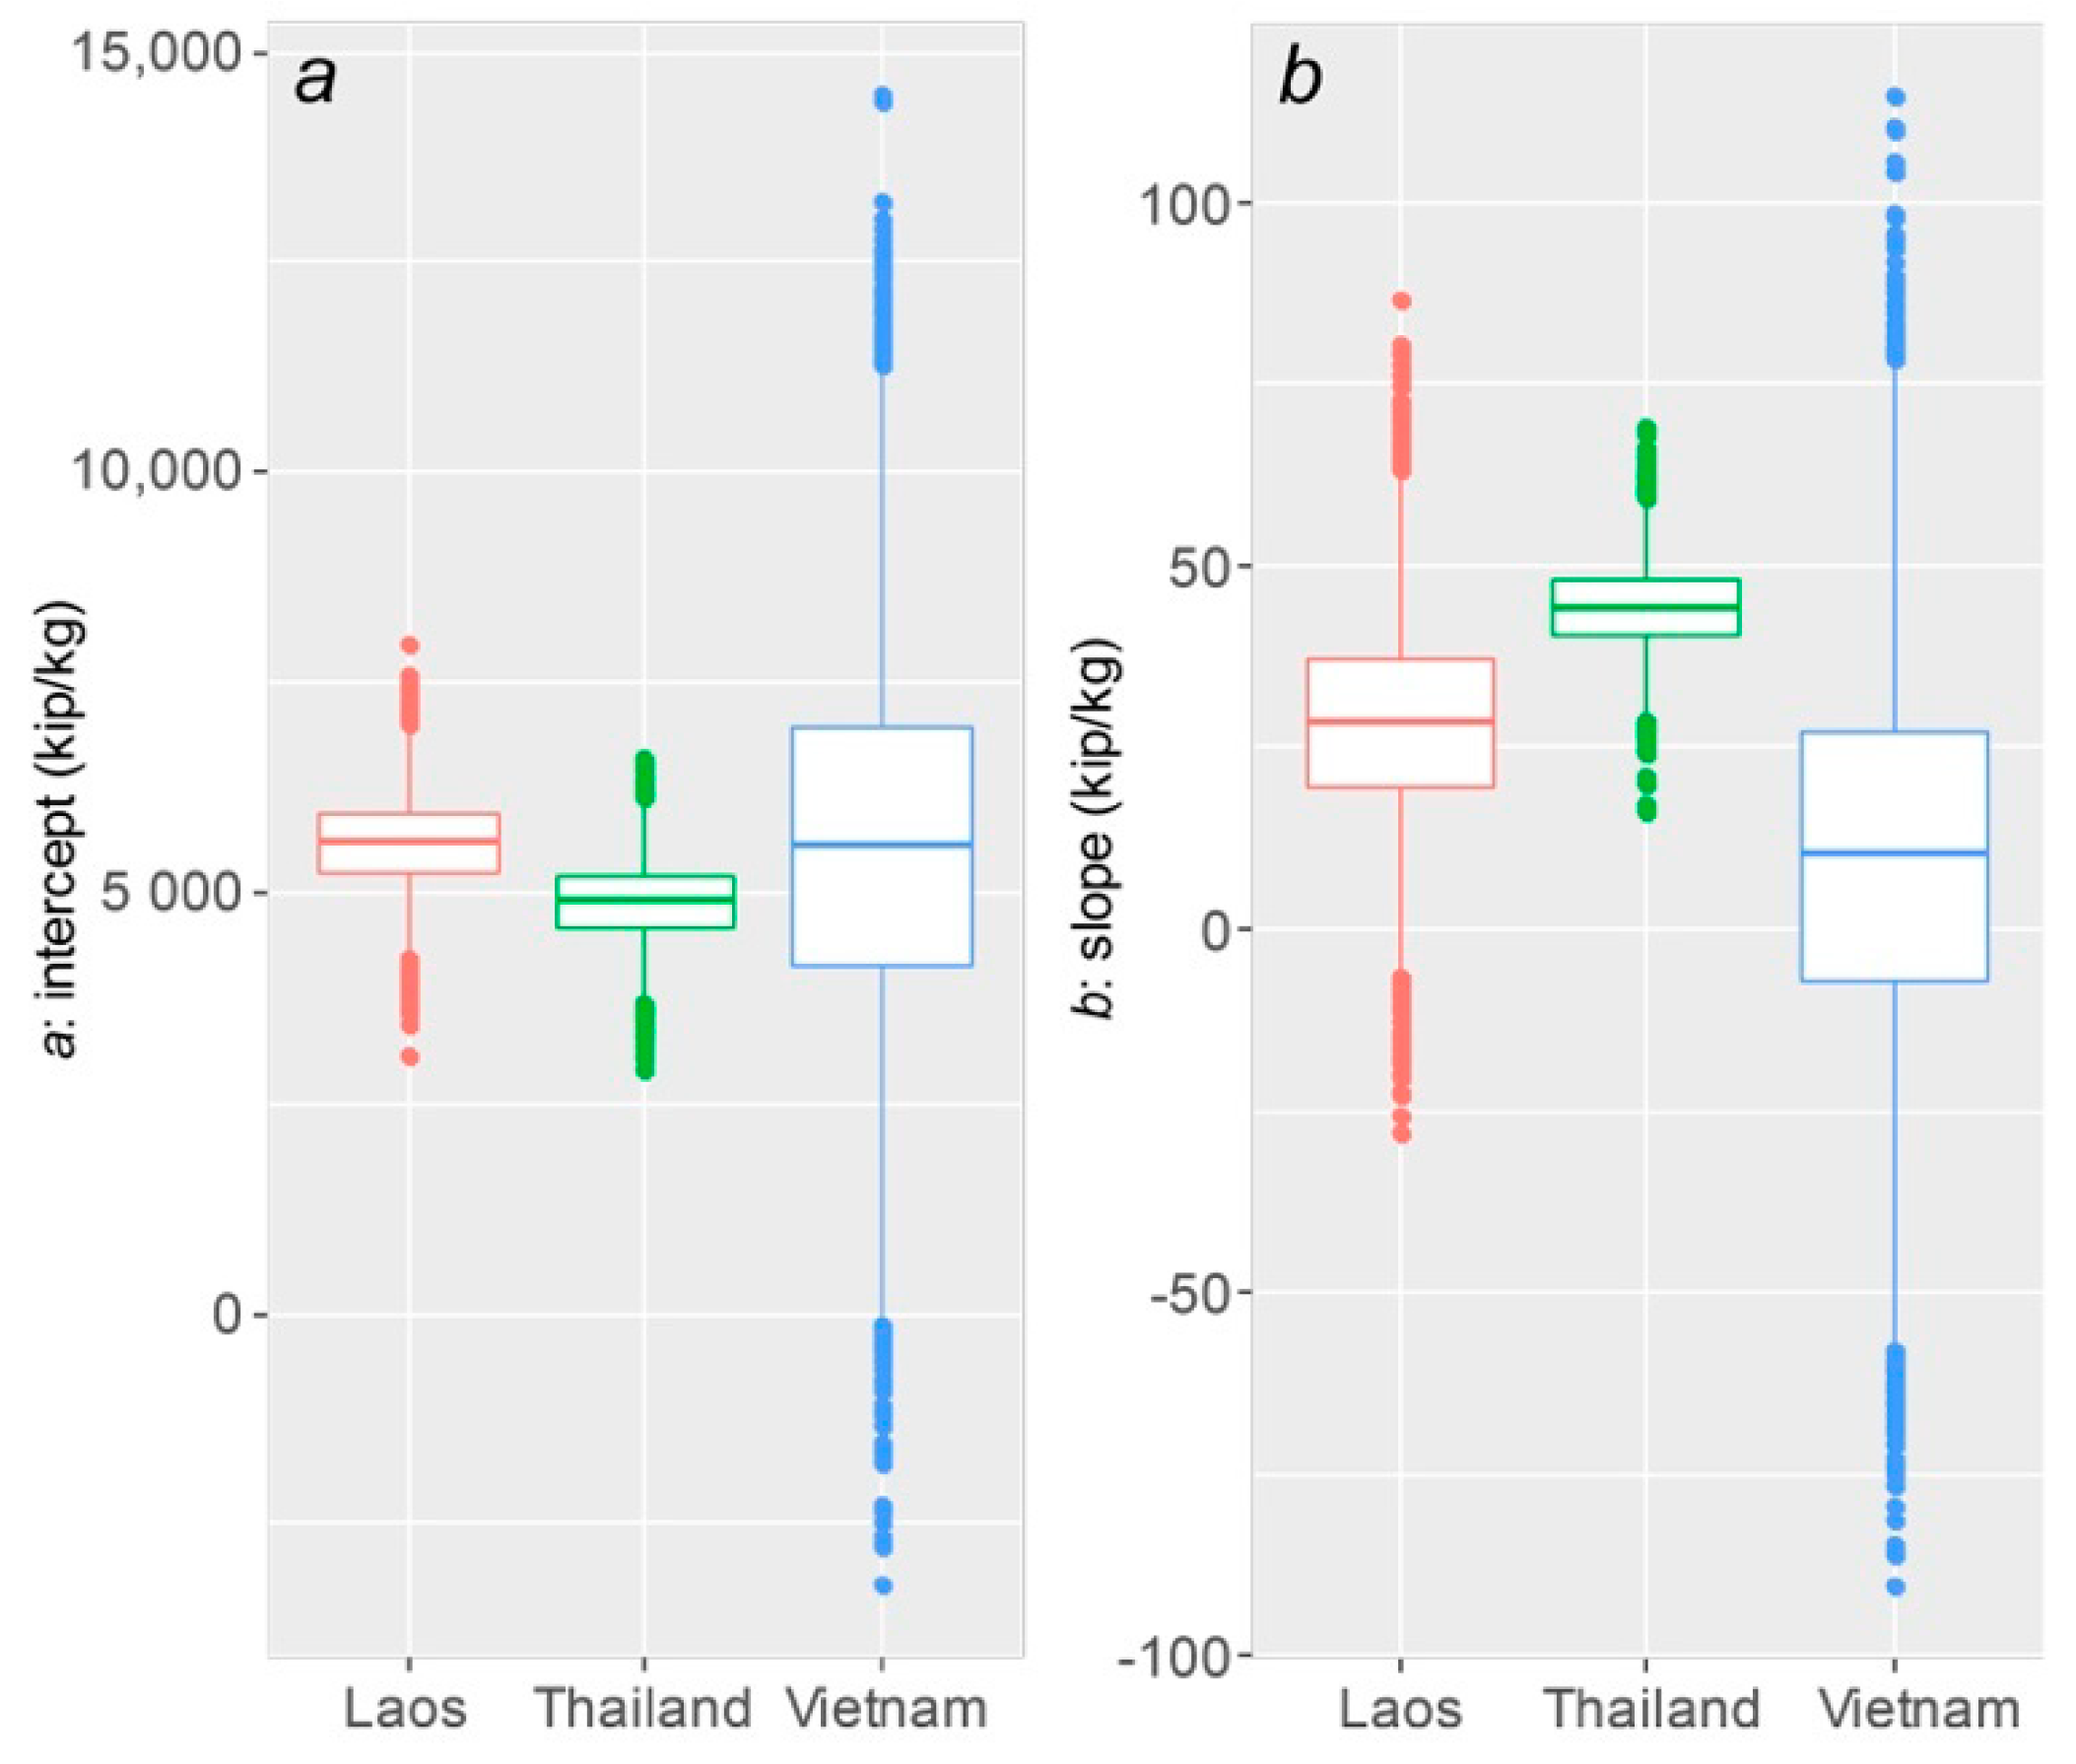
3.2. Rice Quality–Price Relationship Based on a Bayesian Approach

Understanding the rice quality–price relationship in the markets aids rice producers in making better decisions to produce appropriate rice qualities and maximize their returns. In this study, we evaluated the relationship between rice grain quality and price in the market using a GLMM based on the Bayesian framework. The Bayesian approach provides the ability to incorporate additional information that is external to the sample by prior distribution [41]. Such additional information may improve the accuracy and credibility of estimations. The credible regions incorporate this prior information, while frequentist confidence intervals are based only on the sample data.
Table 2 shows the posterior means, standard deviation (SD), and 95% posterior probability intervals (PPIs) obtained via MCMC simulation with NUTS sampling, and Figure 3 depicts box plots of the 95% PPIs for each parameter. The R-hat values, which are indicators of the convergence assessment, reached 1.0 for all parameters, and the effective sample size was sufficient for MCMC sampling. Based on the results of the posterior distribution generated by MCMC, we found similar estimates for the Laos and Thailand products, i.e., positive values for both intercept (a) and slope (b). This result is in agreement with previous research in West Java, Indonesia by Rachmat et al. [15], as the HR ratio exhibits a positive trend on the rice grade, which has a strong correlation (r = 0.95) with the market price. In the present study, the a and b for the Thailand product showed smaller and higher posterior means than that of the Laos product. This result might be due to the fact that the visual characteristics of the Thailand product have a greater influence on the market price than that of the Laos product. For the Vietnam product, the PPIs for slope included 0 with large variances. This finding indicated that the visual characteristics in Vietnam’s product could not explain the influence on the market price.
Figure 4 shows the Bayesian prediction intervals (50% and 95%) of the market price based on the HR ratio for the country of production (Laos, Thailand, and Vietnam) from MCMC. These prediction intervals might be interpreted as indicative of a 50% or 95% chance that unknown parameters were at play in these regions. The results of the MCMC simulations indicated that (1) the market price of Thailand’s product was mostly determined by the HR ratio, but other factors, such as aroma, were also suggested, especially in high-quality rice grains; (2) Laos’s product showed a certain positive correlation with the HR ratio, but other factors might have a greater influence on Laos’s product than Thailand’s product; and (3) Vietnam’s product found no clear relationship due to the limitation of a small number of samples. These results also indicated that the relationship between the rice quality and market price of Laos’s product was unstable compared to that of Thailand’s product.
Figure 5 shows the predicted versus observed values of rice price in each production country. The market price of Thailand’s product could be accurately estimated from the HR ratio of milled rice (R2 = 0.92), except for the high-priced rice due to aromatic rice grains. Aroma is an important quality of high-quality rice, and it plays a considerable role in price and marketing [1]. This result also suggested that the distribution from Thailand was functioning normally even in the rural areas of southern Laos. However, the prices of Laos’s and Vietnam’s rice were difficult to estimate from the HR ratio alone and were considered to be strongly influenced by other factors.
This study focused on a regional market in Savannakhet, which is a southern region of Laos, and targeted only the visual characteristics of rice grains, which act as primary factors in the market price by affecting consumer purchasing behaviors. However, rice grain quality is a combination of physical and chemical characteristics and is determined by many factors, such as grain appearance, nutritional value, cooking and eating qualities, and socioeconomic backgrounds. Cuevas et al. [14] reported that quality traits and socioeconomic factors affected price, and the price varied between income classes. Moreover, Calingacion et al. [1] stated that the rice market is now global, and there is a need for a more holistic perspective on consumer preferences related to rice grain quality and its geographic variability. In their report, consumer preferences in Laos were summarized as homogenous at the national level. However, it is also assumed that rice consumers in Laos exhibit wide variability in preference among domestic regions and even among socioeconomic groups. Further research is needed on the chemical parameters of rice quality, such as amylose content, protein content, and fat acidity content, to determine their contributions to consumer preferences and geographic variability.

4. Summary

Based on a Bayesian framework, we demonstrated the empirical relationship between the visual characteristics of rice and the market price based on the three producer countries (Laos, Thailand, and Vietnam) using Savannakhet, a distribution base city in southern Laos, as a case study. Our findings can be summarized as follows:
  • The market price of Thailand’s product could be explained by the HR ratio of milled rice, while value additions, such as aroma, were also suggested to impact the price of high-quality rice grains.
  • The market price of Laos’s product showed a certain positive correlation with the HR ratio, but the rice quality–price relationship was unstable, and other factors, such as chemical quality and social factors, need to be considered.
  • No clear relationship was found for Vietnam’s product due to the limitation of a small number of samples, but a difference in consumer needs was also considered.
These results indicated that the relationship between the rice quality and market price of Laos’s product was unstable compared to that of Thailand’s product.

5. Conclusions

Laos’s domestic markets are in the process of development, and, thus, there is no standard for determining the market price of milled rice. To improve the sustainability in Laos’s rice sector, it is necessary to improve rice quality and upgrade the value chain to be sustainable. This study is the first attempt to explore the current status of rice’s visual characteristics using image-processing methods and its relation to the market price in southern Laos. As we presumed, Laos’s rice product has lower quality than that of two other large rice exporters (Thailand and Vietnam), and the relation to market price was more unstable than that of Thailand’s product. A major limitation of this study was the small number of samples (n = 30) collected from a specific area, Savannakhet, as a distribution base city in southern Laos. The quality of the results can be expected to be improved if a larger sample size is available. Moreover, rice quality includes many factors in addition to visual characteristics, such as chemical components, and the price also includes social factors, such as consumer preference. Thus, rice samples collected from other regions from Laos will enable comparisons among regions and are expected to contribute to the formation of a rice price standard. To promote a more market-oriented agricultural sector, this pilot study will be broadened to examine the chemical quality of rice and social factors and will be extended to other cities or regions in Laos.

Author Contributions

K.D.K., S.K., P.S., and T.I. designed this study; K.D.K., H.A., and S.S. performed the market surveys; K.D.K. performed the image processing and statistical analyses; K.D.K. wrote the manuscript; and all of the authors revised the paper.

Funding

This study was conducted as part of a project sponsored by the Japan International Research Center for Agricultural Sciences (JIRCAS) on the “Formation of food value chain through value addition of food resources to support sustainable rural development”.

Acknowledgments

We are grateful to Katsumi Hasada of the JIRCAS, Japan, for his valuable comments on market surveys. We also thank all the staff members of the Rice Research Center (RRC) and the Research Centre for Climate Change Resilience in Agriculture (RCRA), NAFRI, Laos, for their support in rice image acquisition and market surveys.

Conflicts of Interest

The authors declare no conflict of interest.

References

  1. Calingacion, M.; Laborte, A.; Nelson, A.; Resurreccion, A.; Concepcion, J.C.; Daygon, V.D.; Mumm, R.; Reinke, R.; Dipti, S.; Bassinello, P.Z.; et al. Diversity of Global Rice Markets and the Science Required for Consumer-Targeted Rice Breeding. PLoS ONE 2014, 9, e85106. [Google Scholar] [CrossRef] [PubMed] [Green Version]
  2. Cosslett, T.L.; Cosslett, P.D. Rice Trade of the Mainland Southeast Asian Countries: Cambodia, Laos, Thailand, and Vietnam. In Sustainable Development of Rice and Water Resources in Mainland Southeast Asia and Mekong River Basin; Springer: Singapore, 2018; pp. 55–83. ISBN 978-981-10-5613-0. [Google Scholar]
  3. Headey, D. Rethinking the global food crisis: The role of trade shocks. Food Policy 2011, 36, 136–146. [Google Scholar] [CrossRef] [Green Version]
  4. Chand, R. The Global Food Crisis: Causes, Severity and Outlook. Econ. Polit. Wkly. 2008, 43, 115–122. [Google Scholar]
  5. World Bank. Vietnam Rice, Farmers and Rural Development: From Successful Growth to Sustainable Prosperity; World Bank: Hanoi, Vietnam, 2012. [Google Scholar]
  6. Breu, M.; Salsberg, B.S.; Tu, H.T. Growing up Fast: Vietnam Discovers the Consumer Society. Available online: https://www.mckinsey.com/business-functions/marketing-and-sales/our-insights/growing-up-fast-vietnam-discovers-the-consumer-society (accessed on 24 April 2018).
  7. Demont, M.; Rutsaert, P. Restructuring the Vietnamese Rice Sector: Towards Increasing Sustainability. Sustainability 2017, 9, 325. [Google Scholar] [CrossRef]
  8. Partnership, G.R.S. Rice Almanac, 4th ed.; International Rice Research Institute: Los Banos, Philippines, 2013; ISBN 978-9712203008. [Google Scholar]
  9. World Bank. Lao People’s Democratic Republic Rice Policy Study; Food and Agriculture Organization: Rome, Italy, 2012. [Google Scholar]
  10. Sayavong, V. Technical Inefficiency in Paddy Rice Production in Laos. J. Southeast Asian Econ. 2018, 35, 257–274. [Google Scholar]
  11. Goto, K.; Douangngeune, B. Agricultural modernisation and rural livelihood strategies: The case of rice farming in Laos. Can. J. Dev. Stud. 2017, 38, 467–486. [Google Scholar] [CrossRef]
  12. Ministry of Agriculture and Forestry. Laos, Agriculture Development Strategy to 2025 and Vision to the Year 2030; Ministry of Agriculture and Forestry: Vientiane, Laos, 2015.
  13. Lapitan, V.C.; Brar, D.S.; Abe, T.; Redoña, E.D. Assessment of genetic diversity of Philippine rice cultivars carrying good quality traits using SSR markers. Breed. Sci. 2007, 57, 263–270. [Google Scholar] [CrossRef]
  14. Cuevas, R.P.; Pede, V.O.; McKinley, J.; Velarde, O.; Demont, M. Rice Grain Quality and Consumer Preferences: A Case Study of Two Rural Towns in the Philippines. PLoS ONE 2016, 11, e0150345. [Google Scholar] [CrossRef] [PubMed]
  15. Rachmat, R.; Thahir, R.; Gummert, M. The empirical relationship between price and quality of rice at market level in West Java. Indones. J. Agric. Sci. 2006, 7, 27–33. [Google Scholar] [CrossRef]
  16. Tomlins, K.; Manful, J.; Gayin, J.; Kudjawu, B.; Tamakloe, I. Study of sensory evaluation, consumer acceptability, affordability and market price of rice. J. Sci. Food Agric. 2007, 87, 1564–1575. [Google Scholar] [CrossRef]
  17. Fitzgerald, M.A.; McCouch, S.R.; Hall, R.D. Not just a grain of rice: The quest for quality. Trends Plant Sci. 2009, 14, 133–139. [Google Scholar] [CrossRef] [PubMed]
  18. Zareiforoush, H.; Minaei, S.; Alizadeh, M.R.; Banakar, A. Qualitative classification of milled rice grains using computer vision and metaheuristic techniques. J. Food Sci. Technol. 2016, 53, 118–131. [Google Scholar] [CrossRef] [PubMed]
  19. Yadav, B.K.; Jindal, V.K. Modeling changes in milled rice (Oryza sativa L.) kernel dimensions during soaking by image analysis. J. Food Eng. 2007, 80, 359–369. [Google Scholar] [CrossRef]
  20. Lurstwut, B.; Pornpanomchai, C. Image analysis based on color, shape and texture for rice seed (Oryza sativa L.) germination evaluation. Agric. Nat. Resour. 2017, 51, 383–389. [Google Scholar] [CrossRef]
  21. Papadimitriou, F. Modelling spatial landscape complexity using the Levenshtein algorithm. Ecol. Inform. 2009, 4, 48–55. [Google Scholar] [CrossRef]
  22. Li, H.; Qian, Y.; Cao, P.; Yin, W.; Dai, F.; Hu, F.; Yan, Z. Calculation method of surface shape feature of rice seed based on point cloud. Comput. Electron. Agric. 2017, 142, 416–423. [Google Scholar] [CrossRef]
  23. Tanabata, T.; Shibaya, T.; Hori, K.; Ebana, K.; Yano, M. SmartGrain: High-throughput phenotyping software for measuring seed shape through image analysis. Plant Physiol. 2012, 160, 1871–1880. [Google Scholar] [CrossRef] [PubMed]
  24. Whan, A.P.; Smith, A.B.; Cavanagh, C.R.; Ral, J.-P.F.; Shaw, L.M.; Howitt, C.A.; Bischof, L. GrainScan: A low cost, fast method for grain size and colour measurements. Plant Methods 2014, 10, 23. [Google Scholar] [CrossRef] [PubMed]
  25. Graham, R. A Proposal for IRRI to Establish a Grain Quality and Nutrition Research Center; IRRI Discussion Paper; International Rice Research Institute: Los Baños, Philippines, 2002. [Google Scholar]
  26. Asia and Pacific Commision on Agricultural Statistics. Twenty-Fourth Session. Available online: h http://www.fao.org/economic/ess/ess-events/ess-apcas/ess-apcas24/en/ (accessed on 24 April 2018).
  27. Mission Aviation Fellowship. Development Strategy of the Crop Sector 2025 and Vision 2030: Crop Production by Focusing on Modernization, Clean, Safety, Quality, Stability, Sustainability and Commercialization; Mission Aviation Fellowship: Vientiane, Laos, 2015. [Google Scholar]
  28. Jang, E.-H.; Lim, S.-T.; Kim, S.S. Comparison of physicochemical characteristics and consumer perception of rice samples with different countries of origin and prices. J. Sci. Food Agric. 2012, 92, 1605–1613. [Google Scholar] [CrossRef] [PubMed]
  29. Naseem, A.; Mhlanga, S.; Diagne, A.; Adegbola, P.Y.; Midingoyi, G.S. Economic analysis of consumer choices based on rice attributes in the food markets of West Africa—The case of Benin. Food Secur. 2013, 5, 575–589. [Google Scholar] [CrossRef]
  30. Brorsen, B.W.; Grant, W.R.; Rister, M.E. A Hedonic Price Model for Rough Rice Bid/Acceptance Markets. Am. J. Agric. Econ. 1984, 66, 156–163. [Google Scholar] [CrossRef]
  31. Wang, Z.; Zheng, S.; Lambert, D.M.; Fukuda, S. A Hedonic Price Model for Rice Market in China. J. Fac. Agric. Kyushu Univ. 2009, 54, 541–548. [Google Scholar]
  32. Zeger, S.L.; Karim, M.R. Generalized Linear Models with Random Effects; a Gibbs Sampling Approach. J. Am. Stat. Assoc. 1991, 86, 79–86. [Google Scholar] [CrossRef]
  33. Kubo, T. An introduction to spatial statistical modeling for ecologists. Jpn. J. Ecol. 2009, 59, 187–196. [Google Scholar]
  34. R Core Team. R: A Language and Environment for Statistical Computing; R Core Team: Vienna, Austria, 2017. [Google Scholar]
  35. Homan, M.D.; Gelman, A. The No-U-turn Sampler: Adaptively Setting Path Lengths in Hamiltonian Monte Carlo. J. Mach. Learn. Res. 2014, 15, 1593–1623. [Google Scholar]
  36. Stan Development Team. RStan: The R Interface to Stan. 2016. Available online: http://mc-stan.org/ (accessed on 24 April 2018).
  37. Dick, D.; Roy, W. Importing High Food Prices by Exporting: Rice Prices in Lao PDR. J. Agric. Econ. 2016, 68, 164–181. [Google Scholar] [CrossRef] [Green Version]
  38. Juliano, B.O. Rice grain quality: Problems and challenges. Cereal Foods World 1990, 35, 245–253. [Google Scholar]
  39. Rickman, J.F. Grain quality from harvest to market. In JIRCAS International Symposium Series 9; Japan International Research Center for Agricultural Sciences: Tsukuba, Japan, 2002; pp. 94–98. [Google Scholar]
  40. Brown, P.R.; McWilliam, A.; Khamphoukeo, K. Post-harvest damage to stored grain by rodents in village environments in Laos. Int. Biodeterior. Biodegrad. 2013, 82, 104–109. [Google Scholar] [CrossRef]
  41. Ibrahim, J.G.; Chen, M.-H. Power Prior Distributions for Regression Models. Stat. Sci. 2000, 15, 46–60. [Google Scholar]
Figure 1. The location of the study area and the 12 selected rice shops (A–L) in Savannakhet Province, Lao PDR.
Sustainability 10 04151 g001
Figure 2. Determination of head rice (HR) ratio using Grain Scanner 2 (a,b) and examples of the HR ratio (%) with market prices in Lao kip kg–2 (ce).
Sustainability 10 04151 g002
Figure 3. Boxplot of the 95% posterior probability intervals (PPIs) for parameters a and b in the country of origin. The center line and the top/bottom of each rectangle and outlier (vertical bar) present the median, the first and third quartiles, and the 95% confidence interval of the median, respectively.
Sustainability 10 04151 g003
Figure 4. Bayesian prediction intervals (50%: light gray; 95%: dark gray) of the market price based on the head rice (HR) ratio for the country of production (Laos, Thailand, and Vietnam).
Sustainability 10 04151 g004
Figure 5. Observed and predicted values of rice price for the country of production (Laos, Thailand, and Vietnam) using a Bayesian model based on the proportion of HR ratio.
Sustainability 10 04151 g005
Table 1. Descriptive statistics of market prices and head rice (HR) ratios of milled rice based on the country of origin (Laos, Thailand, and Vietnam).
DatasetnParameterMeanMinMaxSDCV
Laos13Price (kip kg–1)6653.84500.08000.0943.914.2
HR ratio (%)37.16.465.116.544.5
Thailand12Price (kip kg–1)7958.35000.010,000.01789.622.5
HR ratio (%)69.01.099.339.056.4
Vietnam5Price (kip kg–1)6400.06000.07000.0547.78.6
HR ratio (%)82.556.291.614.918.1
n, number of samples; SD, standard deviation; CV, coefficient of variation (=Mean/SD × 100%).
Table 2. Posterior means (Mean), standard deviation (SD), and quartiles (2.5, 50, and 97.5%) obtained from the Markov Chain Monte Carlo (MCMC) simulation.
CoefficientMeanSD2.5%50%97.5%
a15612.7517.14598.55607.76648.0
a24912.3457.94018.44906.15818.8
a35532.32119.81262.15578.49614.4
b128.012.92.428.152.5
b244.15.832.844.255.6
b310.525.3−38.210.261.9
σ744.6116.2558.8730.11012.1
The values from 2.5% to 97.5% indicate the 95% posterior probability intervals. a and b represent the intercept and slope, respectively, for 1: Laos, 2: Thailand, and 3: Vietnam. σ is the standard deviation.

