An Analysis of Land-Use Change and Grassland Degradation from a Policy Perspective in Inner Mongolia, China, 1990–2015


1
State Key Laboratory of Resources and Environmental Information System, Institute of Geographic Sciences and Natural Resources Research, Chinese Academy of Sciences, Beijing 100101, China
2
University of Chinese Academy of Sciences, Beijing 100049, China
3
Department of Geography, Humboldt–Universität zu Berlin, Unter den Linden 6, 10099 Berlin, Germany
4
Leibniz Centre for Agricultural Landscape Research (ZALF), Eberswalder Straße 84, 15374 Müncheberg, Germany
*
Authors to whom correspondence should be addressed.
Sustainability 2018, 10(11), 4048; https://doi.org/10.3390/su10114048
Submission received: 10 October 2018
/
Revised: 30 October 2018
/
Accepted: 31 October 2018
/
Published: 5 November 2018
Abstract
:Land-use and land-cover changes have important effects on ecology, human systems, the environment, and policy at both global and regional scales. Thus, they are closely related to human activities. The extraction of more details about land-use change and grassland degradation is necessary to achieve future sustainable development in Inner Mongolia. The current study presents the patterns and processes of land-use changes over space and time, while also analyzing grassland degradation that is based on an analysis of land-use changes using a transition matrix, the Markov chain model and Moran’s I index, and a combination of long-time-scale remote sensing data as the data source. The major results indicate the following. (1) In 1990–2015, 13% (123,445 km2) of the total study area, including eight land-use types, changed. Woodland increased the most and moderate grassland decreased the most. (2) Grassland degradation, which occupied 2.8% of the total area of Inner Mongolia, was the major land-use conversion process before 2000, while, after 2000, 8.7% of the total area was restored; however, grassland degradation may still be the major ecological issue in Inner Mongolia. (3) Environmental protection policies show a close relationship with land-use conversion.
1. Introduction
Global land-use and land-cover change (LUCC) has been reported to exert important effects on the environment at both global and regional scales [1,2,3]. LUCC refers to changes in the biophysical attributes of the Earth’s surface and the application of these attributes for human purposes [4,5]. It exerts significant effects on regional environments and ecosystems, even on climate change [6]. Many previous studies have shown that LUCC has close relationships with land degradation [4], biodiversity losses [7], climate change [8], natural hazards [9], and soil erosion [10], as well as threatening food security [11]. Worldwide, it is caused by human activities which are linked with different land-use conversion processes, such as deforestation, agricultural land expansion, built-up land expansion, and vegetation degradation [11]. It is necessary to evaluate the history of LUCC to provide significant information for future decision-making and sustainable development [12,13].
China, as an important part of the global environment, has attracted a good deal of attention with regards to LUCC. Grassland covers about four-million km2 in China, the largest territorial ecosystem (more than 40% of the total area of the land) and the world’s third largest area of this type (13% of the world’s grassland), and it is mainly concentrated in six provinces: Inner Mongolia, Gansu, Tibet, Xinjiang, Qinghai, and Sichuan [14]. This land is predominantly used for livestock farming and environmental conversion [14,15,16]. However, grassland changes have been widely reported in the northern region of China [17,18,19,20], with 10% of total grassland being degraded in the 1970s, increasing to 30% in 1980 and 50% in the 1990s. In 2000, about 90% of grassland in China was degraded [21]. From 2000 to 2010, 61.5% of grassland underwent degradation due to economic development, policy changes, climate change, and increasing human activities [22,23,24,25,26].
Grassland degradation is generally defined as an adverse reduction in biodiversity, vegetation coverage, plant height, and biomass production [4,18,27]. Recently, it also includes mean deterioration in ecosystem services and functions [28]. Grassland degradation causes a range of ecological problems—e.g., loss of biodiversity, carbon sink, and water loss—as well as increases in dust storms and soil degradation [16,27]. Zhou et al. [25] reported that human activities were responsible for 66% and climate factors accounted for 20% of grassland degradation. Policy has been reported widely by many previous studies as being the most influential indirect factor [29,30]. In Inner Mongolia, particularly, which has an arid and semiarid climate and is an ecologically vulnerable area, grassland degradation threatens not only economic development but also household livelihoods [31], at the same time, Inner Mongolia have subject to a set of important ecological policies that combat degradation. Furthermore, according to Cao et al. [27], the direct economic loss from sandstorms is about USD 7.9 billion per year. Specifically, overgrazing, policies, and land-use conversion have been reported as the major drivers of grassland degradation in Inner Mongolia [27,32]. In sum, Inner Mongolia is a typical area to explore the grassland degradation process and associations with ecological policies.
Policy is an important factor that closely relates to land-use and land-cover change throughout the world [11,33]. Many ill-defined institutions (global, regional, or local) lead to undesired land-use changes (e.g., land degradation). At the same time, restoration is possibly also closely related to appropriate land-use policies [33]. Take deforestation in Indonesia as an example. The forest loss caused by illegal logging is closely related to the improper execution of protected principles, which is due to corruption and the conveyance of forest management responsibilities from central to local government [34]. In the Brazilian Amazon area, after the implementation of PPCDAm (Plano de Ação para Prevenção e Controle do Desmatamento na Amazônia Legal), there has been control of the deforestation rate [35]. In Germany, the policy “30-hectares goal” aimed to reduce land changed into urbanized areas until 2020. The achievement of this was predicted to be prevented by demographic factors, local government, and different financial systems [36,37].
Since 1998, a set of grassland conservation policies has been enforced in China to combat degradation. Du et al. [31] stated that there have five major related measures from overall policies, which can be summarized into two aspects: (1) livestock management (i.e., seasonal grazing, rotational grazing, grazing prohibition, and livestock determination according to grassland capacity) and (2) a reduction in users who depend on local grassland. These policies mainly focus on reducing livestock, improving the livelihood of herders, combating degradation, and developing China’s economy [38]. Despite the fact that ecological protection policies have improved, the condition of grasslands in China, degradation is still severe [4,39]. The causes of land-use change cannot be understood without a better understanding of the patterns and processes of land-use conversion [40]. Thus, it is necessary to obtain historic land-use changes, monitor grassland degradation, and obtain more details on grassland processes that are based on large-scale land-use changes for future policy development and grassland management.
Many previous studies have evaluated and monitored grassland degradation and restoration based on a long-time-scale vegetation index [39,41]. The merits of this method include the accessibility of assessing and monitoring data sources and the flexibility for processes within a specified time scale [42]. However, this method cannot provide details on grassland degradation and restoration during a specified range; for example, it does not show how degraded or restored grassland is converted or transformed. Few studies have analyzed grassland degradation based on land-use conversion. Based on this, the current study uses remote sensing data as a data source, while combining this with the transition matrix, Markov chain model, and Moran’s I index to analyze the transition patterns and process of LUCC at a large scale and analyze grassland degradation and restoration based on land-use conversion processes. In addition, we have explored the relationship between land-use conversion and related policies, providing important information for decision makers and householders. Since 1998, various of environmental policies were implemented to combat land degradation and improve ecological conditions in a bid to explore whether these policies are in accordance with land-use conversion processes. In this study, we have presented land-use conversion processes in two periods: 1990–2000 and 2000–2015.
The main goals of this study are (1) to analyze LUCC processes and patterns over space and time in Inner Mongolia between 1990 and 2015, (2) to evaluate grassland degradation that is based on an analysis of land-use changes, and (3) to discuss the possible relationship between land-use processes and ecological policies.
2. Materials and Methods
2.1. Study Area
China’s Inner Mongolia Autonomous Region (Inner Mongolia, IM, USA), located in the north of China, spans from 126°04′ to 97°12′ and from 37°24′ to 53°23′, across a longitude of 28°52′, with a straight-line distance of 2400 km from east to west and across a latitude of 15°59′. IM, covering an area of 118.3 × 10⁴ km2, is the third largest province in China (Figure 1), with average elevation of 1000 m. The topography is characterized by vast plains, the elevation decreasing gradually from south to north and from west to east (ranging between 1400 and 700 m above sea level) [43]. IM includes six plateaus: Hulunbeir, Xilingol, Wulandchabu, Bayannaoer, Alashan, and Eerduosi [43]. The climate varies from arid and semiarid to humid from west to east [44,45]. The annual total precipitation is between 50 and 450 mm, with a declining pattern from the east to the west, while the annual average temperature from −2 to 6 °C. IM has abundant sunshine and a rich luminous energy resource. Most of this region has an average sunshine duration over 2700 h annually, and this is even greater than 3400 h in the Eastern Alashan region.
Corresponding to the vegetation types, IM includes chernozem (meadow steppe), chestnut (typical steppe), and calcic brown (desert steppe and steppe desert) soils. The dominant sandy lands (27.2% of total area in 2015) include Maowusu and Kubuqin in the west, Hunshandak in the center, and Horqin and Hulunbuir in the east [43]. The land-use types from northeast to west are dominated by forest, grassland, and desert. The area of these three land-use types together was over 87.9% of the total area until 2015. Grassland, including meadow, typical, and desert steppe vegetation, was the major land-use type (44.7% of total area in 2015) and the most widespread vegetation type in IM, accounting for about half of the whole vegetation area [46]. Consequently, IM is an important base for animal husbandry and an important ecological barrier that conserves water and soil, combats wind erosion, and guards biodiversity [47]. However, since 1980, grassland sources in IM have experienced serious degradation. From 1980 to 2000, the number of livestock increased from 18.76 × 10⁶ to 23.72 × 10⁶, and the available area of grassland per sheep unit decreased from 6.80 to 1.27 ha between 1950 and 2000 [47]. Thus, it is vital to analyze the grassland degradation processes and patterns, as well as to indicate the relationships between land-use conversion and possible policies.
2.2. Data Collection
The present study employed a land-use and land-cover database (LCCD) that was created by Chinese Academic Science (CAS). It uses long-time-series (e.g., 1990, 2000, and 2015) Landsat MSS/TM/ETM+/OLI remote sensing images as data sources, based on a computer-assisted visual interpolation method to generate land-use data for the whole of China. The time period of this database covers the 1990s to 2015 and, for each period, there are more than 500 pieces of remote sensing data, which cover the entire country [48]. Most of the images were required to be taken from consistent seasons (between July–October). The spatial resolution of the remote sensing data is 30 m for the 1990 and 2000 data and 15 m for the 2015 data, which is sufficient for land-use analysis [49,50,51]. The LUCC data are at a spatial scale of 1:100,000 [6,52].
The accuracy of the LUCC data has been validated via field surveys, with an overall accuracy of 94.0% for the first-level land-use types and 91.2% for the 25 subclasses [52]. These data have been used widely by many previous studies to evaluate land degradation [4], to identify the major drivers of LUCC change [50,52], make predictions for future land-use changes [53], explore optimal land-use strategies [54], present land-use change patterns in China [49,55,56], and explore the process of grassland degradation over space and time [57]. A hierarchical classification system, including 25 subclasses of land-use types, was used in this LCCD [6]. In the present study, to evaluate the grassland change process, eight land-use types were identified: cropland, woodland, water body, built-up land, dense grassland, moderately dense grassland, and sparse grassland (see Table 1). All land-used data went through a preliminary process, in which it was assumed that built-up land could not be changed into other land-use types, and the interpolation errors according to all authors’ experience and Landsat OIL remote sensing data were checked. For example, after 2000, it was impossible for large areas of grassland to change to cropland (i.e., patch areas larger than 6000 km2).
2.3. Methods
Transition matrix was a traditional method generally used to explore the conversion process of different land-use types [58]. The Markov chain model was generally used to present the stabilities of land-use types and make predictions on LUCC for future development [59,60,61]. Moran’s I was used to explore the spatial autocorrelation of different land-use types to present spatial pattern dependence [62].
2.3.1. Land-Use Matrix and Markov Chain Model
The Markov model was used to evaluate land-use change processes and patterns. This mathematical method describes land-use type based on a particular period in a particular region [59]. Based on this, a land-use transition matrix was required. We present the net land-use change in two time periods: 1990–2000 and 2000–2015 [50]. In addition, further calculation of gains (increases) and losses (decreases) was done based on a transition matrix table. A gain in a land-use type refers to an increase between study periods, while a loss means that the land-use type has reduced [63].
Markov chain analysis is a stable mathematical method that was used to predict future change for a system [59]. The Markov model can present all possible directions of land-use change among all land-use types and predict the state of the future [64]. This is a random process without after-effect characteristics, which means that the state of one land-use type at a future time point (t + 1) only depends on the current time (t) and does not include time before t [60]. The applicability and feasibility of Markov chains have been validated in different regions and at different scales by many previous studies [64,65,66,67,68,69]. During this present study, a Markov chains model was used understand and quantify the land-use conversion processes in IM. The transition probability (TP) matrix can be expressed, as follows.
where P refers to the probability of moving from state i to state j.
Equation (1) must satisfy the following two conditions.
2.3.2. Spatial Autocorrelation Analysis
Spatial autocorrelation is generally used to describe a quantitative measure of spatial correlation of a geographical phenomenon [70]. This study used Moran’s I to analyze the spatial autocorrelation of all land types in IM. The basic principle of Moran’s I is as follows [71].
where, for ij, n was the total amount of the space unit, Xi is the observation value of the geographic attribute in the space unit (i), is the average value of regional values, and Wij is the spatial weight matrix which represents the neighborhood relationship between area i and area j, as measured by the spatial distance of the adjacency criterion. The adjacency is expressed by
Generally, the value of Moran’s I is between −1 and 1. When the value is less than 0, there is a negative relationship between observations. If it is the reverse, the relationship is positive. When the value is 0, there is no autocorrelation between the data [72]. In this study, Geoda was used to calculate global spatial autocorrelation [73].
2.3.3. Evaluation of Grassland Degradation and Restoration
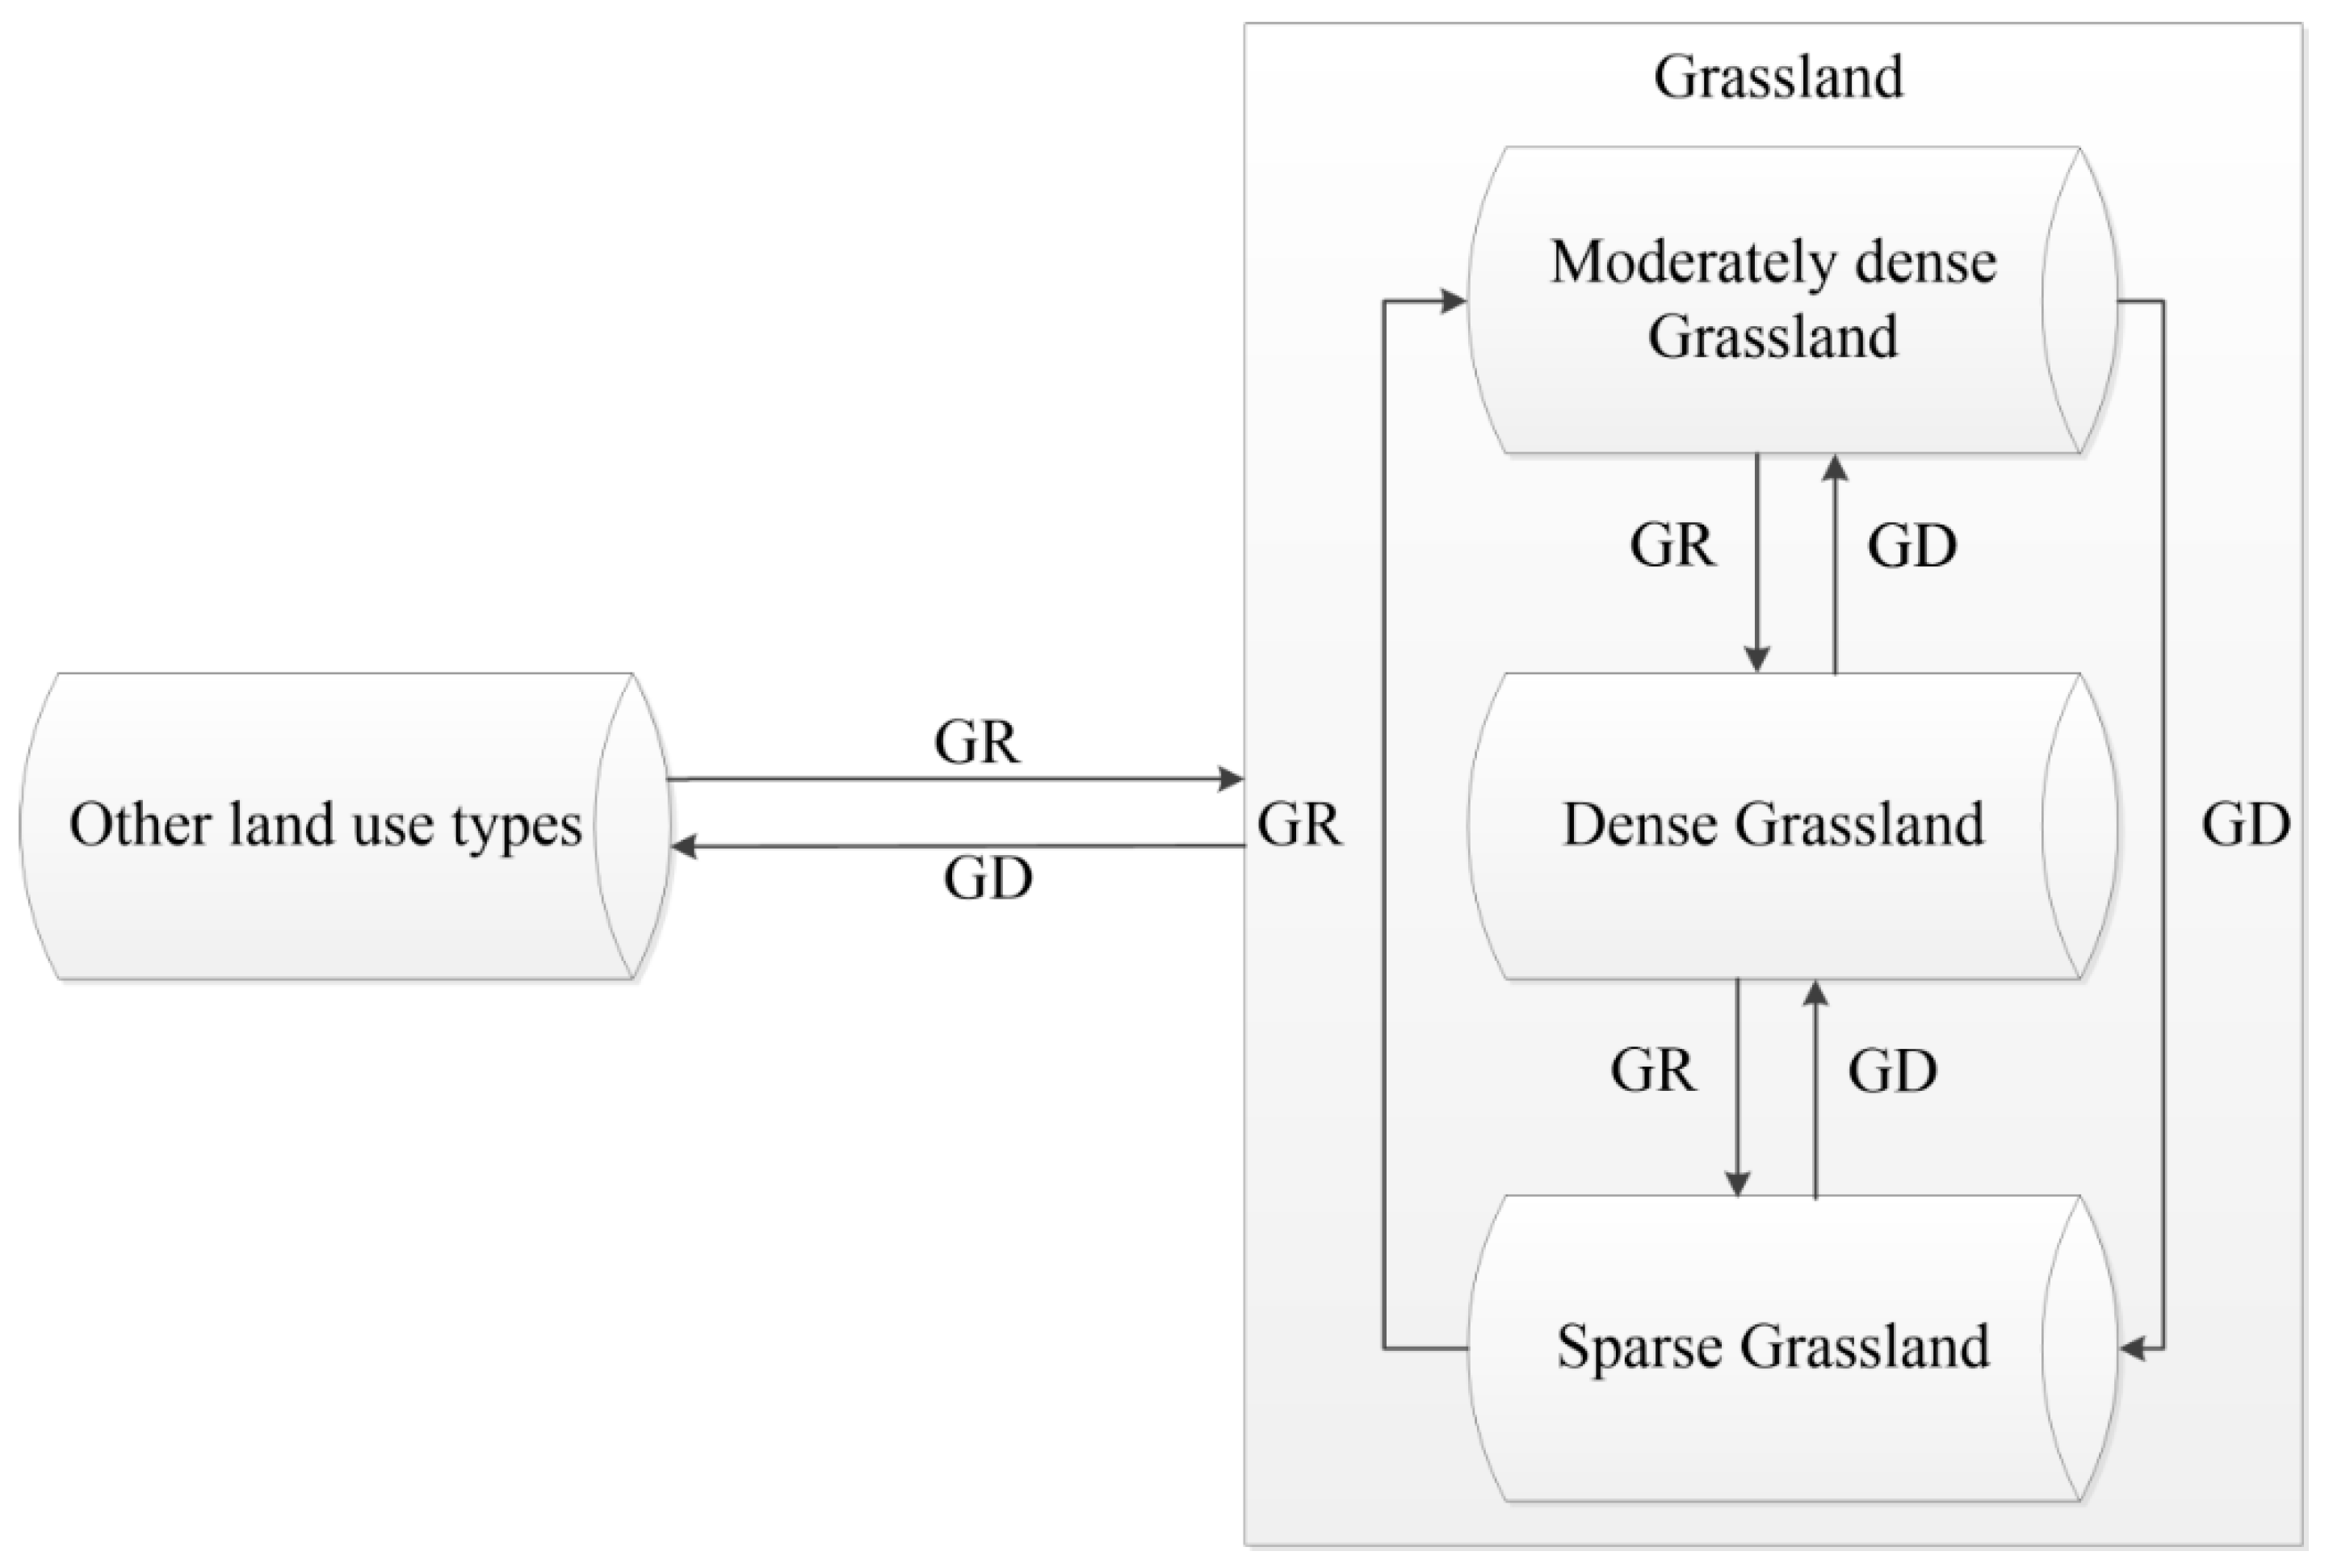
Generally, grassland degradation refers to the struggle to grow grassland structure, grassland species, and grassland products that are caused by overgrazing, cultivated land reclamation, climate change, policy change, rapid conversion of land-use types and fuel and herbs for medicine, and destruction by rodents, etc. [15,74,75,76]. Grassland restoration refers to grassland renewal or regrowth, mainly including vegetation coverage change, soil conservation and remediation, and carbon sequestration [4,77]. In the present study, we redefined grassland degradation and restoration, as follows.
Grassland degradation (GD) is the decrease in grassland coverage or change of grassland into other land-use types (i.e., cropland, woodland, water body, and unused land).
Grassland restoration (GR) is the improvement of grassland coverage (grassland revegetation) or change of grassland from other land-use types (i.e., cropland, woodland, water body, and unused land) (Figure 2).
3. Results
3.1. Land-Use Conversion Since 1990
3.1.1. General Trend of LUCC between 1990 and 2015
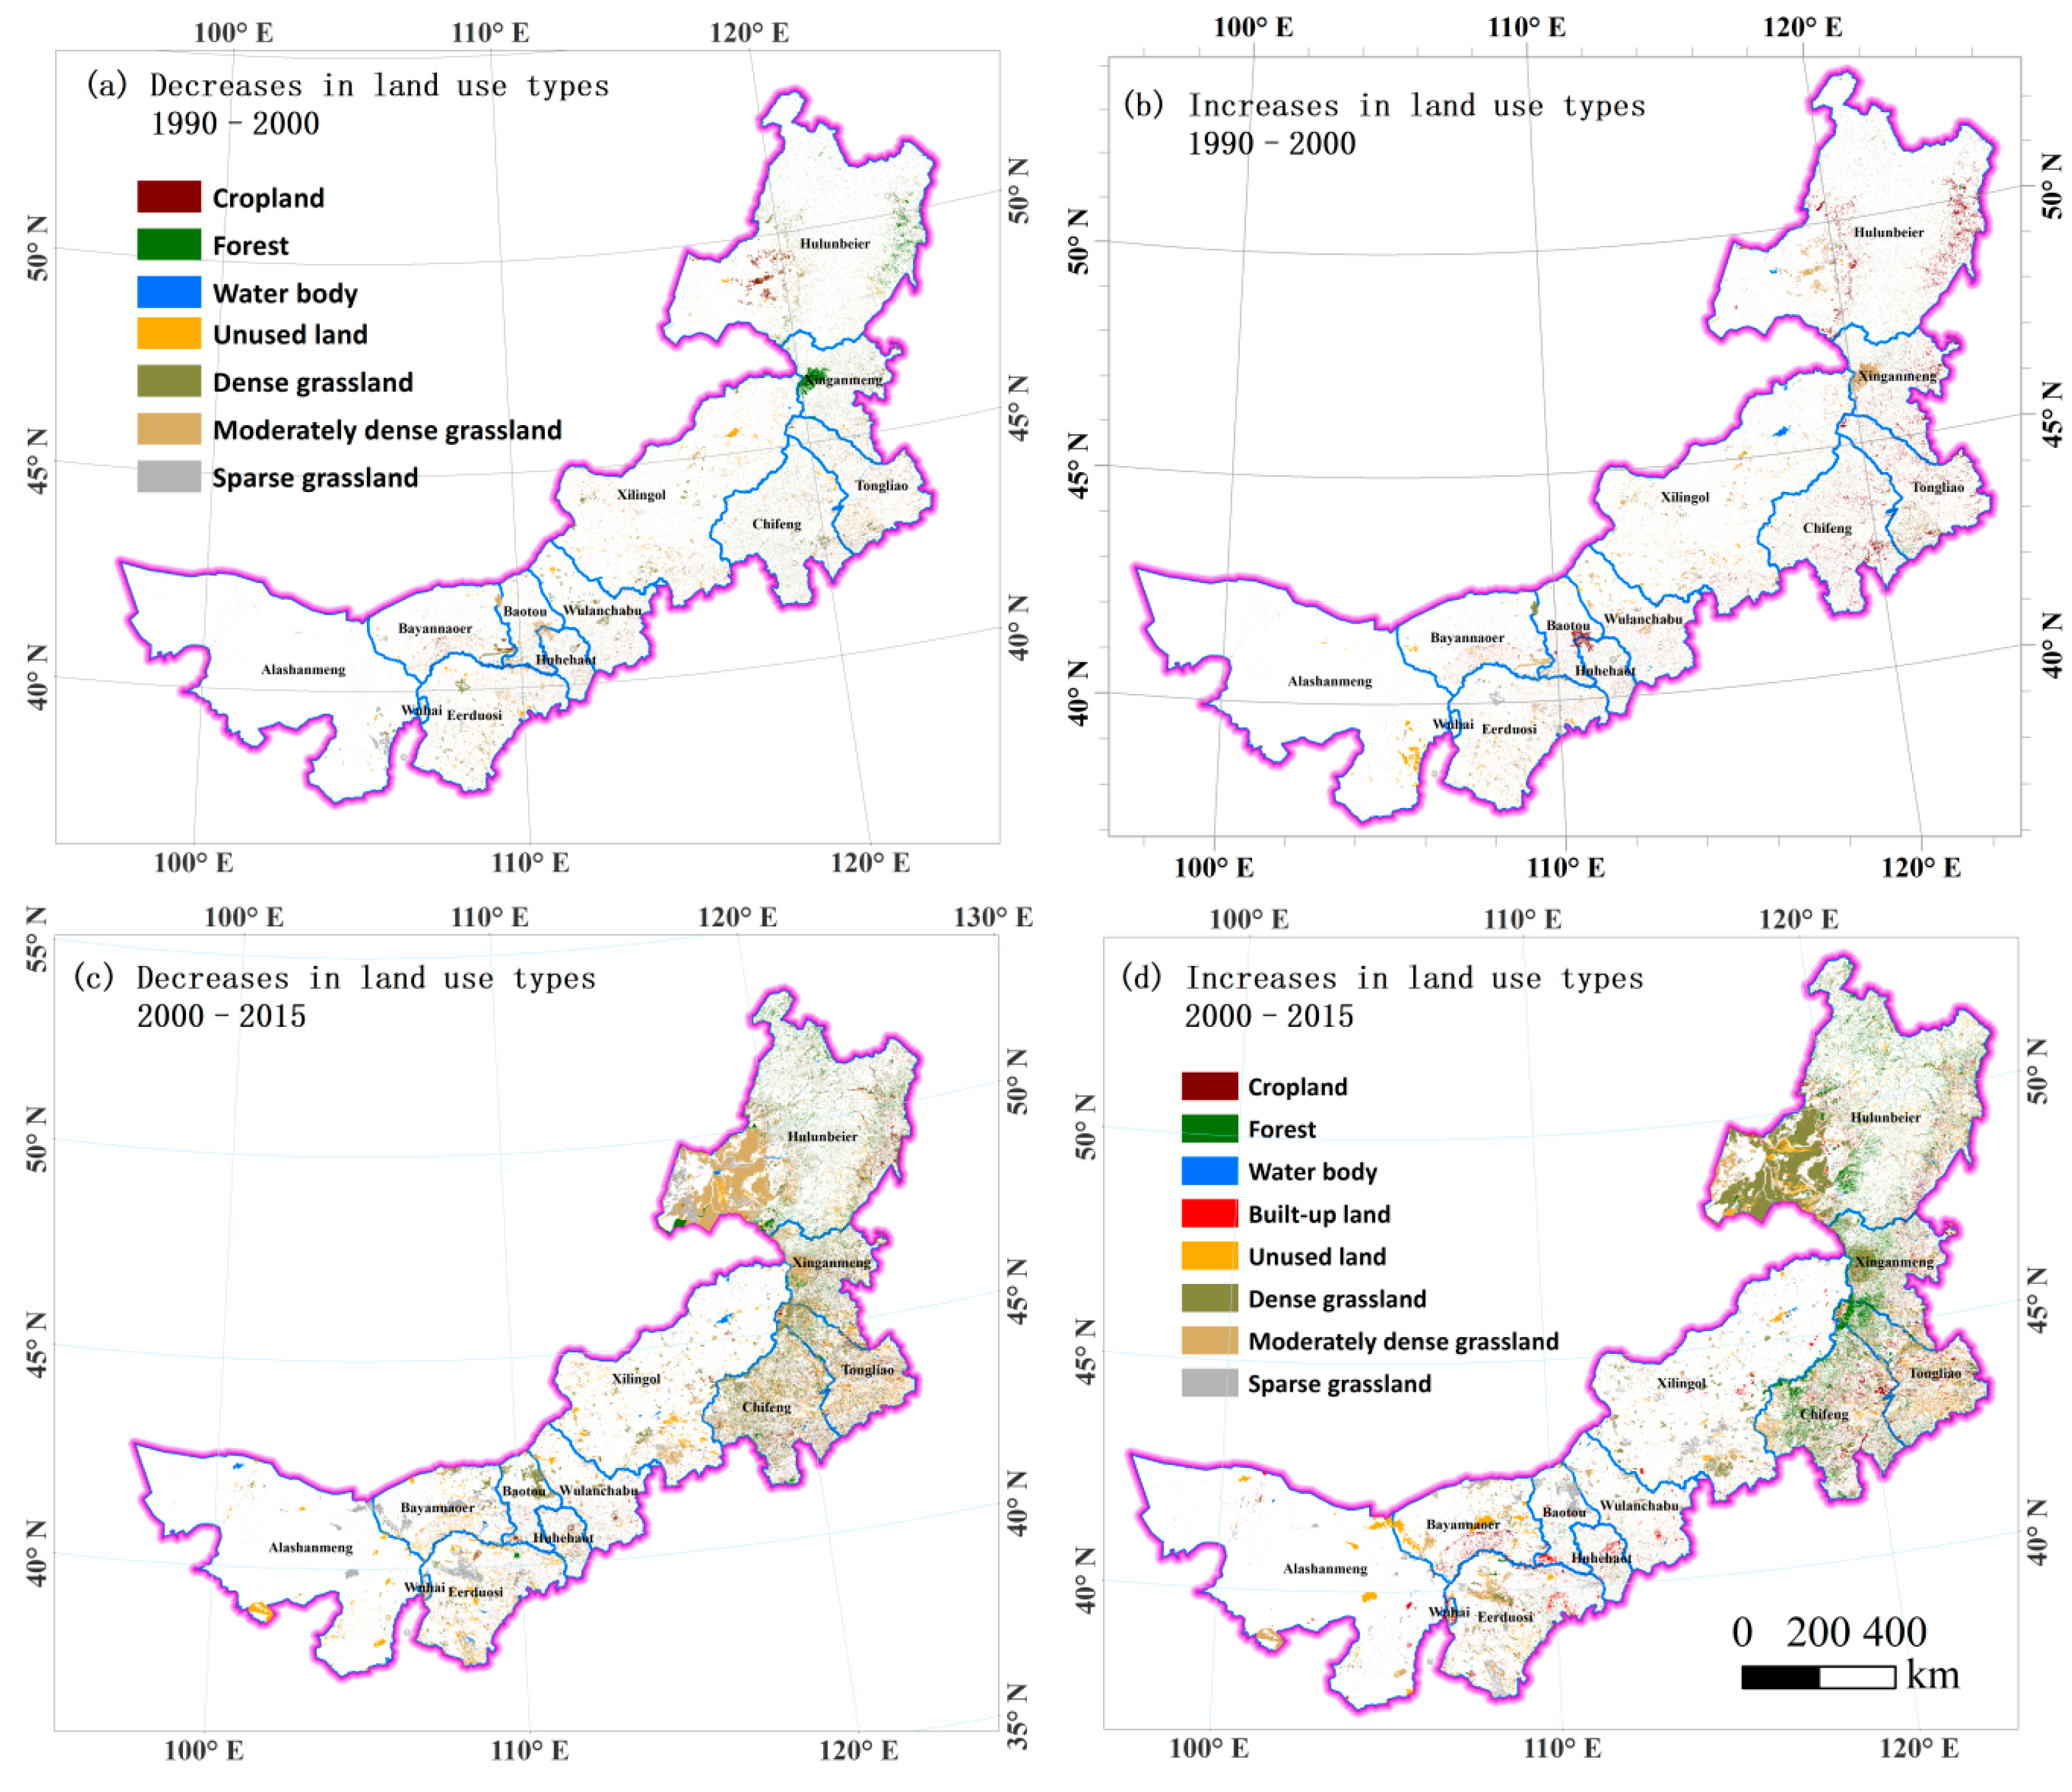
Grassland was the dominant land-use type (44.7% of total area) in 2015, followed by unused land and woodland (27.2% and 16.0% of the total area, respectively). In 1990–2015, 13% of the total area (123,445 km2), including eight land-use types, changed. Woodland increased the most (15,564.2 km2), followed by built-up land (7682.9 km2) and dense grassland (7338.5 km2). In the same period, moderately dense grassland decreased the most (31,123.4 km2), followed by sparse grassland (2184.5 km2), and changes of water bodies and unused land were less than 300 km2 (Figure 3). In this period, the most obvious changes occurred in the eastern and northeastern regions (i.e., Hulunbuir, Xinganmeng, Chifeng, and Tongliao), followed by the central region (i.e., the grassland region). In the west (i.e., the sandy land region), no strong land-use change happened (Figure 4). These results agree with previous studies.
3.1.2. Land-Use Conversion Since 1990
The land-use change patterns and processes are presented by a transition matrix and TPs (Table 2, Table 3 and Table 4), and the spatial characteristics of the LUCC conversion process are shown in Figure 5.
In 1990–2000, unused land was the most stable land-use type, with a TP of 97.91%, followed by woodland, with 95.34%. The most dynamic land-use type was water bodies, followed by cropland and dense grassland, with TPs of 92.2, 92.5, and 92.7%, respectively (Table 3).
Four land-use conversions in this period were identified, as follows. (1) 5804.3 km2 of grassland was converted into cropland (Table 2), with the biggest increases in cropland occurring in the central and eastern areas (Figure 5a,b). (2) Woodland areas decreased by 3840.9 km2, most commonly into cropland and grassland, and mostly in the eastern region. (3) Grassland areas decreased, with the conversion from dense grassland into cropland, moderately dense grassland, and sparse grassland being the most common transitions. In addition, moderately dense and sparse grasslands were converted into unused land. Most grassland loss occurred in the central and eastern areas of IM. (4) Finally, increases in built-up land predominantly occurred through changes from cropland and grassland.
When compared with the previous period, in 2000–2015, the TPs for all land-use types decreased, and human activity became stronger. Table 4 indicates that, in this period, water body and woodland were still the most stable land-use classes, with TPs of 92.0 and 88.4%, respectively. The most dynamic land-use types were moderately dense grassland and water body, with TPs of 65.1 and 69.6%, followed by sparse grassland and cropland, with TPs of 72.6 and 80%, respectively.
During this period, four obvious land-use conversion processes were identified. (1) Cropland decreased, mostly due to changes into woodland and grassland, especially dense and moderate grassland. This occurred predominantly in the central, northeastern, and eastern regions (Figure 5c,d). (2) Woodland increased, mostly through the conversion from cropland and grassland (especially dense grassland) and predominantly in the northeast and east of IM. (3) The total area of grassland increased. This mainly involved dense grassland and was generally through conversion from cropland, woodland, and moderately dense grassland. Moderately dense grassland and sparse grassland decreased, mostly due to changes into dense grassland, or from sparse to moderately dense grassland. (4) Built-up land increased by 6865.1 km2, mostly through changes from cropland and grassland throughout all cities in IM.
3.2. Grassland Degradation and Restoration since 1990
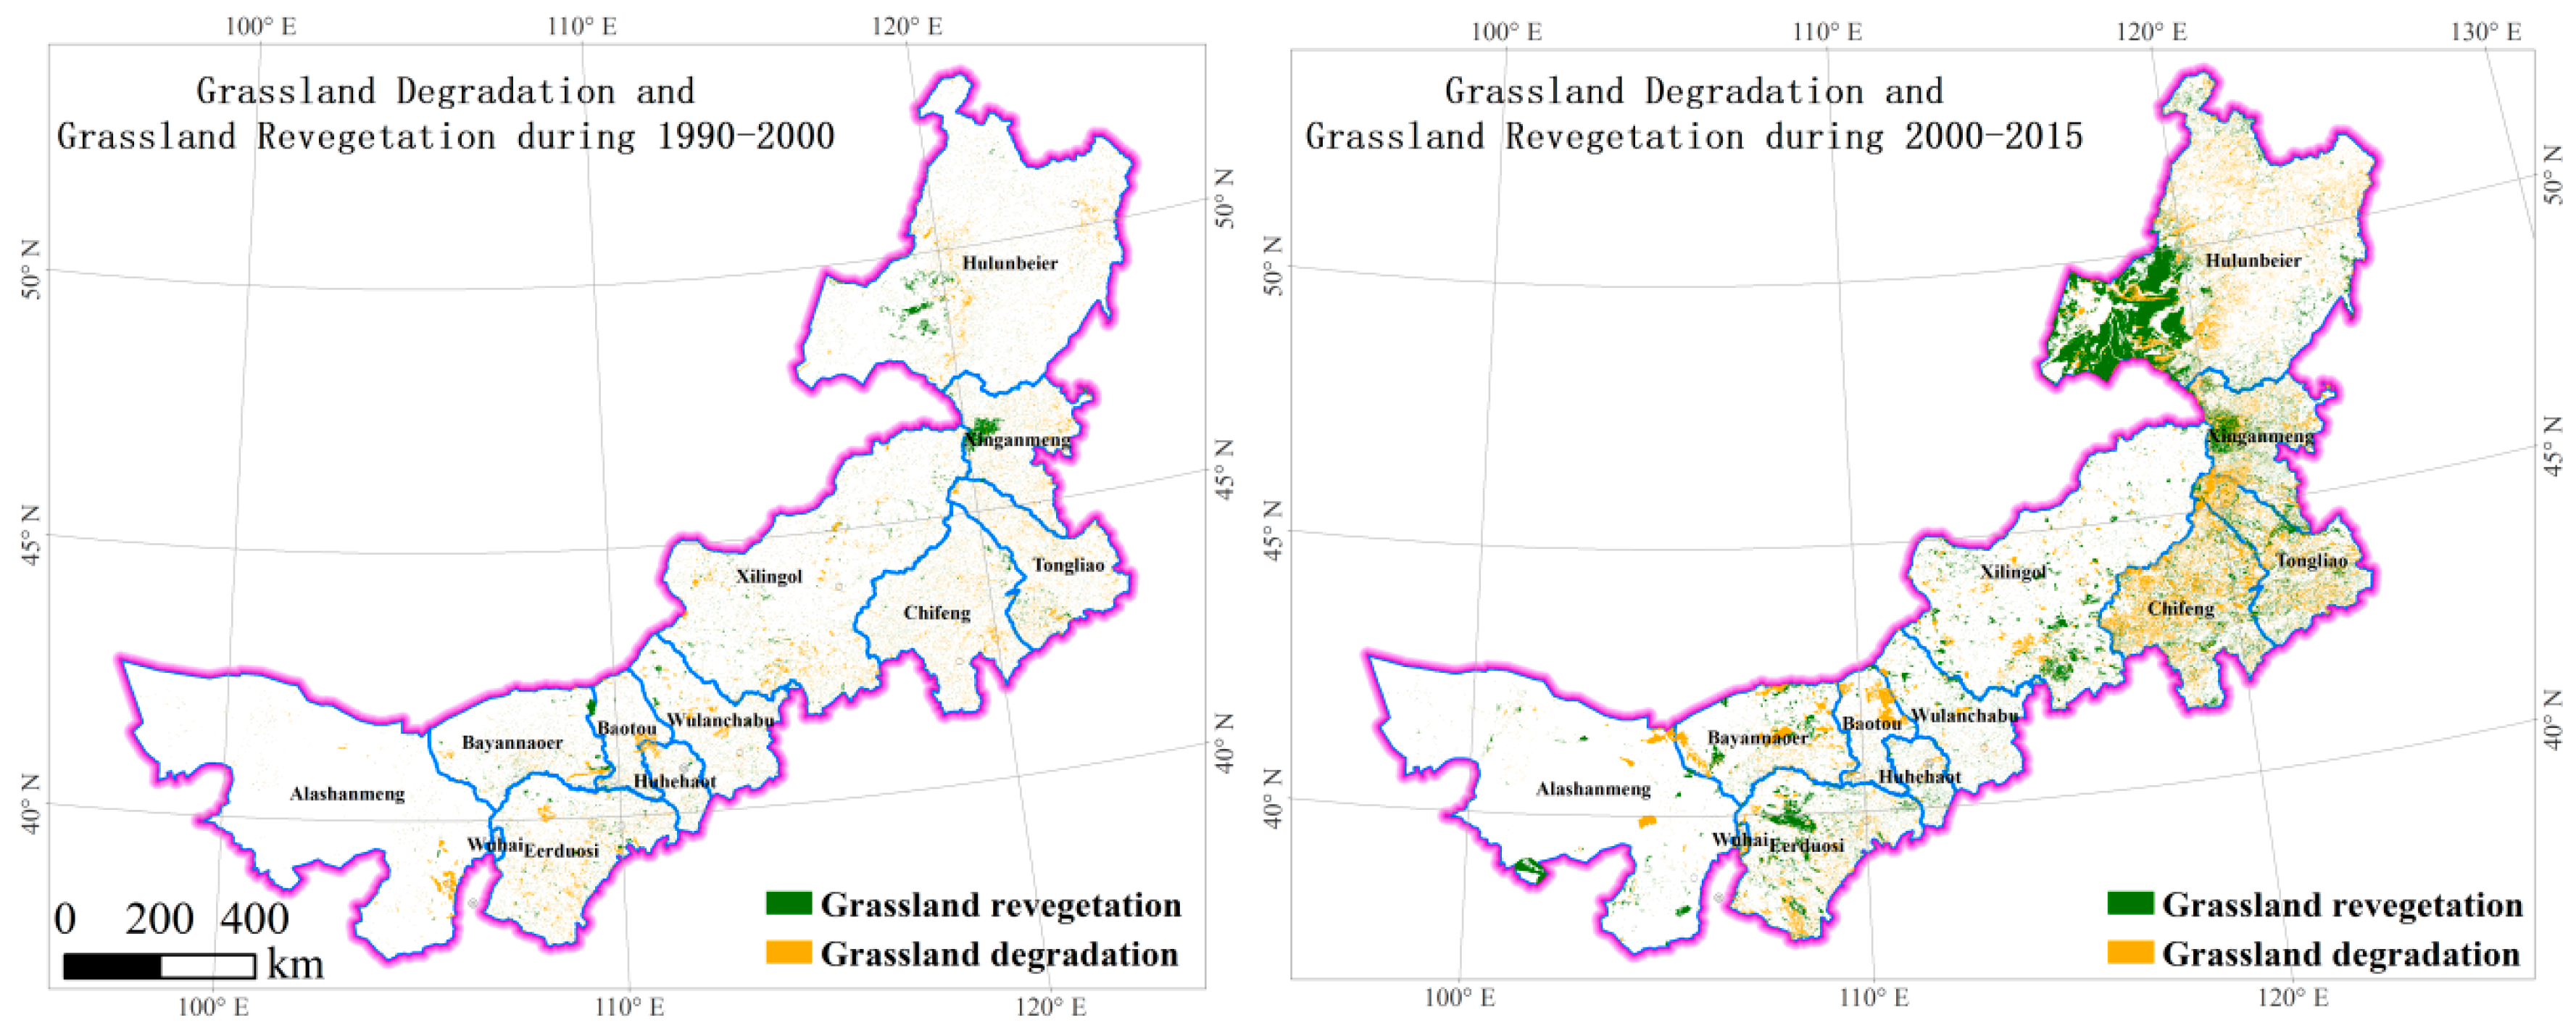
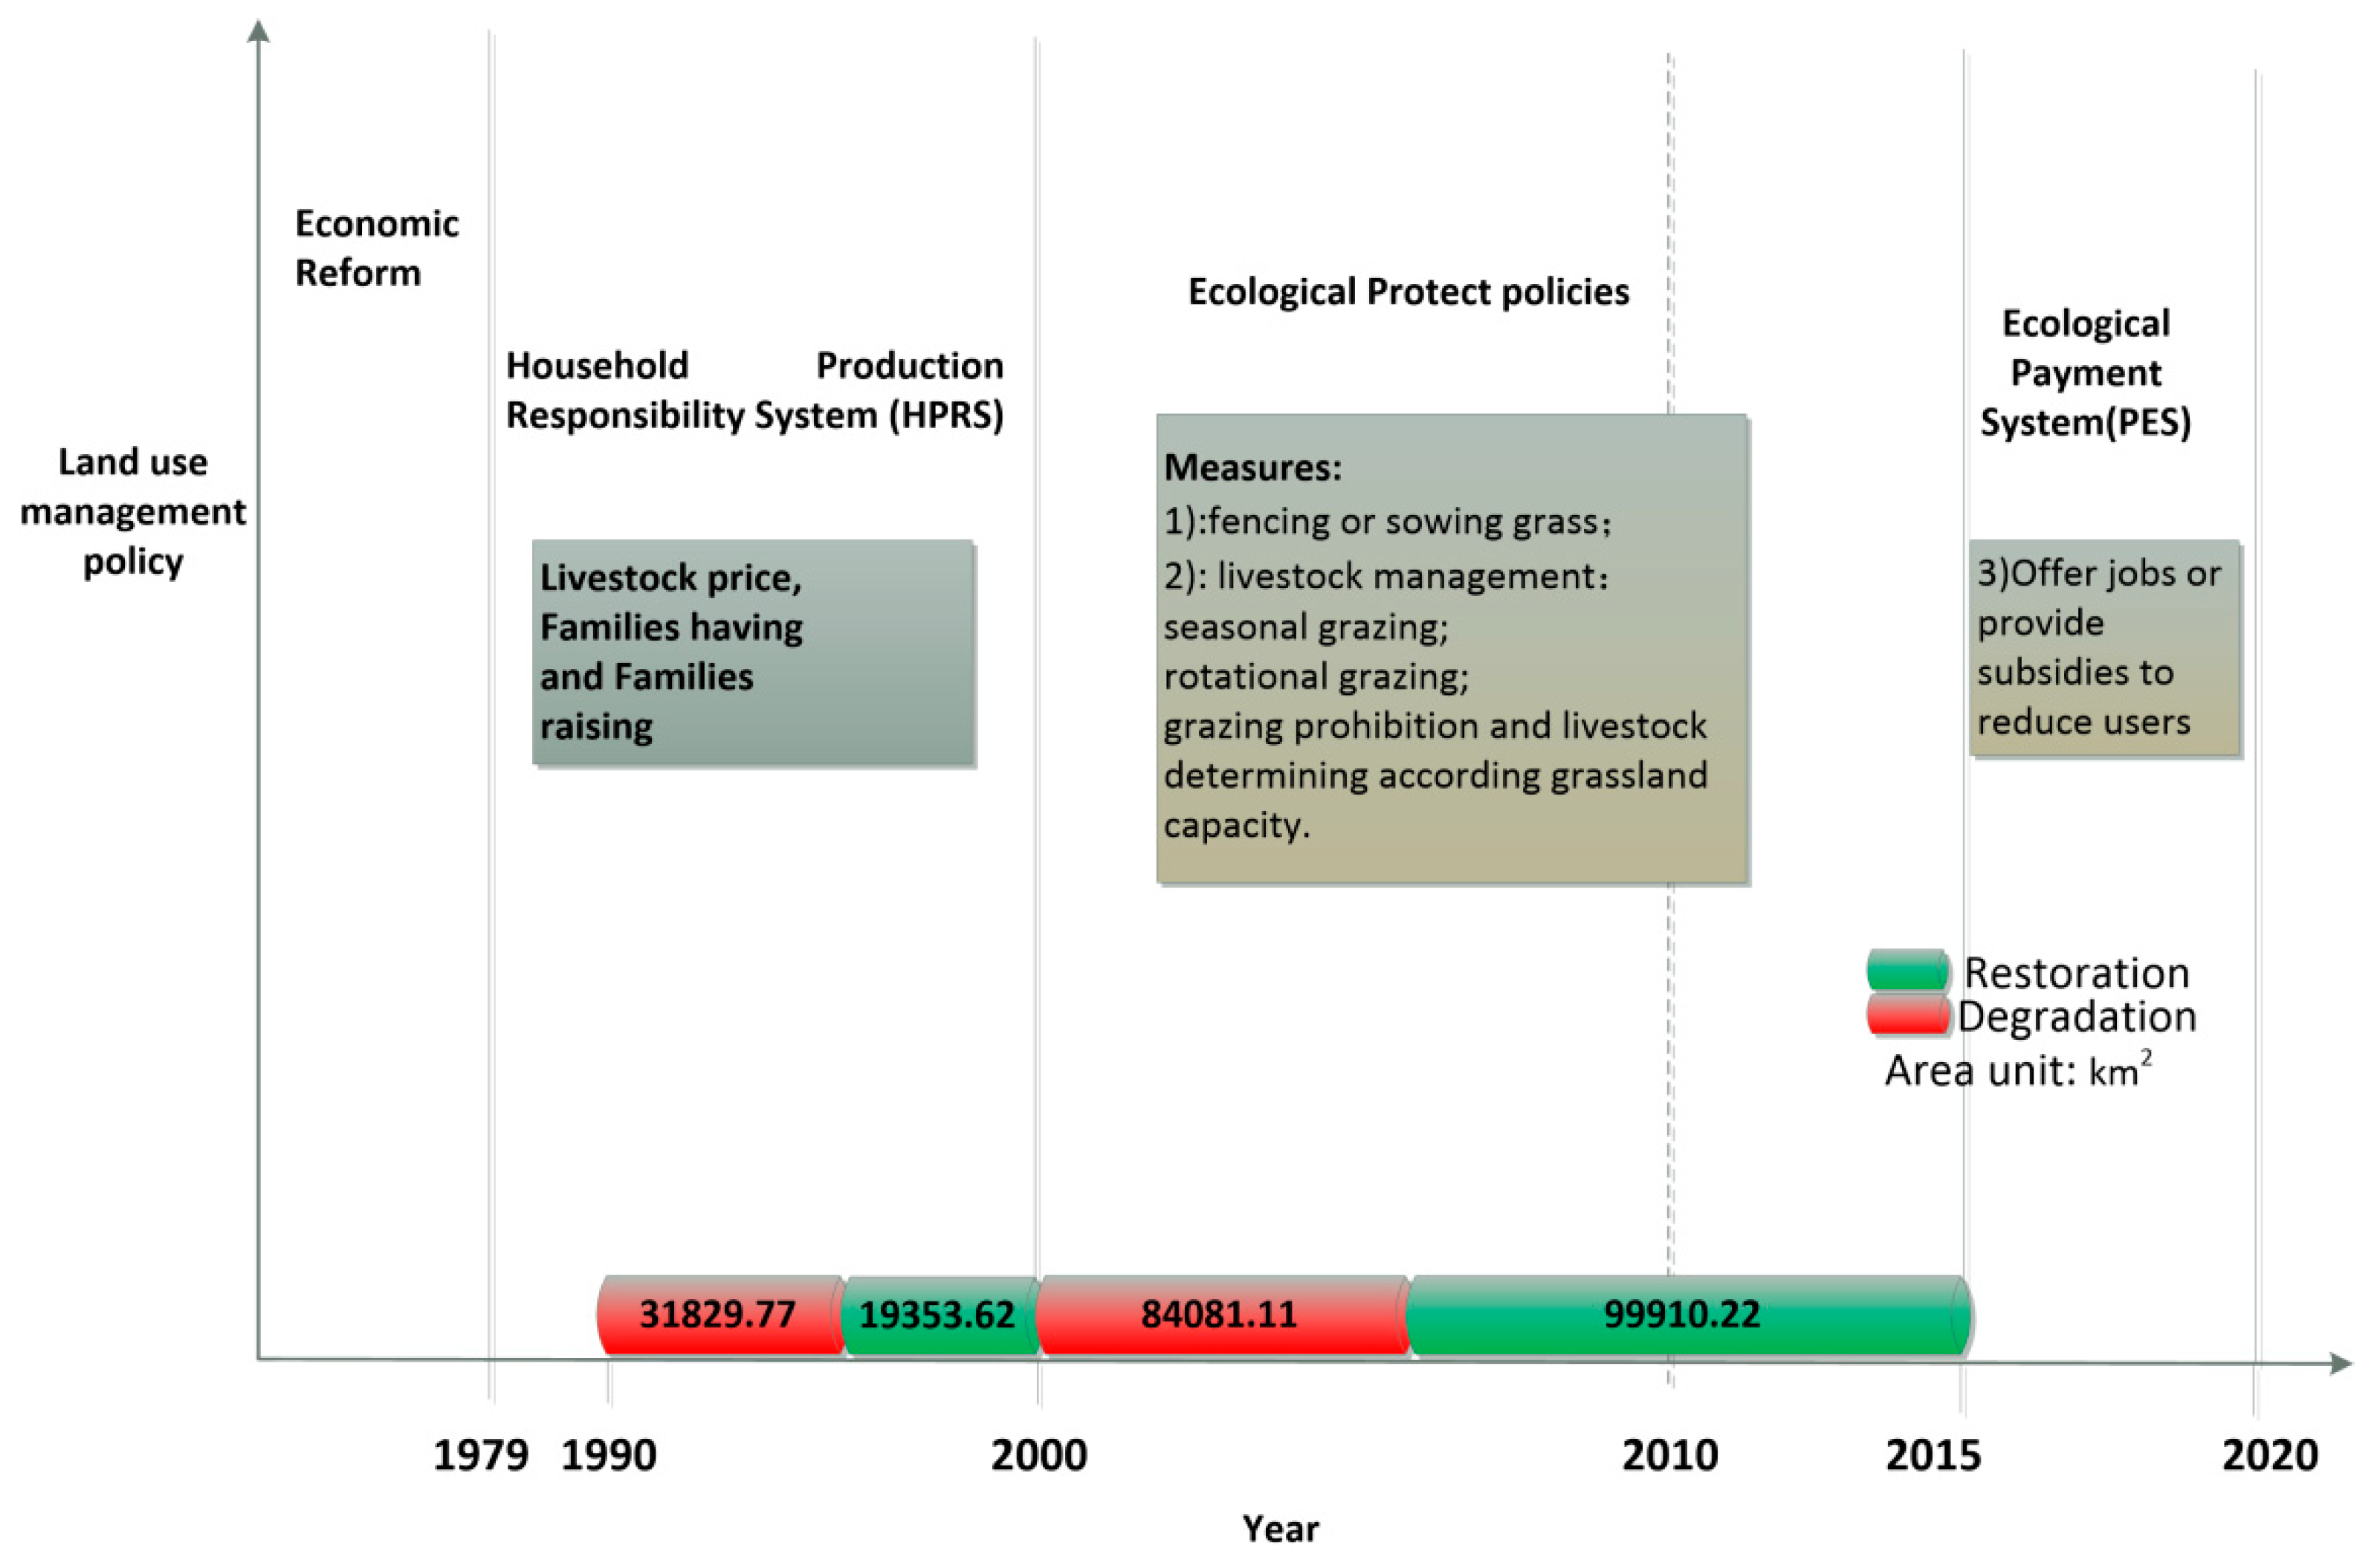
The spatiotemporal characteristics of grassland degradation and restoration are presented in Figure 6 and Figure 7. Before 2000, grassland exhibited an obvious degradation trend. 31,829.8 km2 (2.8% of the total area of IM) of grassland degraded in this period and 19,353.6 km2 was restored, of which 23,457.1 km2 changed to other land-use types. There was an 8273.6 km2 decrease in grassland coverage. The most obvious degradation occurred in the central, northeastern, and eastern areas of IM (Figure 7). While 15,262.5 and 4091.1 km2 of grassland and grassland coverage increased, respectively, the most obvious grassland restoration occurred in the northeastern and eastern regions. After 2000, the major grassland conversion process has been grassland restoration, with 99,910.2 km2 (8.7% of total area) of grassland restored and 84,081.1 km2 of grassland degraded. When compared with the previous period, the area of grassland degradation increased more drastically in this period. However, the area of grassland restoration also increased dramatically, mainly in the northeastern region (Figure 7).
3.3. Spatial Autocorrelation of LUCC in Inner Mongolia
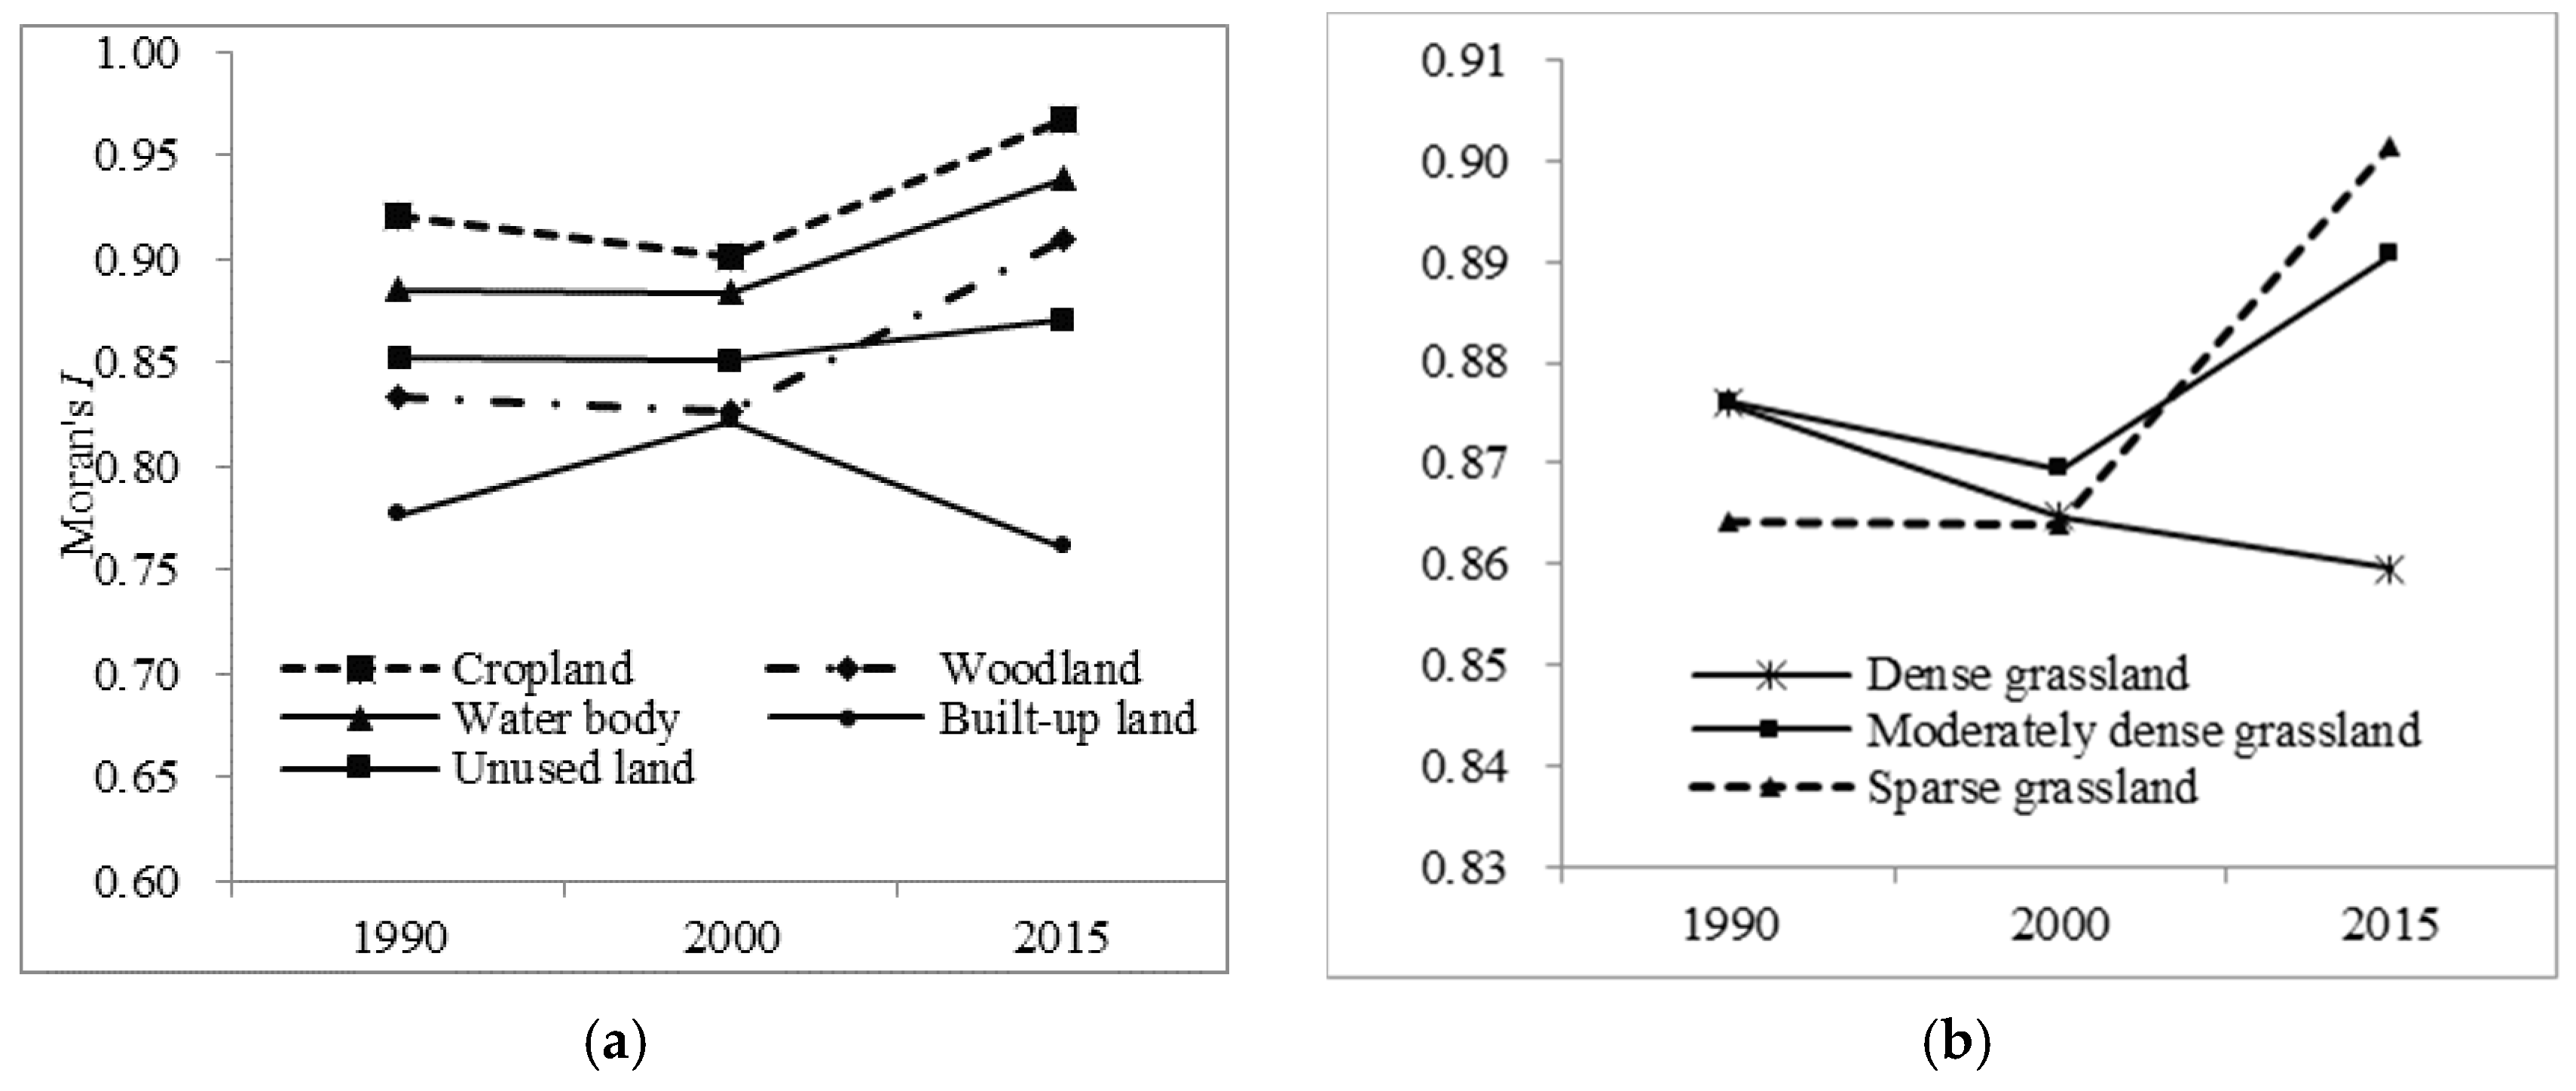
The Moran’s I values of all land-use types projecting spatial autocorrelation is presented in Figure 8. Figure 8a indicates that, before 2000, the Moran’s I values of cropland, woodland, and moderately dense grassland decreased slightly, while that of water bodies, unused land, and sparse grassland remained unchanged. Generally, during this period, the activities of these land-use types were relatively stable, with higher TPs (the lowest being 0.92). The Moran’s I of built-up land increased significantly, and that of dense grassland decreased significantly. This was mainly due to the increased built-up land in this period, while lots of dense grassland changed into cropland and moderately dense and sparse grassland. After 2000, the Moran’s I values showed opposite trends for cropland, water bodies, unused land, woodland, dense grassland, and sparse grassland, being mainly caused by land-use change activities becoming much stronger, while environmental protection policies were put in place. The Moran’s I values of built-up and dense grassland decreased, mainly due to economic development, such as urbanization and the mining industry [78]. Dense grassland suffered more consumption after 2000.
4. Discussion
Many previous researchers have shown that these policies have effectively curbed the grassland degradation trend to some extent [79,80]. Based on remote sensing data, Mu et al. [39] reported that, from 2001 to 2010, grassland increased by a total of 77,993 km2. Meanwhile, the total net primary productivity (NPP) of grassland increased by 29,432.71 Gg C year−1 during this period, for which human activities were responsible for about 80%. Shao et al. [41] indicated that vegetation restoration through environmental protection projects normally lags implementation by 1–2 years. Since 2002, about 72% of studies have reported that vegetation has been restored since the launch of environmental protection policies [76].
Climate change and overgrazing are believed to be the major drivers of grassland degradation in IM [27]. However, recent work has shown that policies that have led to the privatization of use rights and households have been the drivers of grassland degradation [26,76], and environmental protection policies have been the root cause of grassland degradation since 2000 [38,81]. In addition, institutional settings play a key role in shaping land-cover and land-use [47]. Based on this, we give a short review of the most important policies that are related to land-use changes and grassland conversion processes in IM.
4.1. Relationships between Land-Use Policy and Land Conversion before 2000
Our research shows that, during 1990 and 2000, the major land-use process was grassland degradation, mostly through changes to cropland and unused land resulting from cultivation and overgrazing. Specifically, 18.2% of the current cropland has been converted from grasslands in China [28].
Economic reform began at the end of the 1970s, when cropland demand in China increased dramatically to feed the large population and support the agricultural industry. At the same time, there was immigration of the Han people to IM. Jiang et al. [32] indicated that the total population of IM increased almost five-fold from 1940 to 2000. During this period, a large amount of grassland (especially high-quality, dense grassland) changed into cropland. Since 1949, a set of property arrangements for livestock and grassland, of which the Household Production Responsibility System (HPRS) was the most important, has been carried out (see Figure 9). The HPRS has totally changed the lifestyle of herders from nomadic to settled, as well the property rights of grassland and livestock from collective to privatized [38]. The objective of the HPRS is to promote animal husbandry and protect the environment. However, due to the livestock being owned privately, overgrazing has caused wide land degradation in IM [76]. As Zhangqian et al. [38] noted, the HPRS has not achieved its goal (i.e., economic development and protected grassland), as the area of grassland increased degradation from 48.6% (of all available grassland) in 1984 to 64% in 1999. The vegetation coverage decreased from 35 to 27.2%, and the average biomass decreased from 509 to 320 kg per hectare. Taking Xilingol League as an example, the number of livestock increased from 12.6 million in 1980 to 22.7 million in 1997, while the grazing capacity (per sheep unit) of grasslands decreased from 1.42 ha in 1980 to 1.05 ha in 1990 [82]. Li et al. [82] indicated that, without property rights, environmental problems will remain. Obviously, the HPRS has led to further land degradation in IM. Fortunately, previous researchers indicated a new mechanism of stock breed: small-scale co-management, which should be encouraged in the future [82].
4.2. Relationship between Land-Use Policy and Land Conversion after 2000
This present study indicates that, after 2000, grassland restoration was the major land-use conversion process (99,910 km2). Most of the increased grassland was converted from cropland and unused land, and the area of high-coverage grassland increased during this period.
Before 2000, there were some grassland protection policies. For example, the first grassland law, the Rangeland Law, was created in 1986 and was amended in 2003, and this was the first step in improving and protecting the condition of grasslands (see Table 5) [28,83]. Following a serious drought in 1997 and a massive flood in 1998, additional protection policies were launched in China. These policies include two general measurement categories for grassland protection: (1) conversion from other land-use types (for example, cropland and desert to grassland) and (2) livestock management and the reduction of users (see Table 5 and Figure 9).
The protection policies regarding the conversion of grassland from other land-use types are the Grain to Green Program (GGP) and the Beijing–Tianjin Sand Source Control Engineering Project (BTSSC). GGP (also known as the Conversion of Cropland to Forest and Grassland Program) was implemented between 1999 and 2010. It is the largest environmental policy in western and central China (covering 82% of the total area of China) and is closely related to land-use and land-cover change [84,88]. The objectives of this policy were to plant trees and sow grass on steep slopes to increase vegetation coverage [89]. The current study indicates that a total of 12,006 km2 of cropland has been converted into grassland since 2000 (see Table 2). Statistical data in the Inner Mongolia Year Book also indicate that the planted grassland area increased by 132.5 hma from 1999 to 2010 [39]. On the whole, the speed of grassland reclamation has decreased since GGP was launched in IM [39]. BTSSC has been implemented since 2001. The aim of this project is to control the desertification of Beijing and its surroundings [90]. Our study indicates that 17,984 km2 of unused land has been changed into grassland (see Table 2). Based on remote sensing data, Wu et al. [91] showed that, in the BRSSC area, vegetation has experienced the most human-induced improvement, and environmental programs (such as enclosing grassland) are the main human activity. These were therefore implicated in the conversion of grassland and woodland from cropland in IM after 2000.
Policies covering livestock management include the Return Grazing to Grassland Program (RGGP), Fencing Grassland and Moving Users (FGMU), and Payments for Environmental Services (PES) (see Figure 9). RGGP, which was carried out between 2002 and 2010 in China, aimed to mitigate grazing pressure in northern China through the implementation of various measures. For seriously degraded areas, free grazing and fencing are necessary. For moderately and slightly degraded areas, livestock management measures (grazing rotation, seasonal enclosures) are necessary [39,92]. The present study shows that grassland coverage increased by 57,169 km2 since 2000 (see Table 2). FGMU was implemented between 2001 and 2008, and the objective of this policy was to restore degraded grassland by forbidding grazing in the short term or annually. Han et al. [91] reported that most of the grassland improvement since 2000 has been due to fencing. Jiang et al. [32] also indicated that degraded grassland after fencing can be restored naturally. PES has been implemented in China since 2001, with the major aim of achieving a win-win situation in terms of ecological restoration and poverty alleviation [86]. The major measure of PES is the engagement of millions of households as core agents of the project [47]. Taking the largest PES policies—the Sloping Land Conversion Program (SLCP) and Fencing Grassland and Moving Users (FGMU)—as examples, many studies have noted that these policies have improved environmental conditions [47,93]. PES was developed as a primary policy for environmental protection [94].
Indeed, grassland has experienced obvious restoration in IM, and these ecological policies and programs have also contributed significantly to land-use change activities (with lower TPs in this study). This is in accordance with many previous studies [22,42,92,95]. However, land degradation is still the major ecological issue in IM [4]. Mu et al. [39] indicated that the number of livestock increased from 73.35 million heads in 2001 to 107.99 million heads in 2010. During the same period, the amount of available grassland decreased due to fencing and grazing bans. Livestock intensity increased, and the grazing pressure was not alleviated. Liu et al. [21] reported that grassland coverage has increased by 3% since 2000, with 0.4% of that between 2014 and 2015. Moreover, more than one-third of grassland is still degraded. Batunacun et al. [4] indicated that a long-term environmental protection policy should be implemented in pastoral areas. At the same time as removing users of grassland and offering job opportunities in cities, the development of an intensive livestock industry should also be encouraged. A more flexible protection policy, combined with various grassland conditions, should be considered in future grassland development in IM [20].
In the present study, we have redefined the definition of grassland and analyzed grassland degradation processes based on land-use conversion. We have also analyzed the relationship between different land-use conversion processes and possible land-use management policy. Policy as a indirect driver can showed significant effect on other direct drivers, for example, policy showed important influence on demographic factors, technique factor, economic et al. [11], as well land management method, take Brazilian Amazon area as an example, PPCDAm have control over the deforestation rate via expanded protected area, improved morning and enforced laws, implemented soy and cattle moratorium agreed [35]. PPCDAm have control the soy expansion and cattle ranching and decreased the deforestation rate in Amazon area. Analyzing the association between policy and land use conversion patterns has provided a quantitative view to evaluate policy effects, at the same time, this evaluation also provide more information about combat degradation for decision makers. In the future, combining this method of analysis with land-use modeling, making predictions of land-use change based on ideal policy scenarios, or using policy free scenarios to make a quantitative evaluation of policy effects can be done in other scenarios and not just in China.
5. Conclusions
This study identified the patterns and processes of land-use and land-cover change in Inner Mongolia from 1990 to 2015 using long-term remote sensing data from a combination of a transition matrix, Markov chain, and Moran’s I methods. Grassland degradation and restoration was also investigated with an LUCC analysis. The major results were as follows.
- (1)
- In 1990–2015, land-use changed dramatically in IM (i.e., in 13% or 123,445 km2 of the total area, including eight land-use types). Woodland increased the most, followed by built-up land and dense grassland. Moderately dense grassland decreased the most, followed by sparse grassland. The changes in water bodies and unused land covered less than 300 km2. The most obvious changes occurred in the eastern and northeastern regions.
- (2)
- During the first period (1990–2000), all land-use change activities were relatively stable, with TPs of at least 0.92. Before 2000, most of the increased cropland was converted from grassland, and the grassland coverage decreased. In contrast, in 2000–2015, land-use change activities became stronger as compared to before 2000 due to decreased TPs of all land-use types. The major land-use processes in this period were increased grassland area and improved coverage.
- (3)
- The trend of grassland degradation was prevented after 2000. Before 2000, grassland degradation (in 31,829.8 km2 or 2.8% of the total area of Inner Mongolia) was the major grassland change process. After 2000, the major grassland conversion process was restoration, and 99,910.2 km2 (8.7% of the total area) of grassland was restored.
- (4)
- The Moran’s I values of most land-use types in IM increased after 2000, and the land-use change activities became much stronger. The spatial autocorrelations of land-use type and land-use change modes were highly related to the environmental protection policies, especially after 2000.
In this study, the results have indicated that important policies have a significant effect on land-use change, especially grassland degradation and restoration. Before 2000, under the stimulation of economic development policies (i.e., economic reform and HPRS; see Table 5 and Figure 9), population and livestock have increased. This led to cropland expansion at expense of grassland shrinkage and grassland degradation. For example, the grazing capacity and the average biomass decreased, and the grassland coverage decreased significantly in this period. After 2000, grassland was obviously restored. The central and local government have launched a set of ecological policies to combat degradation. The important measures in IM generally are summarized as reducing users, controlling livestock pressure, etc. Corresponding to these environmental policies, the grassland was also restored after 2000. The grassland restoration process can be grouped into the grassland coverage increased and the grassland area increased (i.e., other land-use types changed into grassland) in this study. Ecological conditions have improved in IM to some extent; however, degradation is still an important issue. Even with a set of policies with different measures to control livestock, overgrazing still occurred after 2000 in IM. Many previous studies also showed that not all the ecological policies worked effectively in IM. For example, previous studies [96,97] indicated that fencing policies limit animal mobility, leading livestock to be unable to temporarily move to better grassland resources and water. Hence, fencing led to further grassland degradation and poverty. For other ecological policies, more stable and long-term continued policies should be enforced to encourage the sustainable development of grasslands in the future.
Author Contributions
Y.H. designed and supervised the research. B.N. performed the experiments and preliminarily analyzed the results; and all authors drafted and revised the paper.
Funding
This research was funded by [Strategic Priority Research Program of Chinese Academy of Sciences] grant number [XDA19040301, XDA20010202], [National Key Research and Development Plan Program in China] grant number [2016YFC0503701, 2016YFB0501502], and [Key Project of High Resolution Earth Observation System in China] grant number [00-Y30B14-9001-14/16].
Acknowledgments
We would like to give thanks to the two anonymous referees and all editors who provided great suggestions for this study.
Conflicts of Interest
The authors declare no conflict of interest.
References
- Lin, Y.; Deng, X.; Li, X.; Ma, E. Comparison of multinomial logistic regression and logistic regression: Which is more efficient in allocating land use? Front. Earth Sci. 2014, 8, 512–523. [Google Scholar] [CrossRef]
- Verburg, P.H.; Chen, Y. Spatial explorations of land use change and grain production in China. Agric. Ecosyst. Environ. 2000, 82, 333–354. [Google Scholar] [CrossRef]
- Verburg, P.H.; Kok, K.; Pontius, R.G.; Veldkamp, A. Modeling Land-Use and Land-Cover Change. In Land-Use and Land-Cover Change; Lambin, E.F., Geist, H., Eds.; Springer: Berlin/Heidelberg, Germany, 2006; pp. 117–135. ISBN 978-3-540-32201-6. [Google Scholar]
- Nendel, C.; Hu, Y.; Lakes, T. Land-use change and land degradation on the Mongolian Plateau from 1975 to 2015—A case study from Xilingol, China. Land Degrad. Dev. 2018, 29, 1595–1606. [Google Scholar] [CrossRef]
- Hu, Y. An Analysis of Land-Use and Land-Cover Change in the Zhujiang–Xijiang Economic Belt, China, from 1990 to 2017. Appl. Sci. 2018, 8, 1524. [Google Scholar] [CrossRef]
- Liu, J.; Liu, M.; Tian, H.; Zhuang, D.; Zhang, Z.; Zhang, W.; Tang, X.; Deng, X. Spatial and temporal patterns of China’s cropland during 1990–2000: An analysis based on Landsat TM data. Remote. Sens. Environ. 2005, 98, 442–456. [Google Scholar] [CrossRef]
- Trisurat, Y.; Shrestha, R.P.; Alkemade, R. (Eds.) Land Use, Climate Change and Biodiversity Modeling: Perspectives and Applications; IGI Global: Hershey, PA, USA, 2011; ISBN 978-1-60960-619-0. [Google Scholar]
- Taylor, C.M.; Lambin, E.F.; Stephenne, N.; Harding, R.J.; Essery, R.L.H. The Influence of Land Use Change on Climate in the Sahel. J. Clim. 2002, 15, 3615–3629. [Google Scholar] [CrossRef]
- Bathrellos, G.; Skilodimou, H.; Soukis, K.; Koskeridou, E. Temporal and Spatial Analysis of Flood Occurrences in the Drainage Basin of Pinios River (Thessaly, Central Greece). Land 2018, 7, 106. [Google Scholar] [CrossRef]
- Yang, D.; Kanae, S.; Oki, T.; Koike, T.; Musiake, K. Global potential soil erosion with reference to land use and climate changes. Hydrol. Process. 2003, 17, 2913–2928. [Google Scholar] [CrossRef]
- Lambin, E.F.; Geist, H.J.; Lepers, E. Dynamics of Land-Use and Land-Cover Change in Tropical Regions. Annu. Rev. Environ. Resour. 2003, 28, 205–241. [Google Scholar] [CrossRef]
- Miao, L.; Zhu, F.; Sun, Z.; Moore, J.C.; Cui, X. China’s Land-Use Changes during the Past 300 Years: A Historical Perspective. Int. J. Environ. Res. Public Health 2016, 13. [Google Scholar] [CrossRef] [PubMed]
- Miao, L.; Zhu, F.; He, B.; Ferrat, M.; Liu, Q.; Cao, X.; Cui, X. Synthesis of China’s land use in the past 300 years. Glob. Planet. Chang. 2013, 100, 224–233. [Google Scholar] [CrossRef]
- Bain, I. Sustainable Development in Western China: Managing People, Livestock and Grasslands in Pastoral Areas. Colin G. Brown, Scott A Waldron, John W. Longworth. Cheltenham, United Kingdom. Edward Elgar. 2008. xvii + 294 pp £ 69.95. ISBN: 1-84542-744-0. Mt. Res. Dev. 2010, 30, 59–60. [Google Scholar] [CrossRef]
- Akiyama, T.; Kawamura, K. Grassland degradation in China: Methods of monitoring, management and restoration. Grassl. Sci. 2007, 53, 1–17. [Google Scholar] [CrossRef]
- Liu, L.; Zhang, Y.; Bai, W.; Yan, J.; Ding, M.; Shen, Z.; Li, S.; Zheng, D. Characteristics of grassland degradation and driving forces in the source region of the Yellow River from 1985 to 2000. J. Geogr. Sci. 2006, 16, 131–142. [Google Scholar] [CrossRef]
- Zhang, X.; Niu, J.; Buyantuev, A.; Zhang, Q.; Dong, J.; Kang, S.; Zhang, J. Understanding grassland degradation and restoration from the perspective of ecosystem services: A case study of the Xilin river basin in Inner Mongolia, China. Sustainability 2016, 8, 1–17. [Google Scholar] [CrossRef]
- Kim, E.-S.; Park, D.K.; Zhao, X.; Hong, S.K.; Koh, K.S.; Suh, M.H.; Kim, Y.S. Sustainable management of grassland ecosystems for controlling Asian dusts and desertification in Asian continent and a suggestion of Eco-Village study in China. Ecol. Res. 2006, 21, 907–911. [Google Scholar] [CrossRef]
- Wang, X.; Bennett, J. Policy analysis of the Conversion of Cropland to Forest and Grassland Program in China. Environ. Econ. Policy Stud. 2008, 9, 119–143. [Google Scholar] [CrossRef]
- Li, Y.; Wang, Y.; Schwarze, R. Pathways to Sustainable Grassland Development in China, Findings of Three Case Studies. UFZ Discussion Papers, January 2014. [Google Scholar]
- Liu, M.; Dries, L.; Heijman, W.; Huang, J.; Zhu, X.; Hu, Y.; Chen, H. The Impact of Ecological Construction Programs on Grassland Conservation in Inner Mongolia, China. Land Degrad. Dev. 2018, 29, 326–336. [Google Scholar] [CrossRef]
- Li, S.; Verburg, P.H.; Lv, S.; Wu, J.; Li, X. Spatial analysis of the driving factors of grassland degradation under conditions of climate change and intensive use in Inner Mongolia, China. Reg. Environ. Chang. 2012, 12, 461–474. [Google Scholar] [CrossRef]
- Xie, Y.; Sha, Z. Quantitative Analysis of Driving Factors of Grassland Degradation: A Case Study in Xilin River Basin, Inner Mongolia. Sci. World J. 2012, 2012. [Google Scholar] [CrossRef] [PubMed]
- Ying, L.; Ruimin, H. Grazing resource management and grassland degradation in Northern China. J. Resour. Ecol. 2011, 2, 286–288. [Google Scholar] [CrossRef]
- Zhou, W.; Gang, C.; Zhou, L.; Chen, Y.; Li, J.; Ju, W.; Odeh, I. Dynamic of grassland vegetation degradation and its quantitative assessment in the northwest China. Acta Oecol. 2014, 55, 86–96. [Google Scholar] [CrossRef]
- Thwaites, R.; de Lacy, T.; Hong, L.Y.; Hua, L.X. Property rights, social change, and grassland degradation in Xilingol Biosphere Reserve, Inner Mongolia, China. Soc. Nat. Resour. 1998, 11, 319–338. [Google Scholar] [CrossRef]
- Cao, J.; Yeh, E.T.; Holden, N.M.; Qin, Y.; Ren, Z. The Roles of Overgrazing, Climate Change and Policy as Drivers of Degradation of China’s Grasslands. Nomadic Peoples 2013, 17, 82–101. [Google Scholar] [CrossRef]
- Han, J.G.; Zhang, Y.J.; Wang, C.J.; Bai, W.M.; Wang, Y.R.; Han, G.D.; Li, L.H. Rangeland degradation and restoration management in China. Rangel. J. 2008, 30, 233. [Google Scholar] [CrossRef]
- Li, W.; Huntsinger, L. China’s Grassland Contract Policy and its Impacts on Herder Ability to Benefit in Inner Mongolia: Tragic Feedbacks. Ecol. Soc. 2011, 16. [Google Scholar] [CrossRef]
- Liu, M. China’s Grassland Policies and the Inner Mongolian Grassland System. Ph.D. Thesis, Wageningen University, Wageningen, The Netherlands, 2017. [Google Scholar]
- Du, B.; Zhen, L.; Yan, H.; de Groot, R. Effects of Government Grassland Conservation Policy on Household Livelihoods and Dependence on Local Grasslands: Evidence from Inner Mongolia, China. Sustainability 2016, 8, 1314. [Google Scholar] [CrossRef]
- Jiang, G.; Han, X.; Wu, J. Restoration and Management of the Inner Mongolia Grassland Require a Sustainable Strategy. AMBIO J. Hum. Environ. 2006, 35, 269–270. [Google Scholar] [CrossRef]
- Lambin, E.F.; Turner, B.L.; Geist, H.J.; Agbola, S.B.; Angelsen, A.; Bruce, J.W.; Coomes, O.T.; Dirzo, R.; Fischer, G.; Folke, C. The causes of land-use and land-cover change: Moving beyond the myths. Glob. Environ. Chang. 2001, 11, 261–269. [Google Scholar] [CrossRef]
- Zhao, J.; Pu, F.; Li, Y.; Xu, J.; Li, N.; Zhang, Y.; Guo, J.; Pan, Z. Assessing the combined effects of climatic factors on spring wheat phenophase and grain yield in Inner Mongolia, China. PLoS ONE 2017, 12, e0185690. [Google Scholar] [CrossRef] [PubMed]
- Jepson, P.; Jarvie, J.K.; MacKinnon, K.; Monk, K.A. The end for Indonesia’s lowland forests? 2001, 292, 859–861. [Google Scholar] [CrossRef] [PubMed]
- Gollnow, F.; Lakes, T. Policy change, land use, and agriculture: The case of soy production and cattle ranching in Brazil, 2001–2012. Appl. Geogr. 2014, 55, 203–211. [Google Scholar] [CrossRef]
- Fischer, B.; Klauer, B.; Schiller, J. Prospects for sustainable land-use policy in Germany: Experimenting with a sustainability heuristic. Ecol. Econ. 2013, 95, 213–220. [Google Scholar] [CrossRef]
- Fischer, B.; Jöst, F.; Klauer, B. Is a Sustainable Land-Use Policy in Germany Possible; University of Heidelberg: Heidelberg, Germany, 2009. [Google Scholar]
- Akram, M.; Qian, Z.; Wenjun, L. Policy Analysis in Grassland Management of Xilingol Prefecture, Inner Mongolia. In The Future of Drylands; Lee, C., Schaaf, T., Eds.; Springer: Dordrecht, The Netherlands, 2009; pp. 493–505. ISBN 978-1-4020-6969-7. [Google Scholar]
- Mu, S.; Zhou, S.; Chen, Y.; Li, J.; Ju, W.; Odeh, I.O.A. Assessing the impact of restoration-induced land conversion and management alternatives on net primary productivity in Inner Mongolian grassland, China. Glob. Planet. Chang. 2013, 108, 29–41. [Google Scholar] [CrossRef]
- Zhan, J.; Shi, N.; He, S.; Lin, Y. Factors and mechanism driving the land-use conversion in Jiangxi Province. J. Geogr. Sci. 2010, 20, 525–539. [Google Scholar] [CrossRef]
- Shao, L.; Chen, H.; Zhang, C.; Huo, X. Effects of Major Grassland Conservation Programs Implemented in Inner Mongolia since 2000 on Vegetation Restoration and Natural and Anthropogenic Disturbances to Their Success. Sustainability 2017, 9, 466. [Google Scholar] [CrossRef]
- Sun, B.; Li, Z.; Gao, Z.; Guo, Z.; Wang, B.; Hu, X.; Bai, L. Grassland degradation and restoration monitoring and driving forces analysis based on long time-series remote sensing data in Xilin Gol League. Acta Ecol. Sin. 2017, 37, 219–228. [Google Scholar] [CrossRef]
- Wu, J.; Zhang, Q.; Li, A.; Liang, C. Historical landscape dynamics of Inner Mongolia: Patterns, drivers, and impacts. Landsc. Ecol. 2015, 30, 1579–1598. [Google Scholar] [CrossRef]
- Xie, Y.; Li, W. Why do Herders Insist on Otor? Maintaining Mobility in Inner Mongolia. Nomadic Peoples 2008, 12, 35–52. [Google Scholar] [CrossRef]
- John, R.; Chen, J.; Lu, N.; Wilske, B. Land cover/land use change in semi-arid Inner Mongolia: 1992–2004. Environ. Res. Lett. 2009, 4, 045010. [Google Scholar] [CrossRef] [Green Version]
- Gao, Z.; Sun, B.; del Barrio, G.; Li, X.; Wang, H.; Bai, L.; Wang, B.; Zhang, W. Land degradation assessment by applying relative rue in Inner Mongolia, China, 2001–2010. In Proceedings of the 2014 IEEE International on Geoscience and Remote Sensing Symposium (IGARSS), Quebec City, QC, Canada, 13–18 July 2014; pp. 1449–1452. [Google Scholar]
- Zhao, X.; Hu, H.; Shen, H.; Zhou, D.; Zhou, L.; Myneni, R.B.; Fang, J. Satellite-indicated long-term vegetation changes and their drivers on the Mongolian Plateau. Landsc. Ecol. 2015, 30, 1599–1611. [Google Scholar] [CrossRef]
- Zhen, L.; Li, F.; Yan, H.M.; Liu, G.H.; Liu, J.Y.; Zhang, H.Y.; Du, B.Z.; Wu, R.Z.; Sun, C.Z.; Wang, C. Herders’ willingness to accept versus the public sector’s willingness to pay for grassland restoration in the Xilingol League of Inner Mongolia, China. Environ. Res. Lett. 2014, 9, 045003. [Google Scholar] [CrossRef] [Green Version]
- Deng, X.; Huang, J.; Huang, Q.; Rozelle, S.; Gibson, J. Do roads lead to grassland degradation or restoration? A case study in Inner Mongolia, China. Environ. Dev. Econ. 2011, 16, 751–773. [Google Scholar] [CrossRef] [Green Version]
- Liu, J.; Zhang, Z.; Xu, X.; Kuang, W.; Zhou, W.; Zhang, S.; Li, R.; Yan, C.; Yu, D.; Wu, S.; et al. Spatial patterns and driving forces of land use change in China during the early 21st century. J. Geogr. Sci. 2010, 20, 483–494. [Google Scholar] [CrossRef]
- Shi, G.; Jiang, N.; Yao, L. Land Use and Cover Change during the Rapid Economic Growth Period from 1990 to 2010: A Case Study of Shanghai. Sustainability 2018, 10, 426. [Google Scholar] [CrossRef]
- Liu, J.; Liu, M.; Zhuang, D.; Zhang, Z.; Deng, X. Study on spatial pattern of land-use change in China during 1995–2000. Sci. China Ser. Earth Sci. 2003, 46, 373–384. [Google Scholar]
- Liu, J.; Kuang, W.; Zhang, Z.; Xu, X.; Qin, Y.; Ning, J.; Zhou, W.; Zhang, S.; Li, R.; Yan, C.; et al. Spatiotemporal characteristics, patterns, and causes of land-use changes in China since the late 1980s. J. Geogr. Sci. 2014, 24, 195–210. [Google Scholar] [CrossRef]
- Zhan, J.Y.; Deng, X.; Jiang, O.; Shi, N. The Application of System Dynamics and CLUE-S Model in Land Use Change Dynamic Simulation: A Case Study in Taips County, Inner Mongolia of China. In Proceedings of the 2007 Conference on Systems Science, Management Science and System Dynamics: Sustainable Development and Complex Systems, Shanghai, China, 22–27 July 2007; pp. 2781–2790. [Google Scholar]
- Zheng, Y.; Xu, Z.; Kemp, D.; Akahashi, T.; Jones, R. Modeling Optimal Grazing Management for Grassland Rehabilitation on the Typical Steppe: A Case Study in Taipusi Banner, Inner Mongolia, China. Philipp. Agric. Sci. 2011, 93, 420–428. [Google Scholar]
- Morton, D.C.; DeFries, R.S.; Shimabukuro, Y.E.; Anderson, L.O.; Arai, E.; del Bon Espirito-Santo, F.; Freitas, R.; Morisette, J. Cropland expansion changes deforestation dynamics in the southern Brazilian Amazon. Proc. Natl. Acad. Sci. USA 2006, 103, 14637–14641. [Google Scholar] [CrossRef] [PubMed]
- Kuang, W.; Liu, J.; Dong, J.; Chi, W.; Zhang, C. The rapid and massive urban and industrial land expansions in China between 1990 and 2010: A CLUD-based analysis of their trajectories, patterns, and drivers. Landsc. Urban Plan. 2016, 145, 21–33. [Google Scholar] [CrossRef] [Green Version]
- Liu, J.; Xu, X.; Shao, Q. Grassland degradation in the “Three-River Headwaters” region, Qinghai Province. J. Geogr. Sci. 2008, 18, 259–273. [Google Scholar] [CrossRef]
- Müller-Hansen, F.; Cardoso, M.F.; Dalla-Nora, E.L.; Donges, J.F.; Heitzig, J.; Kurths, J.; Thonicke, K. A matrix clustering method to explore patterns of land-cover transitions in satellite-derived maps of the Brazilian Amazon. Nonlinear Process. Geophys. 2017, 24, 113–123. [Google Scholar] [CrossRef]
- Hu, Y.; Zheng, Y.; Zheng, X. Simulation of land-use scenarios for Beijing using CLUE-S and Markov composite models. Chin. Geogr. Sci. 2013, 23, 92–100. [Google Scholar] [CrossRef]
- Han, H.; Yang, C.; Song, J. Scenario Simulation and the Prediction of Land Use and Land Cover Change in Beijing, China. Sustainability 2015, 7, 4260–4279. [Google Scholar] [CrossRef] [Green Version]
- Cheng, Z.; Cao, S. Markov Processes in Modeling Land Use and Land Cover Change in Tibetan Platau. In Proceedings of the 2011 International Conference on Remote Sensing, Nanjing, China, 24–26 June 2011; pp. 457–459. [Google Scholar]
- Chu, H.-J.; Wu, C.-F.; Lin, Y.-P. Incorporating Spatial Autocorrelation with Neural Networks in Empirical Land-Use Change Models. Environ. Plan. B Plan. Des. 2013, 40, 384–404. [Google Scholar] [CrossRef]
- Biondini, M.; Kandus, P. Transition matrix analysis of land-cover change in the accretion area of the Lower Delta of the Paraná River (Argentina) reveals two succession pathways. Wetlands 2006, 26, 981–991. [Google Scholar] [CrossRef]
- Xu, Y.; Zhang, Y.; Gao, L.; Qiao, G. To Fence or Not to Fence? Perceptions and Attitudes of Herders in Inner Mongolia. In Proceedings of the Building Resilience of Mongolian Rangelands: A Trans-Disciplinary Research Conference, Ulaanbaatar, Mongolia, 9–10 June 2015. [Google Scholar]
- Weng, Q. Land use change analysis in the Zhujiang Delta of China using satellite remote sensing, GIS and stochastic modelling. J. Environ. Manag. 2002, 64, 273–284. [Google Scholar] [CrossRef] [Green Version]
- Iacono, M.; Levinson, D.; El-Geneidy, A.; Wasfi, R. A Markov Chain Model of Land Use Change. Tema J. Land Use Mobil. Environ. 2015, 8, 263–276. [Google Scholar]
- Muller, M.R.; Middleton, J. A Markov model of land-use change dynamics in the Niagara Region, Ontario, Canada. Landsc. Ecol. 1994, 9, 151–157. [Google Scholar] [CrossRef]
- Bell, E.J. Markov analysis of land use change—An application of stochastic processes to remotely sensed data. Socio-Econ. Plan. Sci. 1974, 8, 311–316. [Google Scholar] [CrossRef]
- Kumar, S.; Radhakrishnan, N.; Mathew, S. Land use change modelling using a Markov model and remote sensing. Geomat. Nat. Hazards Risk 2014, 5, 145–156. [Google Scholar] [CrossRef]
- Yuan, T.; Yiping, X.; Lei, Z.; Danqing, L. Land Use and Cover Change Simulation and Prediction in Hangzhou City Based on CA-Markov Model. Int. Proc. Chem. Biol. Environ. Eng. 2015, 90, 108–113. [Google Scholar]
- Zhao, Y.; Li, X. Spatial Correlation between Type of Mountain Area and Land Use Degree in Guizhou Province, China. Sustainability 2016, 8, 849. [Google Scholar] [CrossRef]
- Niu, L.; Luo, W.; Jiang, M.; Lu, N. Land-Use Degree and Spatial Autocorrelation Analysis in Kunming City Based on Big Dat. In Proceedings of the 2018 International Conference on Intelligent Transportation, Big Data & Smart City (ICITBS), Xiamen, China, 25–26 January 2018; pp. 97–100. [Google Scholar]
- Overmars, K.P.; de Koning, G.H.J.; Veldkamp, A. Spatial autocorrelation in multi-scale land use models. Ecol. Model. 2003, 164, 257–270. [Google Scholar] [CrossRef] [Green Version]
- GeoDa Software—Data Exploration at Its Finest. Available online: https://gisgeography.com/geoda-software/ (accessed on 31 October 2018).
- Li, Z.; Wu, W.; Liu, X.; Fath, B.D.; Sun, H.; Liu, X.; Xiao, X.; Cao, J. Land use/cover change and regional climate change in an arid grassland ecosystem of Inner Mongolia, China. Ecol. Model. 2017, 353, 86–94. [Google Scholar] [CrossRef]
- Grassland Degradation. Available online: https://en.wikipedia.org/w/index.php?title=Grassland_degradation&oldid=842071682 (accessed on 31 October 2018).
- Li, Y.; Li, W. Chinas Rangeland management policy debates—What have we learned. Rangel. Ecol. Manag. 2015, 68, 305–314. [Google Scholar] [CrossRef]
- Chen, G.; Wang, M.; Liu, Z.; Chi, W. The Biogeophysical Effects of Revegetation around Mining Areas: A Case Study of Dongsheng Mining Areas in Inner Mongolia. Sustainability 2017, 9, 628. [Google Scholar] [CrossRef]
- Tao, S.; Fang, J.; Zhao, X.; Zhao, S.; Shen, H.; Hu, H.; Tang, Z.; Wang, Z.; Guo, Q. Rapid loss of lakes on the Mongolian Plateau. Proc. Natl. Acad. Sci. USA 2015, 112, 2281–2286. [Google Scholar] [CrossRef] [PubMed] [Green Version]
- Allington, G.R.H.; Li, W.; Brown, D.G. Urbanization and environmental policy effects on the future availability of grazing resources on the Mongolian Plateau: Modeling socio-environmental system dynamics. Environ. Sci. Policy 2017, 68, 35–46. [Google Scholar] [CrossRef]
- Klotzbücher, S. Sustainable Development in Western China: Managing People, Livestock and Grasslands in Pastoral Areas. J. Dev. Stud. 2009, 45, 828–830. [Google Scholar] [CrossRef]
- Zhou, L.; Zhu, Y.; Yang, G.; Luo, Y. Quantitative evaluation of the effect of prohibiting grazing policy on grassland desertification reversal in northern China. Environ. Earth Sci. 2013, 68, 2181–2188. [Google Scholar] [CrossRef]
- Jun Li, W.; Ali, S.H.; Zhang, Q. Property rights and grassland degradation: A study of the Xilingol Pasture, Inner Mongolia, China. J. Environ. Manag. 2007, 85, 461–470. [Google Scholar] [CrossRef] [PubMed]
- Zhang, Q. Pastoralists and the Environmental State: A Study of Ecological Resettlement in Inner Mongolia, China; Department of Human Geography, Stockholm University: Stockholm, Sweden, 2015. [Google Scholar]
- Cao, S.; Chen, L.; Yu, X. Impact of China’s Grain for Green Project on the landscape of vulnerable arid and semi-arid agricultural regions: A case study in northern Shaanxi Province. J. Appl. Ecol. 2009, 46, 536–543. [Google Scholar] [CrossRef]
- Zeng, X.; Zhang, W.; Liu, X.; Cao, J.; Shen, H.; Zhao, X.; Zhang, N.; Bai, Y.; Yi, M. Change of soil organic carbon after cropland afforestation in ‘Beijing-Tianjin Sandstorm Source Control’ program area in China. Chin. Geogr. Sci. 2014, 24, 461–470. [Google Scholar] [CrossRef]
- Démurger, S.; Pelletier, A. Volunteer and satisfied? Rural households’ participation in a payments for environmental services programme in Inner Mongolia. Ecol. Econ. 2015, 116, 25–33. [Google Scholar] [CrossRef]
- Pan, X.; Xu, L.; Yang, Z.; Yu, B. Payments for ecosystem services in China: Policy, practice, and progress. J. Clean. Prod. 2017, 158, 200–208. [Google Scholar] [CrossRef]
- Song, X.; Peng, C.; Zhou, G.; Jiang, H.; Wang, W. Chinese Grain for Green Program led to highly increased soil organic carbon levels: A meta-analysis. Sci. Rep. 2014, 4, 4460. [Google Scholar] [CrossRef] [PubMed] [Green Version]
- Qiu, G.Y.; Yin, J.; Tian, F.; Geng, S. Effects of the “Conversion of Cropland to Forest and Grassland Program” on the Water Budget of the Jinghe River Catchment in China. J. Environ. Qual. 2011, 40, 1745. [Google Scholar] [CrossRef] [PubMed]
- Chen, Y.; Wu, Q.; Chen, N.X. Ecological Benefit Evaluation of the Beijing-Tianjin Sandstom Source Control Project in Beijing. Adv. Mater. Res. 2011, 356–360, 2479–2483. [Google Scholar] [CrossRef]
- Wu, Z.; Wu, J.; He, B.; Liu, J.; Wang, Q.; Zhang, H.; Liu, Y. Drought Offset Ecological Restoration Program-Induced Increase in Vegetation Activity in the Beijing-Tianjin Sand Source Region, China. Environ. Sci. Technol. 2014, 48, 12108–12117. [Google Scholar] [CrossRef] [PubMed]
- Tong, C.; Wu, J.; Yong, S.; Yang, J.; Yong, W. A landscape-scale assessment of steppe degradation in the Xilin River Basin, Inner Mongolia, China. J. Arid. Environ. 2004, 59, 133–149. [Google Scholar] [CrossRef]
- Yeh, E.T. From “Retire Livestock, Restore Rangeland” to the Compensation for Ecological Services: State Interventions into Rangeland Ecosystems and Pastoralism in Tibet. Ph.D. Thesis, University of Colorado Boulder, Boulder, CO, USA, 2012. [Google Scholar]
- Li, Y.; Fan, M.; Li, W. Application of payment for ecosystem services in China’s rangeland conservation initiatives: A social-ecological system perspective. Rangel. J. 2015, 37, 285–296. [Google Scholar] [CrossRef]
Figure 1.
Land-use and land-cover change (LUCC) and location of Inner Mongolia (LUCC: 2015).

Figure 2.
Definitions of grassland degradation andrestoration.

Figure 3.
Land-use and land-cover changes between 1990 and 2000.

Figure 4.
Map of net change in eight land-use types from 1990 to 2015.

Figure 5.
Map of land-use and land-cover changes from 1990 to 2000 and from 2000 to 2017. (a,b) Increases and decreases in area of each land-use type between 1990 and 2000. (c,d) Increases and decreases in area of each land-use type from 2000 to 2017.
Figure 5.
Map of land-use and land-cover changes from 1990 to 2000 and from 2000 to 2017. (a,b) Increases and decreases in area of each land-use type between 1990 and 2000. (c,d) Increases and decreases in area of each land-use type from 2000 to 2017.

Figure 6.
Grassland degradation and restorationin 1990–2000 and 2000–2015.

Figure 7.
Map of grassland degradation andrestoration.

Figure 8.
Global spatial autocorrelation of each land-use type. (a) Moran’s I values of cropland, water body, unused land, woodland, and built-up land types. (b) Moran’s I values of dense grassland, moderately dense grassland, and sparse grassland.
Figure 8.
Global spatial autocorrelation of each land-use type. (a) Moran’s I values of cropland, water body, unused land, woodland, and built-up land types. (b) Moran’s I values of dense grassland, moderately dense grassland, and sparse grassland.

Figure 9.
The major policy framework in Inner Mongolia.


Table 1.
Land-use classification description.
| Land-Use Type | Code | Description |
|---|---|---|
| Cropland | 1 | Cultivated land for crops |
| Woodland | 2 | Land for growing trees, including arbors, shrub arbors, shrubs, bamboo, and forests |
| Water body | 4 | Natural surface water bodies or constructed reservoirs for irrigation and water reserves |
| Built-up land | 5 | Land used for urban and rural settlements, factories, and transportation facilities |
| Unused land | 6 | Land that has not been put into practical use or is difficult to use |
| Dense grass | 31 | Grassland with canopy coverage greater than 50% |
| Moderately dense grass | 32 | Grassland with canopy coverage between 20% and 50% |
| Sparse grass | 33 | Grassland with canopy cover between 5% and 20% |
Table 2.
Transition matrix of land-use change in 1975–2000 and 2000–2015 (Unit: km2).
| 2000 | ||||||||||
| 1990 | Cropland | Woodland | Water Body | Built-Up Land | Unused Land | Dense Grassland | Moderately Dense Grassland | Sparse Grassland | Losses | |
| Cropland | 95,496.32 | 741.58 | 198.22 | 410.20 | 564.48 | 1665.22 | 3426.22 | 712.85 | 7718.77 | |
| Woodland | 2907.97 | 159,705.27 | 39.54 | 31.59 | 191.31 | 1910.63 | 2562.58 | 169.34 | 7812.97 | |
| Water body | 287.65 | 51.64 | 13,158.00 | 18.78 | 422.93 | 128.42 | 142.78 | 68.93 | 1121.14 | |
| Built-up land | 11,006.44 | 0.00 | ||||||||
| Unused land | 981.96 | 218.55 | 773.86 | 46.82 | 304,590.35 | 1020.93 | 1765.78 | 1688.78 | 6496.68 | |
| Dense grassland | 8419.44 | 2081.35 | 229.88 | 128.74 | 1166.42 | 229,546.53 | 3946.00 | 2069.50 | 18,041.34 | |
| Moderately dense grassland | 4303.50 | 705.31 | 146.97 | 121.48 | 1647.44 | 2190.88 | 173,222.75 | 2357.13 | 11472.71 | |
| Sparse grassland | 808.55 | 173.68 | 89.52 | 60.18 | 3374.67 | 770.78 | 1129.47 | 99,560.79 | 6406.86 | |
| Gains | 17,709.06 | 3972.11 | 1477.99 | 817.80 | 7367.26 | 7686.87 | 12,972.84 | 7066.54 | 59,070.47 | |
| 2015 | ||||||||||
| 2000 | Cropland | Woodland | Water Body | Built-Up Land | Unused Land | Dense Grassland | Moderately Dense Grassland | Sparse Grassland | Losses | |
| Cropland | 90,544.80 | 4796.28 | 866.43 | 2021.68 | 2970.22 | 6090.65 | 4711.29 | 1204.06 | 22,660.61 | |
| Woodland | 4333.03 | 144,673.39 | 395.75 | 257.45 | 2188.45 | 8949.26 | 2274.99 | 605.08 | 19,004.00 | |
| Water body | 816.60 | 238.52 | 10,179.30 | 92.80 | 2386.71 | 276.39 | 296.90 | 348.76 | 4456.69 | |
| Built-up land | 11,824.24 | 0.00 | ||||||||
| Unused land | 3012.76 | 1626.55 | 1212.83 | 1017.73 | 287,103.48 | 3103.94 | 7395.08 | 7485.23 | 24,854.12 | |
| Dense grassland | 3489.41 | 24,853.22 | 692.81 | 1255.66 | 1673.05 | 190,147.87 | 6790.74 | 8330.65 | 47,085.53 | |
| Moderately dense grassland | 3066.20 | 5836.07 | 441.81 | 1347.74 | 4963.25 | 40,804.36 | 121,292.73 | 8443.42 | 64,902.85 | |
| Sparse grassland | 698.79 | 1058.41 | 273.77 | 872.09 | 9994.02 | 5553.89 | 10,810.35 | 77,365.99 | 29,261.33 | |
| Gains | 15,416.79 | 38,409.06 | 3883.41 | 6865.14 | 24,175.70 | 64,778.48 | 32,279.35 | 26,417.20 | 212,225.13 | |
Table 3.
Transition probabilities in 1975–2000 (%).
| Cropland | Wood Land | Water Body | Built-Up Land | Unused Land | Dense Grassland | Moderately Dense Grassland | Sparse Grassland | |
|---|---|---|---|---|---|---|---|---|
| Cropland | 92.52 | 0.72 | 0.19 | 0.40 | 0.55 | 1.61 | 3.32 | 0.69 |
| Woodland | 1.74 | 95.34 | 0.02 | 0.02 | 0.11 | 1.14 | 1.53 | 0.10 |
| Water body | 2.01 | 0.36 | 92.15 | 0.13 | 2.96 | 0.90 | 1.00 | 0.48 |
| Built-up land | 0.00 | 0.00 | 0.00 | 100.00 | 0.00 | 0.00 | 0.00 | 0.00 |
| Unused land | 0.32 | 0.07 | 0.25 | 0.02 | 97.91 | 0.33 | 0.57 | 0.54 |
| Dense grassland | 3.40 | 0.84 | 0.09 | 0.05 | 0.47 | 92.71 | 1.59 | 0.84 |
| Moderately dense grassland | 2.33 | 0.38 | 0.08 | 0.07 | 0.89 | 1.19 | 93.79 | 1.28 |
| Sparse grassland | 0.76 | 0.16 | 0.08 | 0.06 | 3.18 | 0.73 | 1.07 | 93.95 |
Table 4.
Transition probabilities in 2000–2015 (%).
| Cropland | Woodland | Water Body | Built-Up Land | Unused Land | Dense Grassland | Moderately Dense Grassland | Sparse Grassland | |
|---|---|---|---|---|---|---|---|---|
| Cropland | 79.98 | 4.24 | 0.77 | 1.79 | 2.62 | 5.38 | 4.16 | 1.06 |
| Woodland | 2.65 | 88.39 | 0.24 | 0.16 | 1.34 | 5.47 | 1.39 | 0.37 |
| Water body | 5.58 | 1.63 | 69.55 | 0.63 | 16.31 | 1.89 | 2.03 | 2.38 |
| Built-up land | 0.00 | 0.00 | 0.00 | 100.00 | 0.00 | 0.00 | 0.00 | 0.00 |
| Unused land | 0.97 | 0.52 | 0.39 | 0.33 | 92.03 | 0.99 | 2.37 | 2.40 |
| Dense grassland | 1.47 | 10.48 | 0.29 | 0.53 | 0.71 | 80.15 | 2.86 | 3.51 |
| Moderately dense grassland | 1.65 | 3.13 | 0.24 | 0.72 | 2.67 | 21.91 | 65.14 | 4.53 |
| Sparse grassland | 0.66 | 0.99 | 0.26 | 0.82 | 9.37 | 5.21 | 10.14 | 72.56 |
Table 5.
Policies launched by the central government related to grassland protection in China.
| Years | Policies and Programs |
|---|---|
| 1985 | Rangeland Law (RL) [28] |
| 1999–2010 | Grain to Green Program (GGP) [84] |
| 2003 | Rangeland Law (amended) [28] |
| 2002–2010 | Return Grazing to Grassland Program (RGGP) [20] |
| 2001–2010 | Beijing–Tianjin Sand Source Control Engineering Project (BTSSC) [85] |
| 2001–2008 | Fencing Grassland and Moving Users (FGMU) [38] |
| 2001–2020 | Payments for Environmental Services (PES) [86,87] |
© 2018 by the authors. Licensee MDPI, Basel, Switzerland. This article is an open access article distributed under the terms and conditions of the Creative Commons Attribution (CC BY) license (http://creativecommons.org/licenses/by/4.0/).
Share and Cite
MDPI and ACS Style
Hu, Y.; Nacun, B. An Analysis of Land-Use Change and Grassland Degradation from a Policy Perspective in Inner Mongolia, China, 1990–2015. Sustainability 2018, 10, 4048. https://doi.org/10.3390/su10114048
AMA Style
Hu Y, Nacun B. An Analysis of Land-Use Change and Grassland Degradation from a Policy Perspective in Inner Mongolia, China, 1990–2015. Sustainability. 2018; 10(11):4048. https://doi.org/10.3390/su10114048
Chicago/Turabian StyleHu, Yunfeng, and Batu Nacun. 2018. "An Analysis of Land-Use Change and Grassland Degradation from a Policy Perspective in Inner Mongolia, China, 1990–2015" Sustainability 10, no. 11: 4048. https://doi.org/10.3390/su10114048
Note that from the first issue of 2016, this journal uses article numbers instead of page numbers. See further details here.