1. Introduction
Together with the general growth of organic farming in many European countries, organic pig farming has expanded in recent decades [
1]. However, the pig meat sector still ranks relatively low in organic product sales, particularly in comparison to the sheep and bovine sectors [
2].
Climate change as well as animal health and welfare are among the most current issues in the public and scientific debate concerning livestock [
3,
4,
5,
6]. Likewise, sustainability and its assessment, covering environmental, economic, and social aspects, have gained importance in recent years. For instance, the Sustainability Assessment of Food and Agriculture systems (SAFA) Guidelines [
7] have been developed as an international reference document to allow for consistent analyses and assessments despite the complexity of sustainability. According to the SAFA guidelines, sustainability consists of four dimensions: Good governance, environmental integrity, economic resilience, and social well-being. In the dimension of environmental integrity, the following themes are addressed: Atmosphere, water, land, materials and energy, biodiversity, and animal welfare.
Livestock production exerts severe impacts on soil, water, and air quality due to the related emissions [
4]. The world’s livestock sector contributes 14.5% of global greenhouse gas emissions, with pigs accounting for 9% of overall livestock-related emissions [
5].
The life cycle assessment (LCA) provides a valuable and consistent methodological framework to quantify the environmental impact within the life cycle of a product [
8]. Hence, several LCAs have been conducted in recent years to quantify the environmental impact, mainly greenhouse gas emissions (global warming potential, GWP), acidification potential (AP), and eutrophication potential (EP), of animal husbandry systems [
9,
10,
11]. Until now, due to high CH
4 emissions from enteric fermentation, ruminants have mainly been in the focus, but in light of the high consumption of pork and pork products in the European Union, pork production must also be considered.
Since pig production is dominated by non-organic production systems, most studies cover conventional systems [
4]. As for most LCA studies dealing with pigs, for organic pig production, which is still comparatively small-scale, but nevertheless rapidly developing, only a few modelling studies are available [
12,
13,
14]. Only a few studies have conducted an LCA using individual farm data [
15], and even fewer have been based on a considerable number of organic farrow-to-finish pig farms.
As organic pigs are produced according to the general principles of organic farming [
16], national, and international regulations (e.g., EC Nos. 2018/848 and 889/2008, [
17,
18]) as well as private standards [
19], organic pig farms have been treated as a uniform system in most studies. However, it has recently been shown that organic pig farms in Europe can clearly be distinguished into three main “husbandry systems”: Pigs may be kept completely outdoors in paddocks on pasture, as in most UK and Italian farms, or indoors, with access to a limited concrete outside run, as in most farms in German speaking countries. Furthermore, both systems, indoor and outdoor, may be combined on one farm for different production stages or during different seasons, as is common, for example, in Denmark or France [
1,
20].
Keeping pigs on pasture has a potentially higher risk regarding nutrient losses [
14,
21] compared to pigs kept indoors, where manure is collected, stored, and spread in a controlled way on fields. Furthermore, due to a more controlled (thermal) environment, pigs kept indoors might have better feed conversion ratios and a higher number of piglets weaned, both reducing the environmental impact [
22,
23].
Besides the effects on environmental impact caused by the husbandry system, as described above, other important influencing factors contribute to variation. As LCA data from 27 conventional farms show, other factors, such as diet characteristics (e.g., level of by-products), influence the environmental impacts [
9]. Therefore, also for organic pig production, individual farm data are needed to describe and quantify the potential influence of the three husbandry systems as well as those individual farm characteristics with potential impact on the environment.
Consequently, the present study aims to deliver first indications to support strategic decisions in the organic sector (policy makers, extension services) or at the farm level (farmer). The analysis focuses on the environmental impact of three common organic pig husbandry systems, indoor (IN), partly outdoor (POUT), and outdoor (OUT), regarding their GWP, AP, and EP. Furthermore, farm characteristics influencing these impacts are assessed by cluster and correlation analysis. Two hypotheses are tested: (1) The null hypothesis that there are no differences between husbandry systems regarding the environmental impact (GWP, AP, EP), and (2) that there are specific farm characteristics, which explain variation independent from the husbandry systems.
2. Materials and Methods
2.1. Overall Study Design and Participating Farms
The present assessments are based on data collected during visits to 74 organic pig farms, representing three different husbandry systems, IN (34 farms), POUT (28 farms), and OUT (12 farms), in eight European countries (Austria, Czech Republic, Denmark, France, Germany, Italy, Switzerland, and the United Kingdom) during 2012 and 2013 (see
Supplementary Materials). In each country, all assessments were carried out by one trained observer. All observers attended a common training course to standardize assessments. The different husbandry systems were defined as described in
Table 1.
Organic pig farms were recruited through farm advisors, producer associations, agricultural journals and their websites, or personal contacts. Farms had to be certified organic for at least two years and preferably combined farrow-finish farms with more than 20 sows and 100 finishing places. Recruitment was also based on the type of husbandry system, as the objective was to compare the three different organic pig systems.
As this study investigated the environmental impact of pork production from piglet production until slaughter, production chains from farrowing to finishing (PC) were the statistical unit. This comprised 64 PCs (24 IN, 30 POUT, 10 OUT), which were either farrow-to-finish farms (15 IN, 24 POUT, 9 OUT) or which were formed of co-operating farrowing-only and fattening-only farms (6, 6, and 1 IN, POUT and OUT PCs, respectively). Additionally, for three other PCs (IN), data from the co-operating farm was not available during the study, and the average of the other farms was then used for the missing part of the PC. For each individual PC, environmental impact categories were calculated as outlined below, with pairs of farrowing-only and fattening-only farms being treated as farrow-to-finish farms.
Based on the literature [
10,
15,
24] and expert knowledge, a standardized on-farm assessment protocol for use on a tablet computer was developed and a supplementary dictionary was translated to the languages of involved countries. The final protocol included an interview with the farm manager, the analysis of farm records, and direct observations. It was structured in thematic sections, including the following parameters:
Farm and manure management, description of husbandry systems;
productivity data and medicinal treatments (records);
land use (crop production);
diet composition and dietary nutrients contents; and
provision of resources (husbandry system) for weaners (defined as pigs from post weaning with at least six weeks until transfer to a fattening unit with approximately 12 weeks), fatteners (includes the growing and finishing phase from approximately 30 kg to slaughter), pregnant, and lactating sows (direct observations)
The PC-specific data used in the present study are based on inventory data either collected on the day of visit or covering a period of 12 months prior to the farm visits.
2.2. Scope of the Study and Life Cycle Assessment Methodology
2.2.1. System Boundaries, Functional Unit, and Allocation Approach
As the study focused on pig farming systems, transport, slaughter, and processing of the carcasses were not included. The system boundaries were defined as cradle-to-farm gate, in this case from piglet birth to pigs ready for slaughter, and included relevant farm inputs needed for this (e.g., electricity, transport-related (fossil) energy for feedstuffs, etc.). While the energy-gain from co-digestion of manure in biogas plants was not considered (as not directly related to the pig unit), digestion-related emission factors were used to derive results from co-digestion of manure. Following LCA-related guidelines, such as PAS2050 [
25], for the assessment of greenhouse gas emissions, emissions from the construction of farm infrastructure (e.g., livestock barns, machinery, farm buildings) were excluded from the LCA. Furthermore, veterinary treatments and inputs, such as cleaning agents and disinfectants, were not considered within the system boundaries as a lower use is assumed in organic farming [
26]. The functional unit was 1000 kg of live weight of fattening pigs leaving the farm (live weight at slaughter), including culled sows. The live weight at slaughter was calculated based on carcass weight records using an equation used for organic pigs from different countries [
27]. An energy allocation approach was used throughout the study, for instance, for feedstuffs’ emission factors.
2.2.2. Environmental Impacts Considered, Data Sources, and Methodological Details
GWP (100 year-horizon) [
28], AP, and EP were calculated using a modified version of an Excel tool developed by Dourmad et al. [
15]. Emissions were calculated from measured as well as modelled data per individual PC, using typical emission factors for livestock-related emissions [
29]. For EP and AP from the pig unit and feed production, characterization factors were used as described in [
8] and [
30]. Gaseous emissions from animal husbandry and manure storage were calculated for NH
3, N
2O, and NO
X as well as CH
4 based on [
28,
29,
31] and other sources as described in [
15].
Calculations for nitrogen (N) and phosphorous (P) retention and excretion have been described in detail in [
29,
32]. Results from [
33], adapted according to [
34], were used to estimate losses from outdoor paddocks into water, assuming a constant rate between P losses and the body mass (live-weight) of pigs on pasture (see Equation (S1) in the
Supplementary Materials). P losses from manure storage, treatment, and spreading were assumed to be negligible and ignored [
29]. All emission factors used are given in the
Supplementary Material. All traits used for deriving the indicators of the pig unit’s environmental impact are provided in
Table 2.
Parameters to calculate the environmental impact from the production of all feedstuffs, except fishmeal and fish oil, were adopted from previous studies [
35,
36]. The nitrogen (N)-related part of feeds’ EP was calculated by multiplying typical quantities of N applied in manure and commercial fertilizers on organic farms in Austria with typical NO
3-N leaching factors identified in [
37]. For P-losses from feed production, it was assumed that, on average, a surplus of 5% over plant requirements (according to yield) was applied and lost. The GWP of the rarely used components, fishmeal and fish oil, originate from [
38]. The GWP, AP, and EP for monocalcium phosphate and mineral premixes are based on the Danish LCA food database [
39].
The total feed consumption per animal, including bought–in-feedstuffs, was calculated from farm-specific data (based on daily consumption per animal, feed conversion rate, duration of the periods, average daily gains, etc.). For individual missing values, results from [
40] and [
41] were used in the fattening and the weaner stages, respectively. For farms lacking full records on the feed intake and feed conversion ratio, these values were estimated according to farm and animal category-specific dietary contents for MJ ME, CP, and P, and recommended nutrient requirements at the respective physiological stage [
42]. Furthermore, the relative amount of digestible lysine per unit of energy (g/MJ NE) was calculated based on the online tool, Evapig [
43], and compared to requirements at different stages [
44]; a 10% tolerance was accepted due to the uncertainty of NE and lysine content. Diets for growing and finishing pigs were classified as sufficient, deficient, or exceeding requirements (excess) using the content of digestible lysine relative to the NE content as an indicator. Feed components and feedstuffs were categorized as described in
Table 3.
2.2.3. Characteristics of the Husbandry Systems
Housing (Floor Type) and Manure Management
The housing, and consequently the manure management, varied only between the individual PCs in IN and POUT, while in OUT, all animals were kept outdoors. Detailed information on housing (floor type) is provided for all animal categories in IN and POUT-PCs in the
Supplementary Materials (
Table S6). All animal categories in IN were kept on (partly slatted) concrete floors, with bedded lying areas. For POUT, 83% of PCs kept lactating sows outdoors throughout the year, and 45% kept dry sows outside, with a much lower proportion keeping weaners and fatteners outdoors.
The floor types for weaners and fatteners housed on POUT farms varied largely. Depending on the floor type, IN and POUT PCs produced either solid manure only or solid manure and slurry. In IN, 95.5% of the PCs generated a combination of solid manure and slurry, while only 4.5% had only solid manure. In POUT, the proportion of PCs with both solid manure and slurry was 69%. In OUT, no manure was stored and handled.
The type and frequency of manure treatments by husbandry system are reported in the
Supplementary Material (
Table S7). In IN, 16.6% of PCs used aerobic digestion. Thirty percent of the POUT-PCs applied a treatment (composting, aerobic, or anaerobic digestion) to the slurry. Across all systems, most PCs did not treat the solid manure before application; composting was the only treatment found on 26.3% of IN- and 15.3% of POUT-PCs.
2.3. Statistical Data Analysis
All statistical analyses were performed with each individual PC as the statistical unit in SAS 9.2 and 9.3 (SAS-Institute, Cary, North Carolina, USA, 2008). Non-parametric Kruskal-Wallis tests were used for comparisons between husbandry systems. When significant effects (p < 0.05) were revealed in global tests, pairwise comparisons were performed using the Wilcoxon Two-Sample (Rank sum) test. p-Values were adjusted for multiple comparisons using Bonferroni correction. Additionally, to investigate associations between the environmental impact categories of AP, EP, and GWP and farm characteristics, Spearman rank correlations were calculated. Only those characteristics were included which were not directly considered in the LCA calculation, except for piglets weaned per sow per year [n, 1 yr mean] and carcass weight [kg, 1 yr mean].
Since AP, EP, and GWP did not significantly correlate with each other, they were subjected to a hierarchical cluster analysis using the average linkage method. Values were standardized using the procedure, STDIZE, in SAS using the mean as a location measure and the sample standard deviation as a scale measure. For this analysis, five outliers (2 IN, 2 POUT, 1 OUT) were excluded, as identified from boxplots, resulting in 59 PCs being included in the final cluster analysis. The number of clusters was based on R-Squared (SAS-Institute, 2008), Pseudo F, and Pseudo t2 statistics. Additionally, the average distance between the clusters was graphically checked in a dendrogram.
3. Results
3.1. GWP, AP, and EP of the Three Husbandry Systems
The total environmental impacts (AP, EP, and GWP) of the 64 PCs in the different husbandry systems are presented in
Table 4. Statistical comparison of the three pig husbandry systems with respect to GWP, AP, and EP revealed inconsistent results.
No significant differences were found regarding the GWP between systems. With 2204, 2213, and 2209 kg CO2-eq per 1000 kg live weight at slaughter, the median estimate for the GWP was similar for the three systems, IN, POUT, and OUT (p = 0.934). Across systems, the PCs with the lowest and highest GWP were both found in OUT, and the variation in the GWP was numerically smaller in IN and POUT than in OUT.
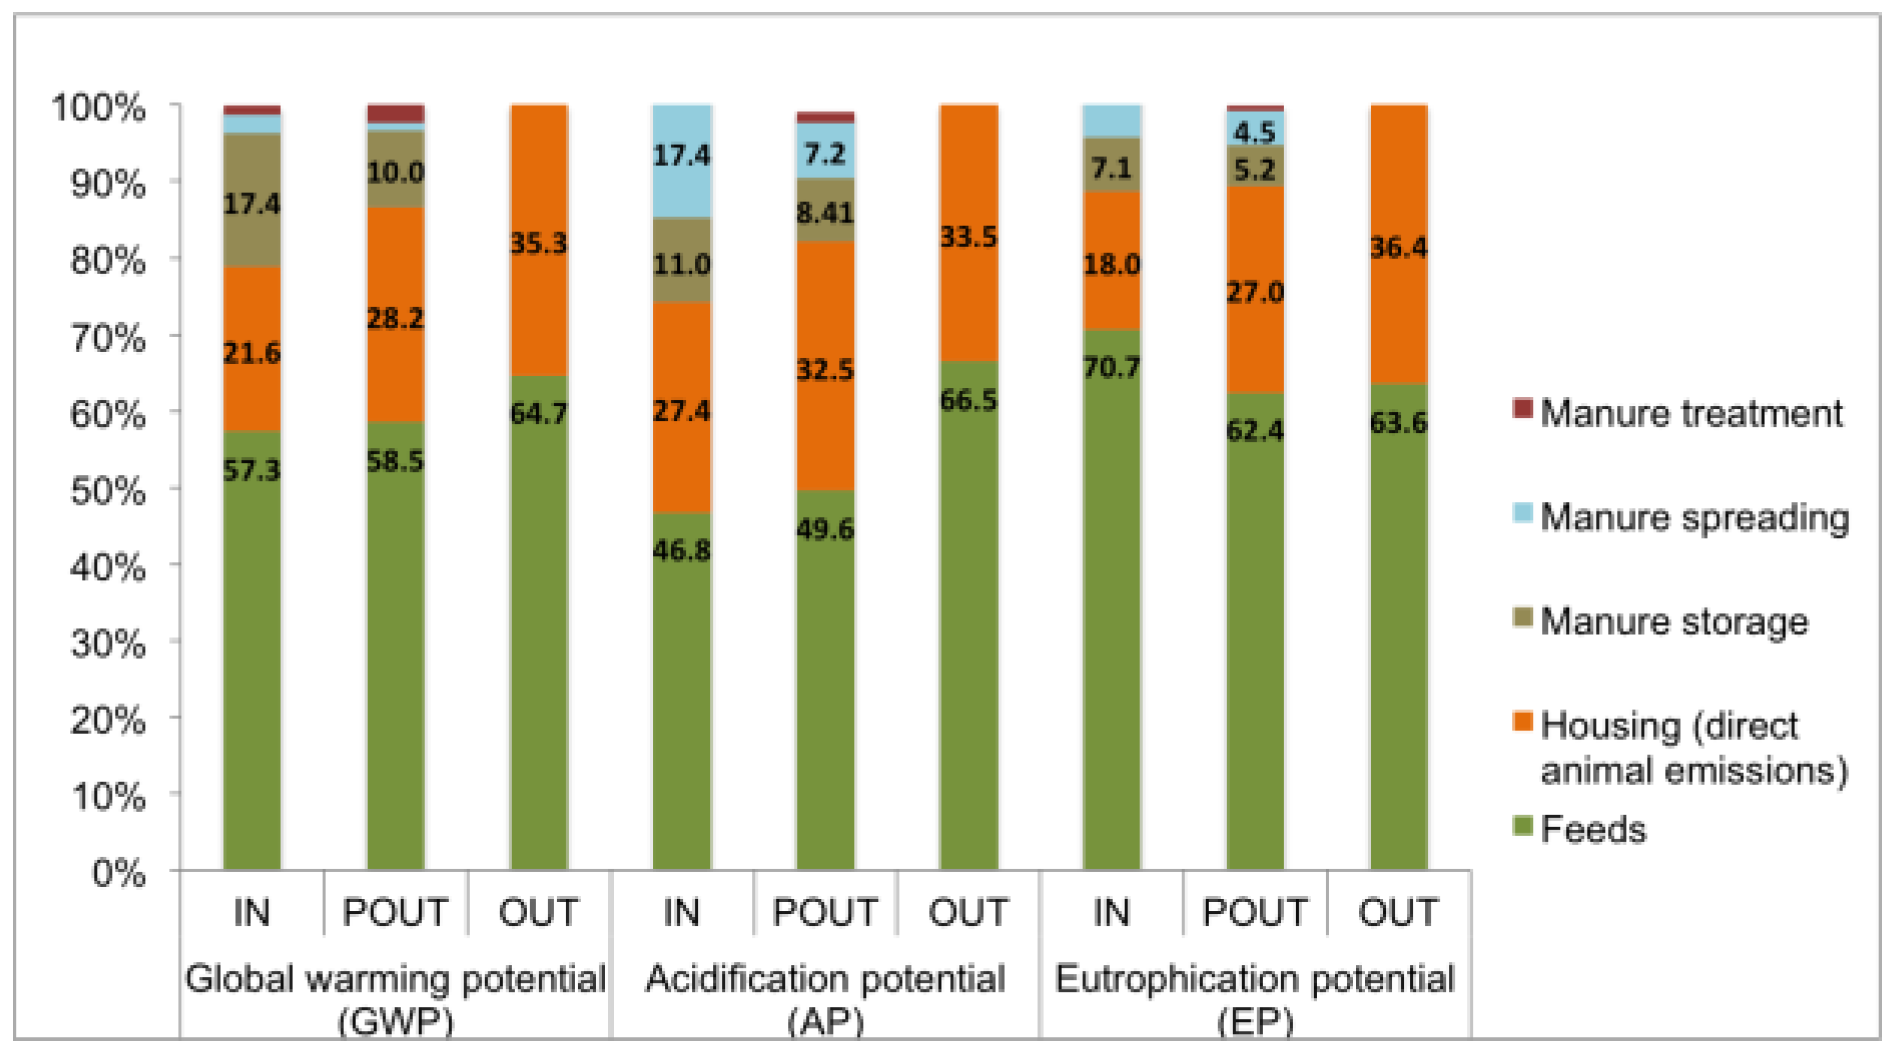
In all systems, feed production most strongly contributed to the GWP, followed by animal housing (direct emissions originating from the animal and excreta inside houses), and, in IN and POUT, manure storage (
Figure 1). Manure treatment and manure spreading contributed only a small percentage to the GWP in IN and POUT, while in OUT, manure is directly excreted onto the field by the animal and therefore is neither stored, treated, nor spread. Relative contributions of housing emissions tended to be lower in IN, whereas the relative contribution of manure storage was highest for this system. Consistently, the highest relative contribution of housing (including field deposition of manure) was found for OUT.
The median AP was significantly higher in IN (61.9 kg SO2-eq per 1000 kg live weight at slaughter) than in POUT (51.9 kg SO2-eq per 1000 kg live weight at slaughter; p = 0.006), mainly due to more NH3 arising from manure spreading in IN. In OUT, AP was numerically slightly higher than in POUT. Across systems, the individual PC with the lowest AP was found in OUT and the one with the highest AP was in IN. The variation (interquartile range) was smaller in POUT compared to IN and OUT.
Similar to GWP, feed production and animal housing contributed most to AP (
Figure 1). The relative contribution of manure spreading in IN and POUT to both AP and EP was higher than the corresponding contributions to GWP. Regarding AP, IN showed higher relative amounts of SO
2-eq originating from feed, housing of the animals (direct emissions), and, especially, manure storage and spreading. In POUT, some manure remains directly on the paddock and is not stored or spread on the field, thus leading to lower AP due to lower NH
3 emissions. Manure spreading was the main explanation for differences in the AP between IN and POUT. An even higher difference was found between OUT and IN, again due to the lack of manure spreading in OUT.
The median EP, expressed in kg PO4-eq per 1000 kg of live weight at slaughter, was significantly higher in OUT than in POUT (p = 0.010), mainly due to more PO4-eq resulting from feed consumption and housing. Total EP of IN was similar to the EP of POUT, but did not differ significantly from OUT. Variation (interquartile range) in OUT was larger than in the other systems. Across all systems, the most important source of EP was feed production, followed by animal housing. In IN and POUT, manure storage, treatment, and spreading also contributed to EP, but to a lesser extent. The highest contribution of feed and housing regarding EP was found in OUT, which had a higher median feed conversion rate than POUT- or IN-PCs, and consequently needed more feed to achieve 1000 kg of slaughter weight.
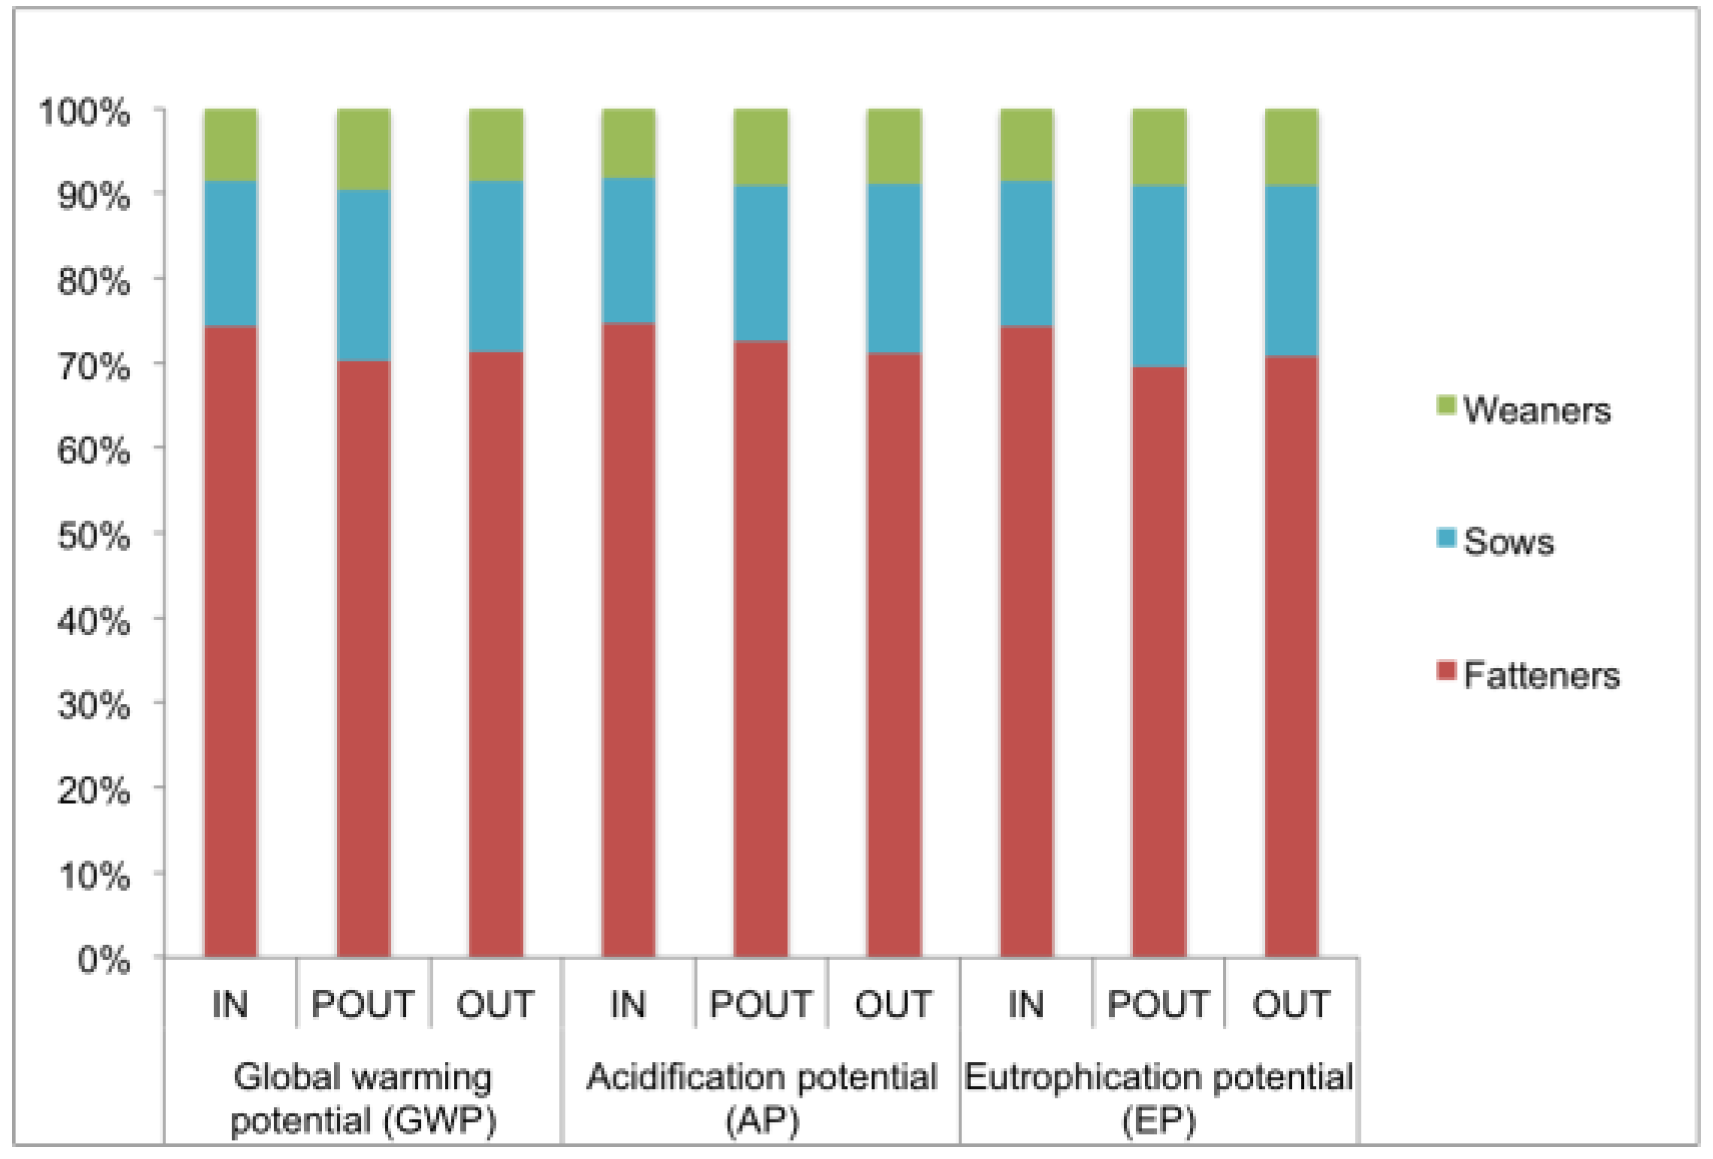
When considering the environmental impact indicators (GWP, AP, EP) based on animal production stages, across all systems the fattening phase had the highest influence (between 68% and 74% of the totals), with little variation between the systems and impact indicators (
Figure 2).
3.2. Correlations between Farm Characteristics and Environmental Impacts
Correlation coefficients of farm characteristics with environmental impact indicators are presented in
Table 5. Two characteristics relating to size of the pig units (number of slaughtered pigs and livestock units per PC) negatively correlated with AP and EP, with larger PCs having lower AP and EP. The current number of sows on the farm, which also relates to farm size, was also negatively correlated with AP.
The total number of piglets born per litter negatively correlated with EP, whilst piglet numbers weaned per sow and year negatively correlated with all environmental impact indicators. The average final carcass weight correlated positively with AP and EP, while the percentage of bought-in feed in fattener diets was negatively associated with AP. Additionally, the relationship between the relative contribution of feedstuff categories to the diets and the environmental impact indicators was investigated, but associations were only found for EP. The relative contribution of the high-protein by-product feed and mineral supplements negatively correlated with EP, while the amount of grains correlated positively.
3.3. Cluster Analysis Regarding Impacts of Organic Pig Husbandry Systems
The hierarchical cluster analysis revealed two suitable classification levels, with five and four clusters, respectively. For statistical reasons (number of observations per cluster), the higher aggregation level, i.e., combining clusters 1 and 4 to cluster 1/4, was chosen. The number of PCs per husbandry system and cluster are shown in
Table 6.
In
Table 7 all clusters are presented: Cluster 2, representing 35.6% of the total, on average, showed numerically the lowest environmental impacts (referred to as “low impact cluster” below). Cluster 1/4 can be considered as the “intermediate impact cluster”, with values of AP, EP, and GWP between those of Cluster 2 and Cluster 3. Cluster 3 had higher median values for AP, EP, and GWP as compared to Cluster 1/4 and Cluster 2. Consequently, Cluster 3 can be described as the “high impact cluster”. Cluster 5 resulted in overall highest environmental impacts, but due to the very small number of farms, included data are only presented descriptively, but not further considered in the analysis.
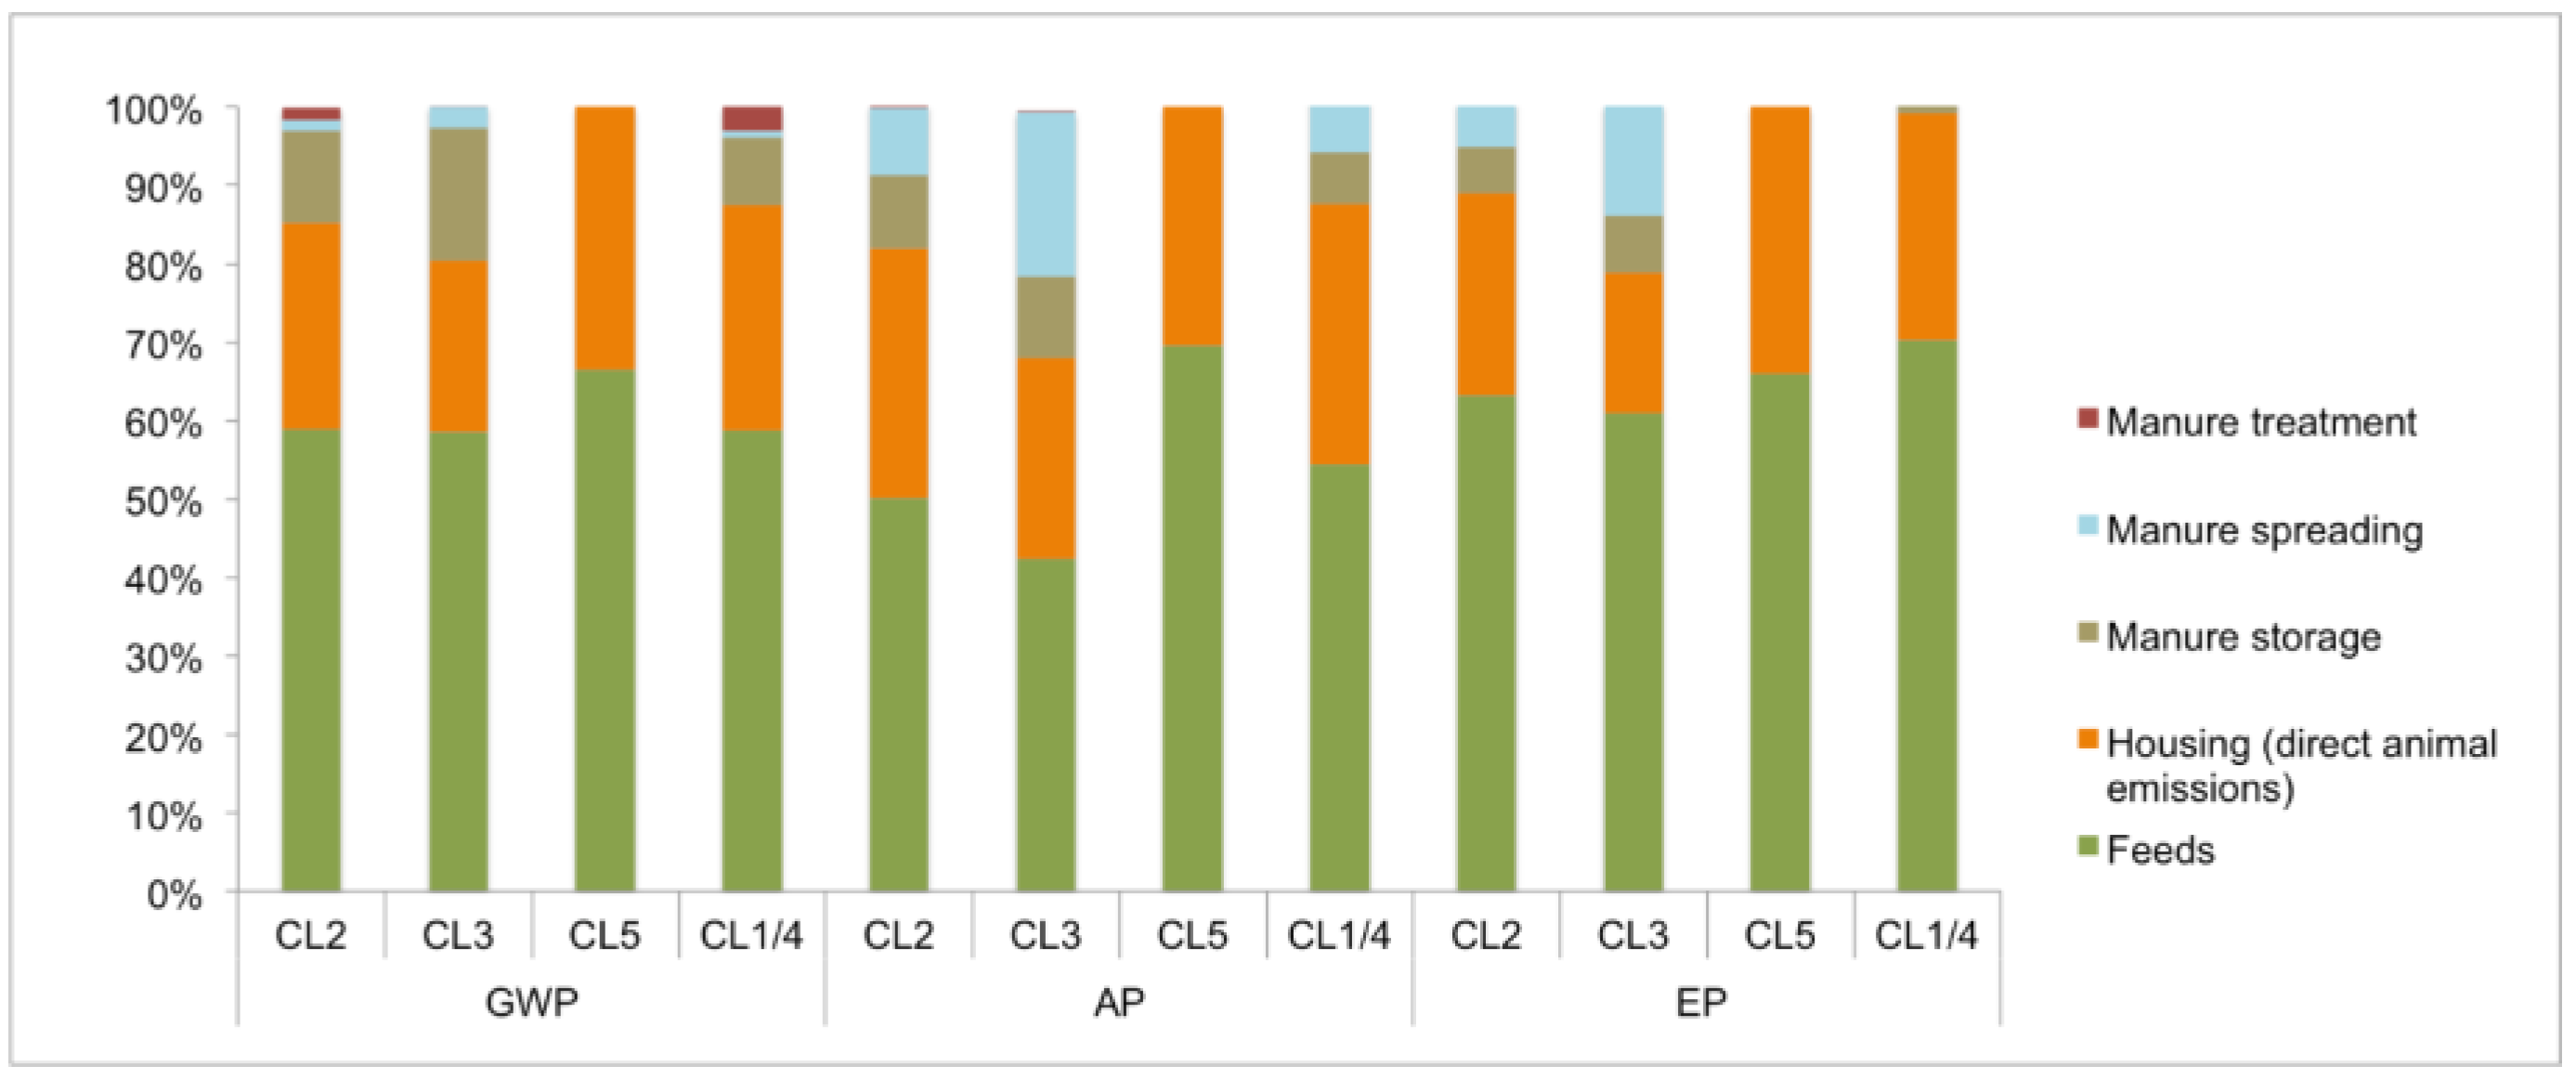
Generally, environmental impact indicators were predominantly influenced by emissions from feed and housing (direct emissions during animal keeping). Numerically, the low impact cluster had the lowest contributions from these sources and Cluster 5 the highest.
Regarding GWP, the intermediate and high impact clusters had relatively comparable values, which were slightly higher in the high impact cluster, but the contribution of the different sources to total GWP differed numerically; the intermediate impact cluster was characterized by higher amounts from feed and housing, while the contribution of manure storage and spreading was higher in the high impact cluster. Considering AP and EP, the main difference leading to numerically higher amounts in the high impact cluster compared to the intermediate impact cluster, were emissions from manure spreading (
Figure 3).
Median numbers of sows, livestock units, and finishing pigs slaughtered per year per cluster ranged between 28 and 110, 38 to 121, and 324 to 859, respectively. These characteristics relating to farm size were numerically lowest for the high impact cluster, while the highest values were found in the intermediate impact cluster. The values for the low impact cluster were between those for the intermediate and high impact cluster. There were, however, no statistical differences between impact clusters in these parameters (see
Supplementary Materials,
Table S8).
The average weight of pigs at the end of the post-weaning period differed between clusters as shown in
Table 8. In the intermediate impact cluster, pigs entering the finishing phase were heavier than in the high impact cluster (
p = 0.012). Lower weights at the start of the fattening phase had a negative effect on environmental impact indicators. Feed conversion for fattening pigs in the low impact cluster was lower than in the intermediate and high impact clusters (
p < 0.001). In line with this, the total amount of feed per finished pig was lower in the low impact cluster in comparison to the high impact cluster (
p < 0.001) and to the intermediate impact cluster (
p = 0.006;
Table 9). Improved feed conversion and lower feed consumption in the low impact cluster had a beneficial effect on environmental impacts. However, mortality of finishers was higher in the low impact cluster than in the high impact cluster (
p < 0.001;
Table 8). The percentage of bought-in feed in finishing diets (
Table 9) was lower for the high impact cluster in comparison to the low impact cluster (
p = 0.000) and the intermediate impact cluster (
p < 0.001). Additionally, in the low and high impact cluster, more leguminous grains were fed than in the intermediate impact cluster (
Table 10).
The high impact cluster showed a higher proportion of PCs feeding sufficient digestible lysine to finishing pigs, compared to the intermediate impact cluster (64.3% vs. 6.3%, respectively;
p = 0.001;
Table 11). There were no differences in the proportion of deficient or excess diets for growing and finishing pigs, but the low impact cluster still showed a high proportion of diets with sufficient digestible lysine content (41.2%). Across the growing and finishing diets, the low impact cluster showed the highest proportion of diets without deficient digestible lysine (82.4%).
4. Discussion
4.1. General Discussion and Comparison with Other Studies
Both hypotheses were confirmed: For all environmental impact categories, variation was greater within than between systems, with no distinct differences between husbandry systems regarding their environmental impact. Furthermore, farm characteristics contributing to environmental impact were identified, and they were mainly related to performance (e.g., piglets weaned per sow and year, fattening pig feed conversion ratio) and feed characteristics (e.g., percentage of bought-in feed stuff in fattener diets; see
Section 4.2).
The selected classification was chosen according to [
1], who found that specific characteristics (e.g., farm size, breeds, live-weights at slaughtering, etc.) of organic farms suggest this differentiation into the three husbandry systems. It may be used to inform the organic sector regarding the strengths and weaknesses of these three widely used systems’ variants, and the results may serve as a basis for system-specific mitigation strategies. The large range of results indicates potential for improvement within all three systems. Cluster analysis was used to investigate further classification. It was interesting to find high, medium, and low impact clusters independently from husbandry systems, but with characteristics regarding feeding and performance, which are mainly affected by management decisions.
Comparing different LCA studies should always be done with caution due to differences in underlying methodology, assumptions, and chosen system boundaries [
45]. The present study addressed, for the first time, the environmental impact of different organic pig husbandry systems based on data obtained from 64 individual farrow-to-finish production chains across several European countries. In accordance with [
9], there was a high variation in environmental impact among farms in the present study, indicating that individual farm characteristics highly influenced the outcome.
Other authors report comparable GWP, but rather different AP and EP (
Table 12). A possible reason is that the GWP originating from the main emission source feedstuffs does not differ widely, except for those loaded with high emissions from land use change. However, in organic systems, comparably low emissions occur from land use change. Contrarily, emission factors regarding AP and EP show a higher variation between animals kept indoors or outdoors. Additionally, methodological differences between studies (e.g., system boundaries, emission factors, type of allocation) could have contributed to the great variation.
In general, most of our results are within the ranges reported in the literature, e.g., as provided in a review of six comparable LCA studies of pork products [
4] (
Table 12). The authors also found a large variation, especially regarding acidification and eutrophication potential.
Our results are particularly comparable to results reported by [
15], who used a similar methodology and system boundaries for an evaluation of 15 pig farming systems from five European countries. For each pig farming system, data from five to 10 farms were obtained from surveys, and systems were categorized into conventional, adapted conventional, traditional, and organic. Feed production contributed less to EP in organic systems than in the others [
15]. In the present study, the results regarding EP (medians ranging from 20.1 to 28.7 g PO
4-eq per kg live weight) exceed the values for organic farms found by [
15]; 16 g PO
4-eq), and are in the range reported for conventional systems. The higher EP in the present study may, on the one hand, be due to a poorer median feed conversion ratio in IN, POUT, and OUT than found by [
15]. On the other hand, due to the assumption of a 5% PO
4-surplus over yield-related plant requirements, our methodological approach might have resulted in higher PO
4-emission estimates from feed production.
Regarding AP, [
15] found higher medians for organic systems than for POUT and OUT in the present study. The even higher median AP found in IN compared to [
15] may be attributed to higher emissions from manure management (storage and spreading) as well as from feed, which resulted mainly from a poorer feed conversion ratio in fatteners in the present study compared to [
15].
4.2. Factors Influencing the Environmental Impacts
In terms of the relative impact of feed on GWP, AP, and EP, results presented herein agree with those of other LCA studies [
10,
22,
33,
46,
47]. Dolman et al. [
9] calculated correlations between farm characteristics and environmental impact: All environmental indicators correlated positively with feed intake and dietary composition. Likewise, and in accordance with [
22], who identified the feed conversion ratio in fatteners as the parameter with the greatest influence on LCA outcomes, in the present study, the feed conversion ratio was significantly lower for fatteners in the low impact cluster. The percentage of bought-in feed for fattener diets (%) was weakly negatively correlated with AP. This might indicate that these feeds either were loaded with relatively low AP or the feeds contributed to a better balanced diet and hence an improved feed conversion.
Regarding the relative contribution (%) of feedstuff categories to the environmental impact indicators, significant correlations were only found for EP. The proportion of high-protein by-products and minerals negatively correlated with EP, while the proportion of cereal grains was positively correlated. This might indicate that high-protein by-products and minerals contribute to a better balanced diet. Furthermore, for fed by-products, a relatively low proportion of impacts from crop production and processing is allocated to the co-product feed (e.g., molasses or oil cakes), and a rather high share to the main product, e.g., sugar or oil.
The average fattener carcass weight (kg) was positively correlated with AP and EP, as during the fattening stage a large proportion of emissions arise. Towards the end of the fattening period the amount of feed needed for 1 kg of weight gain increases in comparison to earlier growing stages [
42].
Furthermore, reproductive performance, especially the number of piglets born alive per litter, has been described as an important influencing factor [
23,
48]. However, as for all associations found in the present study, only weak correlations regarding sow fertility and the environmental impacts were found. The number of total born (still and live born) piglets per litter negatively correlated with EP. However, the correlation coefficient again indicated only a weak relationship, therefore, the results do not allow for strong conclusions. Emissions originating from the sows are allocated to their offspring, and, therefore, higher litter sizes may be regarded as beneficial if all piglets survive and grow adequately. However, in light of the effect of litter size on piglet mortality [
20], the focus should be on an adequate litter size, with robust and viable piglets. This suggestion fits to the number of piglets weaned per sow and year being negatively associated with all environmental impact indicators, which may indicate that farms with good management and productivity are at an advantage.
Two farm characteristics describing the size of the pig units (number of slaughtered pigs, livestock units per PC) negatively correlated with AP and EP, with larger PCs having lower AP and EP. The current number of sows per PC was also weakly negatively correlated with AP, in line with the results for other farm size-related characteristics. These results may indicate that larger farms who are more efficient in managing their pigs, eventually connected with better trained farm staff. Similarly, negative correlations were found between the average number of fattening pigs and environmental impact indicators in [
9], but this relationship is not considered as causal and may have been related to potentially better management in larger farms.
4.3. Limitations of the Method and Uncertainties
The present study used primary data from a non-representative sample of farms instead of modelled data based on assumptions. Therefore, sensitivity analyses, which are used for specific scenarios, were not applied here. Besides the influence of the PC-specific characteristics, LCA results depend on underlying methodological assumptions (e.g., emission factors for different floor types, allocation approach [
49]). The degree of uncertainty for estimates revealed from these assumptions might vary between PCs, and estimates may therefore not be fully appropriate for the diverse husbandry systems in organic pig farming. A Monte Carlo analysis for the calculation of uncertainties of primary data as well as emission factors, describing the uncertainty areas of GWP, AP, and EP results, was not applied in the present study. In future studies on organic pig production, an analysis of the uncertainties with data from a representative sample of farms should be implemented. In addition, expanded system boundaries (including, for instance, the impacts of infrastructure) should be considered in future studies.
In case of emissions from feed production, uncertainty also arises from the fact that all countries’ estimates were based on data for organic feed production in Austria. This approach was considered as the best option, as comprehensive region-specific data for the production of organic feedstuffs is not available and calculations of these would have been beyond the project resources.
Furthermore, farm-specific primary data, such as the feed conversion ratio, may be a source of uncertainty. The calculation of the feed conversion ratio is based on feed use (kg feed fed per day) as reported by the farmers; losses of feed, occurring especially outdoors, were probably not taken into consideration by some farmers. Therefore, the calculated feed conversion ratio might be higher (i.e., poorer) than the true feed conversion ratio. However, in terms of environmental impact, the amount of feed should include feed losses.
These limitations offer possible improvements for future studies. As the limitations concern all husbandry systems, they are not expected to affect the analysis of differences between husbandry systems. Furthermore, LCA takes numerous aspects into account; if weaknesses concern single aspects, this does not reduce the meaningfulness of the calculation. Finally, it must be mentioned that, despite these limitations, the data available for the present PC-specific cradle-to-farm gate LCA with a high number of organic pig farms included and taking different husbandry systems into account are unique.
5. Conclusions
Regarding environmental impact, a substantial variation was found between individual PCs. The ranking of the husbandry systems was not consistent regarding environmental impact; whereas the (median) GWP was similar in all systems; POUT had less AP than IN, and less EP than OUT.
The huge variation among PCs indicates that LCAs based on mean values of model scenarios will not necessarily be representative for individual farms, which may be subsumed in the modelled scenario. This reflects the importance of farm specific cradle-to-farm-gate assessments, rather than generalized scenarios for identifying the extent and the main sources of environmental impact in the different husbandry systems (IN, POUT, OUT).
In all husbandry systems, PCs with low environmental impacts were found, indicating that IN and POUT as well as OUT may be managed in an environmentally friendly way. However, a lack of consistent differences between husbandry systems, as well as results from cluster analysis, indicate that factors other than the husbandry systems affect the environmental impact of organic pig production.
Feeds generally constitute an important source for environmental impact, with the feed conversion ratio of fattening pigs being particularly important. Based on cluster analysis, an appropriate dietary digestible lysine content as well as buying in feedstuffs for supplementation of protein or minerals appears to be beneficial for a low environmental impact.
Furthermore, manure management (storage and spreading) was identified as a main source of emissions. Measures, such as covering slurry tanks and direct application of manure to the soil, offer mitigation options.
The results indicate that an overall good farm management and adequate productivity reduces the environmental impacts, and hence optimization of management should be the focus irrespective of the production system.

 ,
, 


