Article

Response of Soil Moisture to Single-Rainfall Events under Three Vegetation Types in the Gully Region of the Loess Plateau

1
College of Soil and Water Conservation, Beijing Forestry University, Beijing 100083, China
2
Beijing Collaborative Innovation Center for Eco-environmental Improvement with Forestry and Fruit Trees, Beijing 102206, China
3
Ji County Station, Chinese National Ecosystem Research Network (CNERN), Beijing 100083, China
4
Key Laboratory of State Forestry Administration on Soil and Water Conservation, Beijing Forestry University, Beijing 100083, China
5
Beijing Engineering Research Center of Soil and Water Conservation, Beijing Forestry University, Beijing 100083, China
6
Engineering Research Center of Forestry Ecological Engineering, Ministry of Education, Beijing Forestry University, Beijing 100083, China
*
Author to whom correspondence should be addressed.
Sustainability 2018, 10(10), 3793; https://doi.org/10.3390/su10103793
Submission received: 26 September 2018 / Revised: 16 October 2018 / Accepted: 18 October 2018 / Published: 20 October 2018

Abstract

:
Precipitation is the main source of soil moisture recharge in the gully region of the Loess Plateau, and soil moisture is the main and most important water resource for vegetation activities in semiarid regions. To identify the contributions to soil moisture replenishment from rainfall of different intensities, this study conducted a soil moisture monitoring experiment involving continuous measurements at 30-min intervals in areas of Robinia pseudoacacia artificial forestland, Pinus tabulaeformis artificial forestland, and grassland from 1 March to 31 November 2017. The results indicated that there was a positive relationship between the infiltration coefficient and precipitation until the relationship obtained a stable value. When the precipitation was greater than 30 mm, soil moisture was replenished up to the 150 cm soil layer in grassland, and when the precipitation was greater than 40 mm, soil moisture was replenished up to the 150 cm soil layer in P. tabulaeformis artificial forestland. However, only precipitation greater than 50 mm replenished the soil moisture at the 150 cm soil layer in R. pseudoacacia artificial forestland. These three vegetation communities play important roles in soil and water conservation during ecological restoration. The results of this study can guide vegetation configurations in vegetation recovery and reconstruction efforts in the gully region of the Loess Plateau.

1. Introduction

As the global temperature increases and rainfall decline each year, climate-induced forest degradation is becoming a new kind of ecological environment [1]. A previous study showed that evapotranspiration exceeded precipitation, and drought climates occurred frequently, demonstrating that water is the main factor affecting the survival and growth of vegetation [2,3]. Additionally, soil water, along with the water intercepted by the canopy and litter, is a vital part of the hydrological process [4]. In addition, soil water has a large reservoir in the soil [5,6]. T is the main and most important water resource for vegetation in semiarid regions [7,8,9] and has high spatiotemporal variability [10]. However, the regulation of spatial and temporal changes in soil water in forestland differs from that in other water-limited areas. This regulation has important eco-hydrological roles and has not received sufficient attention. Therefore, it is necessary to identify the response of soil water to rainfall events under different restoration vegetation communities when the soil water recharge is insufficient in semi-arid regions.
Soil water plays an important driving role in vegetation growth over the entire plant life cycle. Additionally, soil water is a key factor affecting the trends and rates of vegetation succession. The importance of soil water is particularly apparent in the semi-arid hilly region of the north-western Loess Plateau in China [9]. It has been shown that a strong relationship exists between the positive feedback mechanisms and vegetation communities [11,12,13]. Previous studies have reported spatial-temporal variability in soil moisture at macro scales (e.g., the catchment scale, the regional scale and the continental scale) and at micro-scales (e.g., the field scale and the sample scale) [14,15,16,17,18,19]. Recently, some studies have shown that changes in soil water dynamics can affect the climate, soil, vegetation, and topography [20,21,22]. Additionally, effective precipitation and the aboveground structure of land-use systems affect the recharge and output processes of soil water [23,24]. However, our understanding of the change regularity of soil moisture is still not complete. Identifying plant-soil-water interactions is a popular topic in the field of ecohydrology.
Vegetation growth is strongly affected by the spatial reallocation of soil moisture, primarily due to precipitation-intercepting effectiveness and soil-infiltrating effectiveness [25,26,27,28]. Previous studies have reported the effect of vegetation restoration on the eco-hydrological system in the Loess region. For example, Chang et al. [29,30] evaluated dynamic changes in soil moisture and found that the dynamics of soil moisture could be divided into a stable stage, a fluctuating stage, an accumulative stage and the consumption stage.
The semi-arid gully region of the Loess Plateau of China has recently experienced ecological degradation at an alarming rate due to limited precipitation inputs. However, in the last two decades, the gully region of the Loess Plateau of China has been subjected to the conversion of cropland to forest (grassland), and vegetation coverage has significantly increased [31]. The influence of soil water availability on the survival and reproduction of vegetation has become a popular research topic, and related studies have been conducted on the Loess Plateau for decades. The knowledge gap regarding the relationships between soil water dynamics and vegetation growth in different types of vegetation has not been filled. It is necessary to study the contributions of effective rainfall to soil water recharge under different vegetation recovery communities, such as coniferous forestland (Pinus tabulaeformis), broad-leaf forestland (Robinia pseudoacacia) and grassland. In the present study, three typical communities in the gully region of the Loess Plateau, i.e., coniferous forestland (P. tabulaeformis), broad-leaf forestland (R. pseudoacacia) and grassland, were selected as research areas for field measurements. The results on the contributions of effective rainfall on soil water recharge under different rainfall intensities can guide vegetation restoration and stand management.
The objectives of this study were to (1) compare the changes in the temporal and spatial variations in soil moisture among three vegetation communities (R. pseudoacacia artificial forestland, P. tabulaeformis artificial forestland and grassland) and (2) identify the contribution rate of soil moisture recharge at different soil layers under different precipitation levels in the three vegetation communities.

2. Materials and Methods

2.1. Study Area

The study area is located in the Hongqi forest farm in the city of Jixian, Shangxi Province China, (110°35′30′′ E, 36°06′32′′–36°06′32′′ N; Figure 1), where the Ecological Station of the Institute of Beijing Forestry University is located. The average annual temperature is approximately 9.9 °C, and the mean annual precipitation is approximately 521 mm. The distribution of precipitation is nonuniform throughout the year, with precipitation concentrated from June to September, representing approximately 70% of the total annual precipitation. The mean annual evapotranspiration is 1694.1 mm (1974–2013) [32]. To study hydrological processes, three land use types were selected to measure soil moisture (Figure 1): coniferous-dominated artificial forestland (P. tabulaeformis), broad-leaf-dominated artificial forestland (R. pseudoacacia) and grassland.

2.2. Experimental Design

2.2.1. Soil Properties Investigation

Three sites were investigated in July 2017 at the Hongqi forest farm in the city of Jixian, Shangxi Province, China. Three plots (20 m × 20 m) were established to investigate the respective stand characteristics (e.g., height, leaf area index, canopy density, individual biomass, herb coverage, aspect and slope) in R. pseudoacacia artificial forestland, P. tabulaeformis artificial forestland and grassland. All three plots were selected based on the same topography characteristics. Soil samples were collected from nine soil profiles at 10 cm, 20 cm, 40 cm, 60 cm, 80 cm, 100 cm, and 150 cm in R. pseudoacacia artificial forestland (three soil profiles), P. tabulaeformis artificial forestland (three soil profiles) and grassland (three soil profiles). Before soil organic matter content (SOMC) and particle size composition analysis, all the soil samples were air dried and sieved through a 2-mm soil sieve.
The soil characteristics of the three vegetation types are listed in Table 1. The SOMC in the R. pseudoacacia artificial forestland was significantly higher than that in either the P. tabulaeformis artificial forestland or the grassland. There were no statistical differences in the sand, silt and clay contents among the three communities.

2.2.2. Forest Stand Characteristics

Height, leaf area index (LAI) and canopy density in the R. pseudoacacia artificial forestland were higher than those in the P. tabulaeformis artificial forestland. Additionally, herb coverage varied among the R. pseudoacacia artificial forestland, P. tabulaeformis artificial forestland and grassland (Table 2).

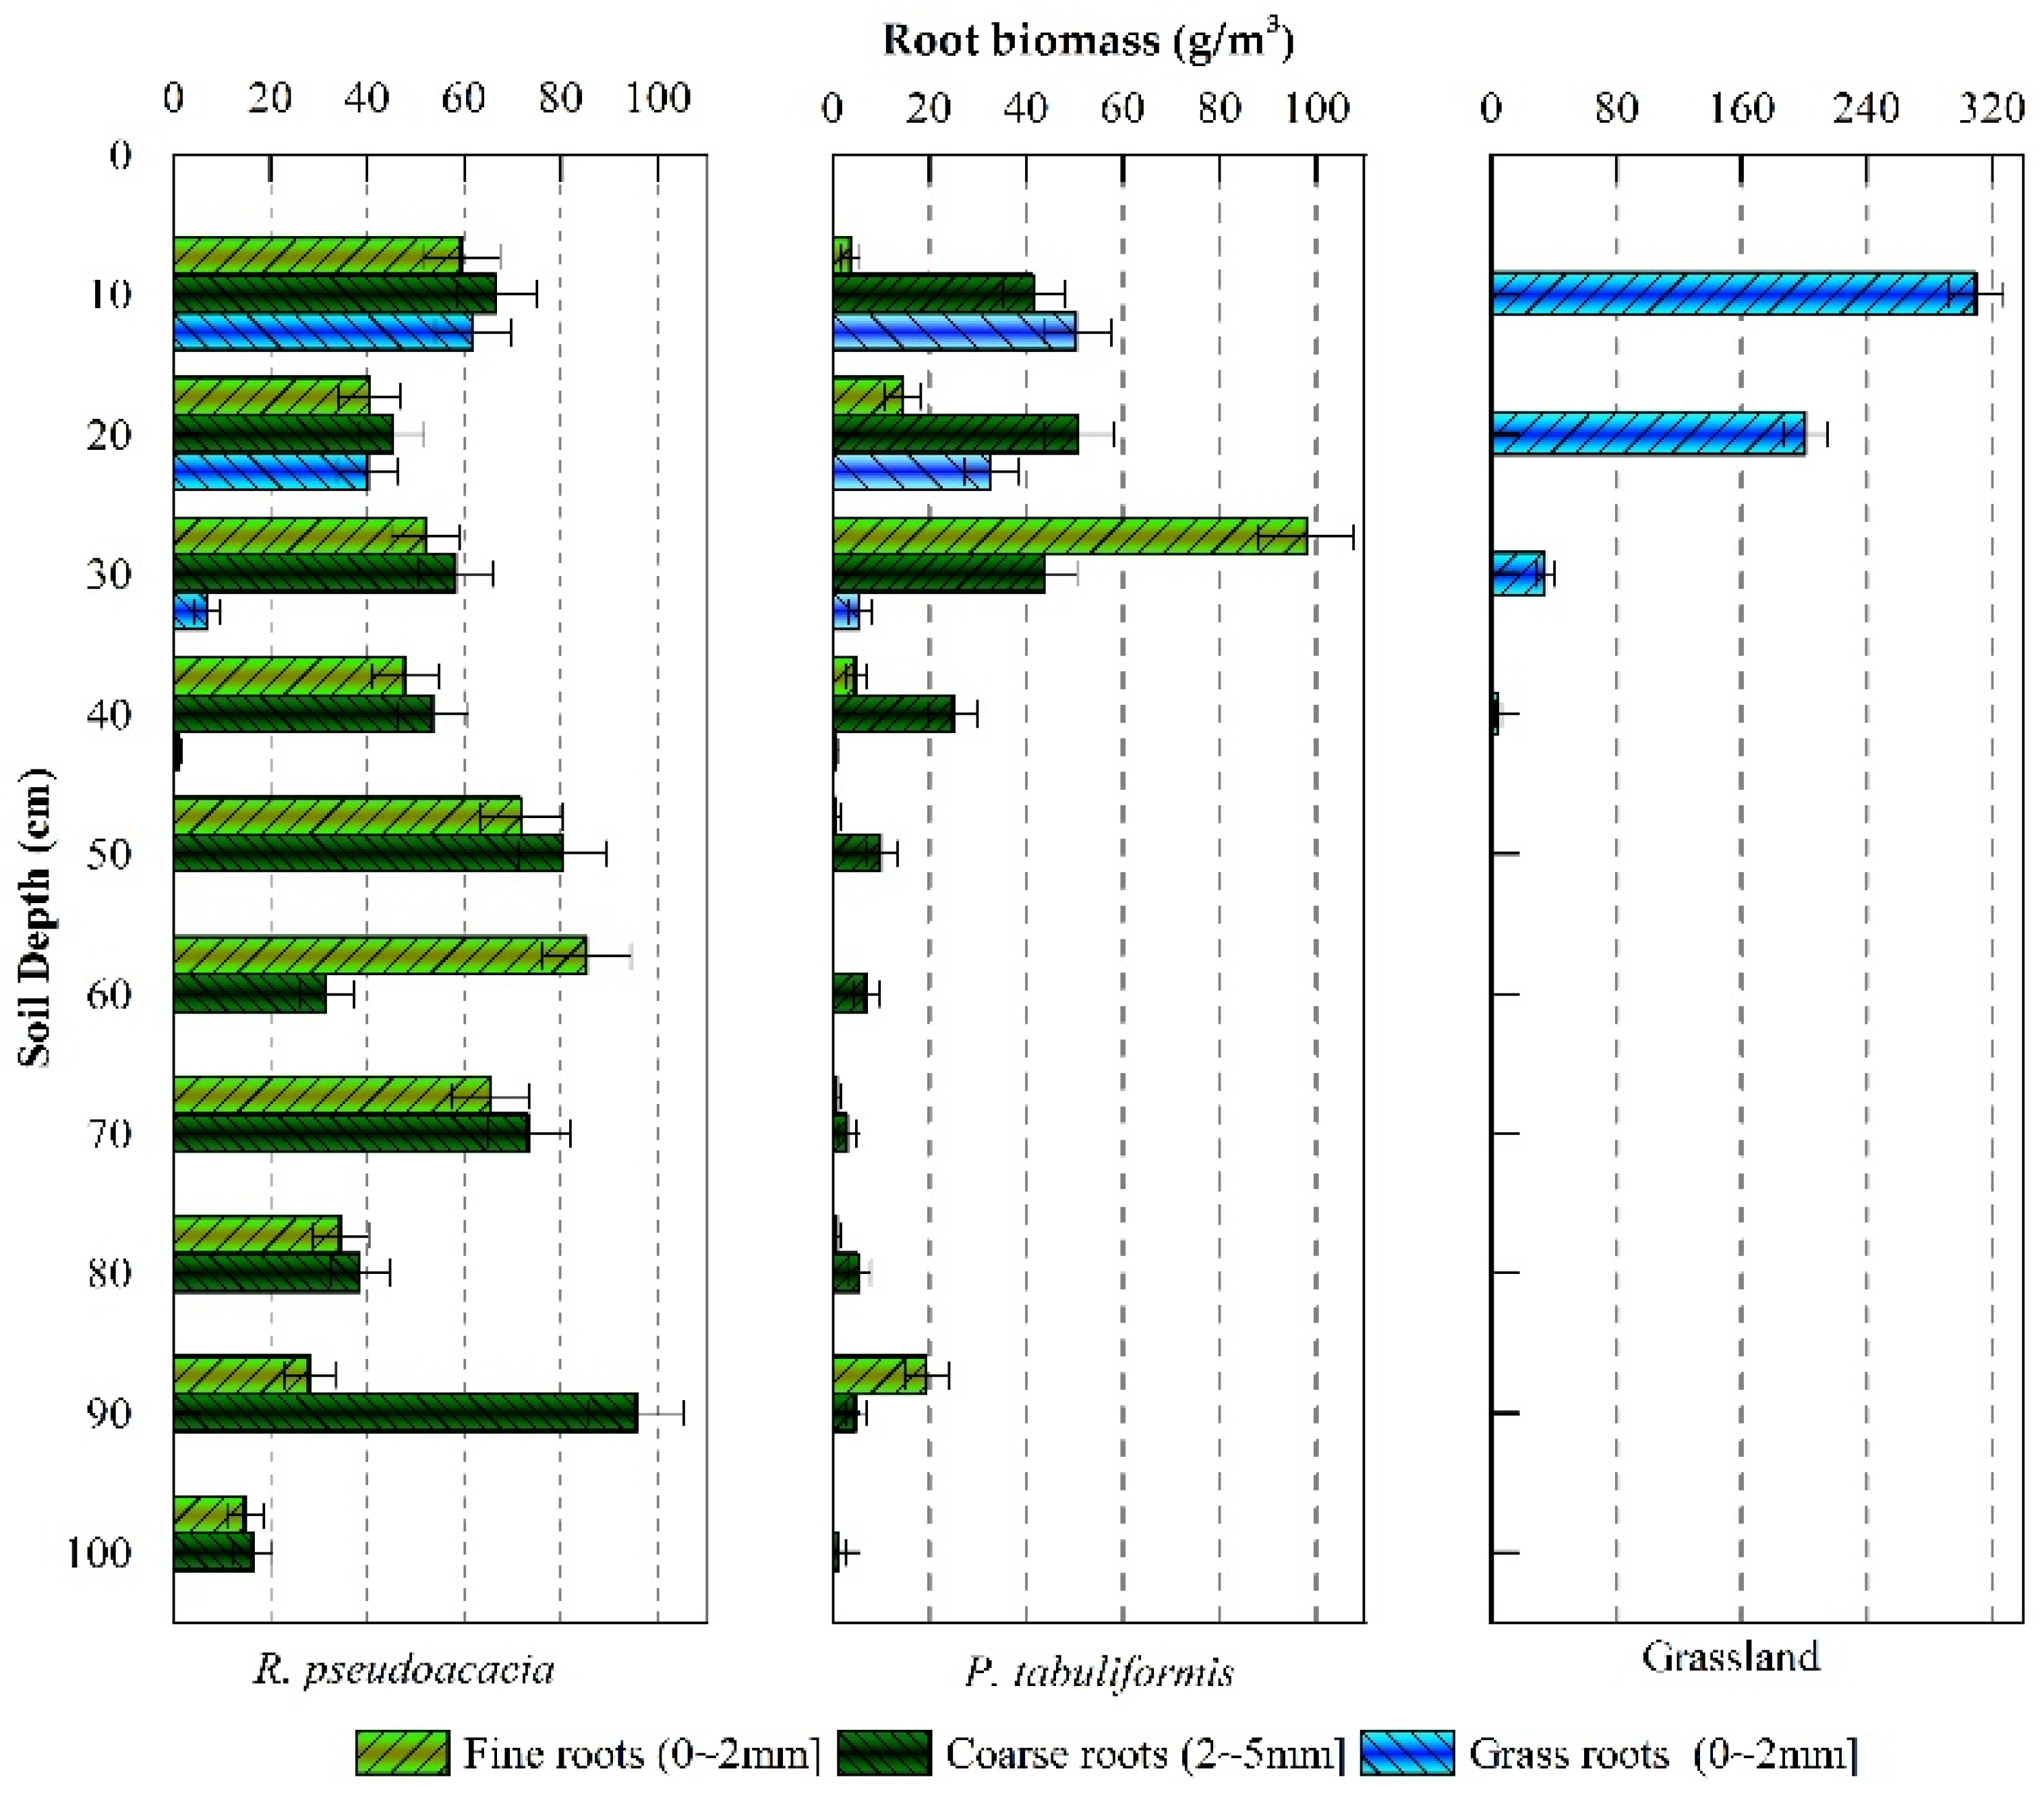
2.2.3. Root Distribution Characteristics

In addition to soil organic matter, the distribution of vegetation roots affects soil structure. Vegetation root systems can increase soil porosity, thereby increasing the soil water infiltration rate and infiltration amount. Root distribution was investigated via a root drill with a depth of 100 cm in 2017. Roots were divided into fine roots (<2 mm) and coarse roots (>2 mm). Dead roots were selected and discarded via visual inspection.
The distribution of underground root biomass was significantly different among the R. pseudoacacia forestland, the P. tabulaeformis artificial forestland, and the grassland (Figure 2). Fine roots were primarily concentrated in the 0–40 cm depth range among the three land use types. Coarse roots were mainly concentrated in the 0–100 cm depth range in the R. pseudoacacia artificial forestland and the P. tabulaeformis artificial forestland. At depths of between 0 and 20 cm, the biomass of fine roots under the grassland were approximately 5 times the value of that in the R. pseudoacacia artificial forestland and ~6 times that in the P. tabulaeformis artificial forestland. Approximately 65% of fine roots were in the 40–80 cm layer in the R. pseudoacacia artificial forestland, and approximately 80% of biomass of fine roots were concentrated in the 20–30 cm layer in the P. tabulaeformis artificial forestland. Approximately 90% of the herb roots were distributed in the 0–20 cm layer in the grassland.

2.2.4. Precipitation

Rainfall and air temperature were monitored and recorded at 10-min intervals using an outdoor mini weather station from 1 March to 31 October in 2017. A total of 82 rainfall events were recorded during the observation period, which corresponded to a precipitation amount of 483.2 mm. Additionally, during the observation period, according to rainfall intensity standards of the State Meteorological Administration of China (Table 3), 16.31% of precipitation was between 0–5 mm which belong to ineffective rainfall; 20.41% of precipitation was between 5–10 mm, which belong to light rainfall, 34.78% of precipitation was between 10–24.9 mm, which belong to moderate rainfall; 16.40% of precipitation was between 24.9–49.9 mm, which belong to heavy rainfall and 12.13% was more than 50 mm, which belong to rainstorm. Among these rainfall events, only 18 rainfall events represented effective rainfall (i.e., precipitation more than 5 mm within 24 h), corresponding to an effective precipitation amount of 460 mm.

2.2.5. Soil Water Content

The soil volumetric water content was automatically and continuously measured at 30-min intervals using the Enviro–SMART Soil Moisture Profile System (Sentek Sensor Technologies, Stepney, SA, Australia), and probes were installed at depths of 10, 20, 40, 60, 100 and 150 cm (Figure 1). Diurnal data soil moisture content (at 30-min intervals) was collected from 1 March to 31 November in 2017.

2.3. Data Analysis

Soil water storage was calculated via Equation (1):
W =   i = 1 ( v r i × h i )
where W represents the soil water storage (mm); v r i is the volumetric soil water content in layer i (%); and h i is the thickness of layer i (mm). The infiltration coefficient (α) was calculated using Equation (2):
α =   W / R
where R is rainfall amount (mm). The cumulative infiltration reflects the replenishment of soil water by rainfall and is calculated via Equations (3) and (4):
Δ H i = ( v e i v i ) × h i
H = i = 1 ( Δ H 1 + Δ H 2 + Δ H n )
where Δ H i is the cumulative infiltration in layer i (mm), v e i is the volumetric soil moisture content in layer i (%); v i is the initial soil moisture content in layer i (%); h i is the thickness of soil layer i (mm); and H is the total cumulative infiltration (mm).
The contribution rate of the recharge amount of soil water at different precipitation intensities was calculated using Equation (5):
C R i =   Δ H i H × 100 %
where C R i (%) is the contribution rate of rainfall to soil water recharge in soil layer i.
SPSS software (ver. 19.0, SPSS Inc., Chicago, IL, USA) was used for all statistical analyses in this study. Differences in the physical and chemical properties of soil and forest stand characteristics were analyzed using one-way analysis of variance (ANOVA) and Fisher’s protected least significant difference (LSD) test (p < 0.05). Origin 9.0 software (Origin Lab, Northampton, MA, USA) was used to produce the graph. Surfer 13.0 (Golden Software, Golden, CO, USA) software was applied to plot the distribution of soil moisture content in the soil profile via Kriging interpolation. Figure 1 was generated with ArcGIS 10.1 (Environmental Systems Research Institute, Inc., Redlands, CA, USA) and AutoCAD 2006 (Autodesk, Inc., San Rafael, CA, USA).

3. Results

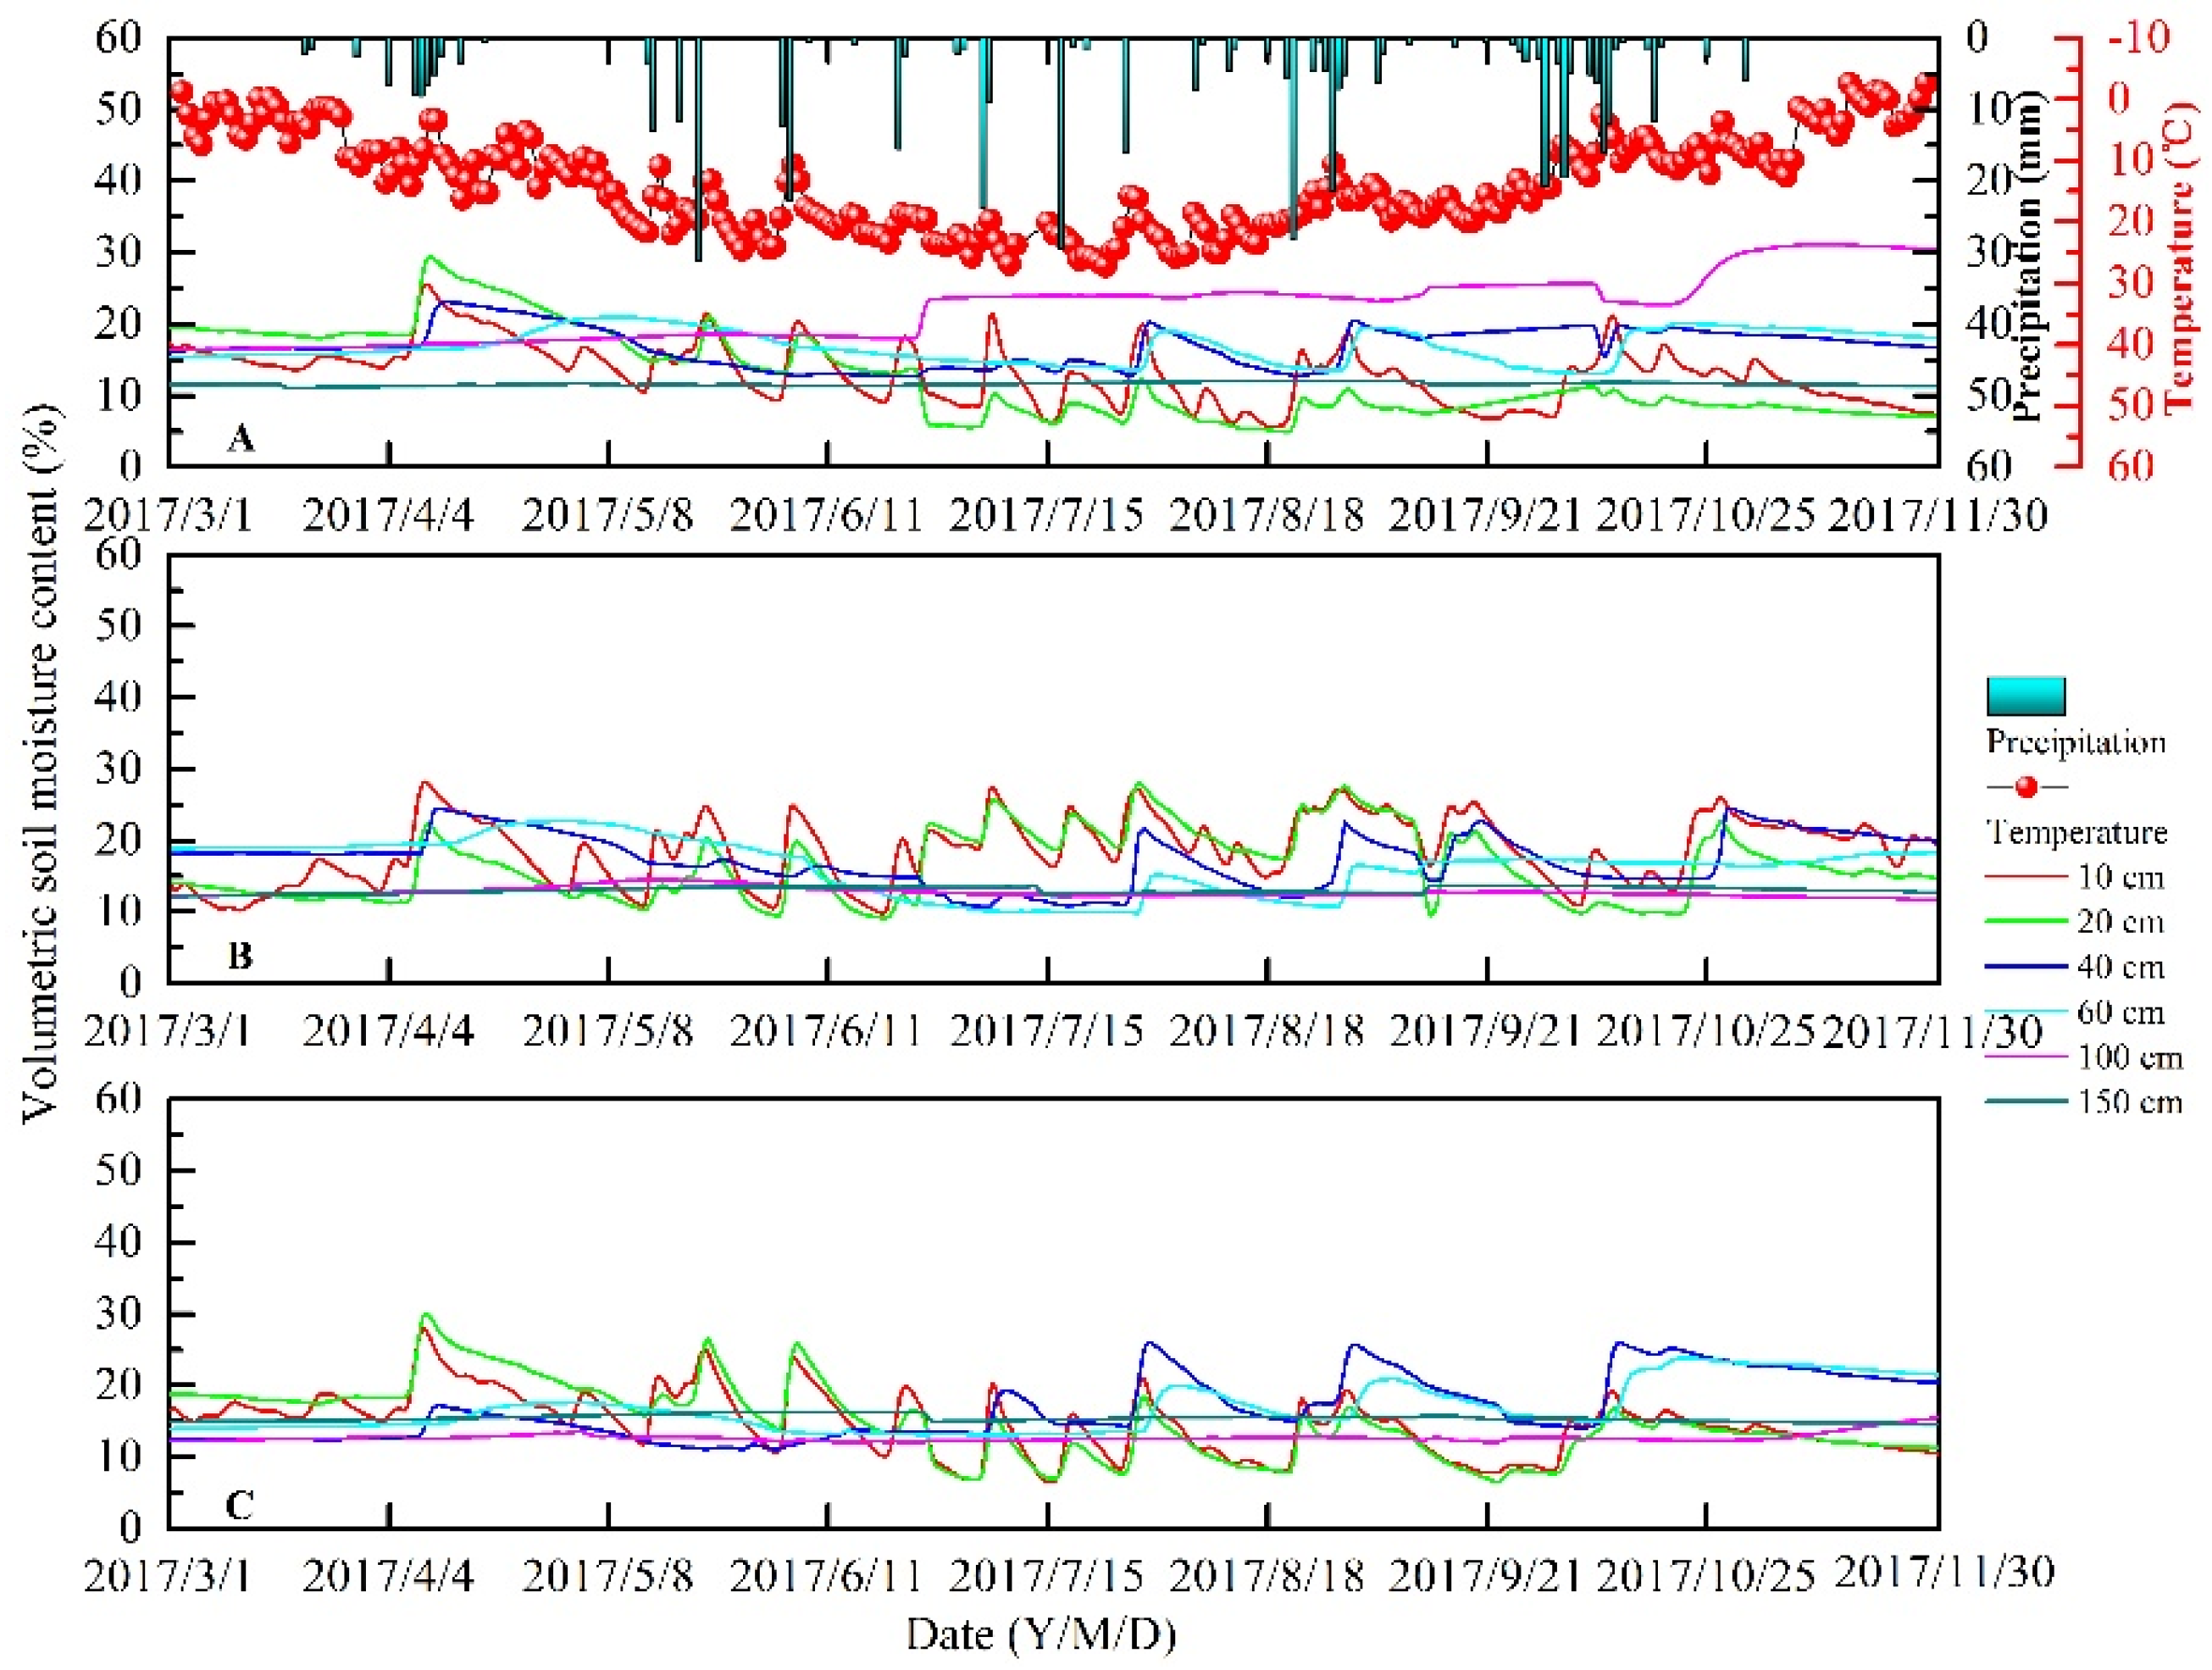
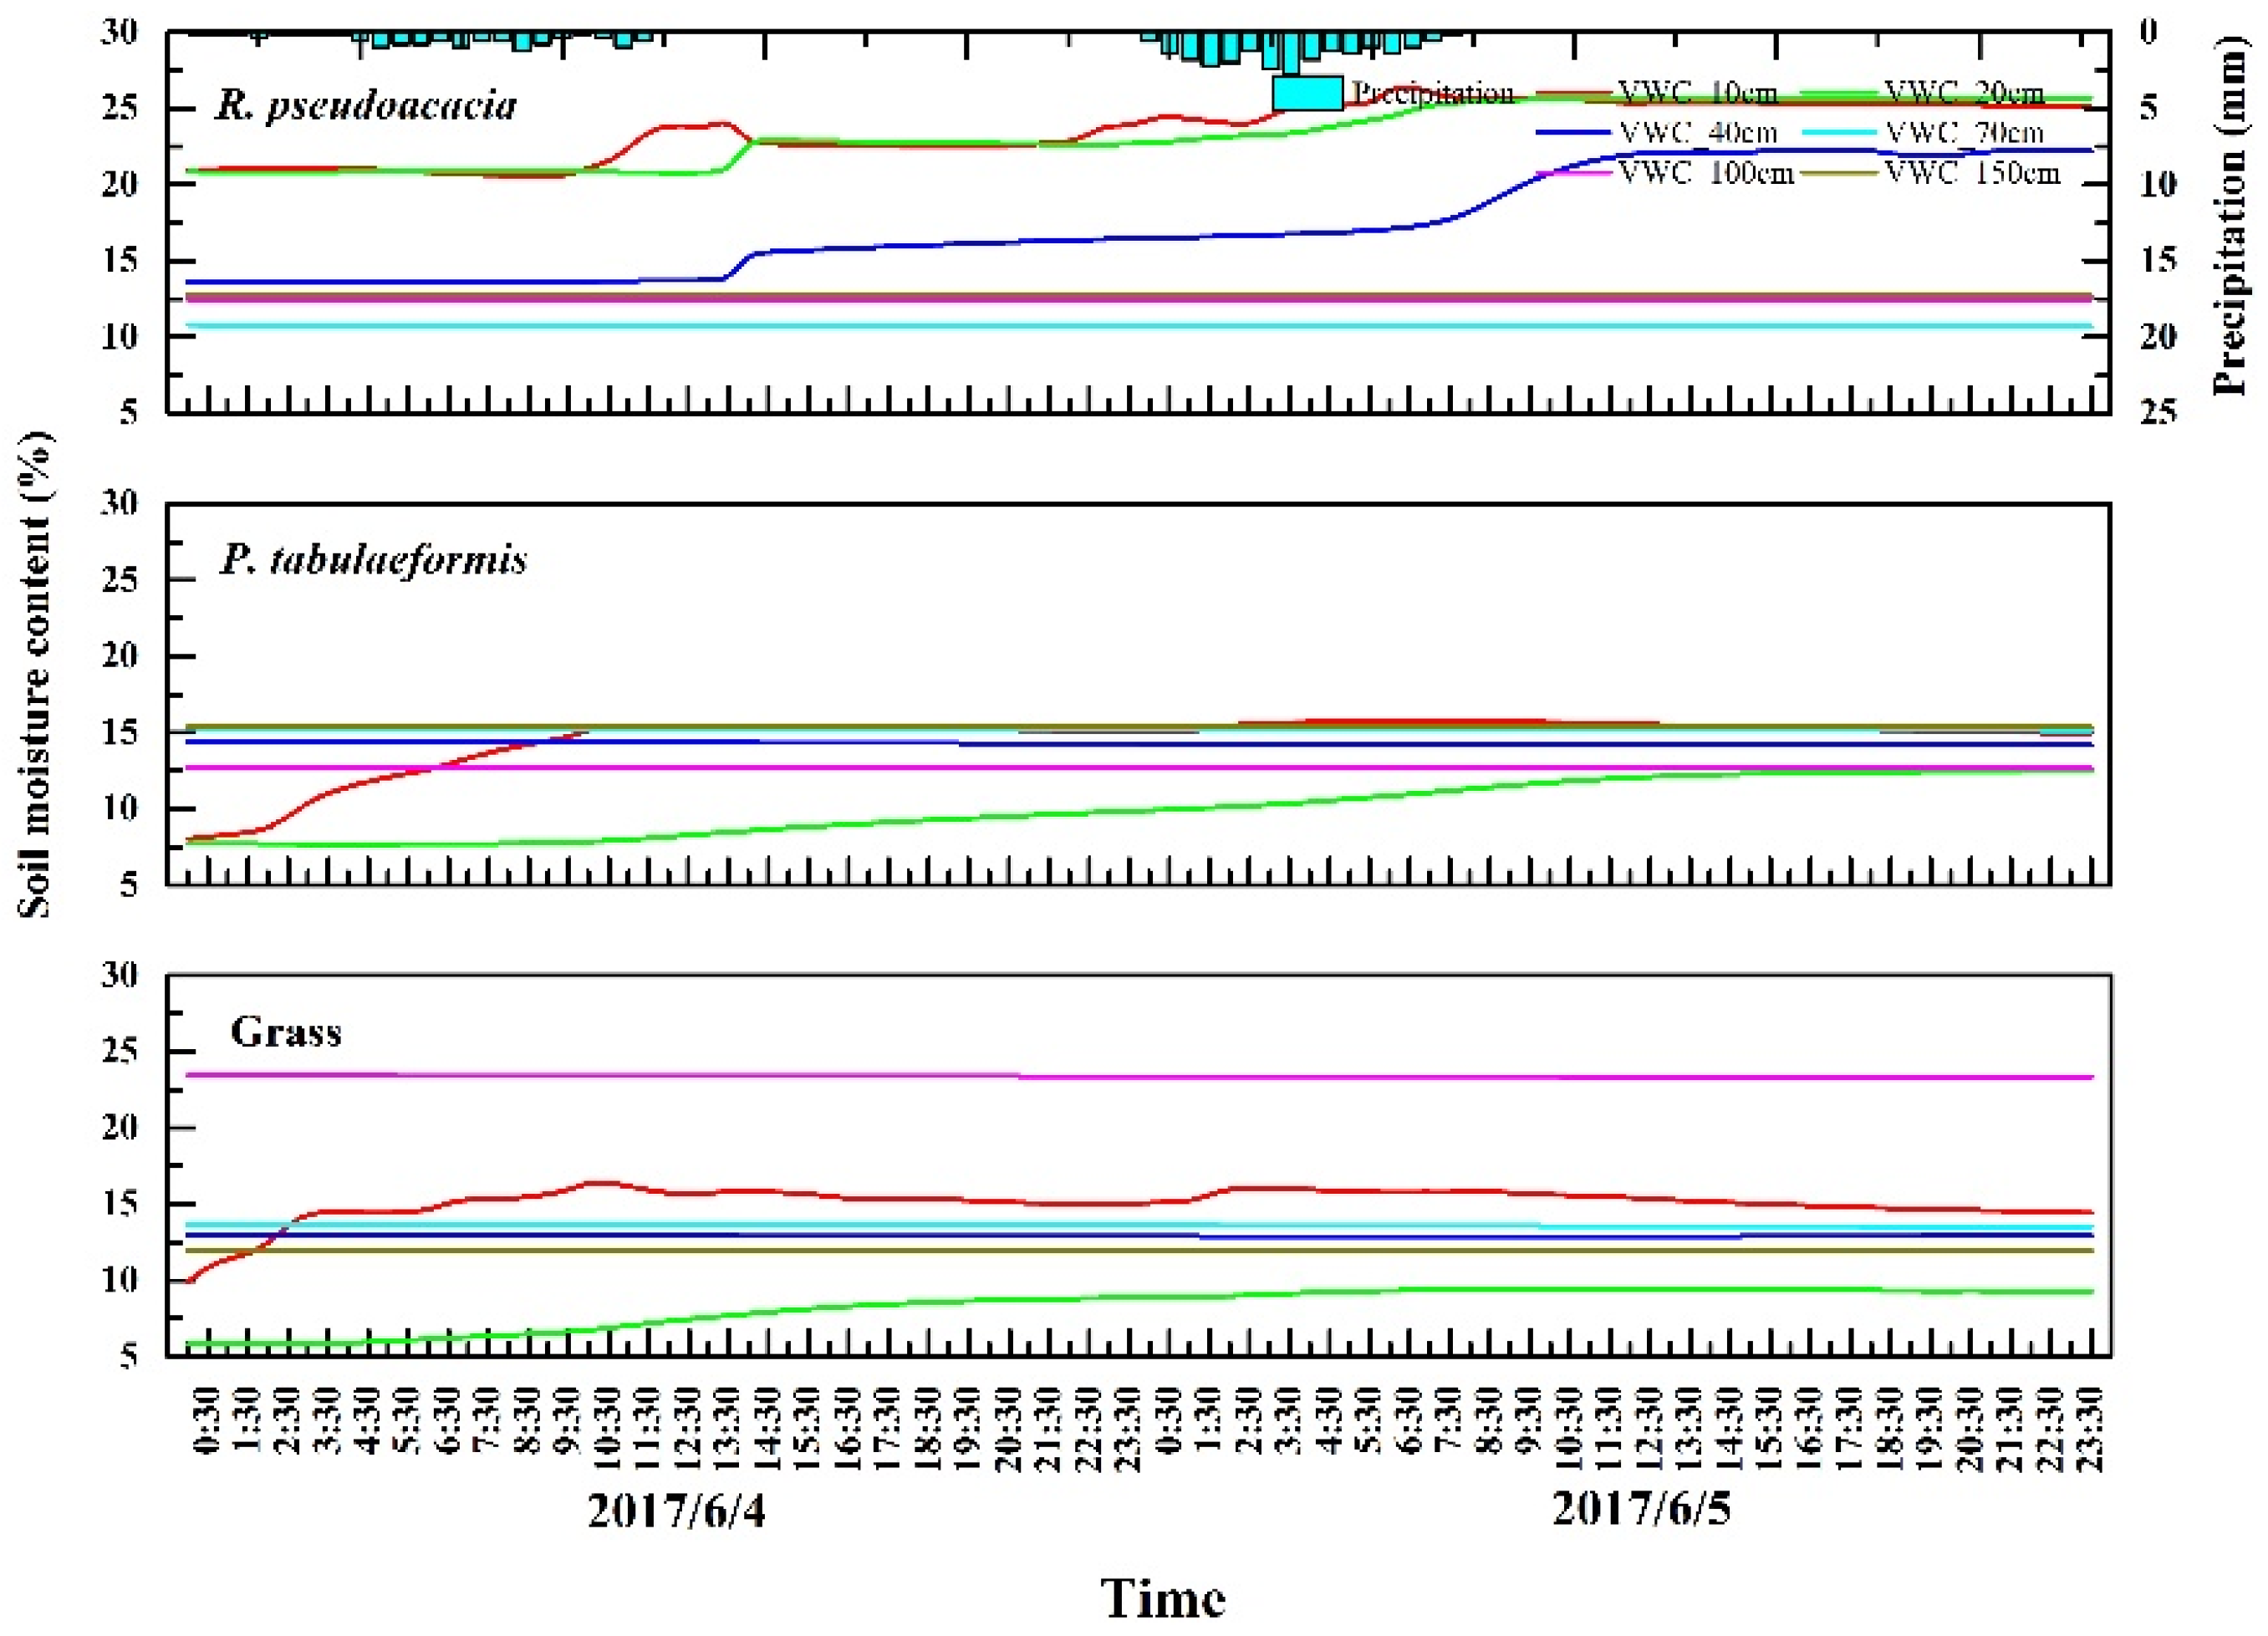
3.1. Temporal Variations in the Characteristics of Soil Moisture

The data on precipitation and soil moisture (from 1 March to 31 October 2017) from the three vegetation communities (R. pseudoacacia artificial forestland, P. tabulaeformis artificial forestland and grassland) were analyzed to reveal the temporal response of soil moisture to rainfall events (Figure 3). The total precipitation calculated from the 18 individual rainfall events was 460 mm during the observation period. Significant differences in the response of soil moisture to each rainfall intensity were observed among the three vegetation communities. Overall, the variation trends and ranges of soil moisture were highly related to rainfall intensity.

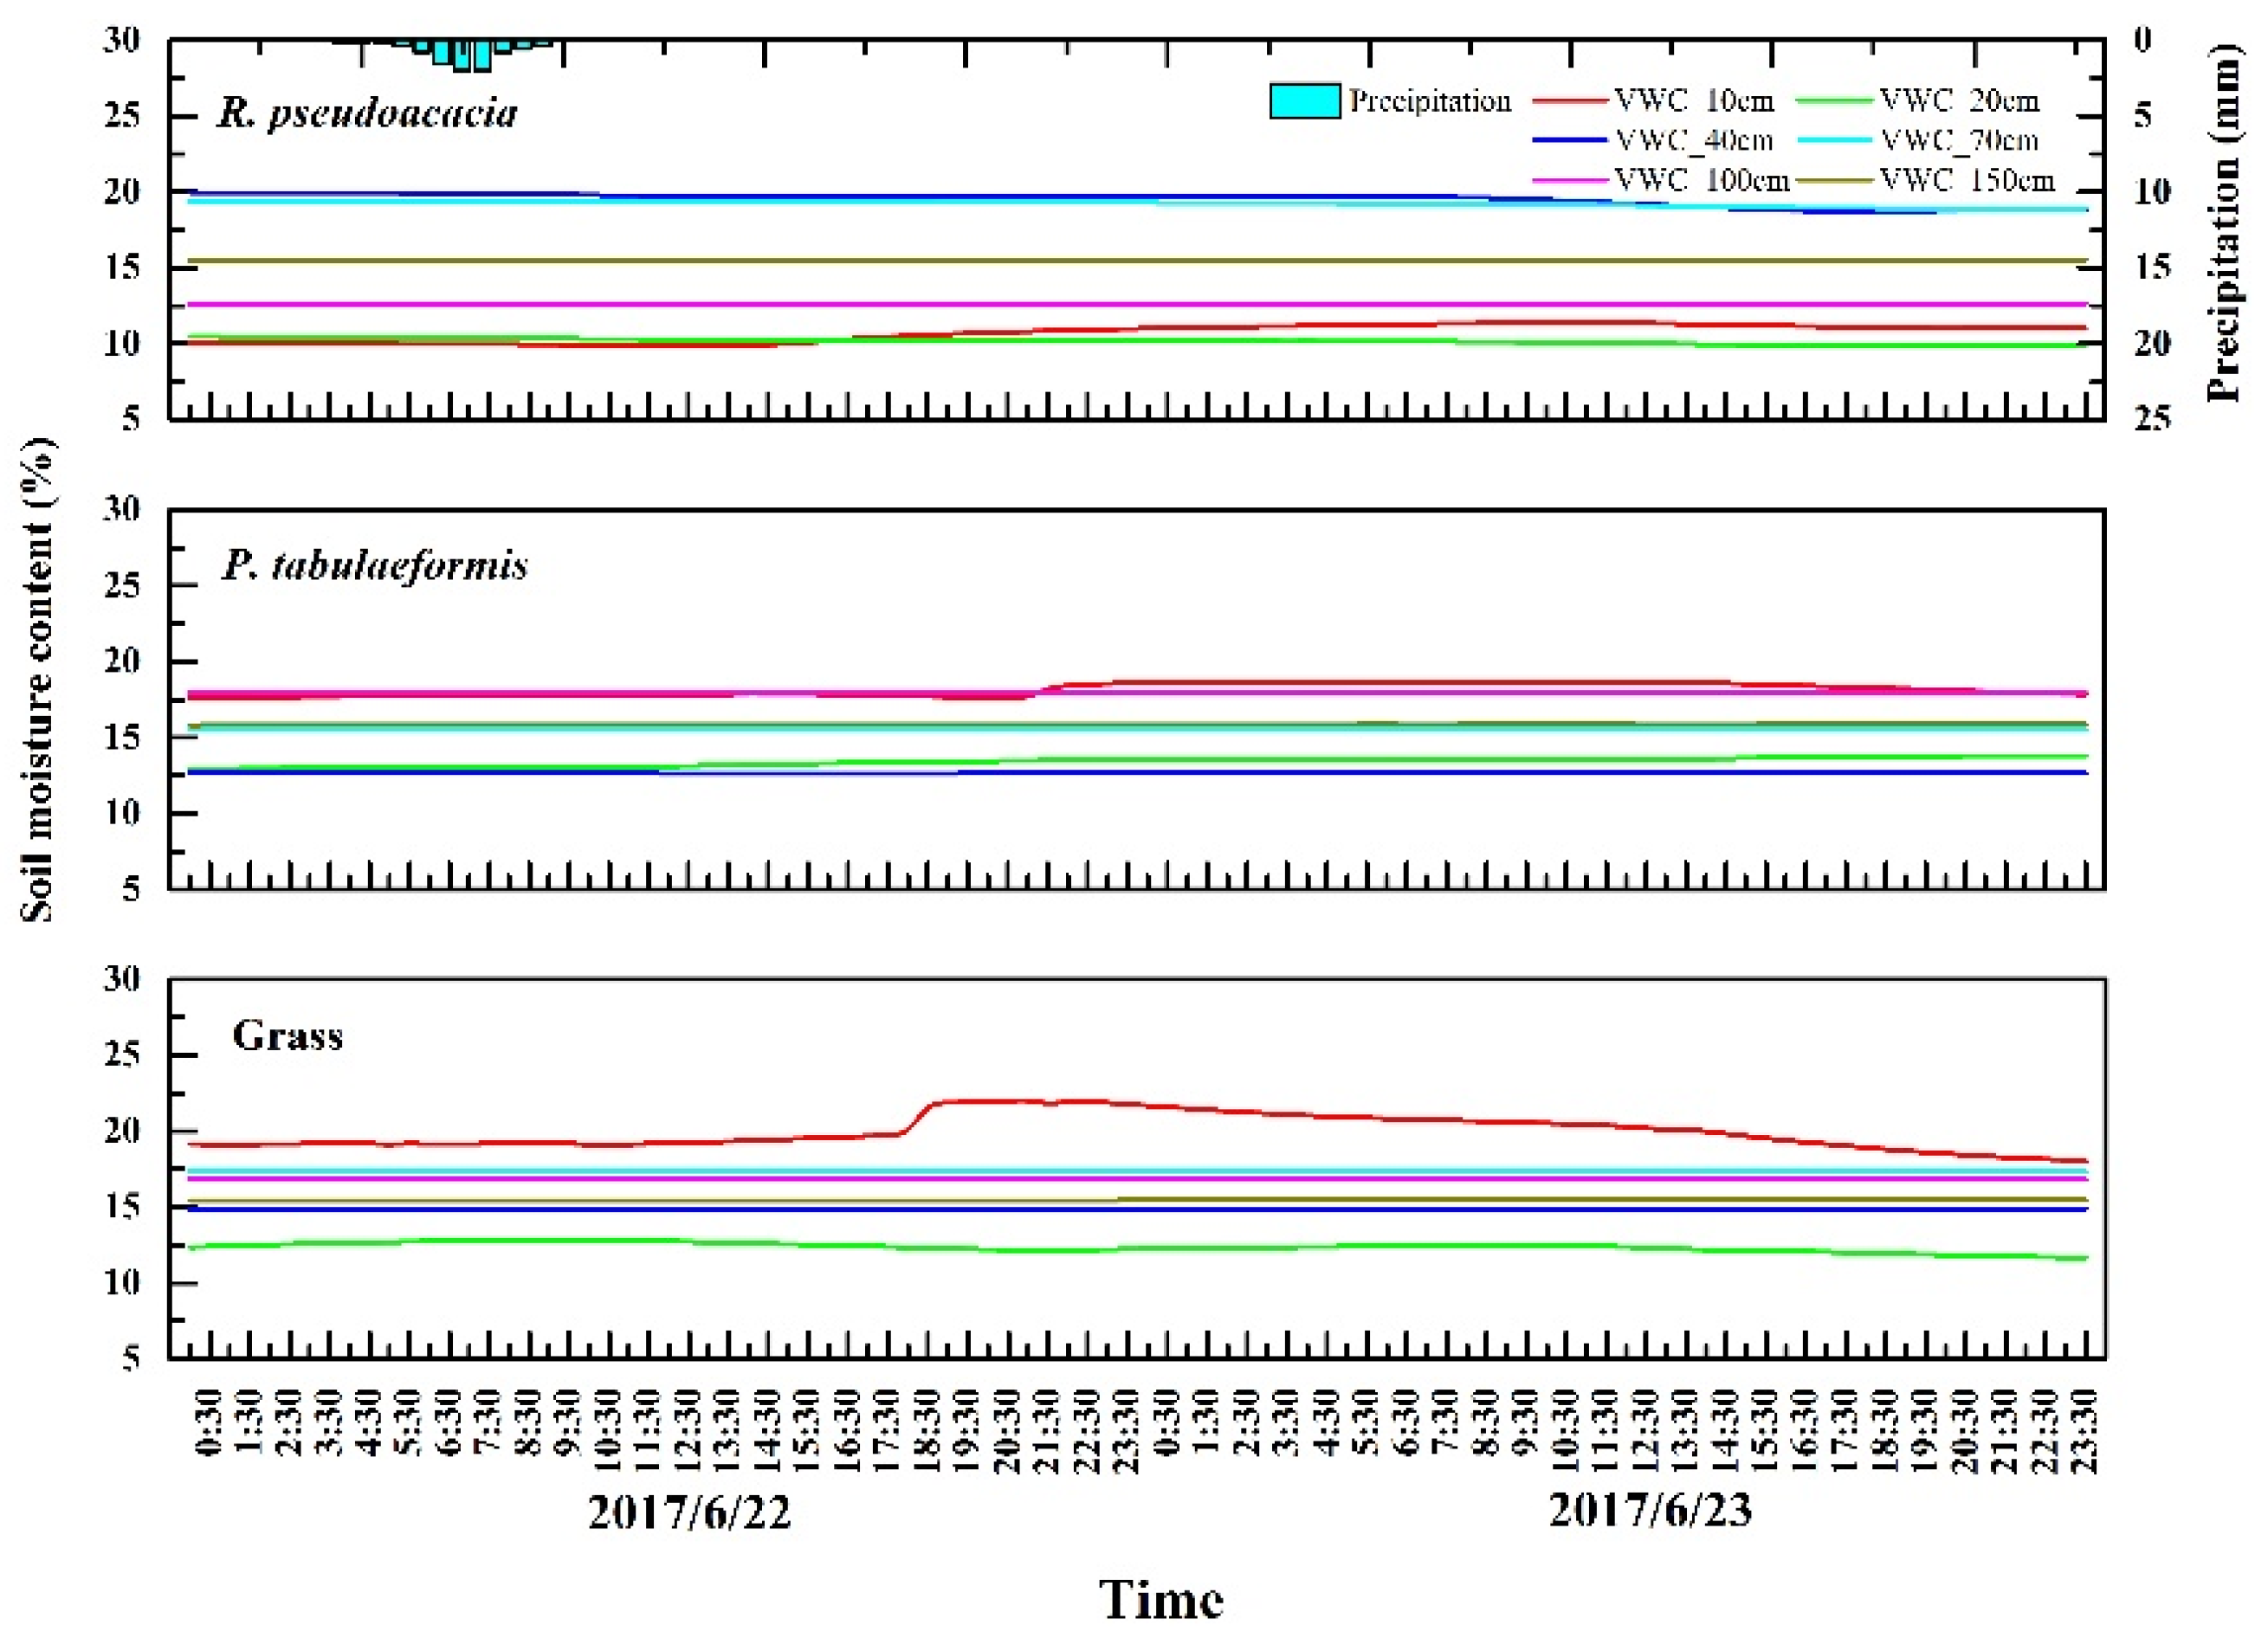
3.1.1. Light Rainfall

To further reveal the temporal variation in soil moisture among different rainfall intensities, the data from four precipitation intensities (Table 1) and the corresponding soil moistures were selected to analyze the responses during the observation period.
When the precipitation was light rainfall (e.g., Figure 4, precipitation of 9.2 mm), the soil moisture of the topsoil (soil depths ≤ 10 cm) in R. pseudoacacia artificial forestland, P. tabulaeformis artificial forestland, and grassland had a weak response to precipitation, and the response time of soil moisture to precipitation was approximately 20 h, 17.5 h, 8 h after rain (4:00 a.m. on 22 June 2017), respectively (Figure 4). However, no pronounced change in soil moisture between the soil depths of 10 and 100 cm was observed.

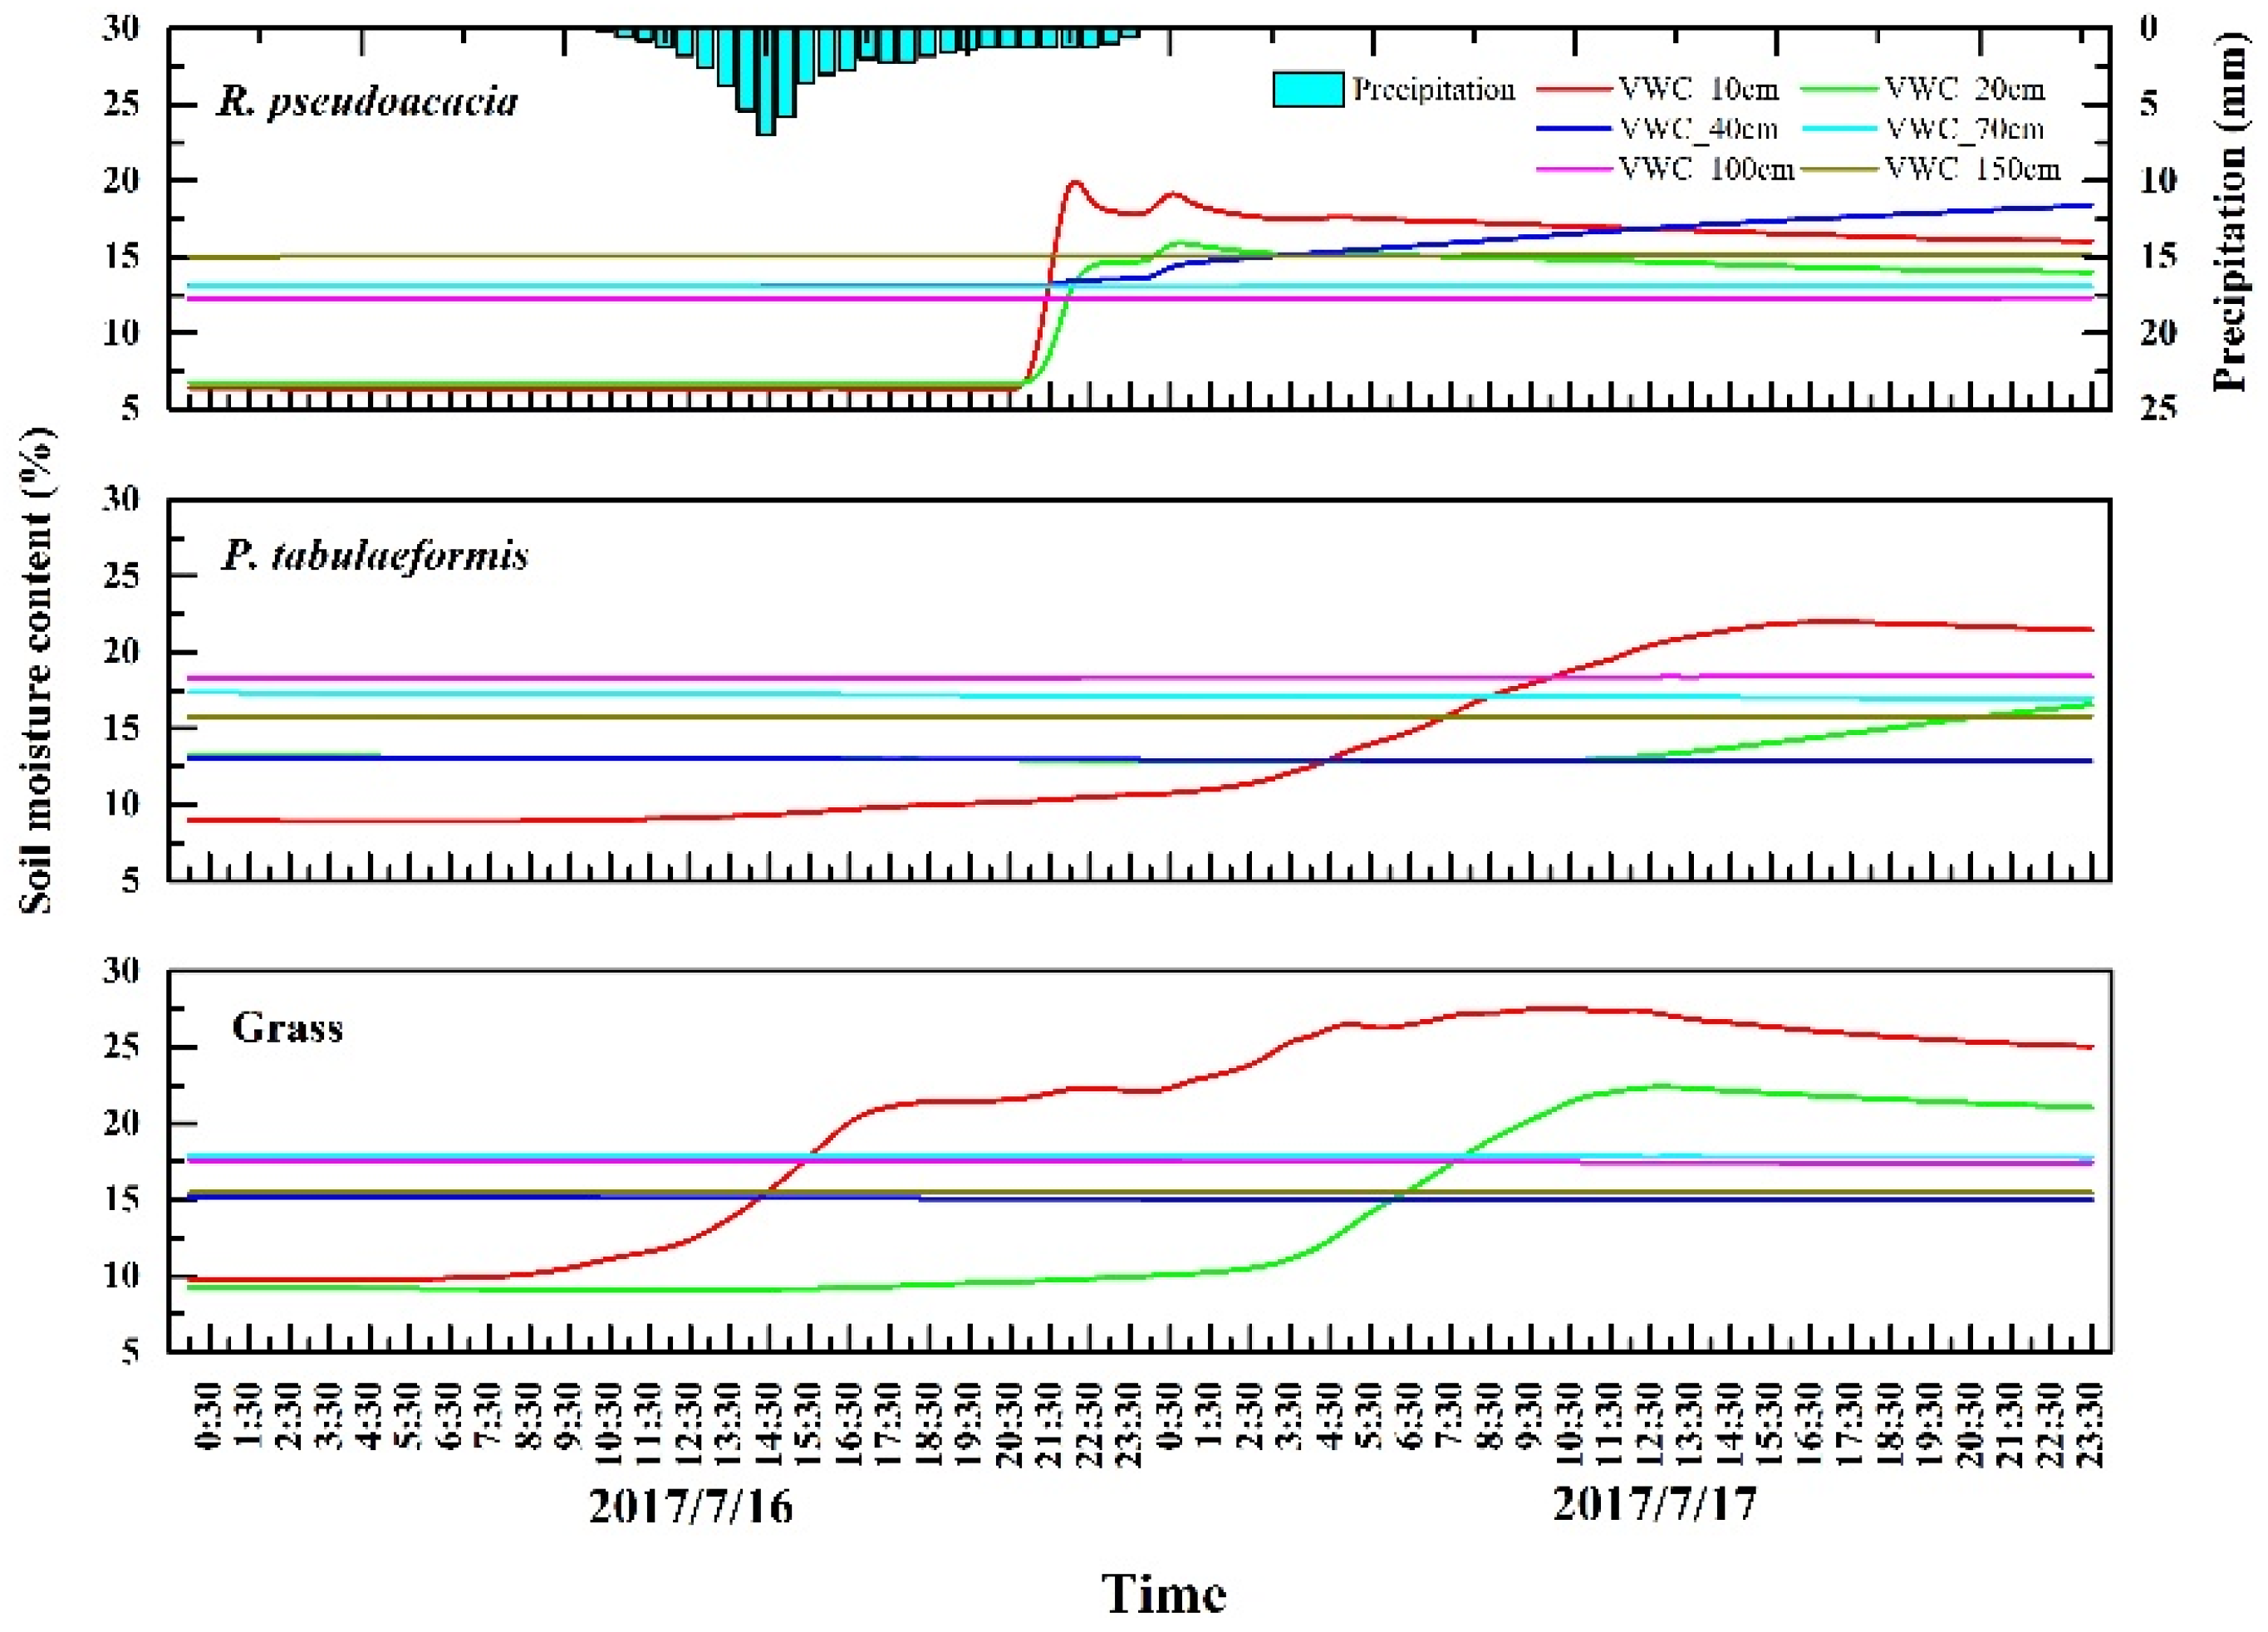
3.1.2. Moderate Rainfall

In moderate rainfall events (e.g., Figure 5, precipitation of 18.2 mm), soil moisture exhibited pronounced fluctuations between soil depths of 0 and 10 cm in the R. pseudoacacia artificial forestland, P. tabulaeformis artificial forestland and grassland. The response time of soil moisture to precipitation was approximately 10.5 h, 7.5 h, and 5.5 h after rain (9:00 a.m. on 7 August 2017) in R. pseudoacacia artificial forestland, P. tabulaeformis artificial forestland, and grassland, respectively. In addition, weak fluctuations in soil moisture (between soil depths of 10 and 20 cm) were observed in the R. pseudoacacia artificial forestland; however, no fluctuations in soil moisture (soil depths ≥ 10 cm) were observed in P. tabulaeformis artificial forestland and grassland.

3.1.3. Heavy Rainfall

Pronounced fluctuations in soil moisture were found between soil depths of 0 and 40 cm in R. pseudoacacia artificial forestland under heavy rainfall conditions (e.g., Figure 6, precipitation of 35.4 mm). The response time of soil moisture to precipitation lagged by approximately 2.5 h relative to the rainfall time (00:30 a.m. on 4 June 2017). However, no fluctuations in soil moisture (soil depths ≥ 40 cm) were found in R. pseudoacacia artificial forestland. Similarly, obvious fluctuations in soil moisture between soil depths of 0 and 20 cm were found in P. tabulaeformis artificial forestland and grassland, and the response time of the soil moisture to precipitation lagged by approximately 4 h and 1.5 h, respectively, relative to the heavy rainfall time. However, no changes in soil moisture were observed at soil depths greater than 20 cm.

3.1.4. Rainstorms

When the precipitation was greater than 50 mm (e.g., Figure 7, precipitation of 58.6 mm), pronounced fluctuations of soil moisture between 0 and 70 cm soil depth were found in R. pseudoacacia artificial forestland, P. tabulaeformis artificial forestland and grassland. The response time of soil moisture to precipitation lagged by approximately 0.5 h, 1 h, 0.5 h, respectively, relative to with the rainfall time (10:30 a.m. on 16 July 2017) in these three vegetation communities. Additionally, weak fluctuations of soil moisture at 70–100 cm soil depth were found in R. pseudoacacia artificial forestland, P. tabulaeformis artificial forestland and grassland. Small changes in soil moisture were found between 100 and 150 cm soil depth in the three vegetation communities.

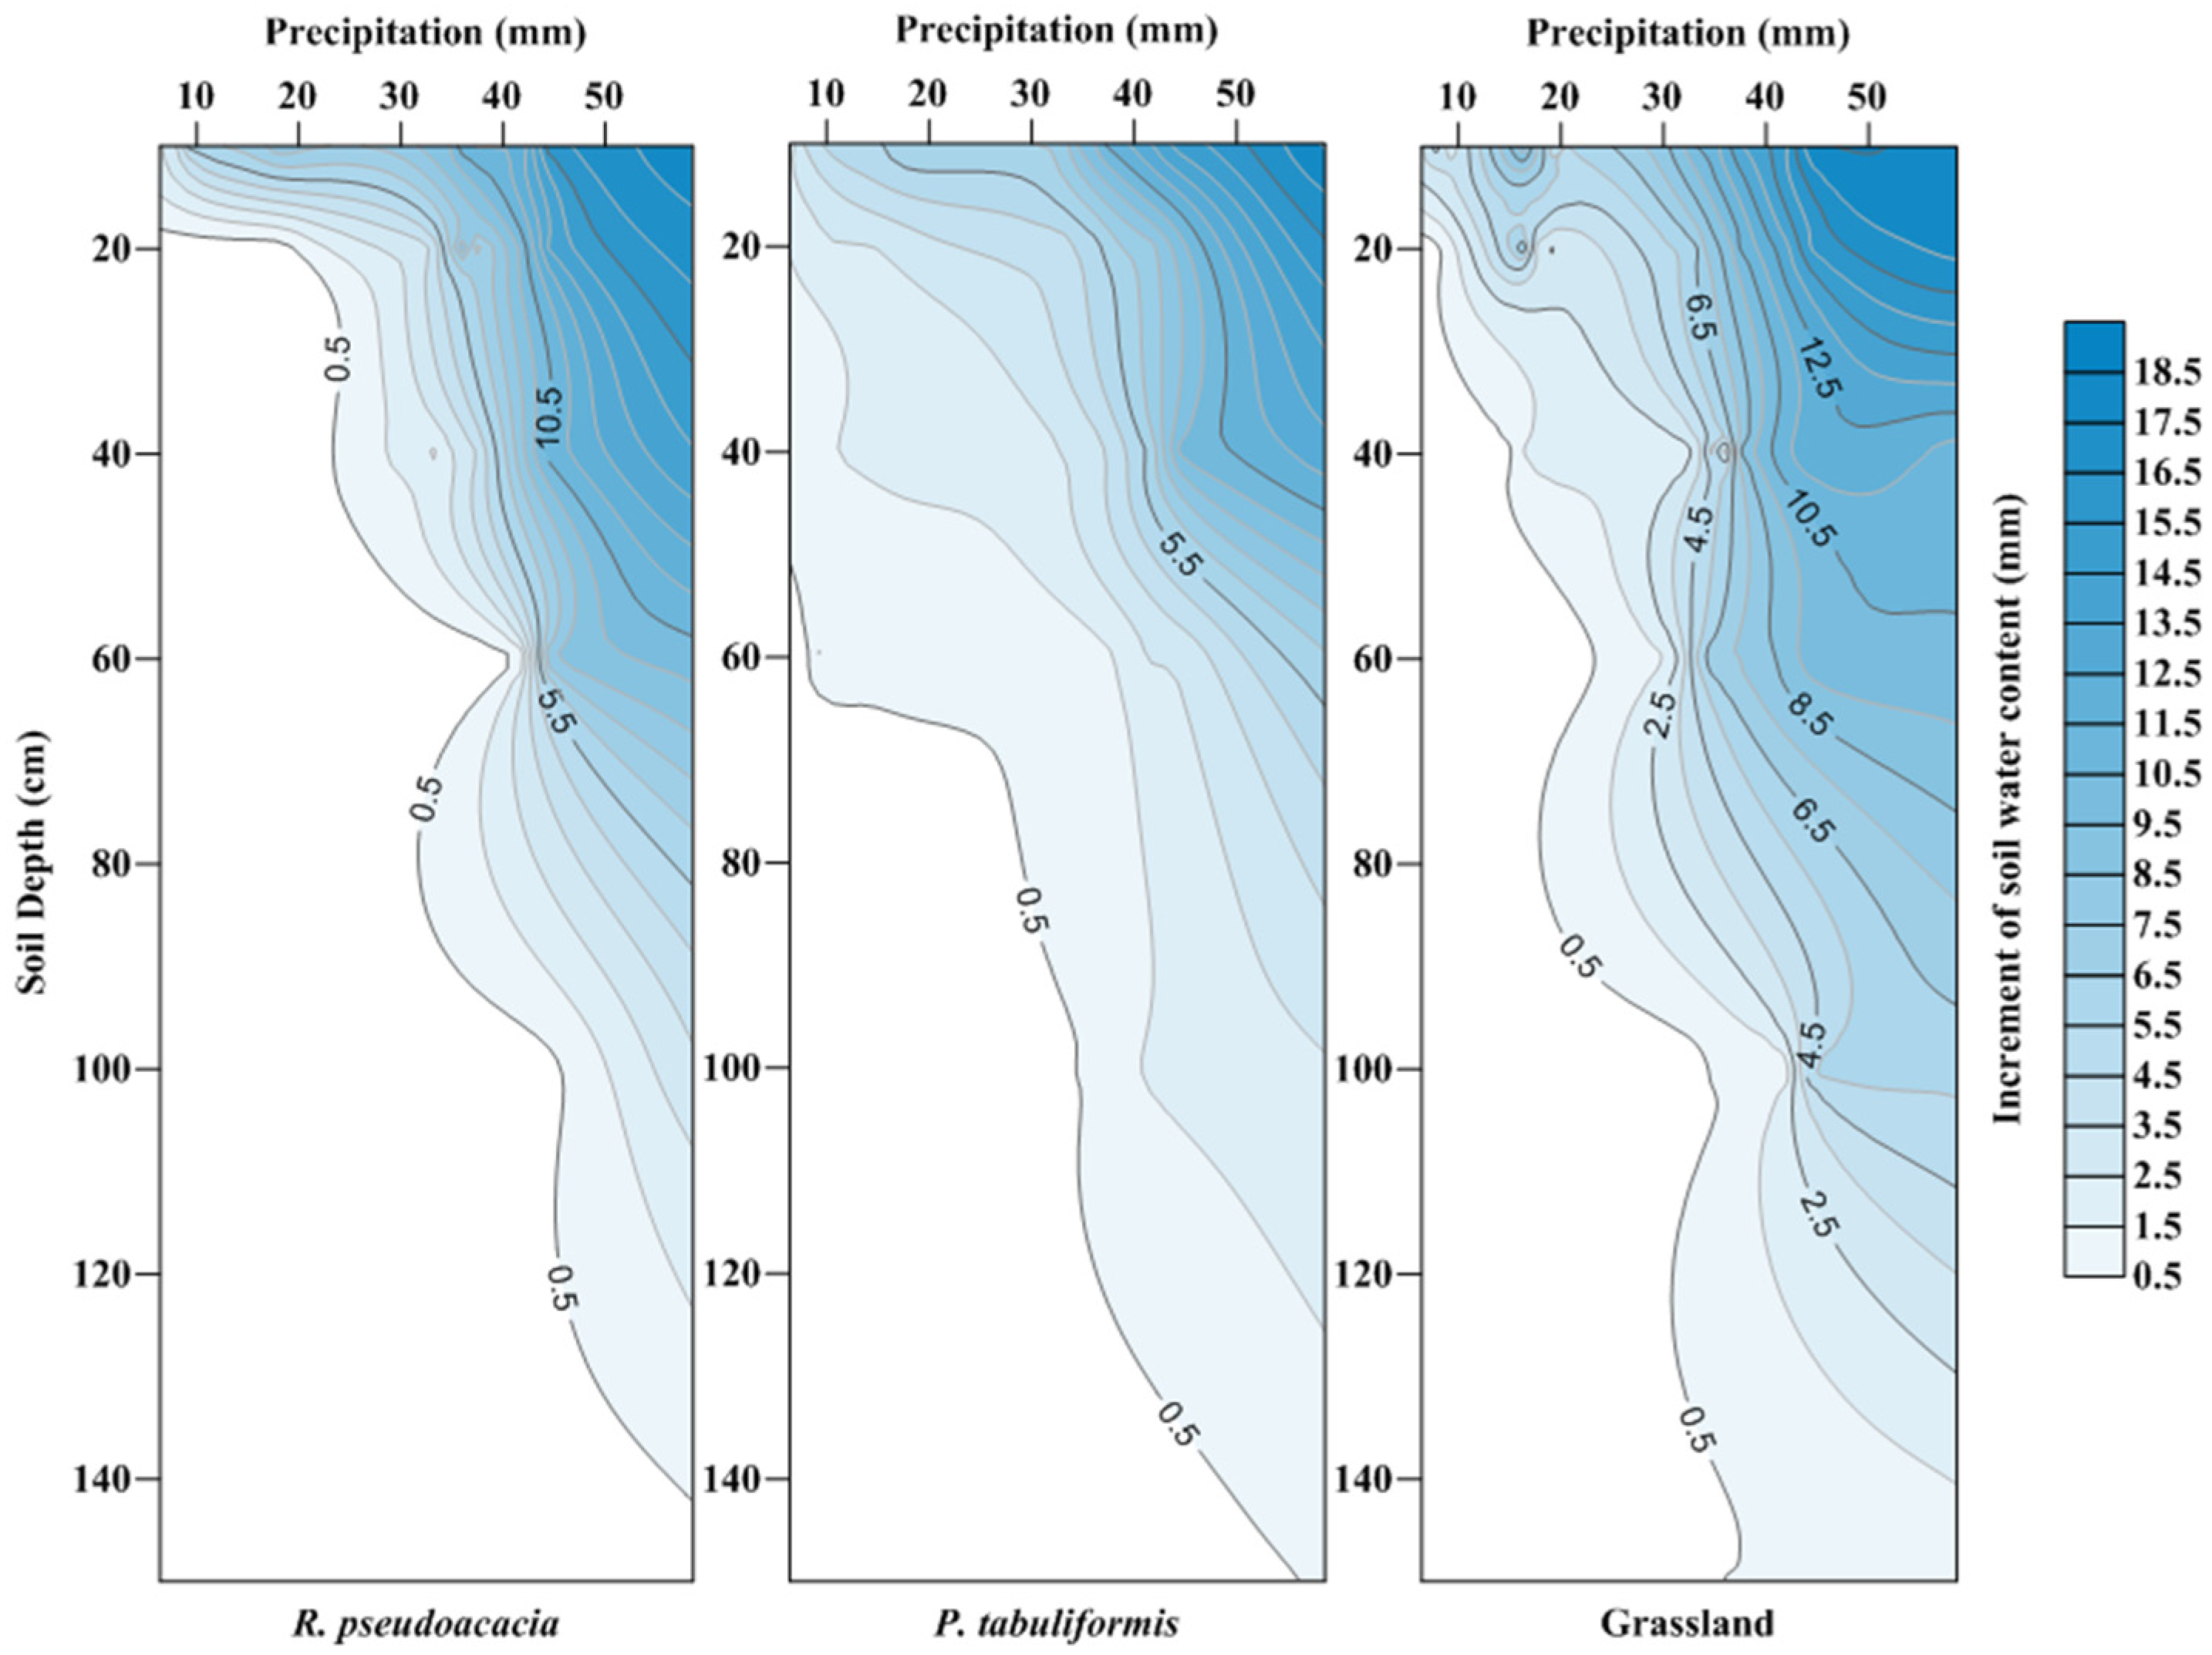
3.2. Spatial Variation in the Characteristics of Soil Moisture

3.2.1. Spatial Variation and Recharge of Soil Moisture under Different Rainfall Intensities

The temporal variation in soil moisture revealed the response times of soil moisture to precipitation, which could be useful for identifying the regulation of precipitation infiltration into the soil. However, it is not easy to identify those soil depths at which precipitation infiltration occurred under different rainfall intensities. Thus, an analysis of the increment and recharge amounts of soil moisture in the different vegetation communities in response to the different rainfall intensities was performed to identify the soil depths at which precipitation infiltration occurred under the different rainfall intensities. These results can help guide vegetation recovery and reconstruction efforts. Therefore, data from the 18 effective rainfall events and the corresponding soil moisture data were selected to analyze the spatial variation and recharge amounts of soil moisture under the four rainfall intensities. The increment amounts of soil moisture under the different precipitation intensities are shown in Figure 8.
The total precipitation of the 18 effective rainfall events was 460 mm. Soil moisture increased with precipitation. When the precipitation was between 5 and 10 mm (i.e., light rainfall), the average increment amounts of soil moisture were 3.59 mm, 6.8 mm, and 4.33 mm, in the R. pseudoacacia artificial forestland, P. tabulaeformis artificial forestland and grassland, respectively. The precipitation infiltrated up to approximately a 20 cm soil depth in both the R. pseudoacacia artificial forestland and P. tabulaeformis artificial forestland, and infiltration in the P. tabulaeformis artificial forestland was greater than in the other two vegetation communities. Accordingly, the soil moisture content was improved by approximately 16.74%, 15.19%, and 18.92% in the three communities relative to the pre-rain values.
When the precipitation was between 10 and 24.9 mm (i.e., moderate rainfall), the average increment amounts of soil moisture were 7.28 mm, 10.92 mm, and 13.54 mm in the R. pseudoacacia artificial forestland, P. tabulaeformis artificial forestland, and grassland, respectively. The precipitation infiltrated to approximately a 40 cm soil depth in the R. pseudoacacia artificial forestland, P. tabulaeformis artificial forestland and grassland. Correspondingly, the soil moisture content was improved by approximately 22.57%, 19.94%, and 26.58% in the three communities relative to the pre-rain values.
When the precipitation was between 24.9 and 49.9 mm (i.e., heavy rainfall), the average increment amounts of soil moisture were 23.38 mm, 21.55 mm, and 31.17 mm in the R. pseudoacacia artificial forestland, P. tabulaeformis artificial forestland and grassland, respectively. The precipitation infiltrated to approximately a 100 cm soil depth in the R. pseudoacacia artificial forestland, P. tabulaeformis artificial forestland and grassland. The soil moisture content was improved by approximately 35.32%, 27.53%, and 29.39% in the three communities relative to the pre-rain values.
When the precipitation was greater than 58.6 mm (i.e., rainstorm), the average increment amounts of soil moisture were 32.70 mm, 31.43 mm, and 33.45 mm in the R. pseudoacacia artificial forestland, P. tabulaeformis artificial forestland and grassland, respectively. The precipitation infiltrated to approximately a 150 cm soil depth in the R. pseudoacacia artificial forestland, P. tabulaeformis artificial forestland and grassland. The corresponding contributions of rainfall to soil moisture recharge were 54.09%, 51.93%, and 58.79%, respectively.

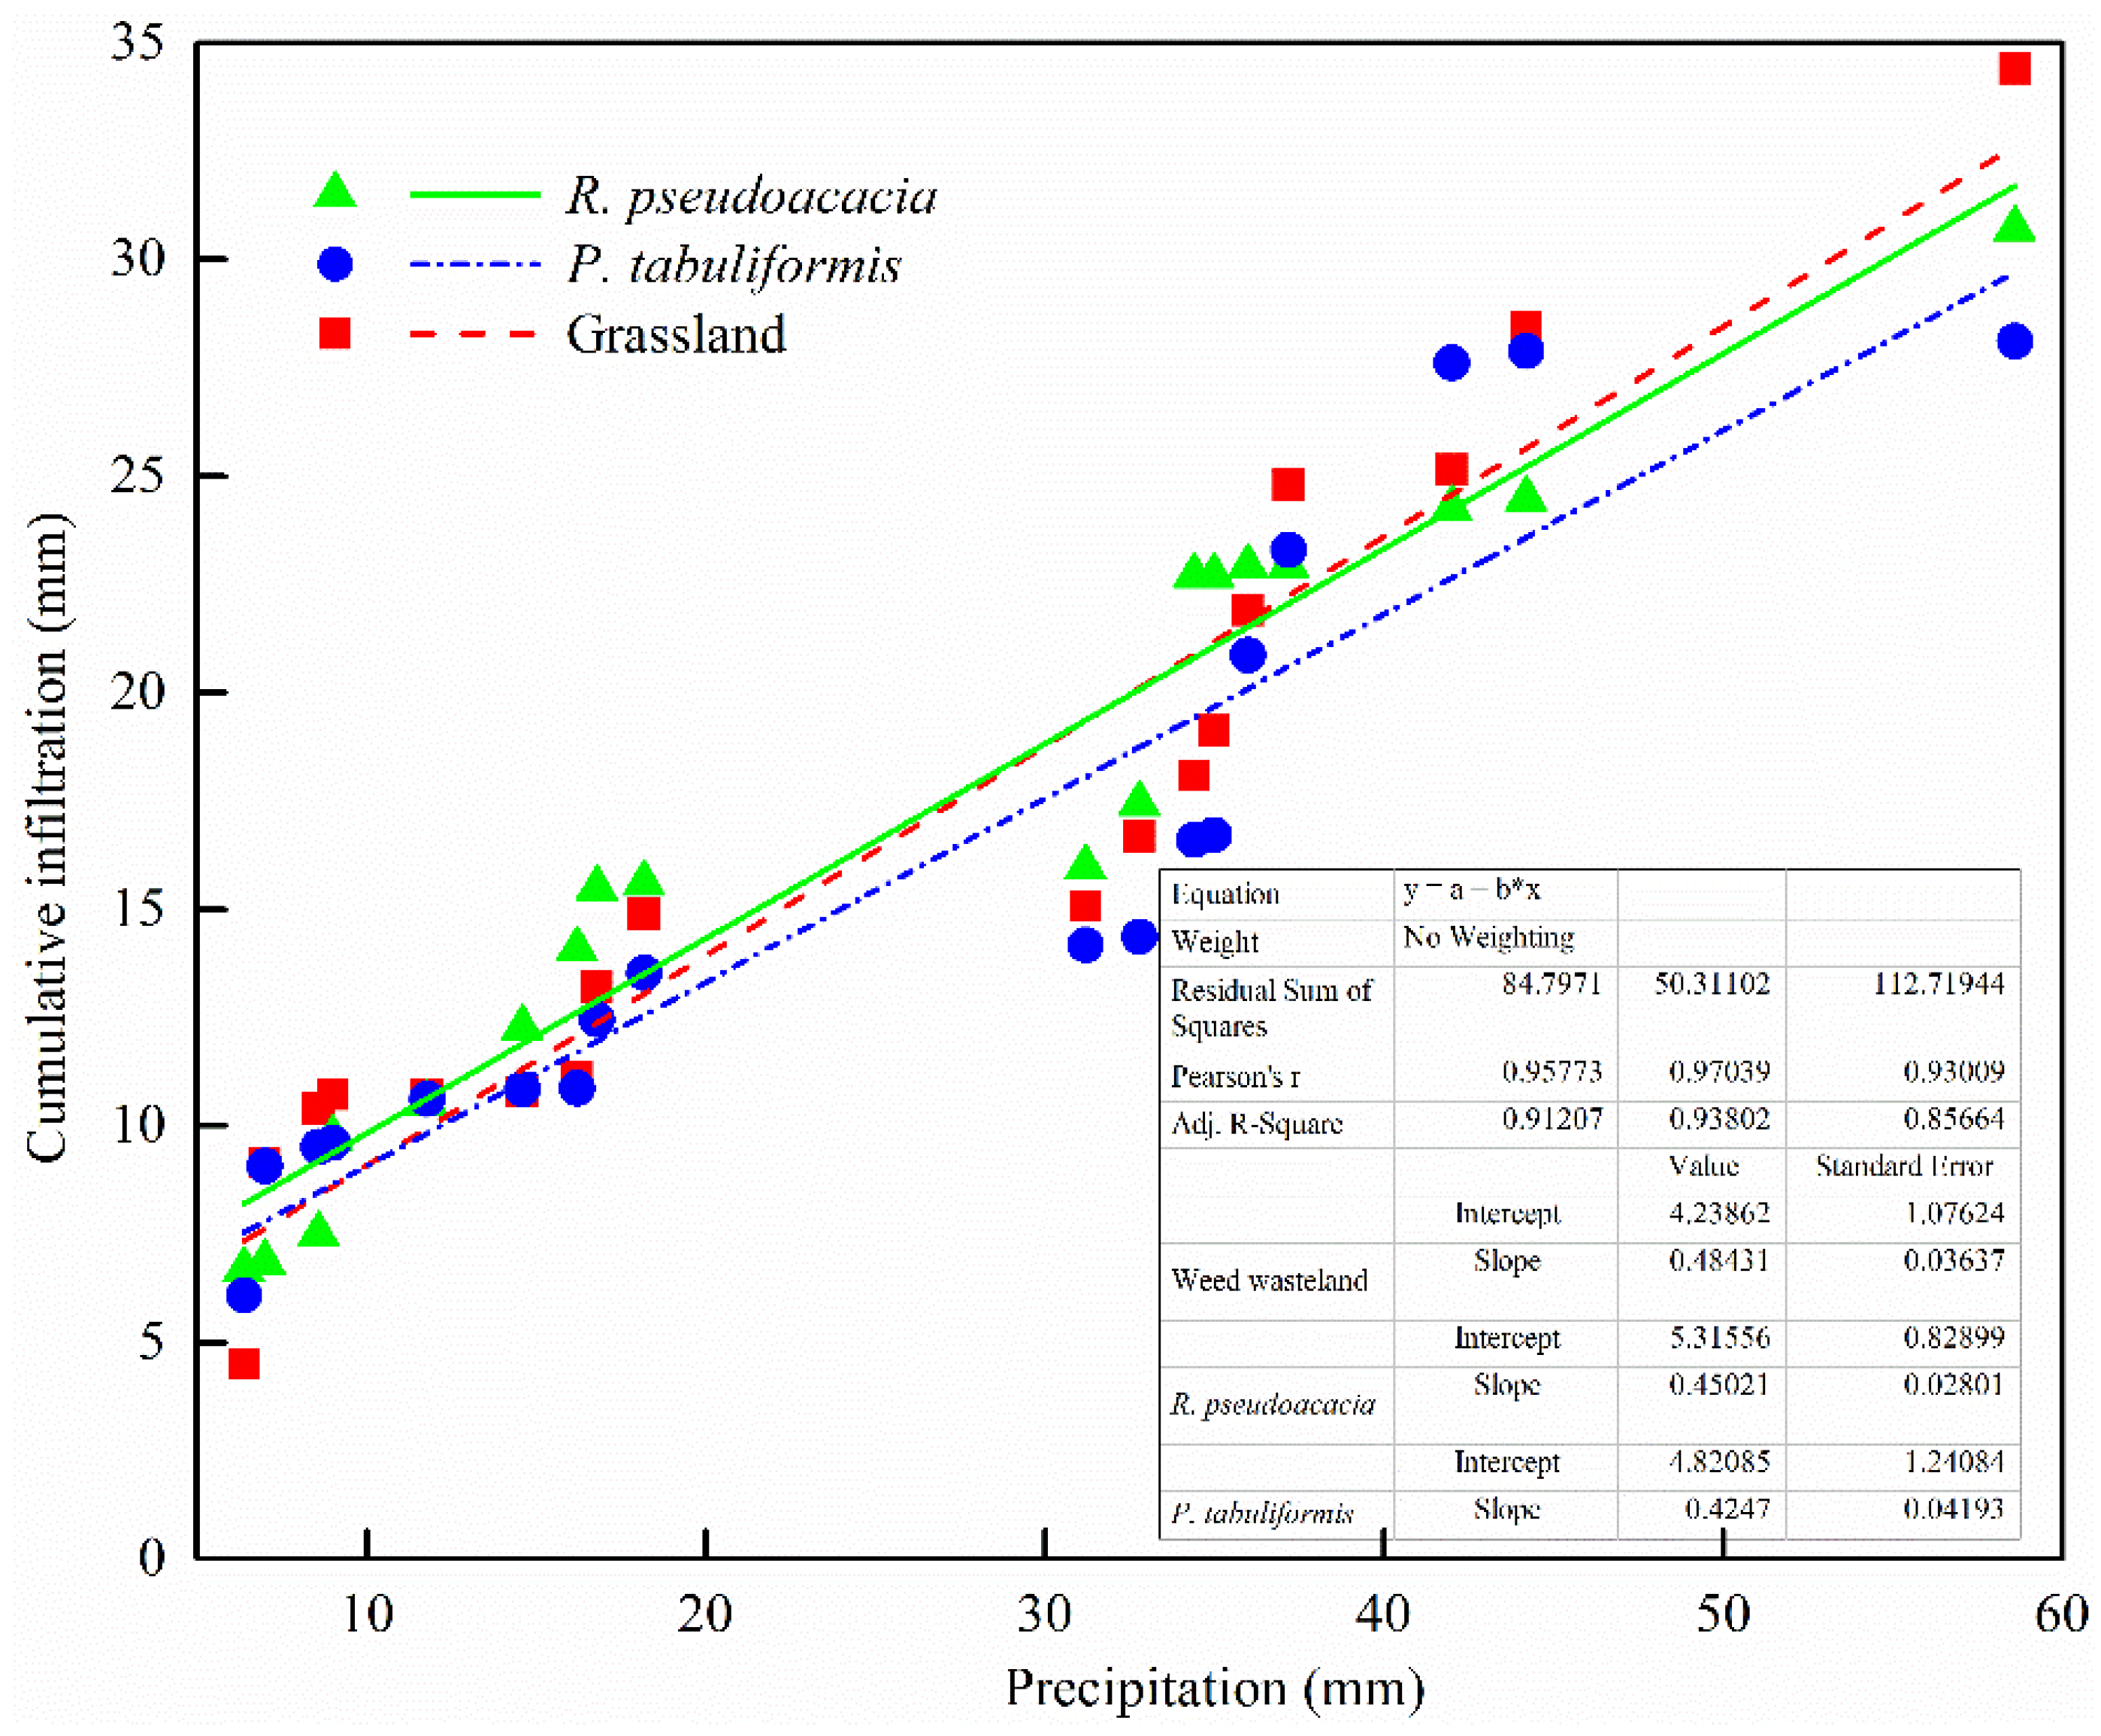
3.2.2. Cumulative Infiltration and Rainfall

The cumulative infiltration and precipitation data were fit according to 18 rainfall events (>5.0 mm) that were recorded during observation (shown in Figure 9). The results revealed a positive linear correlation between cumulative infiltrations and precipitation. The response of cumulative infiltration to precipitation was significantly stronger in the grassland than in the other two vegetation types. However, there were no significant differences in the response of cumulative infiltration to precipitation between the R. pseudoacacia artificial forestland and the P. tabulaeformis artificial forestland. In general, the infiltration coefficient increased with increasing precipitation until stabilization. The infiltration coefficient stabilized at 0.72, 0.69, and 0.68 for the grassland, R. pseudoacacia artificial forestland, and P. tabulaeformis artificial forestland, respectively.

3.2.3. Relationships between Vegetation/Soil Parameters and Soil Moisture Variation

Soil and vegetation play important roles in the processes of soil water input and output. The effects of vegetation and soil parameters on soil moisture variation were analyzed to identify those parameters with the greatest contribution differences in terms of soil moisture variation for the three communities (Table 4). The results in Table 4 show that soil organic matter content, soil structure, stand structure and fine roots had effects on soil moisture variation in R. pseudoacacia and P. tabulaeformis forestland. Soil organic matter content and canopy density had the largest contributions to soil moisture variation in R. pseudoacacia and P. tabulaeformis forestland, whereas herb coverage and fine root biomass had the largest contributions to soil moisture variation under grassland.

4. Discussion

4.1. Responses of Soil Moisture to Different Rainfall Intensities

In general, there is a positive relationship between variation in soil moisture and precipitation [33,34,35,36]. In the present study, the response of soil moisture to precipitation was more pronounced at higher levels of precipitation (Figure 3). The temporal and spatial variation of soil moisture reflected the structures of the underlying layers. The distribution pattern of dominant vegetation affected by the moisture storage in the surface soil layers directly and indirectly affected the vegetation survival and rate of succession by changing the nutrients and energy in the upper soil [37]. Castellano reported that the eco-hydrological processes of vegetation interception and litter interception have great effects on the temporal dynamics of soil water [36]. The ability to intercept precipitation differs significantly among vegetation types because of differences in stand composition and structure. In this study, the vegetation types and vegetation coverage were significant different among the three communities (Table 2). Canopy interception was proportional to LAI and crown length. The value of LAI in the R. pseudoacacia artificial forest was higher (2.04) than that in the P. tabulaeformis artificial forest (1.69). Additionally, herb coverage varied among the R. pseudoacacia artificial forestland, the P. tabulaeformis artificial forestland and grassland. The herb coverage of grassland (70%) was higher than that of R. pseudoacacia artificial forest (55%) and that of P. tabulaeformis artificial forest (10%). These data explain why the response of soil moisture to precipitation was more pronounced at higher levels of precipitation.
The results of this study revealed the regulation of soil moisture under different rainfall intensities (i.e., light rainfall, moderate rainfall, heavy rainfall, and rainstorm). The response time of soil moisture to precipitation decreased with increasing rainfall intensity, and the increases in soil moisture were larger and longer lasting (Figure 4, Figure 5, Figure 6 and Figure 7). Some studies have reported that the loss of precipitation by interception may reach 40% [38,39], and the loss of precipitation by interception under R. pseudoacacia may represent 11.56% of the total precipitation [40]. The loss of precipitation by interception under P. tabulaeformis may represent 29.61% of the total precipitation simulated by the Gash model [41], and the loss of precipitation by interception by A. ordosica may represent 26.8% of the total precipitation [42]. Previous studies have reported that precipitation events greater than 2.0 mm can induce physiological reactions of vegetation [43,44]. The variation in seasonal soil moisture is the result of the coupling of precipitation and seasonal precipitation in a study area with the local topography and vegetation types [45].

4.2. Replenishment of Soil Moisture under Different Rainfall Intensities

Precipitation is the main source of soil moisture recharge in the gully region of the Loess Plateau, because the underground water is deep [46]. Recharging the deeper-layer soil moisture is difficult, because of the variation in hydraulic conductivity [28]. Some studies have shown that precipitation of less than 10 mm cannot replenish the soil water and merely causes minor fluctuations in topsoil moisture [19,33,43,47]. This study showed that continuous rainfall or heavy rain is essential for achieving the recharge of soil moisture in the deeper soil layers (see Figure 6, Figure 7 and Figure 8). These conditions, i.e., heavy rain or continuous rainfall, can induce large fluctuations in soil moisture in the deeper soil layers [44]. In the present study, the increment amount of soil moisture was between 16.74% and 54.9% in R. pseudoacacia artificial forestland when rainfall was less than 40 mm. Additionally, the infiltration depth of precipitation reached approximately 100 cm only under precipitation event with greater than 50 mm rainfall. At this level of precipitation, the soil moisture was recharged in the 150-cm soil layer. However, in the P. tabulaeformis artificial forestland, when the rainfall events yielded greater than 40 mm precipitation, the infiltration depths of precipitation reached 150 cm, and the contribution rate of rainfall to soil moisture recharge varied between 15.19% and 51.93%. When the precipitation was greater than 30 mm, soil moisture in grassland was replenished to 150 cm soil depth, and the contribution rate of rainfall to soil moisture recharge varied from 18.92% to 58.79%. These results, when considered along with plant water use strategies, could be very useful for guiding vegetation configurations in vegetation recovery and reconstruction efforts. It has been reported that the plant water use strategy of R. pseudoacacia during the rainfall season involves preferential use of the shallow soil layer (0–40 cm, 54.3%), which is supplied with sufficient water during the frequent rainfall events to maintain plant growth and activity. Later in the rainfall season, the plant’s water source shifts to deeper soil layers (60–100 cm, 19.2% and 30.9%) to obtain a stable water supply as rainfall events become less frequent. In the rainfall season, P. tabulaeformis mainly absorbs shallow (0–40 cm, 46.8% and 37.7%) and deep (60–100 cm, 24.9% and 27.6%) soil water through frequent events and less frequent events, respectively [48]. Therefore, as soil moisture is affected by rainfall distribution and root distribution, the stands densities of R. pseudoacacia artificial and P. tabulaeformis need to be controlled to avoid stand degradation.
The precipitation-vegetation-soil relationship is complex. The following three aspects should be evaluated in terms of their effects on soil moisture, including its source, infiltration, and loss. First, consider precipitation and recharge. Precipitation is the main source of soil moisture recharge in the gully region of the Loess Plateau. More precipitation increases the opportunity to recharge soil in different vegetation communities. There is a positive relationship between soil moisture and precipitation, as validated by the results of the present study (Figure 3, Figure 4, Figure 5, Figure 6, Figure 7, Figure 8 and Figure 9).
Second, consider vegetation. Vegetation types and vegetation coverage were the main factors affecting the temporal dynamics of soil moisture and can affect soil moisture infiltration. Due to the eco-hydrological processes of light interception by vegetation and litter and evaporation, shade can reduce soil temperature and effectively inhibit soil temperature fluctuations. Thus, vegetation types and vegetation coverage influence the chance that rainfall is transformed into soil water and will affect soil water infiltration. After precipitation interception by the vegetation canopy and litter, precipitation is transformed to soil moisture in the rhizosphere region [26], where the fine root and coarse root distributions may affect the process of soil moisture infiltration [49,50,51]. The root distributions were significantly different among the R. pseudoacacia artificial forestland, P. tabulaeformis artificial forestland and grassland (Figure 1). Roots increase the soil porosity and improve the soil texture, which allows rainwater to penetrate into the deeper layers (>60 cm) in these three communities. The results of this study corroborate previous work showing that soil moisture replenishment is significantly reduced by precipitation interception by vegetation canopies and evaporation into the atmosphere [28].
Third, consider the soil. The soil moisture recharge amount was affected by the soil moisture content before rainfall, the soil physical properties, the precipitation amount, the rainfall intensity, the rainfall time, and the vegetation types [52,53]. The properties of soil pores determine the soil water infiltration rate and the amount of rainfall that transfers into soil moisture when the rainfall is effective (i.e., when the soil moisture is markedly changed). In this study, the soil physical properties and SOMC were significantly different among the three communities, and the clay and silt contents and SOMC in the R. pseudoacacia artificial forestland and grassland were significantly higher than those in the P. tabulaeformis artificial forestland (Table 1). It was previously reported that porosity has significant effects on hydraulic conductivity and soil moisture content and that the temporal stability of soil moisture varies because of the role of hydraulic conductivity [5,23,53,54]. Another possible reason for the lower clay and silt contents and SOMC in the grassland [55,56,57,58]. Soil evaporation is a physical process in which soil water is lost directly, although it can be negligible during rain events. During rainfall, soil pores are filled by precipitation, soil moisture is replenished, and soil evaporation is extremely weak (minor rainfall events) or temporarily suspended (heavy rainfall events). When rainfall stops, the soil evaporation process starts again.
This study analyzed the temporal and spatial variations in soil moisture in three vegetation communities (R. pseudoacacia artificial forestland, P. tabulaeformis artificial forestland and grassland) and identified the contribution rate of soil moisture recharge under different rainfall intensities. These research results can help guide vegetation configuration in vegetation recovery and reconstruction efforts. However, there are two endeavors that need to be performed. One is the collection of soil moisture observations in deeper soil layers, which could provide further insight into the temporal and spatial variations in soil moisture under different rainfall intensities. The second is a soil moisture study of different vegetation communities during different recovery phases, which could provide a theoretical basis for exploring vegetation recovery and climate.

5. Conclusions

In this study, soil moisture was continuously measured at 30-min intervals in three communities (R. pseudoacacia artificial forestland, P. tabulaeformis artificial forestland and grassland) to compare the responses of soil moisture among different rainfall intensities and to quantify the rates of contribution to soil moisture recharge under different rainfall intensities in the gully region of the Loess Plateau of China. The temporal and spatial variation of soil moisture were significantly influenced by the amount and intensity of precipitation, as well as by the aboveground structure of the land-use system. Regarding the contribution rate of precipitation to soil moisture recharge, rainfall amounts greater than 50 mm achieved soil moisture replenishment in the deeper layer (150 cm) in R. pseudoacacia artificial forestland; amounts greater than 40 mm achieved soil moisture replenishment in the deeper layer (150 cm) in P. tabulaeformis artificial forestland. Rainfall greater than 30 mm replenished soil moisture in the deeper layer (150 cm) in grassland.

Author Contributions

G.H. and H.B. conceived and designed the experiments; G.H., X.W., L.K., N.W. and Q.Z. performed the experiments; G.H. analyzed the data, and wrote the paper; and G.H. and H.B. revised the paper.

Funding

This research was supported by the National Key Research and Development Program of China (No. 2016YFC0501704), the National Key Technology Research and Development Program of the Ministry of Science and Technology of China (No. 2015BAD07B0502), the National Natural Science Funds of China (No. 31470638) and the Beijing Collaborative Innovation Center for Eco-environmental Improvement with Forestry and Fruit Trees (PXM2017_014207_000024).

Acknowledgments

We thank Yifang Chang, Lei Yun for providing technical support. We also thank the anonymous reviewers, Editor and Associate Editor for their thorough assessments of the manuscript and the many valuable suggestions.

Conflicts of Interest

The authors declare no conflicts of interest.

References

  1. Allen, C.D.; Macalady, A.K.; Chenchouni, H.; Bachelet, D.; Mcdowell, N.; Vennetier, M.; Kitzberger, T.; Rigling, A.; Breshears, D.D.; Hogg, E.H. A global overview of drought and heat-induced tree mortality reveals emerging climate change risks for forests. For. Ecol. Manag. 2010, 259, 660–684. [Google Scholar] [CrossRef]
  2. Chen, S.L.; Wen, Z.M.; Jiang, H.; Zhao, Q.J.; Zhang, X.Y.; Chen, Y. Temperature Vegetation Dryness Index Estimation of Soil Moisture under Different Tree Species. Sustainability 2015, 7, 11401–11417. [Google Scholar] [CrossRef] [Green Version]
  3. Boyer, J.S. Plant productivity and environment. Science 1982, 218, 443–448. [Google Scholar] [CrossRef] [PubMed]
  4. Topp, G.C.; Watt, M.; Hayhoe, H.N. Point specific measurement and monitoring of soil water content with an emphasis on TDR. Can. Soil Sci. 1996, 76, 307–316. [Google Scholar] [CrossRef] [Green Version]
  5. Vieira, S.R.; Grego, C.R.; Topp, G.C.; Reynolds, W.D. Spatial relationships between soil water content and hydraulic conductivity in a highly structured clay soils. Appl. Soil Phys. Environ. Anal. 2015, 35, 75–90. [Google Scholar]
  6. Klamerus-Iwan, A.; Błońska, E. Canopy storage capacity and wettability of leaves and needles: The effect of water temperature changes. J. Hydrol. 2018, 559, 534–540. [Google Scholar] [CrossRef]
  7. Cheng, X.; An, S.; Li, B.; Chen, J.; Lin, G.; Liu, Y.; Luo, Y.; Liu, S. Summer rain pulse size and rainwater uptake by three dominant desert plants in a desertified grassland ecosystem in northwestern China. Plant Ecol. 2006, 184, 1–12. [Google Scholar] [CrossRef]
  8. Wang, X.P.; Zhang, Y.F.; Hu, R.; Pan, Y.X.; Berndtsson, R. Canopy storage capacity of xerophytic shrubs in northwestern China. J. Hydrol. 2012, 454–455, 152–159. [Google Scholar] [CrossRef]
  9. Hata, K.; Kawakami, K.; Kachi, N. Increases in soil water content after the mortality of non-native trees in oceanic island forest ecosystems are due to reduced water loss during dry periods. Sci. Total Environ. 2016, 545–546, 372–380. [Google Scholar] [CrossRef] [PubMed]
  10. Yang, Y.; Fu, B. Soil water migration in the unsaturated zone of semiarid region in China from isotope evidence. Hydrol. Earth Syst. Sci. 2017, 21, 1757–1767. [Google Scholar] [CrossRef] [Green Version]
  11. Koppel, J.V.D.; Rietkerk, M.; Weissing, F.J. Catastrophic vegetation shifts and soil degradation in terrestrial grazing systems. Trends Ecol. Evol. 1997, 12, 352–356. [Google Scholar] [CrossRef] [Green Version]
  12. Van, D.K.J.; Rietkerk, M.; Van, L.F.; Kumar, L.; Klausmeier, C.A.; Fryxell, J.M.; Hearne, J.W.; Van, A.J.; De, R.N.; Skidmore, A. Spatial heterogeneity and irreversible vegetation change in semiarid grazing systems. Am. Nat. 2002, 159, 209–218. [Google Scholar]
  13. Van, D.K.J.; Rietkerk, M. Spatial interactions and resilience in arid ecosystems. Am. Nat. 2004, 163, 113–121. [Google Scholar]
  14. Rosenbaum, U.; Bogena, H.R.; Herbst, M.; Huisman, J.A.; Peterson, T.J.; Weuthen, A.; Western, A.W.; Vereecken, H. Seasonal and event dynamics of spatial soil moisture patterns at the small catchment scale. Water Resour. Res. 2012, 48, 3472–3476. [Google Scholar] [CrossRef]
  15. Western, A.W.; Zhou, S.L.; Grayson, R.B.; Mcmahon, T.A.; Bloschl, G.; Wilson, D.J. Spatial correlation of soil moisture in small catchments and its relation to dominant spatial hydrological processes. J. Hydrol. 2004, 286, 113–134. [Google Scholar] [CrossRef]
  16. Romshoo, S.A. Geostatistical analysis of soil moisture measurements and remotely sensed data at different spatial scales. Environ. Geol. 2004, 45, 339–349. [Google Scholar] [CrossRef]
  17. Zhao, L.; Yang, K.; Qin, J.; Chen, Y.; Tang, W.; Montzka, C.; Wu, H.; Lin, C.; Han, M.; Vereecken, H. Spatiotemporal analysis of soil moisture observations within a Tibetan mesoscale area and its implication to regional soil moisture measurements. J. Hydrol. 2013, 482, 92–104. [Google Scholar] [CrossRef]
  18. Entin, J.K.; Robock, A.; Vinnikov, K.Y.; Hollinger, S.E.; Liu, S.X.; Namkhai, A. Temporal and spatial scales of observed soil moisture variations in the extratropics. J. Geophys. Res. Atmos. 2000, 105, 11865–11877. [Google Scholar] [CrossRef] [Green Version]
  19. Li, B.; Rodell, M. Spatial variability and its scale dependency of observed and modeled soil moisture under different climate conditions. Hydrol. Earth Syst. Sci. 2013, 17, 1177–1188. [Google Scholar] [CrossRef]
  20. Wilcox, B.P.; Breshears, D.D.; Turin, H.J. Hydraulic conductivity in a Piñon–juniper woodland. Soil Sci. Soc. Am. J. 2003, 7, 1243–1249. [Google Scholar] [CrossRef]
  21. Vanderlinden, K.; Vereecken, H.; Hardelauf, H.; Herbst, M.; Martínez, G.; Cosh, M.H.; Pachepsky, Y.A. Temporal stability of soil water contents: A review of data and analyses. Vadose Zone J. 2012, 11, 280–288. [Google Scholar] [CrossRef]
  22. Li, J.; He, B.; Yun, C.; Ru, H.; Tao, J.; Tian, T. Root distribution features of typical herb plants for slope protection and their effects on soil shear strength. Trans. Chin. Soc. Agric. Eng. 2013, 29, 144–152. [Google Scholar]
  23. Li, X.J.; Li, X.R.; Song, W.M.; Gao, Y.P.; Zheng, J.G.; Jia, R.L. Effects of crust and shrub patches on runoff, sedimentation, and related nutrient (C, N) redistribution in the desertified steppe zone of the tengger desert, northern China. Geomorphology 2008, 96, 221–232. [Google Scholar] [CrossRef]
  24. Chamizo, S.; Cantón, Y.; Lázaro, R.; Domingo, F. The role of biological soil crusts in soil moisture dynamics in two semiarid ecosystems with contrasting soil textures. J. Hydrol. 2013, 489, 74–84. [Google Scholar] [CrossRef]
  25. Li, X.R.; Ma, F.Y.; Xiao, H.L.; Wang, X.P.; Kim, K.C. Long-term effects of revegetation on soil water content of sand dunes in arid region of northern China. J. Arid Environ. 2004, 57, 1–16. [Google Scholar] [CrossRef]
  26. Wang, X.P.; Li, X.R.; Xiao, H.L.; Berndtsson, R.; Pan, Y.X. Effects of surface characteristics on infiltration patterns in an arid shrub desert. Hydrol. Process. 2007, 21, 72–79. [Google Scholar] [CrossRef]
  27. Wang, S.; Fu, B.; Gao, G.; Liu, Y.; Zhou, J. Responses of soil moisture in different land cover types to rainfall events in a re-vegetation catchment area of the Loess Plateau, China. Catena 2013, 1, 122–128. [Google Scholar] [CrossRef]
  28. Yu, X.; Huang, Y.; Li, E.; Li, X.; Guo, W. Effects of vegetation types on soil water dynamics during vegetation restoration in the mu us sandy land, northwestern China. J. Arid Land 2017, 9, 188–199. [Google Scholar] [CrossRef]
  29. Chang, Y.; Bi, H.; Gao, L.; Xu, H. Dynamic changes of soil moisture in Robinia pseudoacacia and Pinus tabuliformis forestlands in Loess region of western Shanxi Province. Sci. Soil Water Conserv. 2014, 12, 21–27. [Google Scholar]
  30. Chang, Y.; Huaxing, B.I.; Huasen, X.U.; Liao, W.; Cai, Z.; Wang, D. Influence of different densities of Robinia pseudoacacia forest on soil moisture in Loess Region of Western Shanxi Province. J. Soil Water Conserv. 2015, 29, 227–232. [Google Scholar]
  31. Liu, N.; Zhou, L.H.; Chen, Y.; Huang, S. Identification and evaluation of desertification reversal in China: Indicators and methods review. Sci. Cold Arid Reg. 2014, 39, 190–200. [Google Scholar]
  32. Chang, Y.F.; Bi, H.X.; Ren, Q.F.; Xu, H.S.; Cai, Z.C.; Dan, W.; Liao, W.C. Soil Moisture Stochastic Model in Pinus tabuliformis Forestland on the Loess Plateau, China. Water 2017, 9, 354. [Google Scholar] [CrossRef]
  33. Li, X.R.; Zhang, Z.S.; Lei, H.; Wang, X.P. Review of the ecohydrological processes and feedback mechanisms controlling sand-binding vegetation systems in sandy desert regions of China. Sci. Bull. 2013, 58, 1483–1496. [Google Scholar] [CrossRef] [Green Version]
  34. Rietkerk, M.; Vandekoppel, J. Alternate stable states and threshold effects in semi-arid grazing systems. OIKOS 1997, 79, 69–76. [Google Scholar] [CrossRef]
  35. Hillerislambers, R.; Rietkerk, M.; Bosch, F.V.D.; Prins, H.H.T.; Kroon, H.D. Vegetation pattern formation in semi-arid grazing systems. Ecology 2001, 82, 50–61. [Google Scholar] [CrossRef]
  36. Castellano, M.J.; Valone, T.J. Livestock, soil compaction and water infiltration rate: Evaluating a potential desertification recovery mechanism. J. Arid Environ. 2007, 1, 97–108. [Google Scholar] [CrossRef]
  37. Wang, Z.L.; Gang, W.; Liu, X.M. Germination strategy of the temperate sandy desert annual chenopod agriophyllum squarrosum. J. Arid Environ. 1998, 40, 69–76. [Google Scholar] [CrossRef]
  38. Liu, S. A new model for the prediction of rainfall interception in forest canopies. Ecol. Model. 1997, 99, 151–159. [Google Scholar] [CrossRef]
  39. Carlylemoses, D.E. Throughfall, stemflow, and canopy interception loss fluxes in a semi-arid sierra madre oriental matorral community. J. Arid Environ. 2004, 58, 181–202. [Google Scholar] [CrossRef]
  40. Wang, Y.; Wang, L.; Wei, S. Modeling canopy rainfall interception of a replanted Robinia Pseudoacacia forest in the Loess Plateau. Acta Ecol. Sin. 2012, 32, 5445–5453. [Google Scholar] [CrossRef]
  41. Wei, X.; Huaxing, B.I.; Liang, W. Canopy interception simulation of Larix Principis-rupprechtii and Pinus tabulaeformis forests in northern China based on gash model. Sci. Soil Water Conserv. 2017, 15, 27–33. [Google Scholar]
  42. Wang, X.P.; Kang, E.S.; Zhang, J.G.; Xin-Rong, L.I. Comparison of interception loss in shrubby and sub-shrubby communities in the tengger desert of northwest China. J. Glaciol. Geocryol. 2004, 26, 89–94. [Google Scholar]
  43. Sala, O.E.; Lauenroth, W.K. Small rainfall events: An ecological role in semiarid regions. Oecologia 1982, 3, 301–304. [Google Scholar] [CrossRef] [PubMed]
  44. He, Z.; Zhao, W.; Liu, H.; Chang, X. The response of soil moisture to rainfall event size in subalpine grassland and meadows in a semi-arid mountain range: A case study in northwestern China’s Qilian mountains. J. Hydrol. 2012, 420, 183–190. [Google Scholar] [CrossRef]
  45. Gómez-Plaza, A.; Alvarez Rogel, J.; Albaladejo, J.; Castillo, V.M. Spatial patterns and temporal stability of soil moisture across a range of scales in a semi-arid environment. Hydrol. Process. 2015, 14, 1261–1277. [Google Scholar]
  46. Duan, L.; Huang, M.; Zhang, L. Differences in hydrological responses for different vegetation types on a steep slope on the Loess Plateau, China. J. Hydrol. 2016, 537, 356–366. [Google Scholar] [CrossRef]
  47. Heisler-White, J.L.; Knapp, A.K.; Kelly, E.F. Increasing precipitation event size increases aboveground net primary productivity in a semi-arid grassland. Oecologia 2008, 58, 129–140. [Google Scholar] [CrossRef] [PubMed]
  48. Liu, Z.; Yu, X.; Jia, G.; Jia, J.; Lou, Y.; Lu, W. Contrasting water sources of evergreen and deciduous tree species in rocky mountain area of Beijing, China. Catena 2017, 150, 108–115. [Google Scholar] [CrossRef]
  49. Zhou, M.H.; Cheng, J.M.; Wan, H.E.; Wang, L.X.; Zhao, L.P. Distribution characteristics of the root system of the stipa bungeana trin. Community in Yunwu mountain. Acta Agric. Sin. 2008, 16, 267–271. [Google Scholar]
  50. Li, X.Y.; Zhang, S.Y.; Peng, H.Y.; Hu, X.; Ma, Y.J. Soil water and temperature dynamics in shrub-encroached grasslands and climatic implications: Results from Inner Mongolia steppe ecosystem of north China. Agric. For. Meteorol. 2013, 172, 20–30. [Google Scholar] [CrossRef]
  51. Wang, T.; Wu, W.; Xue, X.; Han, Z.W.; Zhang, W.M.; Sun, Q.W. Spatial-temporal changes of sandy desertified land during last 5 decades in northern China. Acta Geogr. Sin. 2004, 59, 203–212. [Google Scholar]
  52. Han, F.P.; Zheng, J.Y.; Zhang, X.C. Plant root system distribution and its effect on soil nutrient on slope land converted from farmland in the Loess Plateau. Trans. Chin. Soc. Agric. Eng. 2009, 25, 50–55. [Google Scholar]
  53. Yang, L.; Wei, W.; Chen, L.; Mo, B. Response of deep soil moisture to land use and afforestation in the semi-arid Loess Plateau, China. J. Hydrol. 2012, 475, 111–122. [Google Scholar] [CrossRef] [Green Version]
  54. Lebron, I.; Madsen, M.D.; Chandler, D.G.; Robinson, D.A.; Wendroth, O.; Belnap, J. Ecohydrological controls on soil moisture and hydraulic conductivity within a pinyon-juniper woodland. Water Resour. Res. 2007, 43, 1073–1078. [Google Scholar] [CrossRef]
  55. Zhang, Z.H.; Li, X.Y.; Jiang, Z.Y.; Peng, H.Y.; Li, L.; Zhao, G.Q. Changes in some soil properties induced by re-conversion of cropland into grassland in the semiarid steppe zone of Inner Mongolia, China. Plant Soil 2013, 373, 89–106. [Google Scholar] [CrossRef]
  56. Wang, Y.; Shao, M.A.; Zhu, Y.; Liu, Z. Impacts of land use and plant characteristics on dried soil layers in different climatic regions on the Loess Plateau of China. Agric. For. Meteorol. 2011, 151, 437–448. [Google Scholar] [CrossRef]
  57. Fu, W.; Huang, M.; Gallichand, J.; Shao, M. Optimization of plant coverage in relation to water balance in the Loess Plateau of China. Geoderma 2016, 25, 53–62. [Google Scholar] [CrossRef]
  58. Yu, Z.; Huang, M.B.; Lian, J.J. Spatial distributions of optimal plant coverage for the dominant tree and shrub species along a precipitation gradient on the central Loess Plateau. Agric. For. Meteorol. 2015, 6, 69–84. [Google Scholar]
Figure 1. Locations of the Hongqi forest farm and the soil moisture monitors in the three communities (R. pseudoacacia artificial forestland (A), P. tabulaeformis artificial forestland (B) and grassland (C)).
Sustainability 10 03793 g001
Figure 2. Underground root biomass in the R. pseudoacacia artificial forestland, P. tabulaeformis artificial forestland and grassland.
Sustainability 10 03793 g002
Figure 3. Response of soil moisture to precipitation (R. pseudoacacia artificial forestland (A), P. tabulaeformis artificial forestland (B), grassland (C)).
Sustainability 10 03793 g003
Figure 4. Response of soil moisture in three communities (R. pseudoacacia artificial forestland, P. tabulaeformis artificial forestland, grassland) to light rainfall.
Sustainability 10 03793 g004
Figure 5. Response of soil moisture in three communities (R. pseudoacacia artificial forestland, P. tabulaeformis artificial forestland, grassland) to moderate rainfall.
Sustainability 10 03793 g005
Figure 6. Response of soil moisture in three communities (R. pseudoacacia artificial forestland, P. tabulaeformis artificial forestland, grassland) to heavy rainfall.
Sustainability 10 03793 g006
Figure 7. Response of soil moisture in three communities (R. pseudoacacia artificial forestland, P. tabulaeformis artificial forestland, grassland) to rainstorms.
Sustainability 10 03793 g007
Figure 8. Increments of infiltration at 0–150 cm soil depth in R. pseudoacacia artificial forestland, P. tabulaeformis artificial forestland and grassland.
Sustainability 10 03793 g008
Figure 9. The relationship between cumulative infiltration and precipitation.
Sustainability 10 03793 g009
Table 1. Characteristics of soil under three vegetation communities.
Vegetation TypesSoil Organic Matter Content (%)Sand (%)Silt (%)Clay (%)Soil Buck Density
R. pseudoacacia0.91 ± 0.17a67.30 ± 0.62a21.33 ± 1.76a13.35 ± 1.31a1.07 ± 0.01a
P. tabulaeformis0.41 ± 0.03b67.34 ± 1.34a19.36 ± 0.70a11.33 ± 0.67a1.16 ± 0.13a
Grassland0.63 ± 0.15ab68.74 ± 0.66a17.96 ± 1.15a13.30 ± 0.67a0.90 ± 0.03a
Note: Values followed by different lowercase letters in the same column indicate significant differences. Mean ± SE. Values followed by different lowercase letters in the same row indicate significant differences (p < 0.05).
Table 2. Stands characteristics of different vegetation types.
Vegetation TypesHeightLAICanopy DensityIndividual Biomass (kg)Herb Coverage (%)AspectSlope (°)
R. pseudoacacia3.5a2.04a0.76a8.52a55bsemi-sunny23
P. tabulaeformis2.7b1.69b0.65 b2.01b10csemi-sunny23
Grassland////90asemi-sunny23
Note: Values followed by different lowercase letters in the same column indicate significant differences. Mean ± SE. Values followed by different lowercase letters in the same row indicate significant differences (p < 0.05).
Table 3. Rainfall intensity standards.
Precipitation IntensityPrecipitation within 24 h
Light rainfall[5–10] mm
Moderate rainfall(10–24.9] mm
Heavy rainfall(24.9–49.9] mm
Rainstorm(>50] mm
Note: Rainfall intensity standards are from the State Meteorological Administration of China.
Table 4. The effects of vegetation and soil parameters on soil moisture variation.
X1X2X3X4X5X6X7X8X9X10X11
A0.929 **0.857 *0.7530.885 *0.889 *0.889 *0.857 *0.889 *0.889 *0.886 *0.295
B0.919 **0.912 *0.7070.7540.886 *0.954 **0.913 *0.932 *0.5220.883 *0.683
C0.861 *0.963 **0.7860.891 *0.887 *///0.957 **0.948 **/
Note: A, R. pseudoacacia; B, P. tabulaeformis; C, Grassland; X1, Soil organic matter content; X2, Sand; X3, Silt; X4, Clay; X5, Soil bulk density; X6, Height; X7, Leaf area index; X8, Canopy density; X9, Herb coverage; X10, Fine roots biomass; X11, Coarse root biomass. * Correlation is significant at the 0.05 level, ** correlation is significant at the 0.01 level.

