Reasonable Paths of Construction Ventilation for Large-Scale Underground Cavern Groups in Winter and Summer

1
Key Laboratory of Transportation Tunnel Engineering, Ministry of Education, School of civil Engineering, Southwest Jiaotong University, Chengdu 610031, China
2
School of Engineering, University of Warwick, Coventry CV4 7AL, UK
3
Institute of Foreign Languages, Sichuan Technology and Business University, Meishan 620000, China
*
Author to whom correspondence should be addressed.
Sustainability 2018, 10(10), 3768; https://doi.org/10.3390/su10103768
Submission received: 19 September 2018
/
Revised: 12 October 2018
/
Accepted: 15 October 2018
/
Published: 18 October 2018
(This article belongs to the Special Issue Sustainable Environmental Health Science and Engineering)
Abstract
:Forced ventilation or newly built vertical shafts are mainly used to solve ventilation problems in large underground cavern groups. However, it is impossible to increase air supply due to the size restriction of the construction roadway, resulting in ventilation deterioration. Based on construction of the Jinzhou underground oil storage project, we proposed both a summer ventilation scheme and winter ventilation scheme, after upper layer excavation of the cavern is completed and connected with the shaft. A three-dimensional numerical model validated with field test data was performed to investigate air velocity and CO concentration. Fan position optimization and the influence of temperature difference on natural ventilation were discussed. The results show that CO concentration in the working area of the cavern can basically drop to a safe value of 30 mg/m3 in air inlet and exhaust schemes after 10 min of ventilation. Since there is inevitably a back-flow in the winter ventilation scheme, it is necessary to ensure that airflow is always moving towards the shaft. Optimal placement of the axial flow fan at the shaft bottom is on the central axis of the cavern, 5 m away from the shaft. The greater the temperature difference, the better the natural ventilation effect of the shaft. The natural ventilation effect of the shaft as an outlet in winter, is better than that of the shaft as an inlet in summer.
1. Introduction
The strategic reservation of oil and natural gas is an important means to ensure a safe and stable supply of energy and normal operation of the country. According to provisions of the International Energy Agency (IEA), emergency oil reserves of member states should be equivalent to 90 days’ consumption in the previous year. China is short of oil resources and the contradiction between supply and demand has been increasingly prominent in recent years [1,2,3]. The total annual oil demand in China is expected to exceed seven billion tons by 2020, of which two thirds needs to be imported, therefore fluctuation of the international oil price is becoming more and more important to China’s economy. Underground water-sealed storage of liquefied petroleum gas (LPG) in unlined rock caverns is widely considered a technically sound and economically feasible storage method due to its reduced land occupation, higher security, lower cost, and increased environmental benefits. Since the 1970s, China has built a series of underground energy storage caverns in Huangdao, Xiangshan, Ningbo, Shantou, Yantai, Qingdao, and Huizhou [4]. Compared with traditional underground engineering such as railway tunnels, highway tunnels, and hydraulic tunnels, the water sealed caverns often have characteristics such as a large section, multiple working faces, high required air volume, and serious pollution. These characteristics put forward high requirements for the rapid and safe construction of underground water sealed caverns and some practical engineering problems that urgently need to be solved. A large amount of harmful gas and dust are released when the drilling and blasting method is used in underground excavation [5,6]. Ventilation time and pollutant concentration are two important indexes for evaluating ventilation schemes in tunnel construction. Although the, “Safety Operation Regulations for Tunnel Drilling and Blasting” stipulates that ventilation time after blasting should not be less than 15 min [7], a specific ventilation time is not clearly defined in the code and the industry usually takes 30 min into account. Moreover, according to hygienic standards of the tunnel construction industry [8,9], the maximum allowable concentration of CO is 30 mg/m3. Under special circumstances, the allowable value can be increased to 100 mg/m3 for workers entering the working face, but the working time must not exceed 30 min. Therefore, rational design and optimization of the ventilation scheme for the underground cavern group is key technology and directly related to project progress and safety of construction workers [10].
Numerous studies have been conducted to explore construction ventilation, but mainly in traditional underground engineering, such as coal mine roadways, transportation tunnels, and hydraulic tunnels [11,12,13,14,15,16]. Sasmito et al. [17] and Zhang et al. [18] simulated and analyzed methane distribution in coal mine roadways through numerical simulation and thus provided a base for the design of a ventilation system. Nakayama et al. [19] applied the RNG (Renormalization-group) k-ε turbulence model to study distribution of the flow field near the heading face under forced ventilation. The calculated values were basically consistent with the measured values. Laslandes [20] and Klemens [21] established a two-dimensional Eulerian two-phase flow model to study the influence of mine obstructions on distribution of dust. Toraño et al. [22] performed a two-phase numerical simulation of airflow and dust in mining roadways with the Euler–Lagrange method. Fang et al. [23] built a three-dimensional numerical model to study air flow behavior and hazardous gas dispersion near the cross-aisle of a twin-tunnel construction. Zhang et al. [24] conducted a deep analysis of shaft effect in extra-long tunnel ventilation and optimized fan arrangement near the cross passage and bottom of the shaft by using numerical simulation and field measurement. Liu et al. [25] employed a three-dimensional unsteady Euler–Lagrange two-phase turbulence model to investigate the pollutant discharge problem caused by storage heat effects, intersecting tunnels, and air leakage along the long duct system. Wang et al. [26] validated the correctness of the RNG k-ε model by model testing and further studied the distribution of wind pressure, velocity, and air leakage rates during construction ventilation of a diversion tunnel. Liu et al. [27] proposed a reformed RNG k-ε model and applied a simulation study to the ventilation system of powerhouses in deep underground hydropower stations.
Past studies have mainly focused on ventilation performance and contaminant dispersion [28,29], but there are very few applications in large-scale underground cavern groups with an excavation area exceeding 400 m2. However, the underground water-sealed storage caverns are large in scale and complicated in spatial structure and connection, which brings many difficulties to ventilation during the construction process. Therefore, how to organize and optimize the airflow path is of great significance for improving ventilation efficiency. This paper aims to reveal a reasonable path of construction ventilation for large-scale underground cavern groups in winter and summer. For this purpose, a field ventilation test was carried out first, to validate the results of a three-dimensional numerical model. Then, the distribution of air velocity and CO concentration in both the winter ventilation scheme and summer ventilation scheme were investigated. Finally, fan position optimization and the influence of temperature difference between inside and outside, on natural ventilation were discussed in detail. The results can help engineers better understand flow patterns of ventilation systems and also to design an effective ventilation system for the large-scale underground cavern group.
2. Project Overview
2.1. Layout of Underground Structures
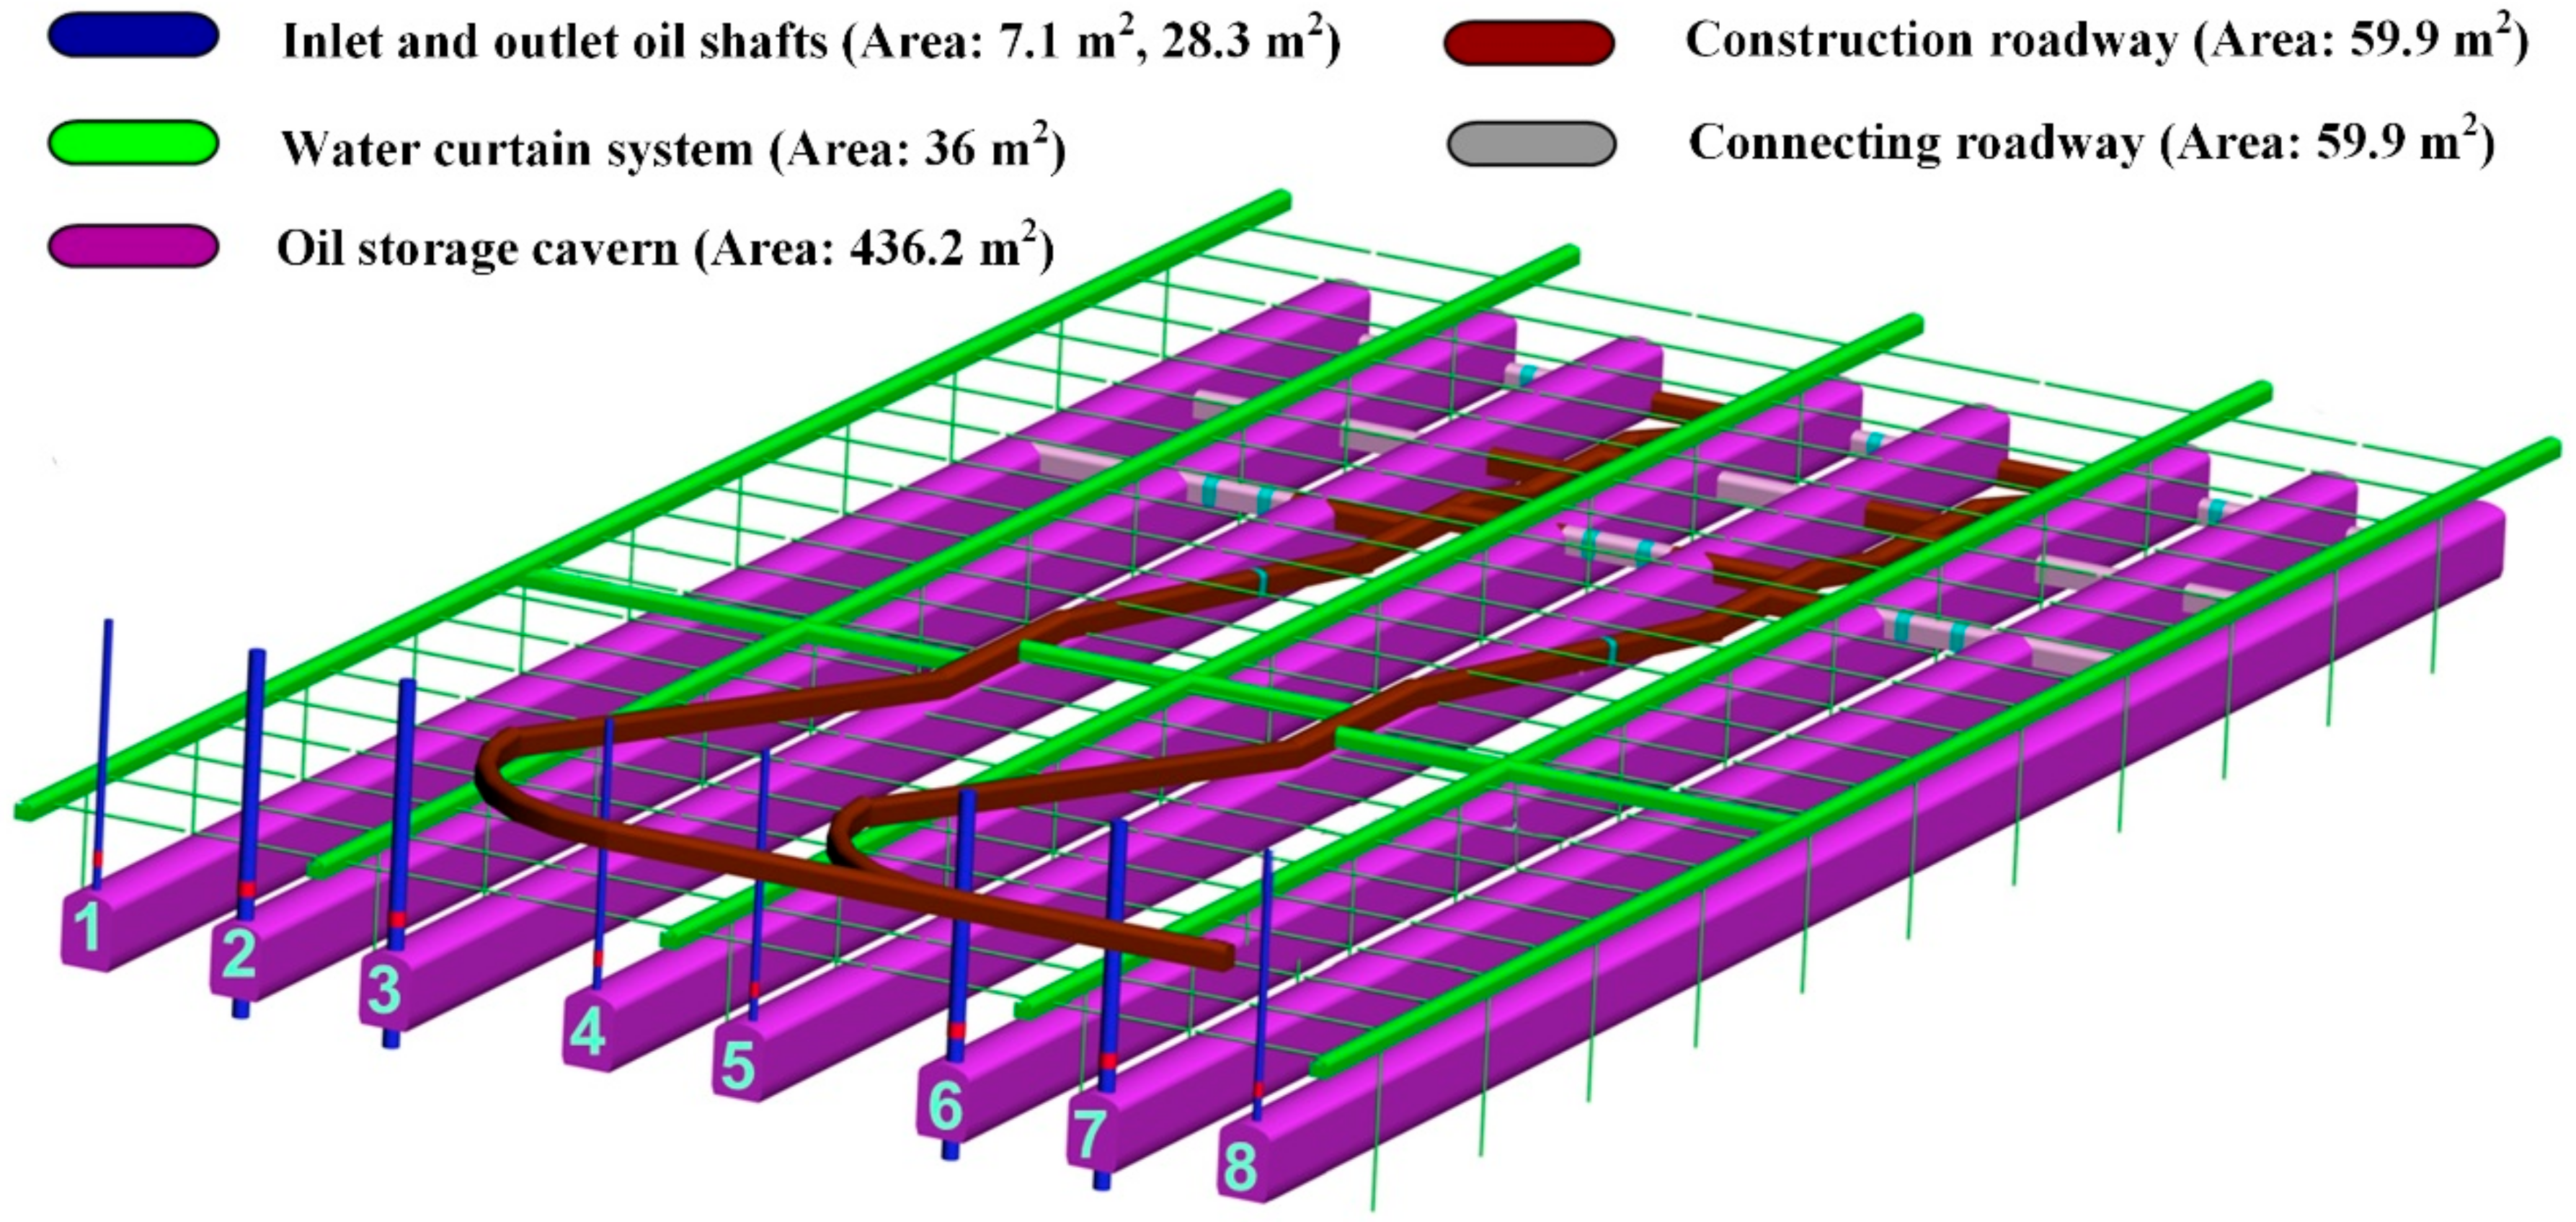
The Jinzhou underground water-sealed oil storage caverns are located in Liaoning province, in the northeast area of China. Jinzhou is located in the semi-humid monsoon climate zone of the north temperate zone. It is cold and dry in winter, with obvious monsoons and strong winds. The maximum annual temperature is 34.1 °C and the lowest temperature is −21 °C. The design storage capacity of the project is 300 × 104 m3 for crude oil, which mainly consists of two parts: underground engineering and ground engineering. The underground engineering is mainly composed of eight storage caverns, four inlet oil shafts with a diameter of 3 m, four outlet oil shafts with a diameter of 6 m, connecting roadways, construction roadways, and an artificial water curtain system (Figure 1). Each storage cavern is arranged in parallel, in an east–west direction, and 19 m wide, 24 m high, and 934 m long. The section area is 436.2 m2, bottom elevation of the cavern is −80 m, top elevation is −56 m, and ground elevation is 0 m. Section size of the construction roadway and the connecting roadway are the same, both 8 m (width) × 8 m (height). The storage cavern is divided into three layers for construction by adopting the drilling and blasting method, the excavation height of each layer is 8 m. Forced ventilation is employed before completion of the upper layer construction and the SDZ-12.5 axial flow fans with Φ1.8 m duct are arranged at the entrance of the construction roadway. However, pollution sources in the middle and bottom layer are generally larger than the upper layer excavation due to increases in the amount of excavation and working faces. Because of size restriction of the construction roadway, forced ventilation cannot meet environmental requirements in the cavern.
2.2. Principle of Natural Ventilation
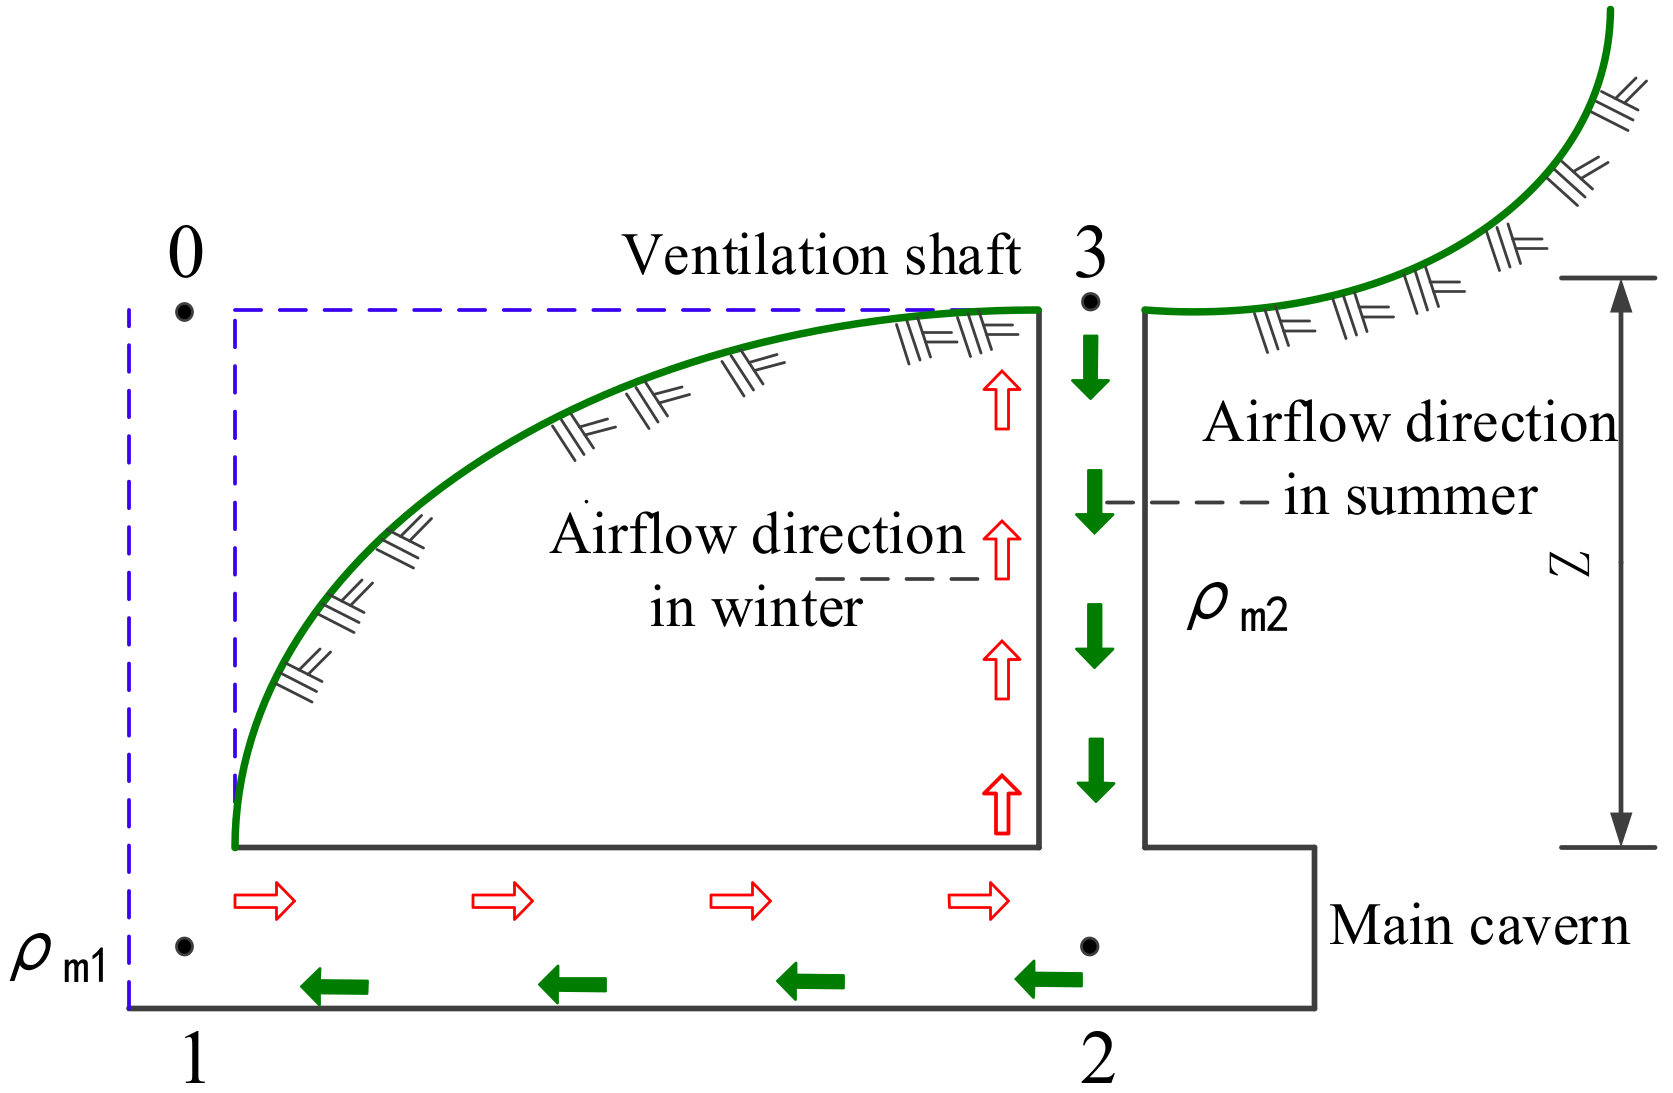
The ventilation shaft is often used to solve the ventilation problem during the construction period of the cavern group, so as to reduce the length of single-head ventilation. At the same time, natural ventilation can be fully utilized to reduce energy consumption in seasons with large temperature differences between the inside and outside of the cavern [30,31,32,33]. Natural wind flow in the cavern is caused by the temperature difference between the inside and outside of the cavern, horizontal pressure differences between air inlet and outlet points, and natural wind flow outside the cavern. Normally, dynamic pressure converted by atmospheric wind flow outside the cavern and the horizontal pressure difference have little effect on natural wind pressure. Natural wind pressure mainly depends on the thermal potential difference. Therefore, two key factors affecting natural wind pressure are the density difference between air columns 0–1 and 2–3, due to the temperature difference inside and outside the cavern and depth of the ventilation shaft as shown in Figure 2. In winter, the outside temperature is lower than the temperature inside the cavern and the density of air column 0–1 is higher than that of 2–3. Natural wind flow enters the cavern from point 1 and discharges from point 3. In summer, the direction of natural wind is opposite. Natural air volume QN is determined by natural ventilation pressure and ventilation resistance. It can be calculated by the following Formulas (1)–(4):
where QN is natural air volume (m3/min), A is excavation area of the cavern (m2), v is the average air velocity in the cavern (m/s), λ is the wall friction coefficient, λ = 0.02, LT is cavern length (m), dT is the equivalent diameter of the cavern (m), ρ is air density (kg/m3), P is the standard atmospheric pressure (Pa), and T is Kelvin temperature (K).
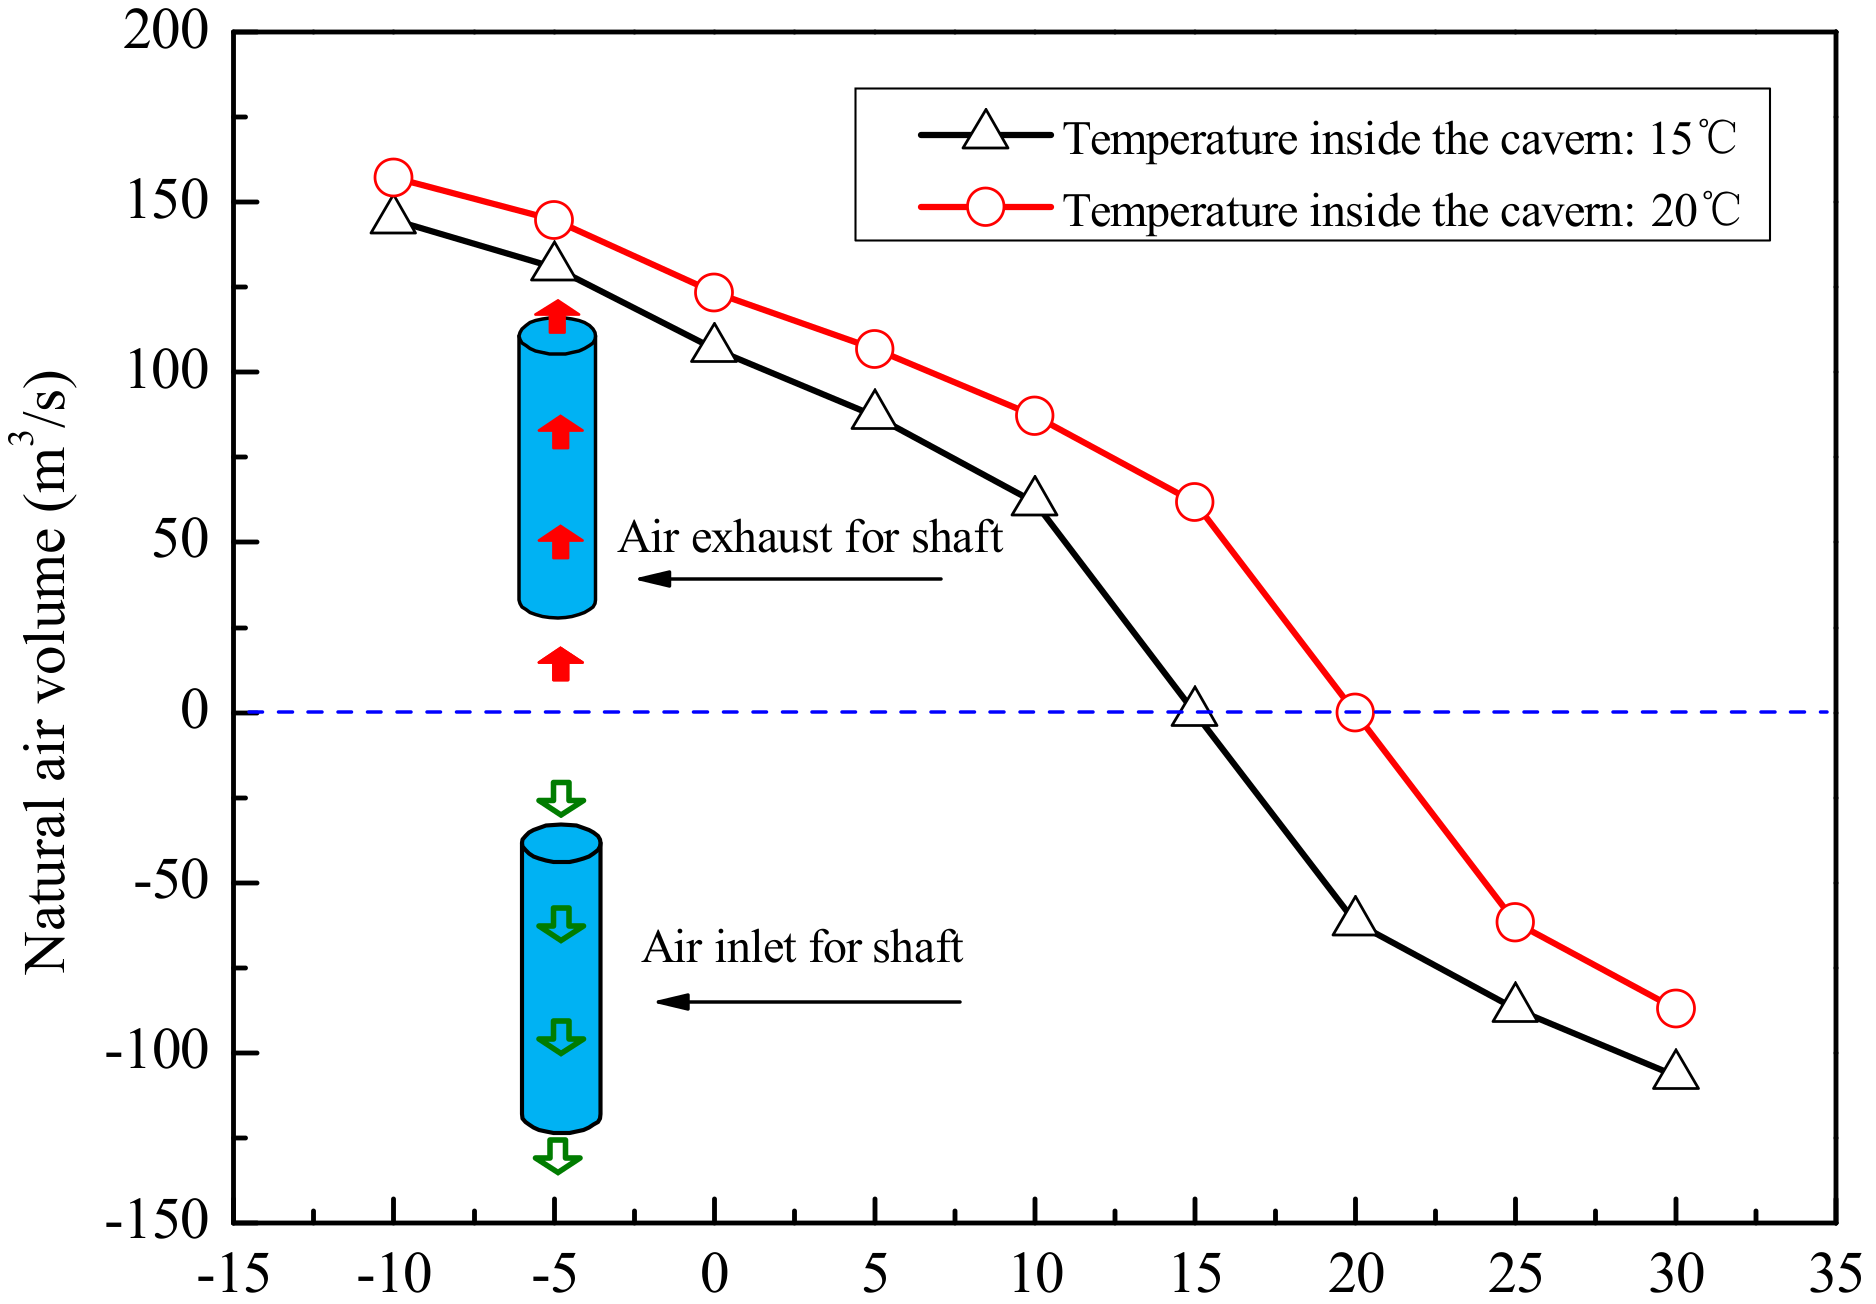
Because the temperature inside the cavern experiences little change, the natural ventilation volume caused by the thermal potential difference is discussed with temperature inside the cavern being 15 °C and 20 °C. When there is a shaft in the cavern, thermal potential difference under the effect of temperature difference, has a great influence on air flow in the cavern as shown in Figure 3. It changes not only air volume in the cavern, but also the direction of airflow.
2.3. Ventilation Scheme
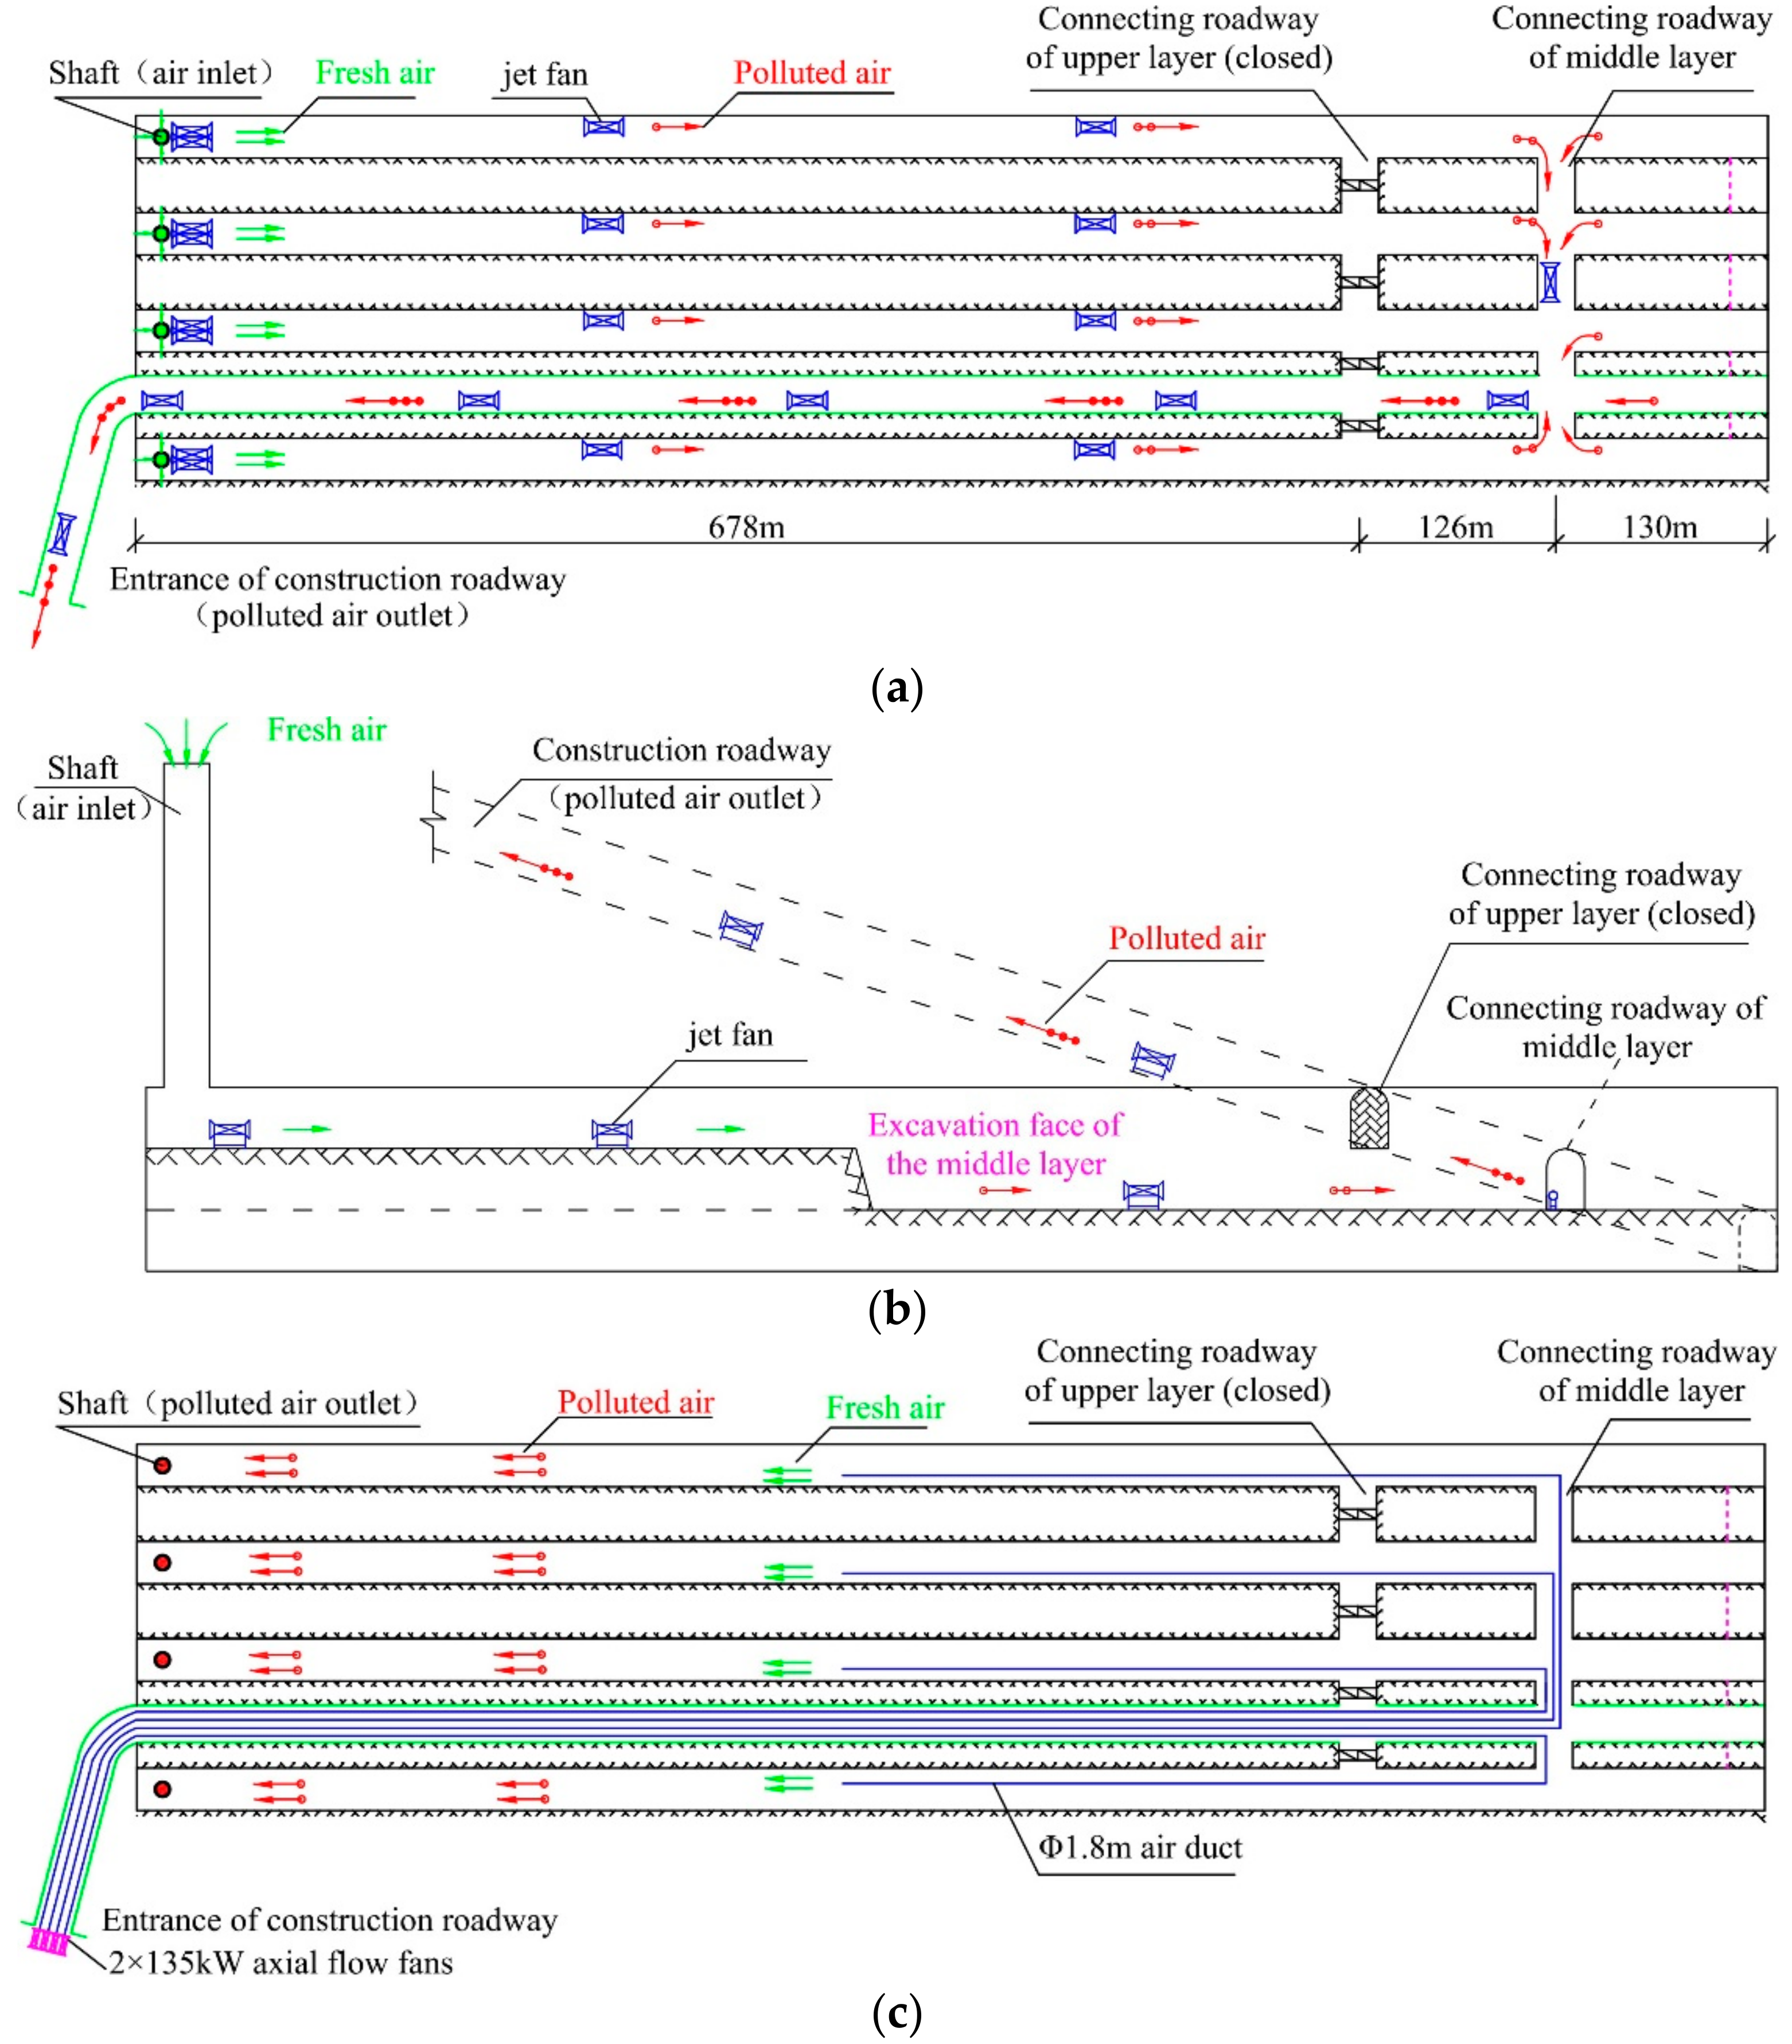
Some successful engineering cases have shown that natural ventilation in underground caverns can assist the original mechanical ventilation system, largely reducing energy consumption [34]. When upper layer excavation of the cavern is completed and connected with the shaft, we present the summer ventilation scheme and winter ventilation scheme as shown in Figure 4. Under the combined action of shaft height difference and temperature difference inside and outside the cavern, the orderly air circulation network can be formed and polluted air discharged by reasonable planning of the ventilation path and fan configuration, as well as effective utilization of natural wind in the shaft. In summer (June to August), shafts are used as the fresh air inlet and the construction roadway as the outlet of polluted air. Fewer jet fans are arranged in the air intake section and more in the polluted air discharge section, while fewer are in the large cross-section and more in the small cross-section. In winter (December to February), axial flow fans with Φ1.8 m ducts are arranged at the entrance of the construction roadway and used to supply fresh air to the working face, where the polluted air is discharged through the shafts. In spring (March to May) and autumn (September to November), the choice of ventilation scheme is mainly based on location of the excavation face. For example, when the excavation face is near the shaft, the winter ventilation scheme is adopted. When the excavation face is near the connecting roadway, the summer ventilation scheme is selected. In addition, the shift of the two ventilation schemes is very convenient in the construction site and multiple shifts are not needed.
3. Field Test
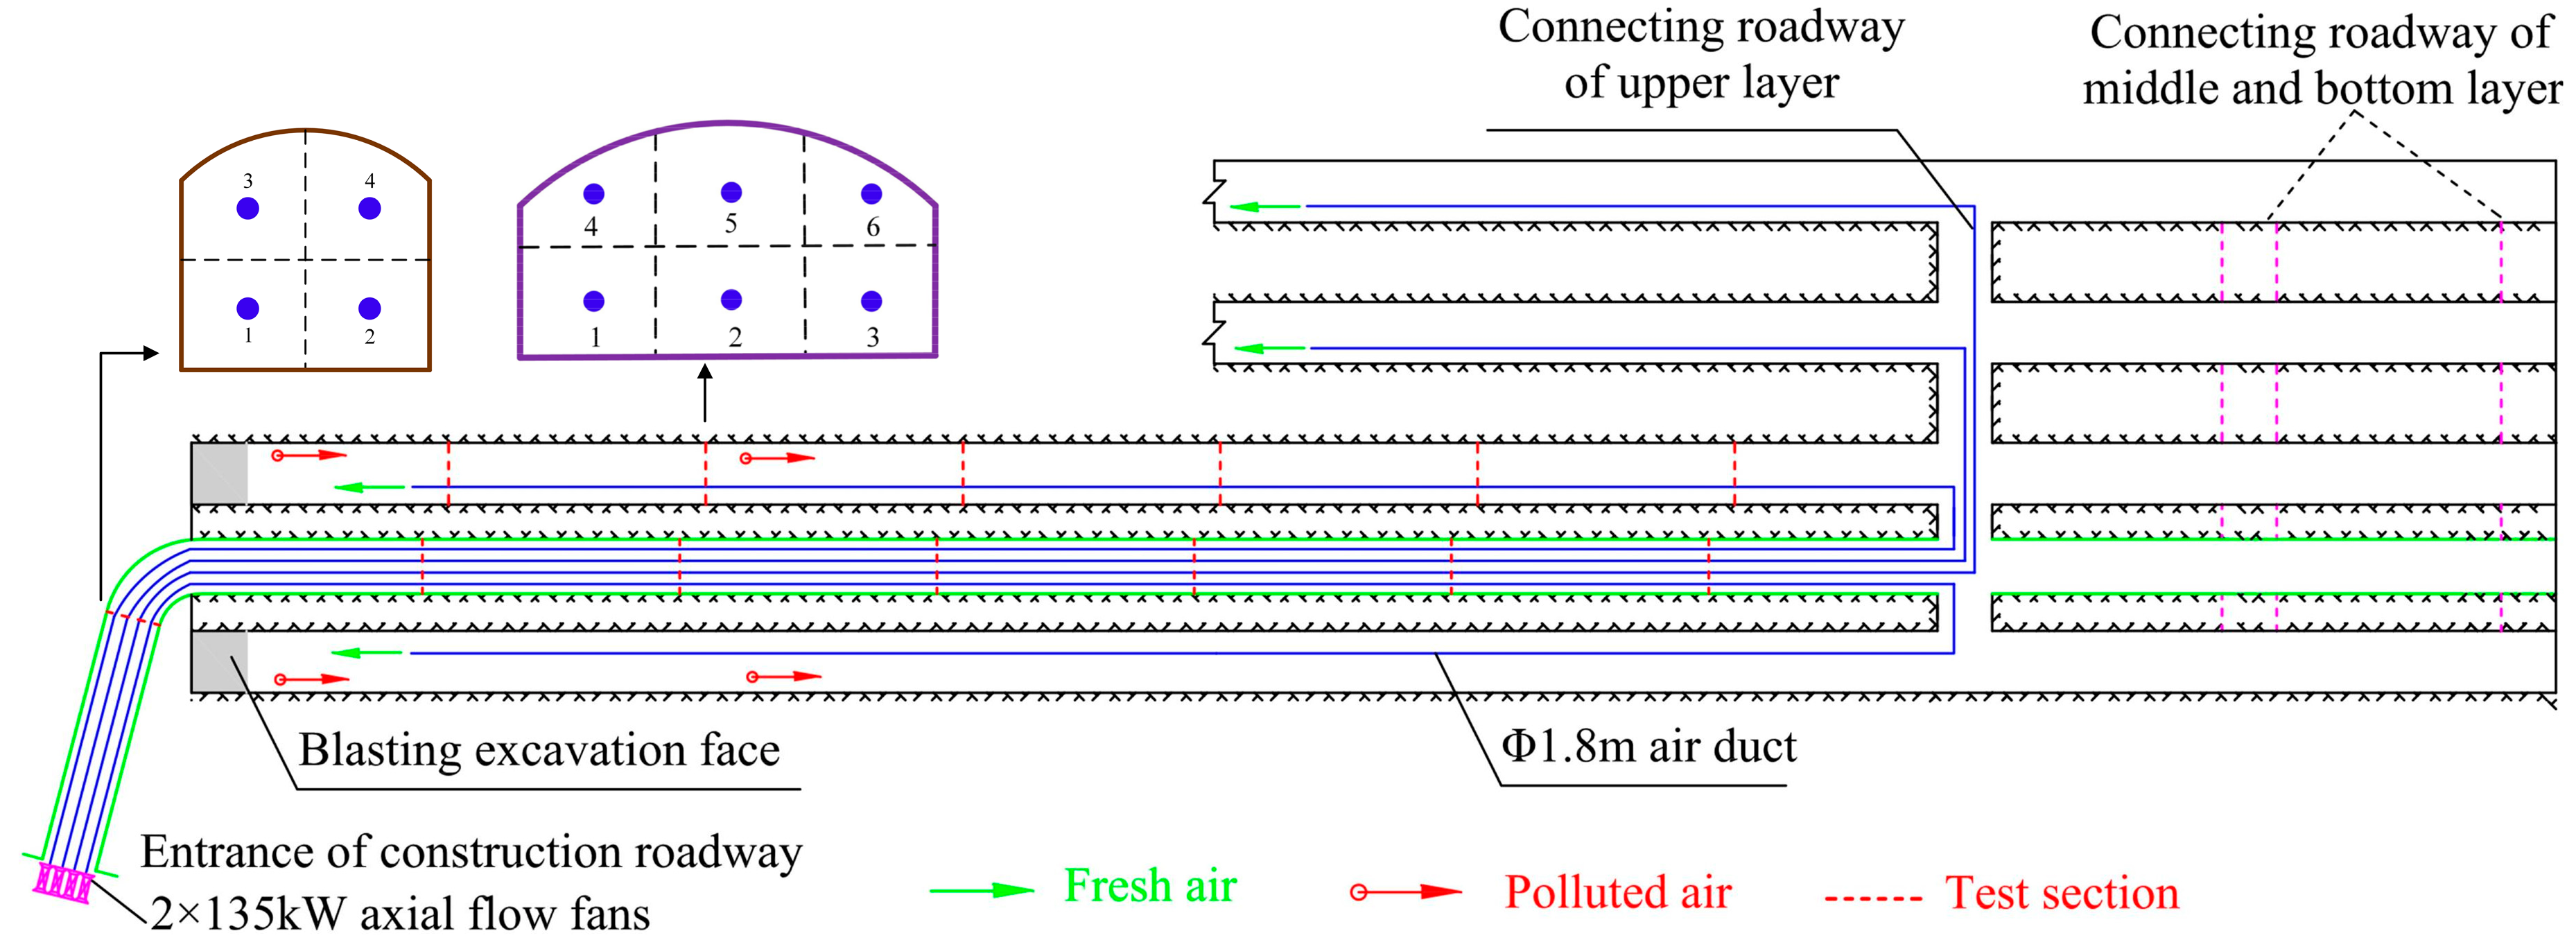
The overall goal of the ventilation field test is to simultaneously obtain air velocity and CO concentration in the oil storage cavern and construction roadway. Before completion of the upper layer construction, the SDZ-12.5 axial flow fans with Φ1.8 m ducts, arranged at the entrance of the construction roadway, were used for forced ventilation as shown in Figure 3. The main cavern was arranged with a test cross-section every 100 m in the longitudinal direction, with a total of six test cross-sections. There were a total of seven cross-sections to be tested in the construction roadway. A hot-wire anemometer with a resolution of 0.01 m/s was used to test air velocity and a M4 gas detector with a resolution of 0.1 ppm was employed to test CO gas concentration. Because the air velocity and CO gas concentration vary with location, it is important to increase the number of test points to obtain average air velocity and CO gas concentration of the cross-section [23]. Therefore, the cross-section of the main cavern is divided into six parts and the cross-section of the construction roadway is divided into four parts as shown in Figure 5. Air velocity and CO gas concentration in each part are averaged to be Va and Ca separately. Consequently, the value of Va and Ca can be calculated with the following equations:
where i = 1, …, 6 for the section of the cavern upper layer, i = 1, …, 4 for the construction roadway, and Ai is the area of part i in the cross-section.
4. Computational Model
4.1. Model Description
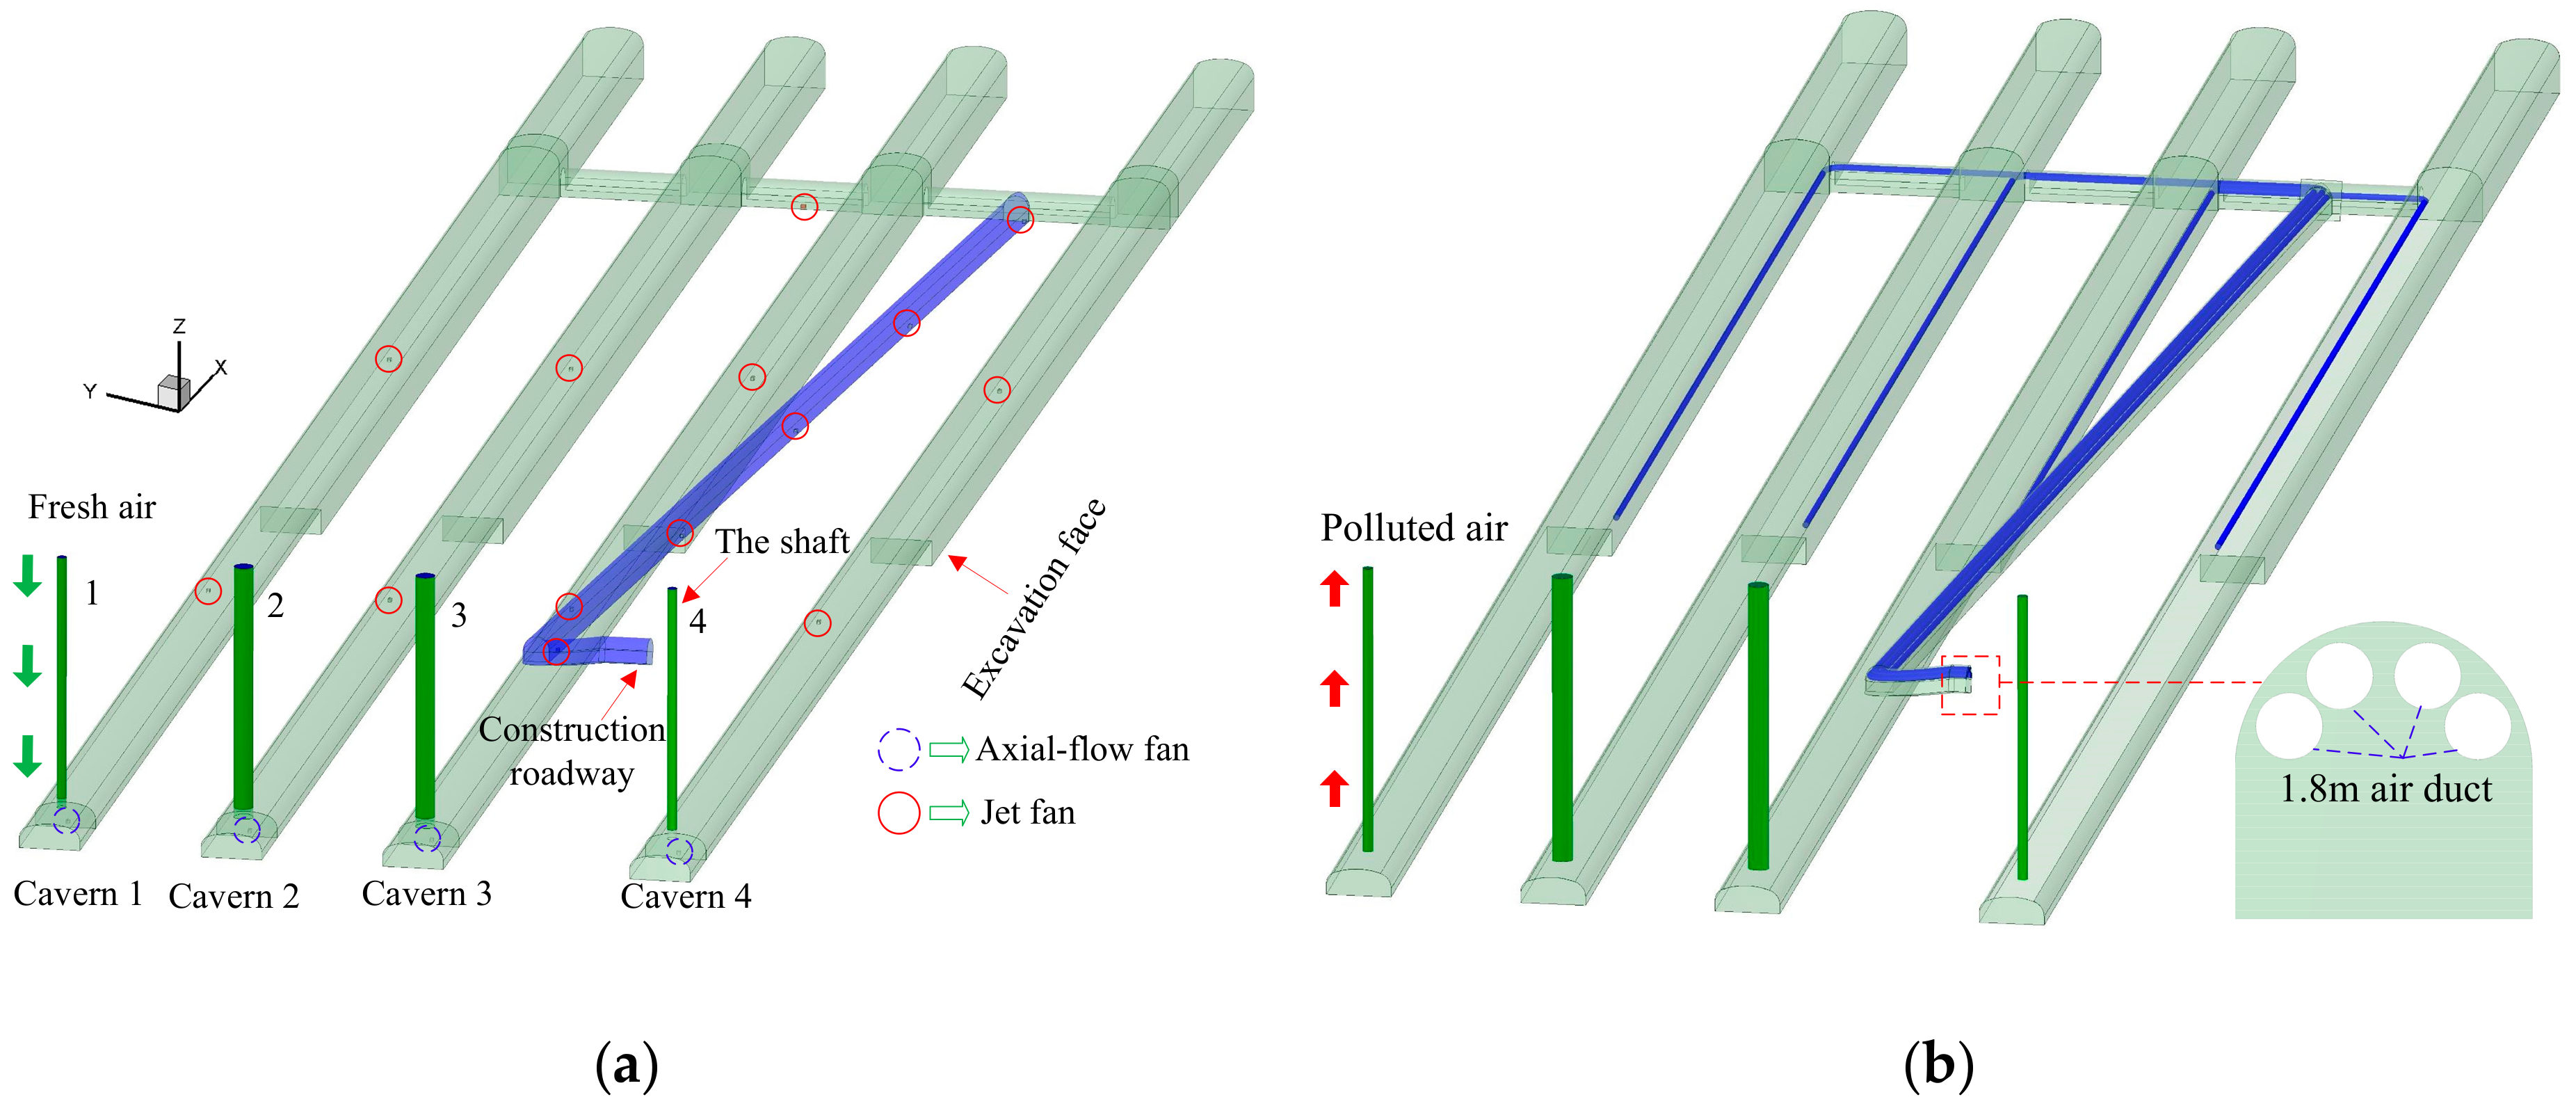
Construction of the Jinzhou oil storage project consists of two contract sections. The object of our work is the first section, including cavern one to cavern four, the shafts, the construction roadway, and the connecting roadway. Analysis of airflow and gas evolution taking place after blasting in a development cavern can be successfully carried out by means of computational fluid dynamic (CFD) modelling. Therefore, the commercial computational fluid dynamics (CFD) software ANSYS FLUENT 17 was employed to solve numerical models. The three-dimensional unsteady component transport model was used to solve the governing equations and the standard two-equation k-ε turbulence model, which has been extensively validated by the scientific community and widely applied to tunnel ventilation systems was applied to simulate turbulence [35,36]. The three-dimensional size of the computational model is exactly the same as the actual project. The X direction is the axis direction, Y direction is the width direction, and Z direction is the height direction of the cavern as shown in Figure 6. In consideration of computing scale, stability, and convergence of the simulation, a regular hexahedron grid with a quality of 0.52 was used in the model meshing.
4.2. Setting the Boundary
The boundary conditions are specified as follows: (1) the velocity-inlet boundaries were applied to the outlet of the air duct, fan and airflow velocity of the air duct were 15.7 m/s, and the value in the outlet of the axial-flow fan and jet fan were 20 m/s and 40 m/s respectively; (2) the pressure outlet boundaries were considered to be in the entrance of the construction roadway in Figure 4a and shaft mouth in Figure 4b; (3) the non-slip wall boundary condition was applied on the solid wall of the tunnel and a value of 0.07 m of wall roughness was applied on the tunnel wall [37].
A large amount of gas is generated after blasting and carbon monoxide (CO) and oxides of nitrogen are highly toxic. Because of the superior stability of chemical and physical properties of CO compared to nitrogen oxide, CO is used as an evaluation index in ventilation calculation. The amount of nitrogen oxide is converted to the equivalent of carbon monoxide at a ratio of 1:6.5. According to actual construction conditions, initial throwing length and average CO concentration are calculated by the following equation and shown in Table 1 [38].
(1) The CO throwing length:
(2) The initial average CO concentration:
where C0 is initial CO concentration (mg/m3), G is the amount of explosive (kg), LOT is the throwing length (m), b is toxic gas produced per kilogram of explosive (m3/kg), b is generally valued at 0.04, and A is the excavation area (m2).
4.3. Validation with Field Ventilation Test Data
The field test data of air velocity and CO concentration in the forced ventilation of the Jinzhou oil storage cavern were used to validate the present numerical model. The simulated data was compared to measured values as shown in Figure 7. It can be found that prediction of air velocity in the main cavern and construction roadway agrees quite well with the field test. Average errors in the main cavern and construction roadway are 10.3% and 8.4% respectively. Moreover, simulation results of average CO concentration in two test sections are in good agreement with test values. Average relative errors of CO concentration in Section 1 and Section 3 are 10.9% and 12.1% respectively. Validation results indicate that the numerical calculation model can be used for construction ventilation scheme simulations of Jinzhou oil storage caverns.
5. Results and Discussion
5.1. Ventilation Effect in the Summer Ventilation Scheme
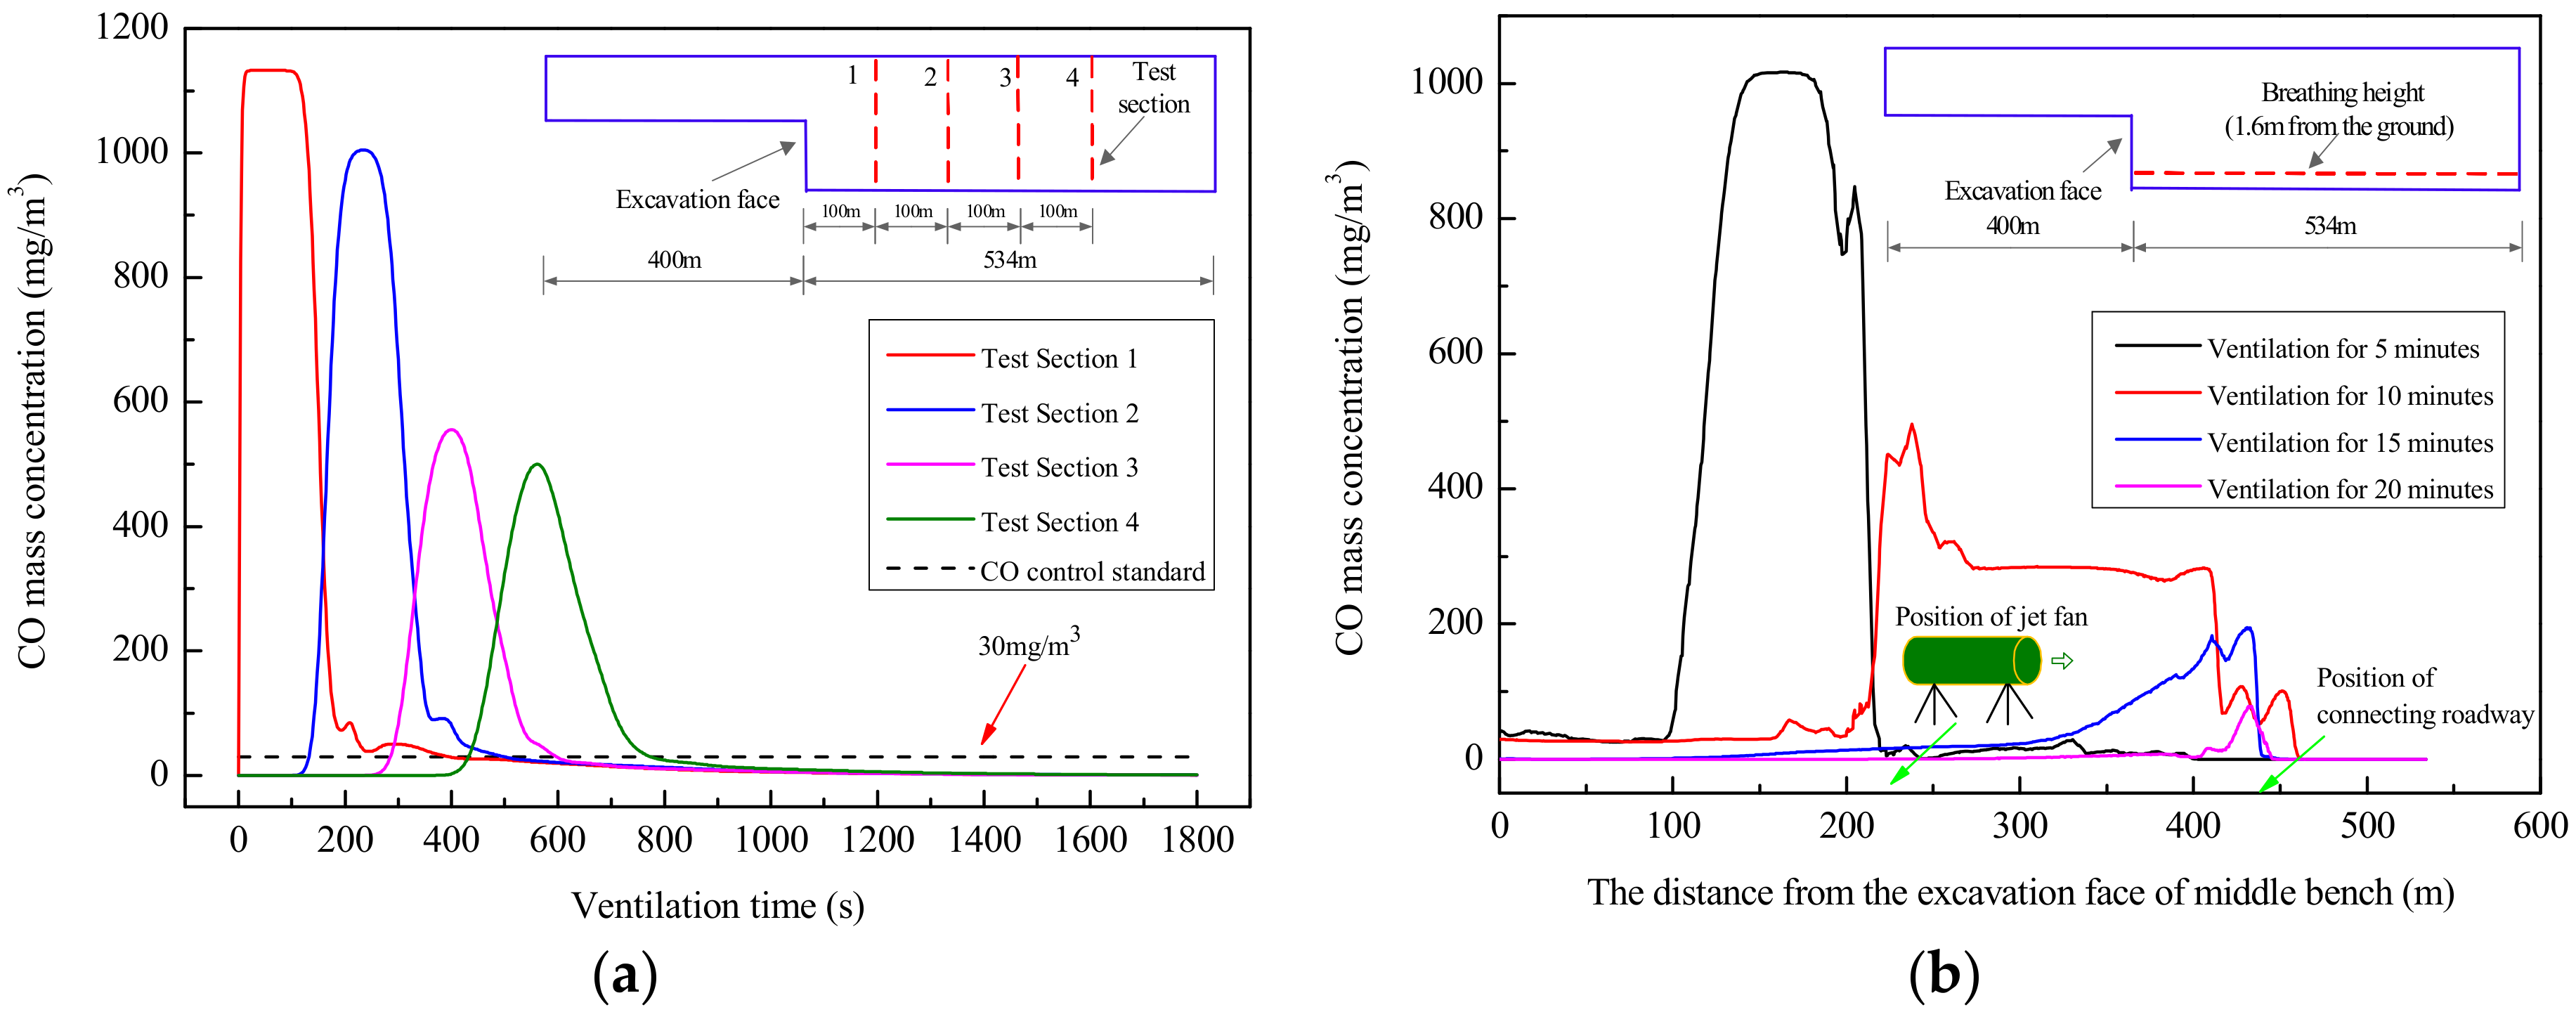
The CO mass concentration migration and distribution law in different ventilation time periods (5 min, 10 min, 15 min, 20 min) in the cavern are shown in Figure 8. It can be seen that CO gas in the vicinity of the middle step moves toward the connecting roadway with the increase in ventilation time. After 15 min of ventilation, it reaches the vicinity of the connecting roadway and polluted air is gradually discharged out of the tunnel through the construction roadway. The CO concentration, in most parts of the caverns, was reduced to below the national safety standard value of 30 mg/m3 after 20 min of ventilation. Although a small amount of high concentration CO gathered near the connecting roadway, it would not affect normal operation of the working area (approximately 300 m away from the excavation face) because the section area of the construction roadway is smaller than that of the cavern and more jet fans are arranged so that CO gas in the construction roadway can be quickly discharged outside.
In order to investigate air quality in the working area (approximately 300 m away from the excavation face), there were a total of four cross-sections to be monitored in the numerical simulation, to obtain variation of CO with ventilation time as shown in Figure 9a. CO concentration in the working area basically decreased below the safety standard value of 30 mg/m3 after 10 min of ventilation, which meets the requirements of safe and rapid construction. Under the promotion of two jet fans on the upper bench, the high concentration CO region moves rapidly towards the connecting roadway. When it reaches the position of the jet fan in the middle bench, CO concentration decreases greatly and the diffusion range increases. This is because the larger air velocity at the outlet of the jet fan makes fresh air and pollutants mix fully and move forward as shown in Figure 9b.
5.2. Axial Fan Arrangement at the Shaft Bottom
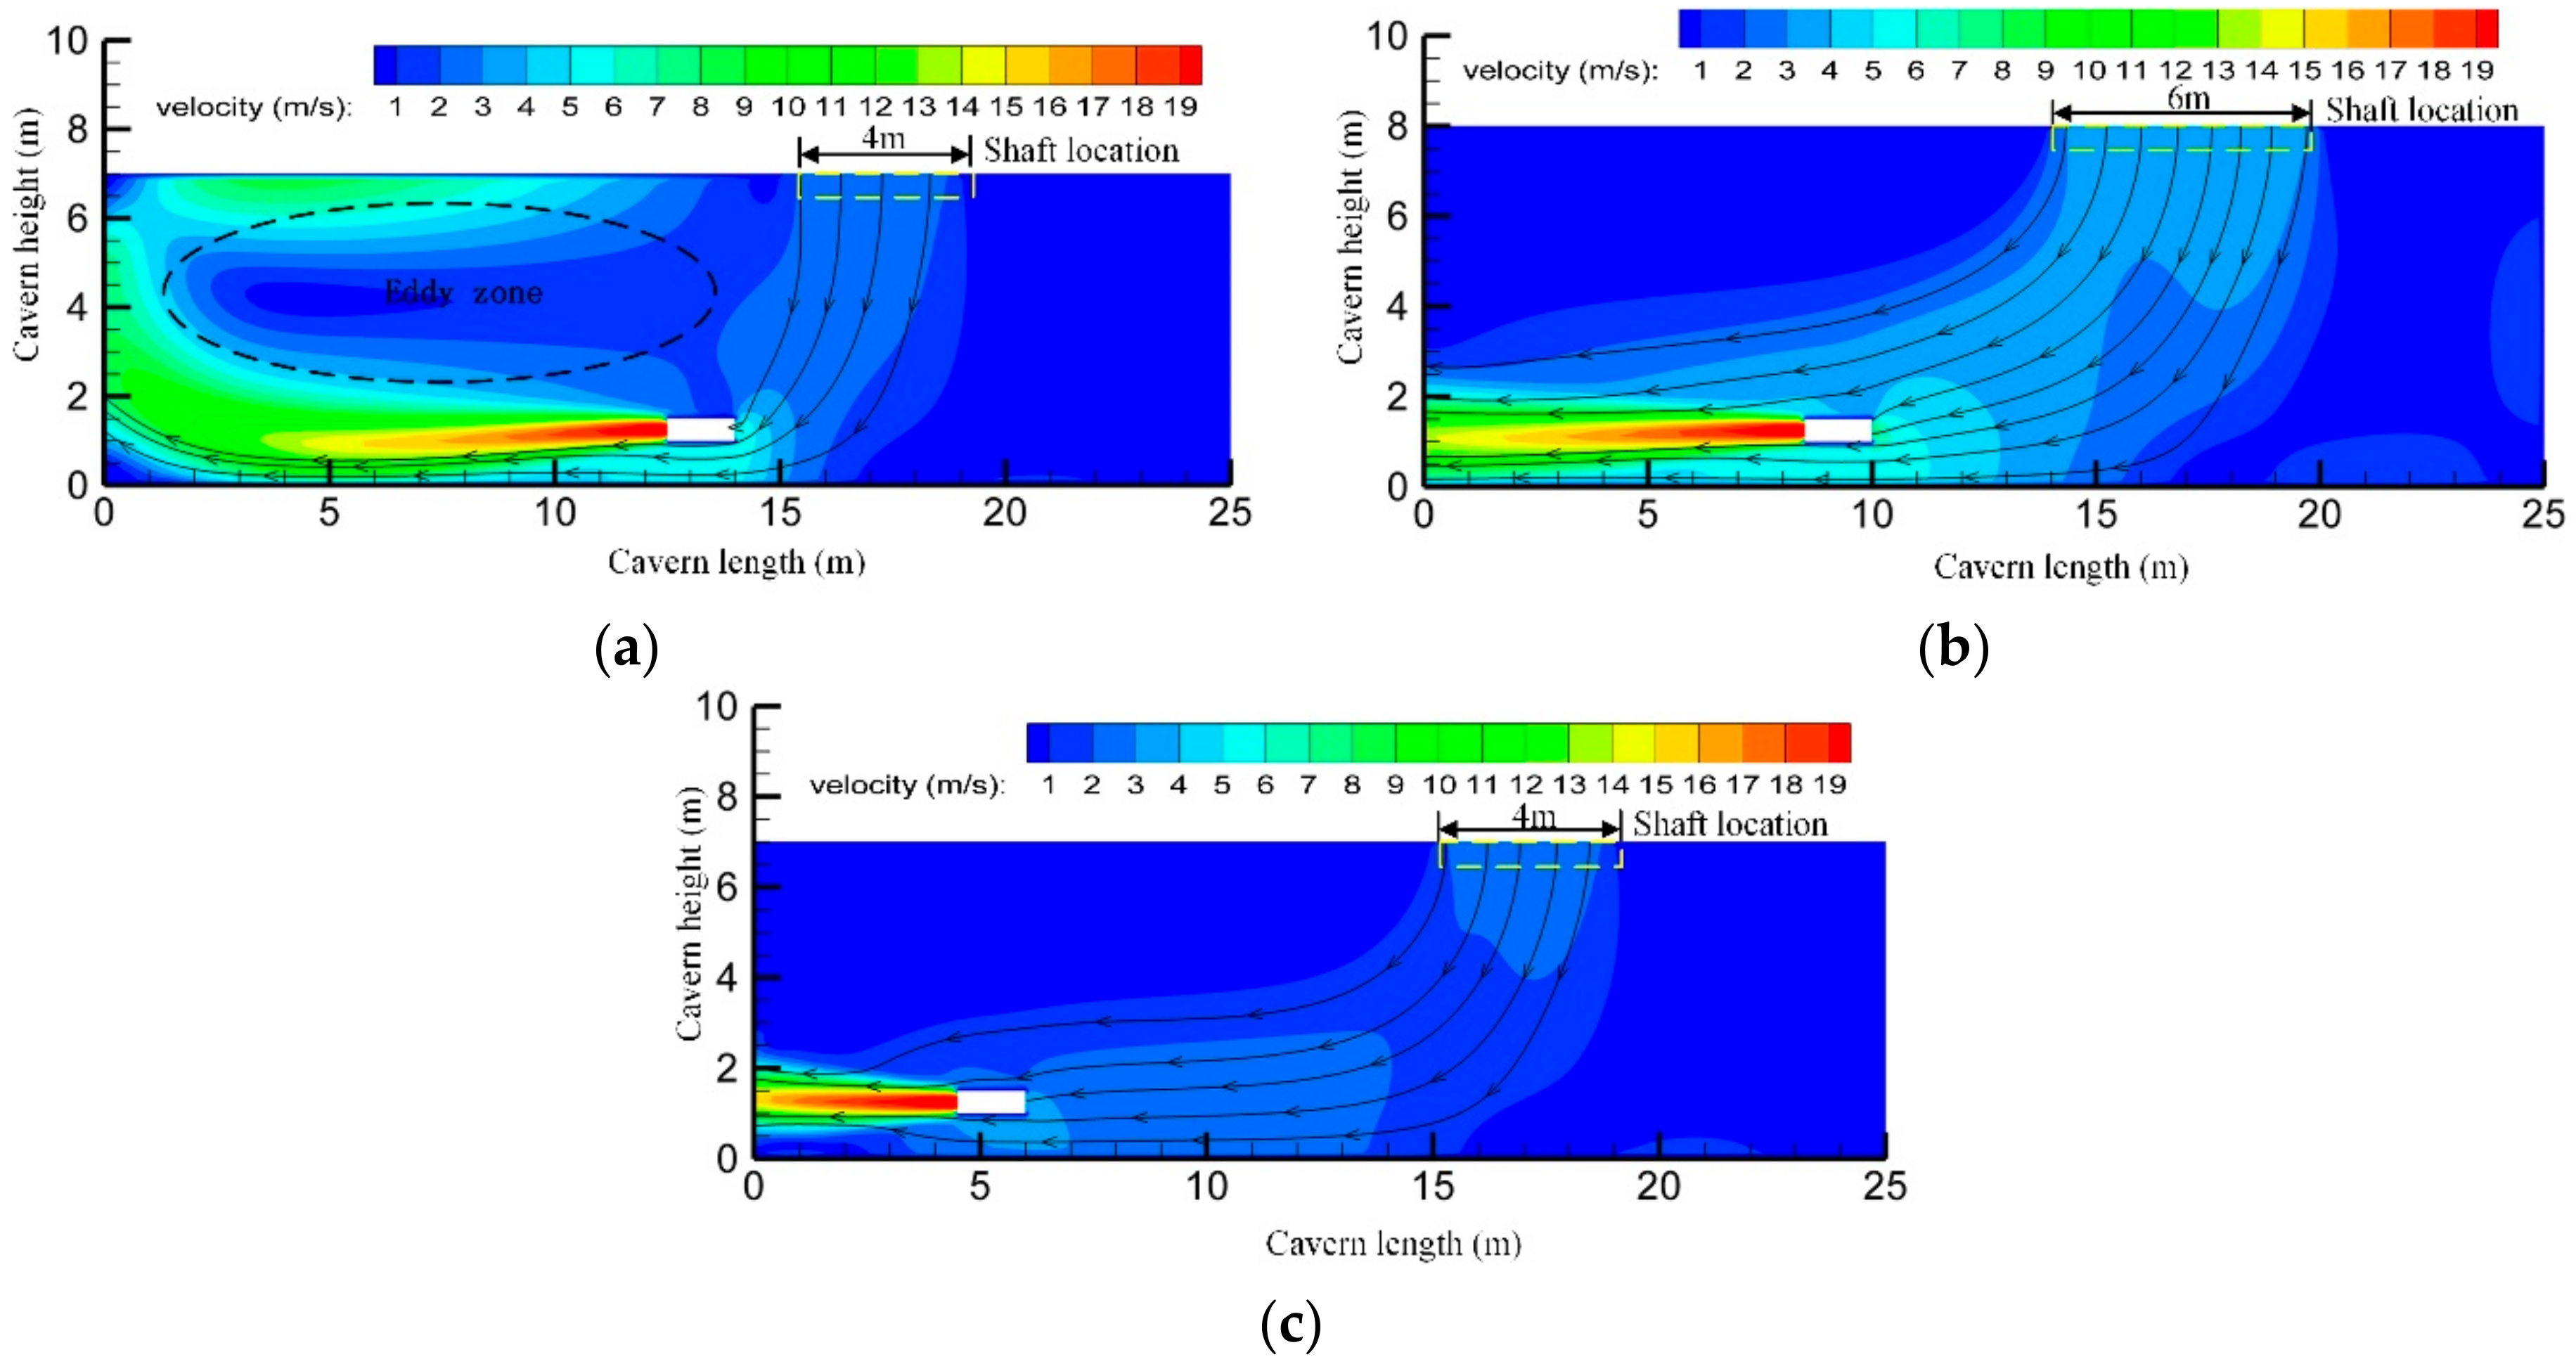
Under the action of temperature difference inside and outside the cavern, the direction of natural wind in the shaft can be changed. Therefore, under the condition of air intake from the shaft in summer, the axial fan without an air duct, can be installed at the bottom of the shaft to bring fresh air into the main cavern. However, a reasonable and effective introduction of fresh air into the main cavern is key to implementation of the summer ventilation scheme. There are nine simulation cases of different axial fan position as shown in Figure 10. The introduction velocity of fresh air in each case is depicted in Figure 11. It can be found that the introduction effect of case five is best, where the introduction velocity at the inlet of the axial fan reached 8.65 m/s. In case seven, the introduction velocity at the inlet of the axial-fan was only 4.10 m/s, which is the worst of the nine cases.
Figure 12 displays the profile of the air velocity field near the axial-flow fan, when the fan arranged at position three is very close to the vertical shaft. Under the combined action of natural wind and fan jet, a large eddy region is formed in the upper left of the fan, which is not conducive to advancing fresh air flow. Where the fan is located at position five, just on the middle line of the shaft section, natural wind velocity of the shaft can reach the maximum value. The proper distance between the fan and the shaft provides more entrainment space of natural air flow and forms an orderly air flow path. Since the fan arranged at position seven is far away from the shaft and not on the middle line of the shaft section, the entrainment effect of the surrounding air is not obvious.
5.3. Ventilation Effect of the Winter Ventilation Scheme
Air velocity distribution in the cavern is shown in Figure 13. Since the entrance of the construction roadway is in a state of natural air intake most of the time, especially in the winter with low temperatures, air velocity in the main cavern can be increased to a certain extent. Natural wind at the entrance of the construction roadway is sent to cavern four through the connecting roadway, at the value of 1.2 m/s. However, the natural air velocity of cavern one to cavern three is slightly lower with the value of 0.8 m/s because there are three caverns on the left side of the construction roadway. The fresh air supplied by the duct near the excavation face belongs to the semi-confined jet. Due to the restriction space of the middle bench and the continuity of airflow, there is a flow contrary to the jet direction. Nevertheless, since natural wind entering the cavern is greater than the wind velocity returning from the excavation face, the airflow in the whole cavern always moves toward the shaft.
Figure 14 and Figure 15 show CO mass concentration migration and distribution laws in different ventilation time periods, under the winter ventilation scheme. This ventilation scheme has the advantages of a short moving path of polluted air, fresh air conveyed by the axial flow duct that is all the time near the excavation face, and greatly reduced interference of the working procedure. After 10 min of ventilation, CO concentration in the construction area of the cavern can be reduced to below 30 mg/m3. The high concentration of CO moves position in the shaft and gradually discharges after 15 min of ventilation. At this time, CO concentration in the cavern decreases greatly. CO concentration of the whole cavern basically decreased to a safe value after ventilation for 20 min, under the combined action of natural ventilation and mechanical ventilation.
5.4. Influence of Temperature Difference on Natural Ventilation
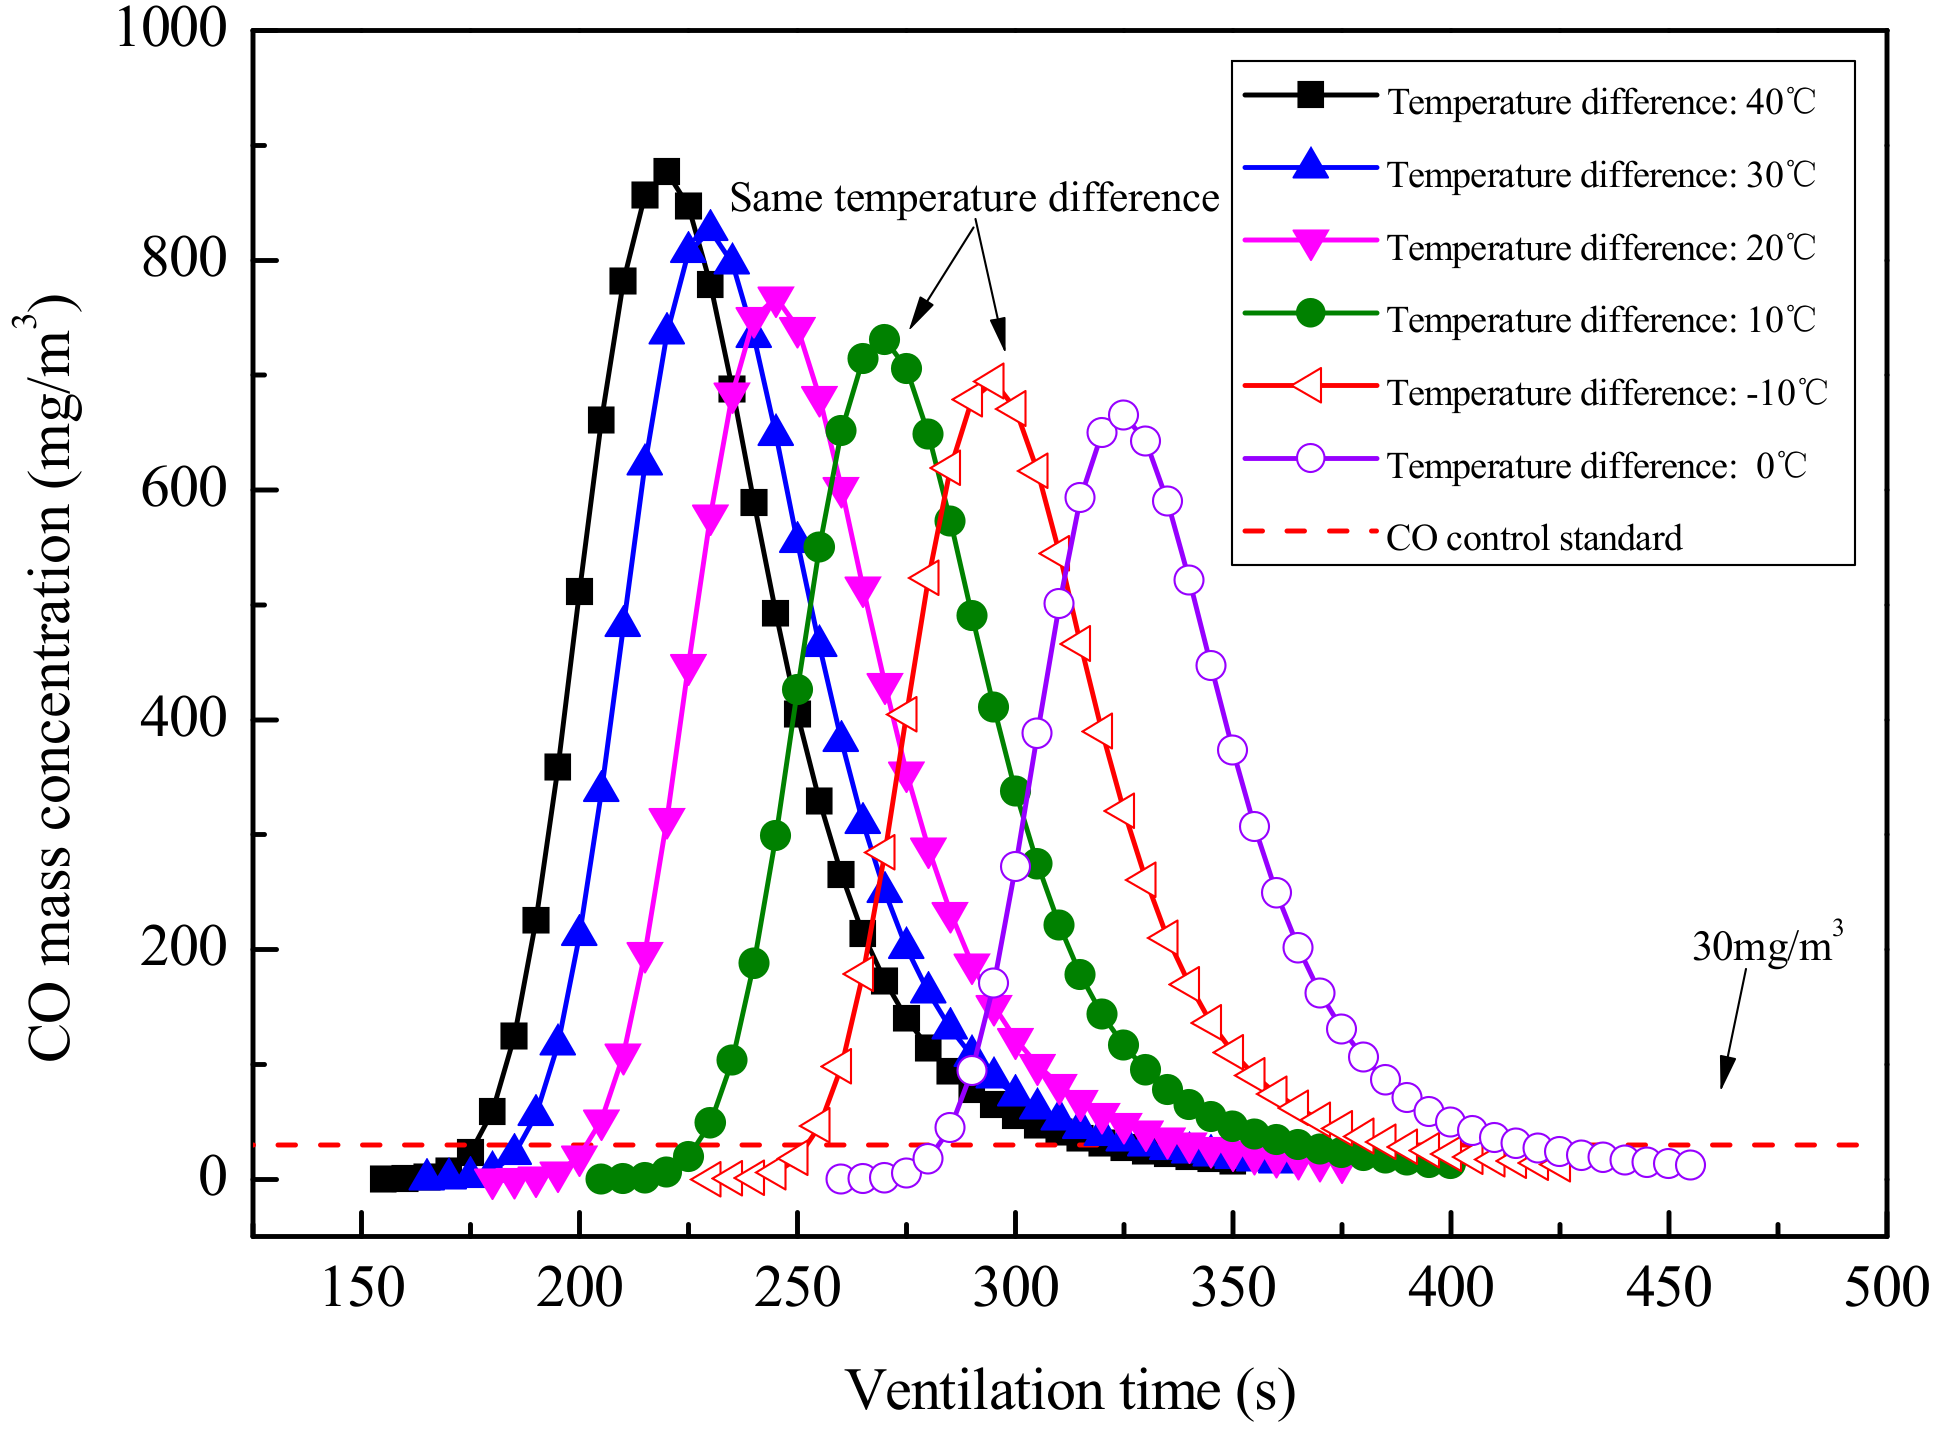
In this numerical simulation, the temperature inside the cavern is set to 20 °C and the temperature inside the cavern is considered as 30 °C, 20 °C, 10 °C, 0 °C, −10 °C, and −20 °C. Therefore, the temperature difference inside and outside the cavern is −10 °C, 0 °C, 10 °C, 20 °C, 30 °C, and 40 °C respectively. The influence of temperature difference on ventilation effects in the above six situations are analyzed respectively and the results shown in Figure 16. CO concentration of the cross-section 300 m from the excavation face is taken as the study object. As the temperature difference increases, the peak value of CO concentration increases slightly, but ventilation time to reach the control standard decreases greatly. Under the same temperature difference, the ventilation effect in winter is better than that in summer.
6. Conclusions
This paper presents a new option for the construction ventilation scheme of large-scale cavern groups. A three-dimensional numerical model validated with field test data is firstly performed to investigate air velocity and CO concentration of different ventilation schemes. Then, the ventilation performance according to the axial fan arrangement at the shaft bottom in the model cavern is evaluated. Finally, the influence of temperature difference between the inside and outside on natural ventilation is discussed. The following conclusions are drawn:
(1) After upper layer excavation of the cavern is completed and connected with the shaft, the network gallery ventilation mode can be formed by making full use of the shafts to introduce fresh air or remove polluted air. The ventilation path is scientific and reasonable, which solves many problems such as a large air volume, multiple working faces, and a large amount of pollution in construction.
(2) The fresh air supplied by the duct near the excavation face belongs to the semi-confined jet. Due to the restriction space of the middle bench and the continuity of airflow, there is inevitably a flow contrary to the jet direction. Hence, use of the winter ventilation scheme must ensure that airflow is always moving towards the shaft.
(3) The CO concentration in the working area of the cavern has basically dropped to a safe concentration of 30 mg/m3 in the air inlet and exhaust schemes after 10 min of ventilation, which can meet the requirements of safe and rapid construction. Because of the short moving path of polluted air in the air exhaust scheme, CO concentration of the whole cavern basically decreases to a safe value after ventilation for 20 min, under the combined action of natural ventilation and mechanical ventilation. Therefore, the construction ventilation scheme can be chosen flexibly according to the distance between the excavation face and shaft location.
(4) A reasonable and effective introduction of fresh air to the main cavern is key to the implementation of the air inlet scheme for the shaft. The optimal placement of the axial flow fan at the bottom of the shaft is on the central axis of the cavern, 5 m away from the shaft, where its air introduction efficiency is the highest. Effective use of natural wind can improve ventilation performance to a certain extent. The greater the temperature difference, the better the natural ventilation effect of the shaft is. The natural ventilation effect of the shaft as an outlet in winter is better than that of the shaft as an inlet in summer.
Author Contributions
J.S. carried out the numerical simulation; H.Z. analyzed of calculation results and wrote the article; M.H. proofread the English expressions in the paper; Q.C. processed the data; and S.C. offered useful suggestions for the preparation and writing of the paper.
Funding
This research received no external funding.
Acknowledgments
The study is supported by National Natural Science Foundation of China (NSFC) under Grant No. 51508477 and the Fundamental Research Funds for the Central Universities (Grant No. 2682016 CX012). The authors also would like to thank the anonymous reviewers and handling editors for their constructive comments.
Conflicts of Interest
The authors declare no conflicts of interest.
References
- Lin, F.; Ren, F.; Luan, H.B.; Ma, G.W.; Chen, S.G. Effectiveness Analysis of Water-sealing for Underground LPG Storage. Tunn. Undergr. Space Technol. 2016, 51, 270–290. [Google Scholar] [CrossRef]
- Gao, X.; Yan, E.C.; Yeh, T.C.J.; Wang, Y.L.; Liang, Y.; Hao, Y.H. Reliability analysis of hydrologic containment of underground storage of liquefied petroleum gas. Tunn. Undergr. Space Technol. 2018, 79, 12–26. [Google Scholar] [CrossRef]
- Liu, J.; Zhao, X.D.; Zhang, S.J.; Xie, L.K. Analysis of support requirements for underground water-sealed oil storage cavern in China. Tunn. Undergr. Space Technol. 2018, 71, 36–46. [Google Scholar] [CrossRef]
- Hong, K.R. Development and Application of Construction Technologies for Underground Water-sealed Energy Storage Caverns. Tunnel Constr. 2014, 34, 189–197. [Google Scholar] [CrossRef]
- Zhang, H.; Chen, S.G.; Yang, J.S. Ventilation Technology in Super Long Group Tunnelling with Trackless Transportation and No Outcrop. J. Saf. Environ. 2013, 13, 229–231. [Google Scholar] [CrossRef]
- Zhao, X.; Wang, R.K.; Zhang, W.H. Measures of Improving Ventilation Efficiency during Construction in Complex Caverns. J. Yangtze River Sci. Res. Inst. 2014, 8, 117–121. [Google Scholar] [CrossRef]
- Safety Operation Regulations for Tunnel Drilling and Blasting. Available online: http://www.safehoo.com/Rules/Traffic/201011/155705.shtml (accessed on 1 November 2010).
- Ministry of Communications of PRC. Technical Specifications for Construction of Highway Tunnel (JTG F60-2009); China Communications Press: Beijing, China, 2009.
- Ministry of Railways of PRC. Code for Construction on Tunnel of Railway (TB10204-2002); China Railway Publishing House: Beijing, China, 2002.
- Zhang, H.; Lin, F.; Zhang, K.; Yang, J.S.; Chen, S.G. Establishment of a Ventilation Network and the Shaft Ventilation Effect in a Large Underground Cavern Group. Mod. Tunn. Technol. 2018, 55, 203–209. [Google Scholar] [CrossRef]
- Kurnia, J.C.; Sasmito, A.P.; Mujumdar, A.S. Simulation of a Novel Intermittent Ventilation System for Underground Mines. Tunn. Undergr. Space Technol. 2014, 42, 206–215. [Google Scholar] [CrossRef]
- Parra, M.T.; Villafruela, J.M.; Castro, F.; Méndez, C. Numerical and Experimental Analysis of Different Ventilation Systems in Deep Mines. Build. Environ. 2006, 41, 87–93. [Google Scholar] [CrossRef]
- Toraño, J.; Torno, S.; Menéndez, M.; Gent, M. Auxiliary Ventilation in Mining Roadways Driven with Road Headers: Validated CFD modelling of dust behavior. Tunn. Undergr. Space Technol. 2011, 26, 201–210. [Google Scholar] [CrossRef]
- Diego, I.; Torno, S.; Toraño, J.; Menéndez, M.; Gent, M. A Practical Use of CFD for Ventilation of Underground Works. Tunn. Undergr. Space Technol. 2011, 26, 189–200. [Google Scholar] [CrossRef]
- Xia, Y.M.; Yang, D.; Hu, C.H.; Wu, C.Z.; Han, J.L. Numerical Simulation of Ventilation and Dust Suppression System for Open-type TBM Tunneling Work Area. Tunn. Undergr. Space Technol. 2016, 56, 70–78. [Google Scholar] [CrossRef]
- Torno, S.; Toraño, J.; Ulecia, M.; Allende, C. Conventional and Numerical Models of Blasting Gas Behaviour in Auxiliary Ventilation of Mining Headings. Tunn. Undergr. Space Technol. 2013, 34, 73–81. [Google Scholar] [CrossRef]
- Sasmito, A.P.; Birgersson, E.; Ly, H.C.; Mujumdar, A.S. Some approaches to improve ventilation system in underground coal mines environment—A computational fluid dynamic study. Tunn. Undergr. Space Technol. 2013, 34, 82–95. [Google Scholar] [CrossRef]
- Zhang, H.R.; Pera, L.S.; Zhao, Y.J. Researches and applications on geostatistical simulation and laboratory modeling of mine ventilation network and gas drainage zone. Process Saf. Environ. Prot. 2015, 94, 55–64. [Google Scholar] [CrossRef]
- Nakayama. In-situ measurement and simulation by CFD of methane gas distribution at a heading faces. Shigen-to-Sozai 1998, 114, 769–775. [Google Scholar] [CrossRef]
- Laslandes, S.; Sacé, C. Transport of particles by a turbulent flow around an obstacle—A numerical and a wind tunnel approach. J. Wind Eng. Ind. Aerodyn. 1998, 74–76, 577–587. [Google Scholar] [CrossRef]
- Klemens, R.; Kosinski, P.; Wolanski, P.; Korobeinikov, V.P.; Markov, V.V.; Menshov, I.S.; Semenov, I.V. Numerical Study of Dust Lifting in a Channel with Vertical Obstacles. J. Loss Prev. Process Ind. 2001, 14, 469–473. [Google Scholar] [CrossRef]
- Toraño, J.; Torno, S.; Menendez, M.; Gent, M.; Velasco, J. Models of methane behaviour in auxiliary ventilation of underground coal mining. Int. J. Coal Geol. 2009, 80, 35–43. [Google Scholar] [CrossRef]
- Fang, Y.; Fan, J.; Kenneally, B.; Mooney, M. Air Flow Behavior and Gas Dispersion in the Recirculation Ventilation System of a Twin-tunnel Construction. Tunn. Undergr. Space Technol. 2016, 58, 30–39. [Google Scholar] [CrossRef]
- Zhang, H.; Sun, J.C.; Lin, F.; Wang, L. Optimization on Energy Saving Ventilation of Gallery-type Combined Construction Shaft Exhaust in Extra Long Tunnel. Procedia Eng. 2017, 205, 1777–1784. [Google Scholar] [CrossRef]
- Liu, Z.; Wang, X.L.; Cheng, Z.F.; Sun, R.R.; Zhang, A.L. Simulation of Construction Ventilation in Deep Diversion Tunnels Using Euler–Lagrange Method. Comput. Fluids 2014, 105, 28–38. [Google Scholar] [CrossRef]
- Wang, X.; Liu, X.; Sun, Y.; An, J.; Zhang, J.; Chen, H.C. Construction Schedule Simulation of a Diversion Tunnel Based on the Optimized Ventilation Time. J. Hazard. Mater. 2009, 165, 933–943. [Google Scholar] [CrossRef] [PubMed]
- Liu, Y.C.; Wang, S.C.; Deng, Y.B.; Ma, W.W.; Ma, Y. Numerical simulation and experimental study on ventilation system for powerhouses of deep underground hydropower stations. Appl. Therm. Eng. 2016, 105, 151–158. [Google Scholar] [CrossRef]
- Lowndes, I.S.; Yang, Z.Y.; Jobling, S.; Yates, C. A parametric analysis of a tunnel climatic prediction and planning model. Tunn. Undergr. Space Technol. 2006, 21, 520–532. [Google Scholar] [CrossRef]
- Sa, Z.Y.; Li, F.; Qin, B.; Pan, X.H. Numerical simulation study of dust concentration distribution regularity in cavern stope. Saf. Sci. 2012, 50, 857–860. [Google Scholar] [CrossRef]
- Yoon, C.H.; Kim, M.S.; Jin, K. The evaluation of natural ventilation pressure in Korean long road tunnels with vertical shafts. Tunn. Undergr. Space Technol. 2006, 21, 472–477. [Google Scholar] [CrossRef]
- Guo, C.; Xu, J.; Yang, L.; Guo, X.; Zhang, Y.; Wang, M. Energy-saving network ventilation technology of extra-long tunnel in climate separation zone. Appl. Sci. 2017, 7, 454. [Google Scholar] [CrossRef]
- Li, A.G.; Gao, X.P.; Ren, T. Study on thermal pressure in a sloping underground tunnel under natural ventilation. Energy Build. 2017, 147, 200–209. [Google Scholar] [CrossRef]
- Mazarrón, F.R.; Amores, C.P.; Guerrero, I.C. Annual evolution of the natural ventilation in an underground construction: Influence of the access tunnel and the ventilation chimney. Tunn. Undergr. Space Technol. 2015, 49, 188–198. [Google Scholar] [CrossRef]
- Zhang, Z.Q.; Zhang, H.; Tan, Y.J.; Yang, H.Y. Natural wind utilization in the vertical shaft of a super-long highway tunnel and its energy saving effect. Build. Environ. 2018, 145, 140–152. [Google Scholar] [CrossRef]
- Wang, F.; Wang, M.N.; He, S.; Deng, Y.Y. Computational Study of Effects of Traffic Force on the Ventilation in Highway Curved Tunnels. Tunn. Undergr. Space Technol. 2011, 26, 481–489. [Google Scholar] [CrossRef]
- Wang, F.; Wang, M.N.; He, S.; Zhang, J.S.; Deng, Y.Y. Computational Study of Effects of Jet Fans on the Ventilation of a Highway Curved Tunnel. Tunn. Undergr. Space Technol. 2010, 25, 382–390. [Google Scholar] [CrossRef]
- Zhang, H.; Fang, L.; Sun, J.C.; Zhou, Z.L. CFD Analysis of Tunnel Construction Ventilation Effect Based on Typical Wall Roughness Model. China Railw. Sci. 2016, 37, 58–65. [Google Scholar] [CrossRef]
- Wu, Z.L. Ventilation in Heading Face after Blasting, 1st ed.; Metallurgical Industry Press: Beijing, China, 1959; pp. 1–3. [Google Scholar]
Figure 1.
Layout of underground structures in Jinzhou oil storage project.

Figure 2.
Schematic of shaft natural ventilation.

Figure 3.
Natural air volume at different temperatures.

Figure 4.
(a) Plan of the summer ventilation scheme, (b) profile of the summer ventilation scheme, (c) plan of the winter ventilation scheme, (d) profile of the winter ventilation scheme.
Figure 4.
(a) Plan of the summer ventilation scheme, (b) profile of the summer ventilation scheme, (c) plan of the winter ventilation scheme, (d) profile of the winter ventilation scheme.

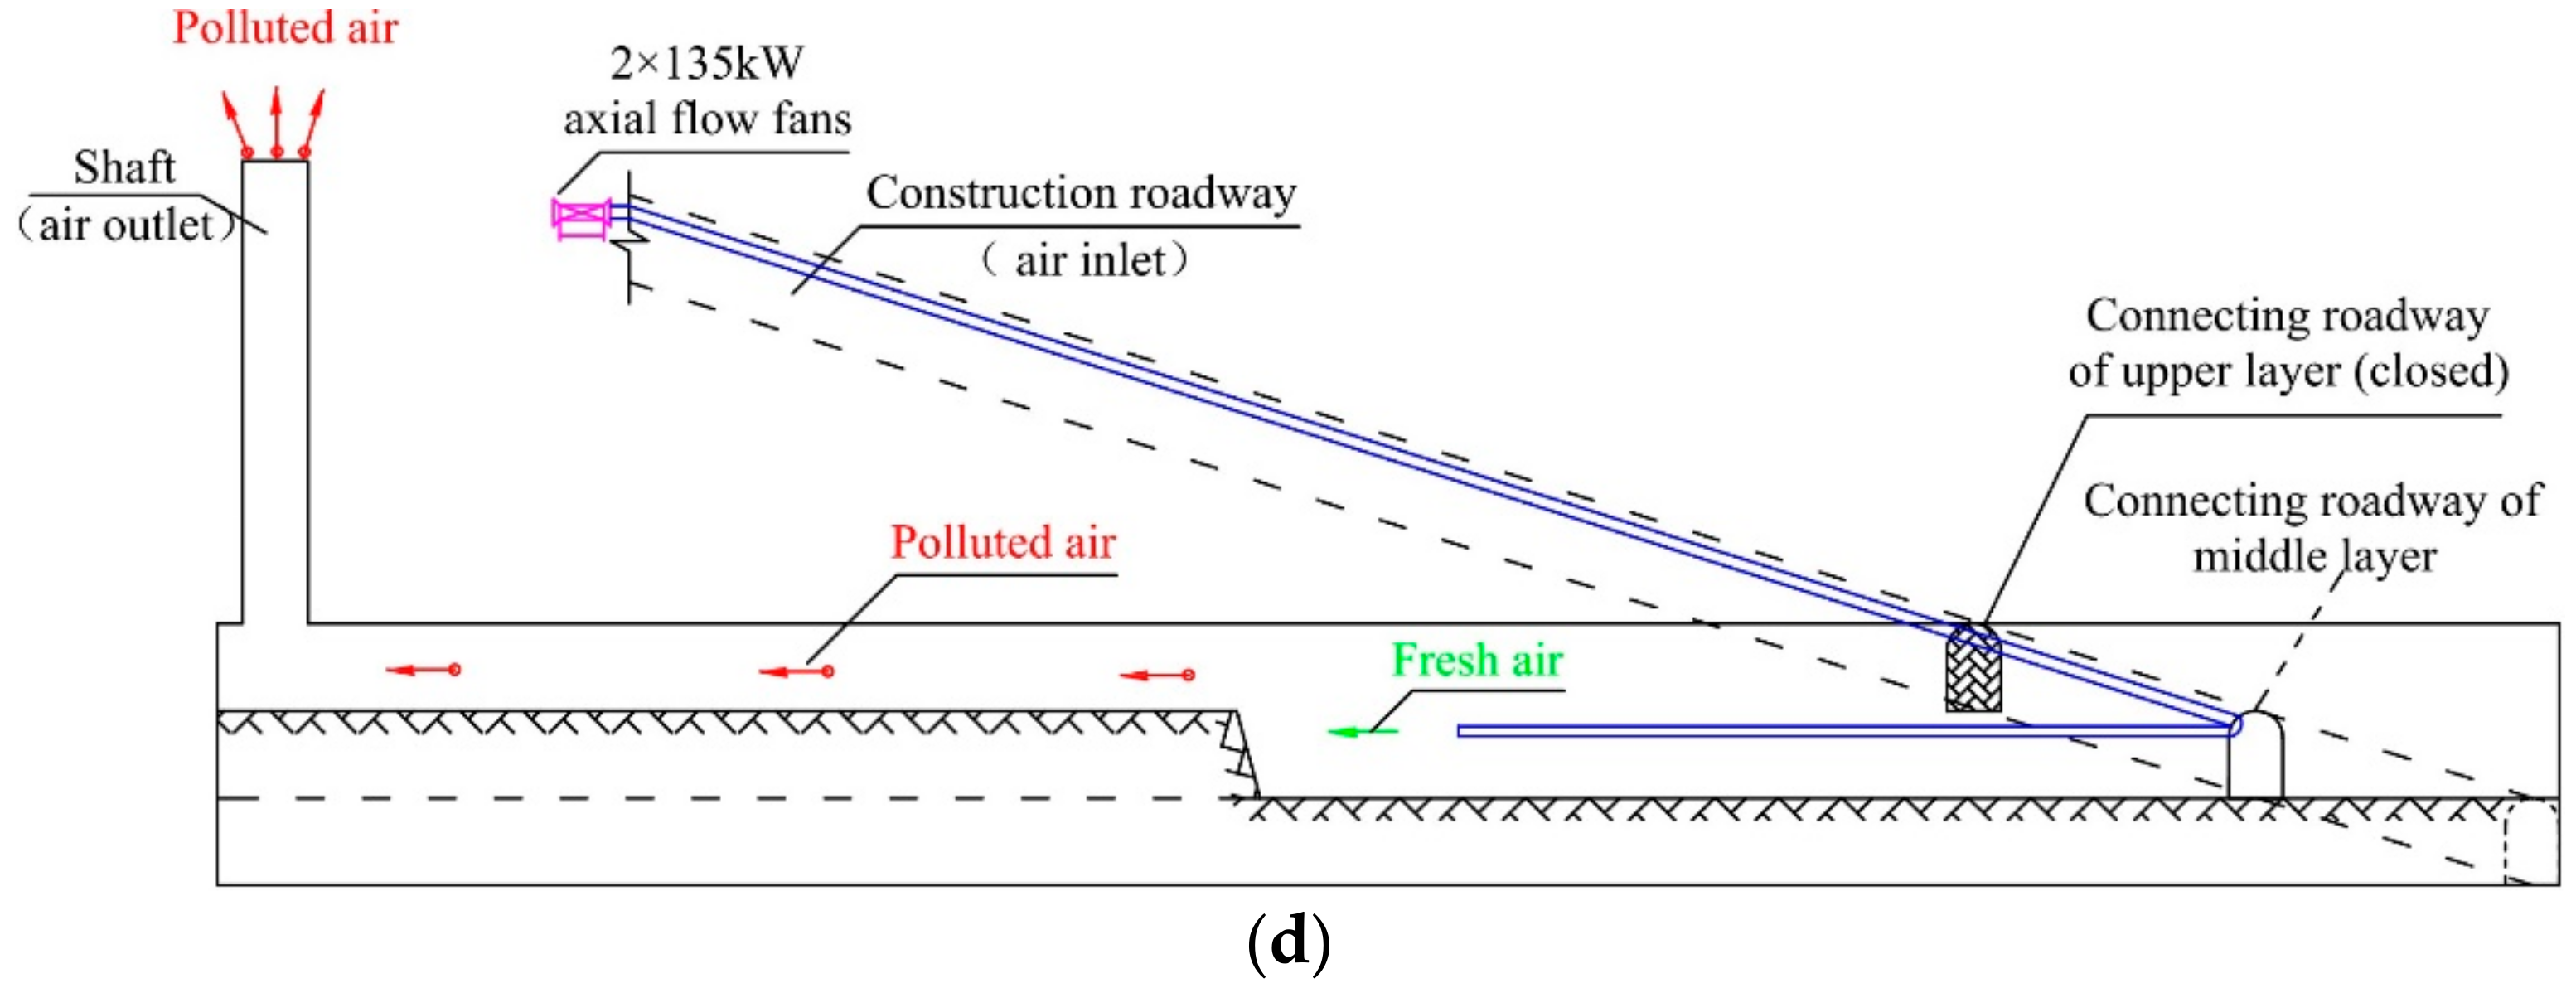
Figure 5.
Test sections and layout of test points in the forced ventilation scheme.

Figure 6.
Three-dimensional numerical model showing (a) air inlet scheme for the shaft and (b) air exhaust scheme for the shaft.
Figure 6.
Three-dimensional numerical model showing (a) air inlet scheme for the shaft and (b) air exhaust scheme for the shaft.

Figure 7.
Comparison between simulated result and field test. (a) Air velocity in main cavern and construction roadway and (b) change of CO concentration with time.
Figure 7.
Comparison between simulated result and field test. (a) Air velocity in main cavern and construction roadway and (b) change of CO concentration with time.
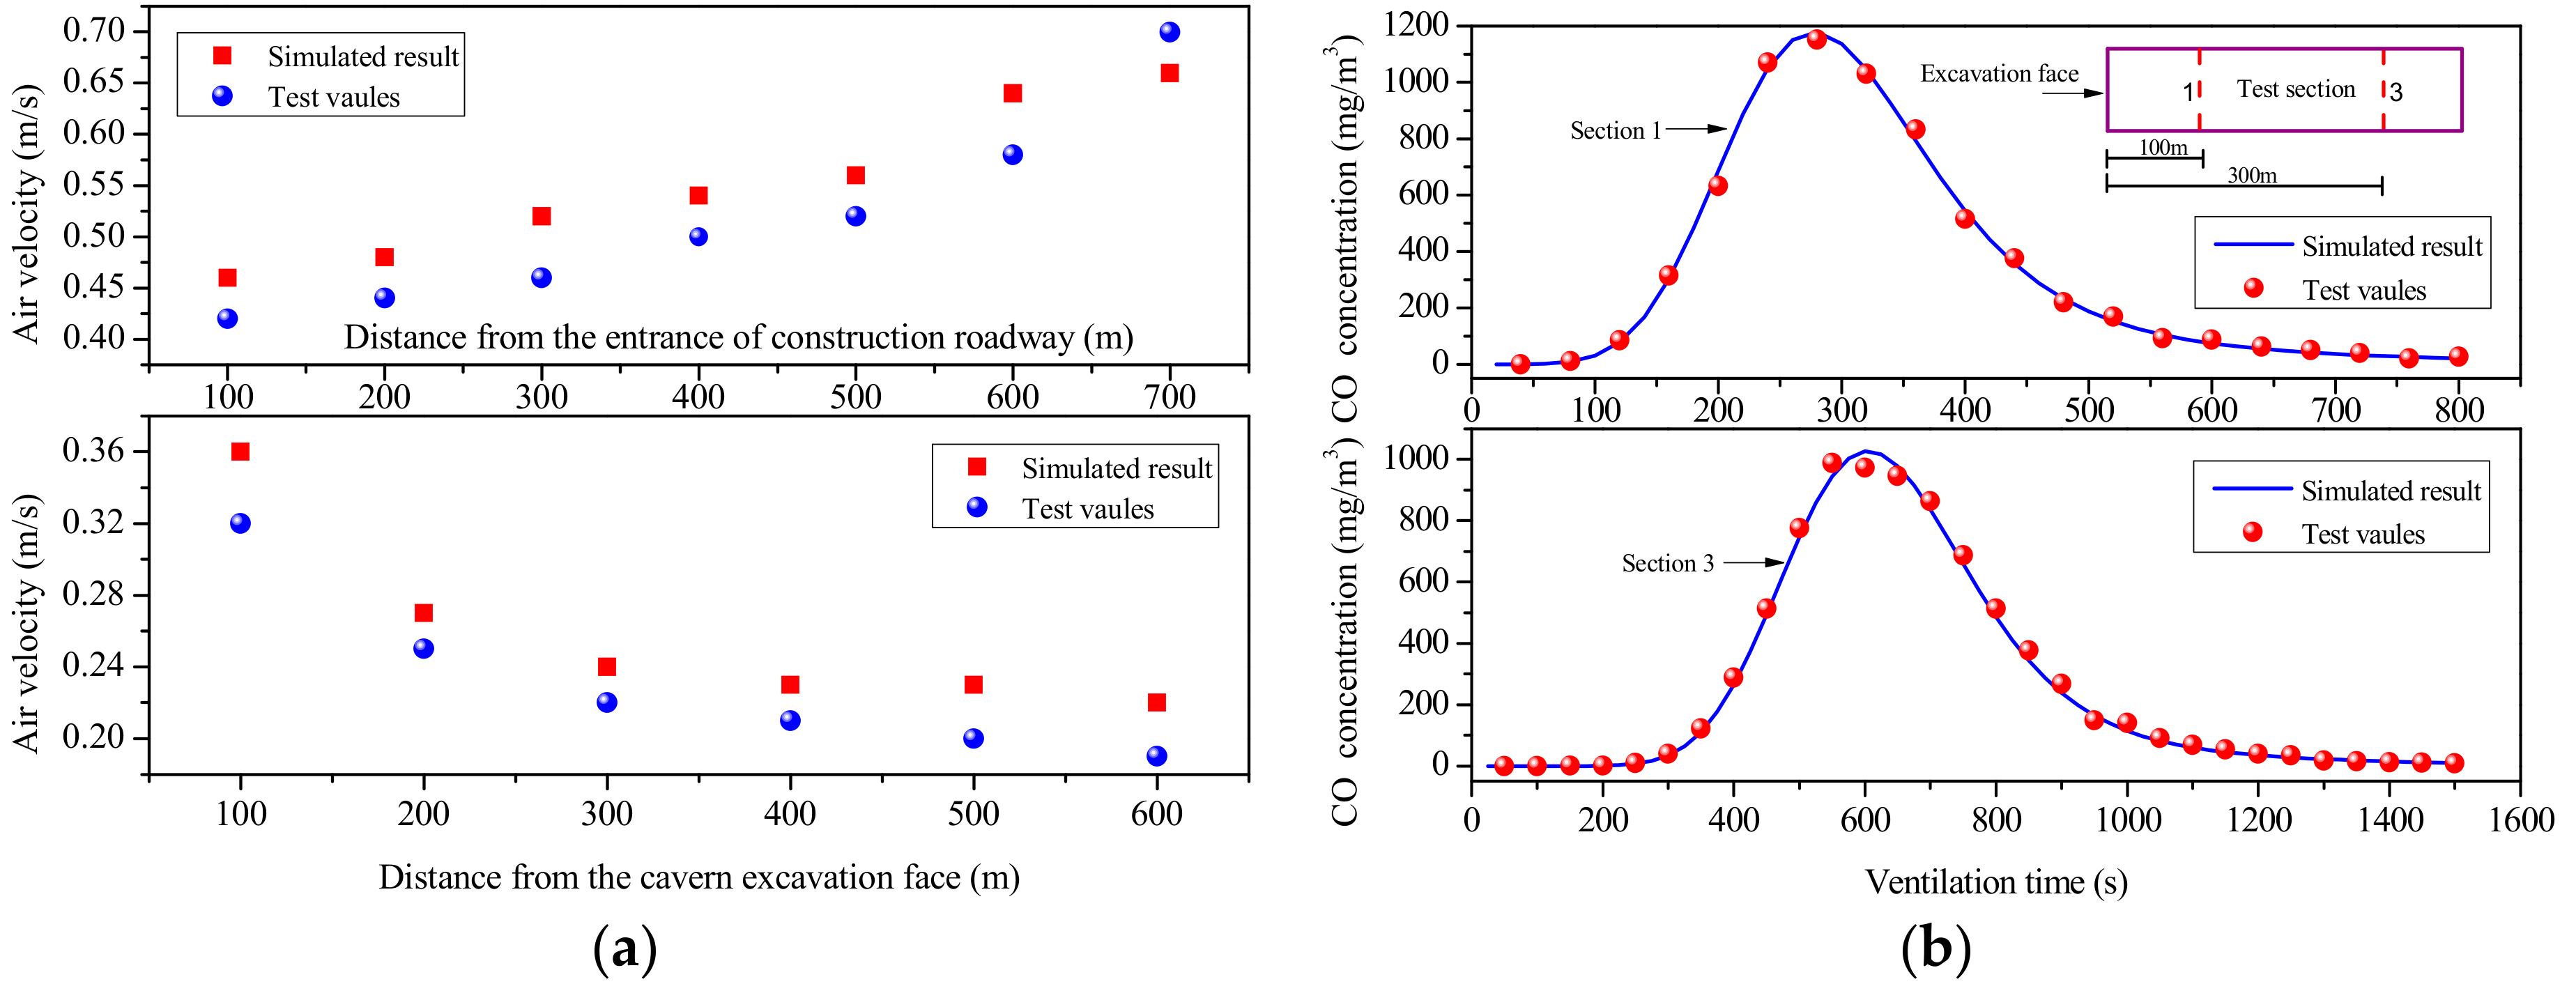
Figure 8.
CO mass concentration distribution of summer ventilation scheme. (a) Ventilation for 5 min, (b) ventilation for 10 min, (c) ventilation for 15 min, and (d) ventilation for 20 min.
Figure 8.
CO mass concentration distribution of summer ventilation scheme. (a) Ventilation for 5 min, (b) ventilation for 10 min, (c) ventilation for 15 min, and (d) ventilation for 20 min.
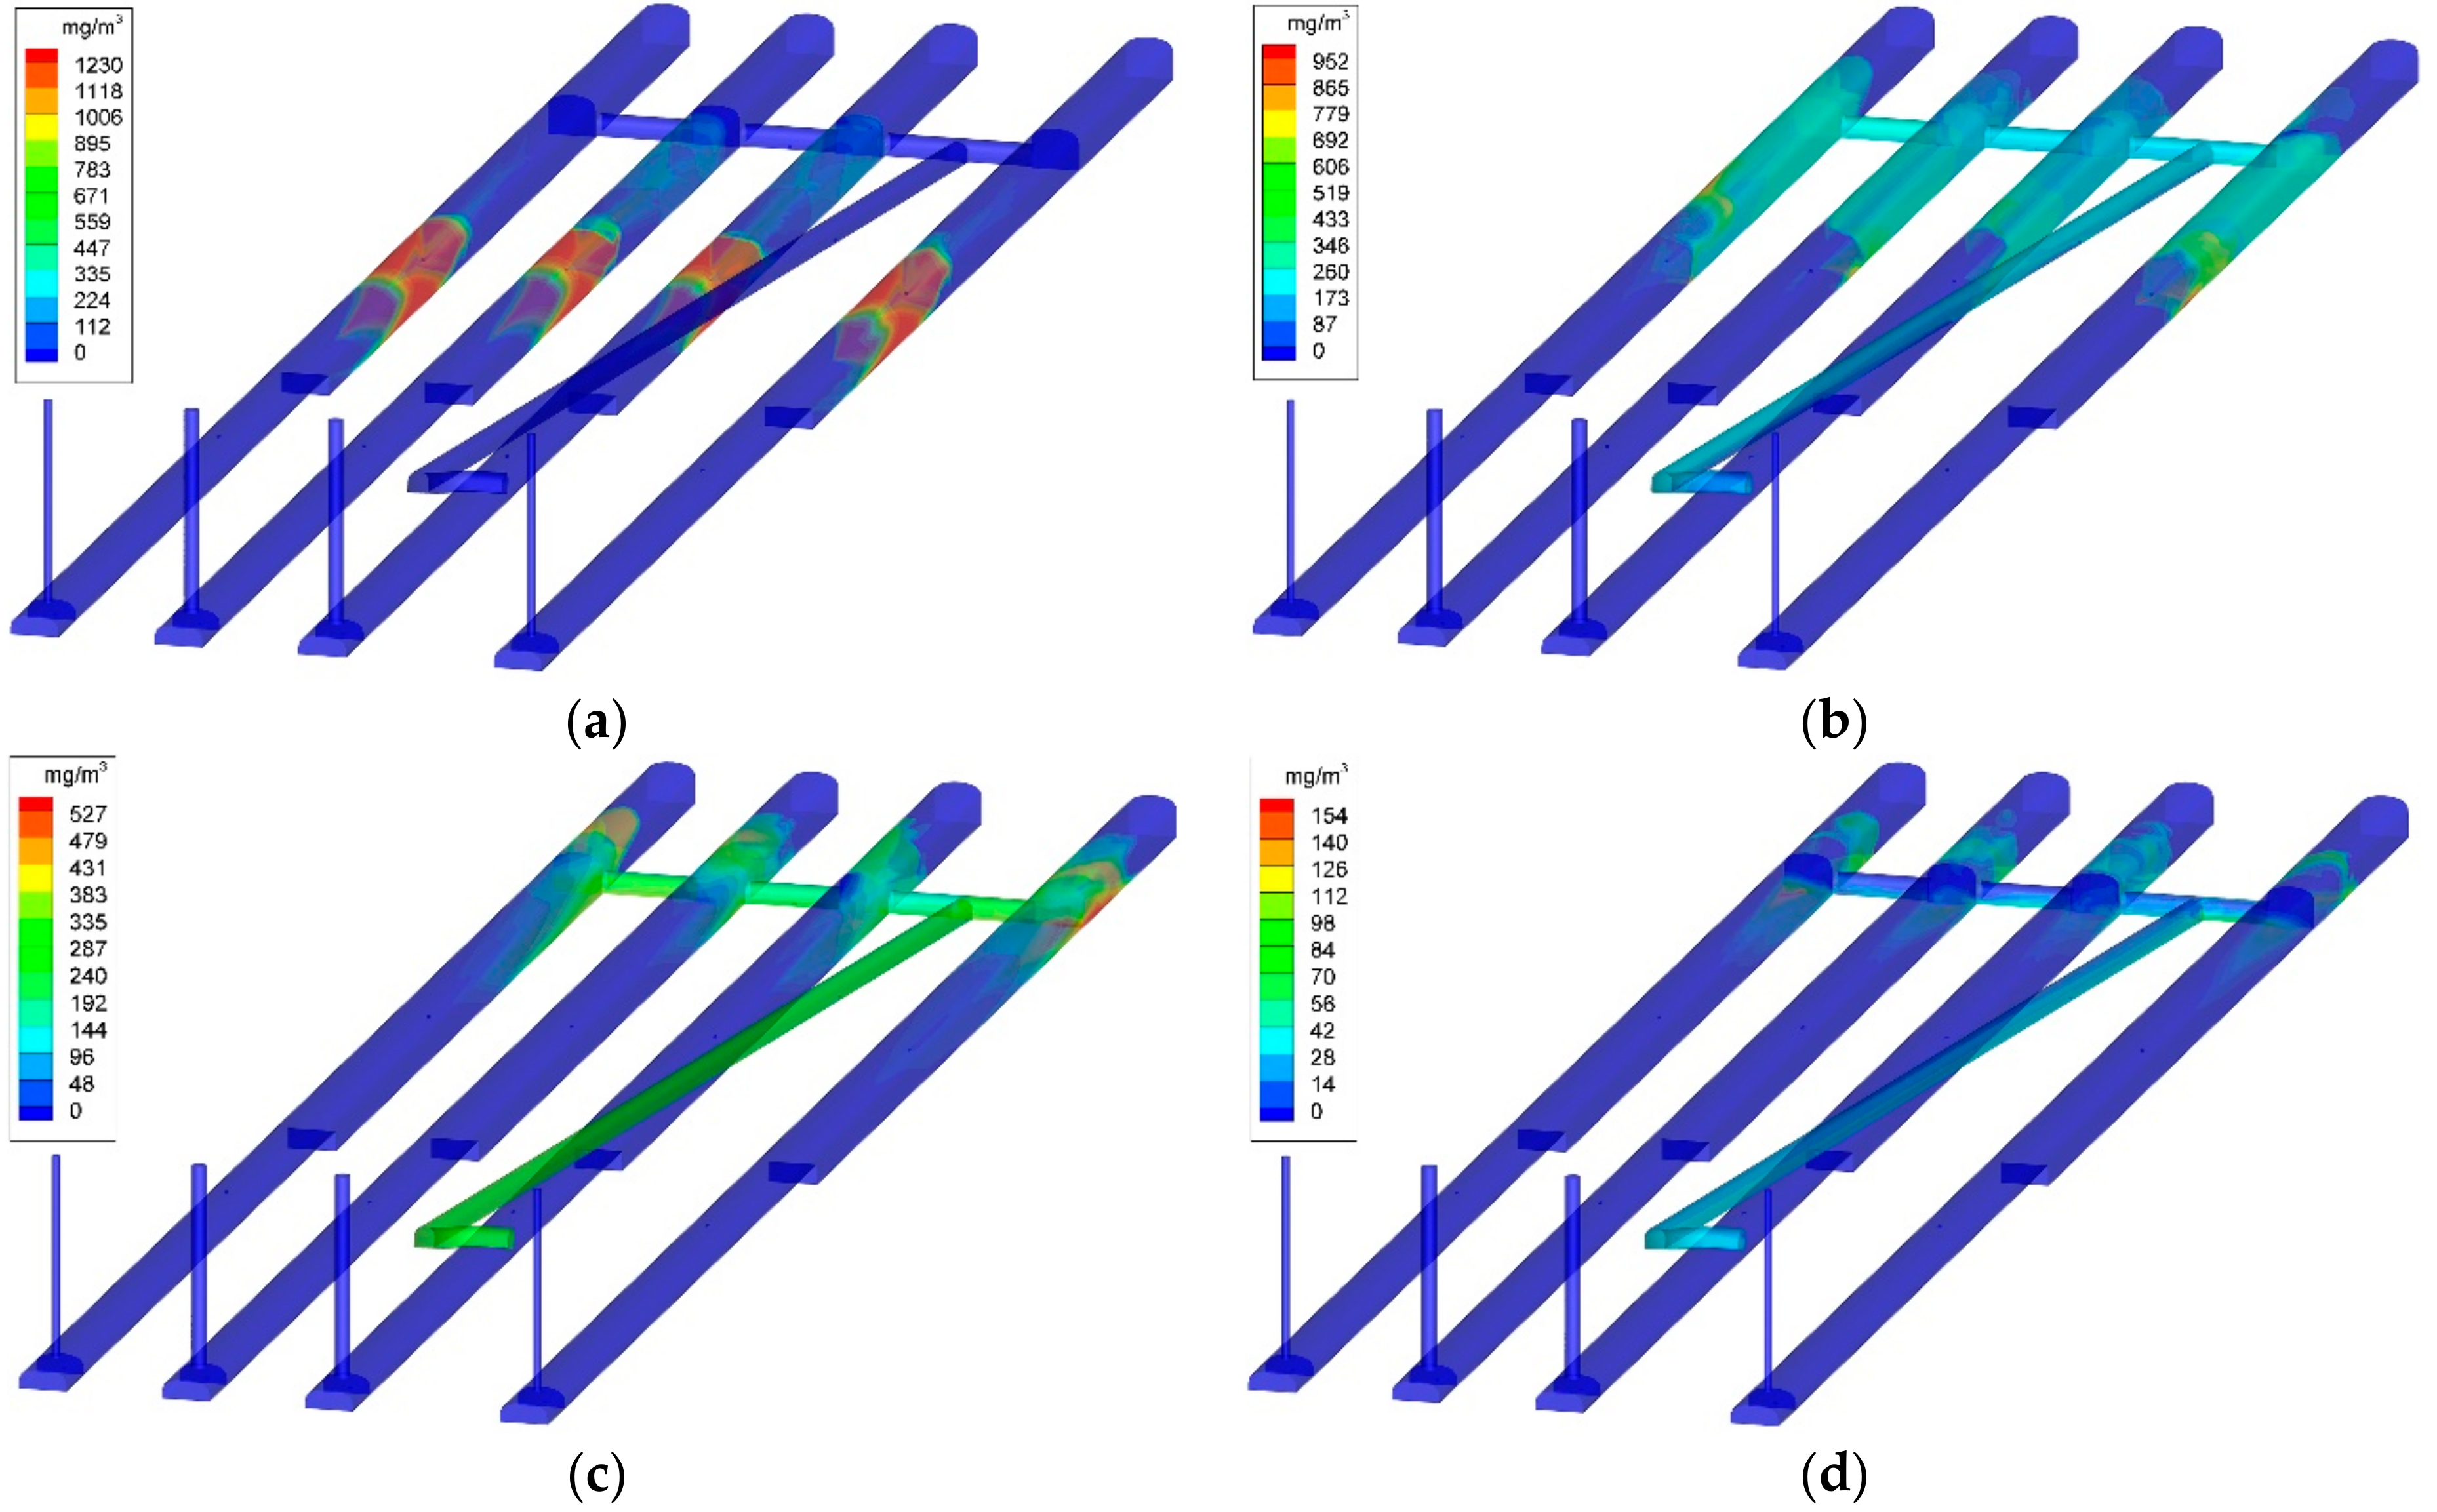
Figure 9.
(a) CO concentration in monitoring section with ventilation time and (b) CO concentration distribution at breathing height.
Figure 9.
(a) CO concentration in monitoring section with ventilation time and (b) CO concentration distribution at breathing height.

Figure 10.
Simulation cases of axial fan arrangement.
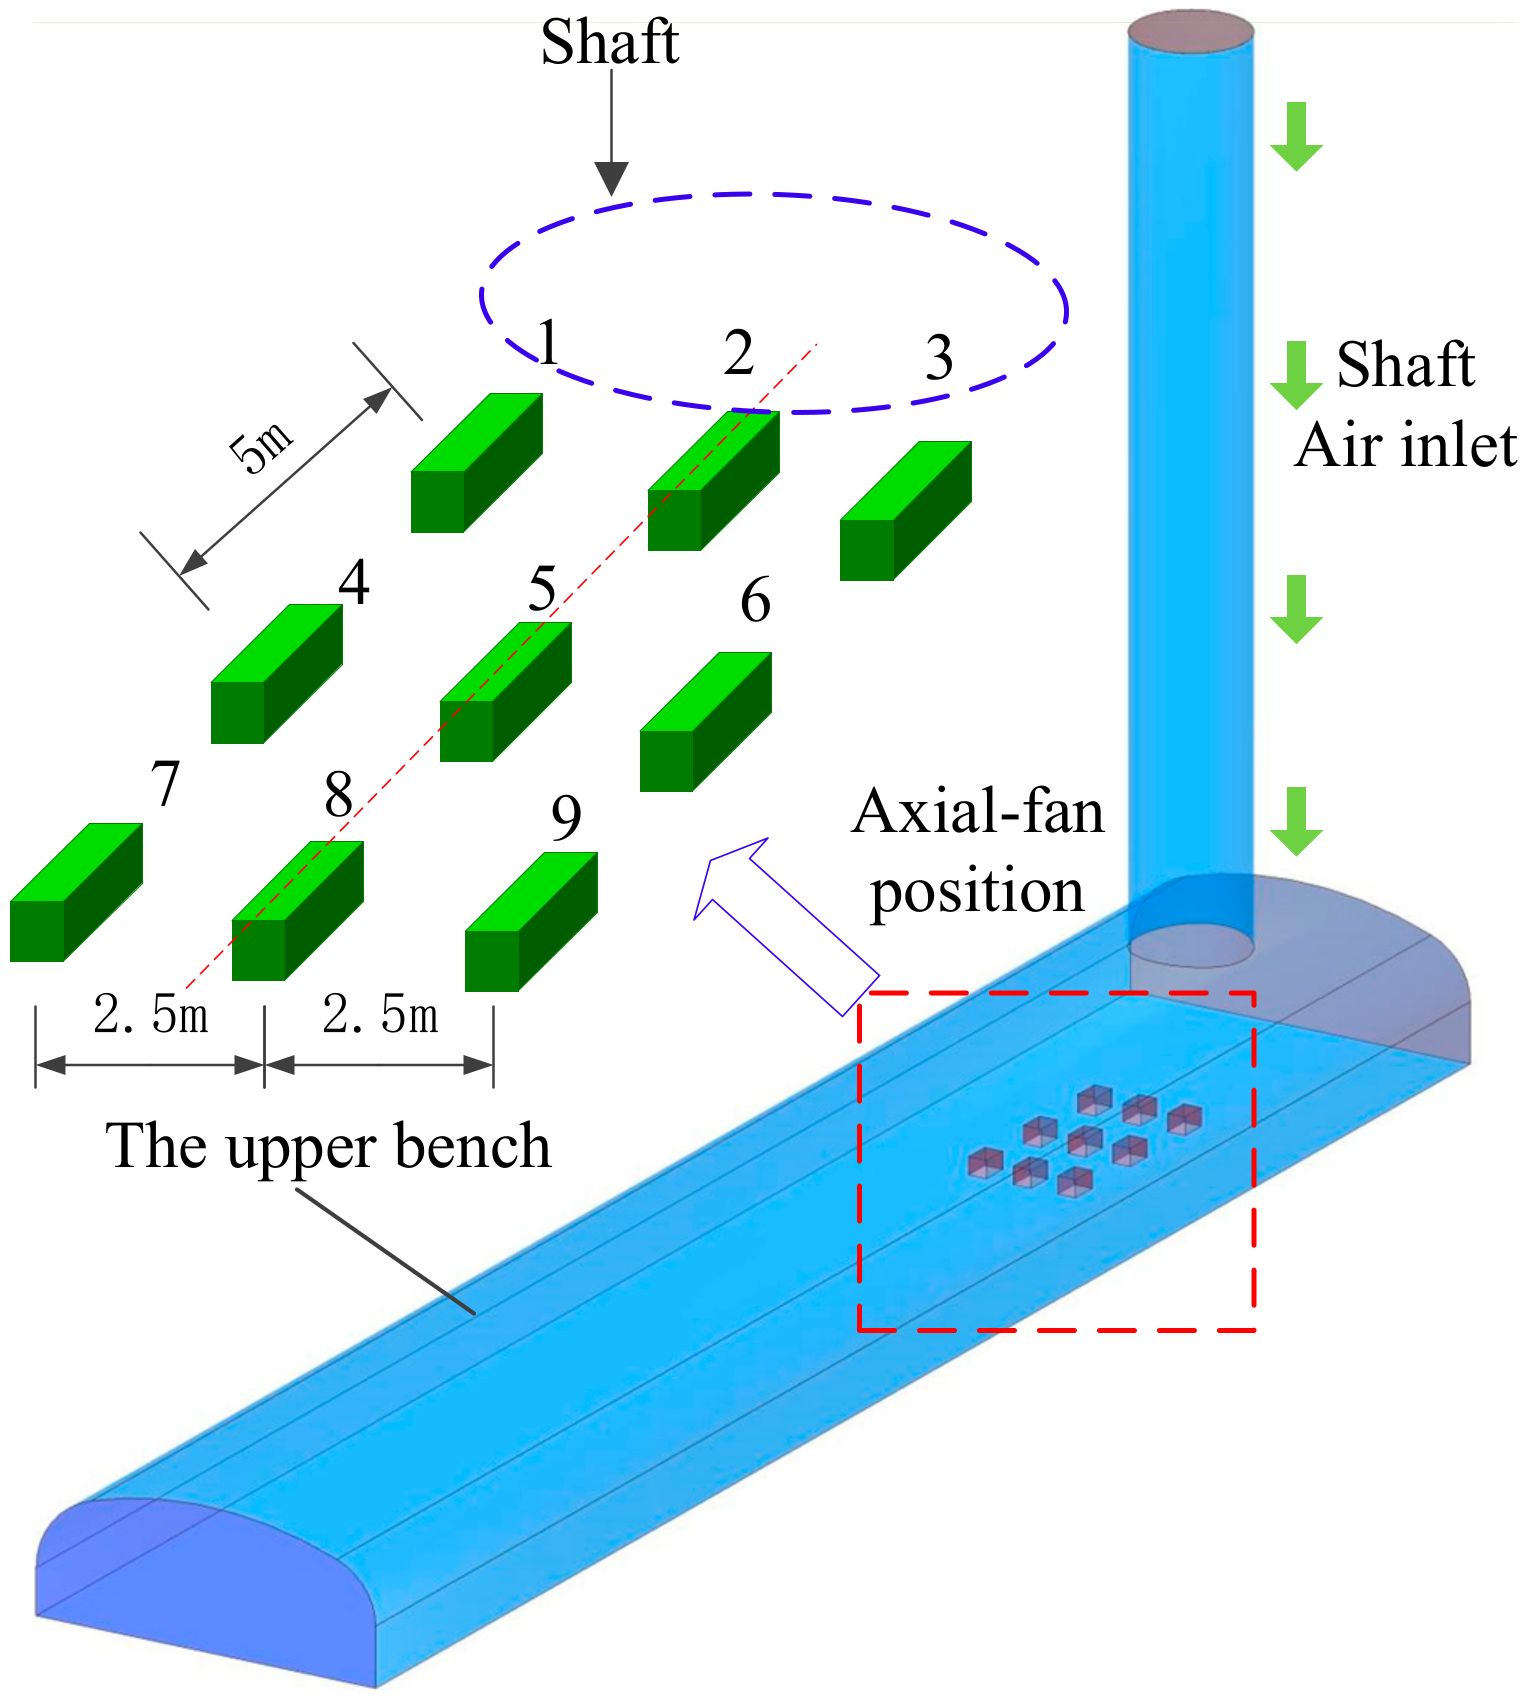
Figure 11.
Air velocity of different cases.
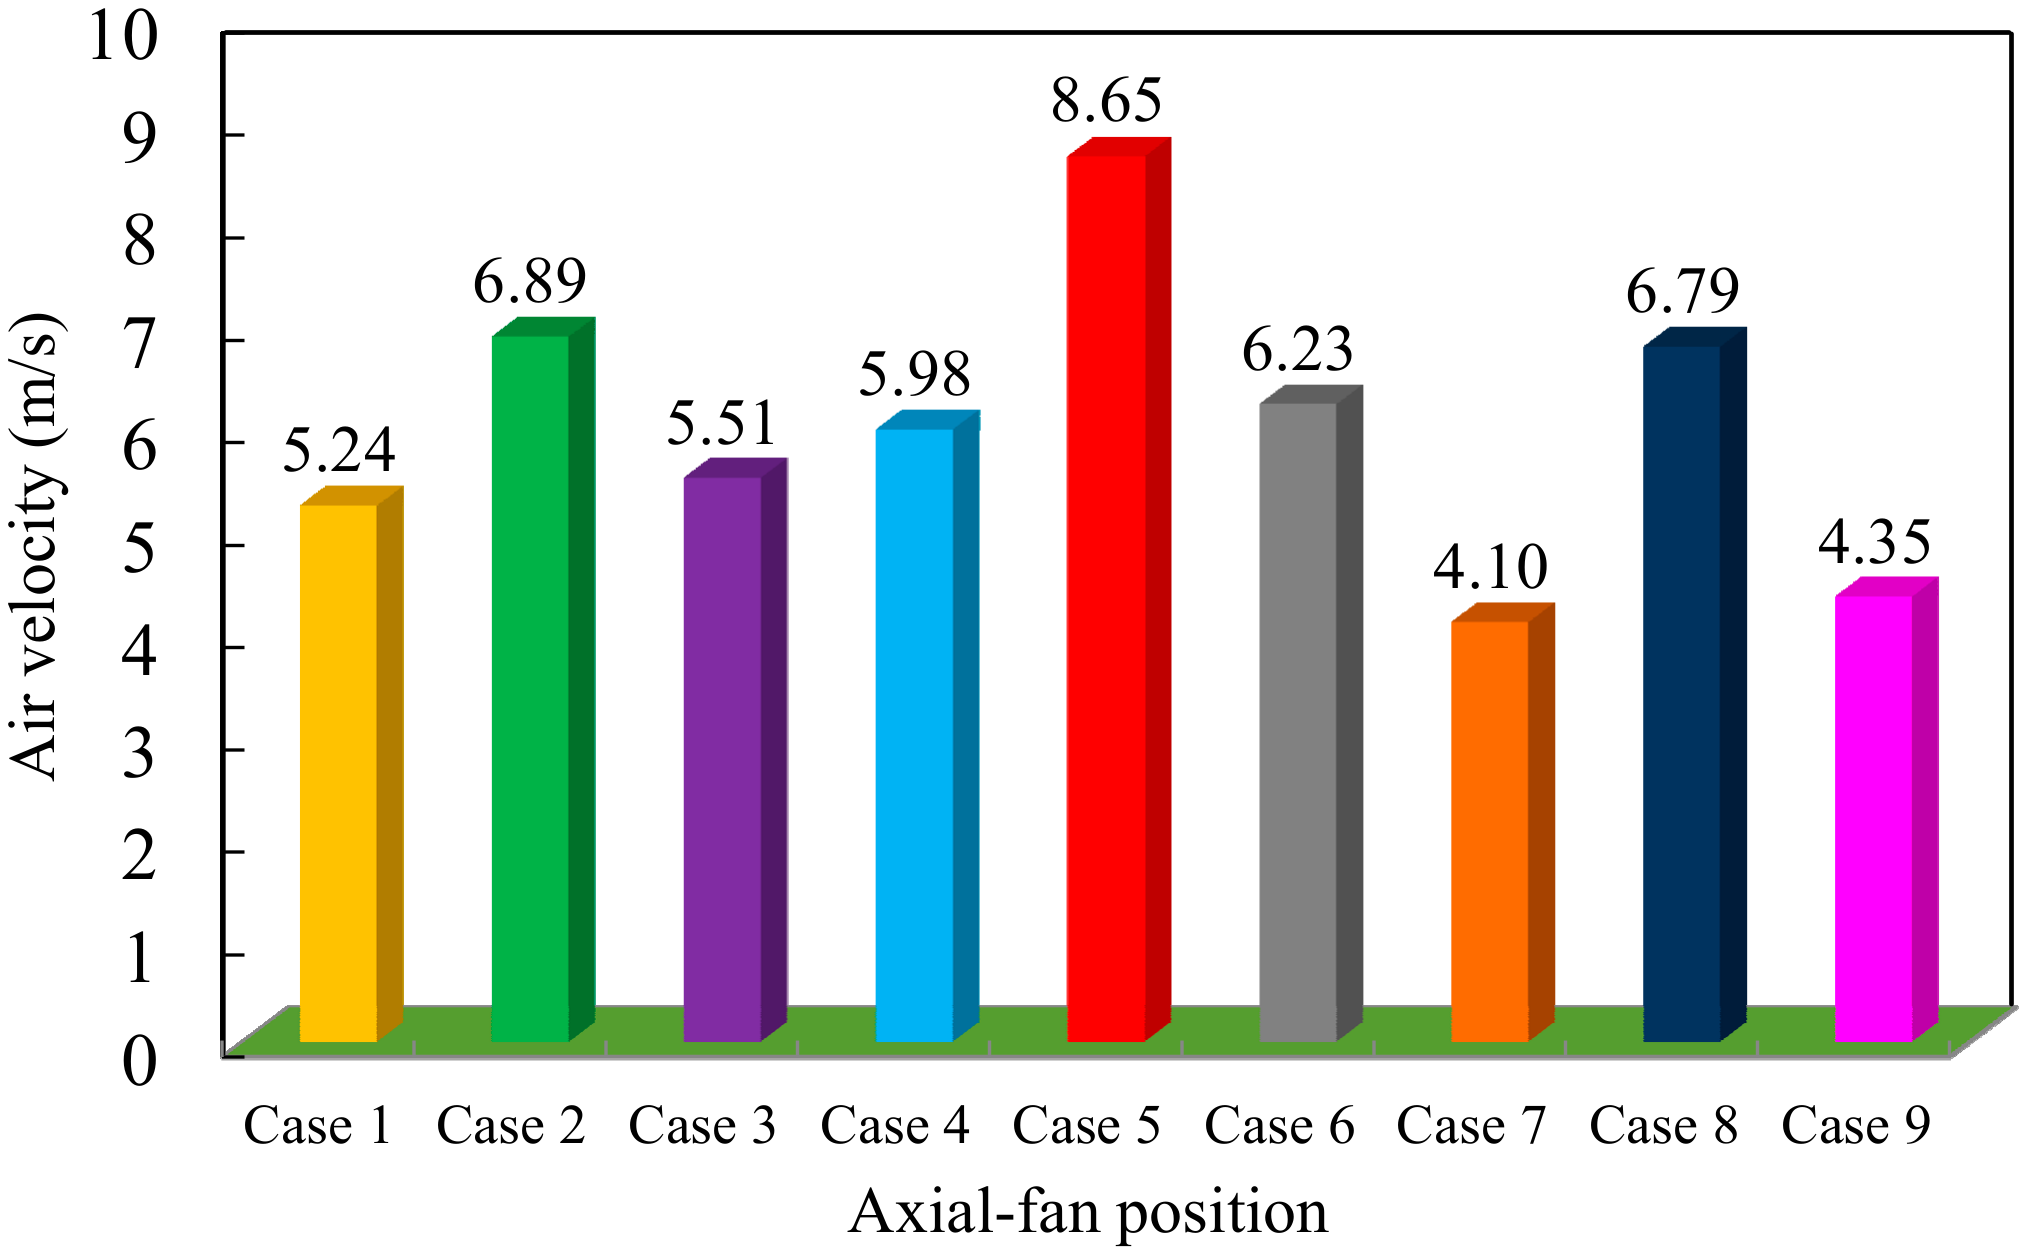
Figure 12.
Air velocity field near the axial fan for (a) Case 3, (b) case 5, and (c) case 7.

Figure 13.
Air velocity distribution in the cavern.
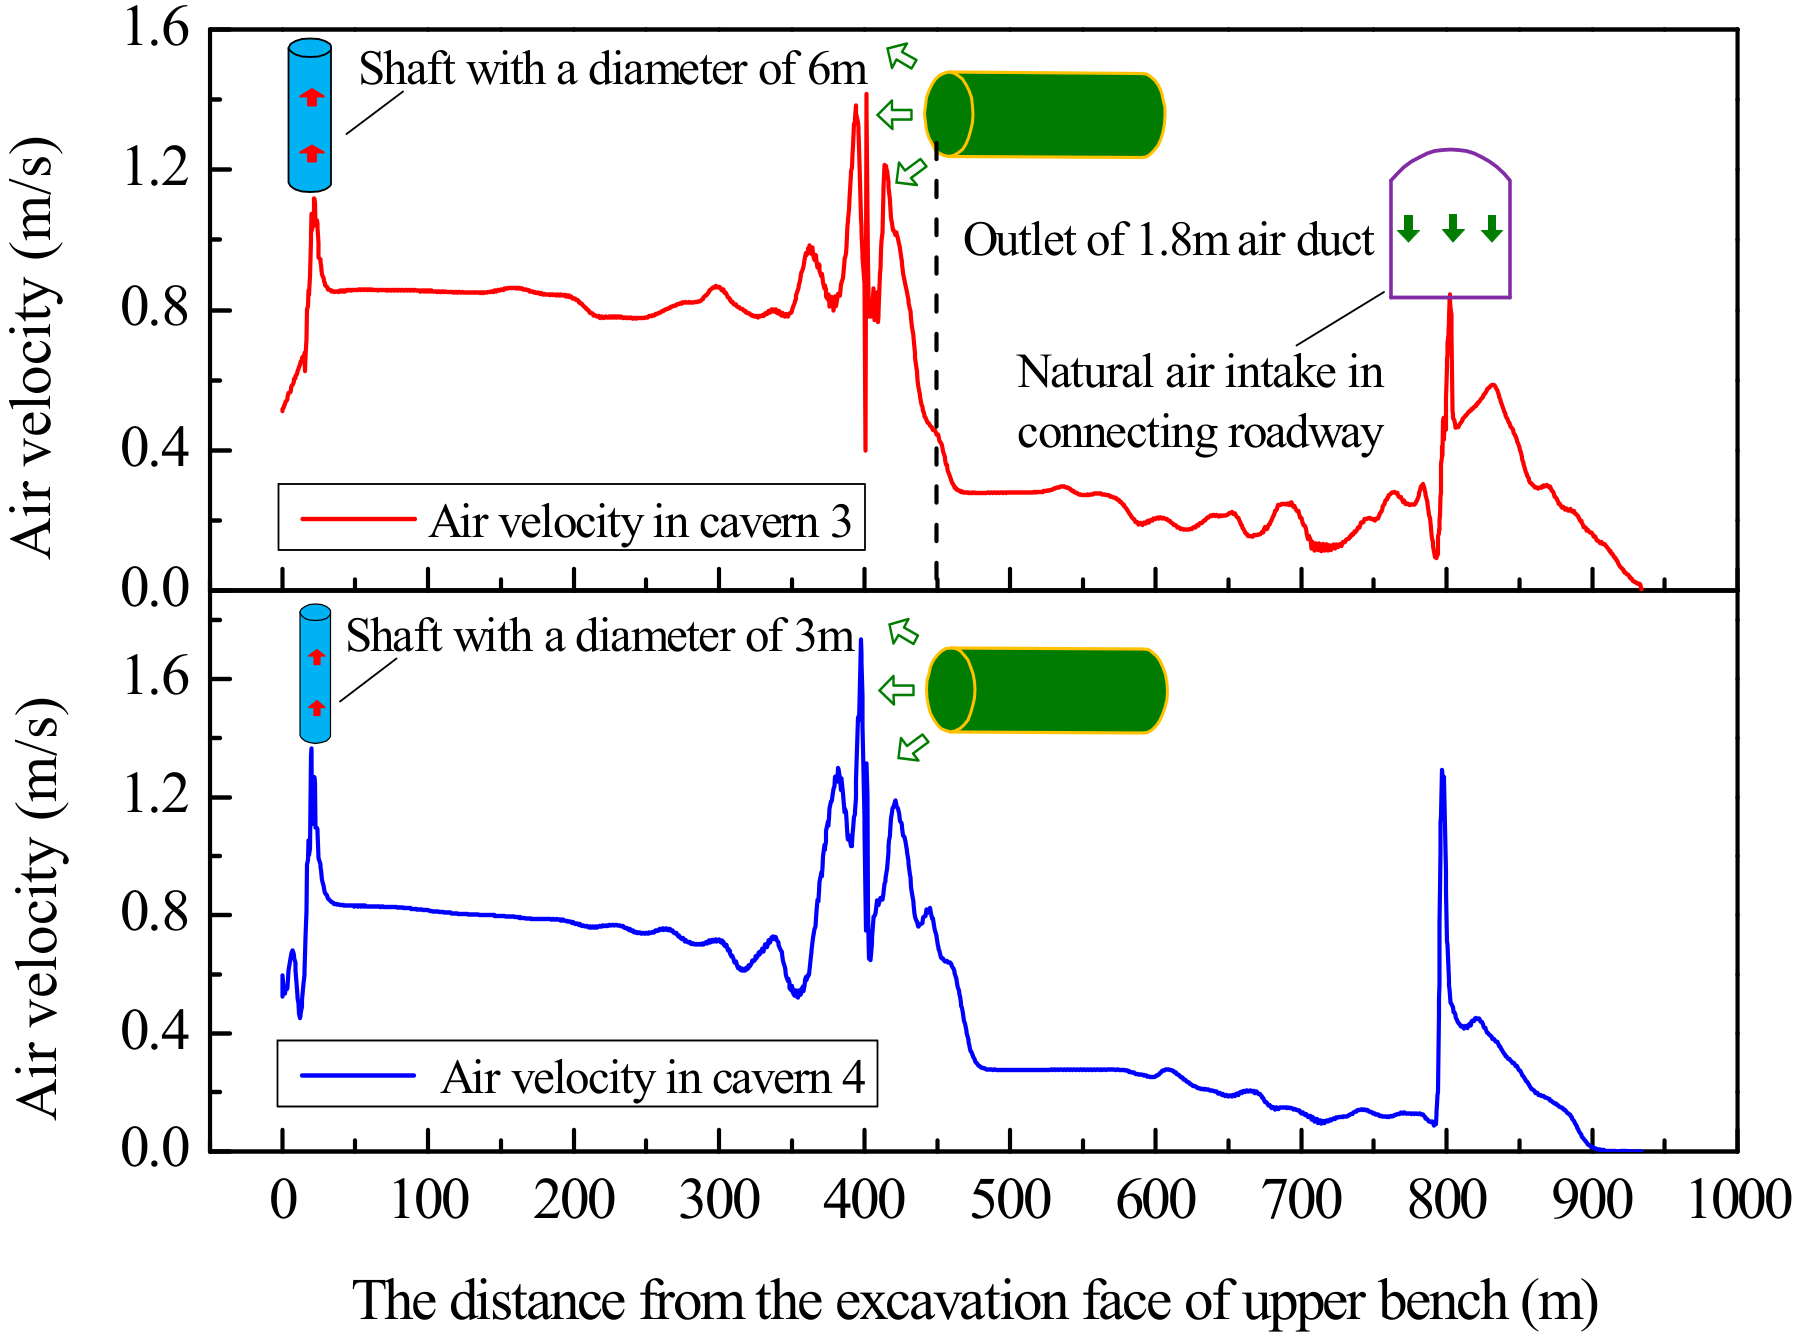
Figure 14.
CO distribution of the center line.
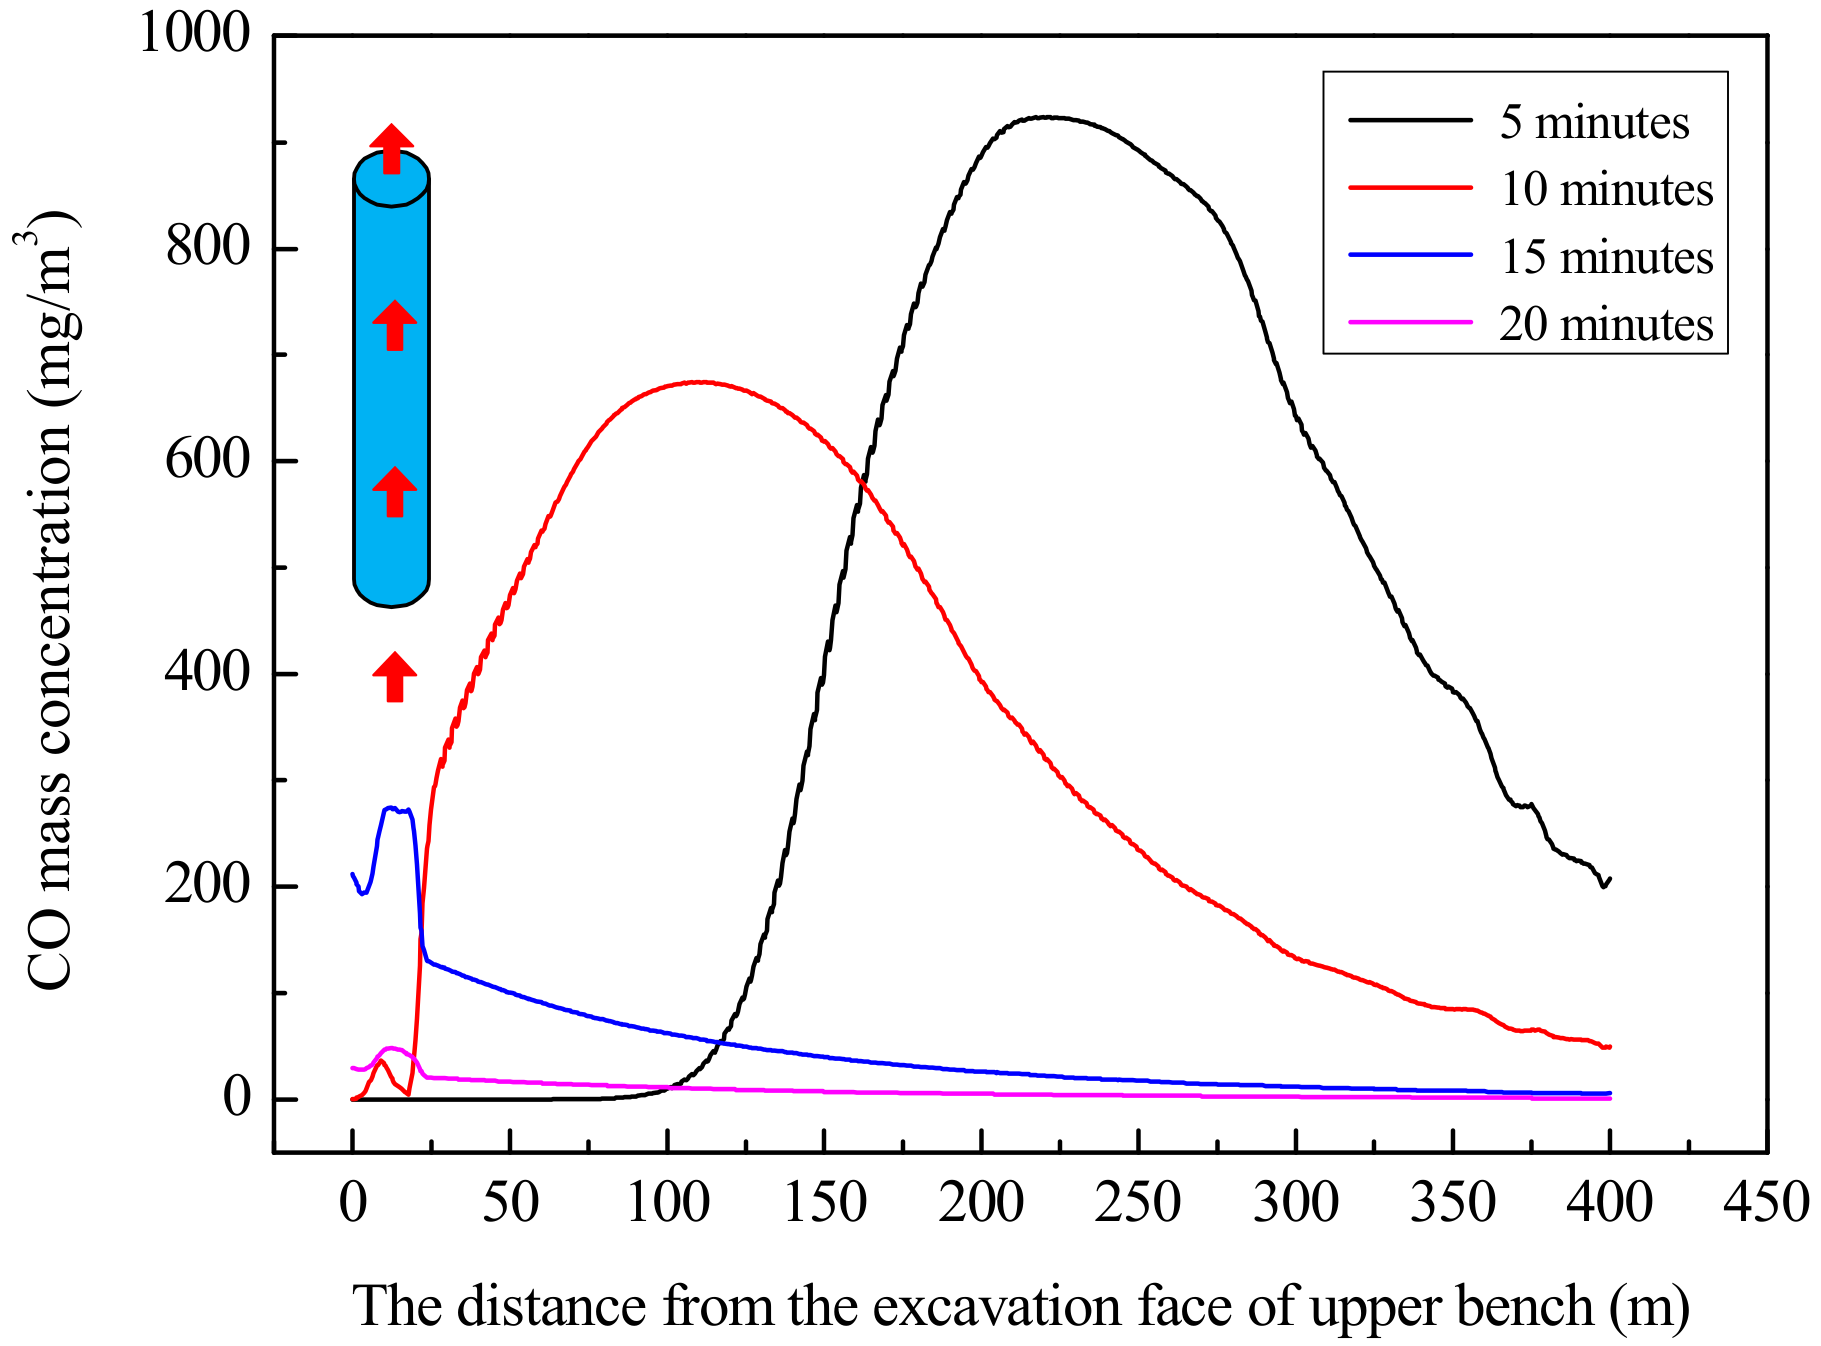
Figure 15.
CO mass concentration distribution of the winter ventilation scheme. (a) Ventilation for 5 min, (b) ventilation for 10 min, (c) ventilation for 15 min, and (d) ventilation for 20 min.
Figure 15.
CO mass concentration distribution of the winter ventilation scheme. (a) Ventilation for 5 min, (b) ventilation for 10 min, (c) ventilation for 15 min, and (d) ventilation for 20 min.
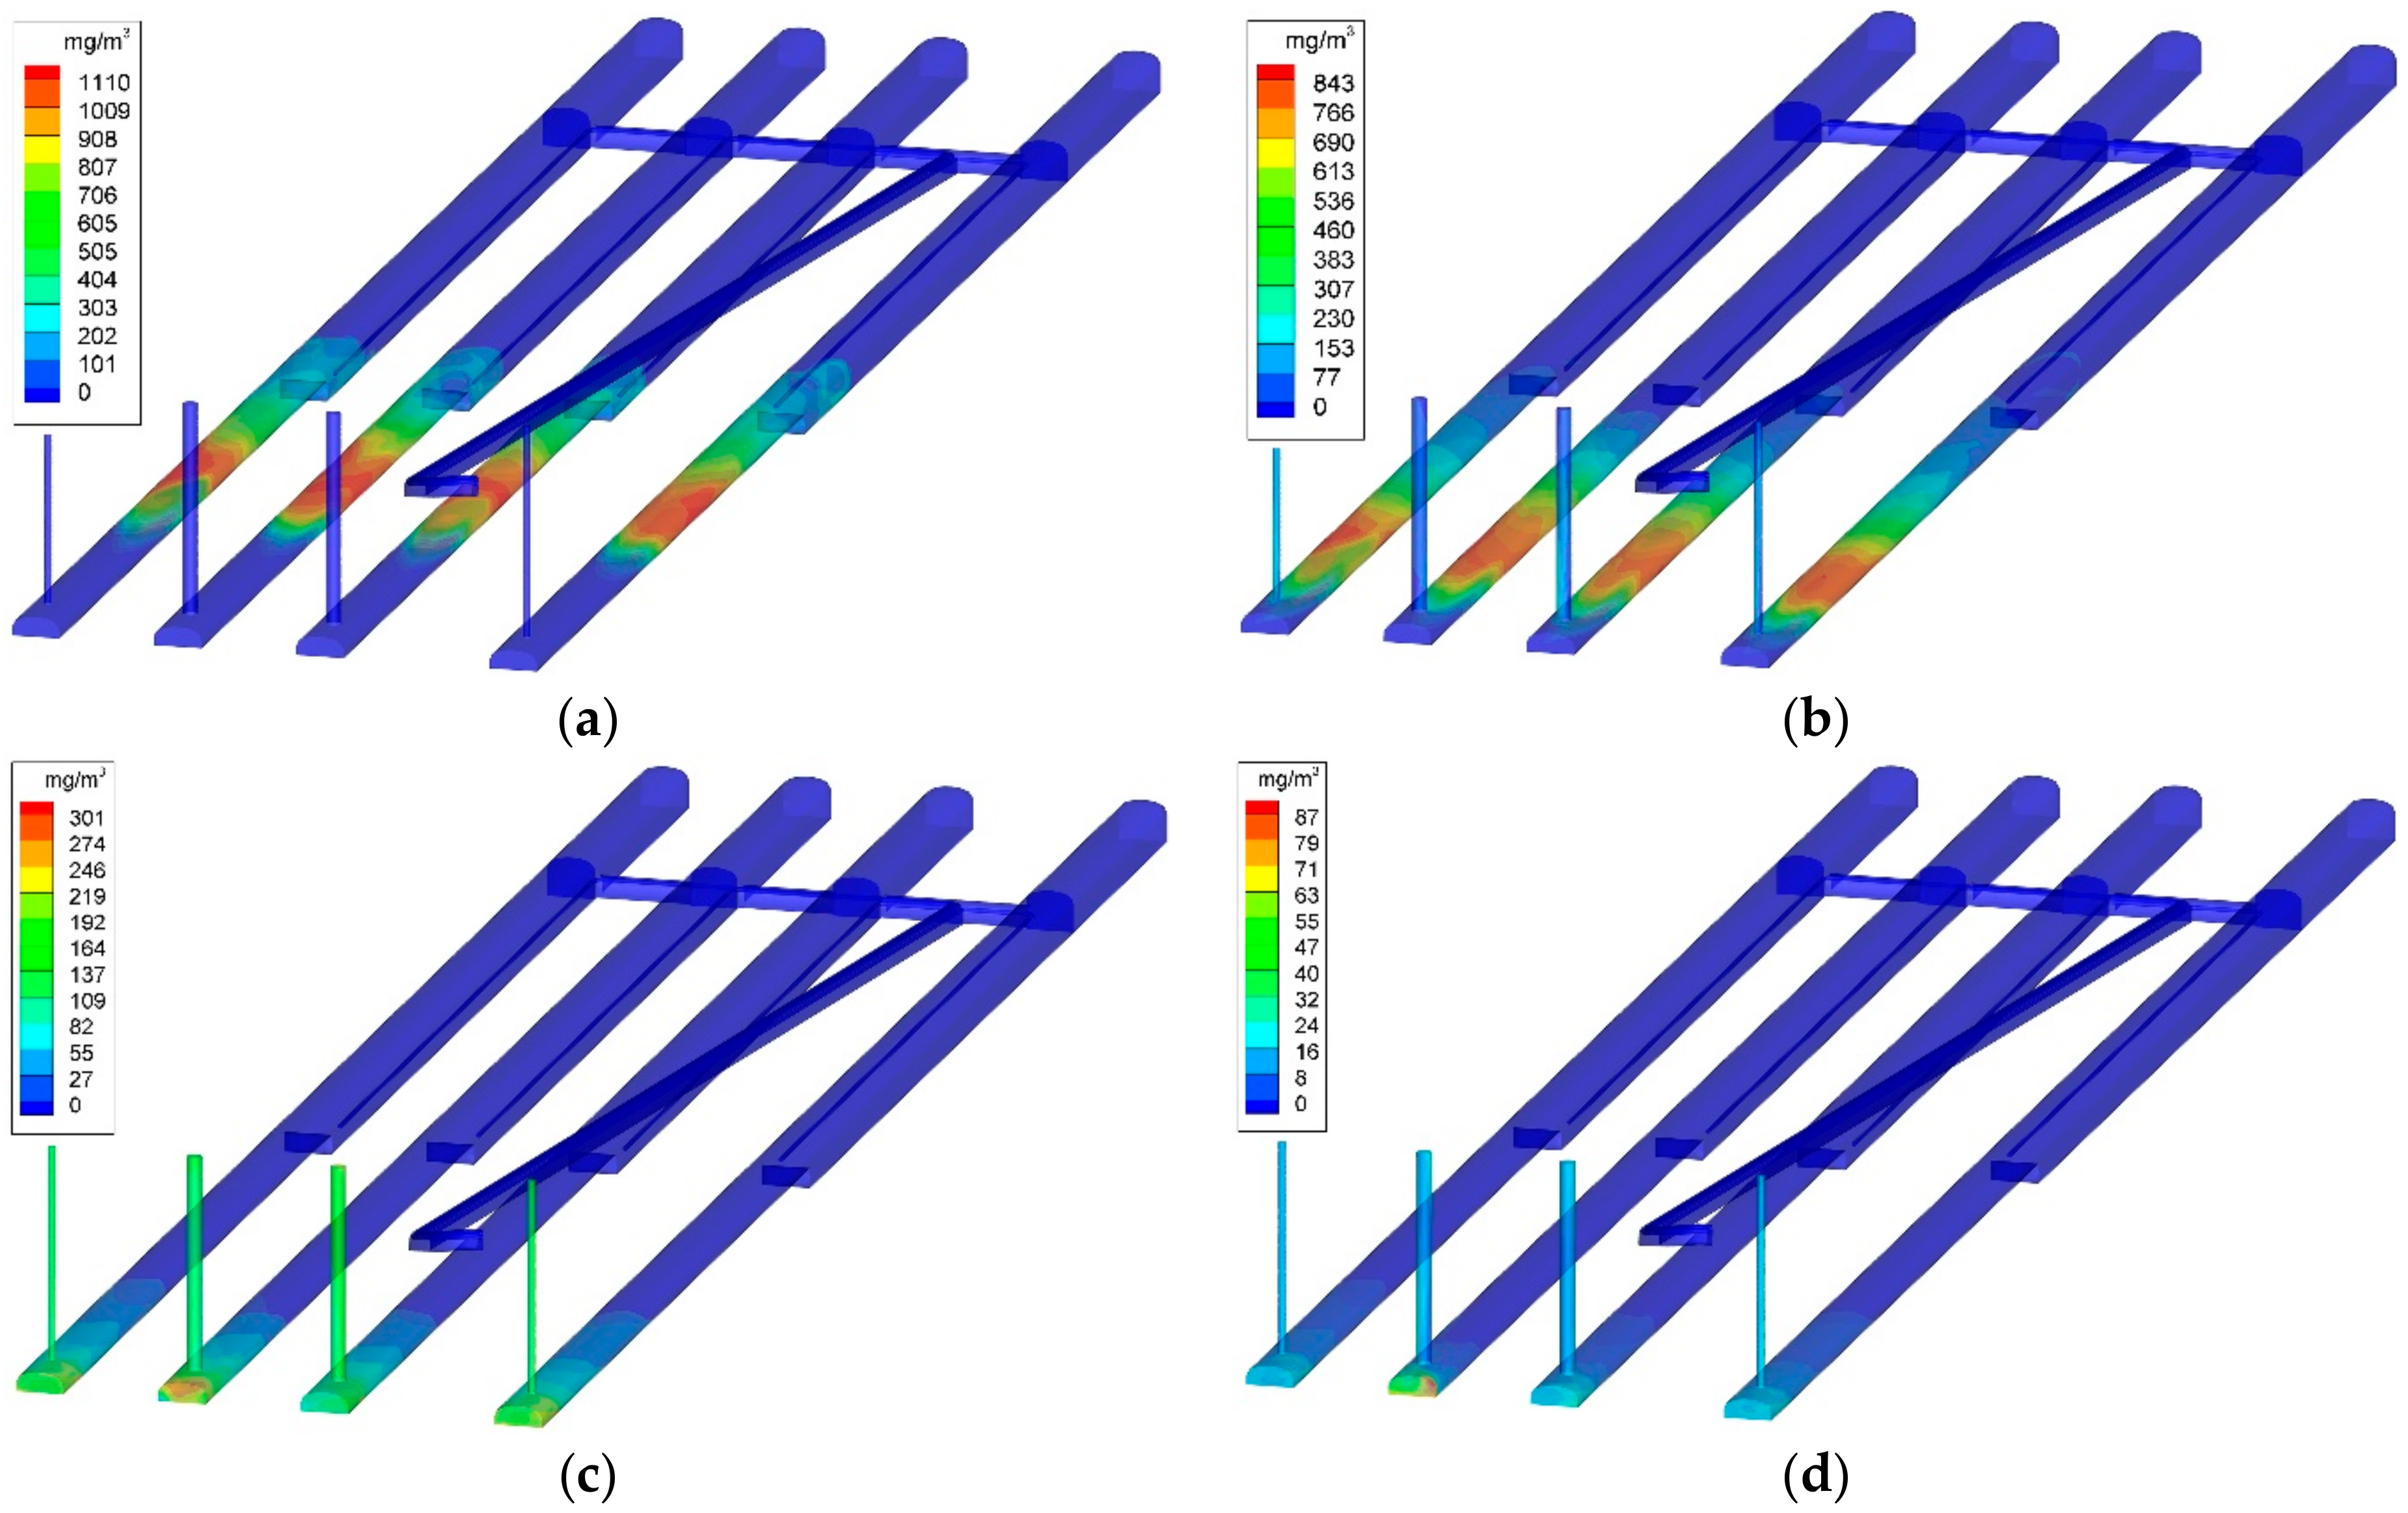
Figure 16.
CO distribution in different temperatures with 300 m to excavation face.


Table 1.
Initial concentration of CO after cavern blasting.
| Section | A (m2) | G (kg) | LOT (m) | The Amount of CO (m3) | C0 (mg/m3) |
|---|---|---|---|---|---|
| Upper layer | 135.1 | 320 | 79 | 12.8 | 1499.1 |
| Middle layer | 152 | 320 | 79 | 12.8 | 1332.4 |
© 2018 by the authors. Licensee MDPI, Basel, Switzerland. This article is an open access article distributed under the terms and conditions of the Creative Commons Attribution (CC BY) license (http://creativecommons.org/licenses/by/4.0/).
Share and Cite
MDPI and ACS Style
Sun, J.; Zhang, H.; Huang, M.; Chen, Q.; Chen, S. Reasonable Paths of Construction Ventilation for Large-Scale Underground Cavern Groups in Winter and Summer. Sustainability 2018, 10, 3768. https://doi.org/10.3390/su10103768
AMA Style
Sun J, Zhang H, Huang M, Chen Q, Chen S. Reasonable Paths of Construction Ventilation for Large-Scale Underground Cavern Groups in Winter and Summer. Sustainability. 2018; 10(10):3768. https://doi.org/10.3390/su10103768
Chicago/Turabian StyleSun, Jianchun, Heng Zhang, Muyan Huang, Qianyang Chen, and Shougen Chen. 2018. "Reasonable Paths of Construction Ventilation for Large-Scale Underground Cavern Groups in Winter and Summer" Sustainability 10, no. 10: 3768. https://doi.org/10.3390/su10103768
Note that from the first issue of 2016, this journal uses article numbers instead of page numbers. See further details here.