Powering Mode-Integrated Energy Management Strategy for a Plug-In Hybrid Electric Truck with an Automatic Mechanical Transmission Based on Pontryagin’s Minimum Principle

Abstract
:1. Introduction
2. Powertrain Modeling
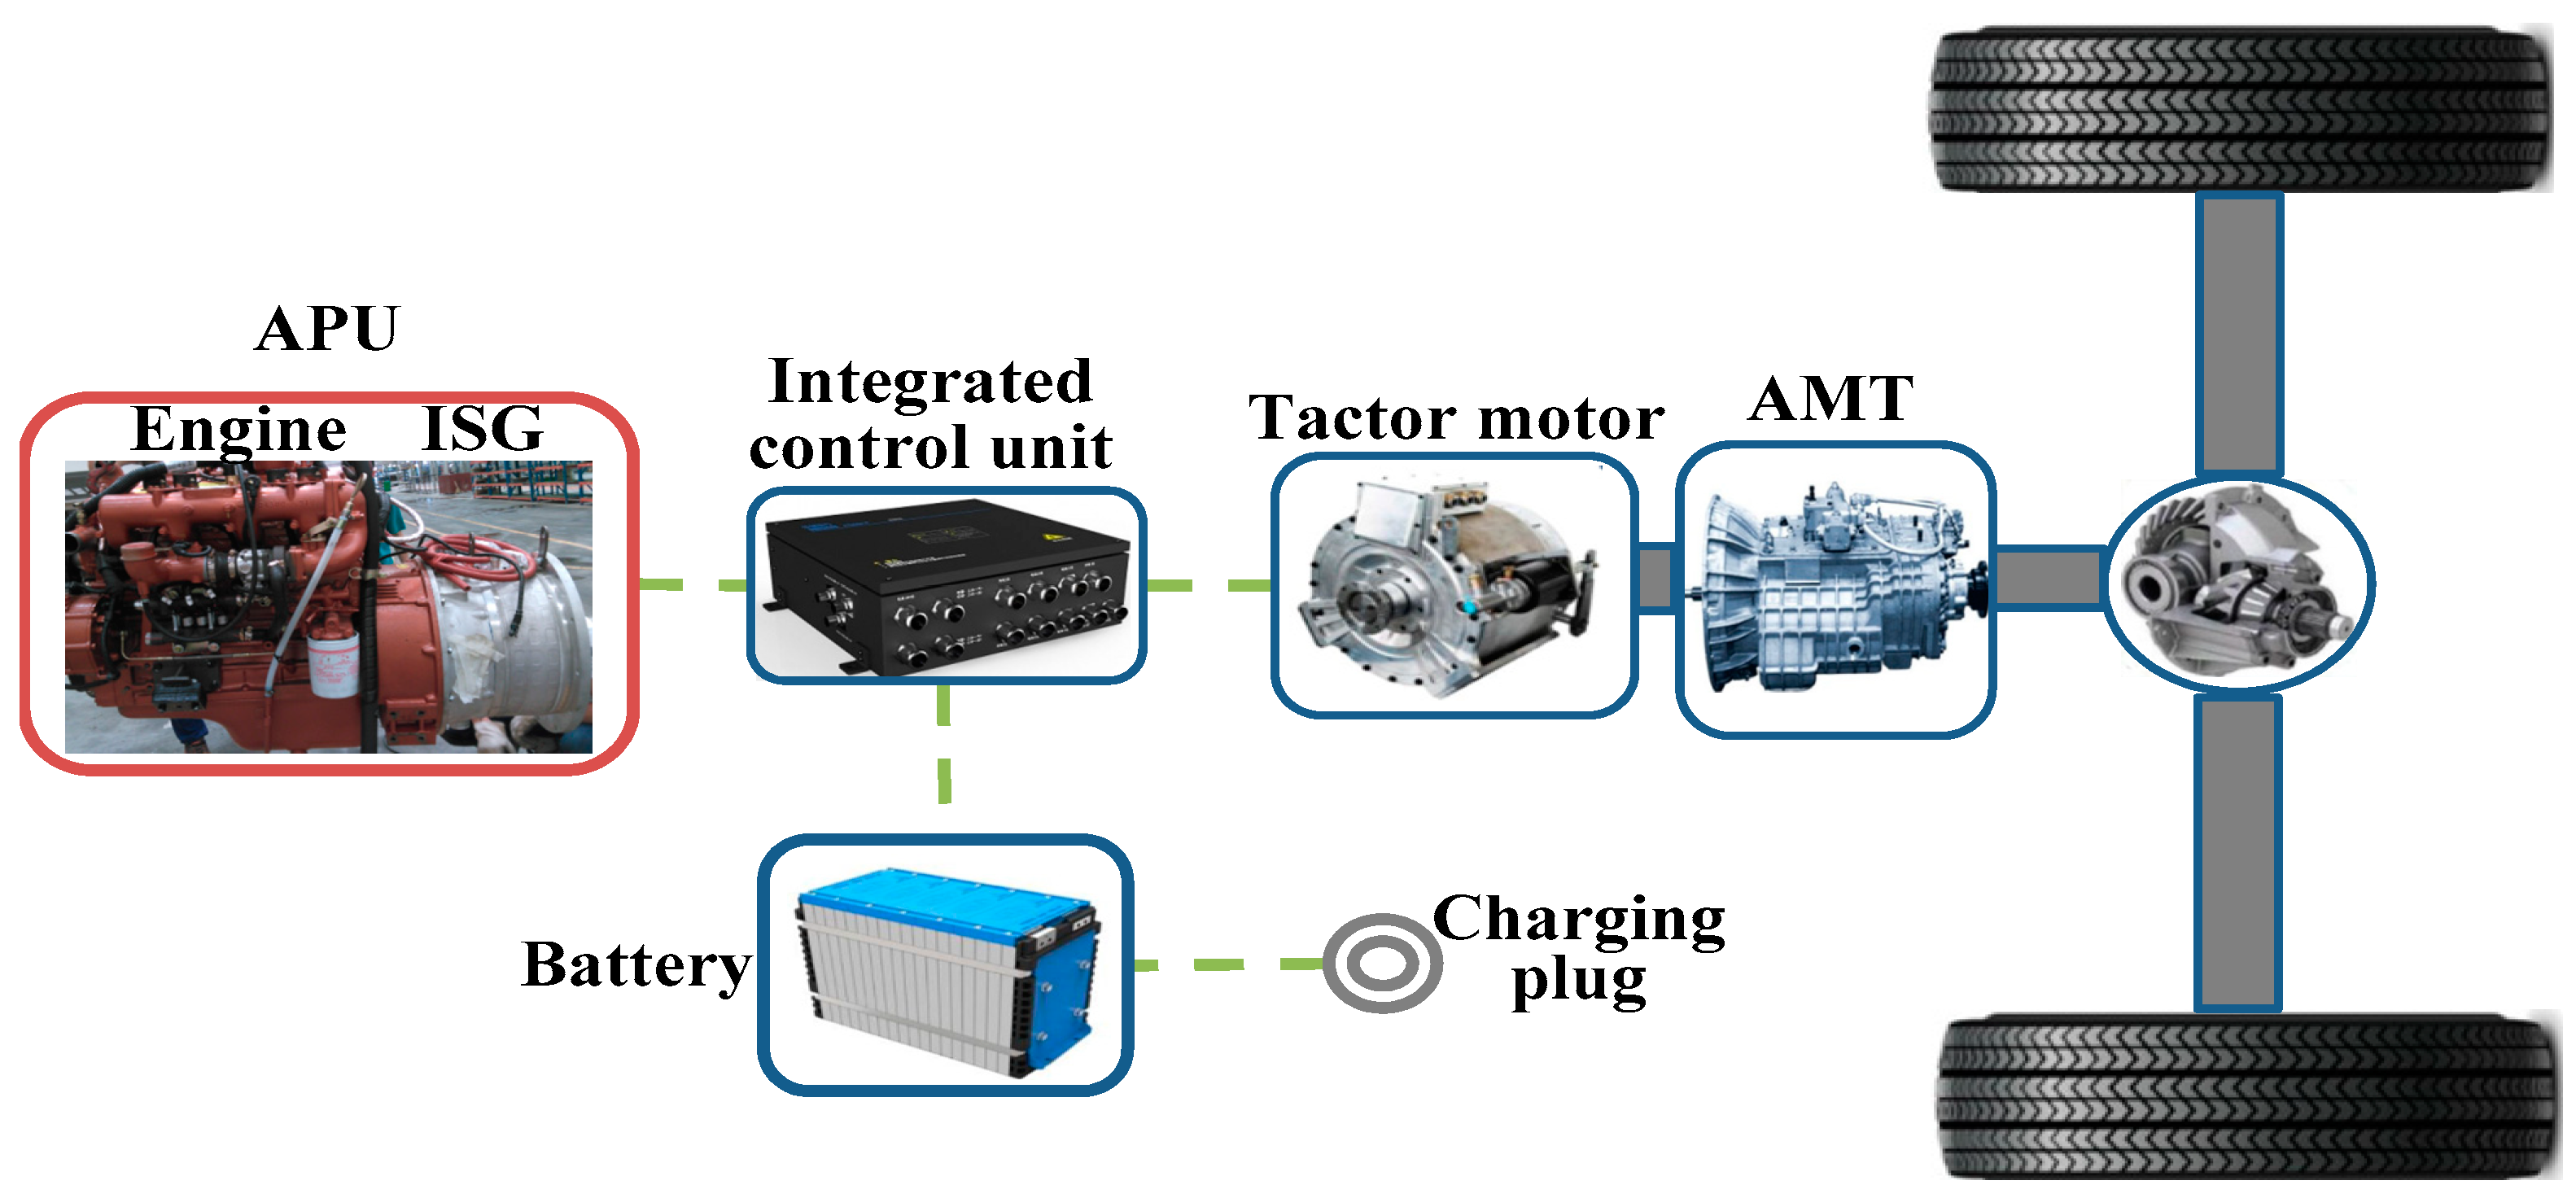
2.1. Powertrian Description
2.2. System Model
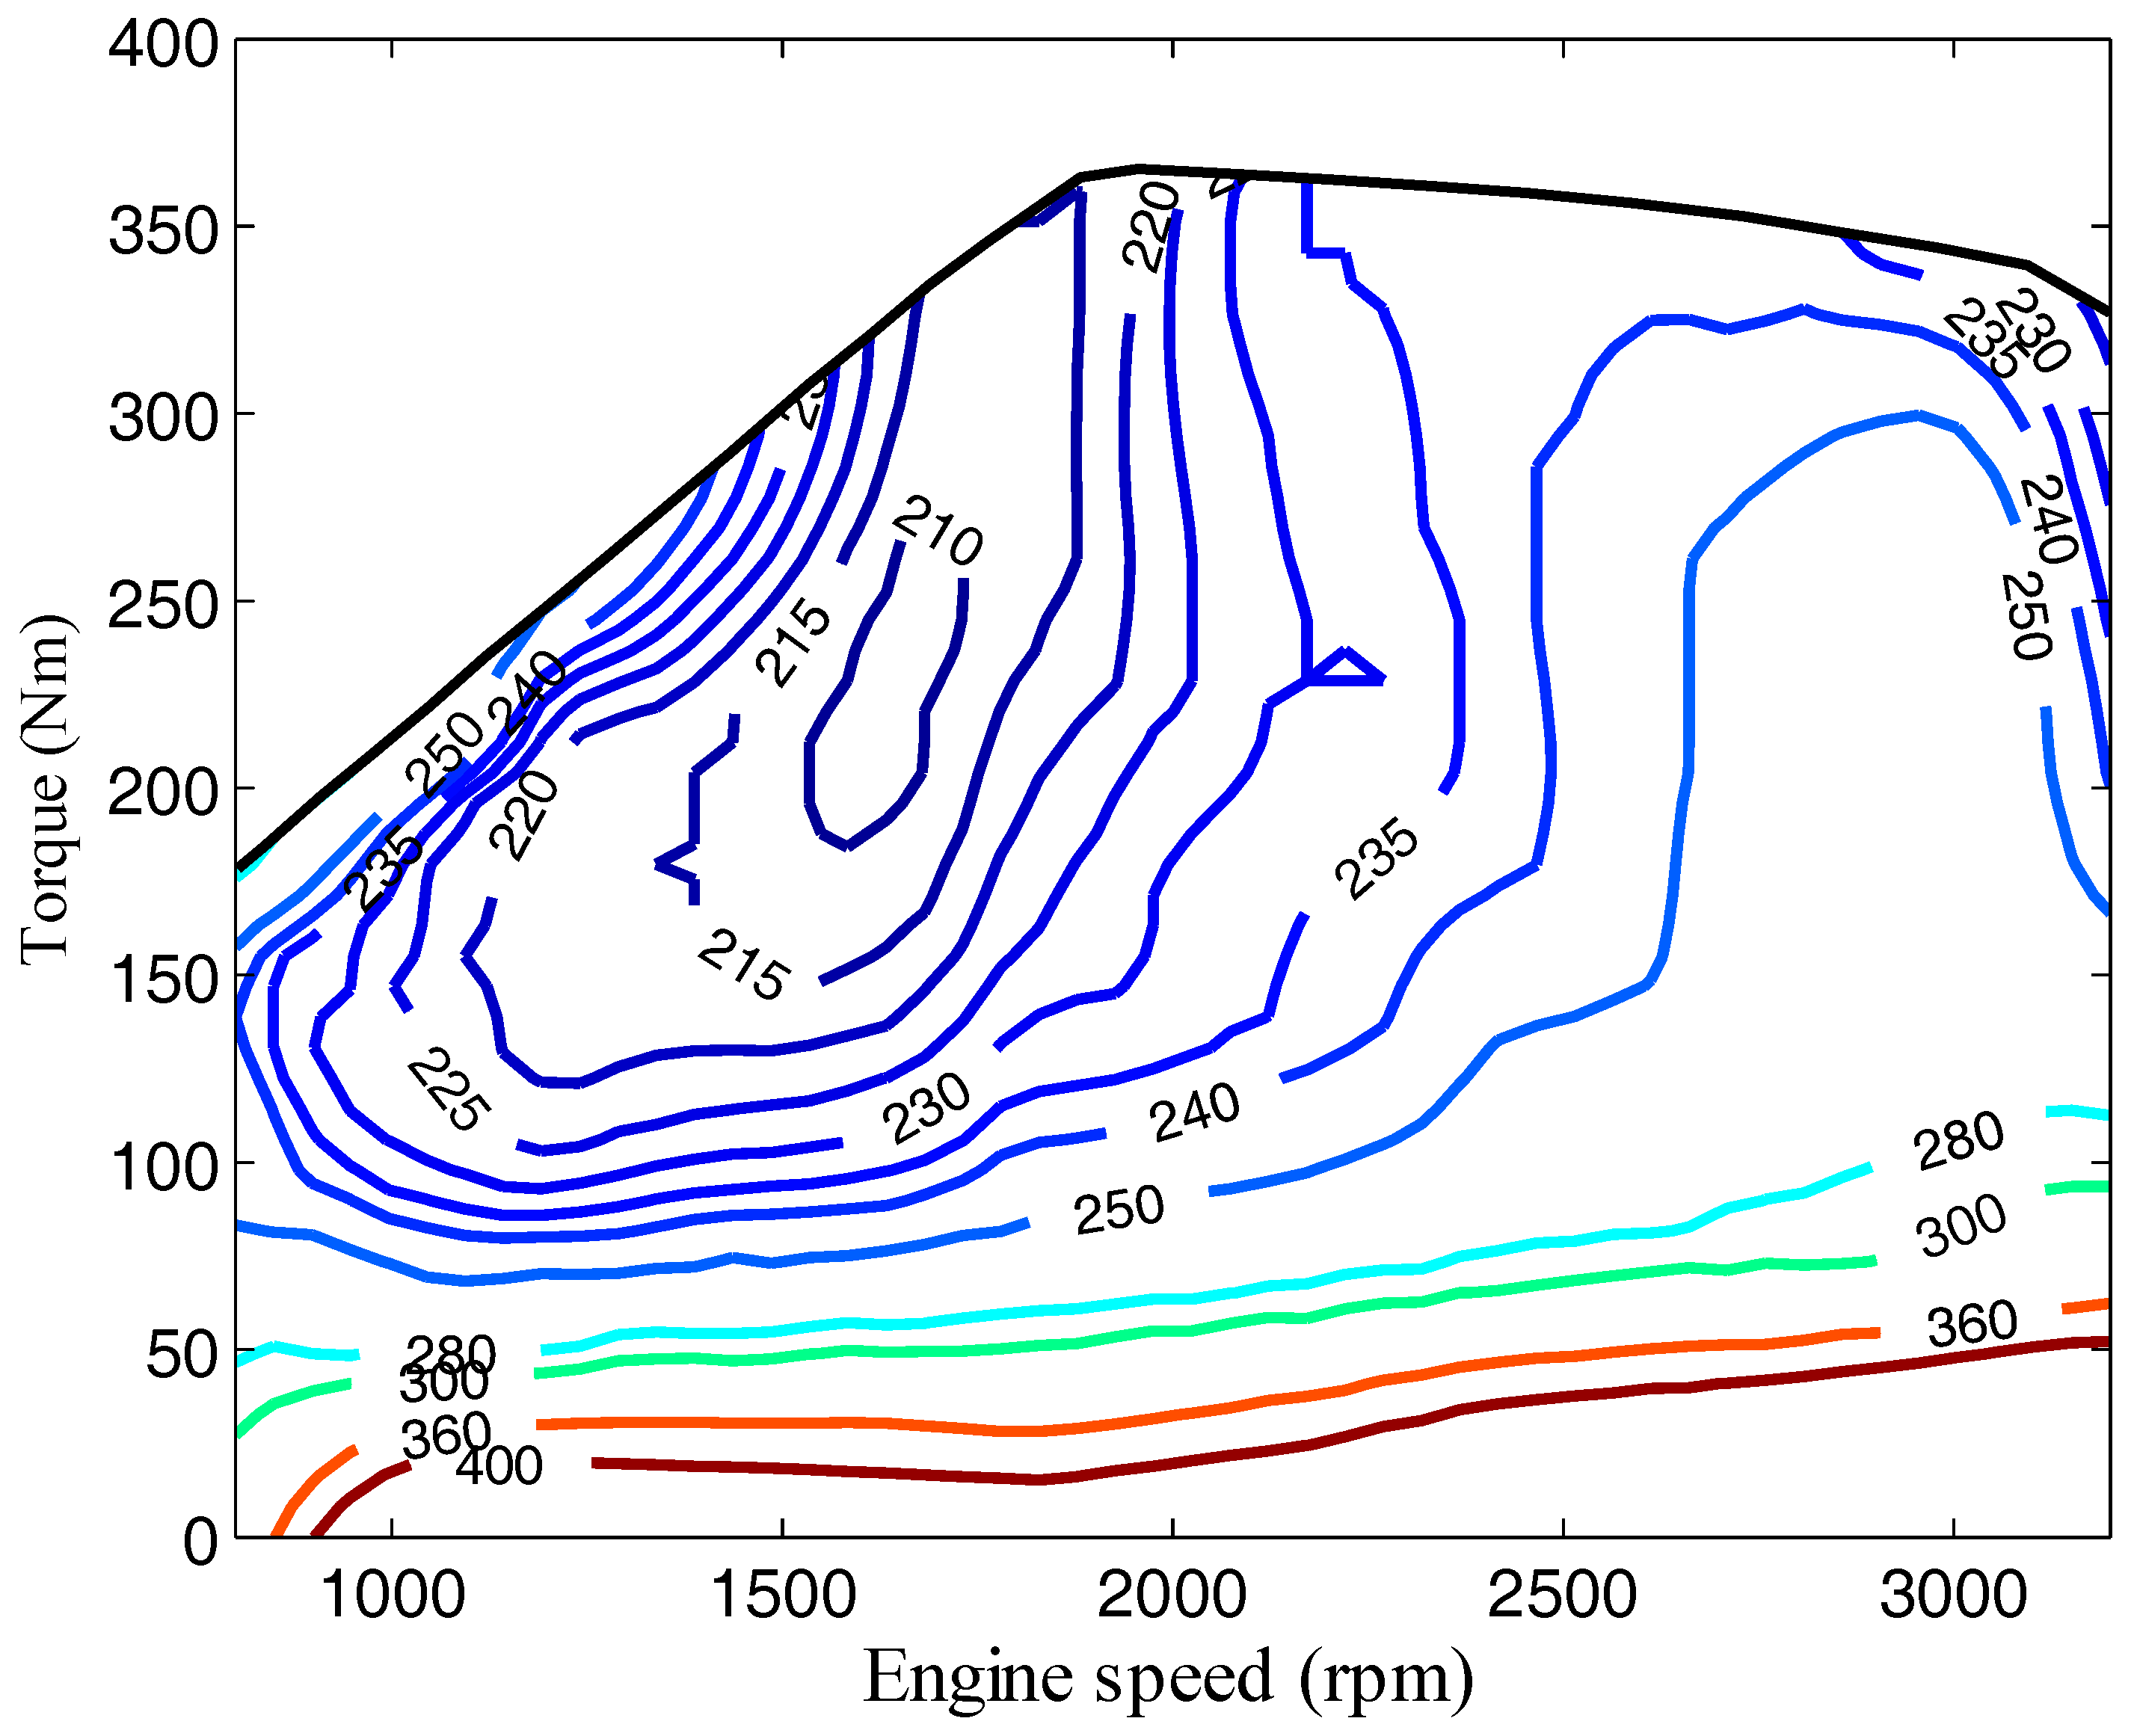
2.2.1. APU Model
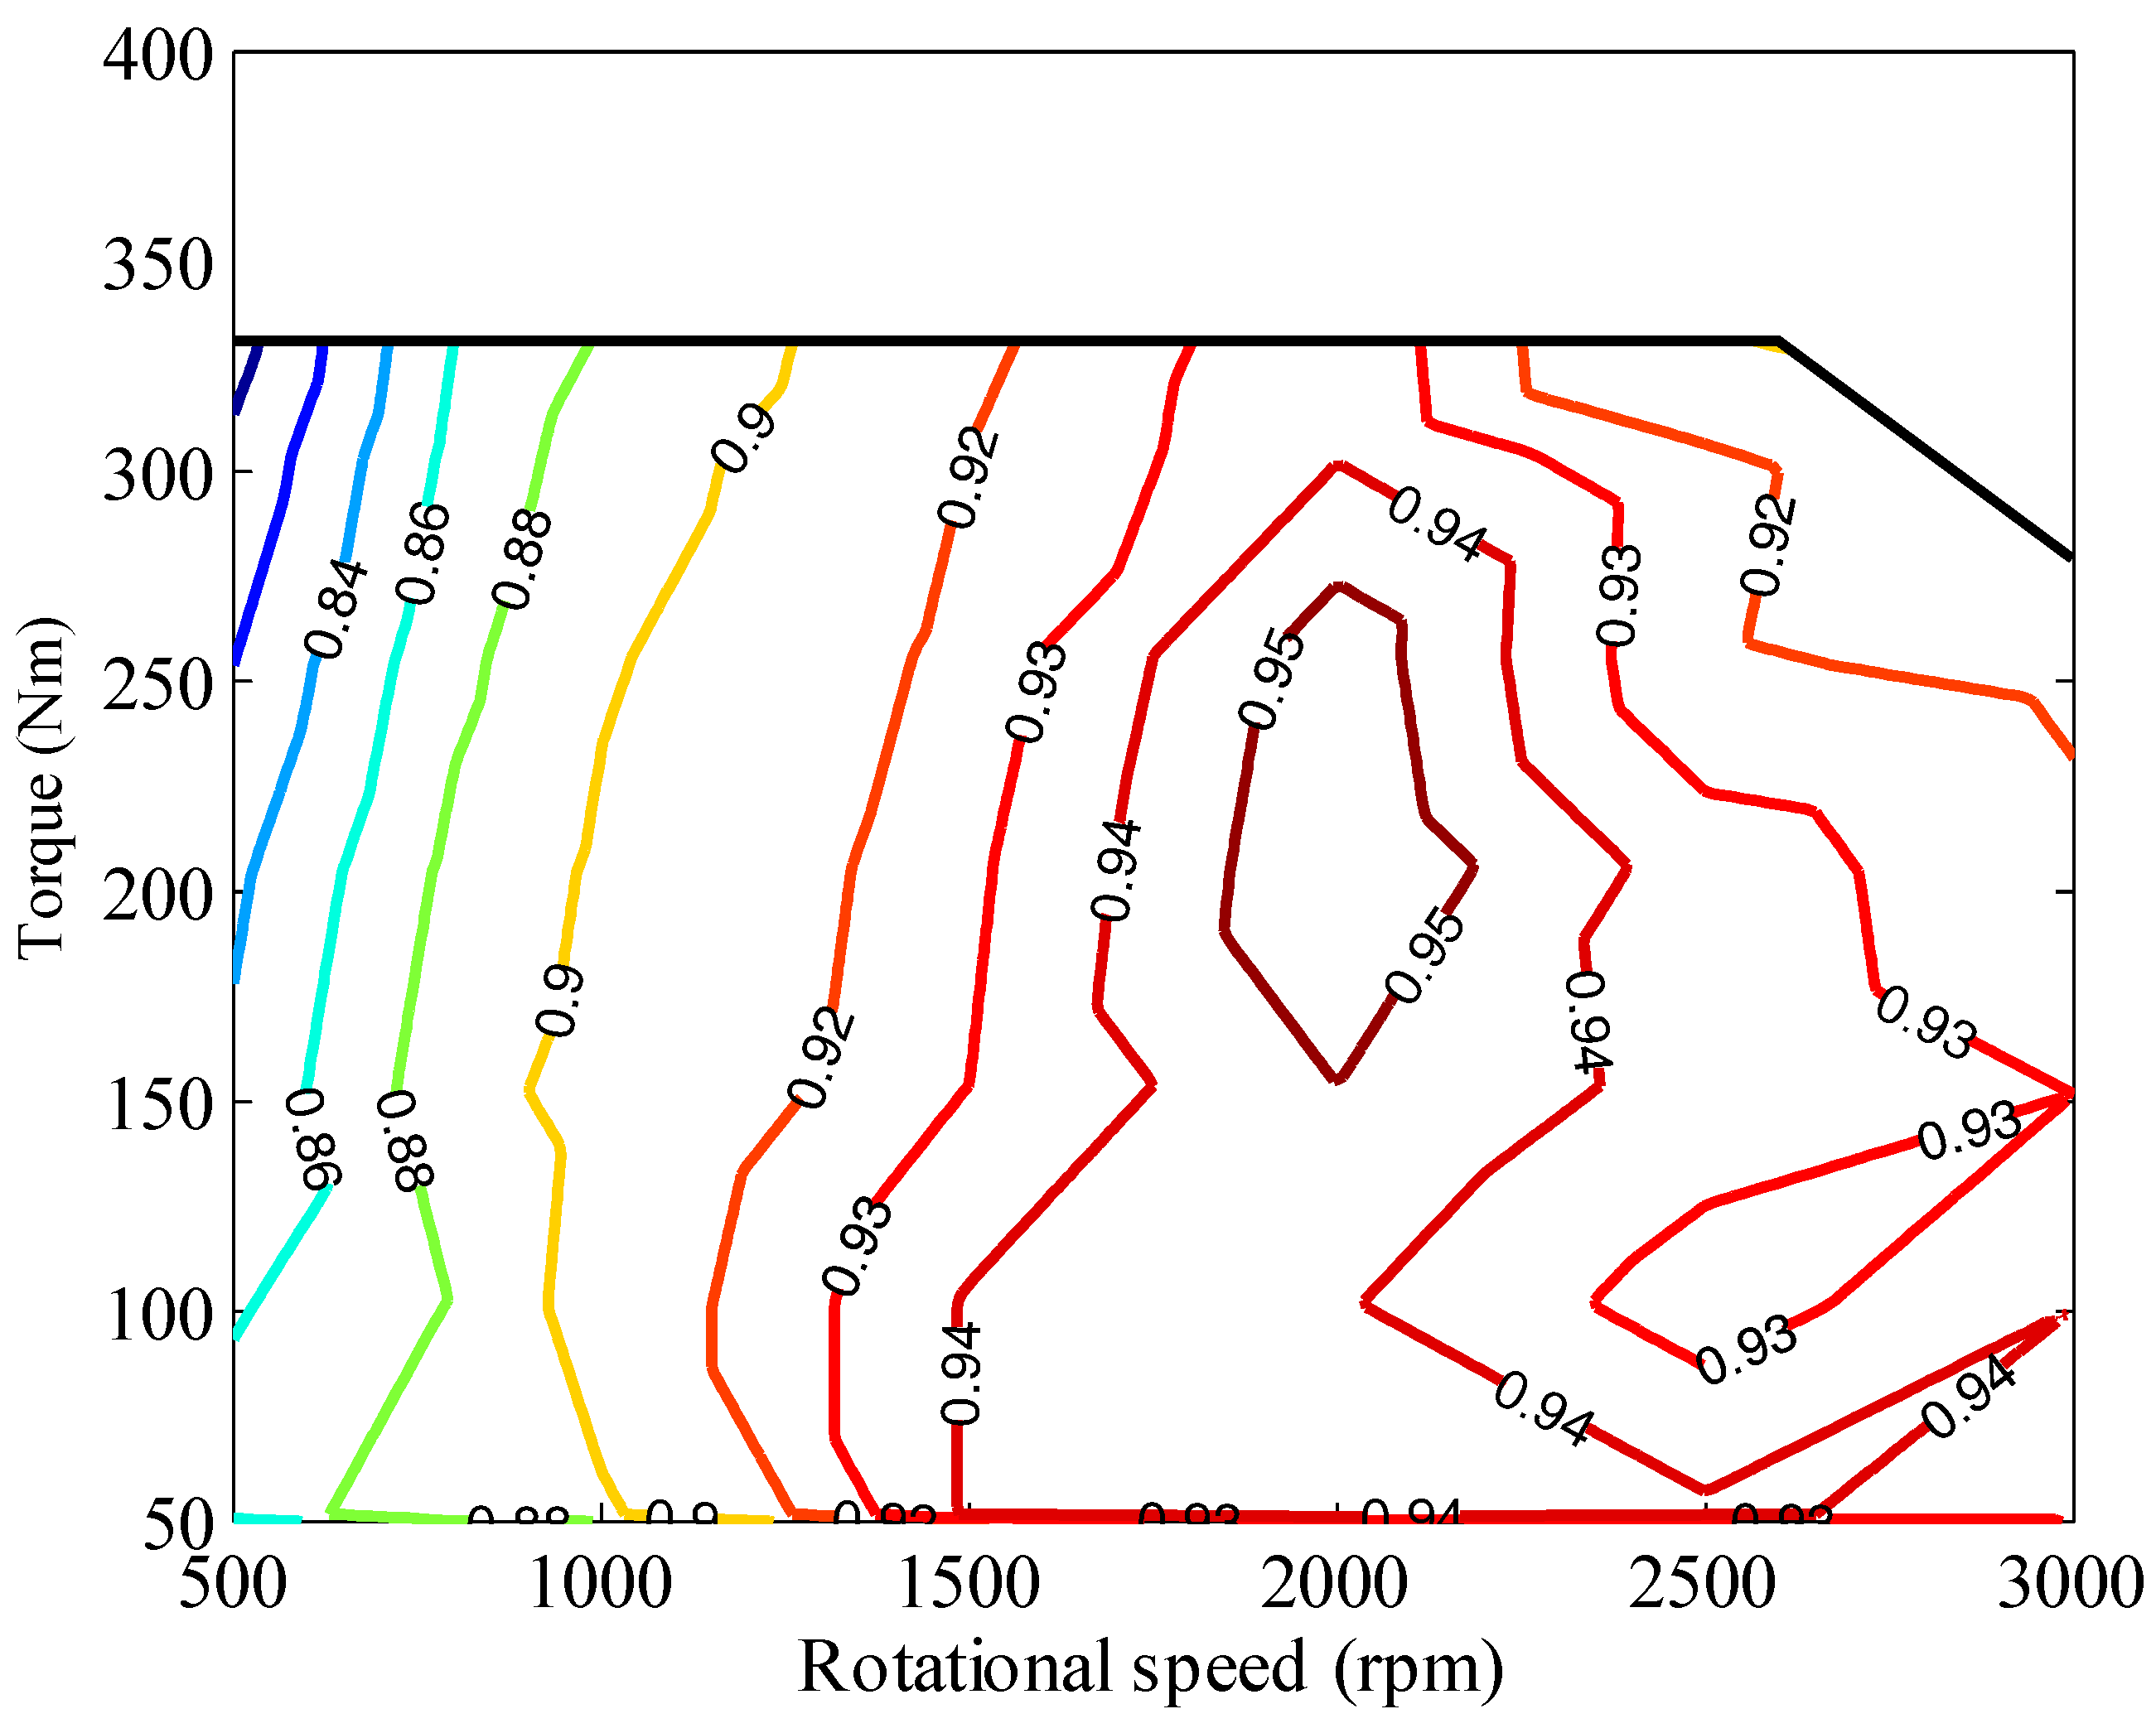
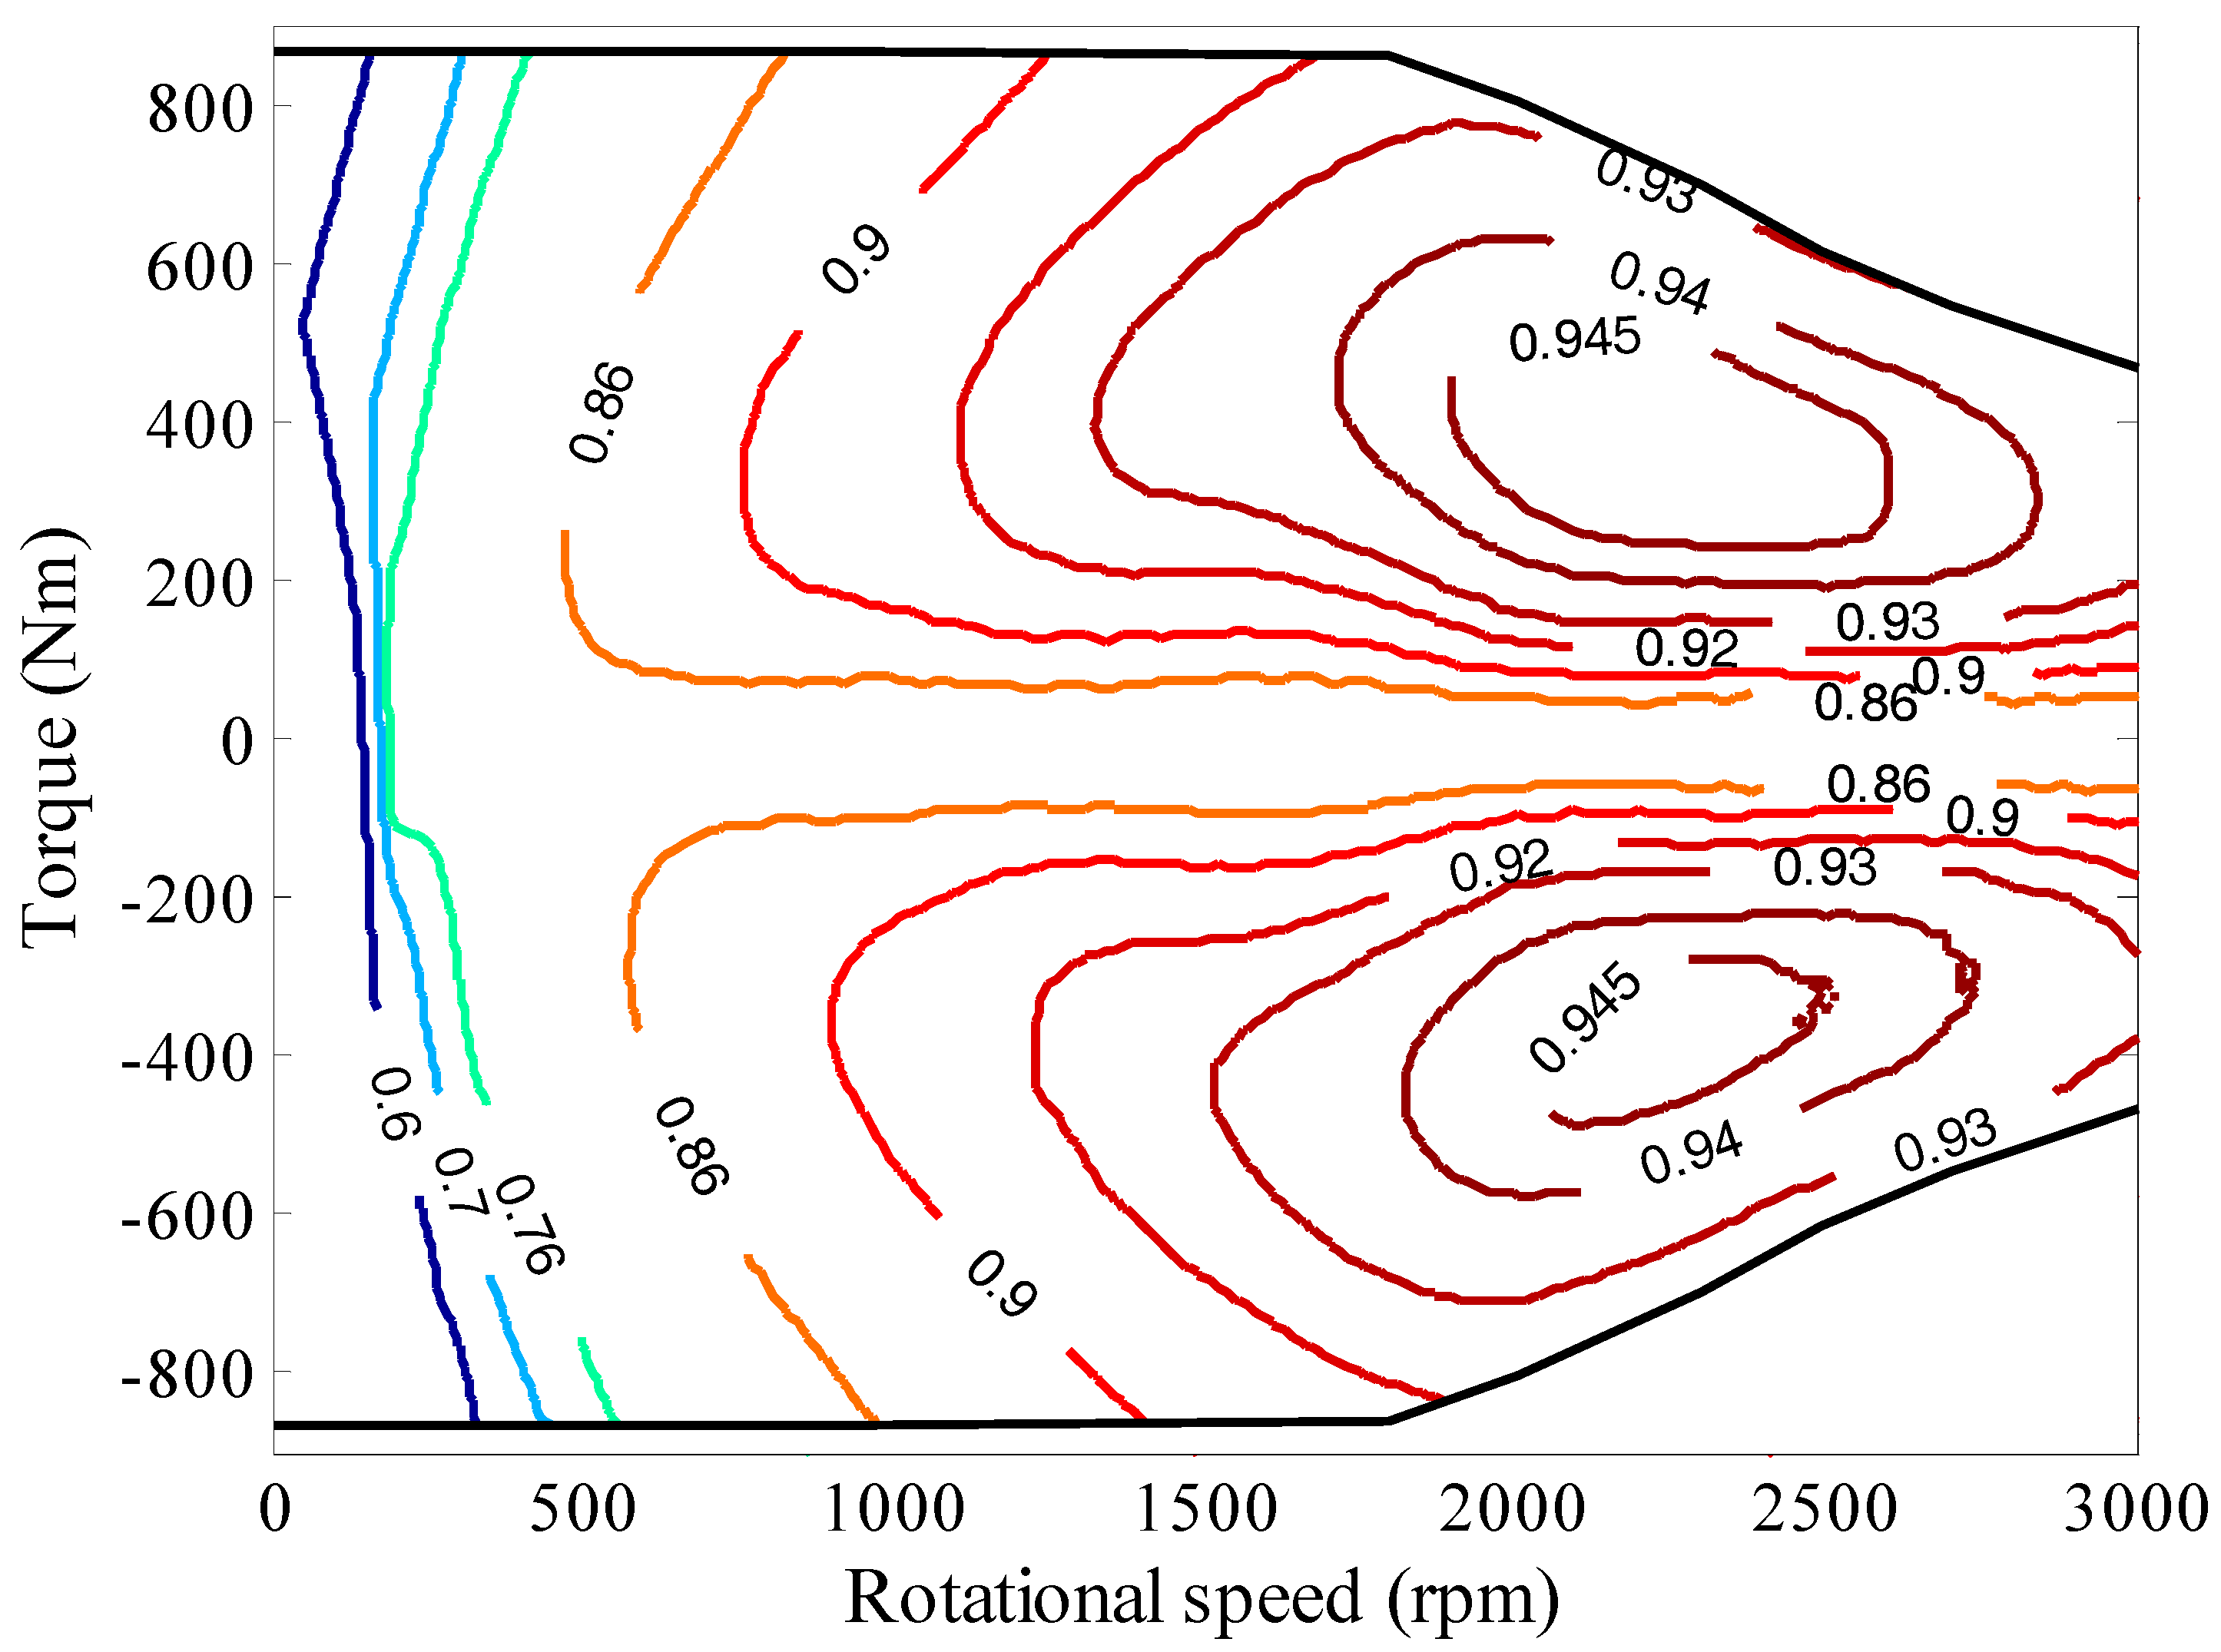
2.2.2. Electric Motor
2.2.3. Battery Model
2.3. Vehicle Dynamics
3. PMP-Based Optimization Problem
3.1. Optimization Problem Formation
3.2. Pontryagin’s Minimum Principle
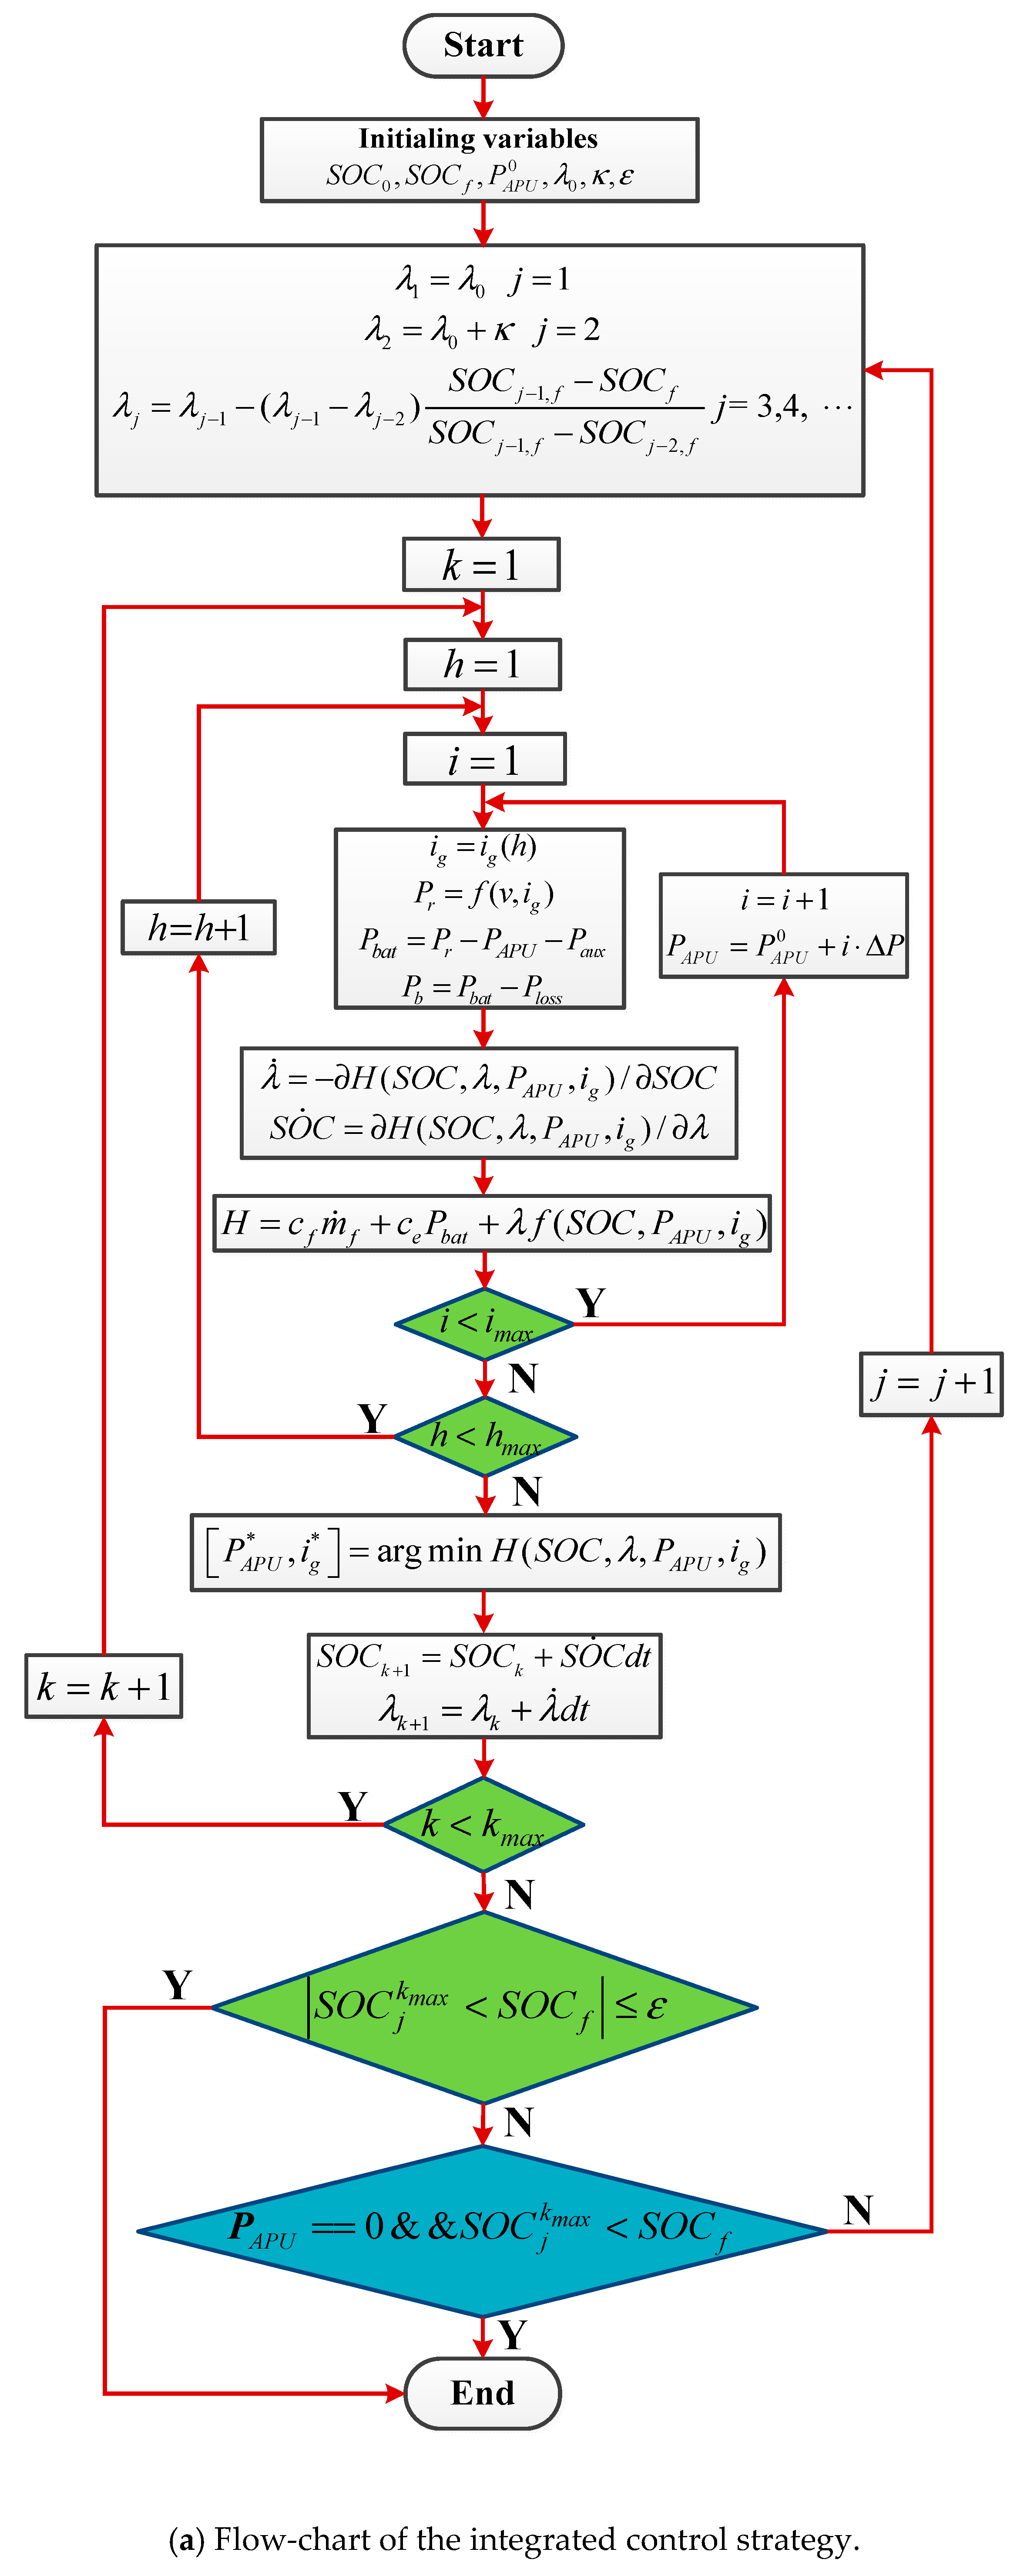
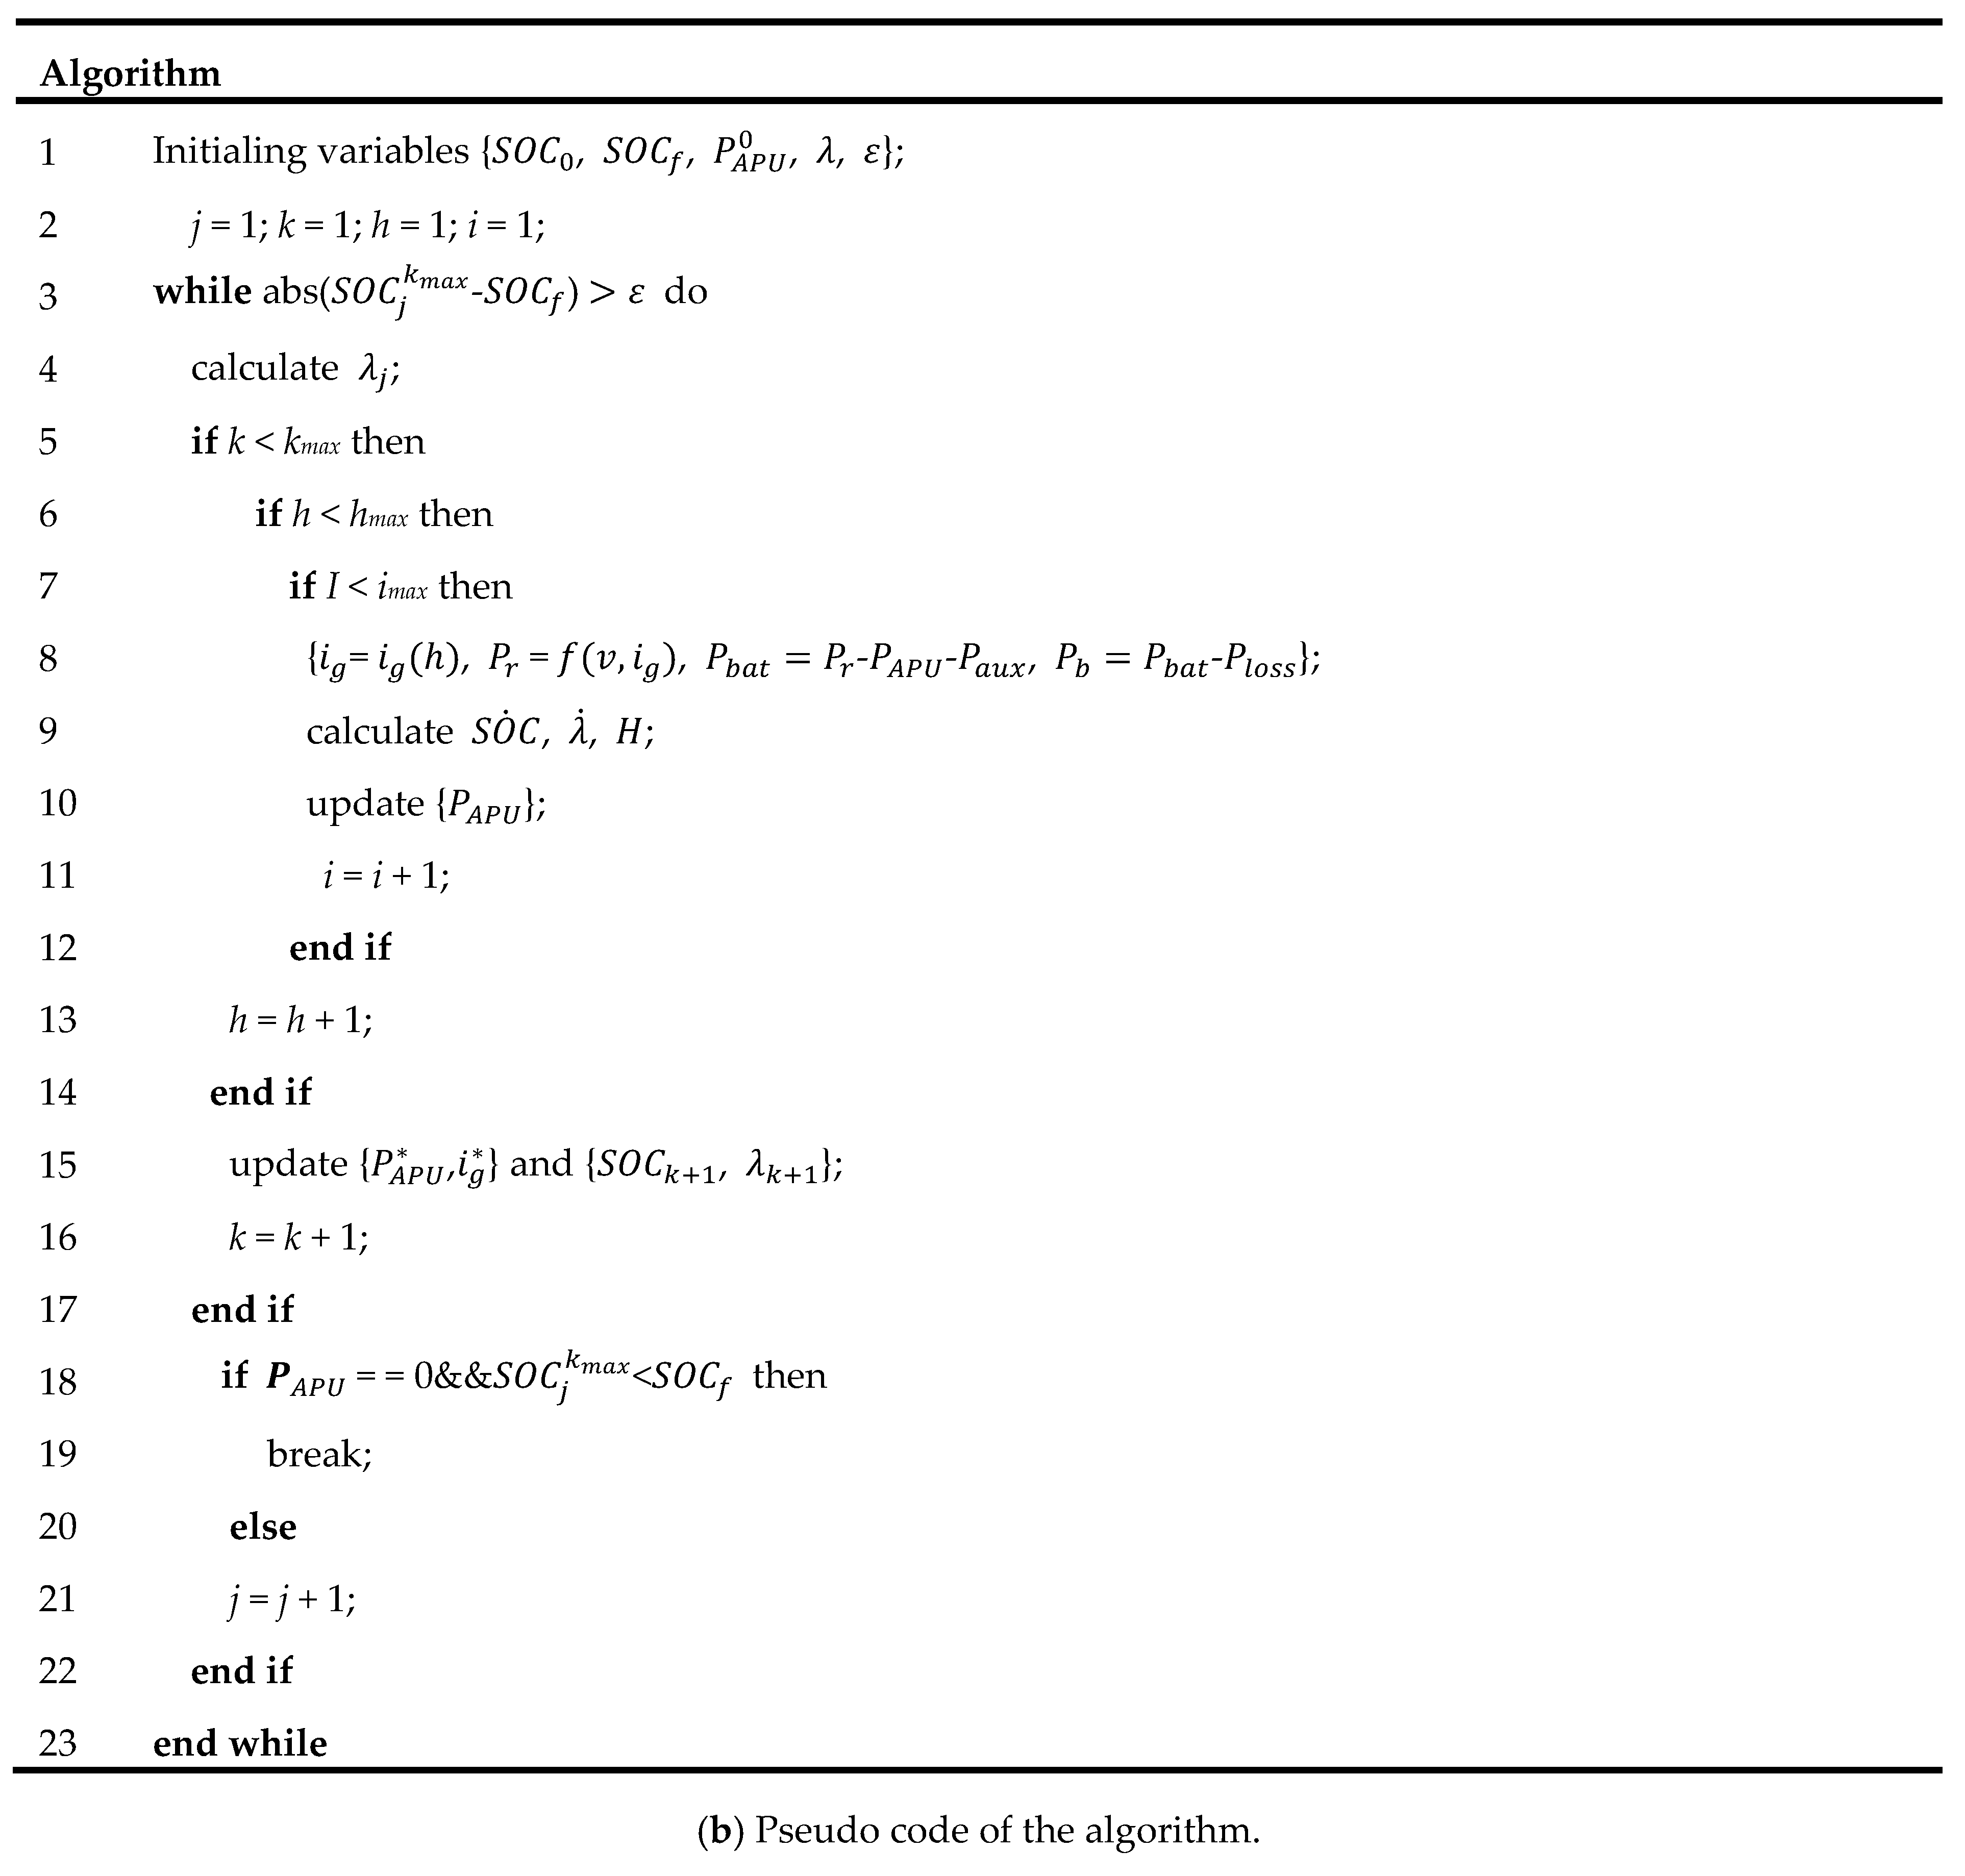
4. Integrated Control Strategy and Its Numerical Solution
4.1. Integrated Control Strategy
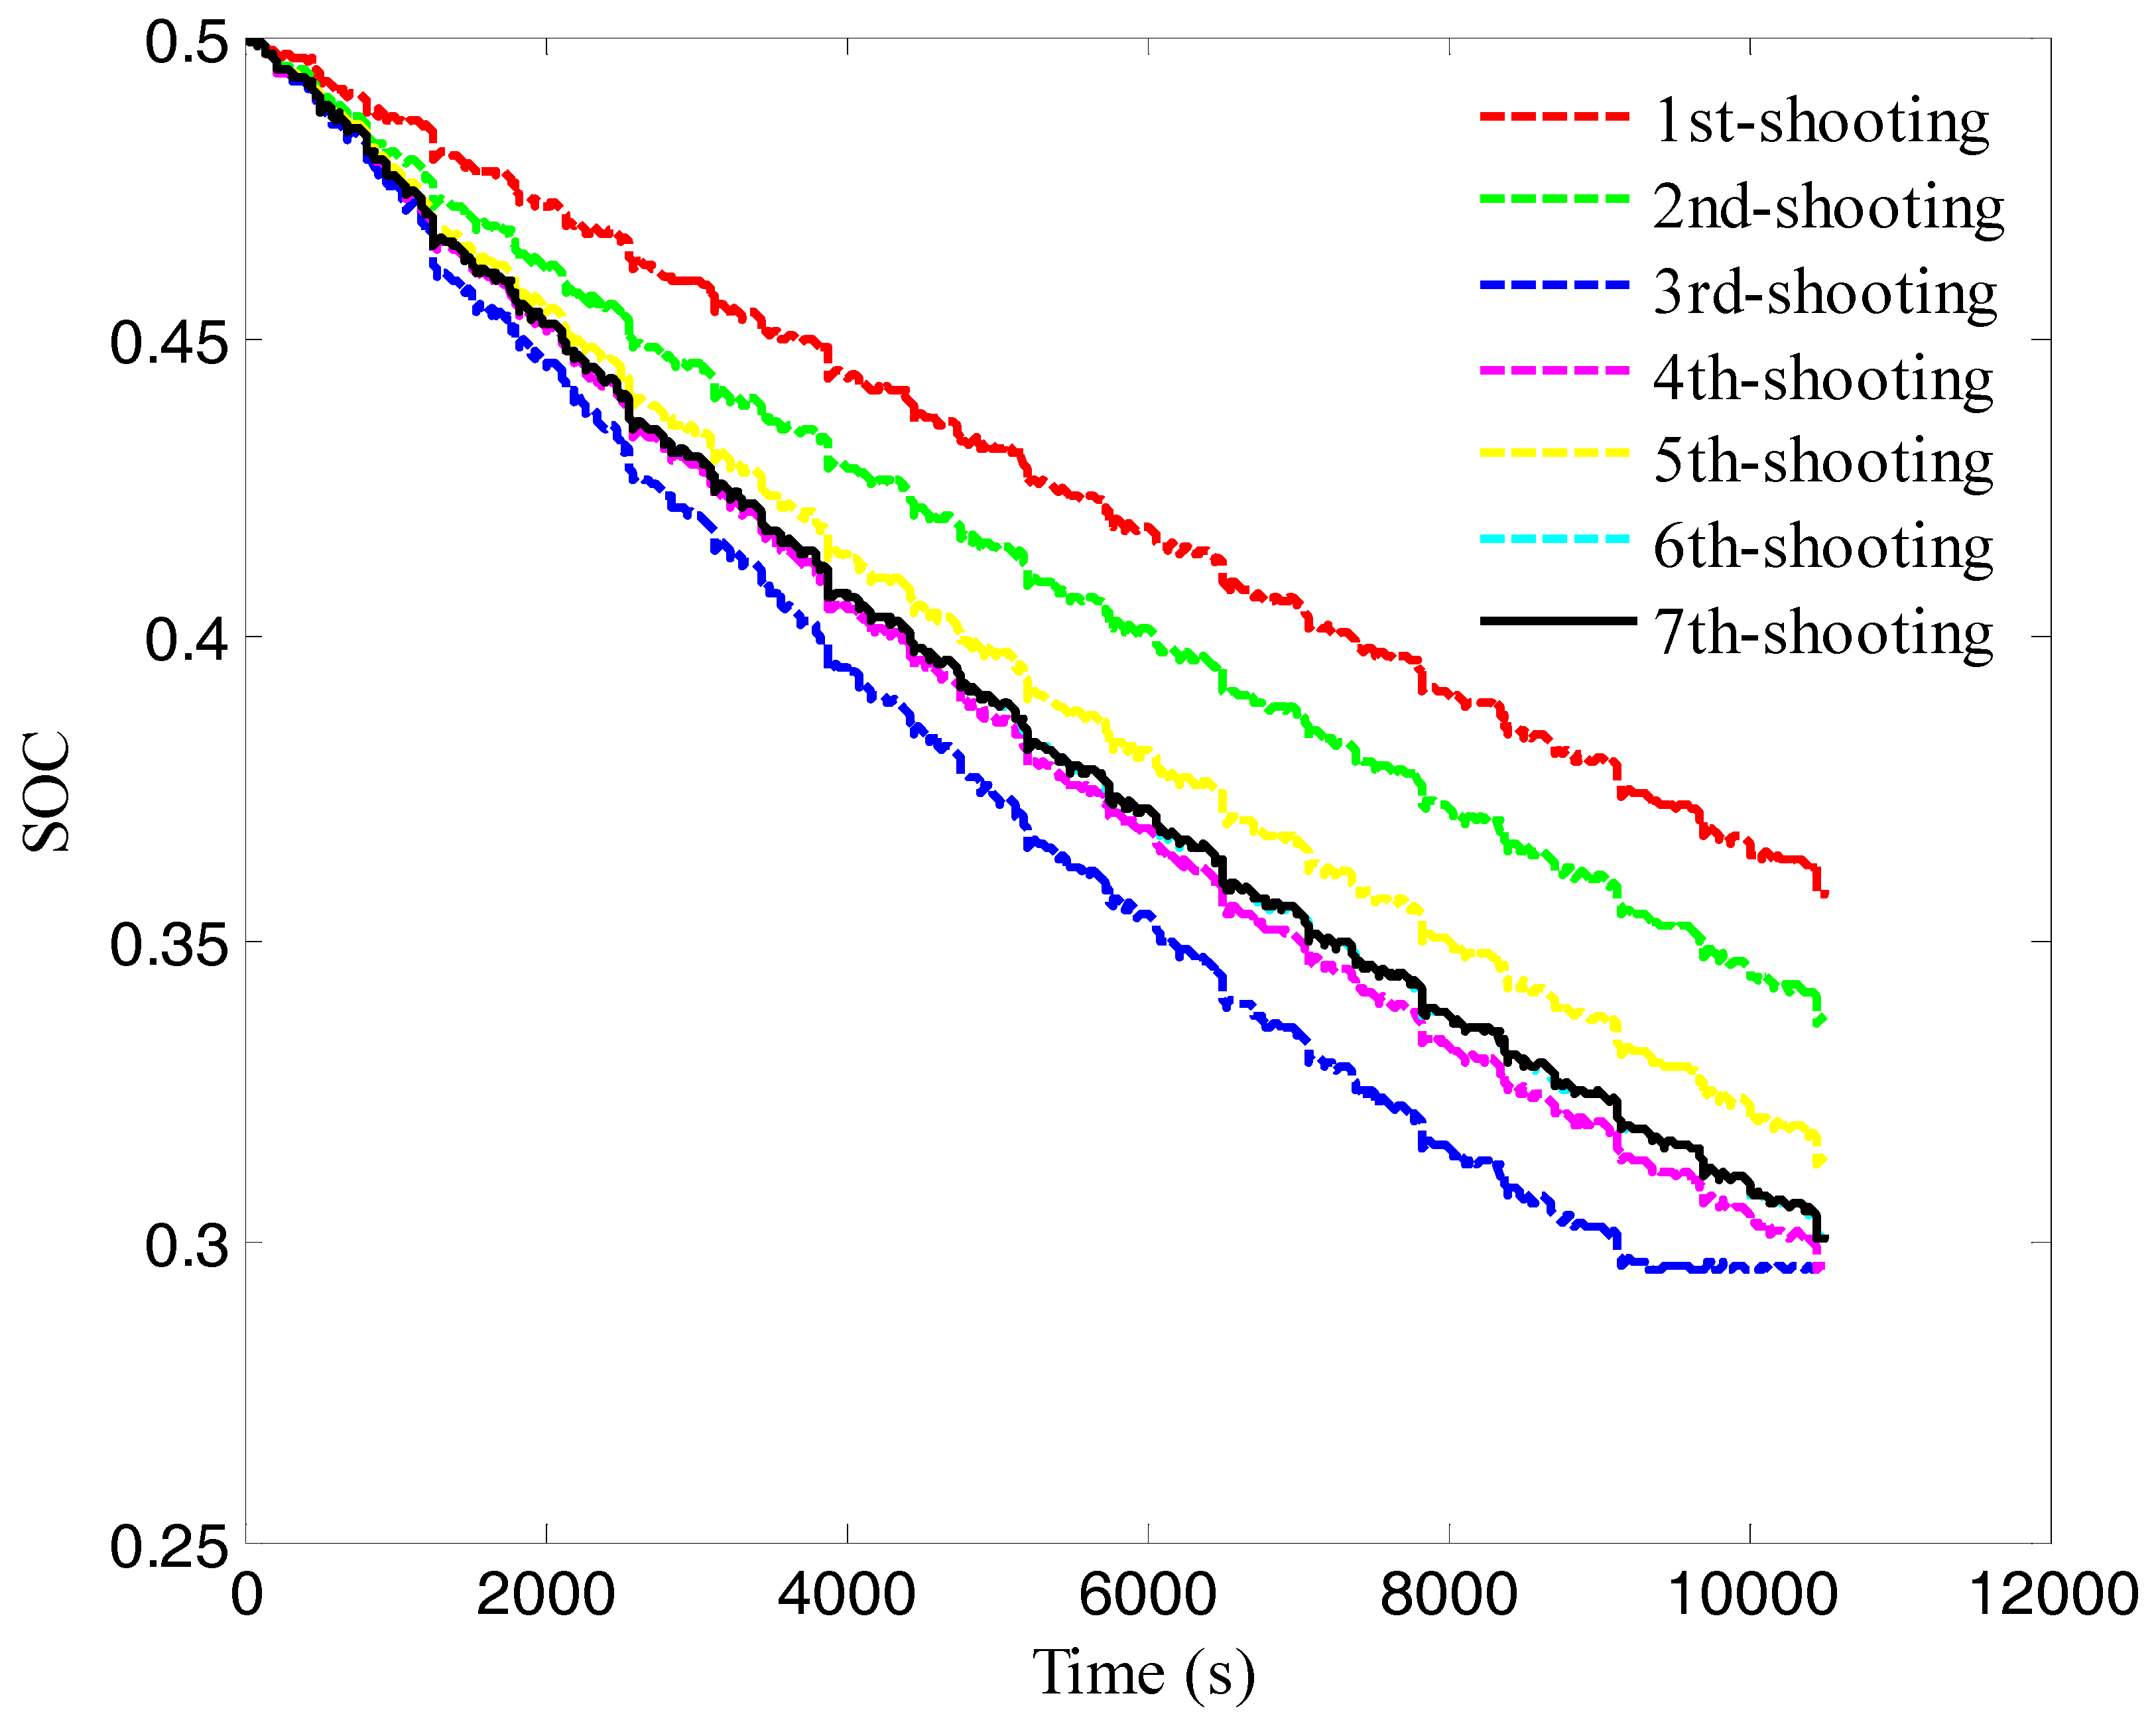
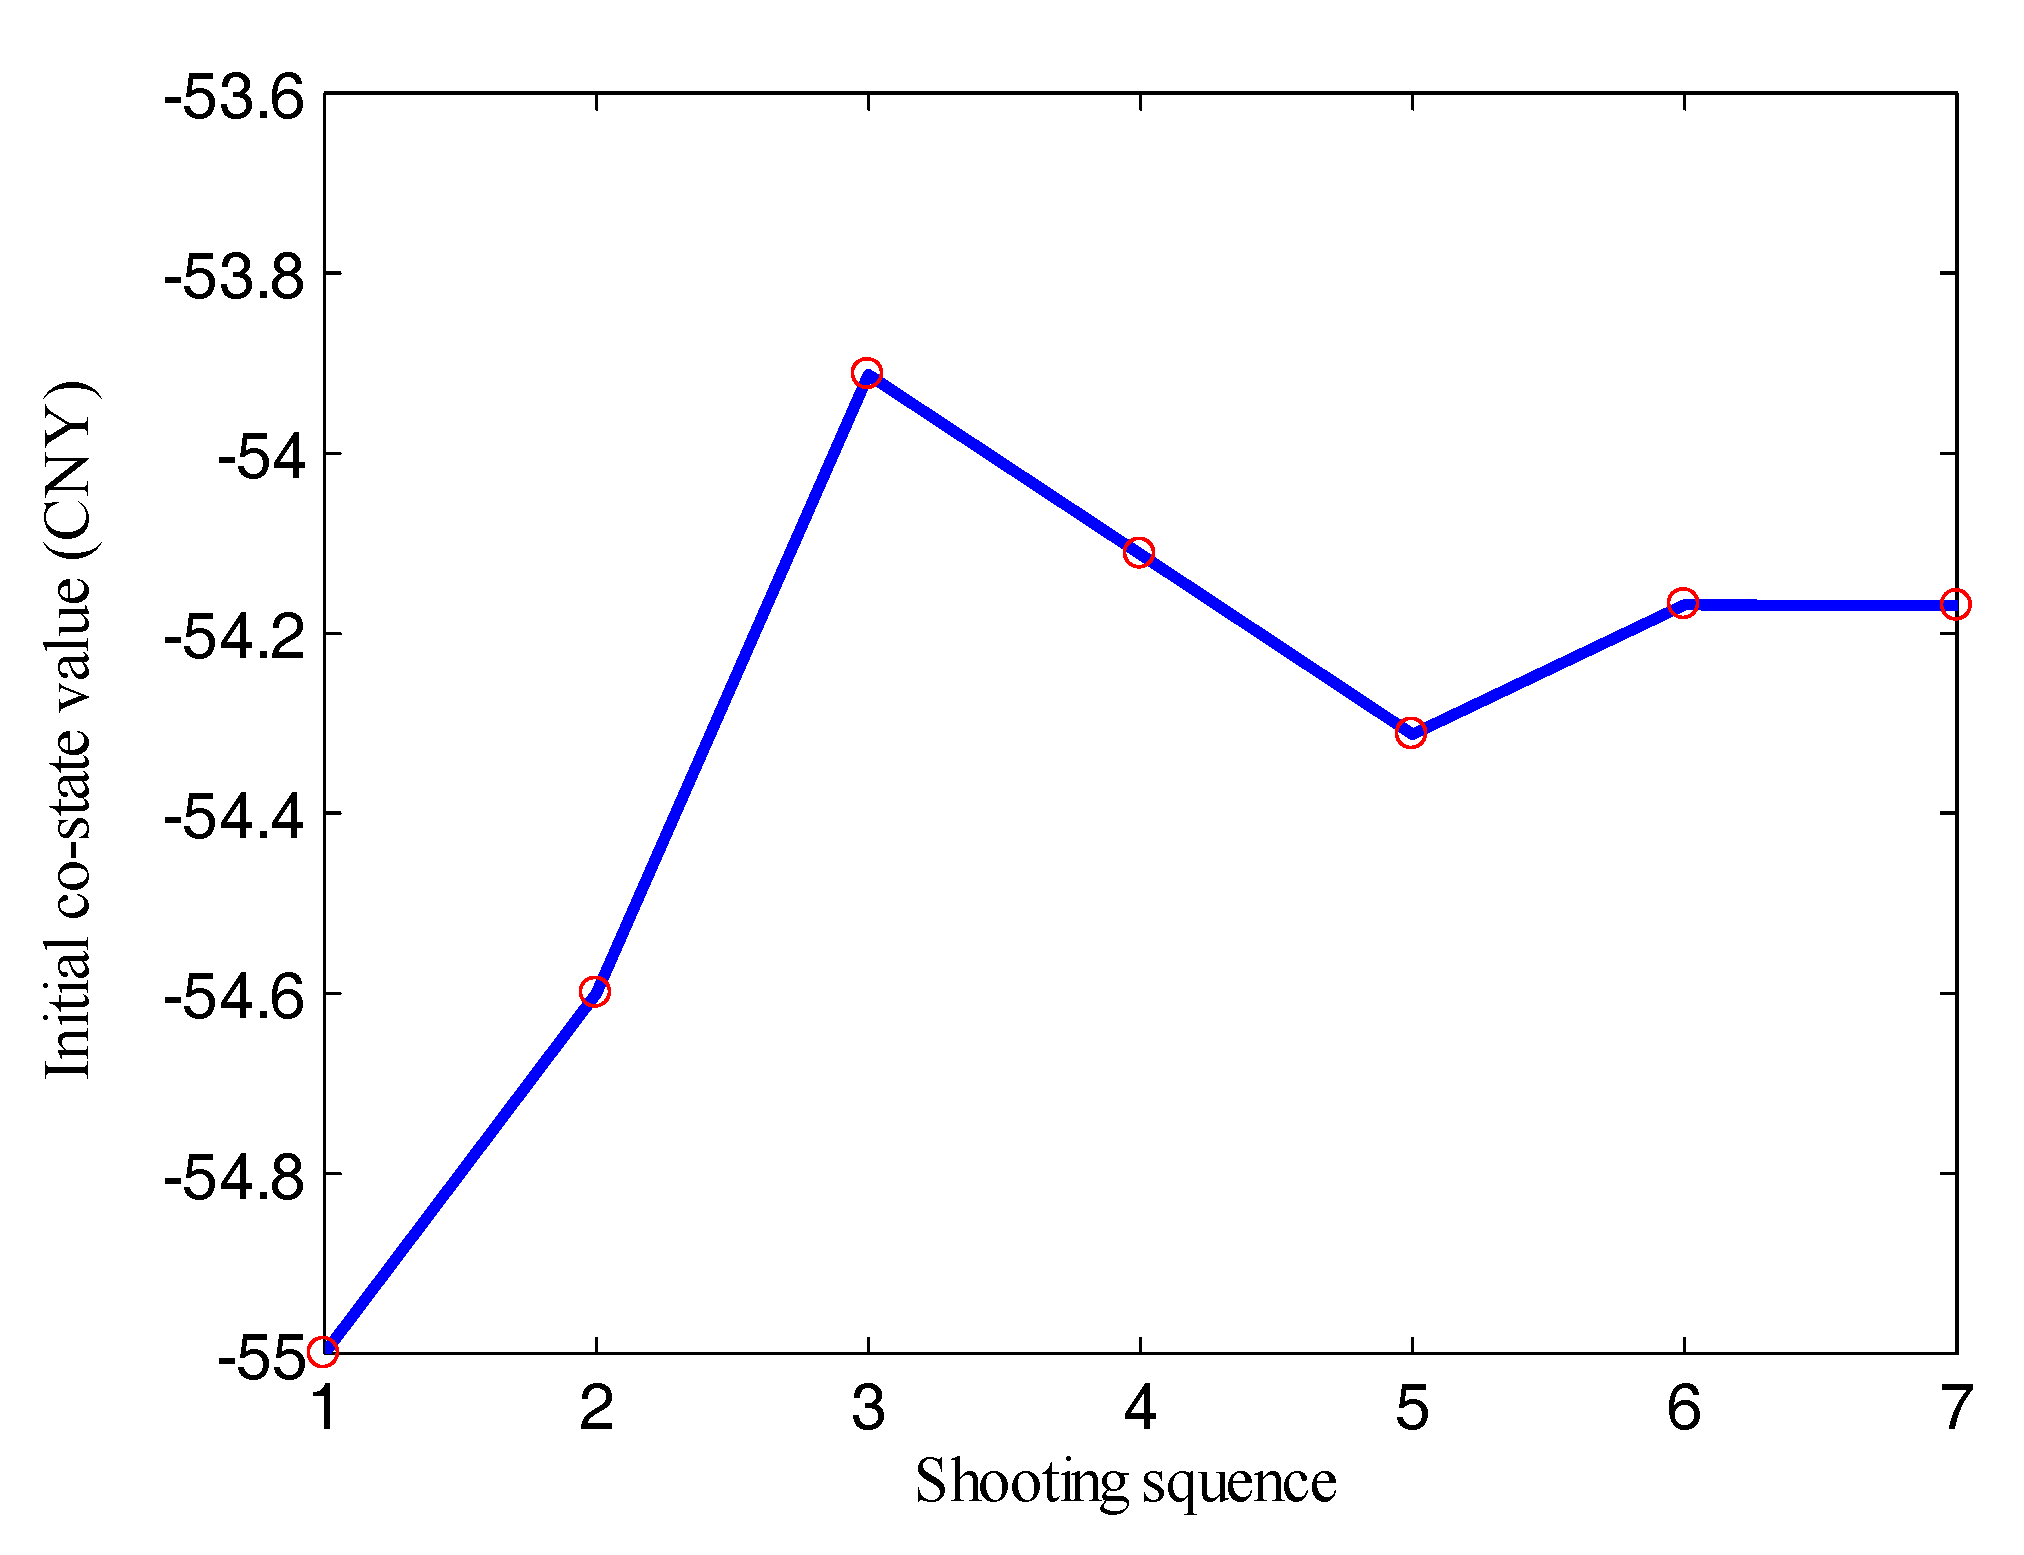
4.2. Numerical Solution
5. Results and Analysis
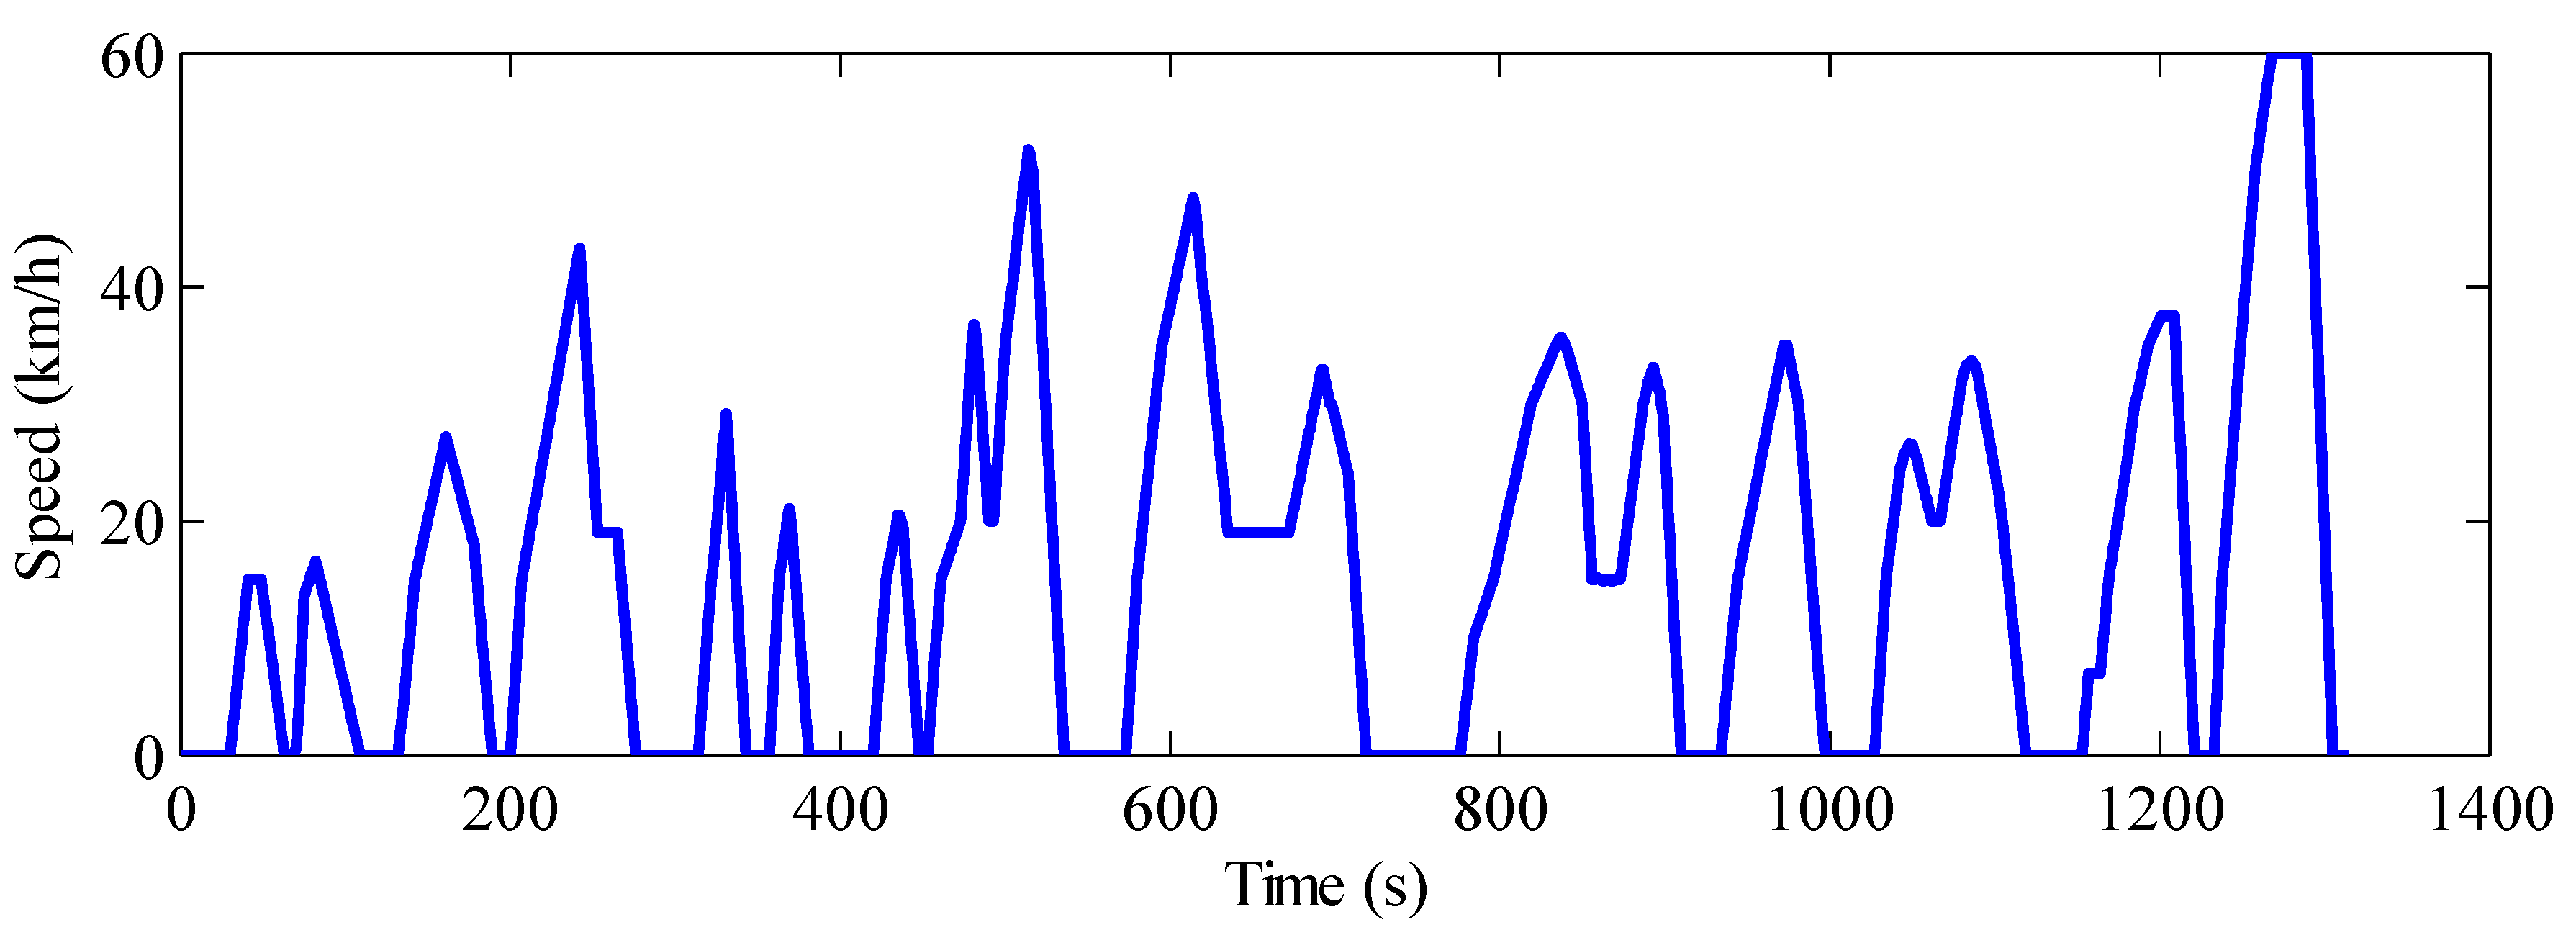
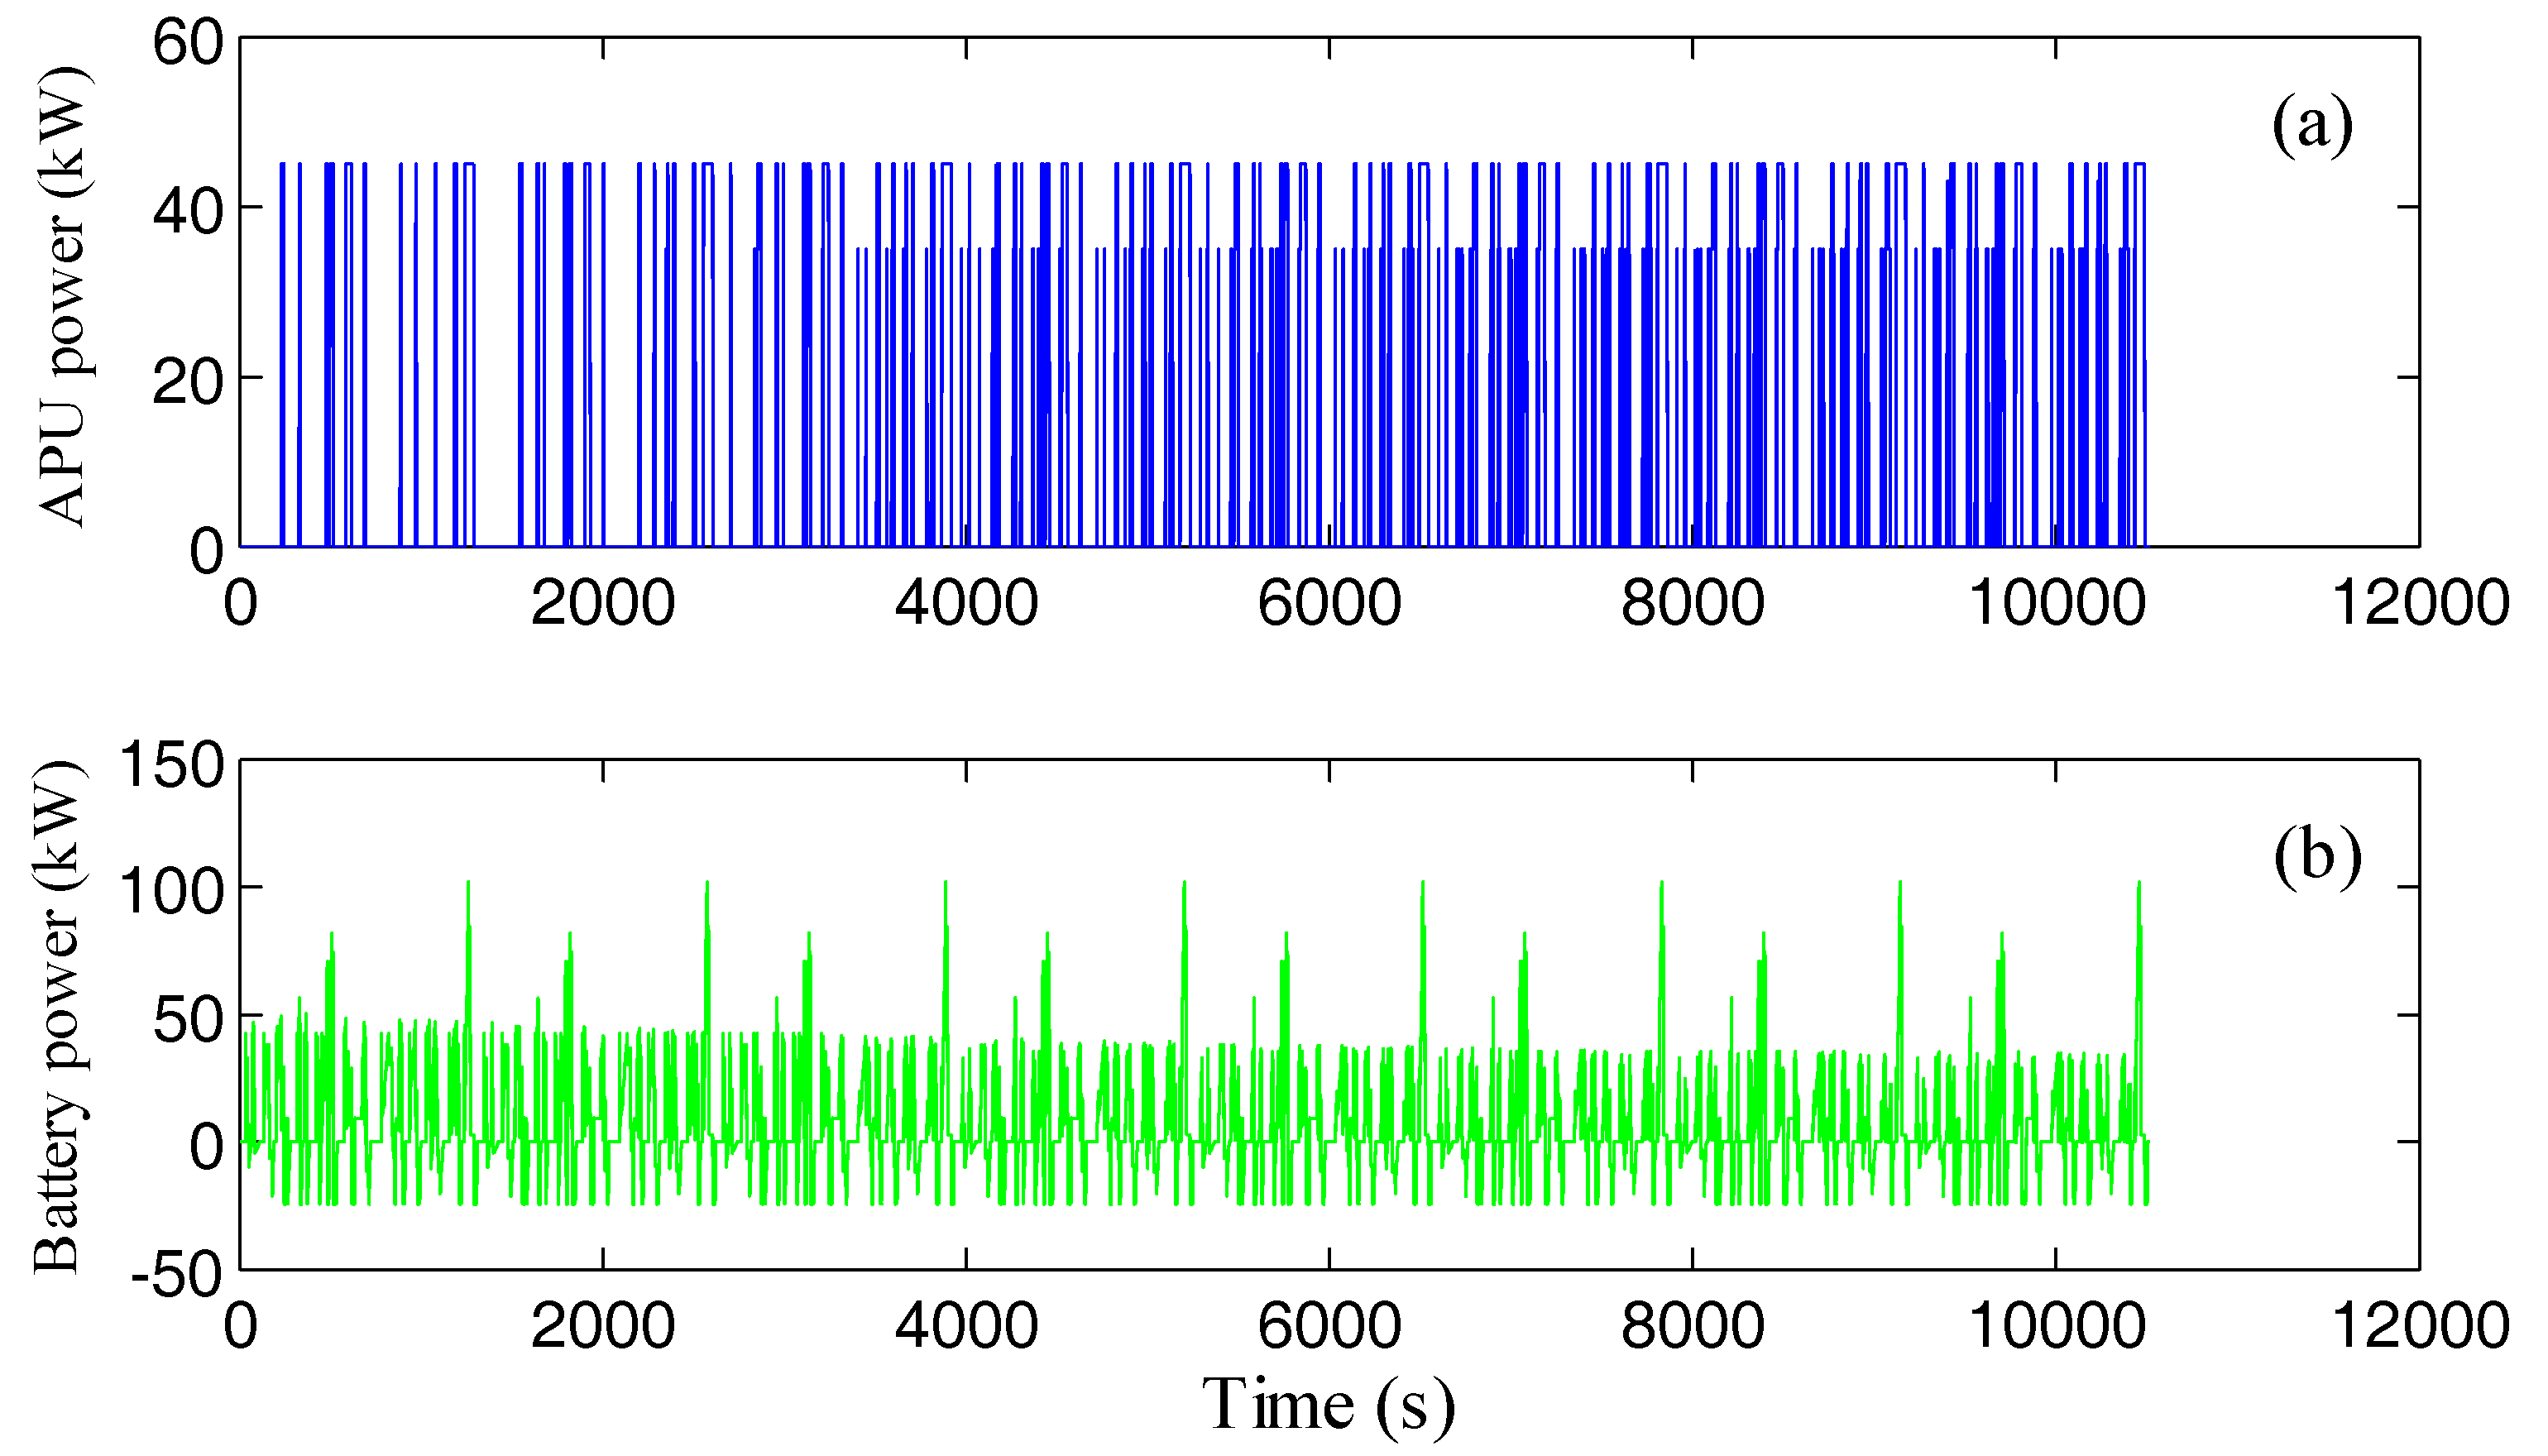
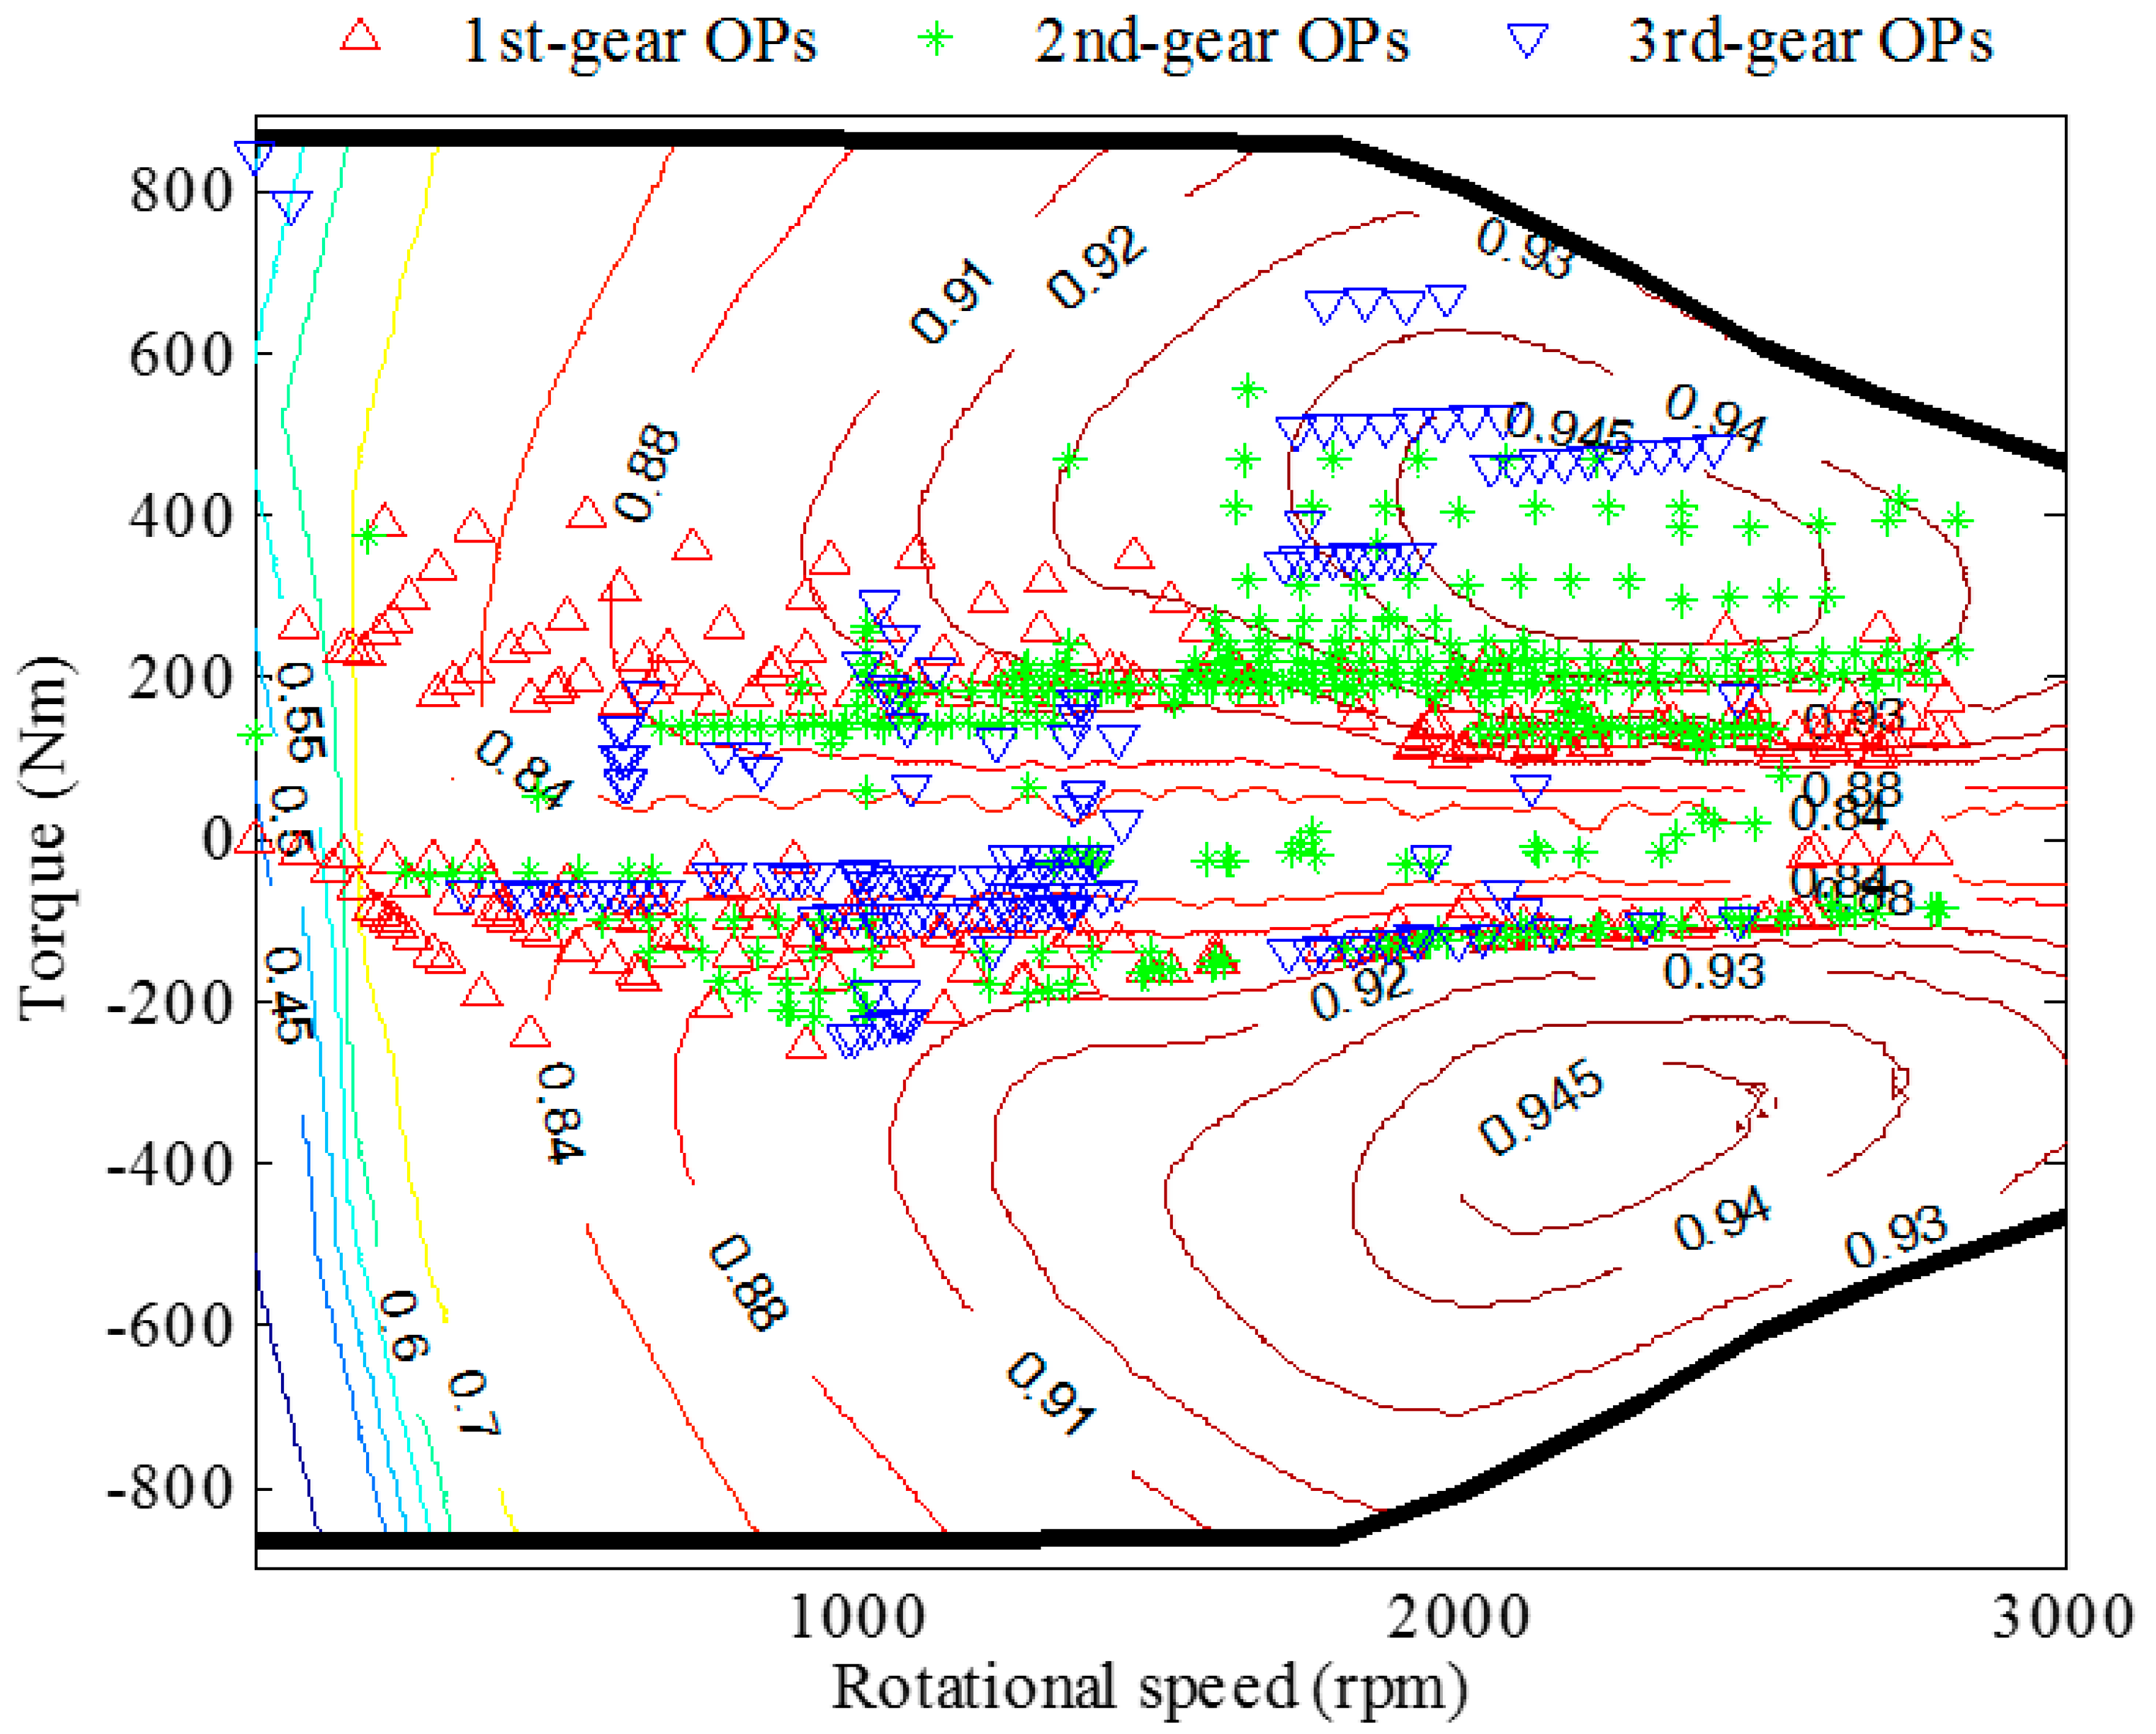
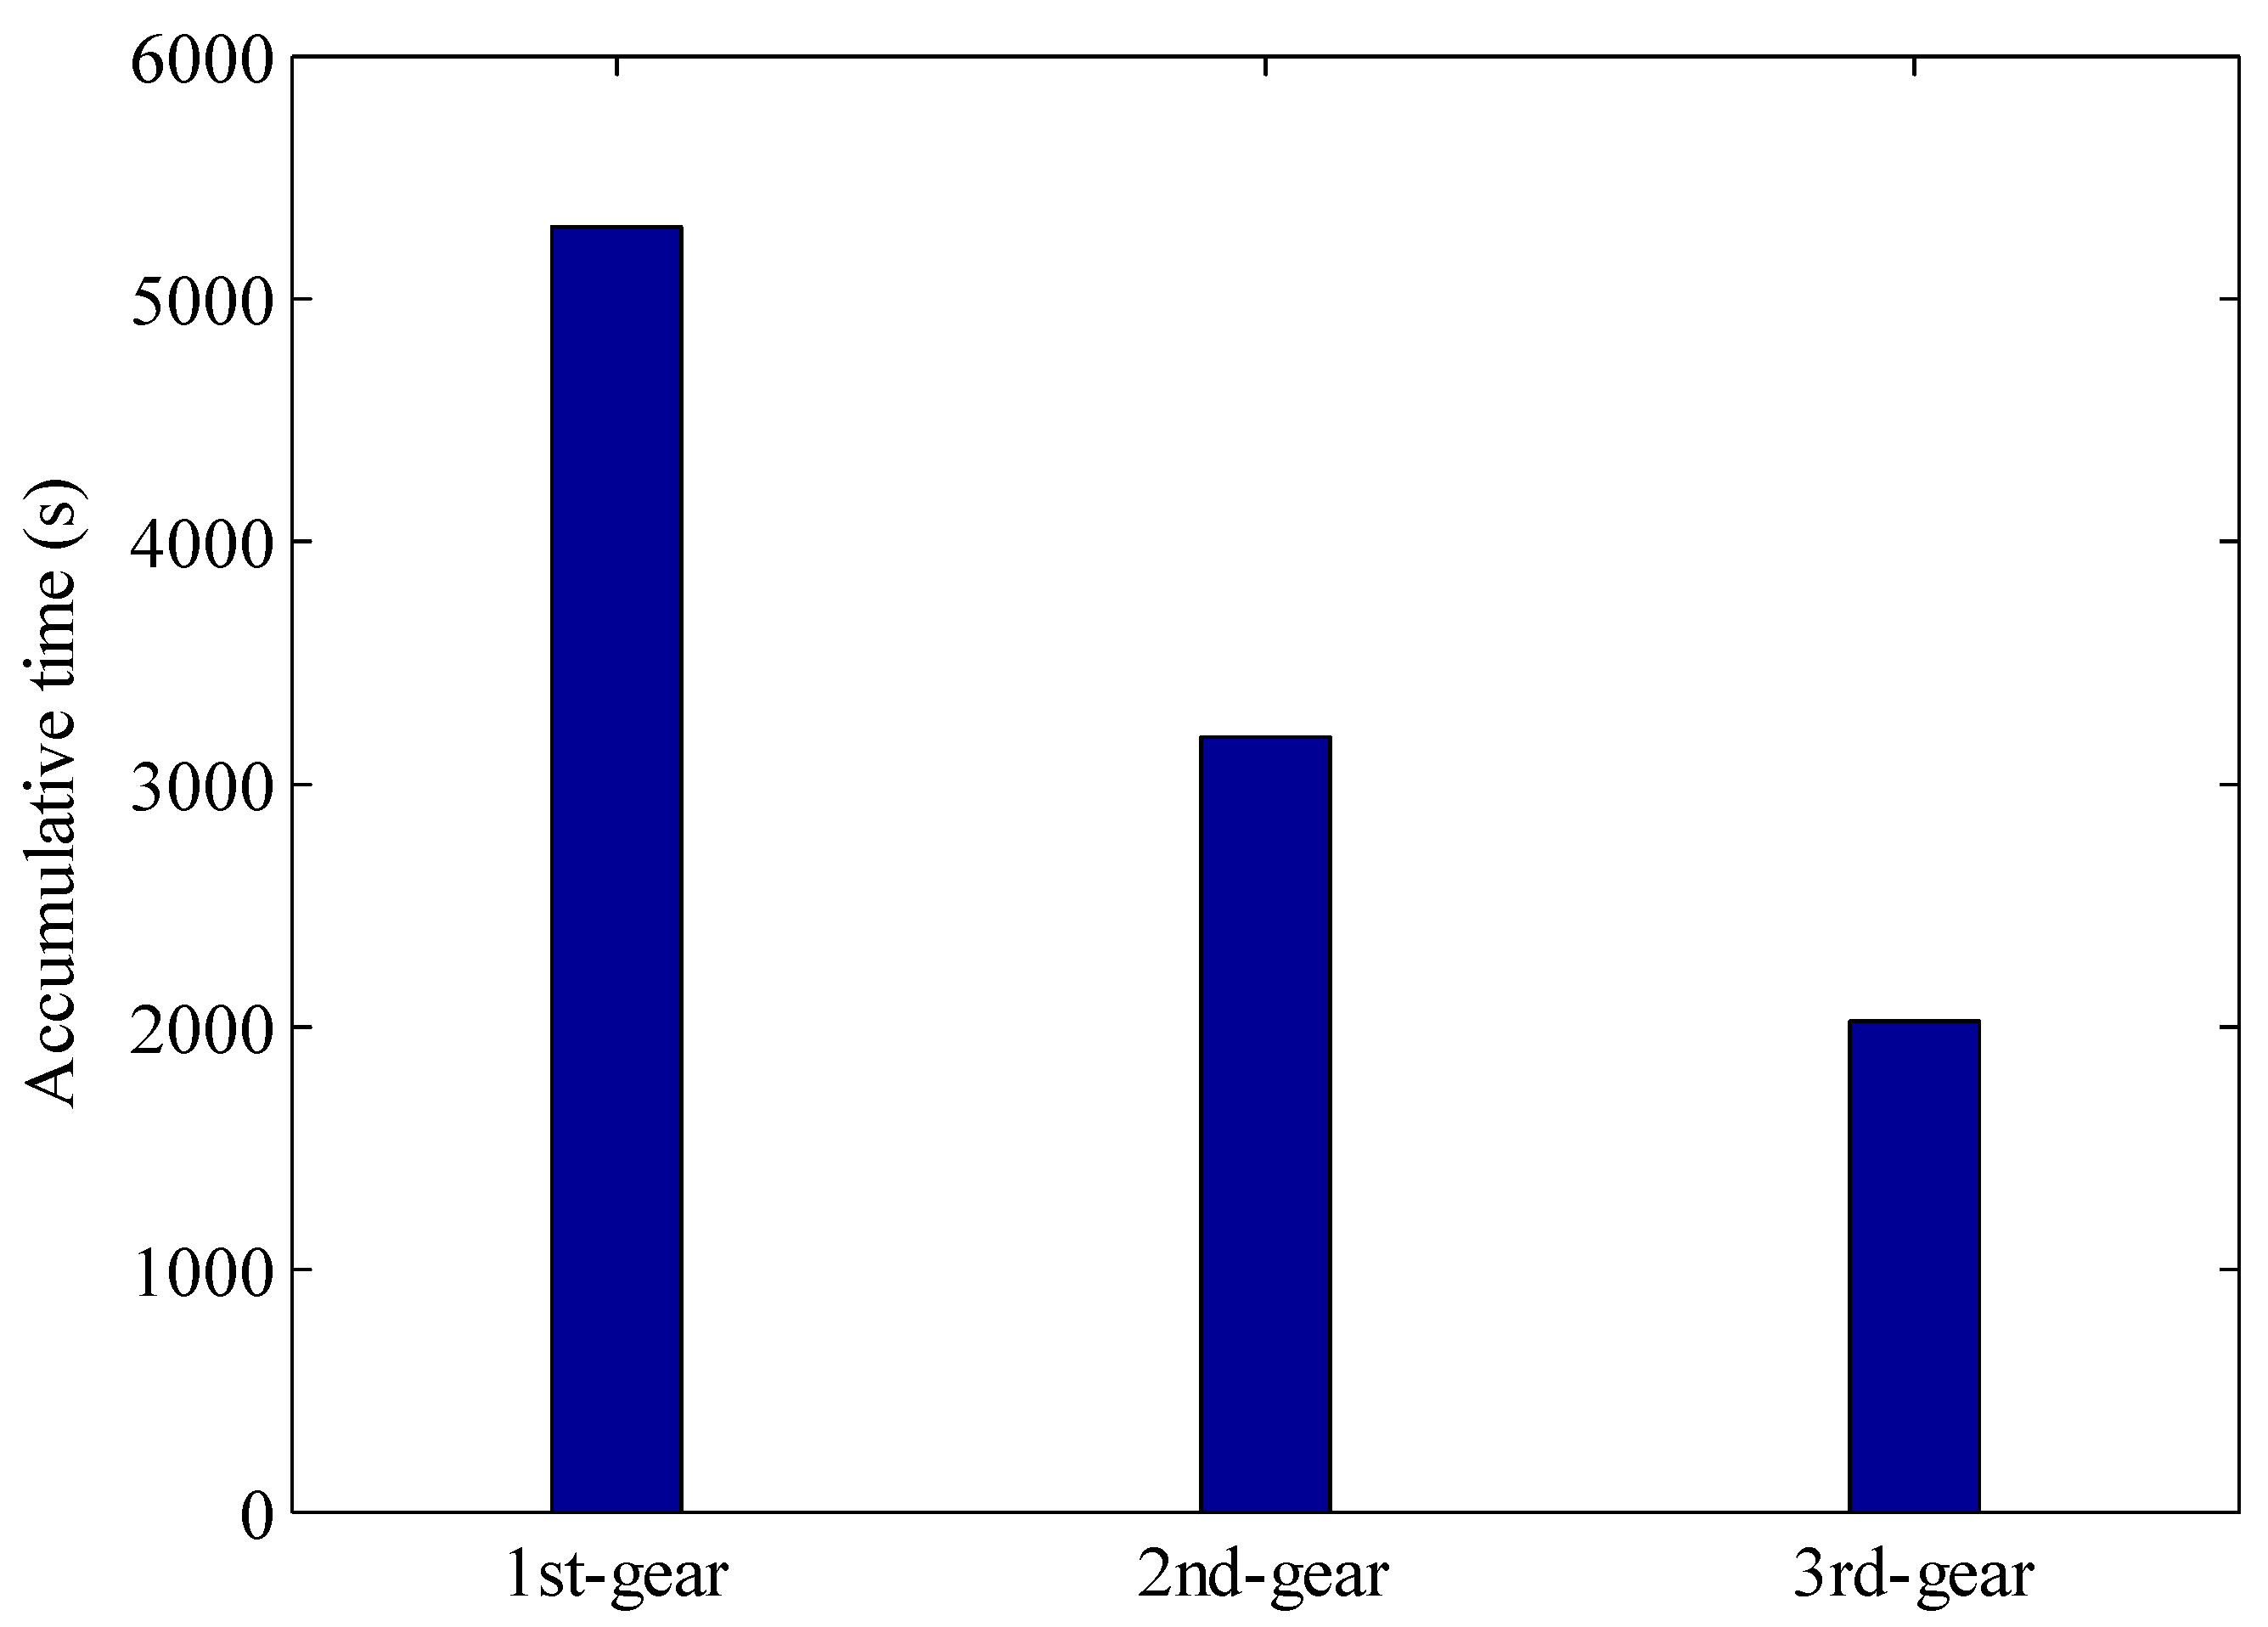
5.1. Long-Distance Driving Cycle
5.2. Short-Distance Driving Cycle
6. Comparisons with Other Existing Strategies
6.1. DP-Based Strategy
6.2. CD-CS Strategy
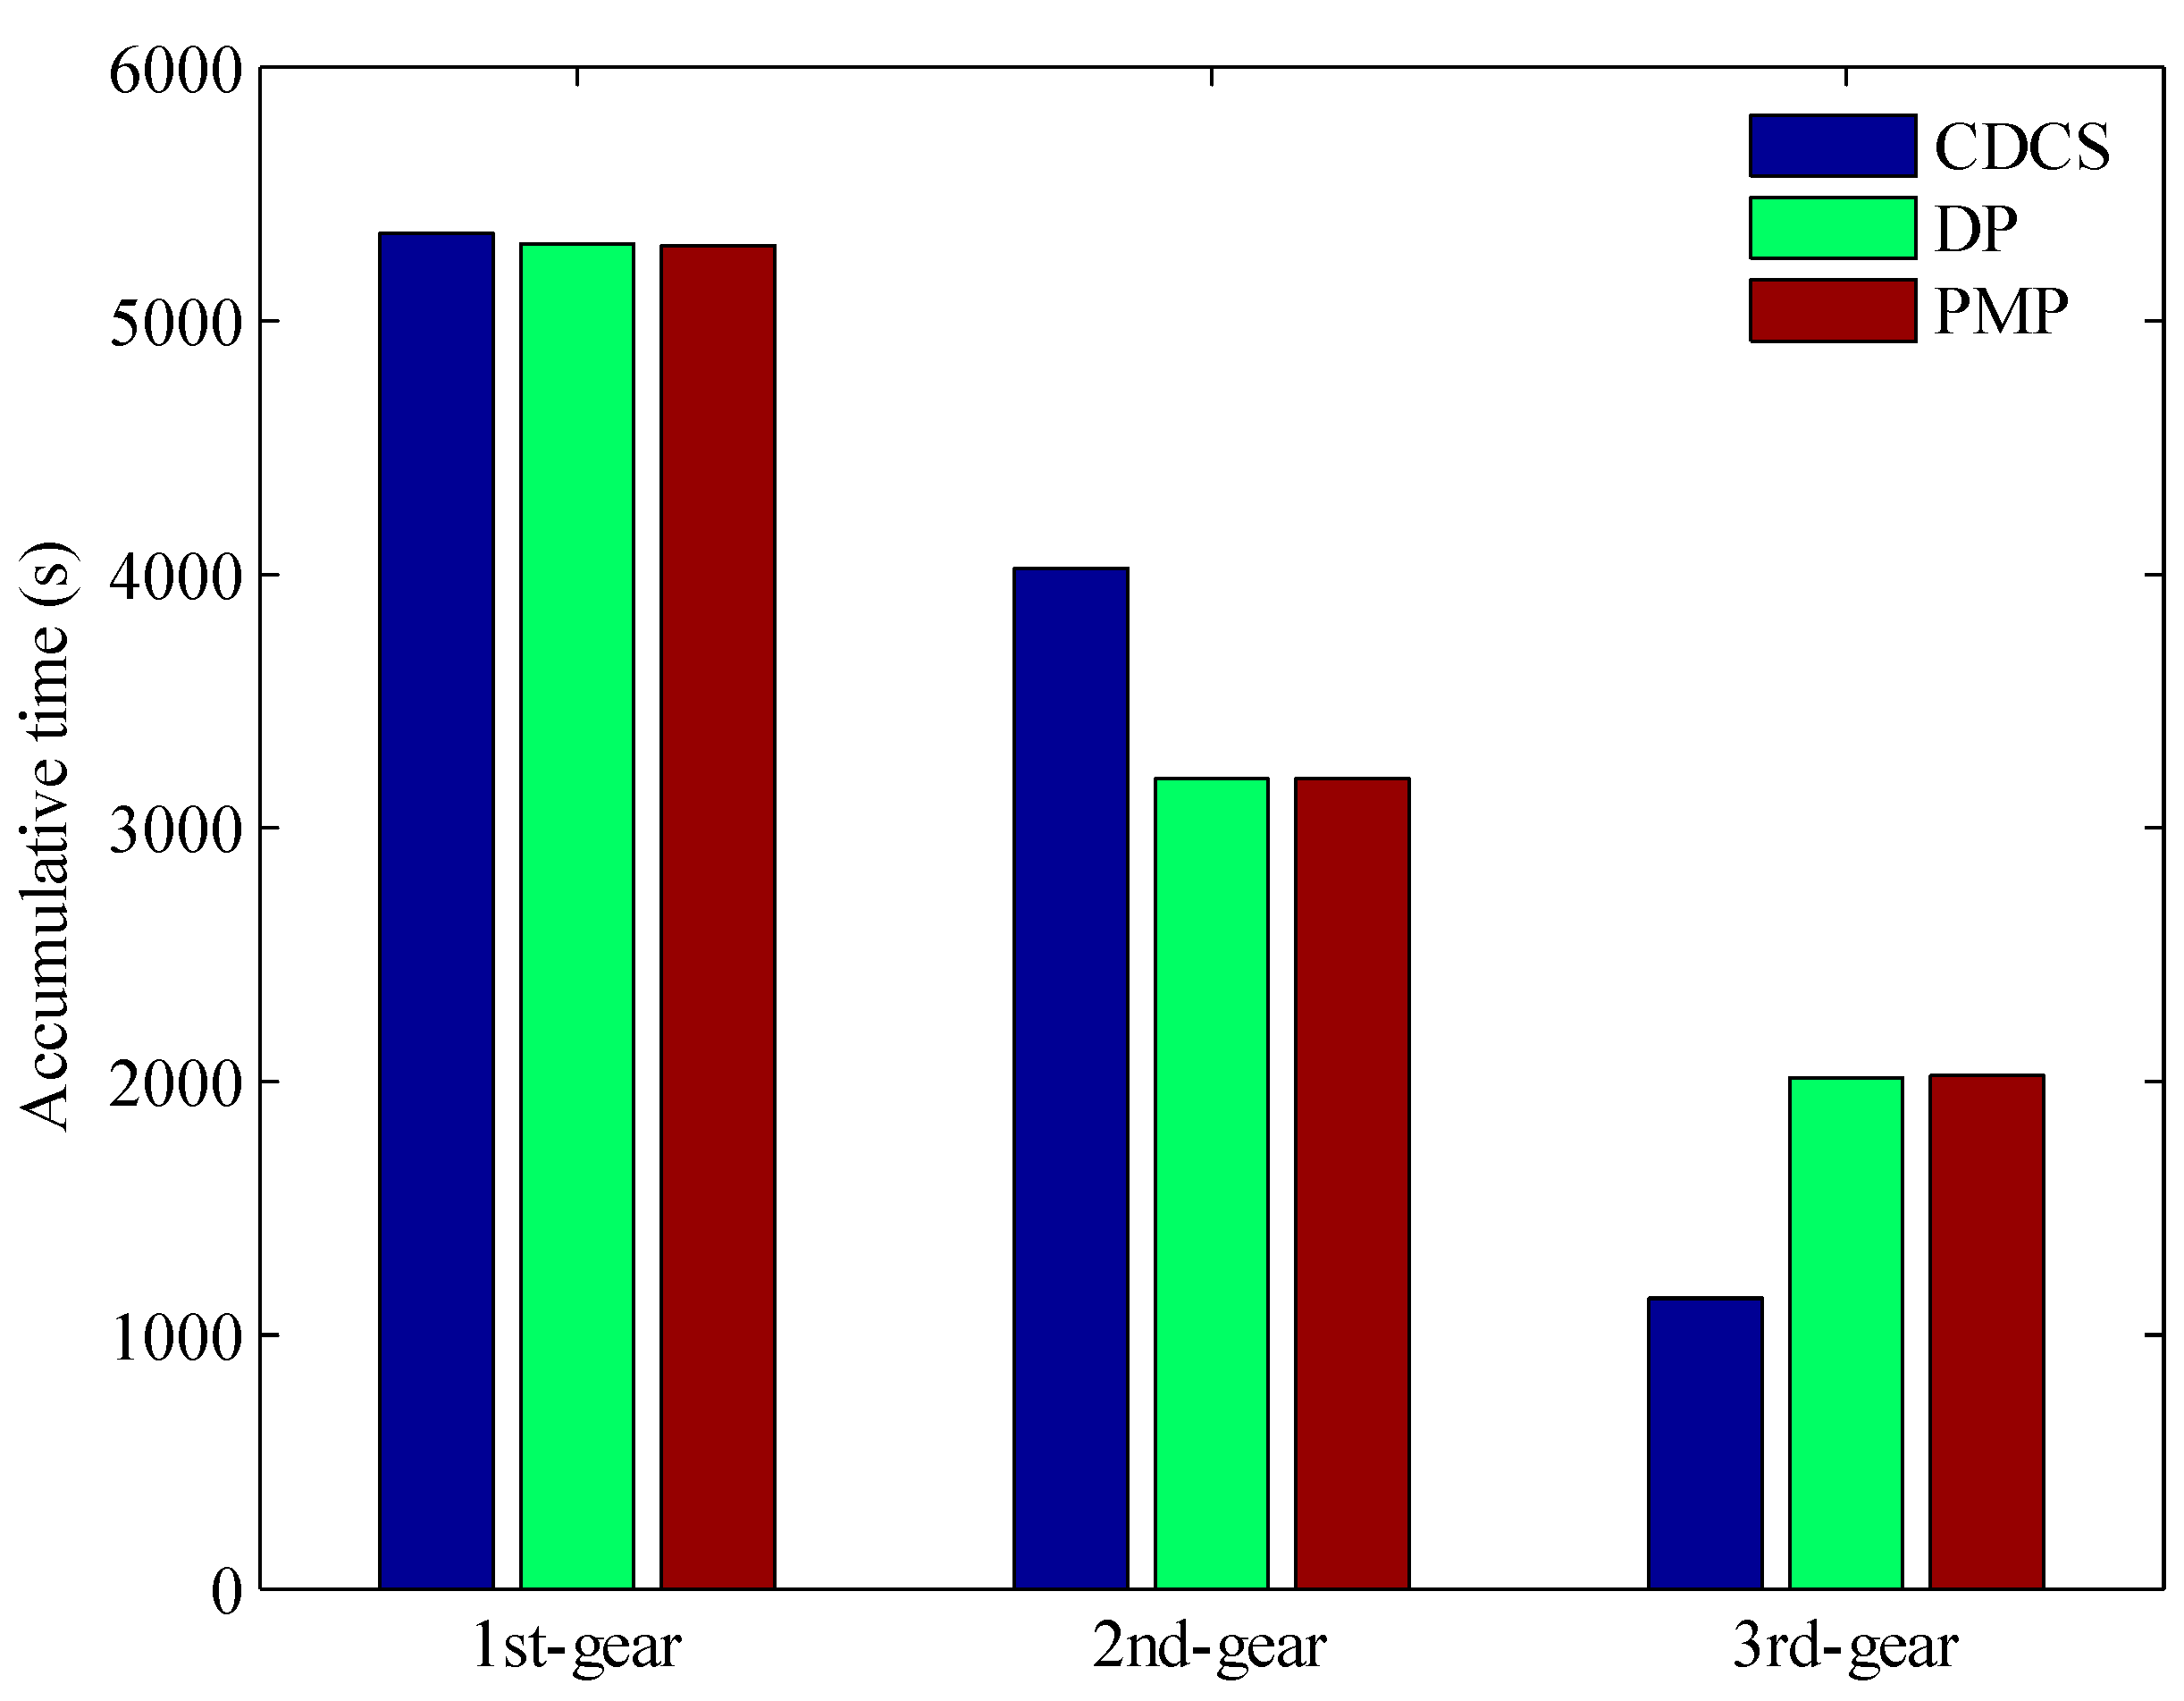
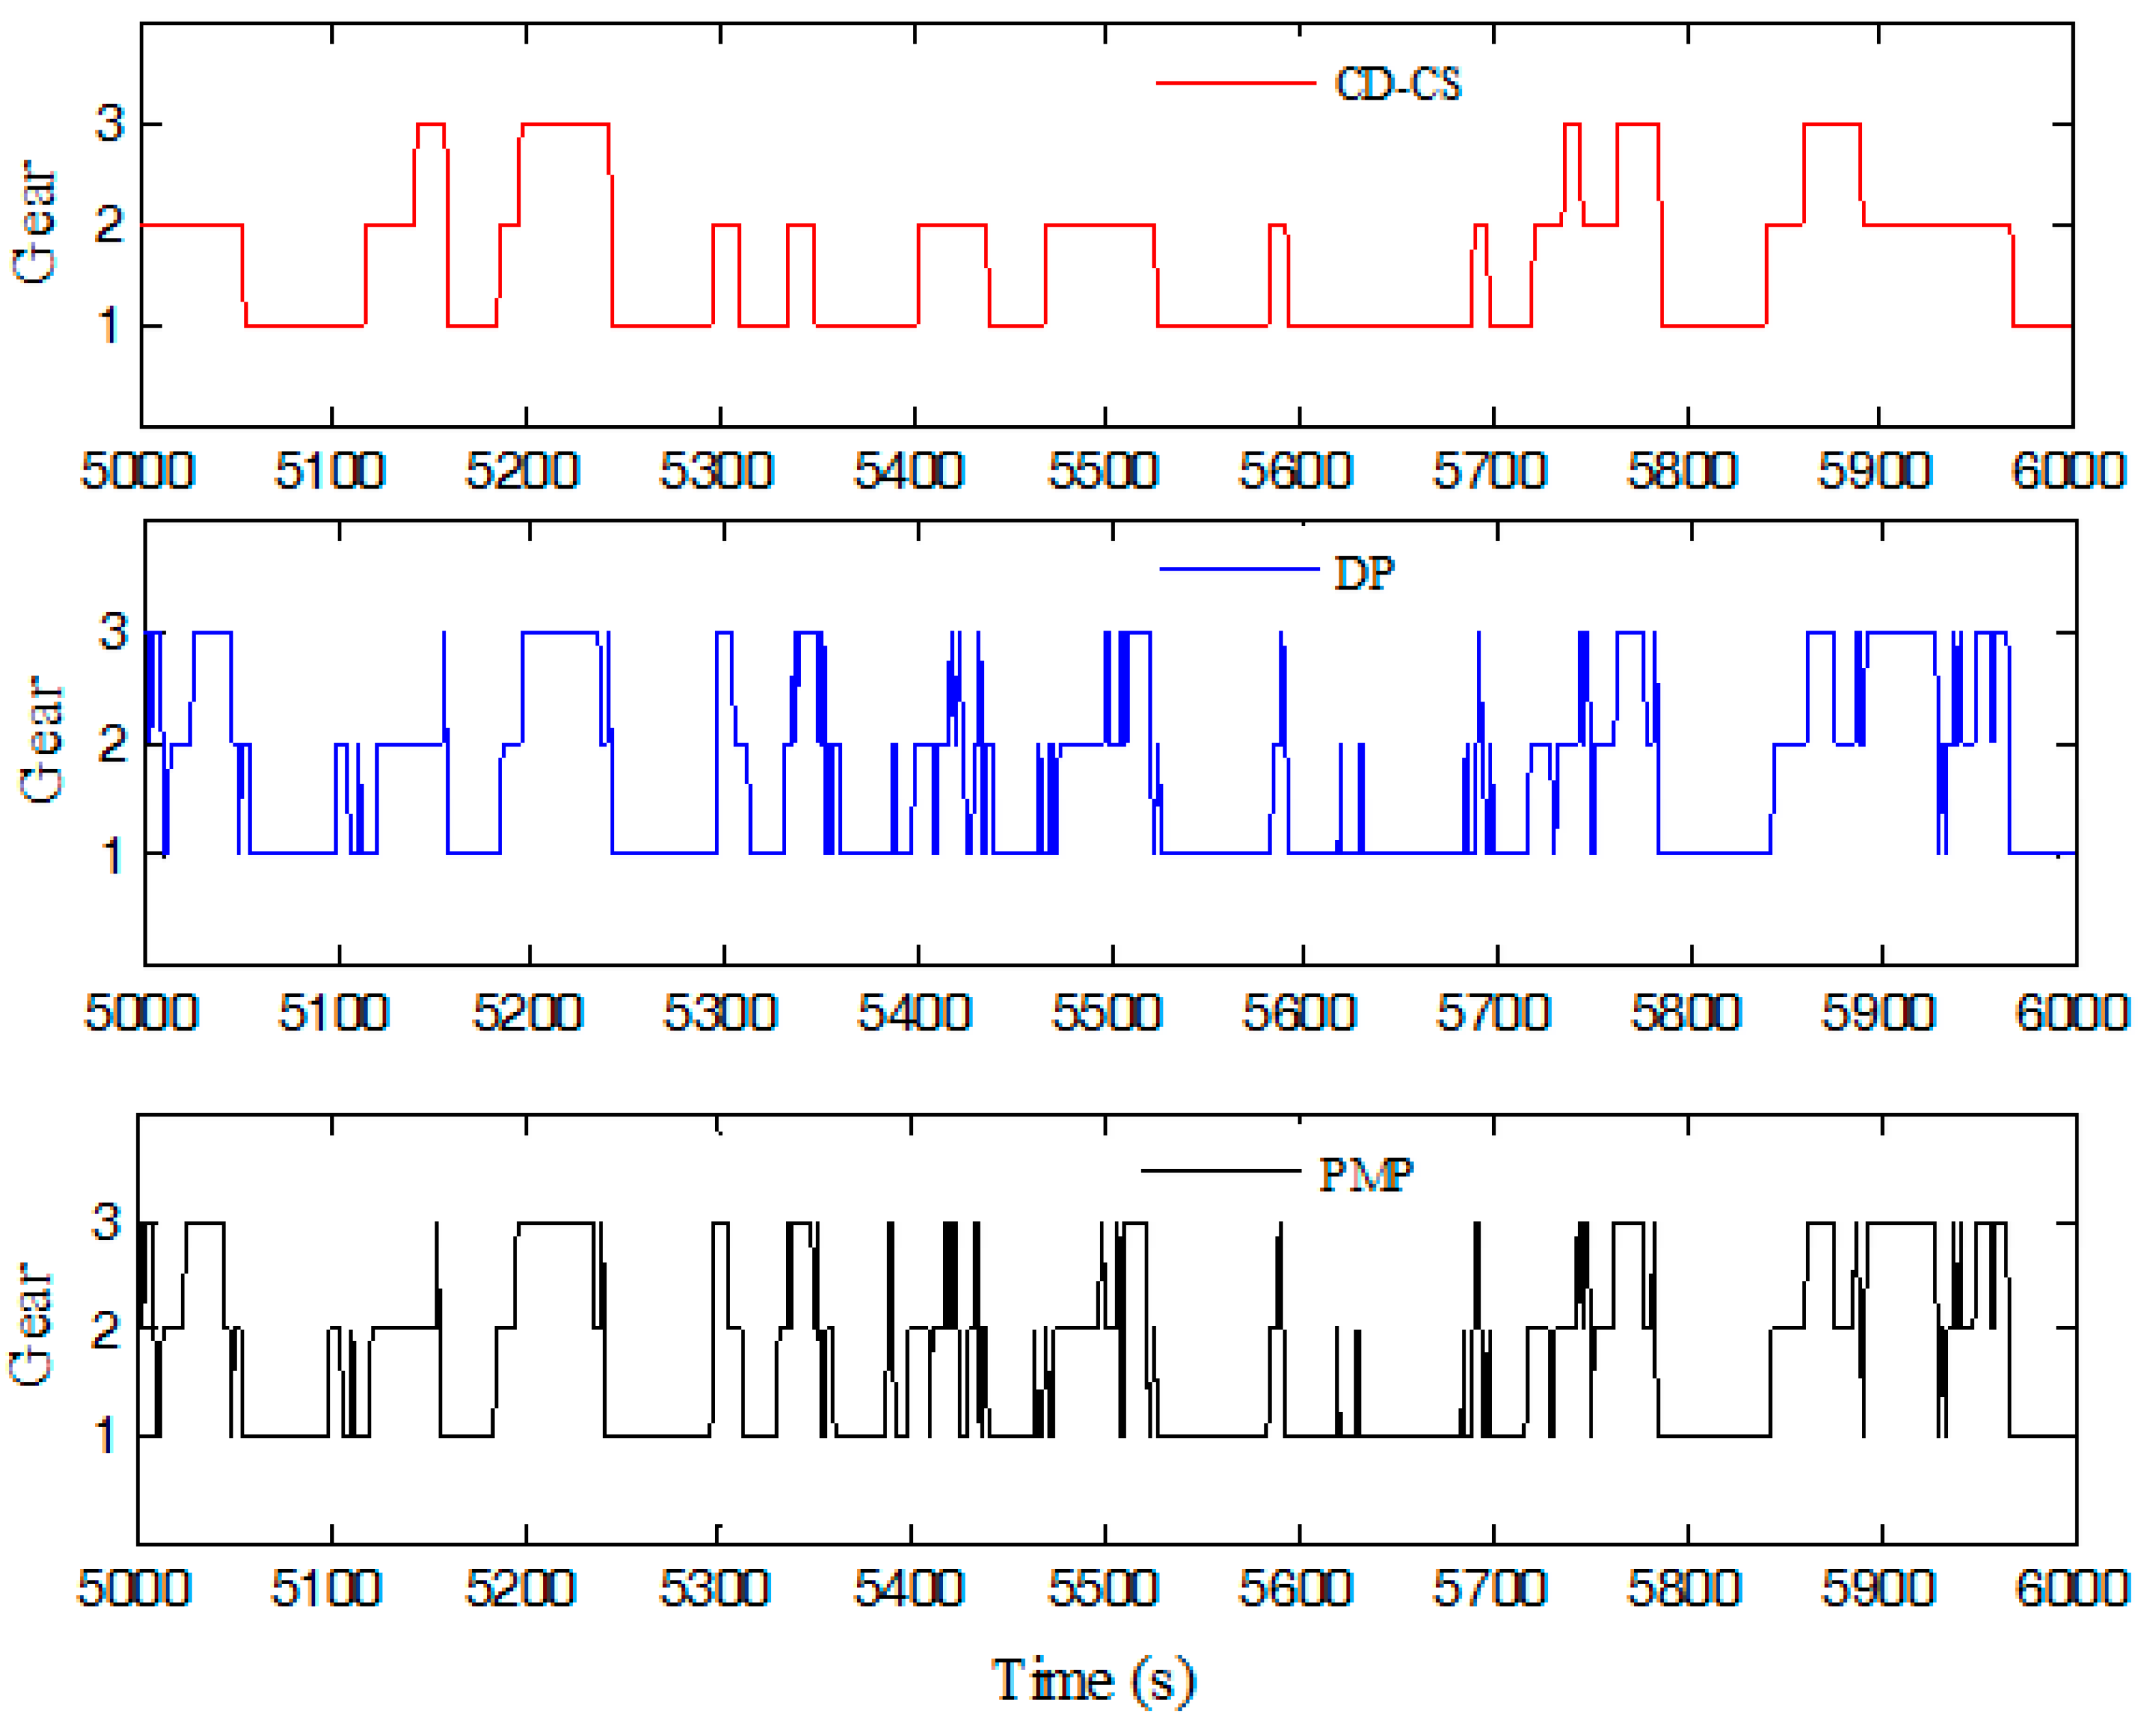
6.3. Results
7. Conclusions
Author Contributions
Funding
Acknowledgments
Conflicts of Interest
References
- Martinez, C.M.; Hu, X.; Cao, D.; Velenis, E.; Gao, B.; Wellers, M. Energy management in plug-in hybrid electric vehicles: Recent progress and a connected vehicles perspective. IEEE Trans. Veh. Technol. 2017, 66, 4534–4549. [Google Scholar] [CrossRef]
- Hu, X.; Zou, Y.; Yang, Y. Greener plug-in hybrid electric vehicles incorporating renewable energy and rapid system optimization. Energy 2016, 111, 971–980. [Google Scholar] [CrossRef]
- Ghanaatian, M.; Radan, A. Application and simulation of dual-mechanical-port machine in hybrid electric vehicles. Int. Trans. Electr. Energy Syst. 2015, 25, 1083–1099. [Google Scholar] [CrossRef]
- Hu, X.; Martinez, C.M.; Yang, Y. Charging, power management, and battery degradation mitigation in plug-in hybrid electric vehicles: A unified cost-optimal approach. Mech. Syst. Signal Process. 2017, 87, 4–16. [Google Scholar] [CrossRef]
- Torres, J.L.; Gonzalez, R.; Gimenez, A.; Lopez, J. Energy management strategy for plug-in hybrid electric vehicles—A comparative study. Appl. Energy 2014, 113, 816–824. [Google Scholar] [CrossRef]
- Gonder, J.; Markel, T. Energy Management Strategies for Plug-in Hybrid Electric Vehicles. SAE Technical Paper, No. 2007-01-0290. 2007. Available online: https://www.sae.org/publications/technical-papers/content/2007-01-0290/ (accessed on 11 October 2018).
- Schouten, N.J.; Salman, M.A.; Kheir, N.A. Fuzzy logic control for parallel hybrid vehicles. IEEE Trans. Control Syst. Technol. 2002, 10, 460–468. [Google Scholar] [CrossRef]
- Hu, X.; Murgovski, N.; Johannesson, L.; Egardt, B. Energy efficiency analysis of a series plug-in hybrid electric bus with different energy management strategies and battery sizes. Appl. Energy 2013, 111, 1001–1009. [Google Scholar] [CrossRef]
- Xie, S.; Li, H.; Xin, Z.; Liu, T.; Wei, L. A Pontryagin minimum principle-based adaptive equivalent consumption minimum strategy for a plug-in hybrid electric bus on a fixed route. Energies 2017, 10, 1379. [Google Scholar] [CrossRef]
- Liu, T.; Hu, X.; Li, S.E.; Cao, D. Reinforcement learning optimized look-ahead energy management of a parallel hybrid electric vehicle. IEEE/ASME Trans. Mechatron. 2017, 22, 1497–1507. [Google Scholar] [CrossRef]
- Xie, S.; Hu, X.; Qi, S.; Lang, K. An artificial neural network-enhanced energy management strategy for plug-in hybrid electric vehicles. Energy 2018, 63, 837–848. [Google Scholar] [CrossRef]
- Pisu, P.; Rizzoni, G. A comparative study of supervisory control strategies for hybrid electric vehicles. IEEE Trans. Control Syst. Technol. 2007, 15, 506–518. [Google Scholar] [CrossRef]
- Zou, Y.; Liu, T.; Sun, F.; Peng, H. Comparative study of dynamic programming and Pontryagin’s minimum principle on energy management for a parallel hybrid electric vehicle. Energies 2013, 6, 2305–2318. [Google Scholar]
- Ma, Y.; Wang, J. Integrated power management and aftertreatment system control for hybrid electric vehicles with road grade preview. IEEE Trans. Veh. Technol. 2017, 66, 10935–10945. [Google Scholar] [CrossRef]
- Sun, C.; Hu, X.; Moura, S.J.; Sun, F. Velocity Predictors for Predictive Energy Management in Hybrid Electric Vehicles. IEEE Trans. Control Syst. Technol. 2015, 23, 1197–1204. [Google Scholar]
- Moura, S.J.; Callaway, D.S.; Fathy, H.K.; Stein, J.L. Tradeoffs between battery energy capacity and stochastic optimal power management in plug-in hybrid electric vehicles. J. Power Sources 2010, 195, 2979–2988. [Google Scholar] [CrossRef]
- Borhan, H.A.; Vahidi, A. Model predictive control of a power-split hybrid electric vehicle with combined battery and ultracapacitor energy storage. In Proceedings of the American Control Conference, Baltimore, MD, USA, 30 June–2 July 2010; pp. 5031–5036. [Google Scholar]
- Xie, S.; Hu, X.; Xin, Z.; Li, L. Time-efficient stochastic model predictive energy management for a plug-in hybrid electric bus with adaptive reference state-of-charge advisory. IEEE Trans. Veh. Technol. 2018, 67, 5671–5682. [Google Scholar] [CrossRef]
- Kim, N.; Cha, S.; Peng, H. Optimal control of hybrid electric vehicles based on Pontryagin’s minimum principle. IEEE Trans. Control Syst. Technol. 2011, 19, 1279–1287. [Google Scholar]
- Xu, L.; Yang, F.; Li, J.; Ouyang, M.; Hua, J. Real time optimal energy management strategy targeting at minimizing daily operation cost for a plug-in fuel cell city bus. Int. J. Hydrogen Energy 2012, 37, 15380–15392. [Google Scholar] [CrossRef]
- Tribioli, L.; Lacandia, F.; Rizzoni, G.; Onori, S. Adaptive energy management strategy calibration in PHEVs based on a sensitivity study. SAE Int. J. Altern. Powertrains 2013, 2, 443–455. [Google Scholar]
- Serrao, L.; Onori, S.; Rizzoni, G. ECMS as a realization of Pontryagin’s minimum principle for HEV control. In Proceedings of the American Control Conference, St. Louis, MO, USA, 10–12 June 2009; pp. 3964–3969. [Google Scholar]
- Kim, N.; Lee, Z.C.; Shin, C.; Seo, H.; Cha, S. Realization of PMP-based control for hybrid electric vehicles in a backward-looking simulation. Int. J. Automot. Technol. 2014, 15, 625–635. [Google Scholar] [CrossRef]
- Tang, L.; Rizzoni, G.; Onori, S. Energy management strategy for HEVs including battery life optimization. IEEE Trans. Transp. Electrif. 2015, 1, 211–222. [Google Scholar] [CrossRef]
- Onori, S.; Tribioli, L. Adaptive Pontryagin’s minimum principle supervisory controller design for the plug-in hybrid GM Chevrolet Volt. Appl. Energy 2015, 147, 224–234. [Google Scholar] [CrossRef]
- Chen, Z.; Mi, C.C.; Xia, B.; You, C. Energy management of power-split plug-in hybrid electric vehicles based on simulated annealing and Pontryagin’s minimum principle. J. Power Sources 2014, 272, 160–168. [Google Scholar] [CrossRef]
- Zheng, C.; Cha, S.W.; Park, Y.; Lim, W.; Xu, G. PMP-based power management strategy of fuel cell hybrid vehicles considering multi objective optimization. Int. J. Precis. Eng. Manuf. 2013, 14, 845–853. [Google Scholar] [CrossRef]
- Sharma, O.; Onori, S.; Guezennec, Y. Analysis of Pontryagin’s minimum principle-based energy management strategy for PHEV applications. In Proceedings of the ASME Dynamic Systems and Control Conference, Fort Lauderdale, FL, USA, 17–19 October 2012; pp. 145–150. [Google Scholar]
- Ghanbari, N.; Mobarrez, M.; Bhattacharya, S. Review and modeling of different droop control based methods for battery state of the charge balancing in DC microgrids. In Proceedings of the IECON 2018, Washington, DC, USA, 21–23 October 2018. [Google Scholar]
- Yu, Z. Automobile Theory; China Machine Press: Beijing, China, 2002. (In Chinese) [Google Scholar]
- Stoer, J.; Burlisch, R. Introduction to Numerical Analysis; Springer: New York, NY, USA, 1980. [Google Scholar]
- National Automobile Standardization and Technical Committee. QC/T759-2006 City Driving Cycle for Vehicle Testing QC/T759-2006; Beijing Planning Press: Beijing, China, 2006. (In Chinese) [Google Scholar]
- Kirk, D.E. Optimal Control Theory: An Introduction; Dover Publications: Mineola, NY, USA, 2004. [Google Scholar]


| Item | Parameter | Value |
|---|---|---|
| Vehicle | Curb mass (kg) | 10,800 |
| Final gear ratio | 5.286 | |
| AMT | Gear 1 ratio | 4.406 |
| Gear 2 ratio | 2.446 | |
| Gear 3 ratio | 1.481 | |
| Engine | Displacement (L) | 2.78 |
| Max power (kW) | 110 | |
| Max speed (rpm) | 3200 | |
| ISG | Max power (kW) | 90 |
| Max torque (Nm) | 330 | |
| Max speed (rpm) | 3000 | |
| Tractor motor | Max power (kW) | 150 |
| Max torque (Nm) | 850 | |
| Max speed (rpm) | 3000 | |
| Battery | Capacity (Ah) | 180 |
| Battery total voltage (V) | 537.6 |
| Result | Method | ||
|---|---|---|---|
| CD-CS | DP | PMP | |
| Final SOC | 0.323 | 0.301 | 0.301 |
| Electric consumption (kWh) | 17.119 | 19.236 | 19.246 |
| Fuel consumption (L) | 6.641 | 5.438 | 5.436 |
| Total cost (CNY) | 51.680 | 46.493 | 46.488 |
| Time consumption (s) | 12 | 20689 | 71 |
| Method | Result | |
|---|---|---|
| CD-CS | DP | |
| CD-CS | - | 73.14% |
| DP | 73.14% | - |
| PMP | 73.21% | 99.01% |
© 2018 by the authors. Licensee MDPI, Basel, Switzerland. This article is an open access article distributed under the terms and conditions of the Creative Commons Attribution (CC BY) license (http://creativecommons.org/licenses/by/4.0/).
Share and Cite
Xie, S.; Hu, X.; Lang, K.; Qi, S.; Liu, T. Powering Mode-Integrated Energy Management Strategy for a Plug-In Hybrid Electric Truck with an Automatic Mechanical Transmission Based on Pontryagin’s Minimum Principle. Sustainability 2018, 10, 3758. https://doi.org/10.3390/su10103758
Xie S, Hu X, Lang K, Qi S, Liu T. Powering Mode-Integrated Energy Management Strategy for a Plug-In Hybrid Electric Truck with an Automatic Mechanical Transmission Based on Pontryagin’s Minimum Principle. Sustainability. 2018; 10(10):3758. https://doi.org/10.3390/su10103758
Chicago/Turabian StyleXie, Shaobo, Xiaosong Hu, Kun Lang, Shanwei Qi, and Tong Liu. 2018. "Powering Mode-Integrated Energy Management Strategy for a Plug-In Hybrid Electric Truck with an Automatic Mechanical Transmission Based on Pontryagin’s Minimum Principle" Sustainability 10, no. 10: 3758. https://doi.org/10.3390/su10103758