Pattern Preference Analysis of Black-and-White Plaid Shirts


1
The Graduate Institute of Design Science, Tatung University, Taipei 104, Taiwan
2
Graduate School of Design, National Yunlin University of Science & Technology, Yunlin 640, Taiwan
3
Institute of Textiles and Clothing, The Hong Kong Polytechnic University, Hong Kong, China
*
Author to whom correspondence should be addressed.
Sustainability 2018, 10(10), 3739; https://doi.org/10.3390/su10103739
Submission received: 1 September 2018
/
Revised: 13 October 2018
/
Accepted: 15 October 2018
/
Published: 17 October 2018
(This article belongs to the Special Issue Sustainability and Product Differentiation)
Abstract
:The market economy has shifted the decision-making power of the garment industry from the enterprise to the consumer. Research on consumer clothing preferences is an essential part of sustainable development of the garment industry. Based on data statistics from eight fast fashion brands, black and white are most commonly used in two-color plaid shirts. This paper carried out a psychophysical experiment to investigate factors affecting pattern preferences for black-and-white shirts and the differences and similarities between male and female pattern preferences. Twenty-eight different representative patterns of plaid shirts were selected by five fashion designers together from 190 different black-and-white plaid shirts from eight fast fashion brands, which were then classified into three categories: gingham, tartans, and windowpane. Based on these patterns, 28 male and female shirts were simulated in three dimensions and presented on a calibrated computer display. The simulations were assessed by 42 observers (consisting of 21 males and 21 females) in terms of four semantic scales, including light–dark, delicate–rough, simple–complex, and like–dislike. The experimental results revealed that there was no significant difference of pattern preference between females and males for 89.29% of the black-and-white plaid shirts, and also described features of the patterns that the females and males liked or disliked. Furthermore, the study also demonstrated the formulation between the four semantic scales and three pattern features (including the percentage of black region, the size of the minimum repeat unit, and the descriptor of the pattern complexity). The findings could be used to develop a more robust and comprehensive theory of pattern preferences and provide a reference for pattern design for black-and-white plaid shirts. More comprehensive pattern preference theory is not only an effective tool to solve the problem of plaid shirt inventory in the garment industry but also an important theoretical basis for the “sustainable design” of clothing, which is of great significance to the sustainable development of the garment industry.
1. Introduction
1.1. Research Background and Motivation
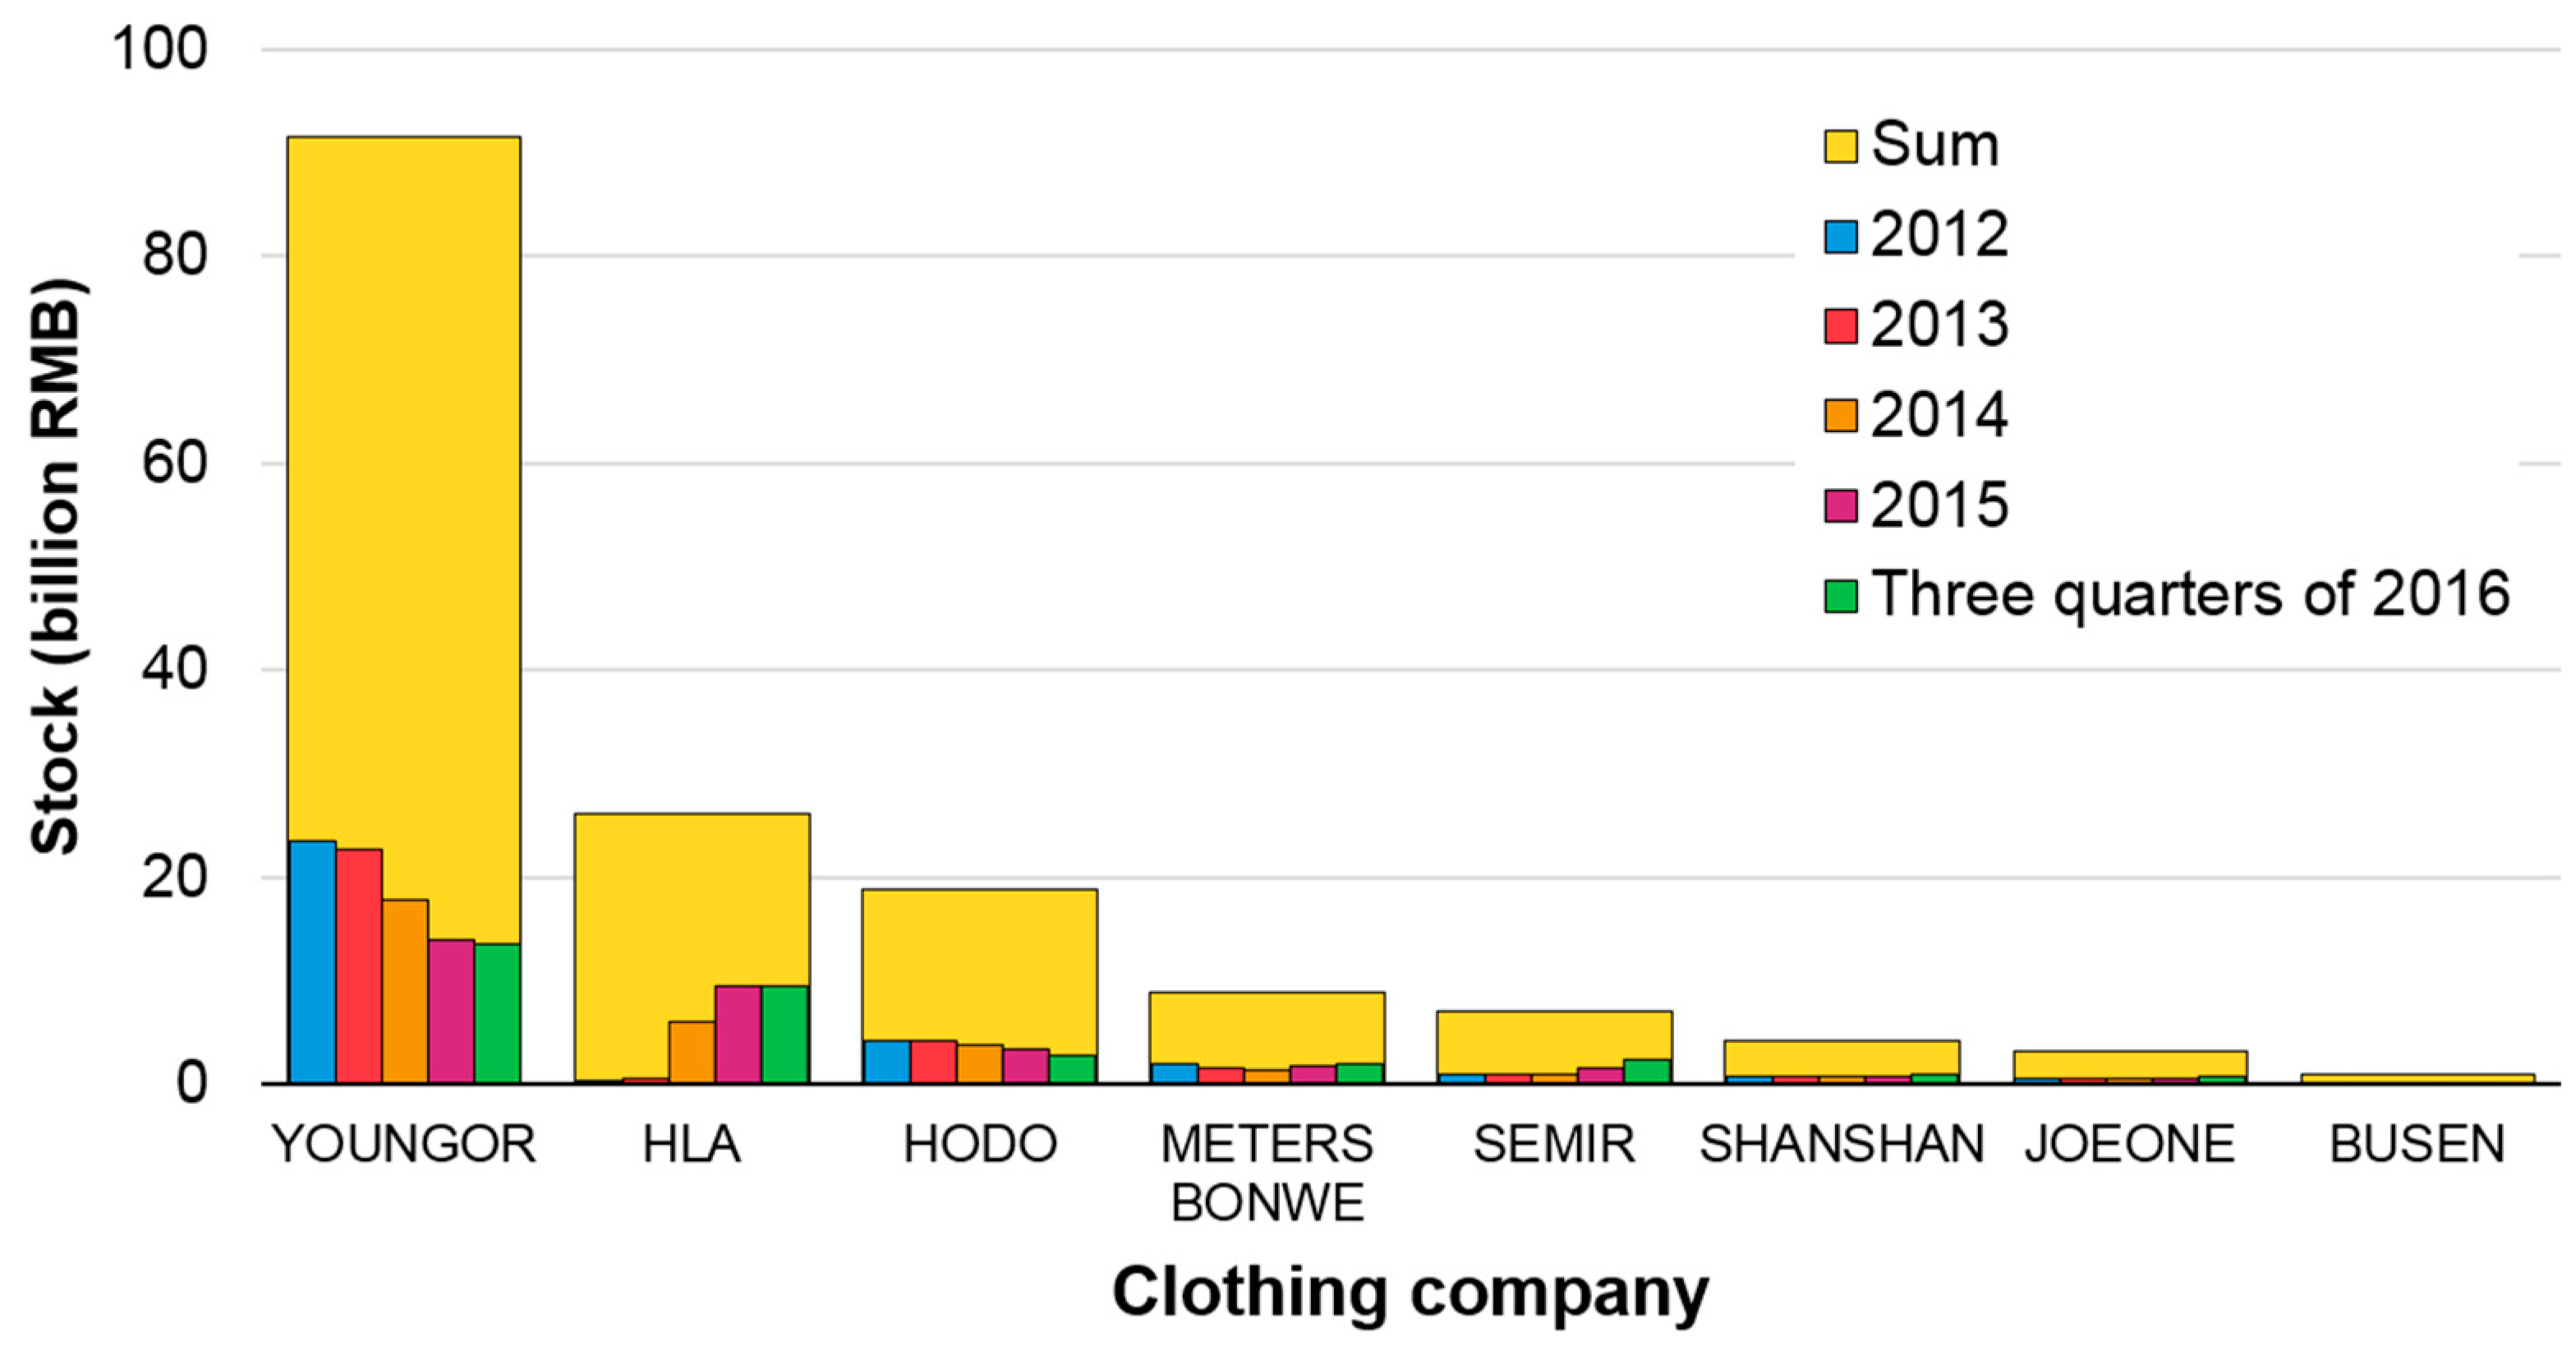
For the garment industry, inventory has always been one of its main pain points. The product backlog not only occupies the company’s operating capital but also increases the company’s management and profit costs, reducing the company’s overall profits, and is also an obstacle to the sustainable development of the garment industry. Linkshop [1] collated the annual inventory data of eight Chinese listed garment enterprises from 2012 to third quarter 2016, including HLA, YOUNGOR, SEMIR, HODO, METERS BONWE, SHANSHAN, JOEONE, and BUSEN; these data were calculated from the annual reports of enterprises, as shown in Figure 1.
The figure above shows that the inventory value of YOUNGOR exceeded 10 billion RMB annually every year from 2012 to third quarter 2016, and even reached 23.473 billion RMB in 2012. Even the lowest inventory value of the eight companies, BUSEN, still exceeded 200 million RMB annually between 2012 and 2016. It can be seen that the inventory problem is becoming an obstacle to the sustainable development of the garment industry. The study of pattern preference is not only an effective tool with which to solve the inventory problem of the garment industry but also an important theoretical basis for the sustainable design of apparel. It is of great significance to the sustainable development of the garment industry.
To solve the inventory problem of the garment industry and promote the sustainable development of the garment industry, we need not only a strong supply chain system but also rapid market response ability to support the extremely high inventory turnover. Consumer clothing preference research is an effective tool with which to support the market reaction ability of the garment industry. The market economy causes the decision-making power of the garment industry to be transferred from enterprises to consumers. By understanding the preferences of consumers, clothing enterprises can avoid unsold clothing as much as possible and reduce inventory. By understanding the preferences of consumers, the design and production of clothing enterprises can reduce undesirable clothing and thus reduce inventory.
“Sustainable design” is formed in the deep thinking of the relationship between human development and environmental problems and the practice of constantly seeking change. The strategy of the “sustainable design” of clothing can be summed up in three ways: sustainable design based on a material foundation aims at reducing the use of materials and optimizing the use of materials, and intuitively reflects the ecological concept of environmental protection; sustainable design based on conveying specific ideas uses emotional design methods to convey sustainable ideas sensibly to consumers; and sustainable design based on life cycle considerations aims at prolonging clothing usage and service life. Overall, the third method is the easiest to implement and can be achieved in a short period of time; the study of clothing preference can improve the durability of the relationship between clothing and people, thereby reducing consumption and waste of resources.
From the above point of view, this paper carried out a psychophysical experiment to investigate factors affecting pattern preferences for black-and-white shirts and the differences and similarities between male and female pattern preferences. Psychophysics has been defined as “the analysis of perceptual processes by studying the effect on a subject’s experience or behavior of systematically varying the properties of a stimulus along one or more physical dimensions” [2].
Research on fabric preferences has mostly focused on color. For instance, Jiang investigated the color of clothing and emphasized the rule that color brightness influences positive–negative emotional categorization [3]. Hsu carried out a psychophysical experiment to investigate factors affecting color preferences for Taiwanese floral pattern fabrics as a case study of object color preference [4]. These studies mainly stressed color. Compared with color, pattern is also an important part of textiles. This researcher summarized some studies on textile patterns.
- Eun Yi Kim discussed challenging issues in how to index images based on human emotions and presented a heuristic approach to emotion-based textile indexing using colors and texture [5].
- Soo-jeong Kim proposed a textile indexing system that can classify textile images based on human emotions [6].
- Na Yeon Kim proposed a neural network-based approach for emotion-based textile indexing [7].
- So-Ra Lee found out the effects of textile motifs and application methods on the wearer’s image perception [8].
- Na Yeon Kim proposed a novel method using color and pattern information for recognizing emotions included in a textile [9].
- Soo-Kyoung Choi investigated the image of casual shirts according to the color combination, tone, and interval of the checked pattern in tone-in-tone coloration. The images, according to color combination, tone, and interval of checked pattern, consisted of five dimensions of attractiveness, youth-activity, appeal, modesty, and freshness. This study discussed how the color combination, tone, and interval of checked pattern affects the five dimensions [10].
- Felecia Davis presented a study that related the communication of emotion to people via the aesthetic textural expression of computational textiles or textiles that transform through electronic commands over time [11].
- Felecia Davis investigated what still and shape-changing textural expressions of computational textiles can communicate emotionally to people [12].
- Siri Homlong studied how simple and complex patterns in printed textile fabrics are perceived and expressed verbally, as well as how judgments, concepts, and values in relation to designed textile patterns are expressed by schoolchildren, consumers, teachers of textile handicrafts, and designers [13].
The above research did not explore the pattern preference of yarn-dyed fabrics. Therefore, this study probed into textile patterns and how patterns influence consumer preferences. This study hypothesized that men and women will have different or similar pattern preferences for textiles. It was worth exploring the characteristics of these patterns.
The object of this paper was to investigate the patterns of plaid shirts made of two-color yarn-dyed fabrics. There were several reasons why these objects were selected for investigation. First, from the design of weaving technologies to the wide application of plaids in modern clothing, plaids have evolved along with the history and civilization of humans. It was therefore significant to regard plaids as the basic research objects of patterns of textiles. Second, this study focused on the aesthetic differences and similarities between men and women in terms of plaids. Clothing has no gender; it is classified into men’s and women’s clothing because of the gender of the wearers. It can be seen that the gender of clothing is a consensus established by society. No other commodity in the world has such distinct gender differences as clothing. Hence, it was reasonable to consider clothing rather than other textiles as the research object. Lastly, the type of clothing that is commonly worn by males and females is plaid shirts.
The application of plaids has a long history. Today, tartan is thought to have originated in Scotland; however, tartan was first discovered far from the British Isles. According to the textile historian E. J. W. Barber, the Hallstatt culture of Central Europe, which is linked with ancient Celtic populations and flourished between the 8th and 6th centuries BC, produced tartan-like textiles [14]. Some of them were discovered in 2004, remarkably preserved, in the Hallstatt salt mines near Salzburg, Austria [15]. Textile analysis of fabric from the Tarim mummies in Xinjiang, northwestern China has also shown it to be similar to that of the Iron Age Hallstatt culture [16].
At around 1700 AD, plaid patterns in Scotland started to reflect distinct geographical features. Martin Martin, in A Description of the Western Islands of Scotland, published in 1703, wrote that Scottish tartans could be used to distinguish the inhabitants of different regions. He expressly wrote that the inhabitants of various islands and the mainland of the Highlands were not all dressed alike, but that the setts and colours of the various tartans varied from isle to isle [15]. People in the same area tended to adopt the same plaids. This also meant that plaid patterns in Scotland were formed. Furthermore, every family or tribe had its own plaid patterns, known as family plaids, which were also a symbol of status and wealth. In addition, plaids were later developed for different occasions. For instance, there were plaids specific for formal and hunting clothes. With the advent of the industrial age, various countries and regions began to register their own plaids. In the combination of aesthetics and the consumer psychology of modern society, plaids became a design element and source of inspiration in later eras and were fully applied to the design of textiles such as clothing.
Many variations of the major patterns exist, as designers constantly come up with new and different styles. Shirt patterns are often enhanced or can be a combination of different check patterns. The classic plaids shown in Table 1 consist of horizontal and vertical lines and planes processed by yarn-dyed technology. The pictures in Table 1 were drawn using Matlab in this study, and the description of check patterns refers to the research of Christina Lee [17].
1.2. Research Purpose
As mentioned above, with the changing times, more and more types of plaid fabrics have been produced. Each has its own unique characteristics. Pattern and color are two important components of plaids. As a basic study on plaid preferences, this study explored two-color plaids in the first part to lay a foundation for follow-up research on multi-color plaids. This study probed into the effects of these characteristics on the preferences of males and females in the hope of identifying the factors influencing the preference of two-color plaid shirts. The research questions included the following:
- What is the relationship between the plaid features and aesthetic emotions?
- What types of two-color plaid shirts show significant differences in preferences between men and women?
- What are the characteristics of two-color plaid shirts that are liked or disliked by both men and women?
In order to answer these questions, this study conducted a psychophysical experiment that covered four semantic scales, including light–dark, delicate–rough, simple–complex, and like–dislike. A 10-point scale was adopted to assess the fabric and patterns of plaid shirts. Regression analysis between the four semantic scales and three pattern features was performed, including an independent sample t-test of differences in the preferences between men and women, a one-sample t-test of differences in the preferences of different patterns, and Two-Way Mixed-Design ANOVA.
2. Methods
2.1. Data Collection
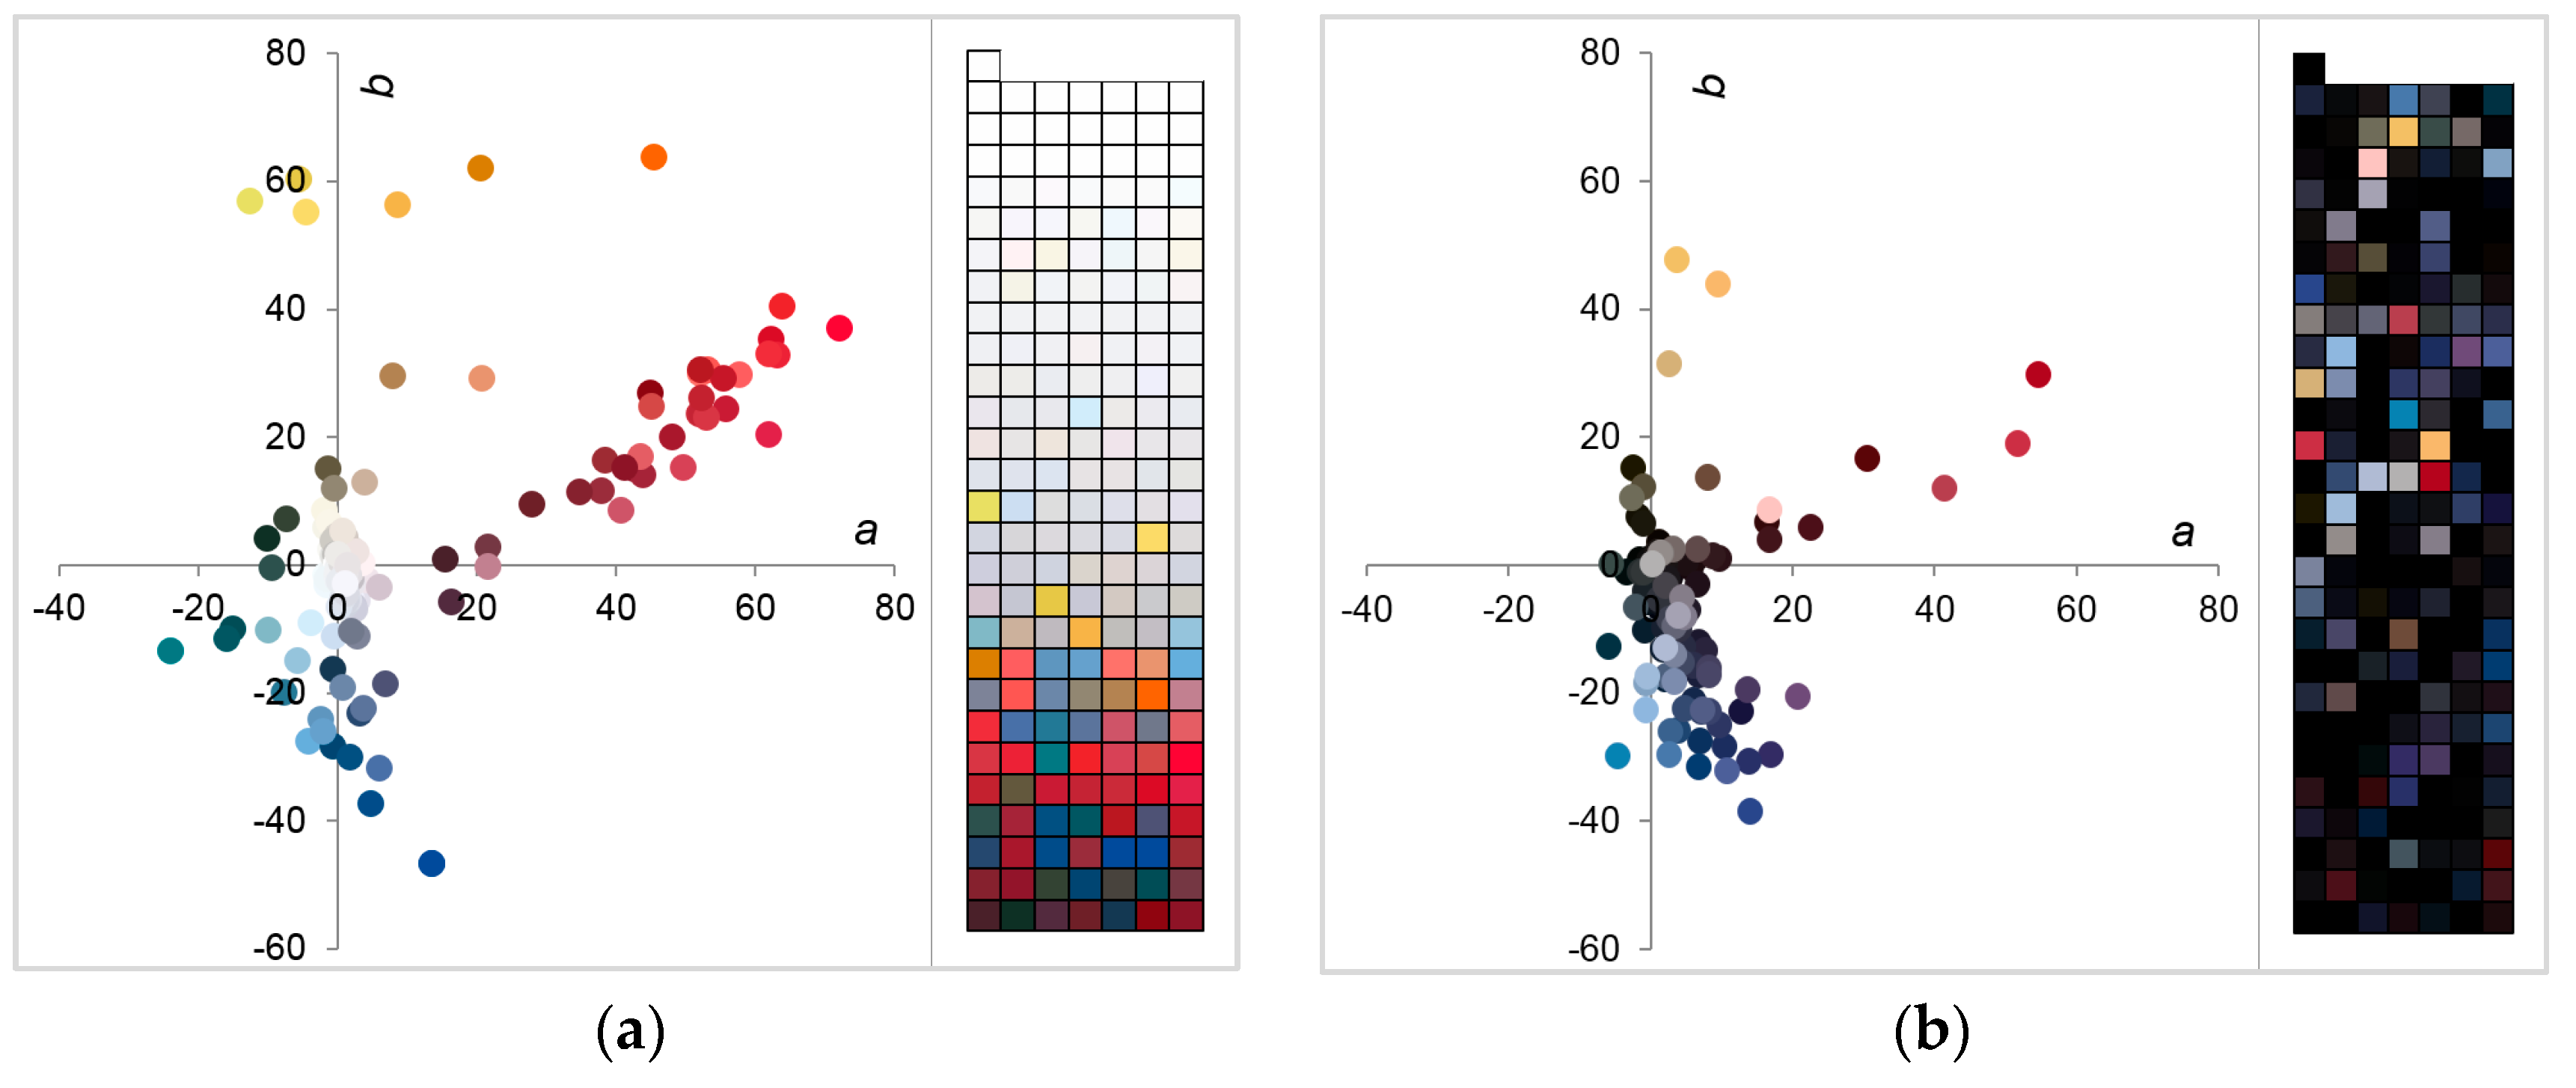
Through an online survey, this study asked two questions: Do you often buy plaid shirts? What brands do you choose? A total of 67 replies confirmed that they purchased plaid shirts. Eight brands were mentioned the most, including H&M, Zara, Uniqlo, C&A, GAP, Muji, Forever 21, and New Look. After receiving these responses, this researcher used the Internet to collect pictures of 190 pieces of two-color plaid shirts from the eight brands. The selection criteria included (a) two-color plaids and (b) shirts, regardless of material. Of the total, 117 pieces were men’s shirts, while the other 73 were women’s. The colors in the pictures of these shirts were extracted by Adobe Photoshop software, which is the industry standard in digital imaging and is used worldwide for design, photography, video editing, and more. In line with the L values (Li,1, Li,2) under the CIE LAB color space, the 117 pairs of colors were classified into 117 light colors and 117 dark colors, in which i indicates the i-th shirt, and 1 and 2 stand for Color 1 and Color 2 of the i-th shirt respectively, as shown in Figure 2.
It could be seen from the above figure that black and white were used the most in the two-color plaid shirts, and that black and white was the most common color combination. Therefore, this study analyzed the preference of black-and-white plaid shirts.
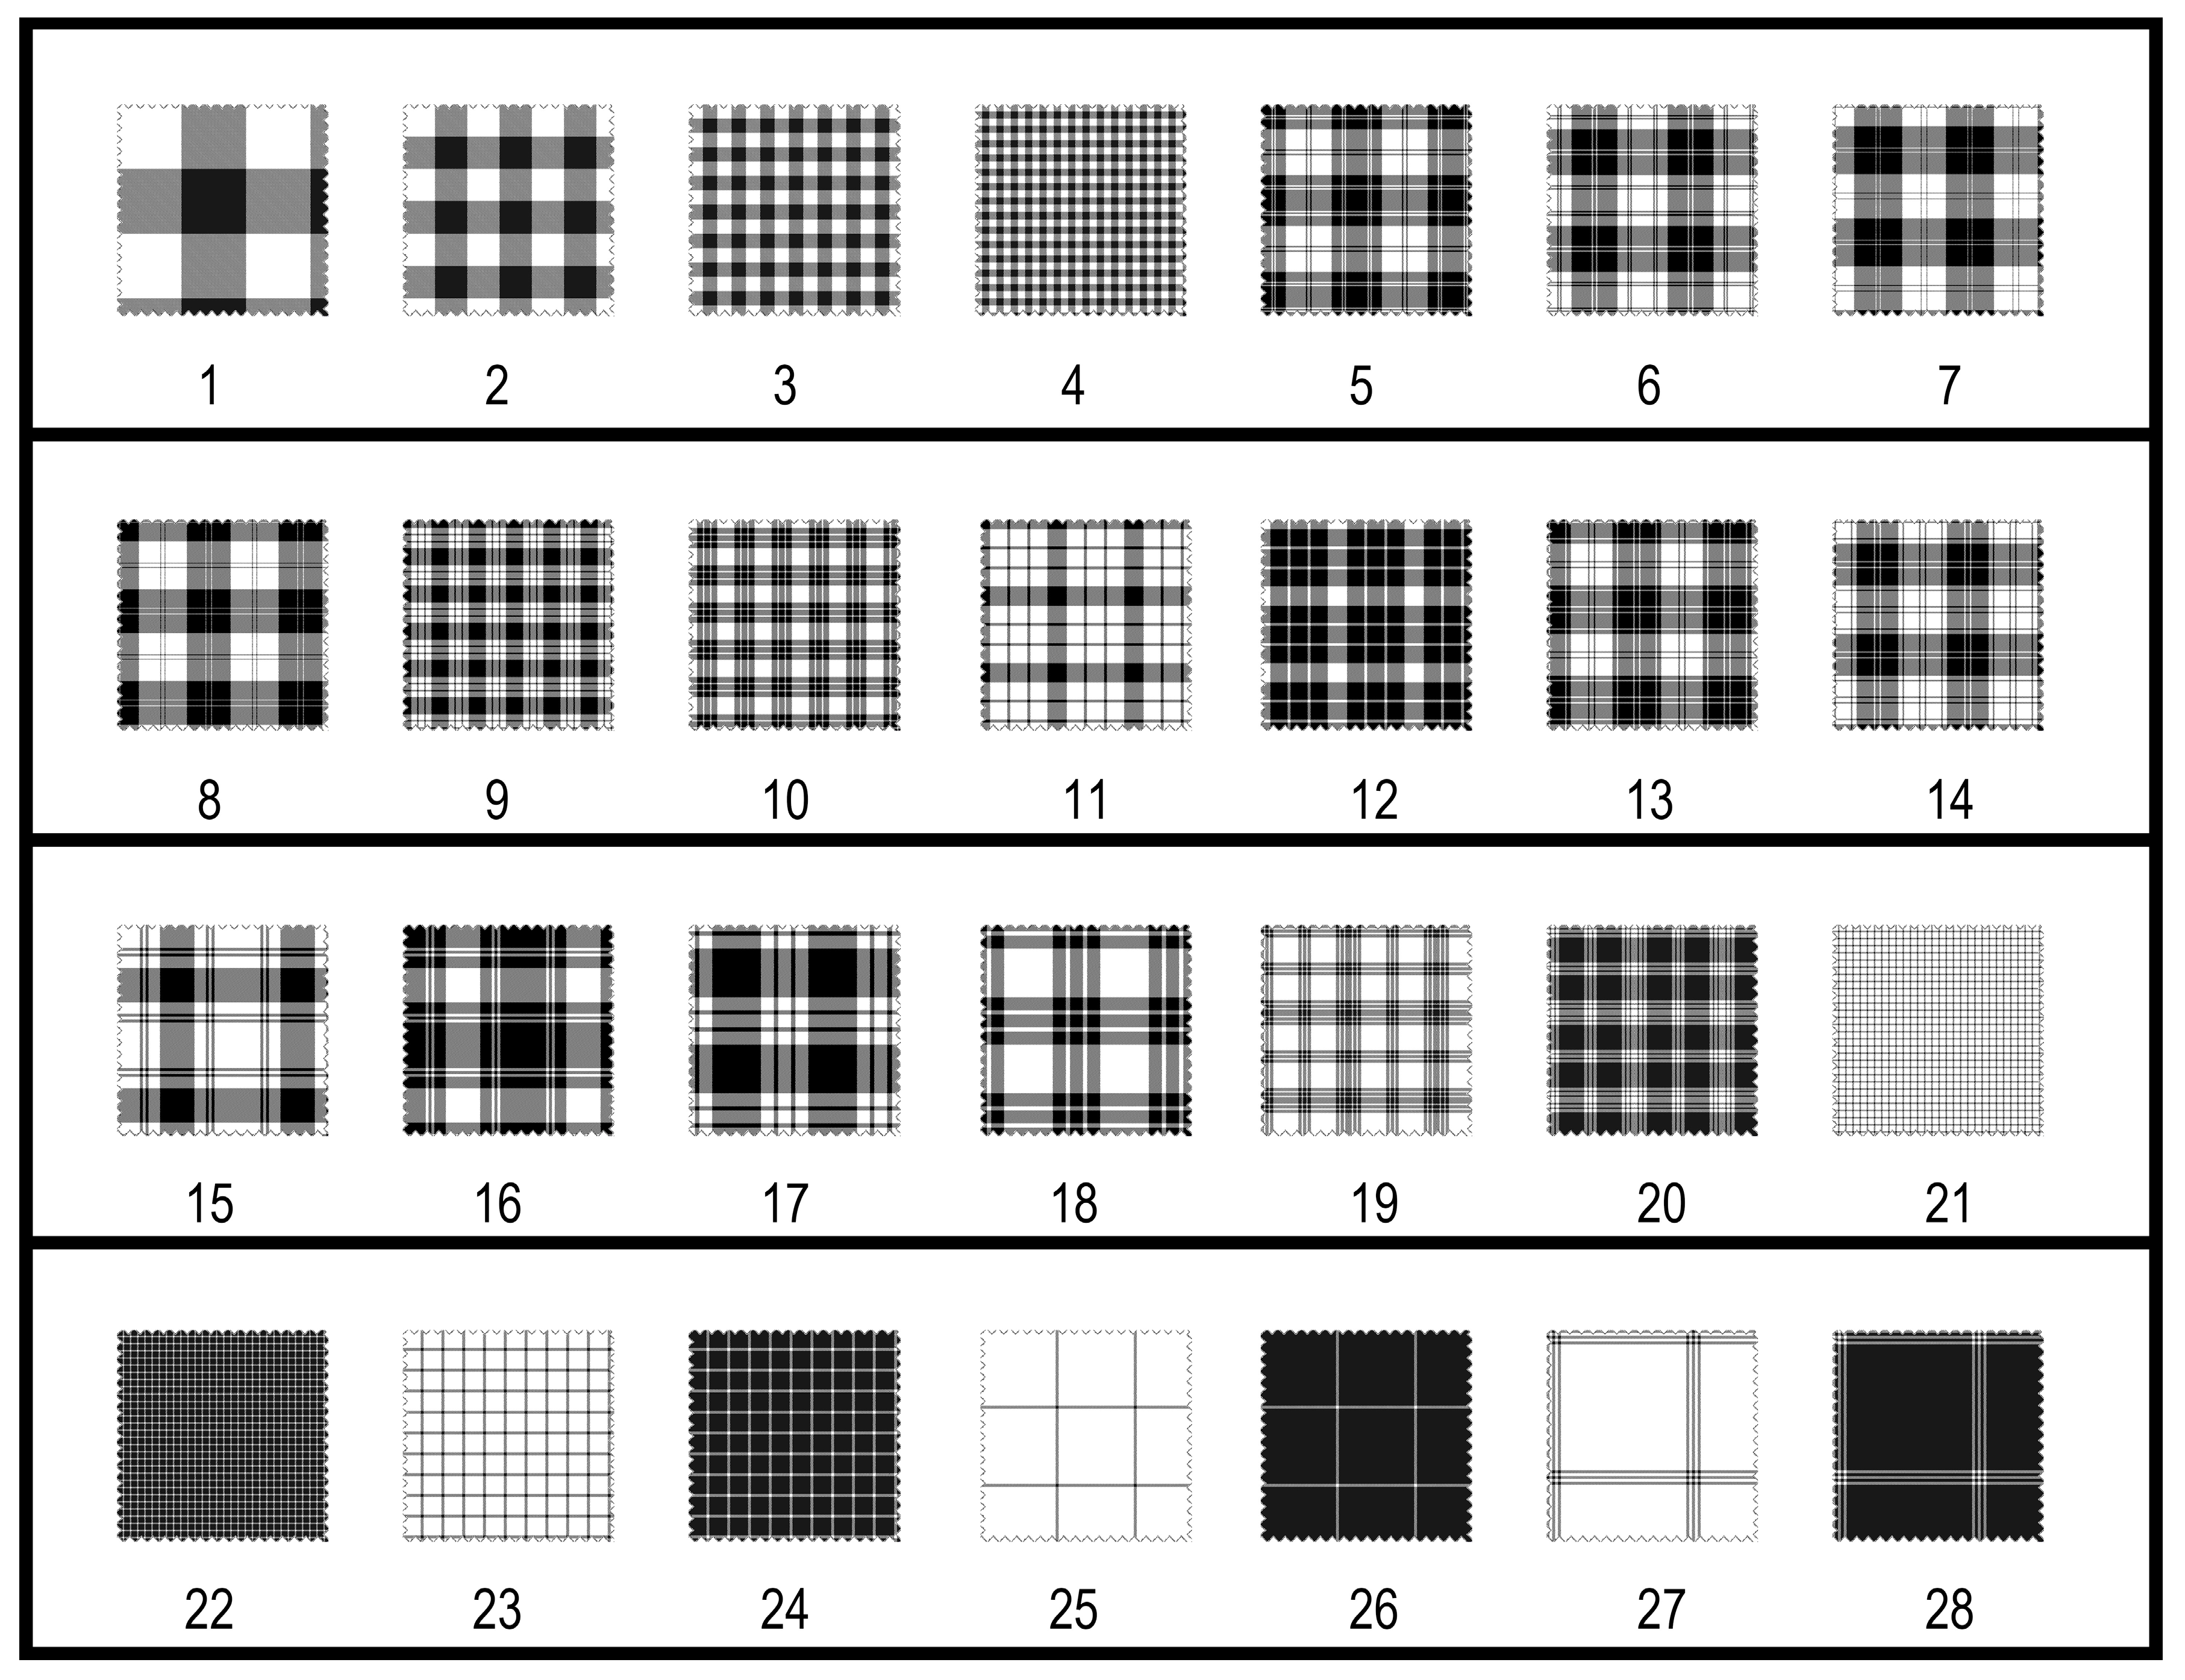
Through the analysis of the 190 pictures of two-color plaid shirts, five fashion designers discussed and drew 28 representative plaids. Matlab 2016 was used to generate simulated drawings of these yarn-dyed fabrics. See Figure 3 for the simulated drawings of the 28 plaids (the figure displays the simulated drawing of fabrics with the size 15 cm × 15 cm).
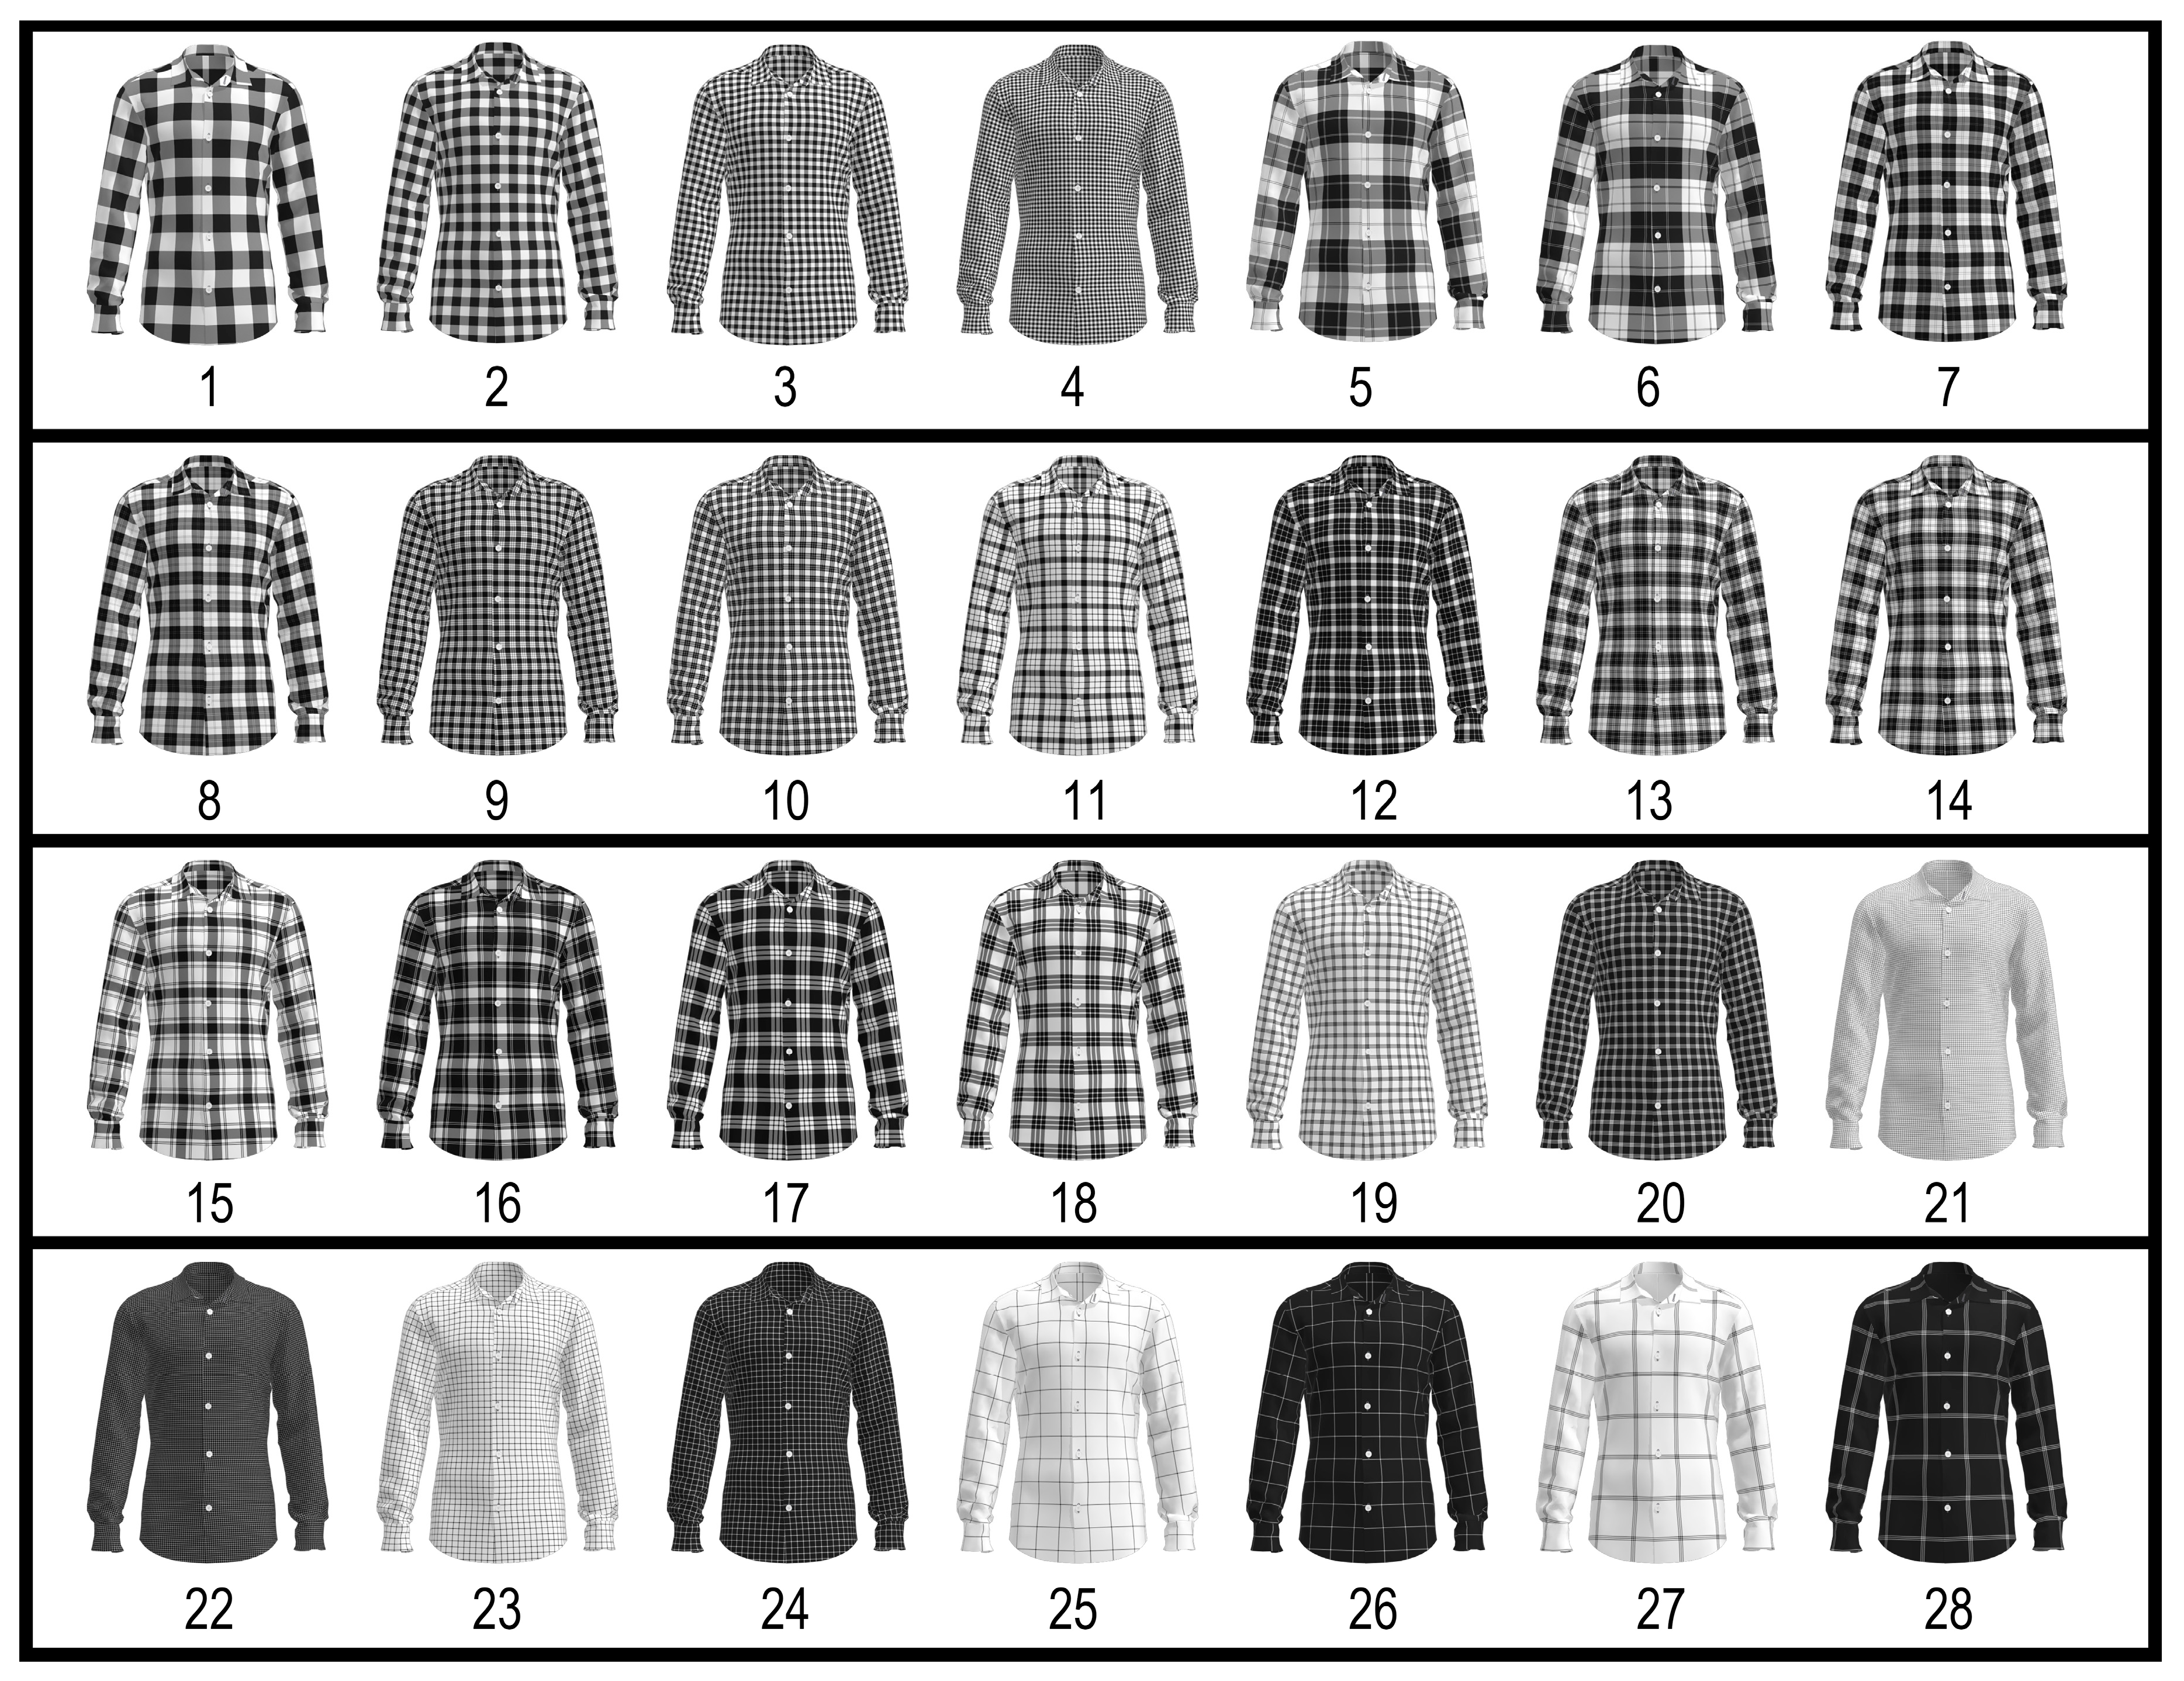
After obtaining the simulated drawings of the 28 fabrics, CLO 3D software was used to simulate the men’s and women’s shirts using these patterns. CLO 3D is a 3D fashion design software program creating virtual, true-to life garment visualization with cutting-edge simulation technologies for fashion designers. CLO 3D can be used as a design tool, specifically for design development, to visualize garments based on their 2D CAD patterns. It is used to visualize true-to-life 3D garments. Examples of the men’s shirts are shown in Figure 4.
2.2. Classification of Plaids
The 28 plaids were drawn by five fashion designers by referring to 190 two-color plaid shirts from the eight brands. These plaids contained five types of plaids (gingham, tartan, mini-check, windowpane, and graph check) as classified by Christina Lee, which were the most common patterns among the 190 two-color plaid shirts. Through the observations of this study, the mini-check could be regarded as a smaller type of gingham, and the graph check could be seen as a smaller type of windowpane. Thus, these plaids could be classified into gingham, tartan, and windowpane. Among the 28 plaids, 16 were first selected. Checks 1–4 under gingham had an evenly-distributed black and white pattern. In terms of the other plaids, after the exchange of black and white, there were obvious visual differences. Therefore, the black and white colors of the other 12 plaids were exchanged. The research objects were added to the 28, as shown in Table 2 below.
After the 28 plaids were selected by the five fashion designers, this researcher asked the fashion designers to write classification criteria for the selection of these plaids. They did not need to write the criterion for the type of plaid, as each type of plaid could have more than one type of fabric. After discussion, they identified three criteria: light–dark, delicate–rough, and simple–complex. This study used the three pairs of adjectives to analyze and describe the 28 plaids and hypothesized that the three pairs of adjectives could be used to describe the plaids associated with the preferences.
2.3. Test Stimuli
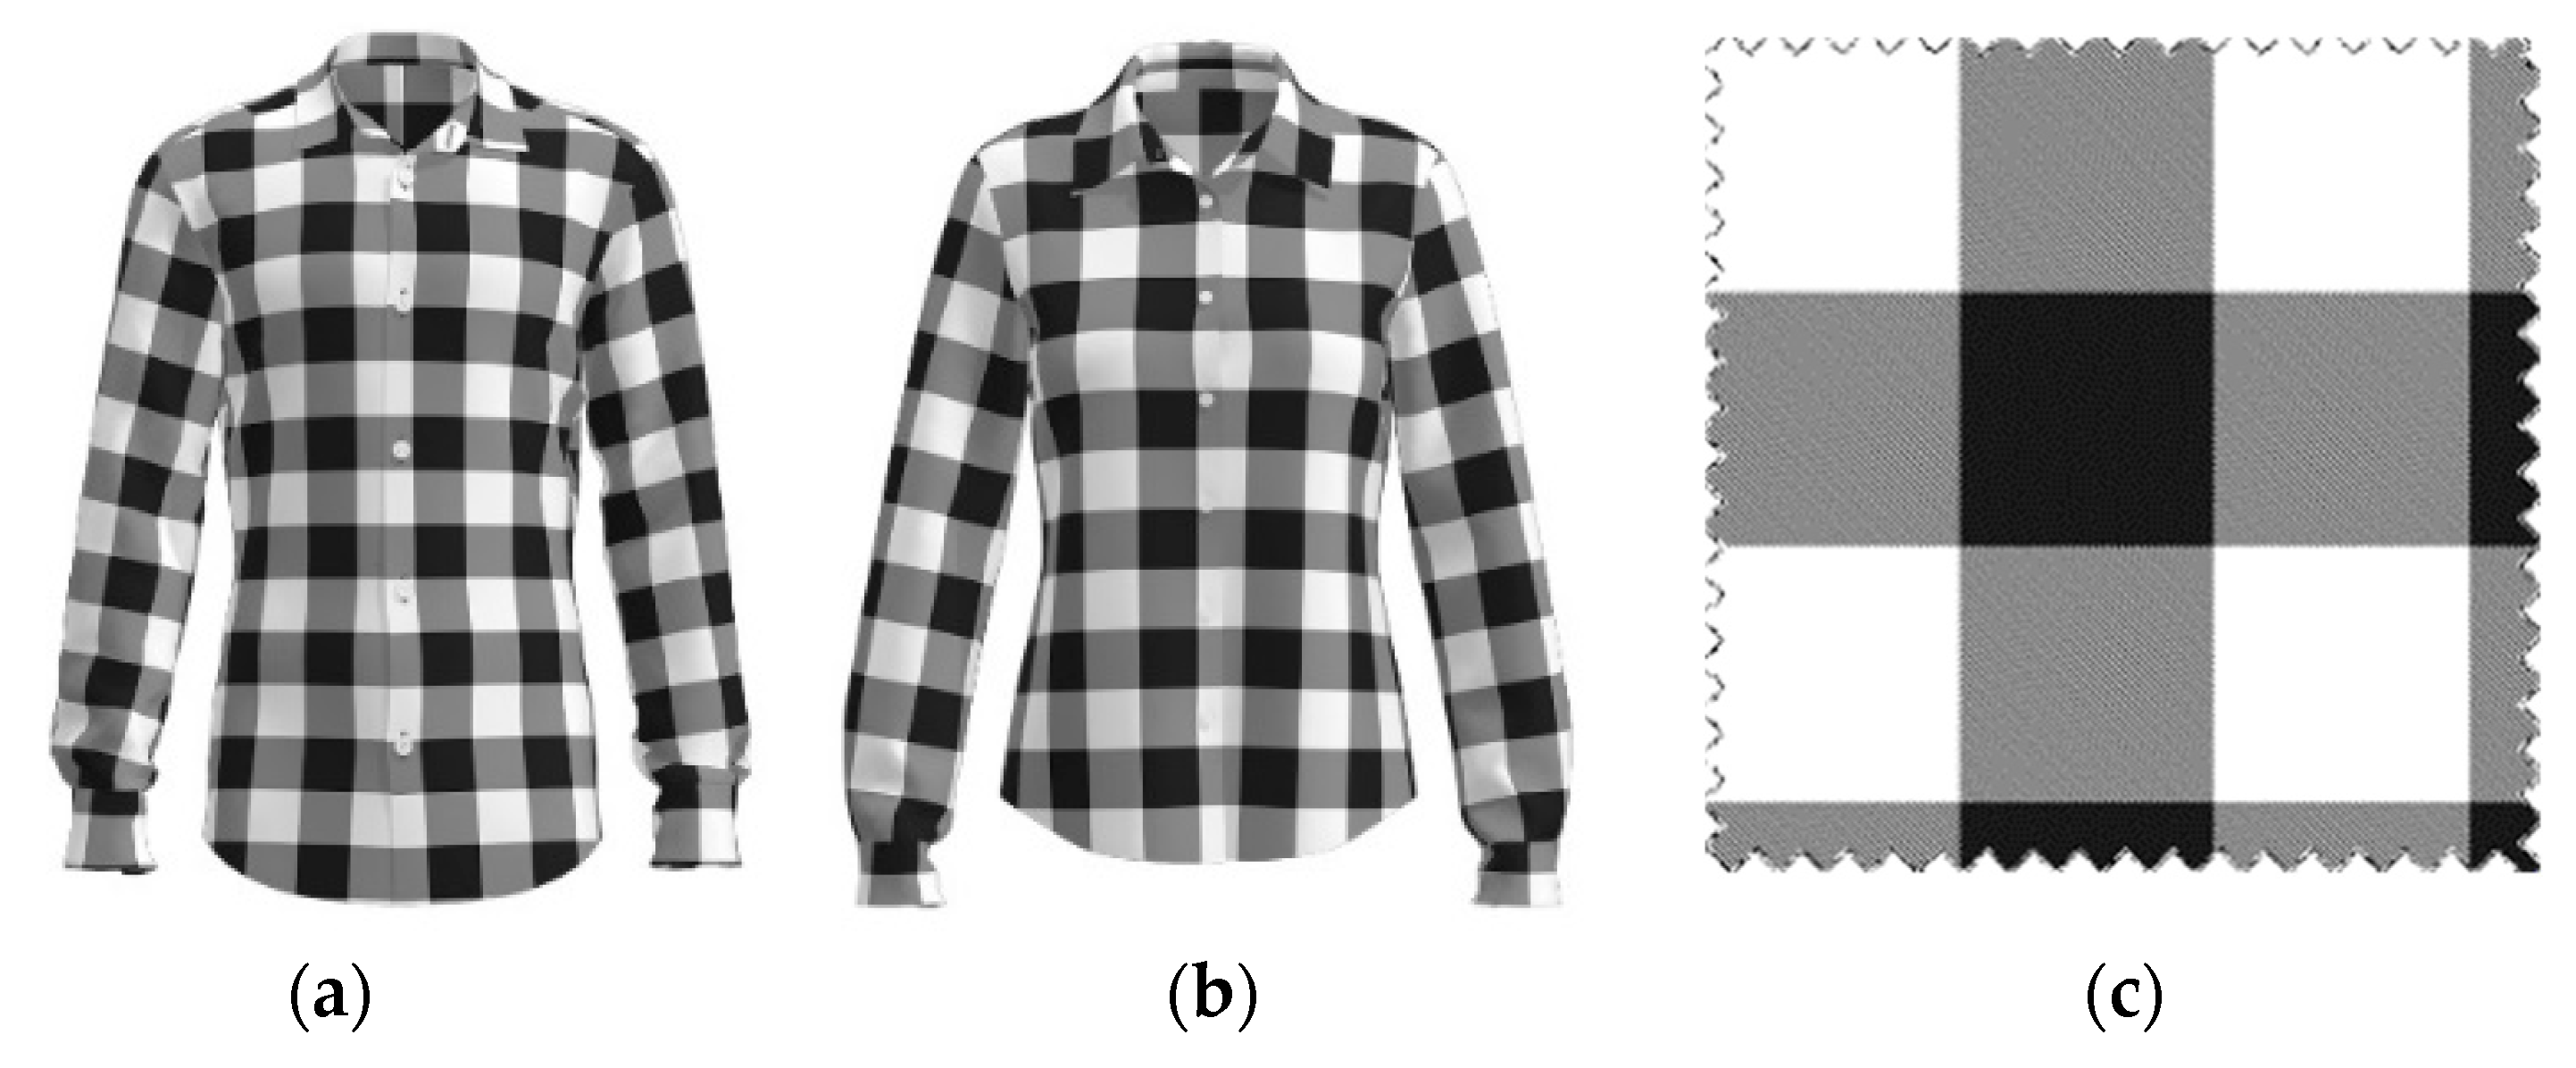
In order to avoid the three adjectives of light–dark/delicate–rough/simple–complex interfering with the choice of preferences, the experiment was divided into two parts. Meanwhile, this study considered that those who had received training could conduct a more reliable assessment of the three pairs of adjectives. The images for the test in the first part were the above 28 simulated images of fabrics and the 3D simulated images of clothes. In the experiment, only one preference indicator, like–dislike, was used to judge the extent of the preference for different patterns of the observers. In the first part of the experiment, a 10-step mandatory scale with choice questions was employed to judge the extent of preference. The 10 steps included “extremely dislike”, “exceptionally dislike”, “fairly dislike”, “dislike”, “somewhat dislike”, “somewhat like”, “like”, “fairly like”, “exceptionally like”, and “extremely like”. The respondents were forced to make a choice between like and dislike rather than selecting a neutral response. The images used in the test are shown in Figure 5 (in which the image on the left (a) is a basic type of men’s shirt for a height of 175 cm, the middle (b) is a basic type of women’s shirt for a height of 165 cm, and the right (c) is a simulated fabric with a size of 15 cm × 15 cm). The respondents were informed of these images before the test.
In the second part of the experiment, 30 observers from the first part were selected purposefully. They received training on graphic design to can make more precise judgments of the three pairs of adjectives. They were asked to fill in the same 10-step mandatory scale with choice questions to assess the 28 plaids using the three pairs of adjectives: light–dark, delicate–rough, and simple–complex. The four semantic scales of aesthetic emotions are presented in Chinese during the experiment. An English translation of the four scales is shown in Table 3.
2.4. Display
In the first part of the experiment, this study used two Apple 27-inch iMacs (model: MD095CH/A) as the display. The two monitors were under the same indoor environment and light source. During the experiment, other interference factors were avoided, and the same brightness and display calibration was set for the two monitors. During the test, an image was displayed for 10 s to avoid interference with the next image.
In the second part of the experiment, this study used the A0 international standard-sized paper to print the 28 plaid shirts and fabrics shown above. All 28 plaids were displayed simultaneously, which helped the observers to make a judgment. Unlike the main part of the experiment, the observers could change their scores on fabric that they had already assessed.
2.5. Observers
The first part of the experiment was aimed to collect data. A team of 42 observers participated in the first part of the experiment, including 21 males and 21 females aged 18 to 33 years old. During the experiment, each observer was asked to sit in front of a monitor that was placed approximately 55 cm away from him/her. Each observer then rated his/her preference of the 28 images.
In the second part of the experiment, 30 observers were selected among the 42 observers from the first part. These 30 observers, including 15 males and 15 females, received training on graphic design. There were 11 doctoral students, 13 postgraduates, and six undergraduates specializing in design-related majors, and seven had backgrounds related to fashion design. During the experiment, each observer was asked to sit approximately 1.3 m in front of the A0 paper. Each observer scored the 28 images according to the following three pairs of adjectives: light–dark, delicate–rough, and simple–complex.
2.6. Research Limitation
All 42 observers are young Chinese people, and 30 of them are majoring in design (at various education levels). This is a very specific consumer group that cannot be used directly to translate the results into universal consumer preference of patterns. However, the proposed investigation method can be used to analyze the patterns of preference consumers of different ages and nationalities. Furthermore, this paper just focuses on the black-and-white plaid shirts and does not include the solid and multi-color plaid shirts, which will be investigated further in the future.
3. Results
3.1. Analysis of Reliability
The reliability of the assessment data for the preference and the adjective pairs was analyzed. The reliability coefficient values were 0.938, 0.990, 0.993, and 0.991, all of which were greater than 0.9 and therefore indicated that the reliability of the research data was high. With respect to Cronbach’s Alpha after deletion of an item, the reliability coefficient value after the analysis item was deleted did not obviously improve; therefore, all items were retained, and the reliability of the research data was high. The corrected item-total correlation (CITC) values of the analysis items were higher than 0.9, indicating good correlation between items and good reliability. In summary, the reliability coefficient of the research data was higher than 0.9 and did not increase after an item was deleted. Therefore, the data were reliable and suitable for further analysis.
3.2. Regression Analysis
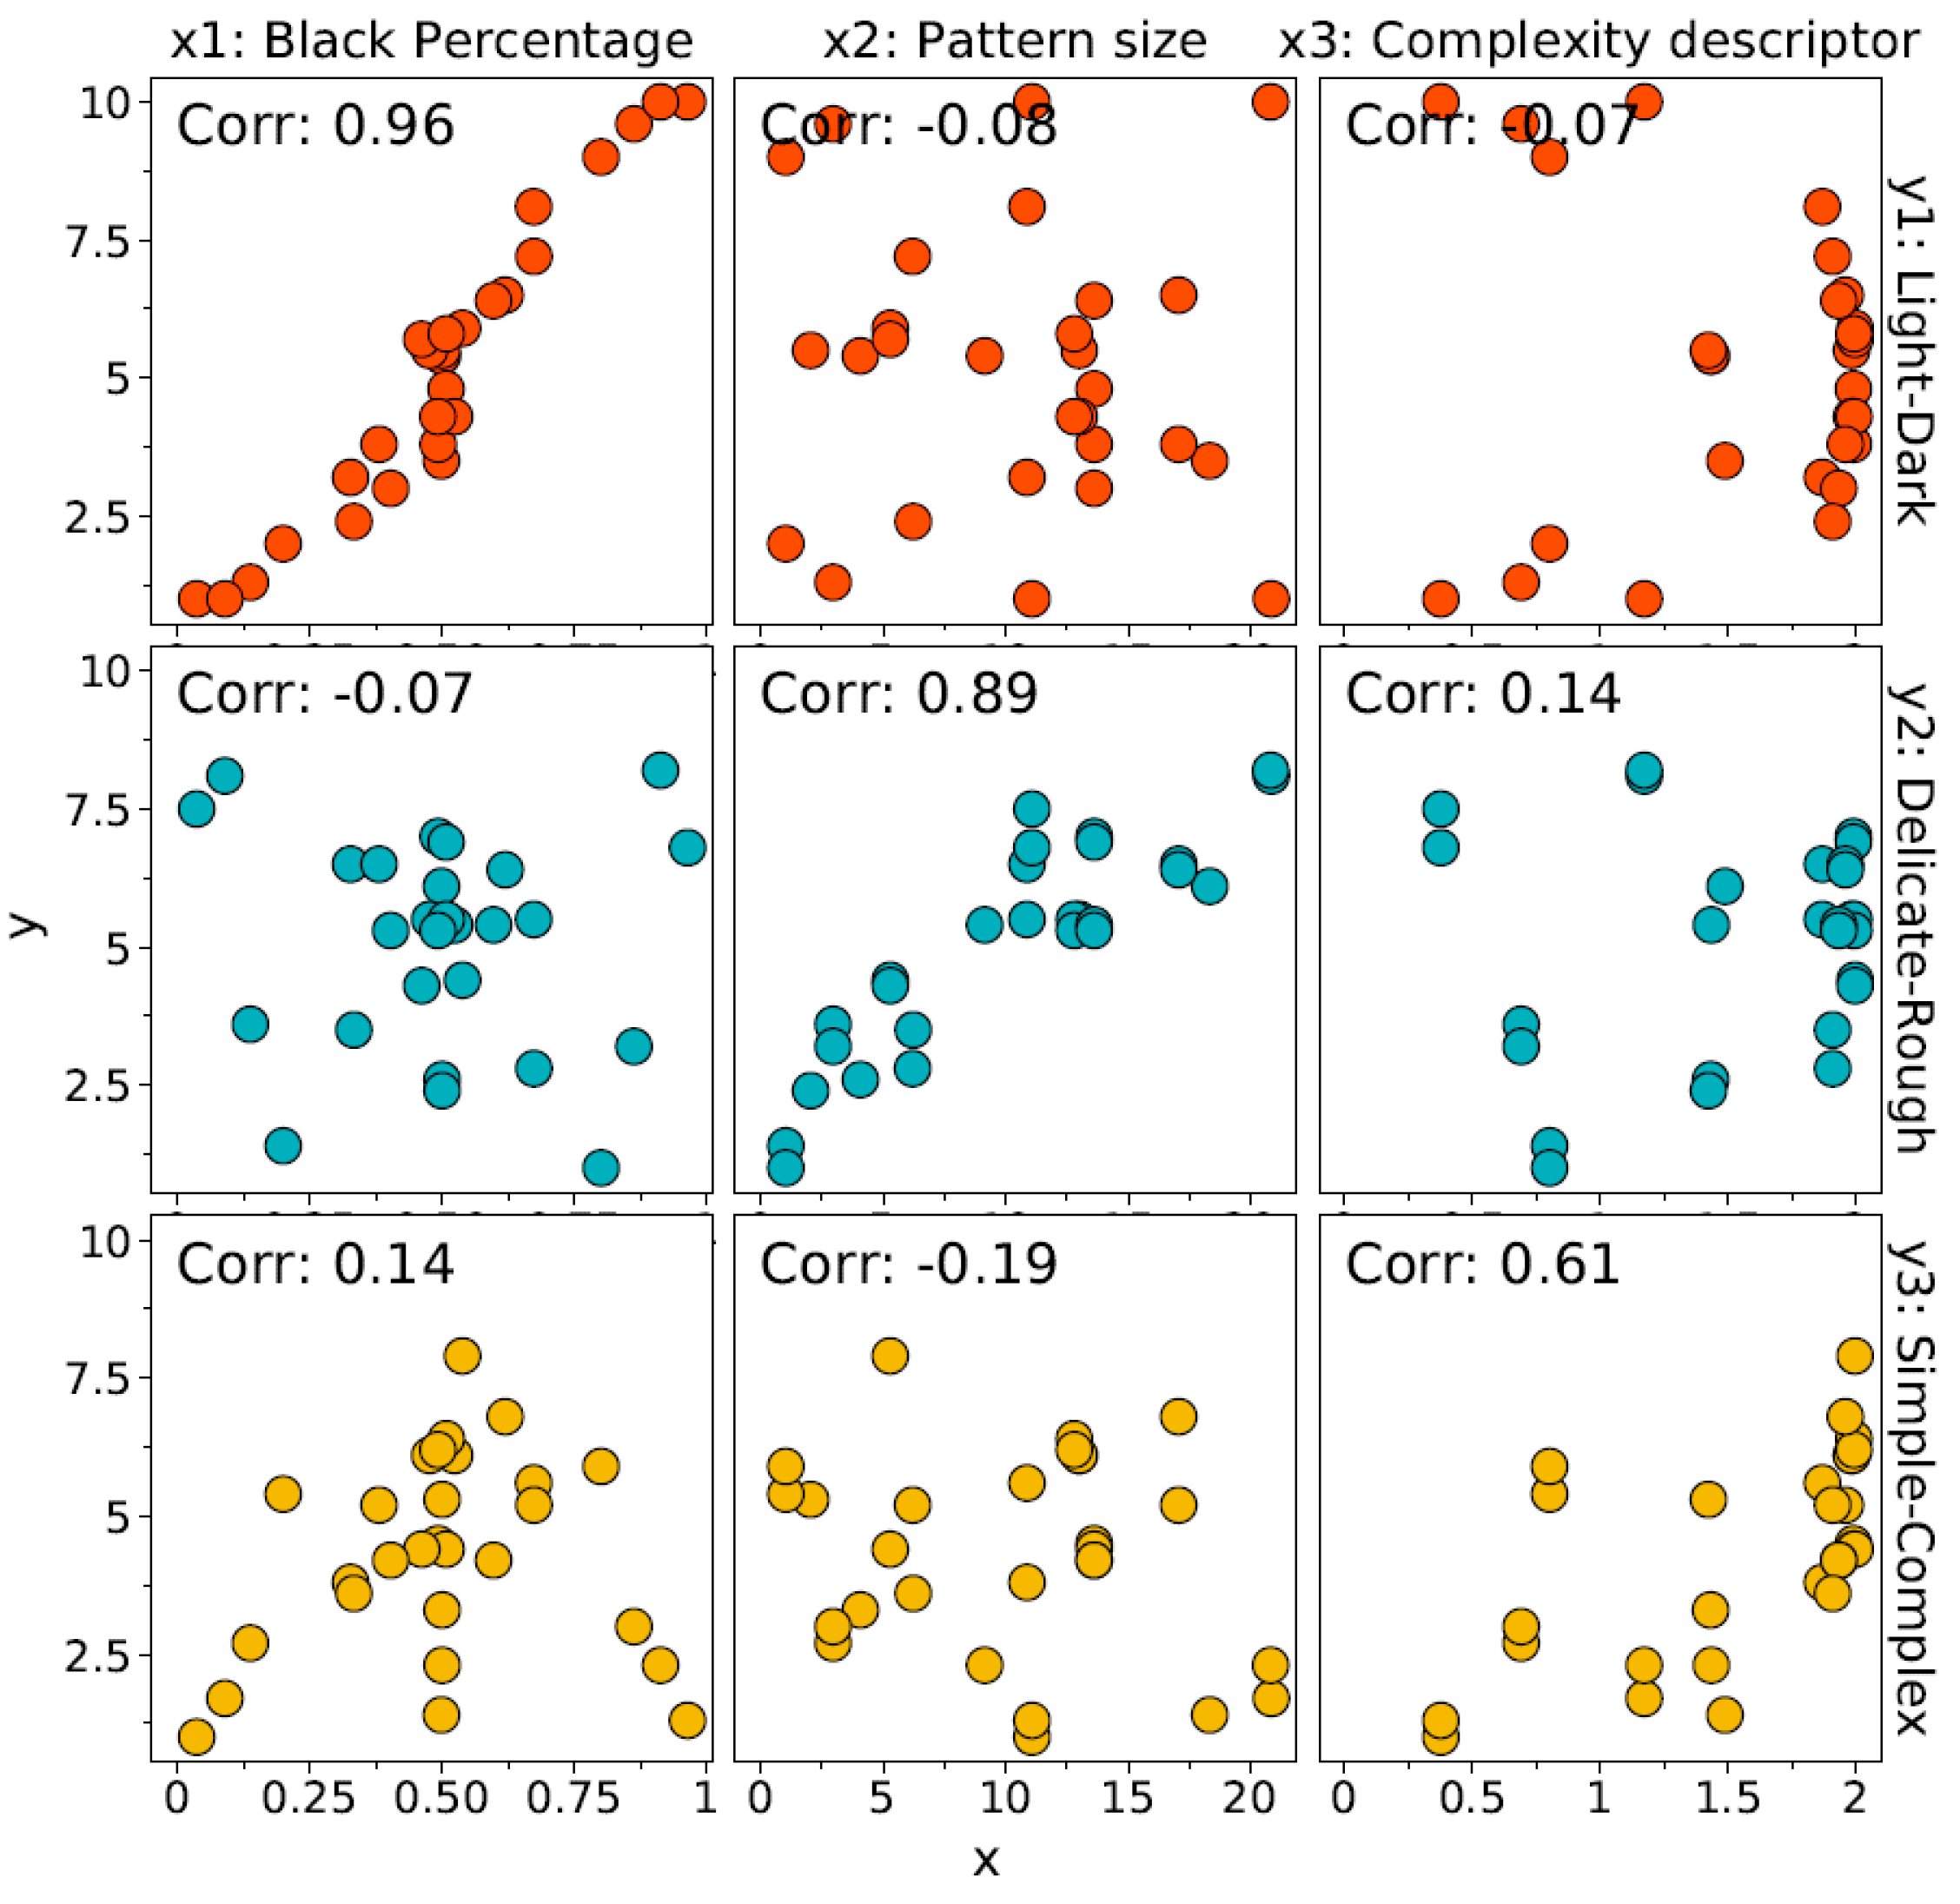
In accordance with the simulated drawings of the 28 plaid fabrics, this study obtained three important characteristic fabric parameters: (1) the black regional percentage, x1; (2) the physic size of the minimum repeat unit (centimetre), x2; and (3) the descriptor of the pattern complexity, x3:
in which is the gray level of the (i, j)-th pixel in the simulated images of yarn-dyed fabrics and , , , and stand for the average gray levels of the minimum repeat unit of the 1, 1/2, 1/3, and 1/4 parts.
The correlation scatter matrix diagram of light–dark (y1), delicate–rough (y2), simple–complex (y3), and x1/x2/x3 is shown in Figure 6. The correlations between y1 and x1 and between y2 and x2 were strong and presented a good linear correlation.
This study adopted regression analysis to obtain the linear relationship between light–dark (y1), delicate–rough (y2), simple–complex (y3), and x1/x2/x3, as shown in Table 4. The values of correlation coefficient r between the fitted value and the actual value were 0.96, 0.91, and 0.96, respectively, indicating strong correlation and good fitting effects. Analysis of variance was performed next. The F test was employed to judge the regression effect of the regression model. According to the results, p = 2E − 12, which was significantly less than 0.05. The overall regression equation was significantly effective. Therefore, it was possible to describe subjective assessments y1, y2, and y3 through the characteristics of objective fabric images x1, x2, and x3.
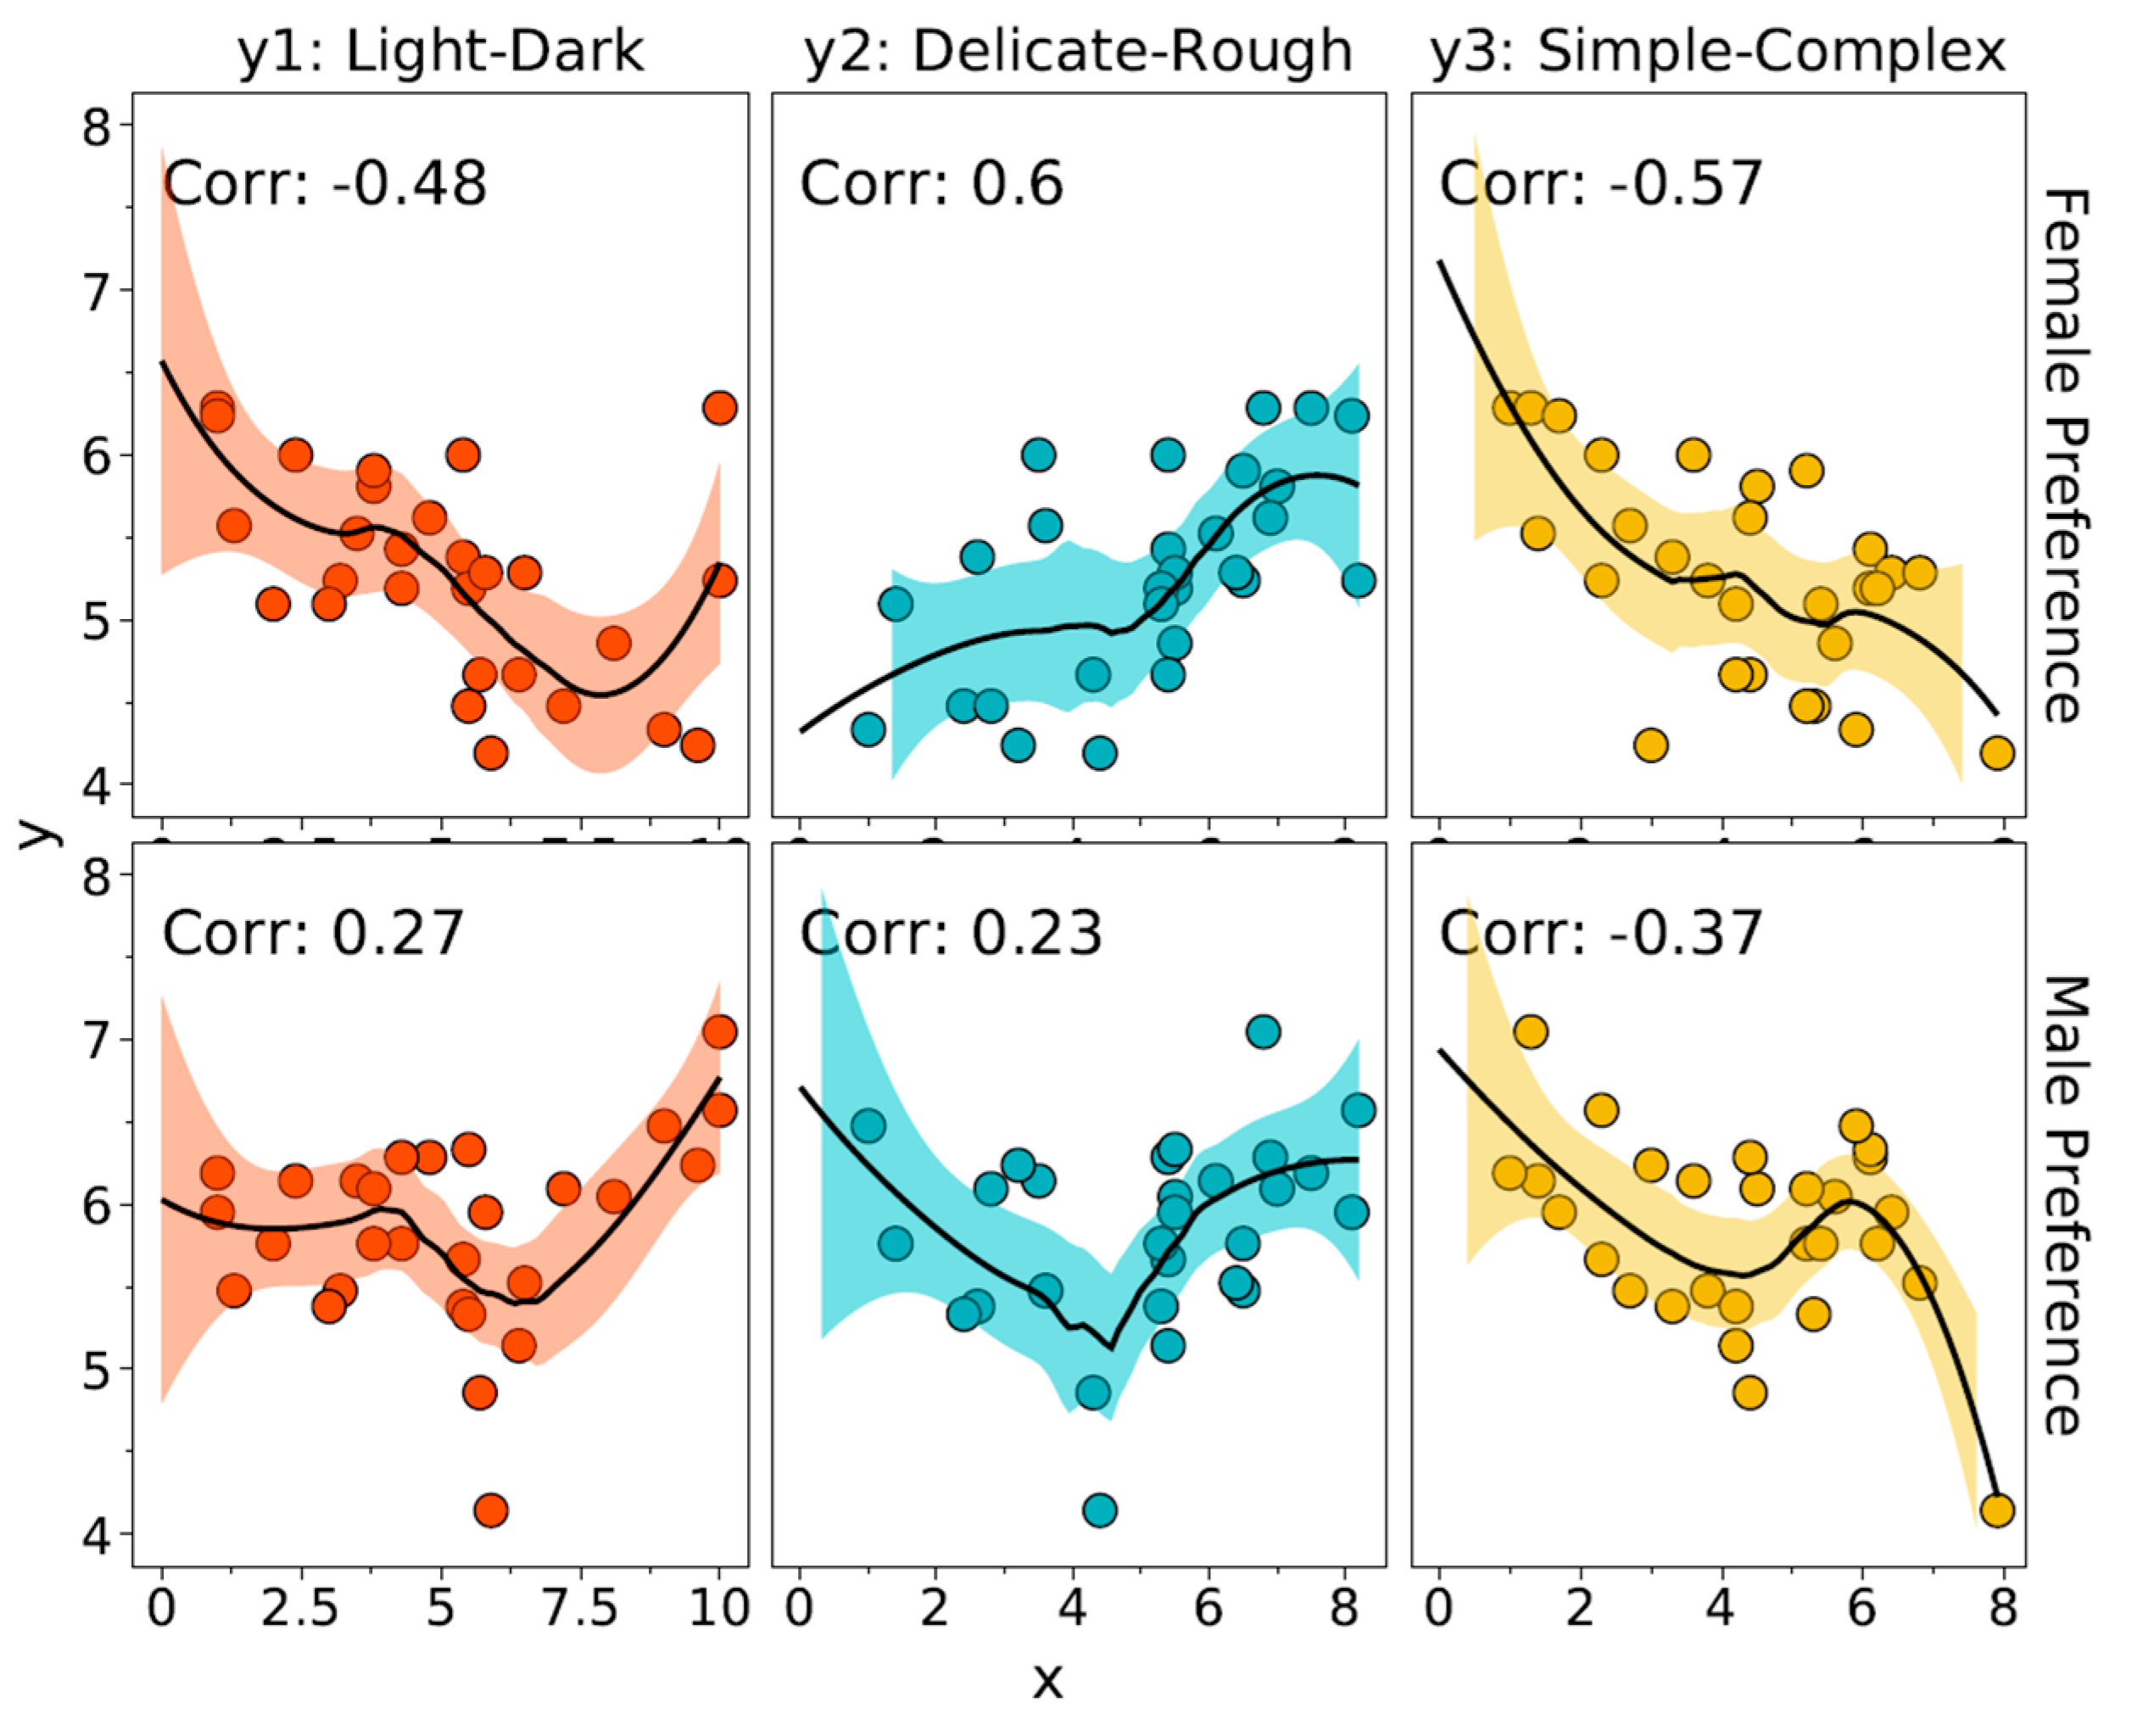
The locally weighted scatterplot smoothing (LOWESS or LOESS) is used to regression analyze the relationship between different gender preferences and three adjective pairs (y1: light–dark, y2: delicate–rough, and y3: simple–complex). Locally weighted regression, including LOWESS and LOESS, originally proposed by Cleveland [18] and further developed by Cleveland and Devlin [19], specifically denotes a method that is also known as locally weighted polynomial regression [18,19]. Locally weighted regression is based on a smoothing procedure that pays greater attention to the local points. Parameters of polynomial regression model can change with different independent variables; in other words, different observations can correspond to different group of parameters and given corresponding estimated values of regression function. The biggest advantage LOESS has over many other methods is the fact that it does not require the specification of a function to fit a model to all of the data in the sample. Instead, the analyst only has to provide a smoothing parameter value and the degree of the local polynomial, which can be used to smooth the data and remove the noise [20]. In addition, LOESS is very flexible, making it ideal for modeling complex processes for which no theoretical models exist. The analysis results are shown in Figure 7, in which the black line is the LOESS curves approximate the relationship between t different gender preferences and three adjective pairs.
- Female preference is more correlated with y2. There is a negative linear relationship between female preference and y1, y3. Female preference has a positive linear relationship with y2.
- Male preference is more correlated with y3. Male preference has a positive linear relationship with y1, y2 and a negative linear relationship with y3.
- Men prefer dark plaids, and women prefer light plaids. Both men and women prefer rough plaids, while men are more receptive to delicate plaids than women. Both men and women prefer simple plaids, and the most complex plaid (check 9) is the least liked by men and women.
3.3. Independent Sample t Test
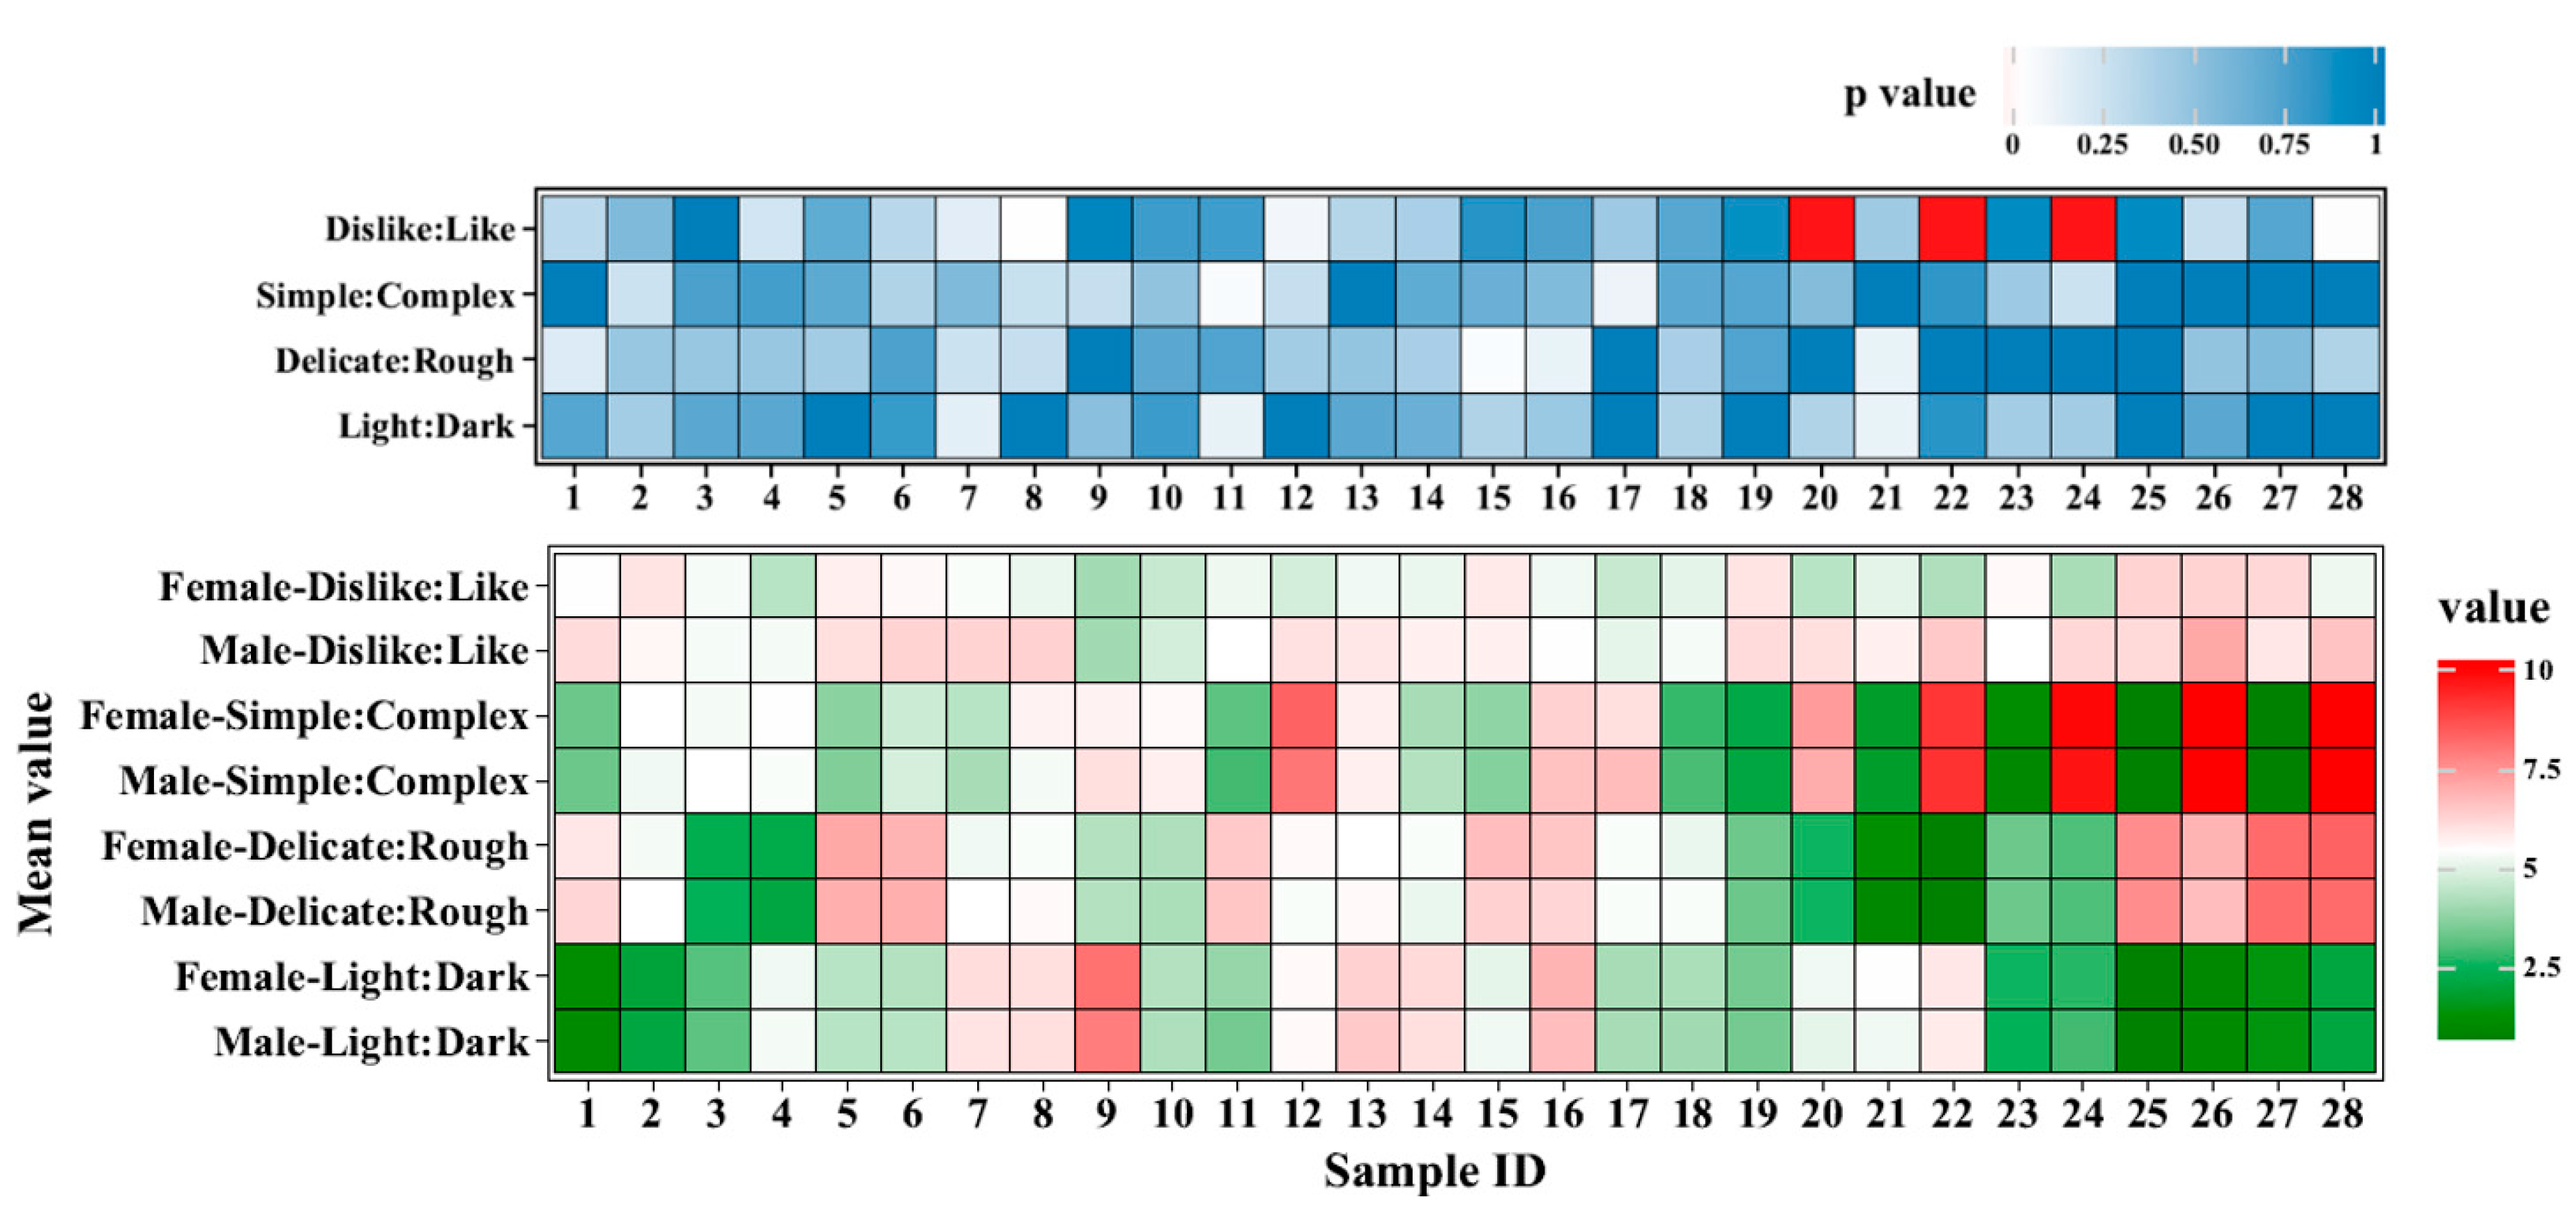
An independent sample t-test was used to analyze the differences in the preference for gingham, tartan, and windowpane from the viewpoint of gender. As shown in Figure 8 of the heat map of the independent sample t-test and the test data, the results showed that observers of different genders did not show a significant difference for gingham (p > 0.05), which indicated that different genders had a consistent preference for gingham. In other words, there was no difference in preference. Additionally, observers of different genders showed significant differences for tartan and windowpane (p < 0.05), implying that different genders had varied preferences for tartan and windowpane. According to the specific analysis, the significance level of gender for tartan was 0.05 (t = 2.04; p = 0.04). In line with the specific differences, the average for the males (5.83) was significantly higher than that for the females (5.19). The significance level of gender for windowpane was 0.01 (t = 2.90; p < 0.01). In line with the specific differences, the average for the males (5.99) was significantly higher than that for the females (4.89). Based on the above, each gender did not show significant differences in their preferences for gingham but showed significant differences in their preferences for tartan and windowpane, and the preferences of the males for the two types of plaids were significantly higher than those of the females.
An independent sample t-test was used to analyze the differences in the preferences for the 28 plaids from the viewpoint of gender. The results demonstrated that observers of different genders did not show a significantly different preferences for 25 plaids (checks 1–19, 21, 23, and 25–28) (p > 0.05), indicating that different genders had consistent preferences for them. In other words, there was no difference in preferences. In addition, observers of different genders showed significant differences in preferences for three plaids (checks 20, 22 and 24) (p < 0.05), implying that different genders had varied preferences for them. In accordance with the specific analysis, the significance level of gender for tartan was 0.05 (t = 2.03; p < 0.05). In line with the specific differences, the average for the males (6.10) was significantly higher than for the females (4.48). The significance level of gender for check 22 was 0.05 (t = 2.54; p < 0.05). In line with the specific differences, the average for the males (6.48) was significantly higher than that for the females (4.33). The significance level of gender for check 24 was 0.05 (t = 2.63; p < 0.05). In line with the specific differences, the average for the males (6.24) was significantly higher than that for the females (4.24). Based on the above, gender did not show significant differences in preferences for 25 plaids (checks 1–19, 21, 23, and 25–28) but showed significant differences in preferences for three plaids (checks 20, 22, and 24). Based on the data, the three plaids could be identified as liked by males and disliked by females.
An independent sample t-test was performed to probe into the differences in light–dark y1, delicate–rough y2, and simple–complex y3 between genders. The results showed that there were no significant differences (p > 0.05) between genders in any of the three adjective pairs of the 28 plaids.
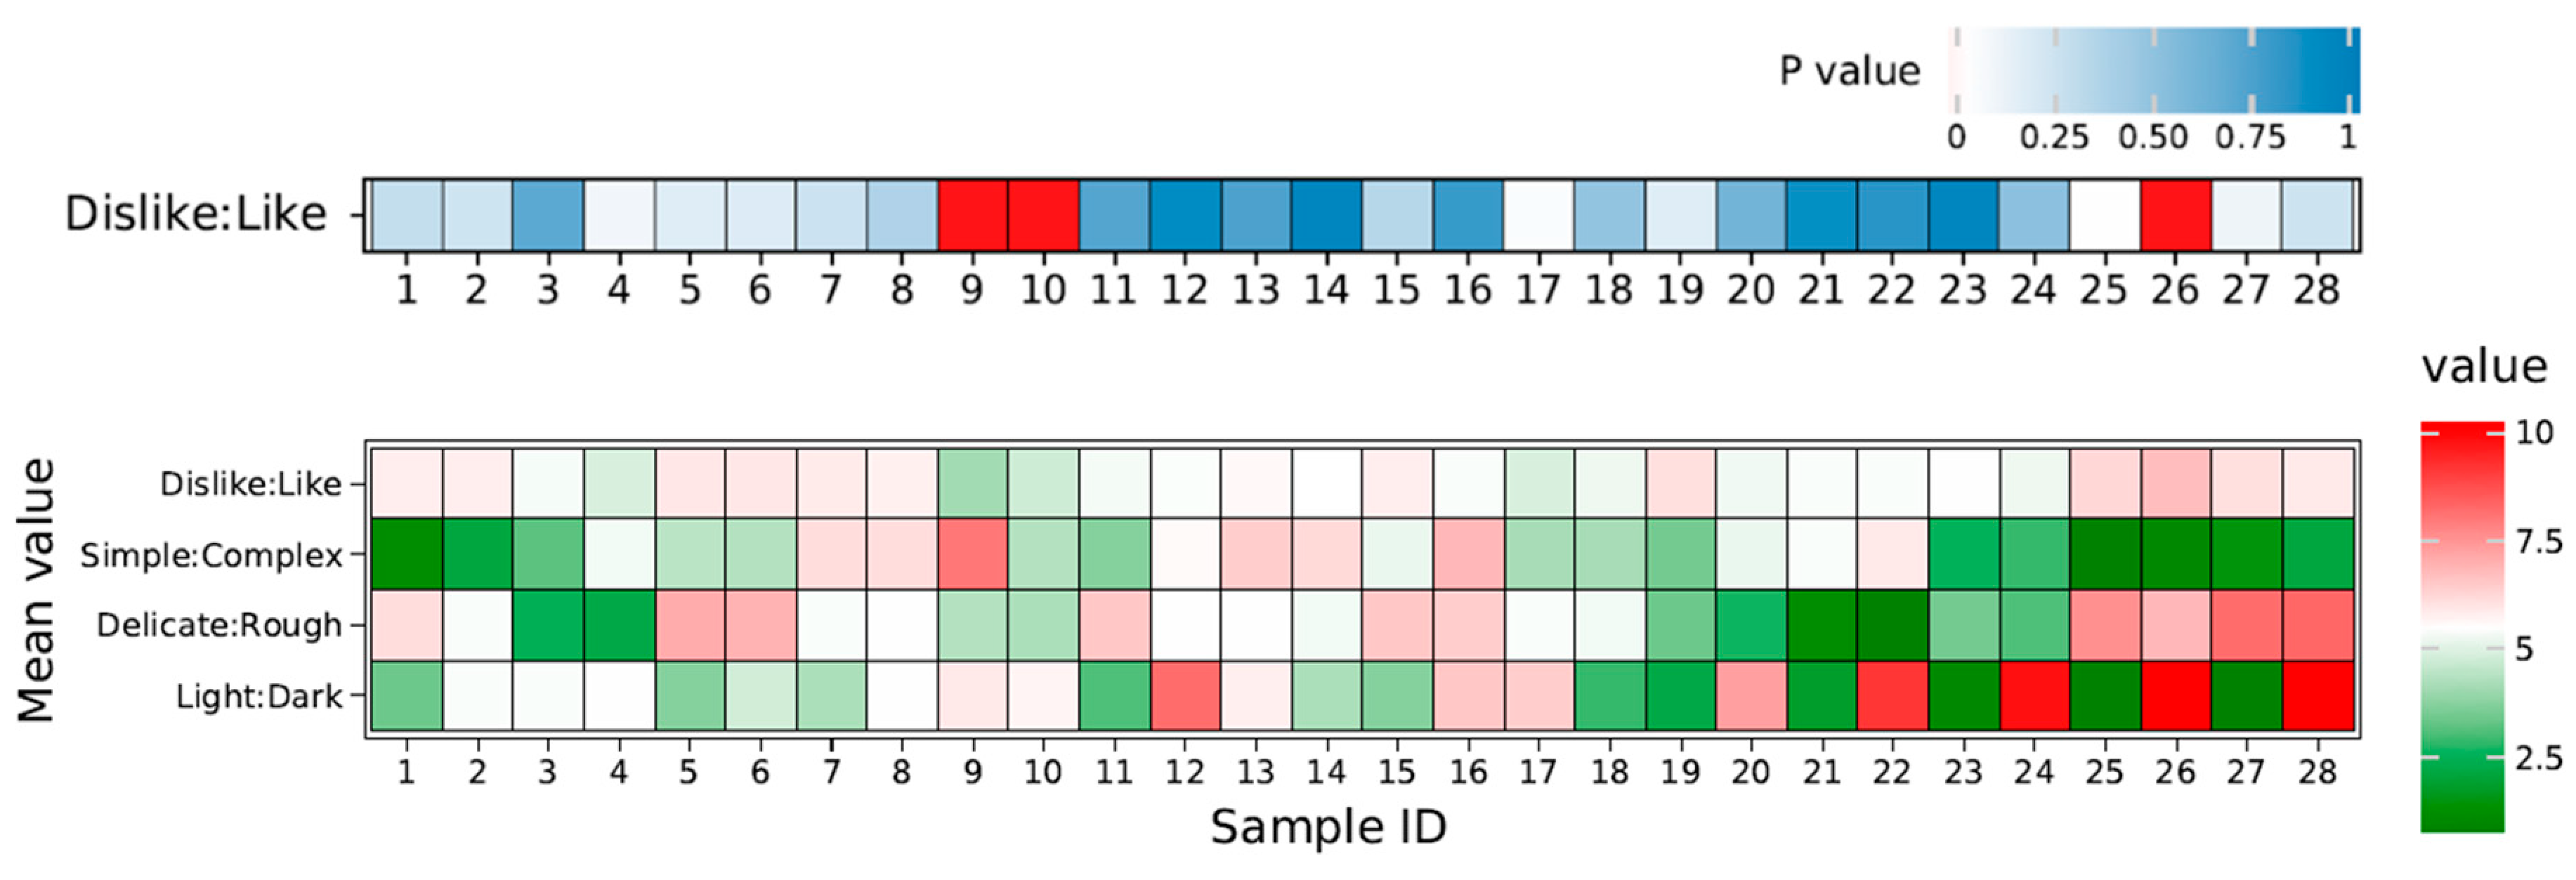
As shown in the above Figure 8, the values of simple–complex y3 for checks 20, 22, and 24 were 5.2, 5.9, and 3, respectively. If 5.5 was regarded as the median value for y3, y3 had no influence on the preferences for checks 20, 22, and 24. All the values of light–dark y1 for checks 20, 22, and 24 were more than 7, and all the values for delicate–rough y2 were less than 4. The other plaids did not have these characteristics at the same time. Hence, this study considered that, for plaids liked by males and disliked by females, y1 will be greater than 7, and y2 will be less than 4. When y1 and y2 meet these characteristics, y3 will not affect preference.
3.4. One-Sample t-Test
Because a 10-point scale was used in the experiment, 5.5 points represented neither dislike nor like. A one-sample t-test was used to study the types of plaids that were liked or disliked by both males and females, as shown in Figure 8. The one-sample t-test was used to check if the preferences for gingham, tartan, and windowpane were obviously not equal to 5.5. The results showed that there were no significant differences in the preferences for gingham, tartan, and windowpane between males and females (p > 0.05), implying that the averages for gingham, tartan, and windowpane were all close to 5.5 without statistical difference. Both men and women neither liked nor disliked the three patterns very much.
A one-sample t-test was employed to identify the types of plaids that were liked or disliked by both males and females. The one-sample t-test was used to check if the preferences of the 28 plaids were obviously not equal to 5.5. The following Figure 9 indicated that the averages for 25 plaids (checks 1–8, 11–25, 27 and 28) were all close to 5.5 (p > 0.05), the average of the preference for check 26 was significantly higher than 5.5 (p < 0.05), and the averages of the preference for checks 9 and 10 were obviously lower than 5.5 (p < 0.05). The data reflected that check 26 was liked very much by both males and females, while checks 9 and 10 were disliked very much by both males and females.
Checks 20, 22, and 24 were liked by men and disliked by women, while check 26 was liked very much by both men and women. Based on the comparison of the characteristics of these four plaids, it was possible to find out why the women disliked checks 20, 22, and 24. As can be seen from the above figure, for checks 26, 20, 22, and 24, all the values of light–dark y1 were more than 7, and all the values of delicate–rough y2 were more than 4. Thus, when the value of light–dark y1 was more than 7, women’s preference for the plaid would be prone to the influence of delicate–rough y2. For checks 12 and 28, their values of y1 were more than 7, and their values of y2 were more than 4. Their values of delicate–rough y2 were 5.5 < 6 and 8.2 > 8, respectively. These two plaids were not liked very much by both men and women. Therefore, this study found that for plaids liked by both men and women, y1 will be more than 7 and y2 will be between 6 and 8. The values of simple–complex y3 for checks 9 and 10 were 7.9 and 4.4, respectively. If 5.5 was regarded as the mean value, y3 would not influence the preference for checks 9 and 10. The values of light–dark y1 for checks 9 and 10 were more than 5 and less than 6. The values of delicate–rough y2 were more than 4 and less than 5. The other plaids did not have these characteristics at the same time. Hence, for plaids disliked very much by both men and women, y1 will be more than 5 and less than 6, and y2 will be more than 4 and less than 5. When these characteristics are met, y3 will not influence preference.
At the same time, Figure 8 and Figure 9 show that male preferences, female preferences, and overall preferences are not significantly close to red or green in the thermogram. From the specific experimental data, none of the patterns were either strongly disliked nor liked, because the mean values of male preferences, female preferences, and overall preferences varied somewhere from 4.14 to 7.05, 4.19 to 6.29, and 4.16 to 6.67 for all 28 patterns, while the total scale varied from 1 to 10.
3.5. Two-Way Mixed-Design ANOVA
We employed two-way mixed-design analysis of variance model (ANOVA) to analyze the differences in preference for gingham, tartan, and windowpane between genders with SPSS. In statistics, a mixed design variance model is used to test the differences between two or more independent groups, and the participants are measured repeatedly. Therefore, in the ANOVA model of mixed design, one factor (fixed effect factor) is the test variable, and the other factor (random effect factor) is the within-subjects variable. A repeated measures design is used when multiple independent variables or measures exist in a data set, but all participants have been measured for each variable [21]. Taking gingham as an example, different ginham lattice patterns will have different preferences. This study wants to observe whether gender is another factor affecting preferences, which can be regarded as a two-way mixed-design ANOVA.
3.5.1. Gingham
Two-way mixed-design ANOVA was employed to analyze the differences in preference for gingham between genders; the results of the analysis are shown in Table 5. The test of internal effect of the respondents showed that the F value of the interaction effect was 1.079; p = 0.361, which did not reach a significant level. Hence, there was no need to conduct the simple main effect analysis. The main effect analysis of the two independent variables implied that the differences in design independent variables (gender) among the respondents did not reach a significant level. F = 0.402; p > 0.05, implying that gender was not related to the preferences for different plaids in gingham. The average of four samples of the within-subject design reached a significant level. The F value of the inter-group effect was 2.823; p < 0.05, which demonstrated that the preferences for different plaids in gingham varied. The ex-post analysis showed that, with respect to the pairwise comparison of four averages, the difference between check 2 and check 4 was significant (the difference, on average, was 0.929; p < 0.05). The pairwise comparison of the other plaids did not reach a significant level. The average for check 2 was 5.83, while that for check 4 was 4.90. It could be judged that, in the category of gingham, the preference for check 2 was significantly higher than that for check 4.
In terms of gingham, the preference for check 2 was significantly higher than that for check 4. The values of light–dark y1 and delicate–rough y2 for check 2 were between 5 and 6, while the other plaids did not have these characteristics at the same time. The value of light–dark y1 for check 4 was between 5 and 6, while the value of delicate–rough y2 was between 2 and 3. Check 3 had the same characteristics. The values of simple–complex y3 for checks 3 and 4 were 3.5 and 5.3, respectively. Hence, both men and women preferred simple plaids. Among gingham plaids, for the plaids liked the most by the respondents, the value of light–dark y1 and the value of delicate–rough y2 were between 5 and 6.
3.5.2. Tartan
Two-way mixed-design ANOVA was employed to analyze the differences in preference for tartan between genders; the results of the analysis are shown in Table 6. The test of internal effect of the respondents showed that the F value of the interaction effect was 0.720; p = 0.745, which did not reach a significant level. Hence, there was no need to conduct simple main effect analysis. The main effect analysis of the two independent variables implied that the differences in design independent variables (gender) among respondents did not reach a significant level. F = 0.809; p > 0.05, implying that gender was not related to the preferences of different tartan plaids. The average of four samples of the within-subject design reached a significant level. The F value of the inter-group effect was 4.639; p < 0.05, which demonstrated that the preferences for different tartan plaids varied. The ex-post analysis showed that, with respect to the pairwise comparison of 14 averages, the differences between check 9 and the other plaids were significant. The differences between check 10 and checks 5–9 and 13–15 via pairwise comparison reached a significant level. The differences between check 17 and checks 5–9 and 12–15 via pairwise comparison reached a significant level. The averages of checks 9, 10, and 17 were 4.167, 4.762, and 4.905. Compared with the averages of the other plaids, it could be judged that for tartan, the preferences for checks 9, 10, and 17 were significantly lower than those of the other plaids.
As shown in the above table, the values of simple–complex y3 for checks 9, 10, and 17 were 7.9, 4.4, and 4.2, respectively. If 5.5 was regarded as the median value of y3, y3 would have no influence on the preferences for checks 9, 10, and 17. Both values of light–dark y1 for checks 9 and 10 were between 5 and 6, and both values of delicate–rough y2 were between 4 and 5. Other plaids did not have these characteristics at the same time. The value of light–dark y1 for check 17 was between 6 and 7 and the value of delicate–rough y2 was between 5 and 6. Other plaids did not have these characteristics at the same time. Among the tartan plaids, there were two scenarios for the plaids disliked the most: (1) a value of light–dark y1 between 5 and 6 and a value of delicate–rough y2 between 4 and 5; and (2) a value of light–dark y1 between 6 and 7 and a value of delicate–rough y2 between 5 and 6. When these characteristics were met, y3 did not affect preference.
3.5.3. Windowpane
Two-way mixed-design ANOVA was employed to analyze the differences in preference for windowpane between genders; the results of the analysis are shown in Table 7. The test of internal effect of the respondents showed that the F value of the interaction effect was 2.095; p = 0.029, reaching a significant level. Hence, simple main effect analysis was carried out. According to the summary, in terms of the males, F(9, 360) = 0.900; p > 0.05. With respect to females, F(9, 360) = 3.756; p < 0.01. The two values were different from those of the main effect regardless of gender (F(9, 360) = 2.328; p < 0.05), implying that the respondents had different preferences for windowpane, especially among females. The differences in preferences for windowpane among females were significant, while those among males were the opposite.
On the other hand, in terms of the independent variable of gender and 10 dependent factors, the F values (1, 400) were 0.028, 4.123, 0.591, 6.474, 0.017, 6.896, 0.016, 1.154, 0.137, and 3.753, respectively. Checks 20, 22, and 24 reached a significant level, while the other plaids did not. These values differed from the main effect F(1, 400) = 2.627; p > 0.05 with complete gender variables. The different genders showed varied preferences for checks 20, 22, and 24. Their averages by gender were as follows: check 20 (males: 6.095; females: 4.476), check 22 (males: 6.476; females: 4.333), and check 24 (males: 6.238; females: 4.238). The data showed that the men’s preferences for these three patterns were significantly higher than those of the women, while the differences in the other plaids were not significant. The results were consistent with the results of the differences in the preferences of the 28 plaids between gender verified by the independent sample t-test.
As shown in the above table, the values of dimple–complex y3 for checks 20, 22, and 24 were 5.2, 5.9, and 3, respectively. If 5.5 was regarded as the mean value of y3, y3 could not be used to describe the preferences of checks 20, 22, and 24. However, all the values of light–dark y1 for checks 20, 22, and 24 were more than 7, and all the values of delicate–rough y2 were less than 4. The other plaids did not have these characteristics at the same time. Hence, for a plaid liked by males and disliked by females, y1 will be greater than 7, and y2 will be less than 4. When y1 and y2 meet these characteristics, y3 will not affect preference.
4. Conclusions
In this paper, a psychophysical experiment was implemented to investigate the factors affecting pattern preference for black-and-white shirts. Firstly, 28 different representative patterns of plaid shirts were selected by five fashion designers together from 190 different black-and-white plaid shirts from eight fast fashion brands, which were then classified into three categories: gingham, tartans, and windowpane. Secondly, based on these patterns, 28 male and female shirts were simulated in three dimensions and presented on a calibrated computer display. The simulations were assessed by 42 observers (consisting of 21 males and 21 females) in terms of four semantic scales, including light–dark, delicate–rough, simple–complex, and like–dislike.
The experimental results revealed:
- There was no significant difference in the pattern preferences between females and males for 89.29% of the black-and-white plaid shirts.
- There was a significant difference for tartan and windowpane preferences between females and males, and the preference degree of the males was more than that of the females.
- There was no significant difference in the preference for gingham.
Furthermore, this study also demonstrated the formulation between the four semantic scales and three pattern features (including the percentage of black region, the size of the minimum repeat unit, and the descriptor of the pattern complexity). The preference degree of the females was easily affected by the semantic scale of delicate–rough.
These findings could be used to develop a more robust and comprehensive theory of object pattern preference for black-and-white plaid shirts and provide a reference for pattern design. From the above results, we can provide suggestions for clothing enterprises to avoid producing black-and-white plaid shirts that men and women obviously do not like. At the same time, the same or different preferences of men and women for black-and-white plaid shirts can provide some theoretical basis for fashion designers to design black-and-white plaid shirts that are liked for longer time. A more comprehensive theory of pattern preference is not only an effective tool to solve the inventory problem of plaid shirts in the garment industry but also an important theoretical basis for the “sustainable design” of garments, which is of great significance to the sustainable development of the garment industry. As managers of textile enterprises and fashion designers, they should make use of our research results so that they can promote the sustainable development of the garment industry.
The limit of this study is that all the 42 observers are young Chinese people, 30 of whom majored in design (at different educational levels). This is a very specific consumer group and cannot be directly used to translate the results into a universal consumer preference of patterns. However, the proposed investigation method can be used to analyze the patterns of preference of consumers of different ages and nationalities.
A limitation of this paper is that it focused on black-and-white plaid shirts and did not include solid and multi-color plaid shirts. Such color combinations in the fabric pattern may have a great influence on pattern preferences, and this effect should be studied in the future.
Author Contributions
All authors contributed to the paper. Q.J., J.Z., and C.Y. collected and organized data; Q.J. wrote the manuscript with the supervision from L.-C.C. and J.Z.; and J.Z. acted as a corresponding author.
Funding
This research received no external funding.
Conflicts of Interest
The authors declare no conflict of interest.
References
- Linkshop. Exclusive: Youngor and Other Eight Clothing Five-Year Inventory Structure Analysis. Available online: http://www.linkshop.com.cn/web/archives/2017/368169.shtml (accessed on 13 October 2018).
- Bruce, V. Visual Perception; Psychology Press: London, UK, 1996. [Google Scholar]
- Jiang, X.F. Positive-Negative Emotional Categorization of Clothing Color Based on Brightness. Engineering 2015, 5, 189–194. [Google Scholar] [CrossRef]
- Hsu, M.Y. Colour preference for Taiwanese floral pattern fabrics. Color Res. Appl. 2016, 41, 43–55. [Google Scholar] [CrossRef]
- Kim, E.Y. Emotion-Based Textile Indexing Using Colors and Texture. In Proceedings of the International Conference on Fuzzy Systems and Knowledge Discovery, Changsha, China, 27–29 August 2005; pp. 1077–1080. [Google Scholar]
- Kim, S.J. Emotion-Based Textile Indexing Using Colors. In Proceedings of the International Symposium on Visual Computing, Lake Tahoe, NV, USA, 6–8 November 2006; pp. 9–18. [Google Scholar]
- Na, Y.K. Emotion-Based Textile Indexing Using Neural Networks. In Proceedings of the International Conference on Human-Computer Interaction, Beijing, China, 22–27 July 2007; pp. 349–357. [Google Scholar]
- Lee, S.R. Effect of Motif Designs on Preferences and Image Perception. Res. J. Costume Cult. 2007, 15, 193–202. [Google Scholar]
- Na, Y.K. Emotion recognition using color and pattern in textile images. In Proceedings of the IEEE Conference on Cybernetics and Intelligent Systems, Chengdu, China, 21–24 September 2008; pp. 1100–1105. [Google Scholar]
- Chio, S.K. The Image Evaluation according to Checked Pattern Variable of Casual Shirts-Focus on Tone-in-Tone Coloration. J. Korean Soc. Cloth. Text. 2011, 35, 867–876. [Google Scholar] [CrossRef]
- Davis, F. A Study Relating Computational Textile Textural Expression to Emotion. In Proceedings of the 33rd Annual ACM Conference Extended Abstracts on Human Factors in Computing Systems (CHI EA’15), Seoul, Korea, 18–23 April 2015; pp. 1977–1982. [Google Scholar] [CrossRef]
- Davis, F. The Textility of Emotion: A Study Relating Computational Textile Textural Expression to Emotion. In Proceedings of the 2015 ACM SIGCHI Conference on Creativity and Cognition (C&C’15), Glasgow, UK, 22–25 June 2015; pp. 23–32. [Google Scholar]
- Homlong, S. The Language of Textiles Description and Judgement on Textile Pattern Composition. Ph.D. Thesis, Uppsala University, Uppsala, Sweden, 2006; p. 90. [Google Scholar]
- Barber, E.J.W. Prehistoric Textiles: The development of Cloth in the Neolithic and Bronze Ages, with Special Reference to the Aegean; Princeton University Press: Princeton, NJ, USA, 1992. [Google Scholar]
- Banks, J. Tartan: Romancing the Plaid; Rizzoli: New York, NY, USA, 2007; ISBN 978-0-8478-2982-8. [Google Scholar]
- Fortson, B.W. Indo-European Language and Culture: An Introduction; Blackwell Publishing: Oxford, UK, 2004; ISBN 1-4051-0316-7. [Google Scholar]
- Lee, C. Style Guide: Know Your Shirt Fabric Patterns [EB/OL]. Available online: https://www.alexander-west.com/styleguide/?p=288. 2009-8-3 (accessed on 13 October 2018).
- Cleveland, W.S. Robust locally weighted regression and smoothing scatterplots. J. Am. Stat. Assoc. 1979, 74, 829–836. [Google Scholar] [CrossRef]
- Cleveland, W.S. Locally-weighted regression: An approach to regression analysis by local fitting. J. Am. Stat. Assoc. 1988, 83, 596–610. [Google Scholar] [CrossRef]
- Zhang, J. Automatic inspection of yarn-dyed fabric density by mathematical statistics of sub-images. J. Text. Inst. 2014, 106, 823–834. [Google Scholar] [CrossRef]
- Field, A. Discovering Statistics Using SPSS, 3rd ed.; Sage: Thousand Oaks, CA, USA, 2009. [Google Scholar]
Figure 1.
Stock status of eight Chinese clothing companies in 2012–2016.

Figure 2.
Color clustering scatter diagram based on 190 plaid shirts in CIE LAB color space. (a) Light color distribution. (b) Dark color distribution.
Figure 2.
Color clustering scatter diagram based on 190 plaid shirts in CIE LAB color space. (a) Light color distribution. (b) Dark color distribution.

Figure 3.
Simulated drawings of plaids.

Figure 4.
Simulated drawings of men’s plaid shirts.

Figure 5.
Images used in the questionnaire. (a) Men’s shirt, (b) women’s shirt, and (c) simulated fabric.
Figure 5.
Images used in the questionnaire. (a) Men’s shirt, (b) women’s shirt, and (c) simulated fabric.

Figure 6.
Correlation analysis of the scatter matrix diagram (Corr indicates the correlation coefficient).
Figure 6.
Correlation analysis of the scatter matrix diagram (Corr indicates the correlation coefficient).

Figure 7.
Correlation analysis between different gender preferences and three adjective pairs (Corr indicates the correlation coefficient).
Figure 7.
Correlation analysis between different gender preferences and three adjective pairs (Corr indicates the correlation coefficient).

Figure 8.
Independent sample t-test and thermogram of test data.

Figure 9.
Thermogram of one-sample t-test test data.


Table 1.
Classic plaids consisting of horizontal and vertical lines and planes [17].
Table 1.
Classic plaids consisting of horizontal and vertical lines and planes [17].
| Plaid | Example | Difinition |
|---|---|---|
| Gingham |  | Gingham usually comes in a checkered pattern and is distinguished by white and colored, even-sized checks. This pattern is formed by horizontal and vertical stripes (usually of the same color) that cross each other on a white background to form even checks. |
| Tartan |  | Tartan plaid is the pattern that is most often found on Scottish kilts. This plaid consists of vertical and horizontal or diagonal stripes that cross each other to form differently sized checks. |
| Shepherd’s Check |  | This pattern is a twill-weave of small, even-sized, colored, and white checks. While this check often resembles the gingham check, the visible twill weave is what distinguishes the shepherd’s check from gingham. The houndstooth pattern originated from the Shepherd’s check. |
| Windowpane Check |  | The windowpane check is a pattern that resembles the pattern of panes on a window. The stripes that cross to form windowpane checks are often thicker and farther apart than the pattern found in graph checks. |
| Graph Check |  | This is a check pattern that resembles the crossing lines of graph paper. The graph check pattern is characterized by solid, thin, and single-colored stripes that cross each other to form even and small-sized checks. The stripes that create a graph check are thinner than the stripes in a windowpane check. |
| Tattersall |  | Tattersall is a check pattern that consists of thin, regularly spaced stripes in alternating colors that are repeated both horizontally and vertically. The stripes that create the tattersall pattern often come in two different colors and are usually darker than the background color. |
| Mini-check |  | This is a pattern consisting of very small and even-sized checks. It usually consists of one color with white and often resembles the gingham check-except that it is much smaller. |
Table 2.
Classification of the 28 plaids.
| Type of Plaid | Plaid No. |
|---|---|
| Ginham | Checks 1/2/3/4 |
| Tartan | Checks 5/6/7/8/9/10/11/12/13/14/15/16/17/18 |
| Windowpane | Checks 19/20/21/22/23/24/25/26/27/28 |
Table 3.
Four semantic scales of aesthetic emotions.
| Chinese | English |
|---|---|
| 明亮的-黑暗的 | Light–dark |
| 精緻的-粗獷的 | Delicate–rough |
| 簡單的-複雜的 | Simple–complex |
| 不喜歡的-喜歡的 | Dislike-like |
Table 4.
Summary of regression analysis of the fitting results.
| Factors | Regression Equation | Multiple R | Adjusted R Square | Significance F |
|---|---|---|---|---|
| Light–dark | y1 = 11.09 x1 − 0.39 | 0.96 | 0.93 | 2.28E − 16 |
| Delicate–rough | y2 = 1.32 + 0.50 x2 − 0.01 x22 | 0.91 | 0.81 | 4.63E − 10 |
| Simple–complex | y3 = 2.84 x3 − 0.11 x2 + 2.03 x1 | 0.96 | 0.88 | 5.88E − 14 |
Table 5.
Summary of one-way ANOVA of dependent samples for gingham plaids.
| Source of Variation | SS | Df | MS | F | p |
|---|---|---|---|---|---|
| Gender (independent factor) | 3.429 | 1 | 3.429 | 0.402 | 0.010 |
| Different plaids (independent factor) | 24.786 | 3 | 8.262 | 2.823 | 0.055 |
| Gender × different plaids | 9.476 | 3 | 3.159 | 1.079 | 0.361 |
| Intra-group | 541.553 | 80 | |||
| Among respondents (Block) | 341.048 | 40 | 8.526 | ||
| Residual | 200.505 | 40 | 5.013 | ||
| Total | 579.224 | 87 |
Note: “Gender × different plaids” indicates the interaction between gender and plaids.
Table 6.
Summary of one-way ANOVA of dependent samples for tartan plaids.
| Source of Variation | SS | Df | MS | F | p |
|---|---|---|---|---|---|
| Gender (independent factor) | 32.859 | 1 | 32.859 | 0.809 | 0.34 |
| Different plaids (independent factor) | 142.580 | 13 | 10.968 | 4.639 | 0.000 |
| Gender × different plaids | 22.117 | 13 | 1.701 | 0.720 | 0.745 |
| Intra-group | 2854.667 | 560 | |||
| Among respondents (block) | 1625.150 | 40 | 40.629 | ||
| Residual | 1229.517 | 520 | 2.364 | ||
| Total | 3052.223 | 587 |
Note: “Gender × different plaids” indicates the interaction between gender and plaids.
Table 7.
Summary of mixed-design simple main effect variance analysis of windowpane plaids.
| Simple Main Effect | SS | Df | MS | F | p |
|---|---|---|---|---|---|
| Different plaids (independent factor) | |||||
| Males | 36.233 | 9 | 4.026 | 0.900 | 0.527 |
| Females | 128.424 | 9 | 14.269 | 3.756 | 0.000 |
| Error (residual) | 1489.143 | 360 | 4.137 | ||
| Gender (independent factor) | |||||
| Check 19 | 0.214 | 1 | 0.214 | 0.028 | 0.868 |
| Check 20 | 27.524 | 1 | 27.524 | 4.123 | 0.049 |
| Check 21 | 4.667 | 1 | 4.667 | 0.591 | 0.446 |
| Check 22 | 48.214 | 1 | 48.214 | 6.474 | 0.015 |
| Check 23 | 0.095 | 1 | 0.095 | 0.017 | 0.897 |
| Check 24 | 42.000 | 1 | 42.000 | 6.896 | 0.012 |
| Check 25 | 0.095 | 1 | 0.095 | 0.016 | 0.901 |
| Check 26 | 6.095 | 1 | 6.095 | 1.154 | 0.289 |
| Check 27 | 0.857 | 1 | 0.857 | 0.137 | 0.714 |
| Check 28 | 18.667 | 1 | 18.667 | 3.753 | 0.060 |
| Error | 2561.619 | 400 | 6.404 |
© 2018 by the authors. Licensee MDPI, Basel, Switzerland. This article is an open access article distributed under the terms and conditions of the Creative Commons Attribution (CC BY) license (http://creativecommons.org/licenses/by/4.0/).
Share and Cite
MDPI and ACS Style
Jiang, Q.; Chen, L.-C.; Yang, C.; Zhang, J. Pattern Preference Analysis of Black-and-White Plaid Shirts. Sustainability 2018, 10, 3739. https://doi.org/10.3390/su10103739
AMA Style
Jiang Q, Chen L-C, Yang C, Zhang J. Pattern Preference Analysis of Black-and-White Plaid Shirts. Sustainability. 2018; 10(10):3739. https://doi.org/10.3390/su10103739
Chicago/Turabian StyleJiang, Qianling, Li-Chieh Chen, Chun Yang, and Jie Zhang. 2018. "Pattern Preference Analysis of Black-and-White Plaid Shirts" Sustainability 10, no. 10: 3739. https://doi.org/10.3390/su10103739
Note that from the first issue of 2016, this journal uses article numbers instead of page numbers. See further details here.