Article

Historical Geomorphological Research of a Ligurian Coastal Floodplain (Italy) and Its Value for Management of Flood Risk and Environmental Sustainability

1
Istituto di Ricerca per la Protezione Idrogeologica, Consiglio Nazionale delle Ricerche, Strada della Cacce 73, 10135 Torino, Italy
2
School of Geography, University of Nottingham, Sir Clive Granger Building, University Park, Nottingham NG7 2RD, UK
3
Dipartimento di Scienze della Terra dell’Ambiente e della Vita, Università di Genova, Corso Europa 26, 16132 Genova, Italy
*
Author to whom correspondence should be addressed.
Sustainability 2018, 10(10), 3727; https://doi.org/10.3390/su10103727
Submission received: 18 September 2018 / Revised: 29 September 2018 / Accepted: 8 October 2018 / Published: 16 October 2018
(This article belongs to the Special Issue Urban Sprawl and Sustainability)

Abstract

:
The alluvial plain of the Entella River (Eastern Liguria), historically affected by damaging flood events, has been heavily modified over the past 250 years by human activity and natural processes. A qualitative and quantitative analysis of the morphological and land use evolution of the Entella floodplain since the 18th century was carried out using base maps and aerial photos ranging from 1758 to 2016. These diverse sources were Geographical Information System (GIS) georeferenced. Additional information on land-use change was gathered from historical documents and recent research reports. The main transformations to the floodplain include morphological changes, e.g., narrowing, channelization, displacement of the river channel and the advance of the coastal line due to fills and embankments. In addition, there has been very significant urbanization with loss of vegetated and agricultural areas. Our results indicate the primary role of human disturbance on morphological changes and landscape modifications of the coastal floodplain, particularly over the last 200 years. Furthermore, the historical geomorphological and cartographical analysis we adopted to reconstruct the floodplain transformation represents an essential tool in flood risk mitigation and environmental sustainability management, particularly in an urbanized coastal plain historically affected by floods.

1. Introduction

Flood risk mitigation and landscape sustainability management are topical subjects. In modern urban societies, frequent flash floods and wide inundations with high levels on the ground surface due to heavy rainfall events, represent a global problem for their cost, particularly in terms of human lives and socio-economic assets. In recent years, the relationship between these natural processes and land use changes and human disturbance has been investigated, on a worldwide scale. It is widely accepted that climate changes, with sequences of very wet and dry periods, and human activities, with uncontrolled urban and industrial sprawl, have resulted in an increase in frequency and magnitude of flood events [1,2,3]. At the same time, urban planning and land management modify the environmental and landscape equilibrium, greatly increasing the hydrological hazards and the flood risk [4,5,6], especially in areas of high demographic and economic growth such as coastal strips and alluvial plains.
Mediterranean and Italian watercourses and their floodplains have been modified over the past 250 years by a combination of natural factors, such as severe floods and variations in climate, and human activities, such as channelization, land use changes, urbanization and gravel and sand extraction [7,8,9,10,11,12,13,14]. Before the 19th century river channels and land use were modified to create and increase agricultural capacities, reclaim marshes and provide flood protection [15,16,17,18]. Since the 19th century there has been very substantial urban development including new houses, factories, roads and railways [19,20,21,22,23]. The direct consequences of these human activities on river channel and floodplain morphology include: (i) narrowing, channelization, diversion, displacement and covering of the riverbed; (ii) the loss of soils due to the transformation from a natural to an anthropogenic landscape and (iii) the outward movement of the shoreline due to infilling, embankments and the construction of harbour infrastructures on the coastal alluvial plain [24,25,26,27].
The Entella River floodplain, one of the largest urbanized coastal flat areas in the Ligurian region, Northern Italy, has been historically affected by recurrent and devastating inundations; however, in recent decades, floods have more and more frequently hit the urbanized plain, causing widespread damage to buildings, infrastructures, industrial and productive sites, agricultural lands and loss of human lives.
The landscape and geomorphological dynamics of the floodplain have been influenced, particularly from the 1950s onwards, by extensive and undisciplined urbanization [18,19,20,21,22,23,24,25,26,27,28,29,30,31] due to considerable demographic and economic growth. Over a longer period, landform modifications are due to both natural phenomena, including several large disastrous floods [32,33], and increasing human activities [34,35]. Since the end of the 18th century, human interventions included channelization and diversion to provide flood protection and to increase farmlands in the plain; during the 20th century, increasing urbanization, the construction of stream banks along the riverbed, coastal defences and tourist ports along the shoreline [36], further modified the former landforms.
In this paper, morphological modifications and landscape changes of the alluvial plain reach of the Entella River over the last 250 years are reconstructed using historical, recent and current cartography and modern aerial photos [8,37,38,39], improved by the use of GIS. In addition, information about flood events, human impacts, land use changes and the expansion of urban areas was collected from historical archives and more recent works. The paper demonstrates a multi-temporal method, applicable also in other areas, for reconstructing the history of the alluvial plain and how it changes over time. Historical analysis is essential to the study and knowledge of potential damaging natural phenomena, such as floods, in space and time and their correlation with land use changes and human activity. The use of historical data in territories that are historically affected by inundation and where urbanization has increased exposure to floods, should support urban and land planners and indicate the most useful structural and urban measures, in terms of prevention and mitigation of the flood risk [30,31].

2. Methods

2.1. Study Area

The study area is the floodplain reach of the Entella River that extends for 7 km2 in the central sector of the Gulf of Tigullio (Figure 1). Three watercourses cross through the floodplain: the largest is Entella, which flows in the central sector, with the Rupinaro and Fravega streams at the western and eastern edges. The basin of Entella covers 375 km2 and comprises three tributaries: the Lavagna catchment (160 km2), the Sturla catchment (130 km2) and the Graveglia catchment (63 km2).
Figure 1 shows that the Entella starts at the confluence of the Lavagna and Graveglia streams; the Sturla joins 4 km below this confluence. The coastal floodplain results from combined and cyclical effects of fluvial and marine processes: it is mainly constituted of alluvial deposits of the Entella, rearranged by the sea wave action and drift effects along the shoreline.
The Rupinaro and Fravega streams, with a catchment area of 11.4 km2 and 4.8 km2 respectively, also contribute to the formation of the coastal plain. Alluvial deposits mainly consist of gravels and silts, associated with clayey and inorganic soils typical of ancient marshes due to the floods and migration of the riverbed in the plain [40,41] (Figure 2). Marine sediments, made up of sands and pebbles, feature along the coastal strip; man-made deposits form railway and road embankments and associated artificial surfaces along the shoreline.
The Entella floodplain is characterized by a Mediterranean climate [42,43], with dry and hot summers and relatively mild winters; there is a mean annual rainfall of 1167 mm, with a primary peak of precipitation in autumn (October–November) and a secondary maximum in winter (January) and spring (March) [44,45,46]. The historical weather station of Chiavari (5 m a.s.l.) shows no significant climate trend for annual rainfall in the 140-year period, 1876–2016; however, a substantial decrease in the number of rainy day and a resulting increase in the rainfall rate were observed, in accordance with results obtained at the Giacopiane Dam and Genoa University stations [47]. The Entella riverbed is never totally waterless: minimum hydrometric levels can be observed in summer or during protracted dry spells, whereas highest flows are recorded during prolonged or very heavy rainfalls in the autumn and winter.

2.2. Multi-Temporal Analysis

In recent years, historical cartography has increasingly become a fundamental source for the analysis of land-use and environmental changes. Historical maps provide unique information at a topographical scale and their analysis and interpretation is facilitated by the availability of cartographical material in digital form [48,49,50]. The principal maps used in the reconstruction of the 18th century morphology of the Entella floodplain and subsequent changes are listed in Table 1 and include: (i) historical maps of the middle and late 18th century; (ii) 1:9450 scale maps of Chiavari and Lavagna at the beginning of the 19th century; (iii) maps of the Entella floodplain during the Napoleonic Age; (iv) 1:9450 scale historical topographic maps of Chiavari and Lavagna (“Gran Carta degli Stati Sardi in Terraferma”) of the first two decades of the 19th century; (v) topographic map of Chiavari of the early 20th century, at scale 1:10,000; (vi) 1:25,000 scale topographic map of Chiavari and Lavagna in the first half of the 20th century; (vi) 1:5000 and 1:10,000 scale regional maps of the late 20th century. Aerial photography includes: (i) black-and-white aerial photo of the middle 20th century, at scale 1:65,000; (ii) black-and-white aerial photo map of the end of the 20th century, at scale 1:10,000, and (iii) current high-resolution aerial and satellite photos.
We integrated historical maps and aerial photos in Qgis to compare present and past configurations of the Entella floodplain landscape. Raster scans of the historical paper maps and aerial photos do not contain geographical information (i.e., longitude and latitude values) and they must be georeferenced. We selected visible landmarks, called Ground Control Points (GPC), and added them on each scanned map; next, we aligned these control points with their actual geographical location by assigning to each GPC the geographical coordinates associated with the equivalent landmarks on the modern, georeferenced technical map. As landmarks, we used targets accurately identified on the raster dataset, and in the georeferenced map, such as churches, buildings or natural benchmarks. To compute the error for each georeferenced map, we calculated the Root Mean Square Error (RMSEtot), as the square root of the mean squared error (RMSEgpc), the value that describes how consistent the transformation is between the different control points (Table 2).
On georeferenced and co-registered maps and photos, we digitized the main floodplain features, i.e., riverbanks, shoreline and the different types of land use 1758–2016. A multi-temporal cartographical comparison was carried out to reconstruct the original morphology of the floodplain and to identify, in qualitative terms, the most significant transformations, such as urban sprawl, the reduction of semi-natural and agricultural areas, and modifications to the shoreline and the river channel.
For the quantitative analysis by Qgis of the morphological and landscape changes in the floodplain, we identified the following reference points: (i) the medieval bridge “Ponte della Maddalena”; (ii) the “San Giovanni Battista” Church, in Chiavari and (iii) the “Nostra Signora del Carmine” Church in Lavagna, buildings dating before 17th century (Figure 2). Changes in channel width and coastline distance variations from date to date were referenced to these using the minimum distance technique. Furthermore, the medieval bridge has been used as reference element to measure the changes in distance between the river channel and the built-up area over the time.
In addition, the map of the town evolution (1:50,000) and the regional land use map (1:10,000) were used to evaluate land use changes and urban development (Table 1). The Coordination of Information on the Environment (CORINE) land use and cover classification [52] adopted in the Regional Map of Land use (1:100,000) (Table 1) was used to define present and previous land use of the Entella floodplain, properly adjusted with respect to the landscape information derivable from the historical maps (Table 3): because the varied current categories of agricultural areas in the Entella floodplain can be hard to recognize in the maps of the 18th and 19th centuries, we simplified and assembled them into a single cultivated area category.
Using original contemporary documents from historical archives or reported on in more recent works by other authors [32,33], integrated with data about the latest events from different sources, including newspaper articles, scientific papers, technical and event reports, a catalogue of the flood events that occurred in the Entella river plain in the period 1758–2016 was compiled. Different document sources provide with different information: relating to the past events, historical manuscripts or descriptive chronicles report only qualitative data about flood events. However, annotations about the damage caused by inundations and the involved places, are useful to evaluate the magnitude of the events and locate the flooded areas, and compare them, in qualitative terms, with the recent ones.

3. Results

3.1. Period 1758–1900

Visual inspection of maps by Vinzoni dated 1758 and 1773 reveals the original geomorphological landscape of the Entella floodplain (Figure 3). The Entella was free to wander in its floodplain, characterized by a large channel and a mouth displaced westward, compared to the present river configuration. At the bridge “Ponte della Maddalena”, the riverbed reached 200 m across (Table 4).
The Rupinaro and Fravega streams bounded the western and eastern edges of the plain respectively. Minor creeks were in the inland floodplain area: they represented fluvial channels, called “beudi”, which drained the surplus of water from marshlands to the main river or direct to the sea. Because of the absence of concrete levees and banks along the riversides, freshwater marshland formed near the mouth of the river, replenished during floods. These marshes were reclaimed by the end of the 18th century following work on the channel [53,54]. There were beaches along the entire shoreline, next to the mouth of the Entella River and in front of the medieval settlements of Chiavari and Lavagna, up to the edges of the floodplain. The measured distances between the sea and the bridge “Ponte della Maddalena” are reported in Figure 4. Historical documents and manuscripts reported in more recent works [55,56,57] indicate the distance of the sea from the Chiavari medieval walls (Table 5).
The medieval settlement of Chiavari developed westward and incorporated the village of Rupinaro; in the 18th century (Figure 5), the municipal area stretched between the foothills and the market gardens that occupied most of the coastal strip. In the East, the small village of Lavagna stands along the ancient Roman Aurelia Way.
During the 18th century, vegetated areas with horticulture, agriculture and woodland were the dominant land type, the area of which accounted for 84% of the total land, and small artificial surfaces occupied only 6% of the flat area (Table 6, Figure 5A). The floodplain was largely occupied by agricultural land, with market gardens, olive groves, vineyards and fruit orchards, both in the coastal sectors and in the inland areas (74%); there was some woodland at the mouth of the river and trees grew on the banks (5%), while shores represented the 5% of the natural spaces (Table 7, Figure 6A).
At the end of the 18th century, significant flood protection works were carried out to protect the plain [41,51,52]: these included the reclamation of marshland next to the mouth, which was identified as rudimentary channelization with fences and levees along the western riverbank, and a channel diversion toward the east.
In the early 19th century (Figure 7A), the artificial canals to the east of Chiavari were still in use. The main morphological effect of human impact was the eastward movement of the river mouth and the marked narrowing of the channel, to a minimum of 89 m in 1800 (Table 4). New cultivated areas replaced the old marshland next to the mouth, increasing the area of the plain covered with vegetation (84%); the moderate expansion of Chiavari slightly increased artificial surfaces, whose area accounted for less than 10% (Table 6, Figure 5B). Market gardens, olive groves and orchards were the dominant land uses (77%) (Table 7, Figure 6B). The wood at the mouth of the Entella, in a place called Il Prato, belonged to the noble Rivarola family who established a plantation of mulberry trees along the river [58]. The wood was composed of willows, alders and lime trees, all species that grow in wetlands and along rivers [59]. Visual evidence of this wood is provided by a pen drawing by William Strangways (“From above Chiavari on the road to Genoa”, DocSAI Center, Topographical Collection, Genoa), which also shows the flat area, with a characteristic chessboard pattern of land plots.
The interventions along the river favoured the sedimentation of alluvial deposits and shoreline advance, due to the continuous supply of materials to the plain and the beaches. Consequently, there was an increase in length of the distance between the coastline and the reference points, up to the maximum value in 1826 (Table 4). The urban development of Chiavari and Lavagna during the 19th century was moderate: only a limited and discontinuous expansion took place toward SW in the coastal strip between the mouths of the Entella and the Rupinaro, previously almost exclusively occupied by market gardens or marshland, whereas a small suburban district grew along the western riverside next to the “Ponte della Maddalena” bridge (Figure 5). Between 1868 and 1870, the construction of the Genova-Pisa railway line required the construction of embankments along the shorelines and concrete levees upstream and downstream and the building of a bridge over the river. These works narrowed the flow section of the lower stretch of the river channel.

3.2. Period 1900–2016

During the 20th century (Figure 7B), there was very rapid urbanization of the coastal floodplain: new buildings, roads, bridges, commercial and production sites replaced many cultivated and vegetated areas. In the early 20th century, vegetated regions were reduced by 10% and the built-up areas increased fivefold over the century (Table 6; Figure 5C). The discontinuous urban fabric characterized the coastal sectors (23%), surrounding the continuous residential districts (11%) of the historical centers of Chiavari and Lavagna (Table 7; Figure 6C). The municipal development of the two seaside towns was rapid, with a marked expansion in the coastal sector of the plain and towards SW and the Entella riversides (Figure 4). In Chiavari entirely new exclusive neighbourhoods were built between the historical center and the railway, and secondarily in Lavagna, between the historical center and the Entella. Many were built for wealthy people who returned from North and South America, where they had migrated to seek fortunes at the end of the previous century. Cultivated land account for 52% of the total area and dominate the middle and inland sectors of the plain: olive groves survived at the foot of the hills, and woodland along the riversides (Table 6, Figure 5C). Around 1910, channelization interventions with concrete levees were carried out along the lower stretch of the Entella River [53,60] and next to its mouth due to the construction of the new bridge “Ponte della Libertà” about 250 m upstream of the existing railway bridge [41]. The town development toward the river caused a marked channel narrowing at the “Ponte della Maddalena”, up to a minimum value of 58 m in 1936 (Table 4). The artificial canals to the east of Chiavari were gradually completely covered and connected to the urban underground water mains to collect and drain the storm sewage. At the present day, they still work and drain the water to the Entella channel.
The most important landscape modifications took place between the 1950s and the 1980s (Figure 5). Post-war population increase and economic growth caused rapid and massive urban sprawl in both Chiavari and Lavagna. By 1964, artificial spaces accounted for 53% of the floodplain (Table 6, Figure 5D), with most being discontinuous built-up areas (26%) (Table 7, Figure 6D). The residential area of Chiavari extended in the western sector of the floodplain and inwards along the western bank of the Entella; on the other riverside, the municipal areas of Lavagna extended as far as the river (Figure 5). Between the 1960s and the 1970s, the coastal sector of the floodplain was heavily urbanized with residential and tourist developments from the shoreline up to the foothills, with agricultural areas interspersed within the discontinuous urban fabric that characterized the inland suburban districts of Chiavari and Lavagna and the village of San Salvatore (Figure 5). The channelization of the lower stretch of the Entella was completed with the construction of the new bridge “Ponte della Pace” along the Aurelia Way, upstream the railway and downstream the existing bridge “Ponte della Libertà”. Since the 1950s–1960s, the flow section of the river in its lower stretch has stabilized: no substantial changes in channel width have been observed at the bridge “Ponte della Maddalena” (Table 3).
Starting from the latter 19th century, the coastline was heavily modified and there was a general regressive trend. The increased demand for building materials for construction caused the extraction of sand and gravel from the beaches and the Entella riverbed, contributing to shoreline retreat [61]. In the 1950s–1960s, shores were halved compared to the previous century (Table 7, Figure 6D) and the floodplain retreated, up to a minimum value in 1954, indicated by the values of the distance measured between the coastline and the reference points (Figure 4). There was a short break in the period 1955–1970, due to the supply of newly extracted material derived from construction works for roads, motorway E80 and railway networks [36].
The last relevant morphological modification affected the shoreline in the 1970s, with the construction of the tourist ports of Chiavari and Lavagna and the associated marina. The interventions included embankments of a new sea promenade, fillings and the building of two long breakwaters next to the mouth of the Entella. This increased erosional processes due to a remarkable reduction in fluvial sediment supply and the conveyance of sediments to the deeper seabed. The construction of coastal defence structures in recent years, such as groynes, seawalls, submerged breakwaters and the artificial nourishment from land sources, has been successful in partially reducing the erosion of shores and coastline, and Figure 4 shows that the values of the distance between shoreline and the reference points are unvaried or slightly increased.
The rapid increase of the built-up area between the 1950s and 1980s caused the almost total saturation of the coastal sector of the floodplain (Figure 5). By 1986, artificial surfaces occupied more than 67% of the floodplain (Table 6, Figure 5E): continuous built-up areas are predominant (40%), whereas olives groves and agricultural land are strongly reduced (24%) and survive in the floodplain inland area and along the foothill, interspersed with a discontinuous urban fabric (21%) (Table 7, Figure 6E). The woodland at the mouth of the Entella River was also much reduced; at present a small pinewood (0.4 ha) survives in the municipal parks along the two riverbanks between the modern bridges.
In the last decade of the 20th century and in the early 2000s the morphological setting of the plain and its landscape remained almost unchanged, although urbanization continues in the inland area near S Salvatore (Figure 5). At the present day, the Entella plain is dominated by artificial surfaces, which account for 71% of the total area; vegetated regions, both natural and agricultural, account for less than 25% (Table 6, Figure 5F). Artificial areas include continuous (46%) and discontinuous (19%) urban fabric, port areas (6%) and artificial, non-agricultural vegetated areas (1%) (i.e., green municipal areas); agricultural and natural vegetated areas included mainly complex cultivation pattern (19%) (i.e., open field and under plastic or glass cultivation of vegetables, aromatic plants and fruit trees and flower nurseries) interspersed with natural vegetation, olive groves (1%) sometimes mixed with vineyards or chestnuts, mixed forest and shrub or herbaceous vegetation association (2%), beaches (1%) (Table 7, Figure 6F). There is a continuous built-up area along the entire coast of the floodplain (Chiavari and Lavagna), between the shoreline and the foothills. Small scattered patches of agricultural areas and natural/semi-natural vegetation are interspersed within a discontinuous urban fabric along the riversides in the inland floodplain region. Very small pebbly beaches characterize the shoreline in front of Chiavari, between the tourist port and the rocky coast to the west; larger sandy beaches stand between the Chiavari marina and the mouth of the Entella to the east. The recent arrangement of the marina and the enlargement of the tourist port of Chiavari further modified the shoreline: interventions included fillings, groynes and the prolongation of the breakwater (Figure 6F).

3.3. Summary of Land Use Changes

Table 8 shows the changes in land use types from 1758 to 2016: vegetated land and watercourse have decreased, with a total decrease of 270.2 ha and 14.1 ha respectively, and artificial areas have largely increased, with a total increase of 319.9 ha. In particular, from 1826 to 1936, the growth rate of artificial areas was the highest (79%) with an increase of 118.2 ha, which account for 34% of the total artificial surfaces; vegetated areas and watercourse have shown the maximum decrease, with a reduction of 123.3 ha and 11.9 ha, which account for the 37% and 26% of the total land occupied by vegetation and inland water, respectively. In the years before and after the Second World War (1936–1964), artificial areas have continued to increase with a considerable growth rate (57%), whereas vegetated areas are further reduced with a decrease rate of 31%: after 1964, artificial and vegetated areas show a continuous increasing and decreasing trend, respectively, with rates gradually lower.
Changes in land use categories are shown in Table 9. From 1758 to 2016, olive groves are greatly reduced with a total decrease of 28.9 ha, which account for 83% of their total surface: compared to the area occupied by each land use category, it represents the most significant transformation observed over the entire period, with the highest decrease rate (48%, from 1964 to 1986). Shores and complex cultivated land have decreased, with a total decrease of 15.3 ha and 208.9 ha respectively, which account for 72% and 30% of the area occupied by these natural and agricultural land respectively.
To highlight the human disturbance upon the landscape of the floodplain, we assembled land use categories in three main categories, built-up areas, agricultural and natural land (Figure 8): it shows the overall trend of urbanization and increasing of built-up areas, at the expense of agricultural and natural land.

3.4. Historical and Recent Flood Events

We identified 51 floods from 1758 to 2016, with an average of 1 event every 5.2 years. Based on the available information about the level of damage, 10 events can be classified as medium and 16 as high or very high magnitude; in two cases, the Entella flooding caused a total of 3 fatalities. It is necessary to specify that the historical sources do not report evidence about relevant inundation from 1796 to 1880, but we cannot exactly know, if this is due to information gaps in the ancient documents or to the absolute absence of phenomena. However, it is plausible that some flood events occurred, similar to what happened in the same period in other Ligurian areas [13].
From 1758 to 1950 we counted 22 flood events, with an average of 1 event every 8.7 years; 14 floods in the period 1950–2000, with an average of 1 event every 3.6 years, and 15 in the 16-years period 2000–2016, with an average of 1 event per year.
The oldest event occurred between 12 and 18 April 1772; a large and damaging flood took place in the western riverside, destroying bridges and damaging buildings, harvest and cultivated land. The most recent event occurred on 9–10 February 2016, when the Entella river overflowed at several places along its medium and final stretch, and large portions of the plain neighbouring the channel were flooded, causing damage to buildings, farms, productive sites and leisure facilities along both riversides.
From 1758 to 2016, heavy rainfalls and intense rainstorms caused both regular and flash floods: flooded areas are historically the flat regions neighbouring the river channel along both riverbanks, where San Salvatore village and the present inland suburban districts of Chiavari stand, and large sectors of the coastal plain at the mouth, including several present residential districts of Chiavari and Lavagna (Figure 9).
The most exceptionally damaging floods events occurred on (i) 14–15 October 1953, when the highest maximum peak discharge (1990 m3/s) and the highest maximum hydrometric level (7.57 m) were measured [44]; (ii) 24 November 2002, when the water level rose remarkably in the Entella river and in some of its tributaries (Lavagna stream) flooding large sectors of the floodplain and the Lavagna valley floor with significant damage to buildings, roads and industrial sites; (iii) 10 October 2013, when large portion of the plain and the Lavagna and Sturla valley floors were inundated and the flood wave caused two fatalities due to the collapse of a bridge in the inland of Chiavari; and (iv) 10–11 November 2014, when the town of Chiavari was largely occupied by waters due to the synchronous flash flood events in the Entella river and the Rupinaro stream, at the western boundary of the plain, caused by very short but intense rainfall events, with extensive damage to shops, basements, garages, roads and buildings in the urban area and to riverbanks, leisure and tourist facilities, industrial and commercial sites along the riversides (Figure 9).

4. Discussion

Historical analysis allowed us to reconstruct the original landscape of the Entella floodplain and its modification due to human interventions over the last three centuries.
In the comparison of historical maps, we identify trends in land use changes and channel morphology:
  • The increase in built-up areas over the entire period 1758–2016, particularly in the late 19th century and after the Second World War, between the 1950s and the 1980s (Figure 5). Transformation from natural to artificial landscape is linked to the urban growth in the coastal and, later, in the inland sectors of the floodplain, with the gradual construction of residential urban and suburban districts and the consequent development of transportation and road networks, industrial sites, port areas and leisure, tourist and service facilities (Figure 10).
  • The gradual loss of agricultural land since the 19th century. Human activity is the major factor in this land use change: in the 18th and the early 19th century, cultivations occupied large portions of the plain, and agricultural land was even increased at the end of 18th century as result of human intervention along the channel to reclaim marshy areas at the mouth. Since the late 19th century, the urban sprawl of Chiavari, Lavagna and the village of San Salvatore converted agricultural land into residential and technical areas (Figure 10).
  • The increasing density of built-up area in the urban area, with a continuous urban fabric between the shoreline and the foothills (Chiavari and Lavagna) and along both the riversides in the inland sector of the plain (sub-urban districts of Chiavari and San Salvatore). Figure 11 shows the soil consumption in the floodplain (i.e., the conversion of natural land, with healthy soils and intact habitats, into technical areas for industrial, agricultural and mainly urban human settlement, with concomitant negative effects upon landscape and its resources) and population increase in Chiavari and Lavagna over the last 150 years (1861–2014): most intensive urbanization and land use change phases are closely correlated to the higher economic and population rate of growth.
  • The moderate urban development of Lavagna towards the Entella riverbed, especially next to the mouth, where small nurseries, market and vegetable gardens occupy a well-maintained plain: we attribute this fact to the marshlands and wetlands which endured over a long period of time in this sector of the plain, until the 20th century, due to the absence of concrete levees along the eastern riverside (Figure 12). Today this special landscape is included in the list of Italian Historical Rural Landscapes and is known as a landscape of the ‘peri-urban vegetable gardens in the valley of the Entella River.’ It is characterized by a mixture of different cultivations including viticulture and vegetables such as cauliflowers, broccoli and basil [62].
  • A reduction in the channel width, particularly in the final stretch, linked to the construction of fences and rudimentary levees at the end of 18th century to protect the plain from the recurrent floods, and later to the gradual construction of concrete levees, required for the building of new bridges at the mouth and the Genoa–Pisa railway line since the late 19th century (Figure 12).
  • The progressive regression of the coastal line since the latter 19th century: we attribute this trend to the extraction of sand and gravel from the beaches and the Entella riverbed to satisfy the increasing demand for building materials. During the 20th century, and particularly in the 1970s, sea embankments, coastal defences and harbour infrastructures modified the coastline, and new artificial areas were created in place of beaches and natural spaces. Moreover, interventions including channelization, gravel and sand quarrying, and the construction of long breakwaters at the mouth of the Entella, contributed to a reduction in sediment supply and the progressive and continuous retreat of the shoreline (Figure 4).
  • A decrease in distance between the river channel and the built-up area: the residential and industrial development of the plain has caused the gradual reduction of the distances between the watercourse and the built-up area, particularly on the western riverside (Chiavari), where the ancient flood bed was obliterated in the 20th century by the gradual construction of roads, buildings, craft warehouses and small business next the riverbank (Figure 13). We observed that the largest reduction of distance from the channel is closely correlated to the most intensive urbanization phase and rate of population growth.
  • An increase in the frequency with which flood events occur since the 20th century: from an average of one event every 3.6 years in the 50-year period 1950–2000 to one event every year in the last two decades. The number of flood events resulting in high damage is seemingly decreasing compared to the 20th century, but they are increasing in percentage, up to 50% of the total events; furthermore, since 2000, three exceptional floods have occurred (2002, 2013, 2014).
  • An increase in flood risk in the entire urban plain, linked to the presence of buildings, roads, craft warehouses, industrial sites and shopping centers at inadequate distance or next to the riverbanks, areas which were historically occupied by waters during the flooding of the Entella River. The almost perfect overlap between the areas historically flooded and those inundated during the exceptional floods in 2014, highlights the negative impact of land use changes and human disturbances within the flooding areas related to uncontrolled urbanization and insufficient land management in terms of prevention and mitigation of flood risk.
Historical analysis highlights the fragile environmental equilibrium of the Entella floodplain: urbanization represents an irreversible process that has deeply modified the landscape, increasing both vulnerability and flood hazard. Evidence of the Entella landscape fragility is the considerable damage suffered by the towns of Chiavari and Lavagna during several large floods, with flow values closer to a 30-year flood, that occurred in the last two decades. Due to the high impact that flood events have on the economy and the society, flood risk mitigation is a priority issue for regional and city administrations. In this sense, planners and decision-makers have to set the most suitable urban and structural measures aimed to mitigate the flood risk and the negative impact of the urban sprawl. Since re-establishing the original landscape and pre-urban channel conditions is unrealistic, it is necessary to plan sustainable structural and non-structural measures.
From this perspective, the supposed construction of up to 5 m embankment walls along the Entella riverbanks in order to restrain the 200-year flood [63] appears incompatible with the sustainable management of the landscape of the Entella valley and river. In addition, the possible building of the new district purification plant at the mouth of the river would have an even more negative impact on an area which shows naturalistic and landscape values. Sustainable measurements aimed to mitigate flood risk should involve the embankment naturalization, the establishment of new green areas (urban parks, gardens) along the river and, where possible, the demolition of some buildings, in order to reduce soil consumption.

5. Conclusions

This paper reconstructs the transformation of the landscape of the Entella floodplain and its land use due to human impacts over the last 250 years. Until the end of the 18th century, landscape changes were moderate, and the former landforms were preserved. Since the early 19th century, and particularly after the 1950s, rapid urban sprawl deeply modified the geomorphological landscape of the floodplain and radically transformed the semi-natural environment. Morphological changes include channelization and diversion of the Entella and the alteration of the shoreline due to sea embankments, coastal defences and harbour infrastructures: since the 19th century, human interventions along the river and the coastline, combined with land use changes, caused shoreline retreat with a significant reduction in the width of beaches.
The urban development, with an excessive concreting of large original vegetated areas, caused unavoidable modifications to the morphological setting of the floodplain. Land use changes, soil consumption, covering, narrowing and channelization of the watercourse through the building of rip-raps and concrete walls, often raised higher than the surrounding surface, increase the flood risk for the population living in coastal areas [31,34,35].
This work shows how historical analysis is essential to improve our knowledge of the interactions between human activities and the morphological features of floodplain, watercourses and their dynamics [64,65], such as floods, in a coastal environment. If correctly analyzed and interpreted, historical cartography provides unique information on land-use evolution and hydrological changes through the centuries. This knowledge is of importance for the mitigation of flood risk, safeguarding the population and also the reclamation of the landscape in terms of conscious and sustainable development of the territory and its resources. Measures to mitigate the Entella flood risk have to take into account the primary setting of the floodplain and its changes over the time due to human disturbance: in this perspective, invasive works, such as embankment walls up to 5 m tall, as planned by the basin master plan, are incompatible with the fragile landscape of the urbanized floodplain. Analysis of historical flood events should be the basic instrument to locate the areas occupied by waters in the past and assist the planners and decision-makers of city administrations with land planning and landscape management and with the realization of the most suitable urban and structural measures in terms of prevention and mitigation of flood risk.
Our findings highlight the interplay between human impacts and morphological and landscape modifications in a small coastal urban floodplain. The methodological approach used here, which combines modern papers and reports, field data and historical documents, is applicable to other small floodplains of the Ligurian coast which have all been heavily urbanized with consequent changes to river channels, land uses and shorelines.

Author Contributions

All authors contributed to the research presented in this work. Their contributions are presented below. Conceptualization, A.R., F.F.; Methodology, A.R., F.F. and P.P.; Software, A.R.; Formal Analysis, A.R.; Investigation, A.R.; Resources, A.R., P.P.; Data Curation, A.R.; Writing-Original Draft Preparation, A.R., P.P.; Writing-Review & Editing, P.P., C.W. and F.L.; Visualization, A.R.; Supervision, F.F., F.L., L.T. and C.W.; Project Administration, F.F.
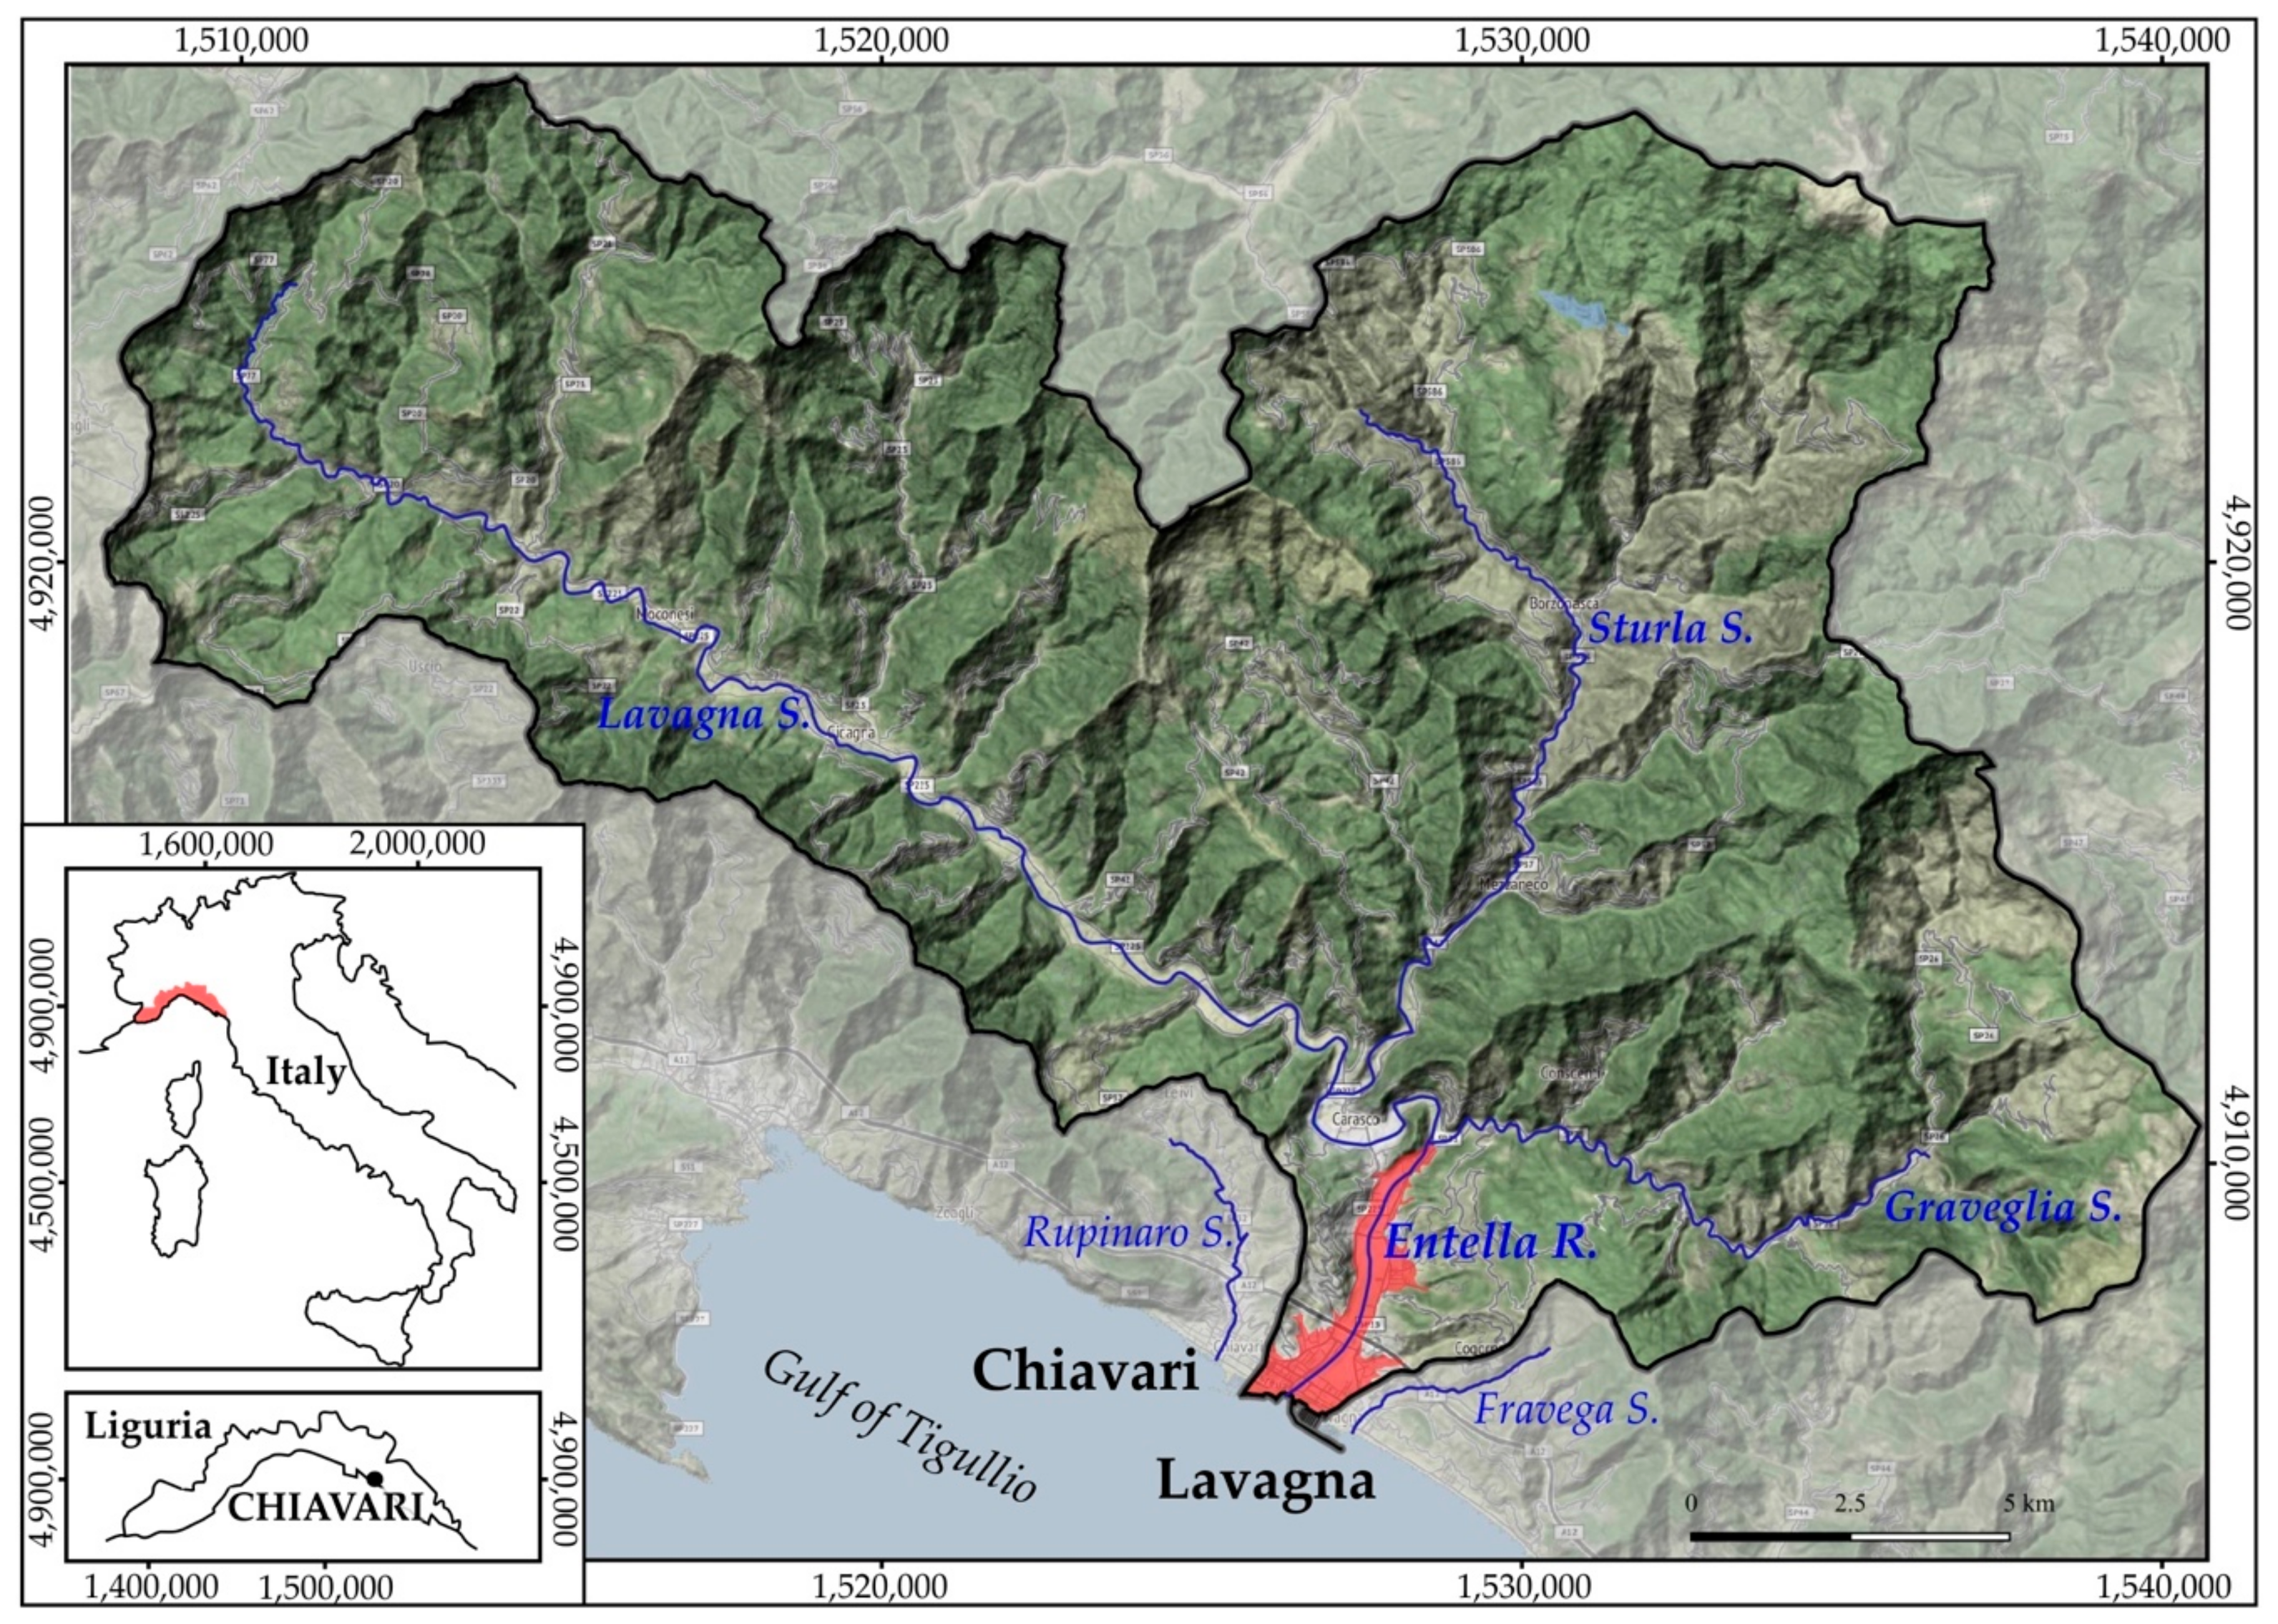
Funding

This research received no external funding.

Acknowledgments

We are grateful to the Economic Society of Chiavari for consulting historical documents and manuscripts kept in its archive sited in Chiavari, and to the Photographer Edoardo Migone for permitting us to used old photos from the historical photographical archive of his family.

Conflicts of Interest

The authors declare no conflict of interest.

References and Note

  1. Van der Ploeg, R.R.; Hermsmeyer, D.; Bachmann, J. Postwar changes in land use in former West Germany and the increased number of inland floods. In Floods Issues in Contemporary Water Management; Marsalek, J., Watt, W.E., Zeman, E., Sieker, F., Eds.; NATO Sciences Series (Series 2. Environmental Security); Springer: Dordrecht, The Netherlands, 2000; Volume 71, pp. 115–123. [Google Scholar]
  2. Blöschl, G.; Ardoin-Bardin, S.; Bonell, M.; Dorninger, M.; Goodrich, D.; Gutknecht, D.; Matamoros, D.; Merz, B.; Shand, P.; Szolgay, J. At what scales do climate variability and land cover change impact on flooding and low flows? Hydrol. Process. 2007, 21, 1241–1247. [Google Scholar] [CrossRef] [Green Version]
  3. Chen, Y.; Yu, B. Impact assessment of climatic and land-use changes on flood runoff in southeast Queensland. Hydrol. Sci. J. 2015, 60, 1759–1769. [Google Scholar] [CrossRef]
  4. Apollonio, C.; Balacco, G.; Novelli, A.; Tarantino, E.; Piccinni, A.F. Land use change impact on flooding areas: The case study of Cervaro basin (Italy). Sustainability 2016, 8, 996. [Google Scholar] [CrossRef]
  5. He, S.; Wang, D.; Li, Y.; Zhao, P. Land use changes and their driving forces in a debris flow active area of Gansu Province, China. Sustainability 2018, 10, 2579. [Google Scholar] [CrossRef]
  6. Palom, A.R.; Sauri Pujol, D.; Olcina Cantos, J. Sustainable land use planning in areas exposed to flooding: Some international experiences. In Floods; Vinet, F., Ed.; Volume 2 Risk management; Elsevier Ltd.: Amsterdam, The Netherlands, 2018; pp. 103–117. [Google Scholar]
  7. Billi, P.; Rinaldi, M. Human impact on sediment yield and channel dynamics in the Arno River basin (central Italy). In Human Impact on Erosion and Sedimentation (Proceedings of Rabat Symposium); Walling, D.E., Probst, J.L., Eds.; Publ. 245; IAHS Publication: Wallingford, UK, 1997; pp. 301–311. [Google Scholar]
  8. Capelli, G.; Miccadei, E.; Raffi, R. Fluvial dynamics in the Castel di Sangro plain: Morphological changes and human impact from 1875 to 1992. Catena 1997, 30, 295–309. [Google Scholar] [CrossRef]
  9. Surian, N.; Rinaldi, M. Morphological response to river engineering and management in alluvial channels in Italy. Geomorphology 2003, 50, 307–326. [Google Scholar] [CrossRef] [Green Version]
  10. Hooke, J.M. Human impacts on fluvial system in the Mediterranean region. Geomorphology 2006, 79, 311–355. [Google Scholar] [CrossRef]
  11. Mallini, G.; Emmanoloudis, D.; Giannakopoulos, V.; Maris, F.; Koutsis, N. Mapping and interpreting historical land cover/land use changes in a Natura 2000 site using earth observational data: The case of Nestos delta, Greece. Appl. Geogr. 2011, 30, 312–332. [Google Scholar] [CrossRef]
  12. Maraga, F.; Turconi, L.; Pellegrini, L.; Anselmo, V. Scouring in the Po river Basin at the Upper Plain (Italy). In Engineering Geology for Society and Territory; Lollino, G., Arattano, M., Rinaldi, M., Giustolisi, O., Marechal, J.C., Grant, G., Eds.; Springer: Cham, Switzerland, 2015; Volume 3, pp. 489–493. [Google Scholar]
  13. Faccini, F.; Paliaga, G.; Piana, P.; Sacchini, A.; Watkins, C. The Bisagno stream catchment (Genoa, Italy) and its major floods (1822, 1970 and 2014): Geomorphic and land use variations in the last three centuries. Geomorphology 2016, 273, 14–27. [Google Scholar] [CrossRef]
  14. Meneses, B.M.; Reis, E.; Pereira, S.; Vale, M.J.; Reis, R. Understanding Driving Forces and Implications Associated with the Land Use and Land Cover Changes in Portugal. Sustainability 2017, 9, 351. [Google Scholar] [CrossRef]
  15. Herget, J. Holocene development of the River Lippe Valley, Germany: A case study of anthropogenic influence. Earth Surf. Process. Landf. 2000, 25, 293–305. [Google Scholar] [CrossRef]
  16. Marchetti, M. Environmental changes in the central Po Plain (northern Italy) due to fluvial modifications and anthropogenic activities. Geomorphology 2002, 44, 361–373. [Google Scholar] [CrossRef] [Green Version]
  17. Caporali, E.; Rinaldi, M.; Casagli, N. The Arno River Floods. Geol. Appl. 2005, 1, 177–192. [Google Scholar] [CrossRef]
  18. Clerici, A.; Perego, S.; Chelli, A.; Tellini, C. Morphological changes of the floodplain reach of the Taro River (Northern Italy) in the last two centuries. J. Hydrol. 2015, 527, 1106–1122. [Google Scholar] [CrossRef]
  19. Rinaldi, M. Recent channel adjustments in alluvial rivers of Tuscany, Central Italy. Earth Surf. Process. Landf. 2003, 28, 587–608. [Google Scholar] [CrossRef]
  20. Nirupama, N.; Simonovic, S.P. Increase of flood risk due to urbanization: A Canadian example. Nat. Hazards 2007, 40, 25. [Google Scholar] [CrossRef]
  21. Li, X.; Zhang, Q. Variation of floods characteristics and their responses to climate and human activities in Poyang Lake, China. Chin. Geogr. Sci. 2015, 25, 13–25. [Google Scholar] [CrossRef]
  22. Li, X.; Zhang, Q. The changing patterns of floods in Poyang Lake, China: Characteristics and explanations. Nat. Hazards 2015, 76, 651–666. [Google Scholar] [CrossRef]
  23. Brandolini, P.; Faccini, F.; Paliaga, G.; Piana, P. Urban geomorphology in coastal environment: Man-made morphological changes in a seaside tourist resort (Rapallo, Eastern Liguria, Italy). Quest. Geogr. 2017, 36. [Google Scholar] [CrossRef]
  24. Shi, G.; Jiang, N.; Yao, L. Land Use and Cover Change during the Rapid Economic Growth Period from 1990 to 2010: A Case Study of Shanghai. Sustainability 2018, 10, 426. [Google Scholar] [CrossRef]
  25. Baioni, D. Human activity and damaging landslides and floods on Madeira Island. Nat. Hazards Earth Syst. Sci. 2011, 11, 3035–3046. [Google Scholar] [CrossRef] [Green Version]
  26. Singh, B.; Goswami, R.K. Anthropogenic influence on flow and sediment regime of a river basin. Int. J. Eng. Sci. Technol. 2012, 4, 30–37, ISSN 0975-5462. [Google Scholar]
  27. Scorpio, V.; Rosskopf, C.M. Channel adjustments in a Mediterranean river over the last 150 years in the context of anthropic and natural controls. Geomorphology 2016, 275, 90–104. [Google Scholar] [CrossRef]
  28. Fiorini, L.; Zullo, F.; Romano, B. Urban development of the coastal system of the Italian largest islands: Sicily and Sardinia. Ocean Coast. Manag. 2017, 143, 184–194. [Google Scholar] [CrossRef]
  29. Anthony, E.J.; Marriner, N.; Morhange, C. Human influence and the changing geomorphology of Mediterranean deltas and coasts over the last 6000 years: From progradation to destruction phase? Earth-Sci. Rev. 2014, 139, 336–361. [Google Scholar] [CrossRef]
  30. Faccini, F.; Luino, F.; Sacchini, A.; Turconi, L. Flash Flood Events and Urban Development in Genoa (Italy): Lost in Translation. In Engineering Geology for Society and Territory; Lollino, G., Manconi, A., Guzzetti, F., Culshaw, M., Bobrowsky, P., Luino, F., Eds.; Springer International Publishing: Cham, Switzerland, 2014; Volume 5, pp. 797–801. [Google Scholar]
  31. Faccini, F.; Luino, F.; Sacchini, A.; Turconi, L.; De Graff, J. Geo-hydrological hazard and urban development in the Mediterranean area: An example from Genoa city (Italy). Nat. Hazards Earth Syst. Sci. 2015, 15, 2631–2652. [Google Scholar] [CrossRef]
  32. Sanguineti, G. Le Alluvioni nel Chiavarese e Riassunto Meteorologico per L’anno 1953; Tipografia G. Esposito: Chiavari, Italy, 1953; pp. 1–12. (In Italian) [Google Scholar]
  33. Casaretto, F. Inondazioni a Chiavari dal 1626 al 1950; Dattiloscritto: Chiavari, Italy, 2003; pp. 1–8. (In Italian) [Google Scholar]
  34. Faccini, F.; Giostrella, P.; Lazzeri, R.; Melillo, M.; Raso, E.; Roccati, A. The 10th November 2014 flash-flood event in Chiavari city (Eastern Liguria, Italy). Rend. Online Soc. Geol. Ital. 2015, 35, 124–127. [Google Scholar] [CrossRef]
  35. Faccini, F.; Giostrella, P.; Melillo, M.; Sacchini, A.; Santangelo, M. Heavy rains triggering flash floods in urban environment: A case from Chiavari (Genoa Metropolitan area, Italy). Ital. J. Eng. Geol. Environ. 2017, 51–66. [Google Scholar] [CrossRef]
  36. Corradi, N.; Delbono, I.; Barsanti, M.; Morgigni, M.; Ferretti, O. Caratteri morfologici, sedimentologici ed evoluzione del litorale compreso fra Chiavari e Sestri Levante (Liguria orientale). In Studi per la Creazione di Strumenti di Gestione Costiera, Golfo del Tigullio; Ferretti, O., Ed.; ENEA S. Teresa Centro Ricerche Ambiente Marino: La Spezia, Italy, 2003; pp. 21–39. Available online: www.santateresa.enea.it/wwwste/dincost/dincost_pdf/3sedimentologia.pdf (accessed on 15 October 2018). (In Italian)
  37. Stancalie, G.; Catana, S.; Poiana, I.; Iordache, A.; Craciunescu, V. Assessment of the impact of climat and ecosystem changes on dought conditions: Case study from Romania. In Water Resources System—Hydrological Risk, Management and Development, Proceedings of the Symposium H2O2b IUGG2003, Sapporo, Japan, 30 June–11 July 2003; IAHS Publ.: Wallingford, Oxfordshire, UK, 2003; p. 158. [Google Scholar]
  38. Luino, F.; Nigrelli, G.; Turconi, L.; Faccini, F.; Agnese, C.; Casillo, F. A proper land-use planning through the use of historical research. Disaster Adv. 2016, 9, 8–19. [Google Scholar]
  39. Xu, F.; Otte, A.; Ludewig, K.; Donath, T.W.; Harvolk-Schöning, S. Land Cover Changes (1963–2010) and TheirEnvironmental Factors in the Upper Danube Floodplain. Sustainability 2017, 9, 943. [Google Scholar] [CrossRef]
  40. Faccini, F.; Robbiano, A.; Roccati, A.; Angelini, S. Engineering geological map of the Chiavari city area (Liguria, Italy). J. Maps 2012, 8, 41–47. [Google Scholar] [CrossRef] [Green Version]
  41. Lagomaggiore, C. Il problema del fiume Entella e della spiaggia di Chiavari-Lavagna. In Vita Chiavarese; Tipografia Esposito: Chiavari, Genova, 1912; 64p. (In Italian) [Google Scholar]
  42. Sacchini, A.; Ferraris, F.; Faccini, F.; Firpo, M. Environmental climatic maps of Liguria. J. Maps 2012, 8, 199–207. [Google Scholar] [CrossRef]
  43. Alessandri, A.; De Felice, M.; Zeng, N.; Mariotti, A.; Pan, Y.; Cherchi, A.; Lee, J.Y.; Wang, B.; Ha, K.J.; Ruti, P.; et al. Robust assessment of the expansion and retreat of Mediterranean climate in the 21st century. Sci. Rep. 2014, 4, 7211. [Google Scholar] [CrossRef] [PubMed] [Green Version]
  44. Ministero dei Lavori Pubblici. Annali Idrologici. Ministero dei Lavori Pubblici, Servizio Idrografico, Roma, 1934–2003. Available online: http://www.acq.isprambiente.it/annalipdf/ (accessed on 15 October 2018).
  45. ARPAL-CMIRL—Agenzia Regionale per la Protezione dell’Ambiente Ligure-Centro Funzionale Meteo-Idrologico di Protezione Civile della Regione Liguria. Annali idrologici. In Genova, 2003–2010. Available online: https://www.arpal.gov.it/homepage/meteo/pubblicazioni/annali-idrologici.html (accessed on 15 October 2018).
  46. Sanguineti, G. Osservatorio del Seminario di Chiavari. In Atti Della Società Economica di Chiavari; Anno XXVI; Tipografia Esposito: Chiavari, Italy, 1958. (In Italian) [Google Scholar]
  47. Acquaotta, F.; Faccini, F.; Fratianni, S.; Paliaga, G.; Sacchini, A. Rainfall intensity in the Genoa Metropolitan Area (Northern Mediterranean): Secular variations and consequences. Weather 2018. [Google Scholar] [CrossRef]
  48. Gregory, I.N.; Ell, P.S. Historical GIS: Technologies, Methodologies and Scholarship; Cambridge University Press: Cambridge, UK, 2007; 227p, ISBN 978-0-521-85563-1. [Google Scholar]
  49. Lukas, M.C. Cartographic reconstruction of historical environmental change. Cartogr. Perspect. 2014, 78, 5–24. [Google Scholar] [CrossRef]
  50. Statuto, D.; Cilli, G.; Picuno, P. Using historical maps within a GIS to analyze two centuries of rural landscape changes in southern Italy. Land 2017, 6, 65. [Google Scholar] [CrossRef]
  51. Ministero di Agricoltura, Industria e Commercio. Tavole di Ragguaglio dei pesi e Delle Misure già in uso nelle Varie Province del Regno col Sistema Metrico Decimale; Stamperia Reale: Rome, Italy, 1877. (In Italian)
  52. European Environmental Agency. CORINE Land Cover Technical Guide. Part2: Nomenclature; Office for Official Publications of the European Communities: Luxembourg, 1995. [Google Scholar]
  53. De Negri, C. La foce dell’Entella. Note di geografia storica. In Miscellanea di Geografia Storica e Storia Della Geografia; Fratelli Bozzi: Genova, Italy, 1971; pp. 21–32. (In Italian) [Google Scholar]
  54. Pessagno, G. Settecento Chiavarese. In Atti Società Economica di Chiavari; Anno XVI; Tipografia Esposito: Chiavari, Italy, 1938; pp. 41–42, 58–61. (In Italian) [Google Scholar]
  55. Giustiniani, A. Annali Della Repubblica di Genova; Canepa: Genova, Italy, 1854. (In Italian) [Google Scholar]
  56. Del Soldato, M. L’evoluzione della piana alluvionale del Rupinaro in epoca protostorica e storica. Studi Genuensi 1987, 6, 19–45. (In Italian) [Google Scholar]
  57. Ragazzi, F.; Corallo, C. Chiavari; Sagep: Genova, Italy, 1981. (In Italian) [Google Scholar]
  58. Garibaldi, C. Della Storia di Chiavari; Tipografia Como: Genova, Italy, 1853. (In Italian) [Google Scholar]
  59. Archivio di Stato di Genova, Prefettura Sarda 206, Denunce e consegne dei boschi, Mandamento di Chiavari, 23 (23 May 1822).
  60. Issel, A. Lettera del Prof. Issel sulla spiaggia di Chiavari. In Estratto da: Atti Società Economica di Chiavari; Tipografia Esposito: Chiavari, Italy, 1908. (In Italian) [Google Scholar]
  61. Conti, S. Sulle cause determinanti l’arretramento della spiaggia di Chiavari, Lavagna e Cavi. In Annali di Ricerche e Studi di Geografia; Istituto di Geografia dell’Universitá di Genova: Genova, Italy, 1951. (In Italian) [Google Scholar]
  62. Moreno, D. Liguria. In Italian Historical Rural Landscapes, Environmental History; Agnoletti, M., Ed.; Springer: Dordrecht, The Netherlands; Heidelberg, Germany; London, UK; New York, NY, USA, 2013; pp. 199–219. [Google Scholar]
  63. Regione Liguria. Piano di Bacino Stralcio per l’Assetto Idrogeologico. Ambito 16. Piano Degli Interventi. Available online: http://www.pianidibacino.ambienteinliguria.it/GE/ambito16/tavole/interventi_232050.pdf (accessed on 15 October 2018). (In Italian).
  64. Luino, F.; Turconi, L.; Petrea, C.; Nigrelli, G. Uncorrected land-use planning highlighted by flooding: The Alba case study (Piedmont, Italy). Nat. Hazards Earth Syst. Sci. 2012, 12, 2329–2346. [Google Scholar] [CrossRef]
  65. Luino, F. A Flood Can Point Out Improper Land-Use Planning: The Case of Alessandria Town (Piedmont, Northern Italy). In Engineering Geology for Society and Territory—Volume 5; Lollino, G., Manconi, A., Guzzetti, F., Culshaw, M., Bobrowsky, P., Luino, F., Eds.; Springer: Cham, Switzerland, 2015. [Google Scholar]
Figure 1. Relief map of the Entella River catchment. Lavagna, Sturla and Graveglia Streams, the three main tributaries, area indicated. Red area delimits the examined alluvial plain of the Entella River.
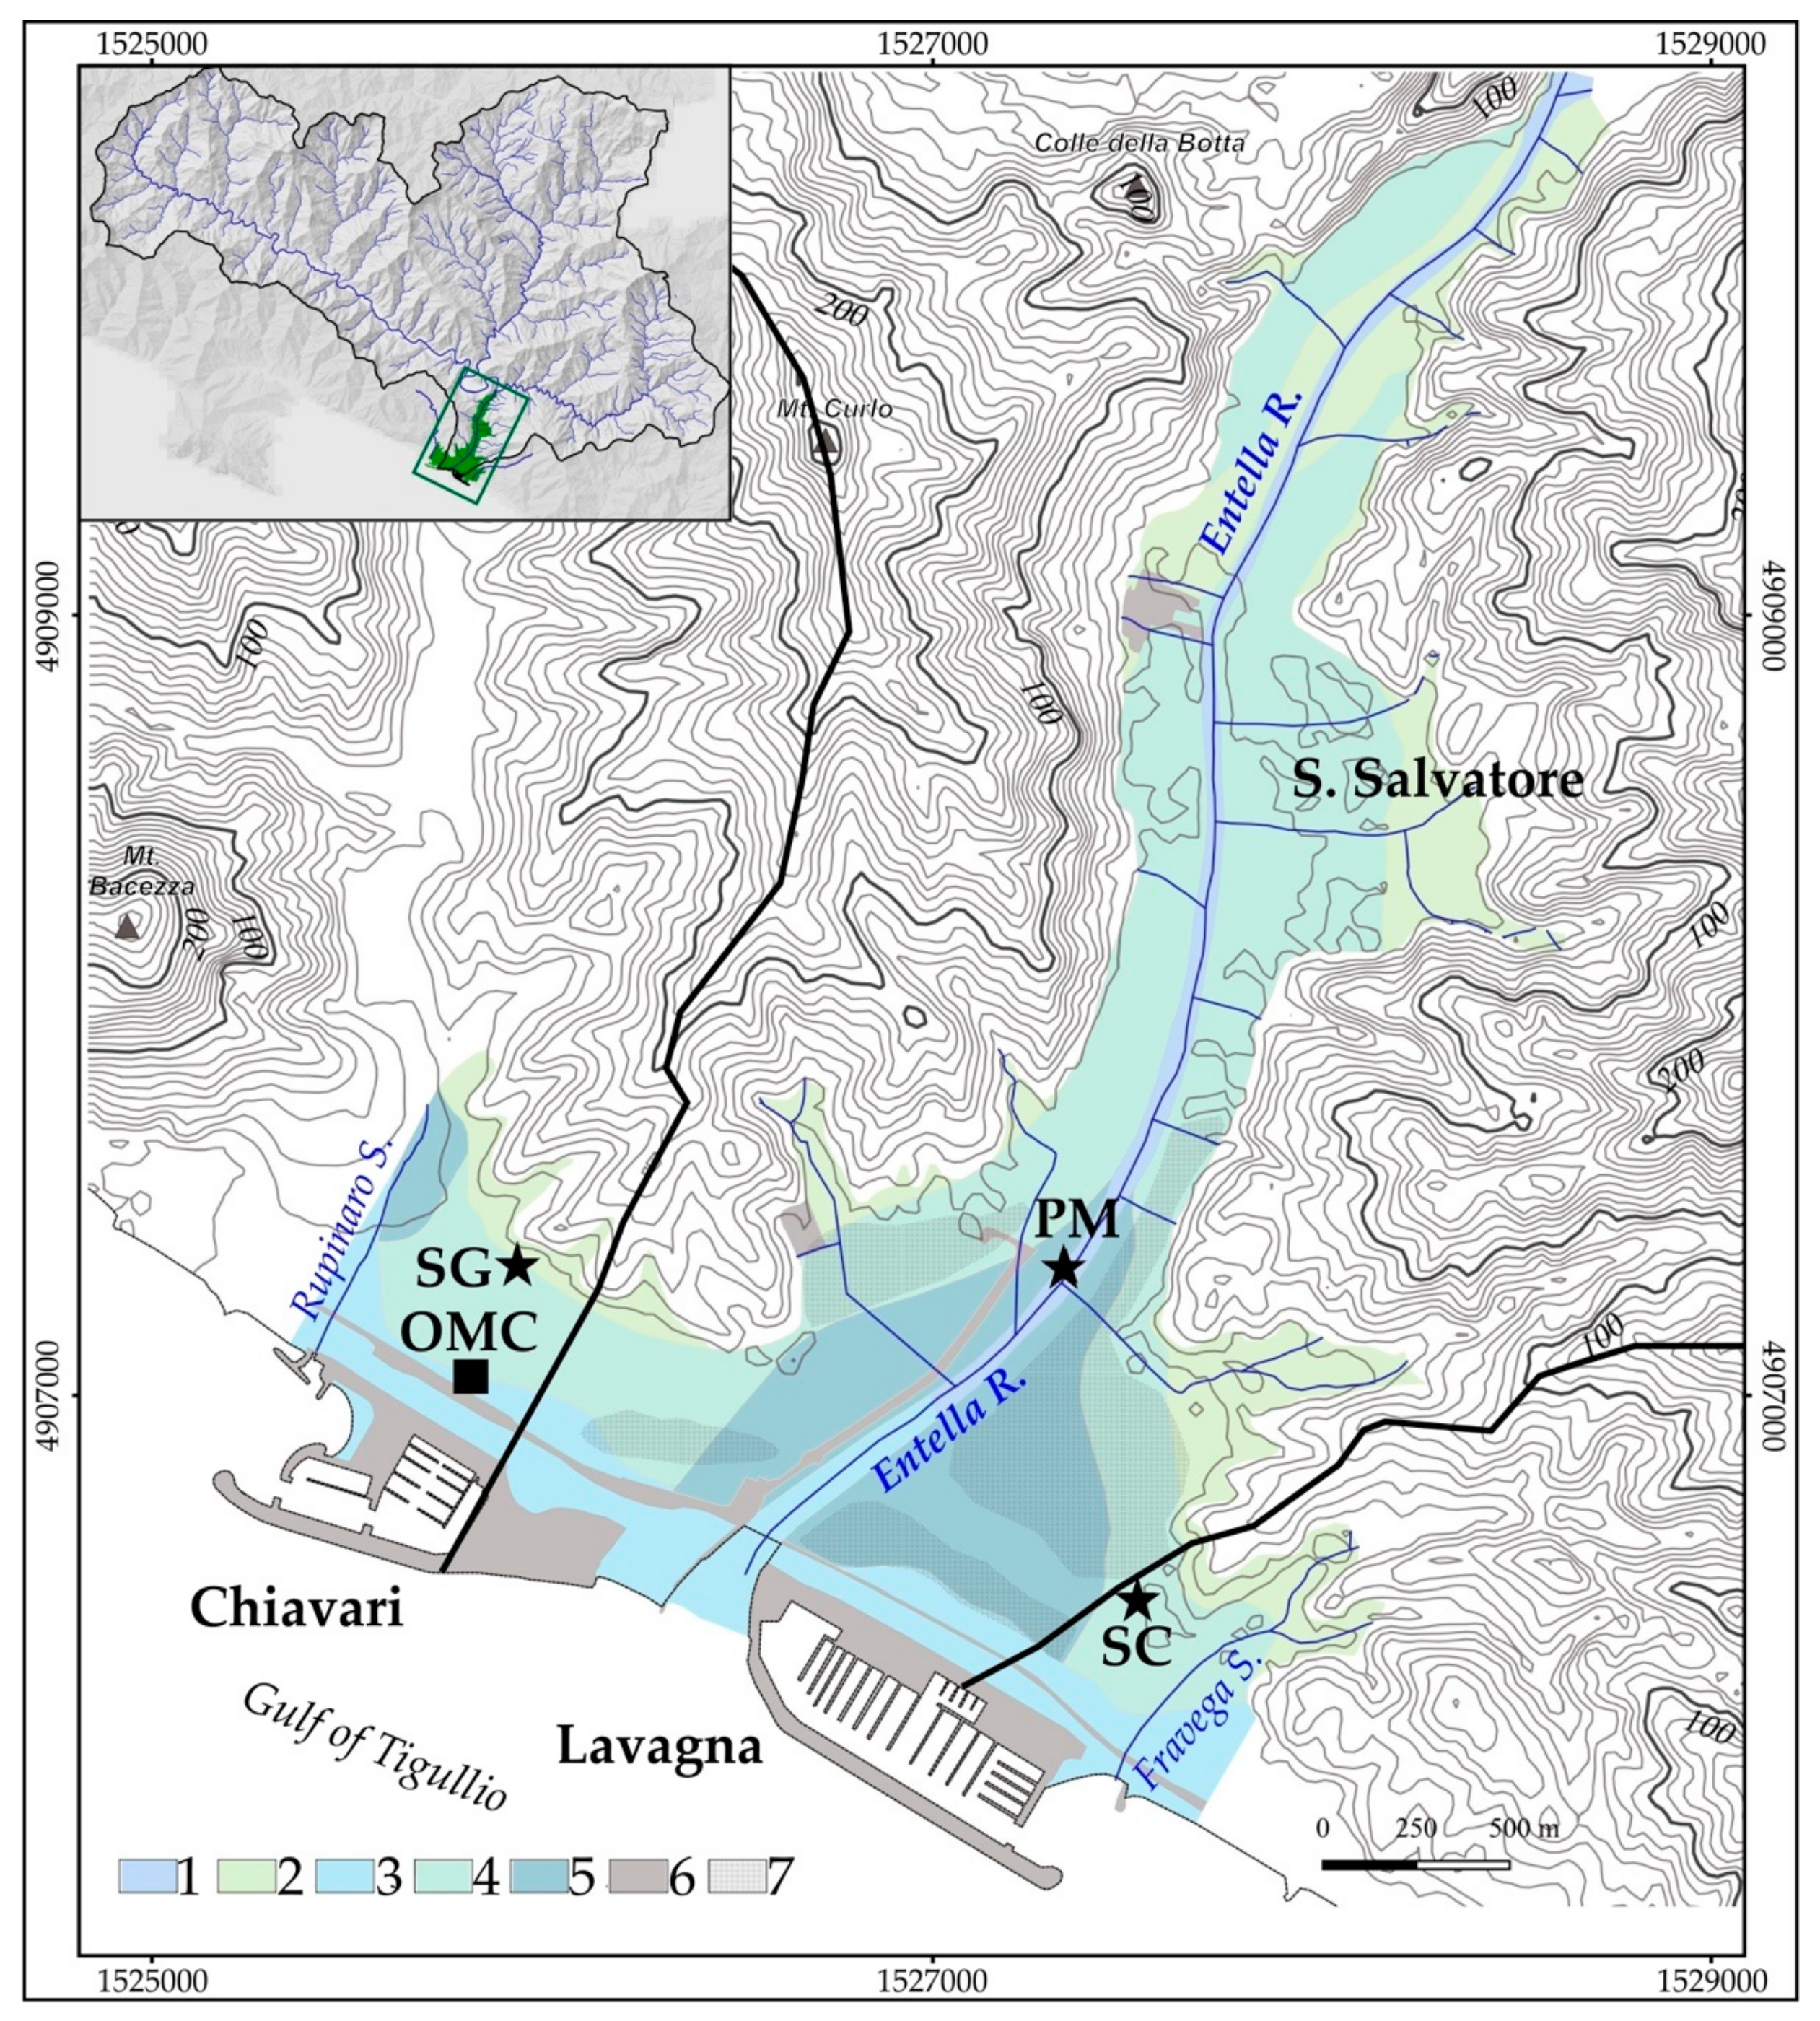
Sustainability 10 03727 g001
Figure 2. Engineering geological map of the Entella floodplain [34]. 1. Gravel, with subordinate sand and little or no fines; 2. Gravel and sands, with significant fines; 3. Sand, with subordinate gravel and little or no fines; 4. silty sand, gravelly silt and sandy silt; 5. clayey silt and inorganic silty clay, with a granular fraction (sand or gravel); 6. Man-made deposits, include coarse soil frequently mixed with heterogeneous material (pitch, bricks, etc.); 7. marshes, swamps. Black stars show reference points: SG, “San Giovanni Battista” Church; PM, “Ponte della Maddalena” bridge; SC, “Nostra Signora del Carmine” Church. Black square shows the Weather Station OMC, “Osservatorio Meteorologico di Chiavari”.
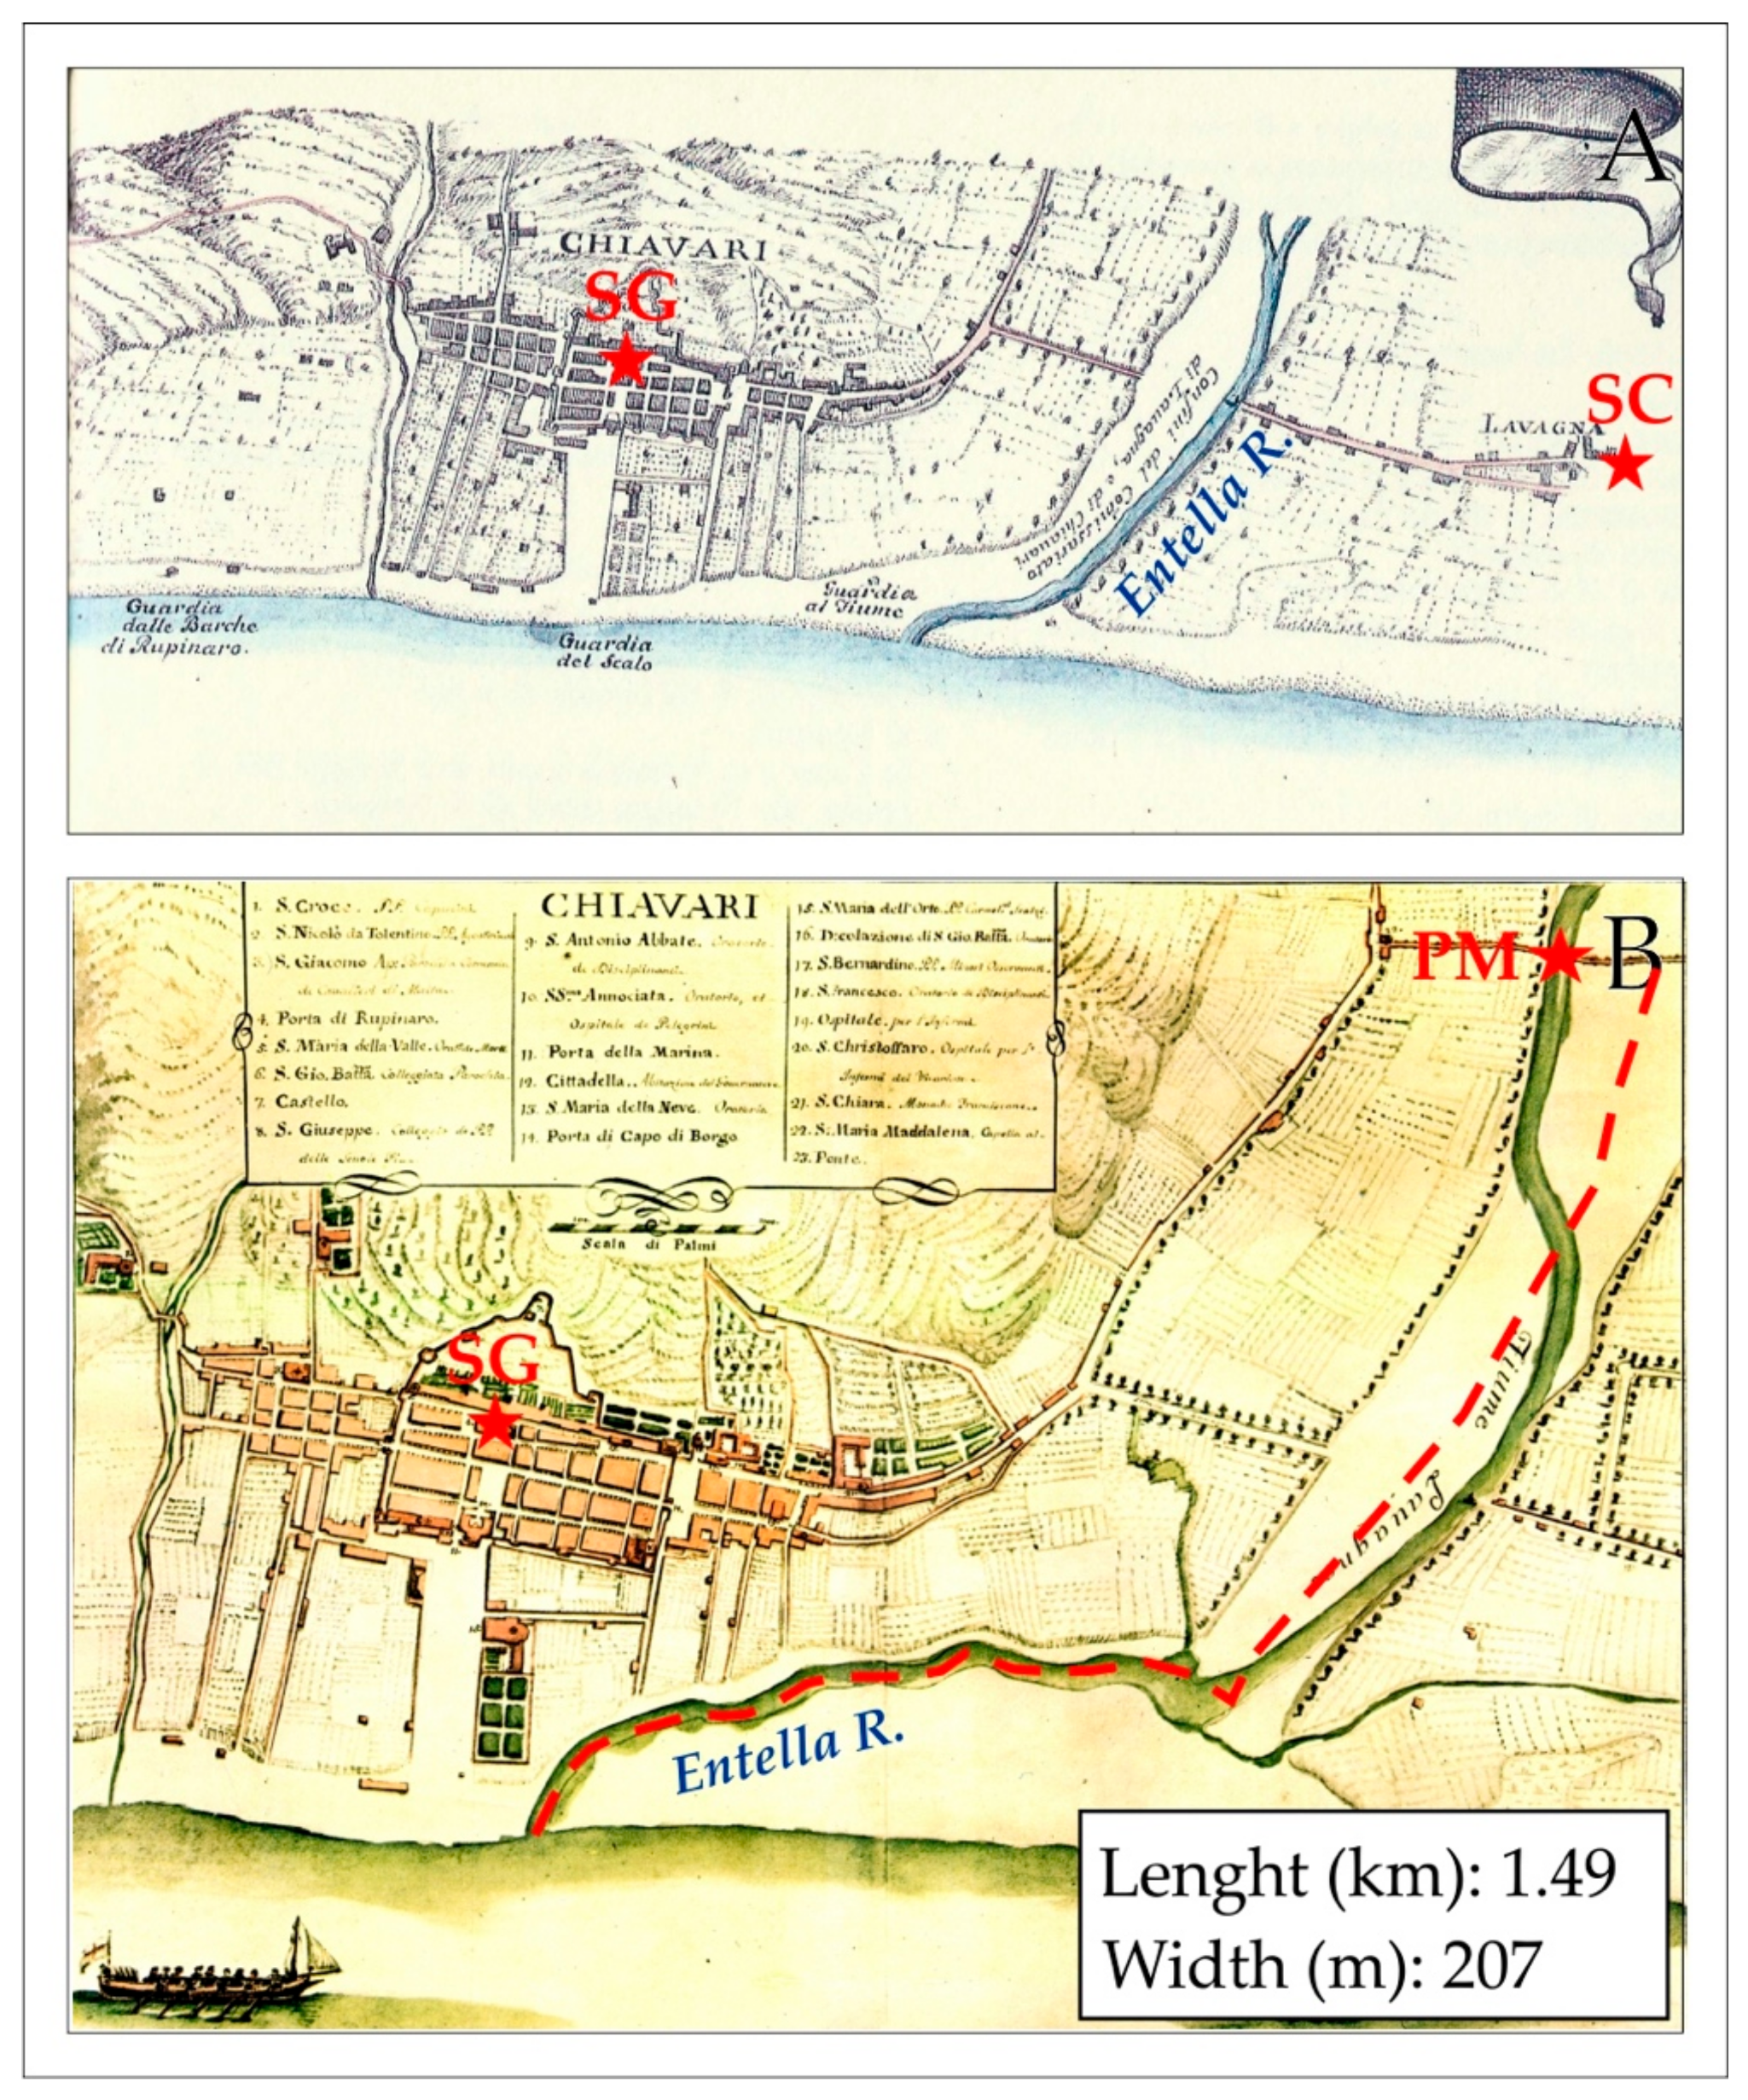
Sustainability 10 03727 g002
Figure 3. The Entella River floodplain in the 18th century: (A) “Pianta delle Due Riviere della Serenissima Repubblica di Genova divise ne’ i Commissariati di Sanità”, 1758; (B) “Il Dominio della Serenissima Repubblica di Genova in terraferma”, 1773. Red stars show reference points: SG, “San Giovanni Battista” Church; PM, “Ponte della Maddalena” bridge; SC, “Nostra Signora del Carmine” Church. (See also Figure 2). Red dotted line shows the axis of the channel. Values of the channel length and width are measured at the PM reference point.
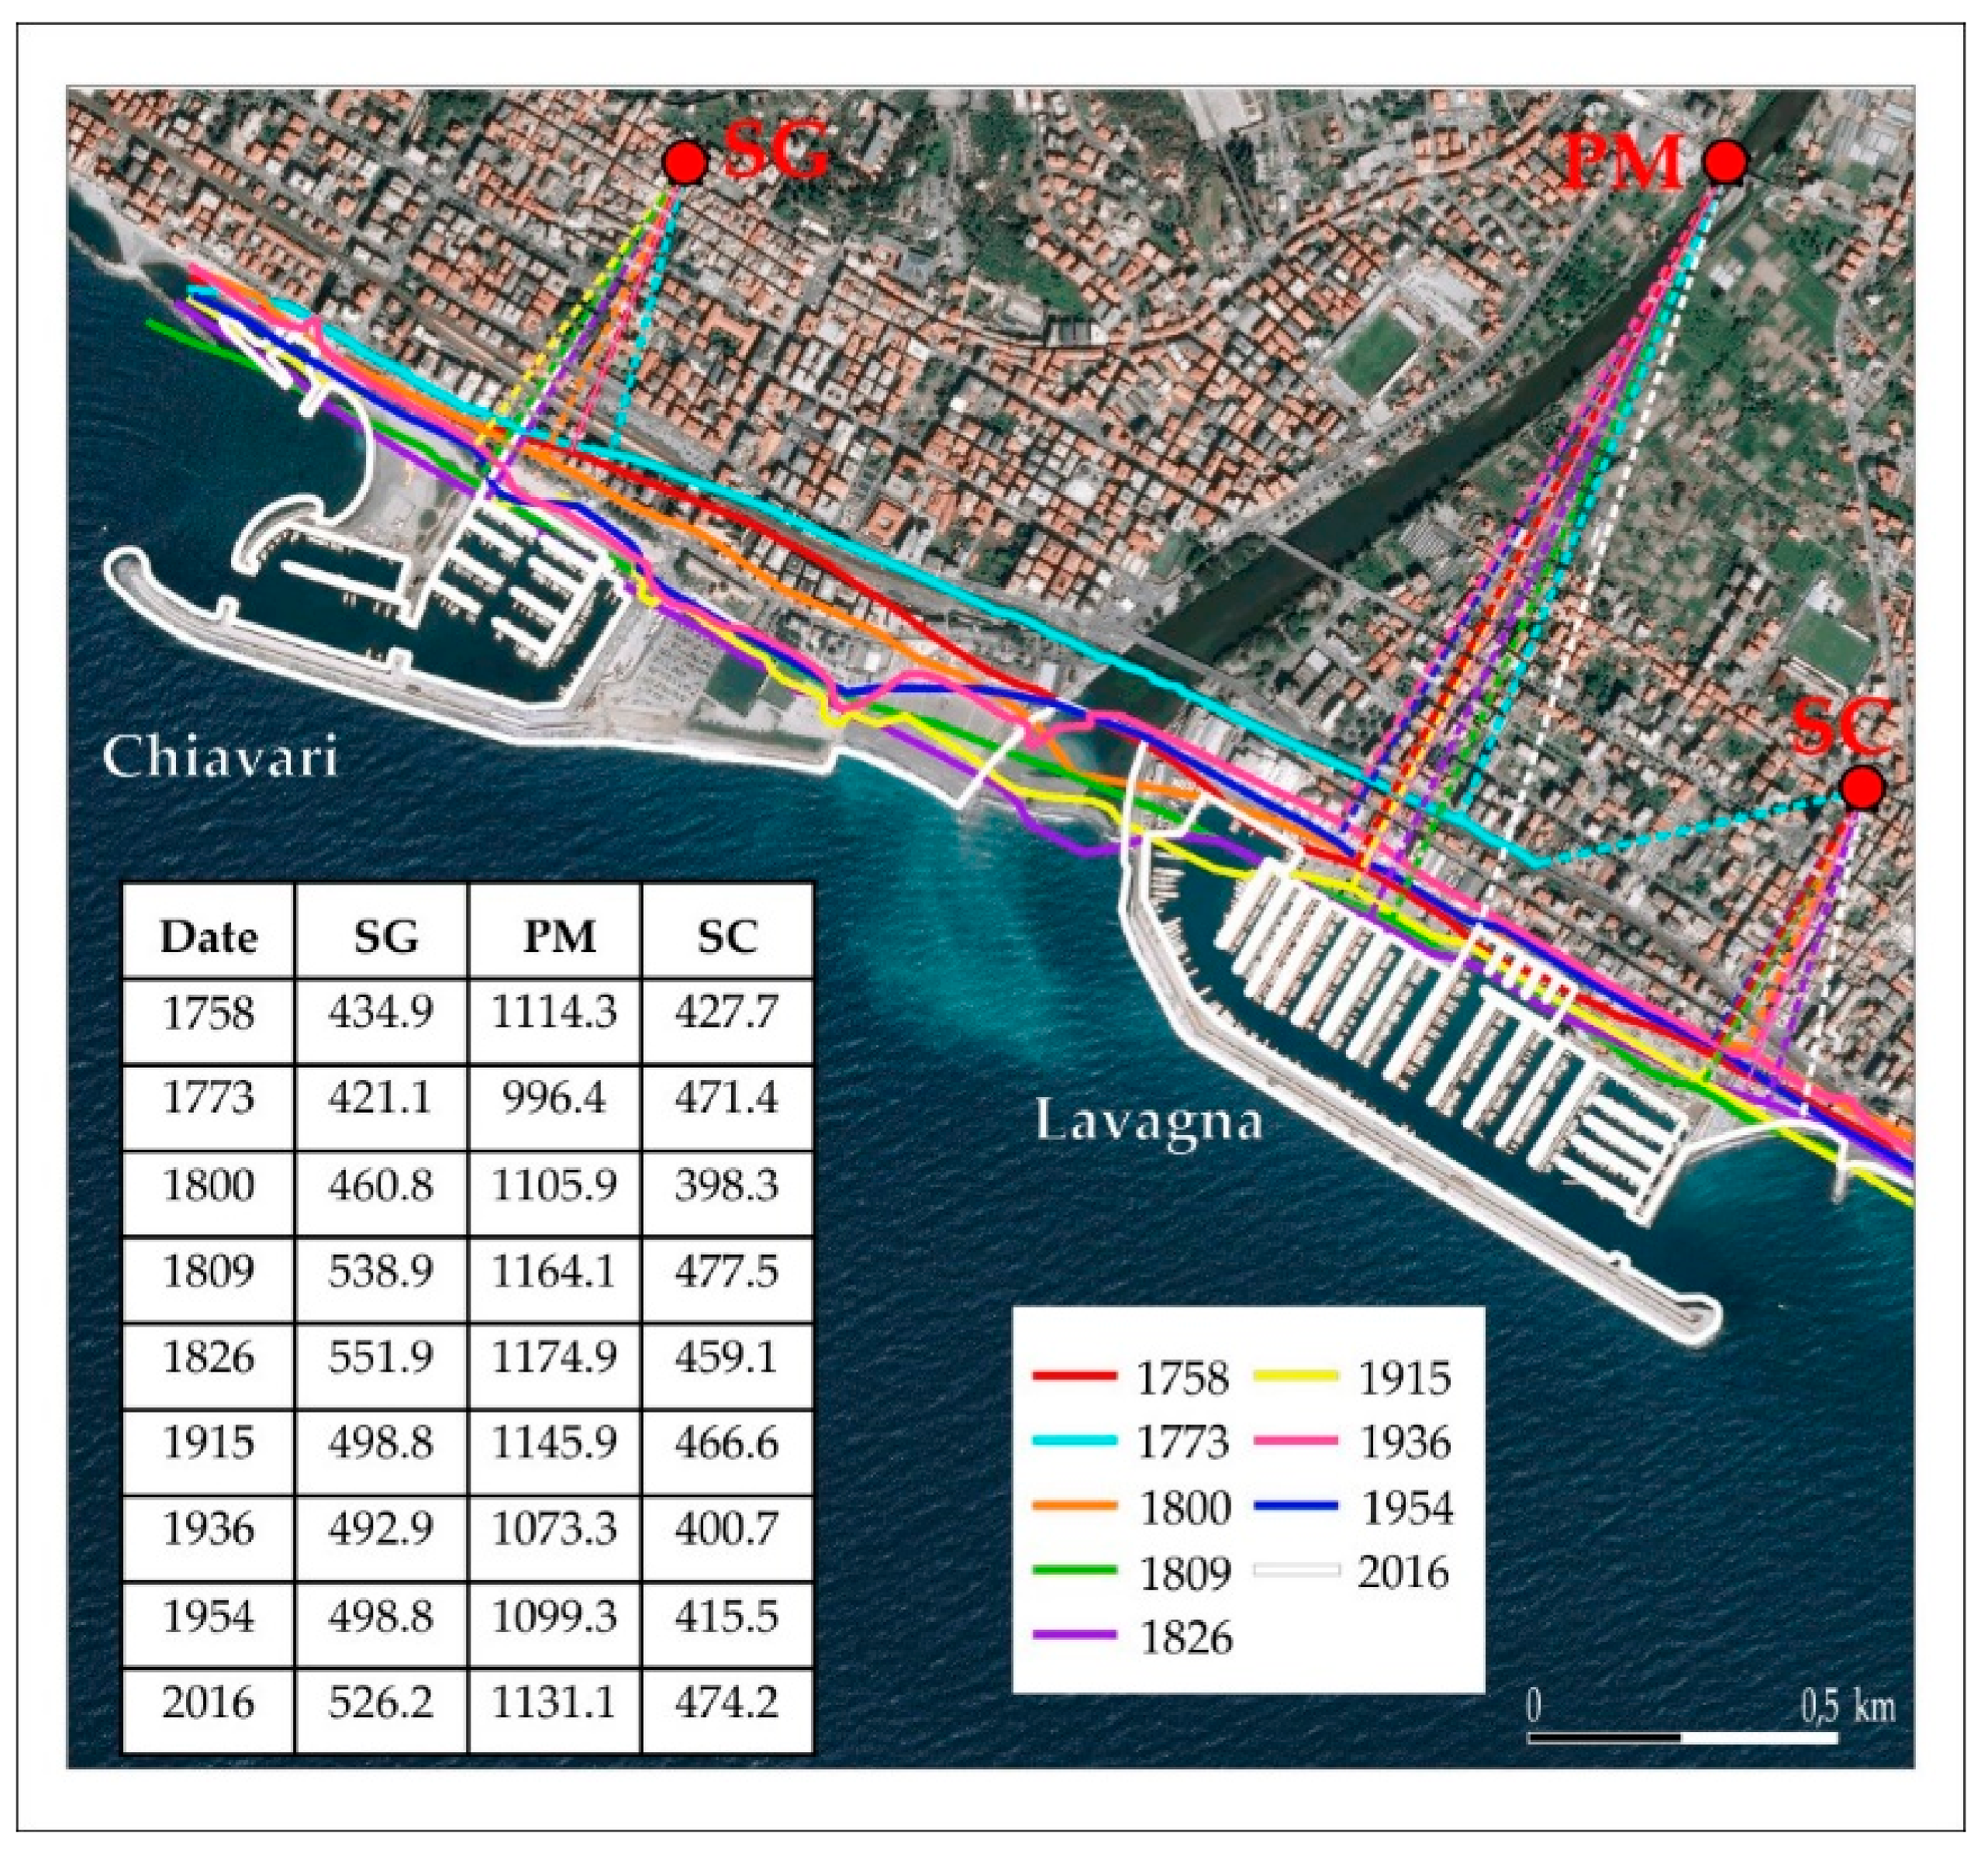
Sustainability 10 03727 g003
Figure 4. Evolution map of the shoreline from 1758 to 2016. Colored lines represent the different stages of coastal modification. Dotted colored lines show the distance measured from the reference point: SG, “San Giovanni Battista” church; PM, “Ponte della Maddalena” bridge; SC, “Nostra Signora del Carmine” church. Measured values (m) are reported in the table.
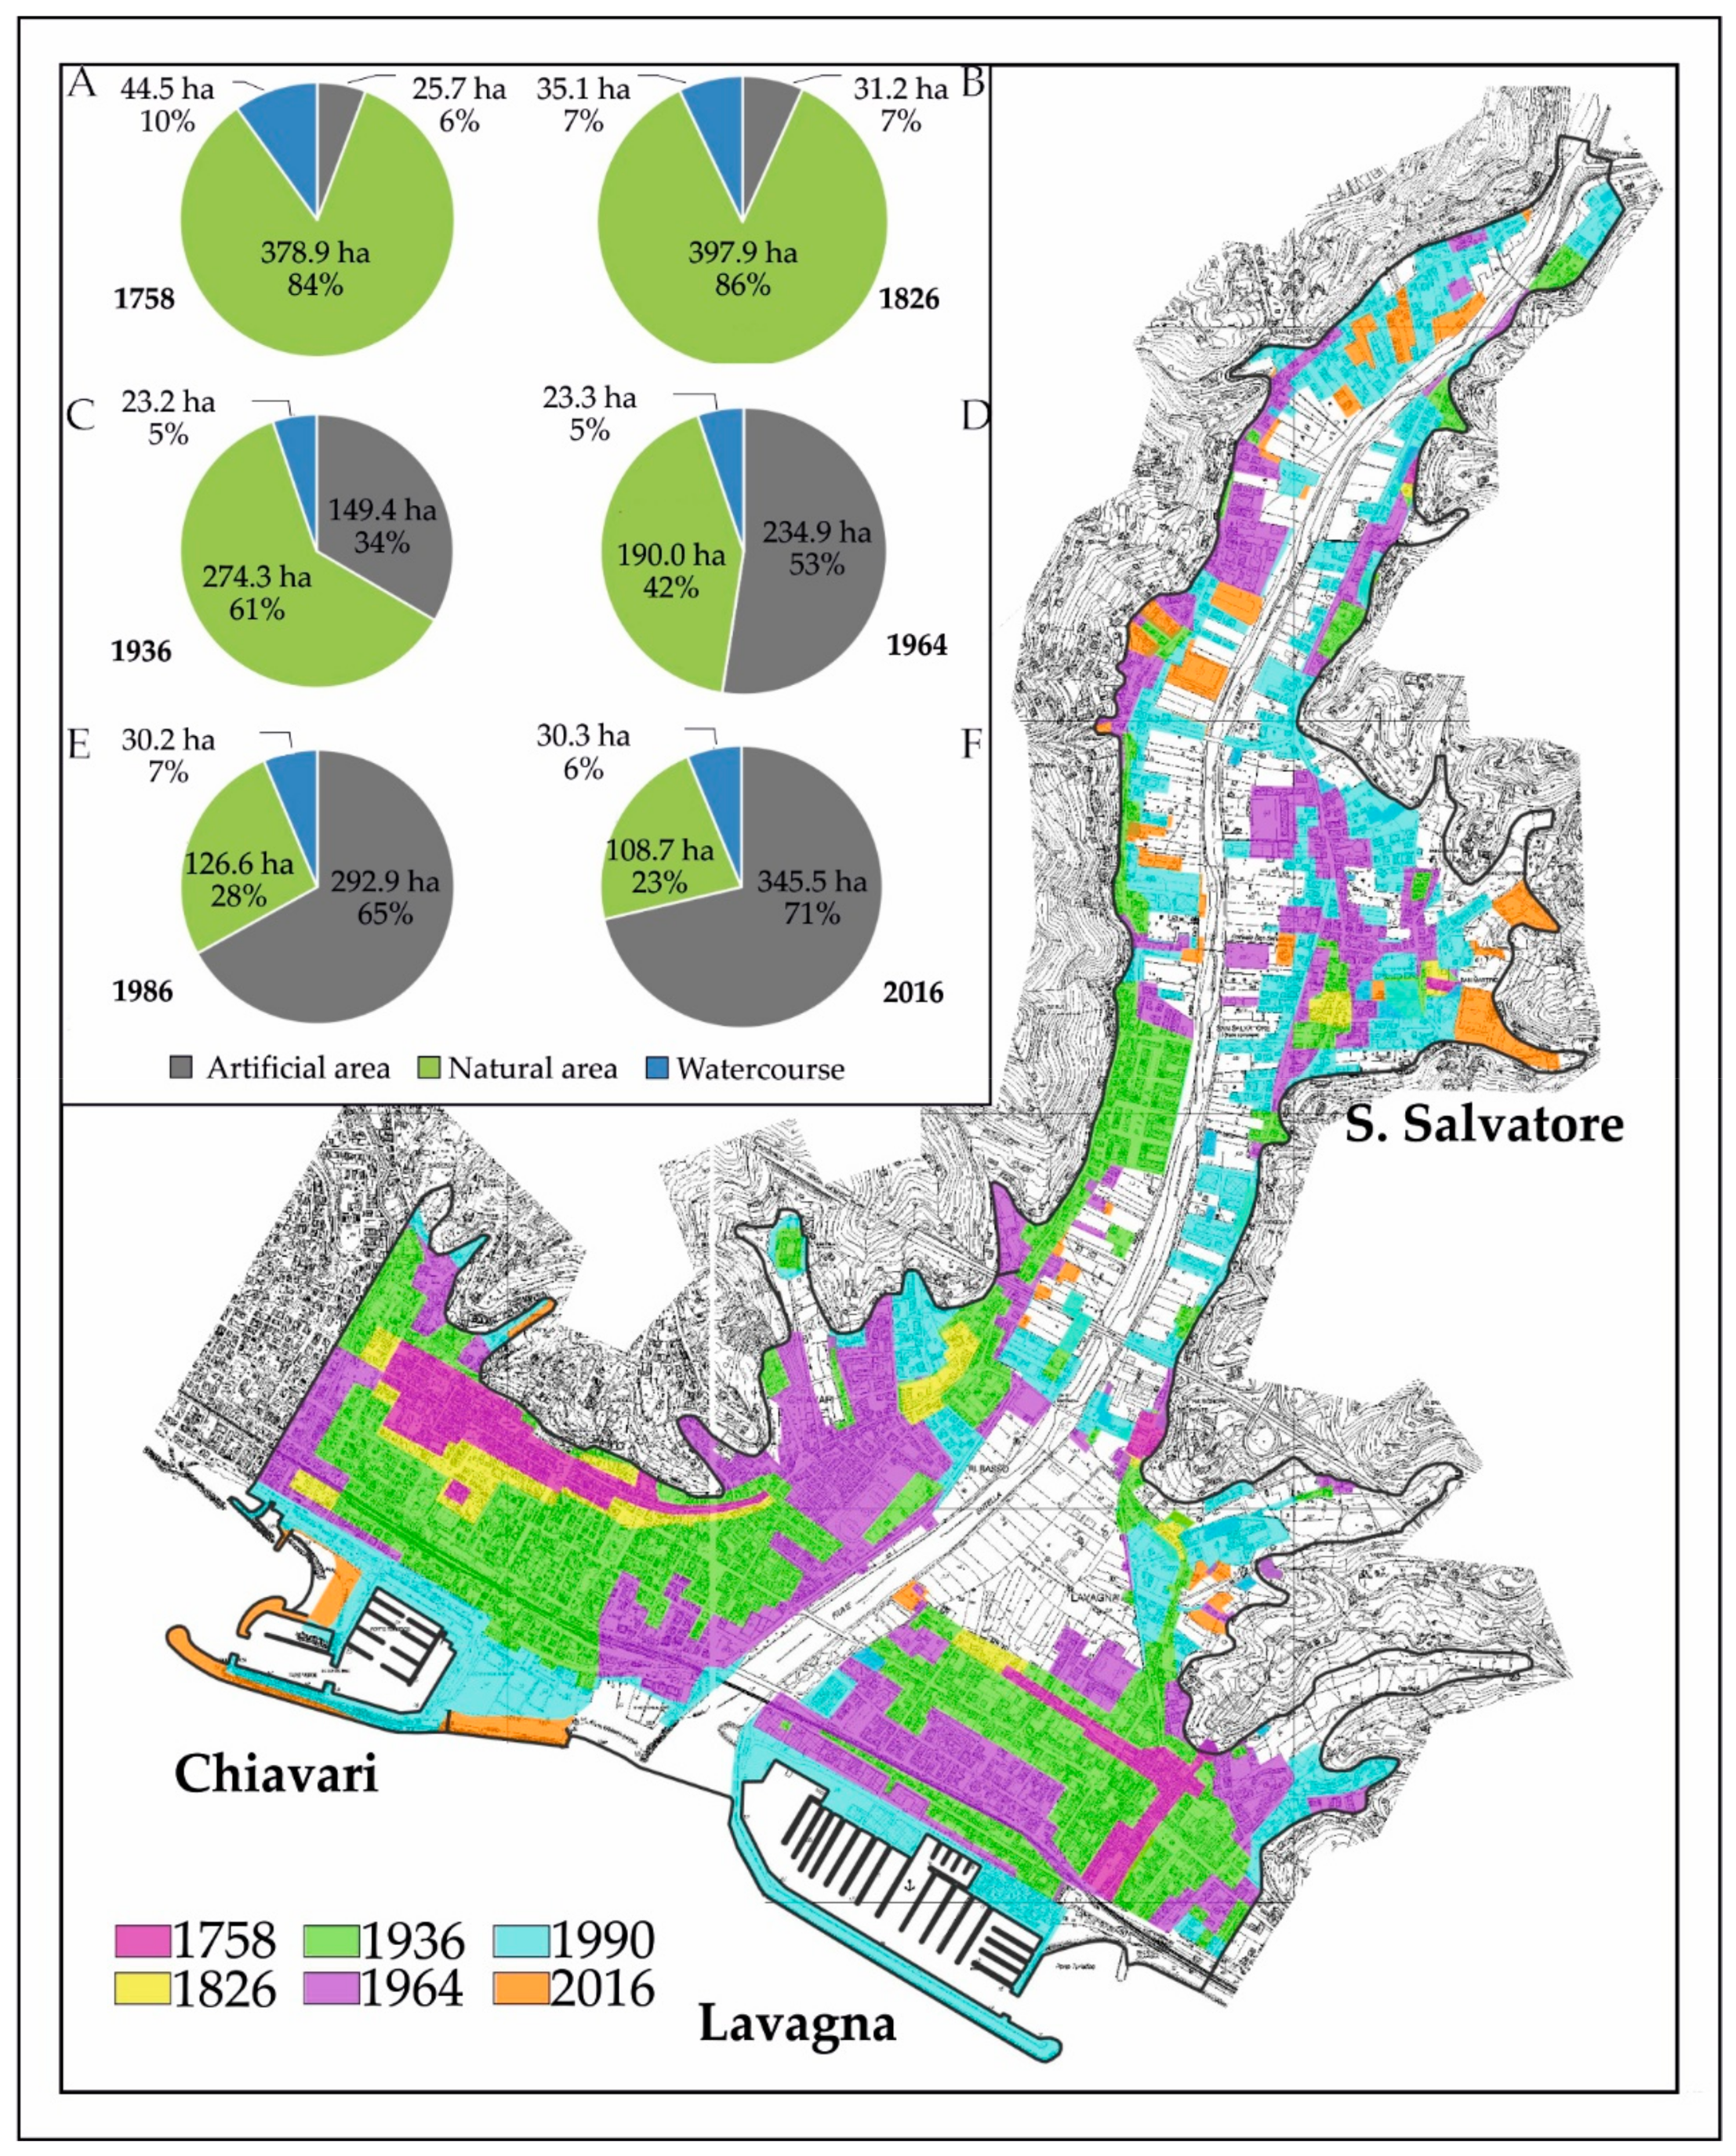
Sustainability 10 03727 g004
Figure 5. Urban evolution map of Chiavari and Lavagna from 1758 to 2016. Pie charts (AF) show the relationship between artificial areas (continuous and discontinuous urban fabric, port areas and artificial, non-agricultural vegetated areas), natural areas (forested areas, olive groves and cultivated areas) and watercourse in the same period.
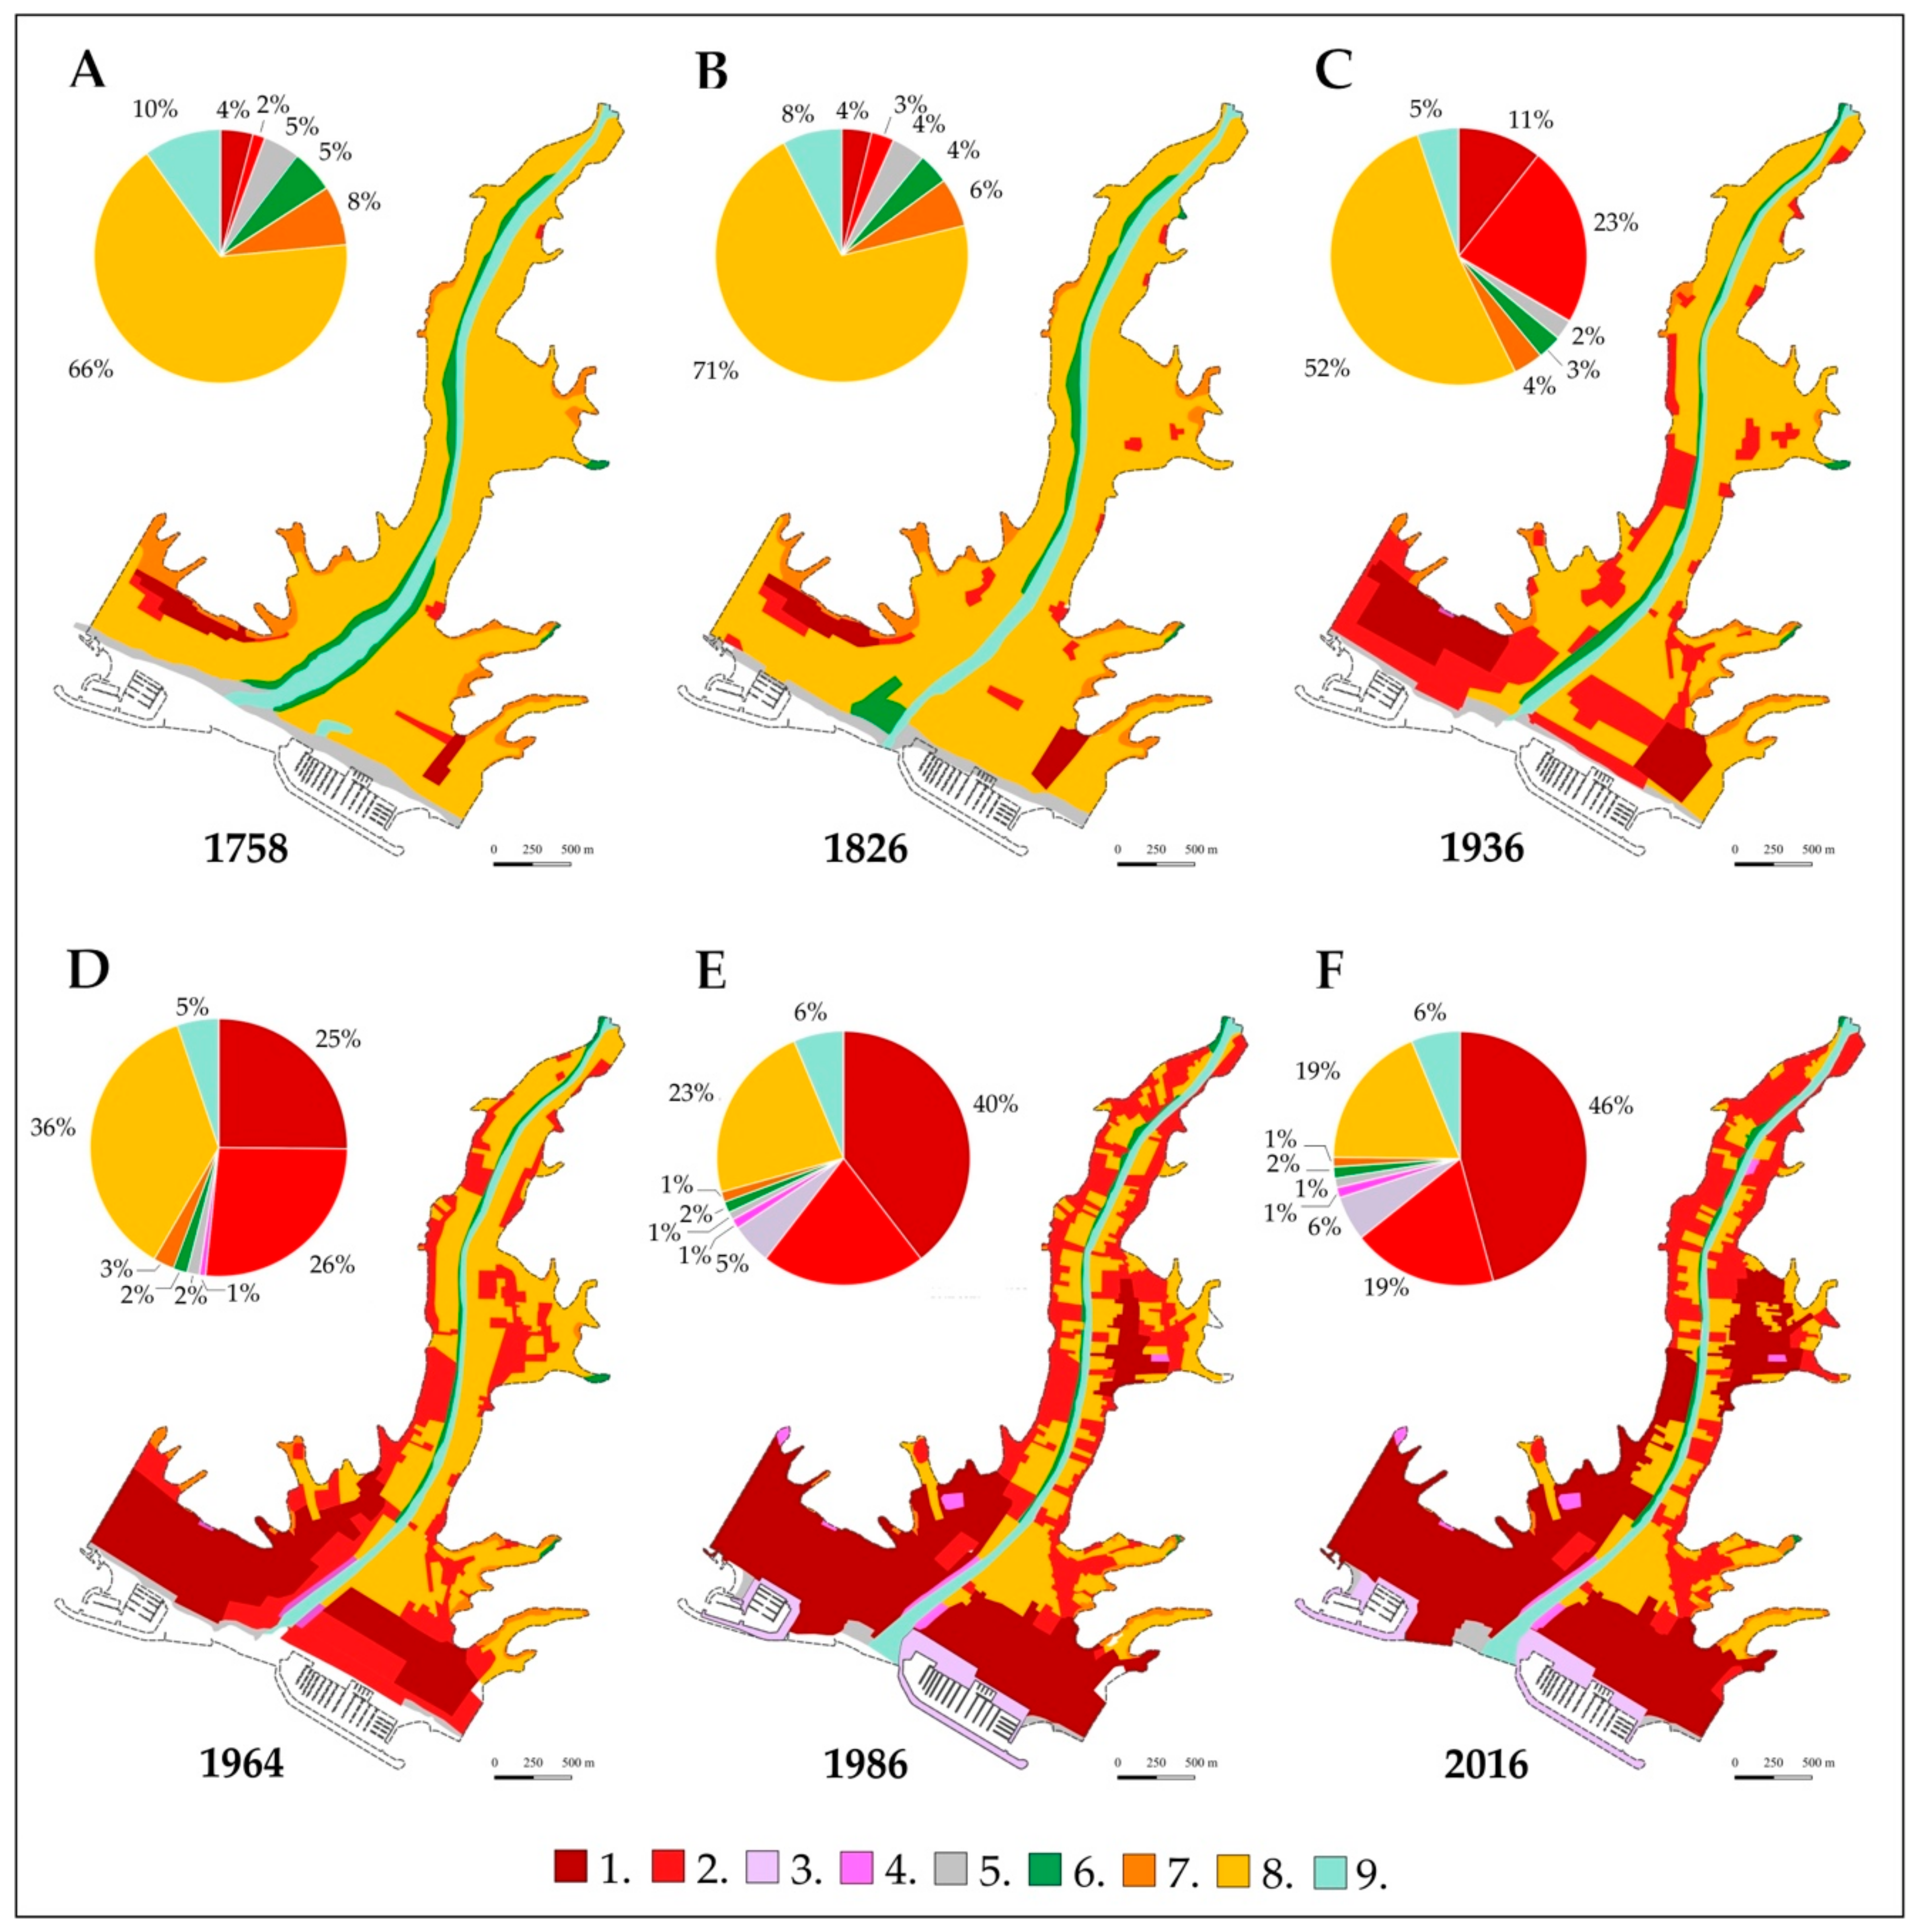
Sustainability 10 03727 g005
Figure 6. Land use changes from 1758 to 2016. Pie charts (AF) show the relationship between different types of land use and land-cover categories provided by the CORINE project. Land use categories: 1, continuous urban fabric; 2, discontinuous urban fabric; 3, port area; 4, artificial, non-agricultural vegetated area; 5, shore; 6, forested area; 7, olive groves; 8, cultivated area; 9, watercourse.
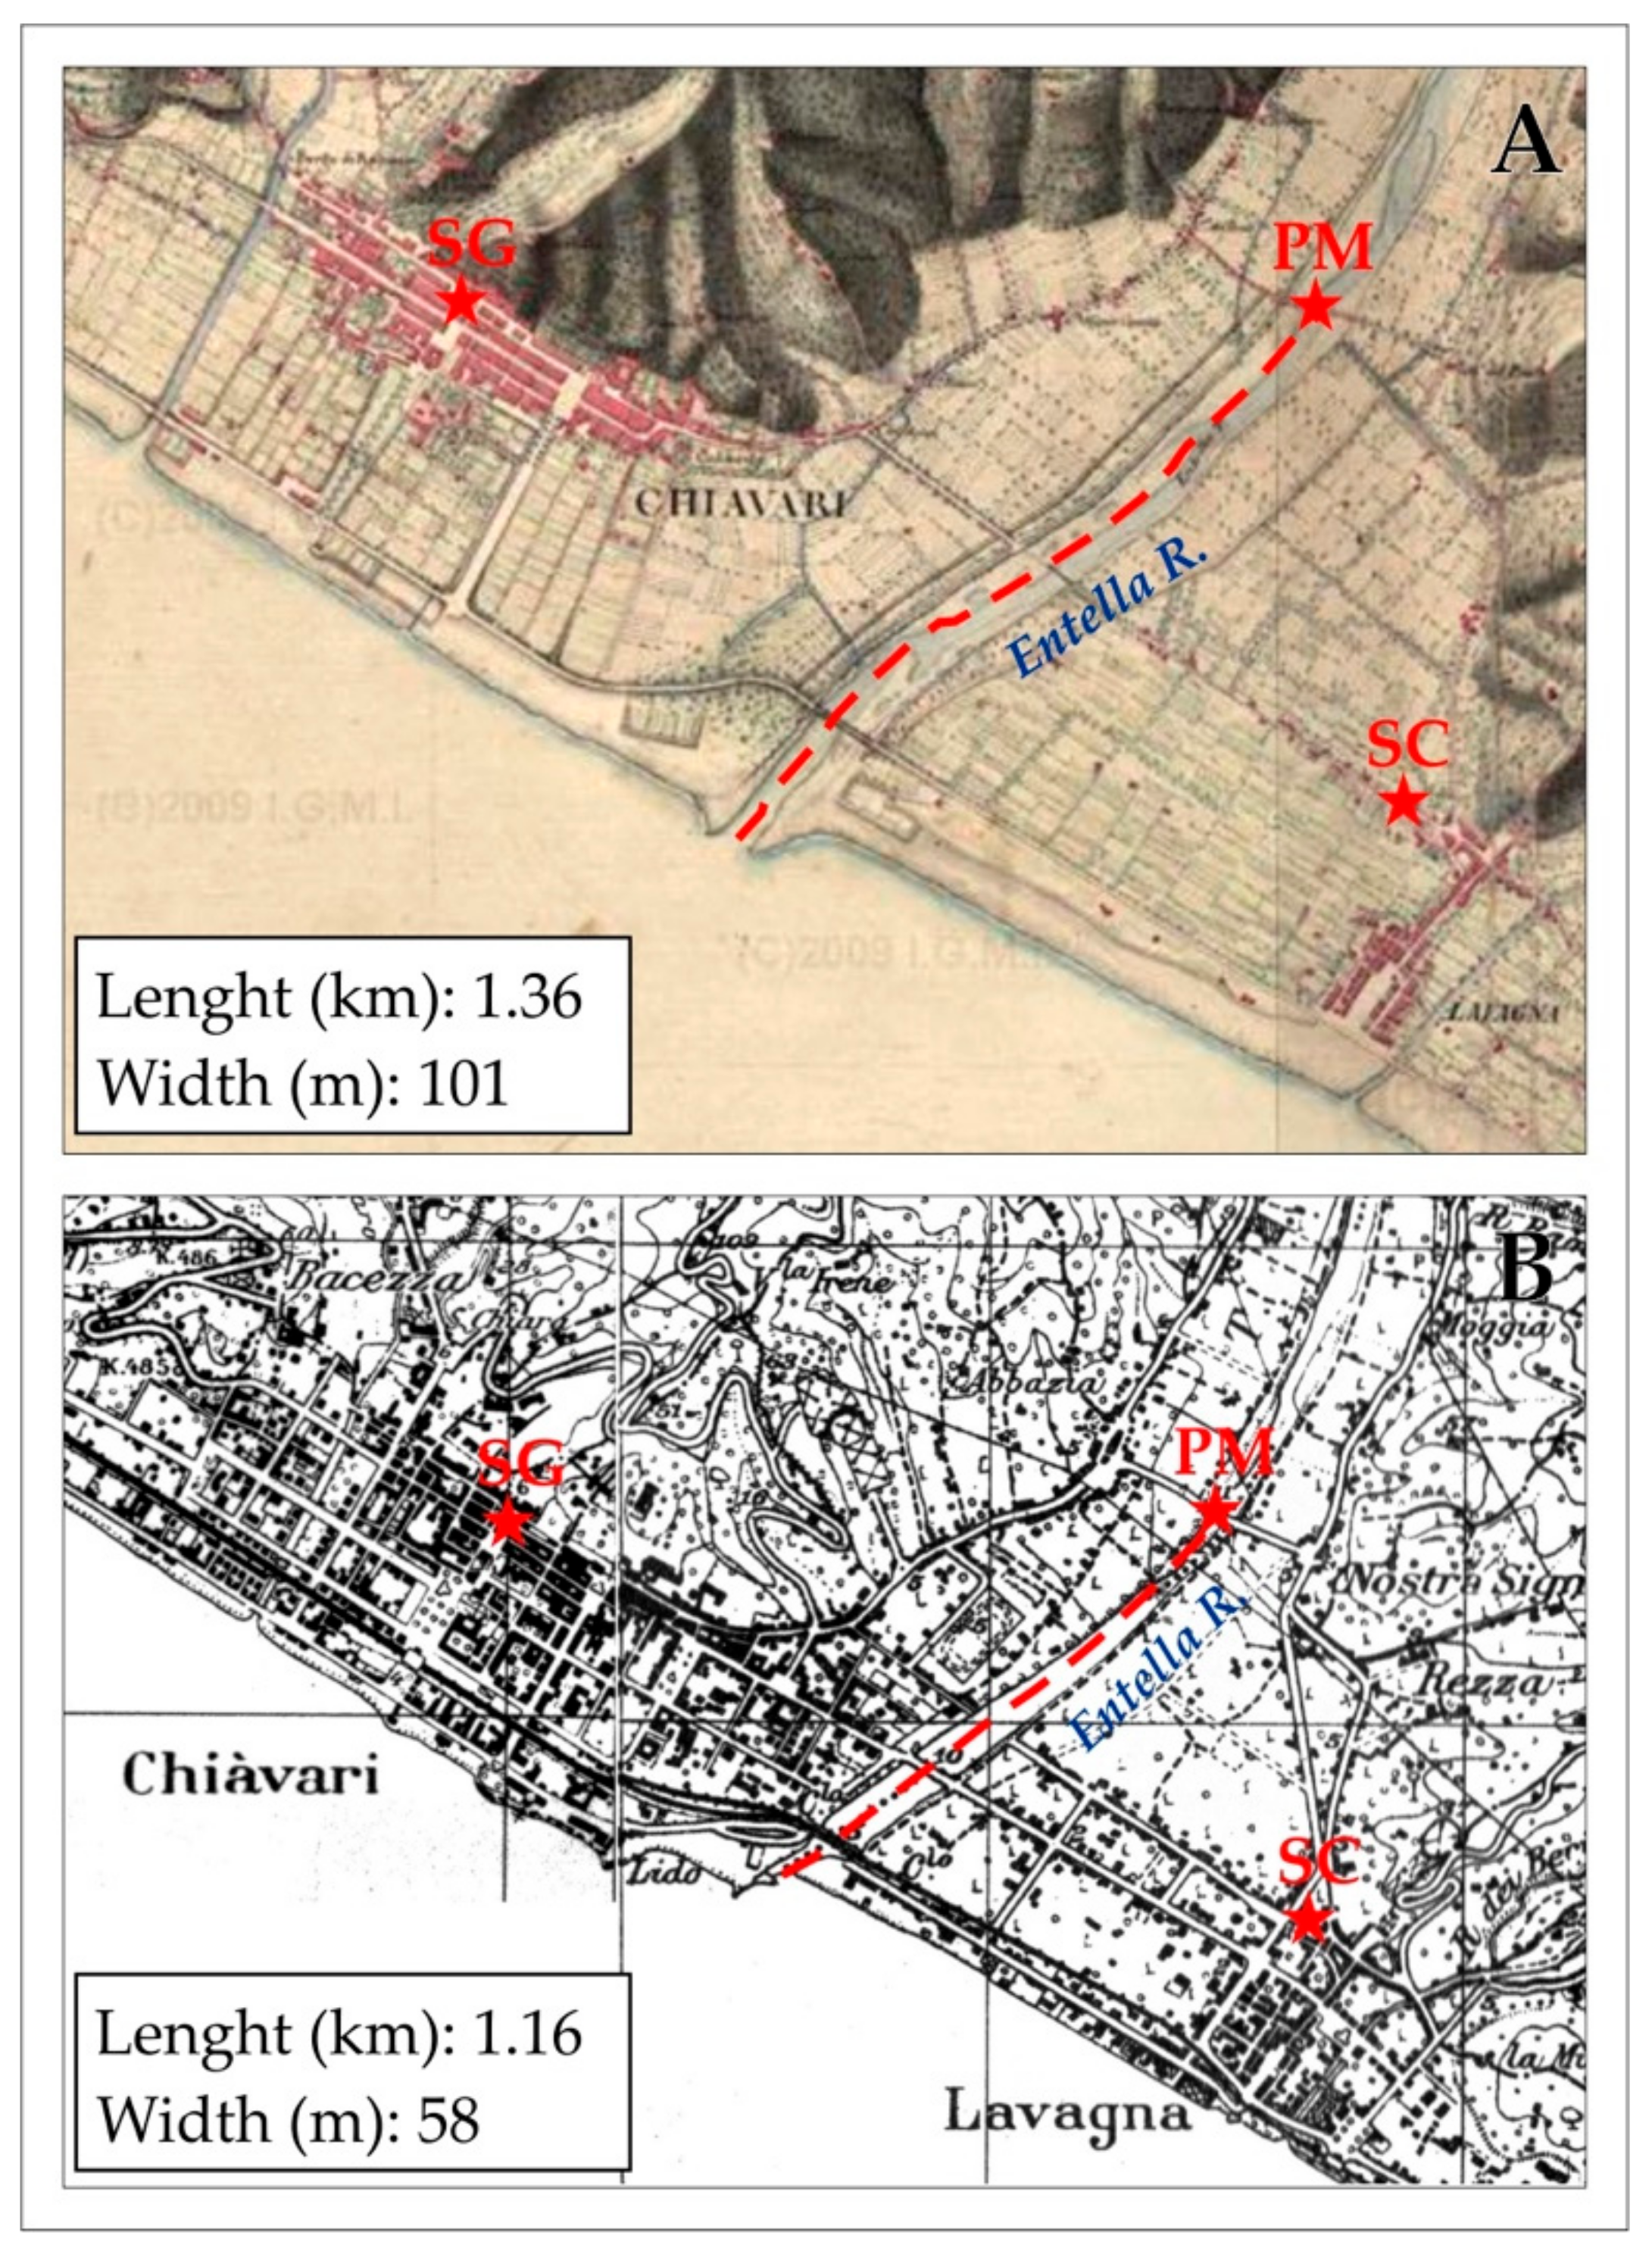
Sustainability 10 03727 g006
Figure 7. The Entella floodplain in the 19th and 20th centuries: (A) “Gran Carta degli Stati Sardi in Terraferma, Riviera di Levante”, Istituto Geografico Militare Italiano, 1816–1826; (B) “Carta Topografica d’Italia—serie 25, Foglio 94, Tavolette I-NO “Chiavari” e I-NE “Sestri Levante”, Istituto Geografico Militare Italiano, 1936. Red stars show reference points: SG, “San Giovanni Battista” Church; PM, “Ponte della Maddalena” bridge; SC, “Nostra Signora del Carmine” Church. (See also Figure 2). Red dotted lines show the axis of the channel. Values of the length and width channel are measured at the PM reference point.
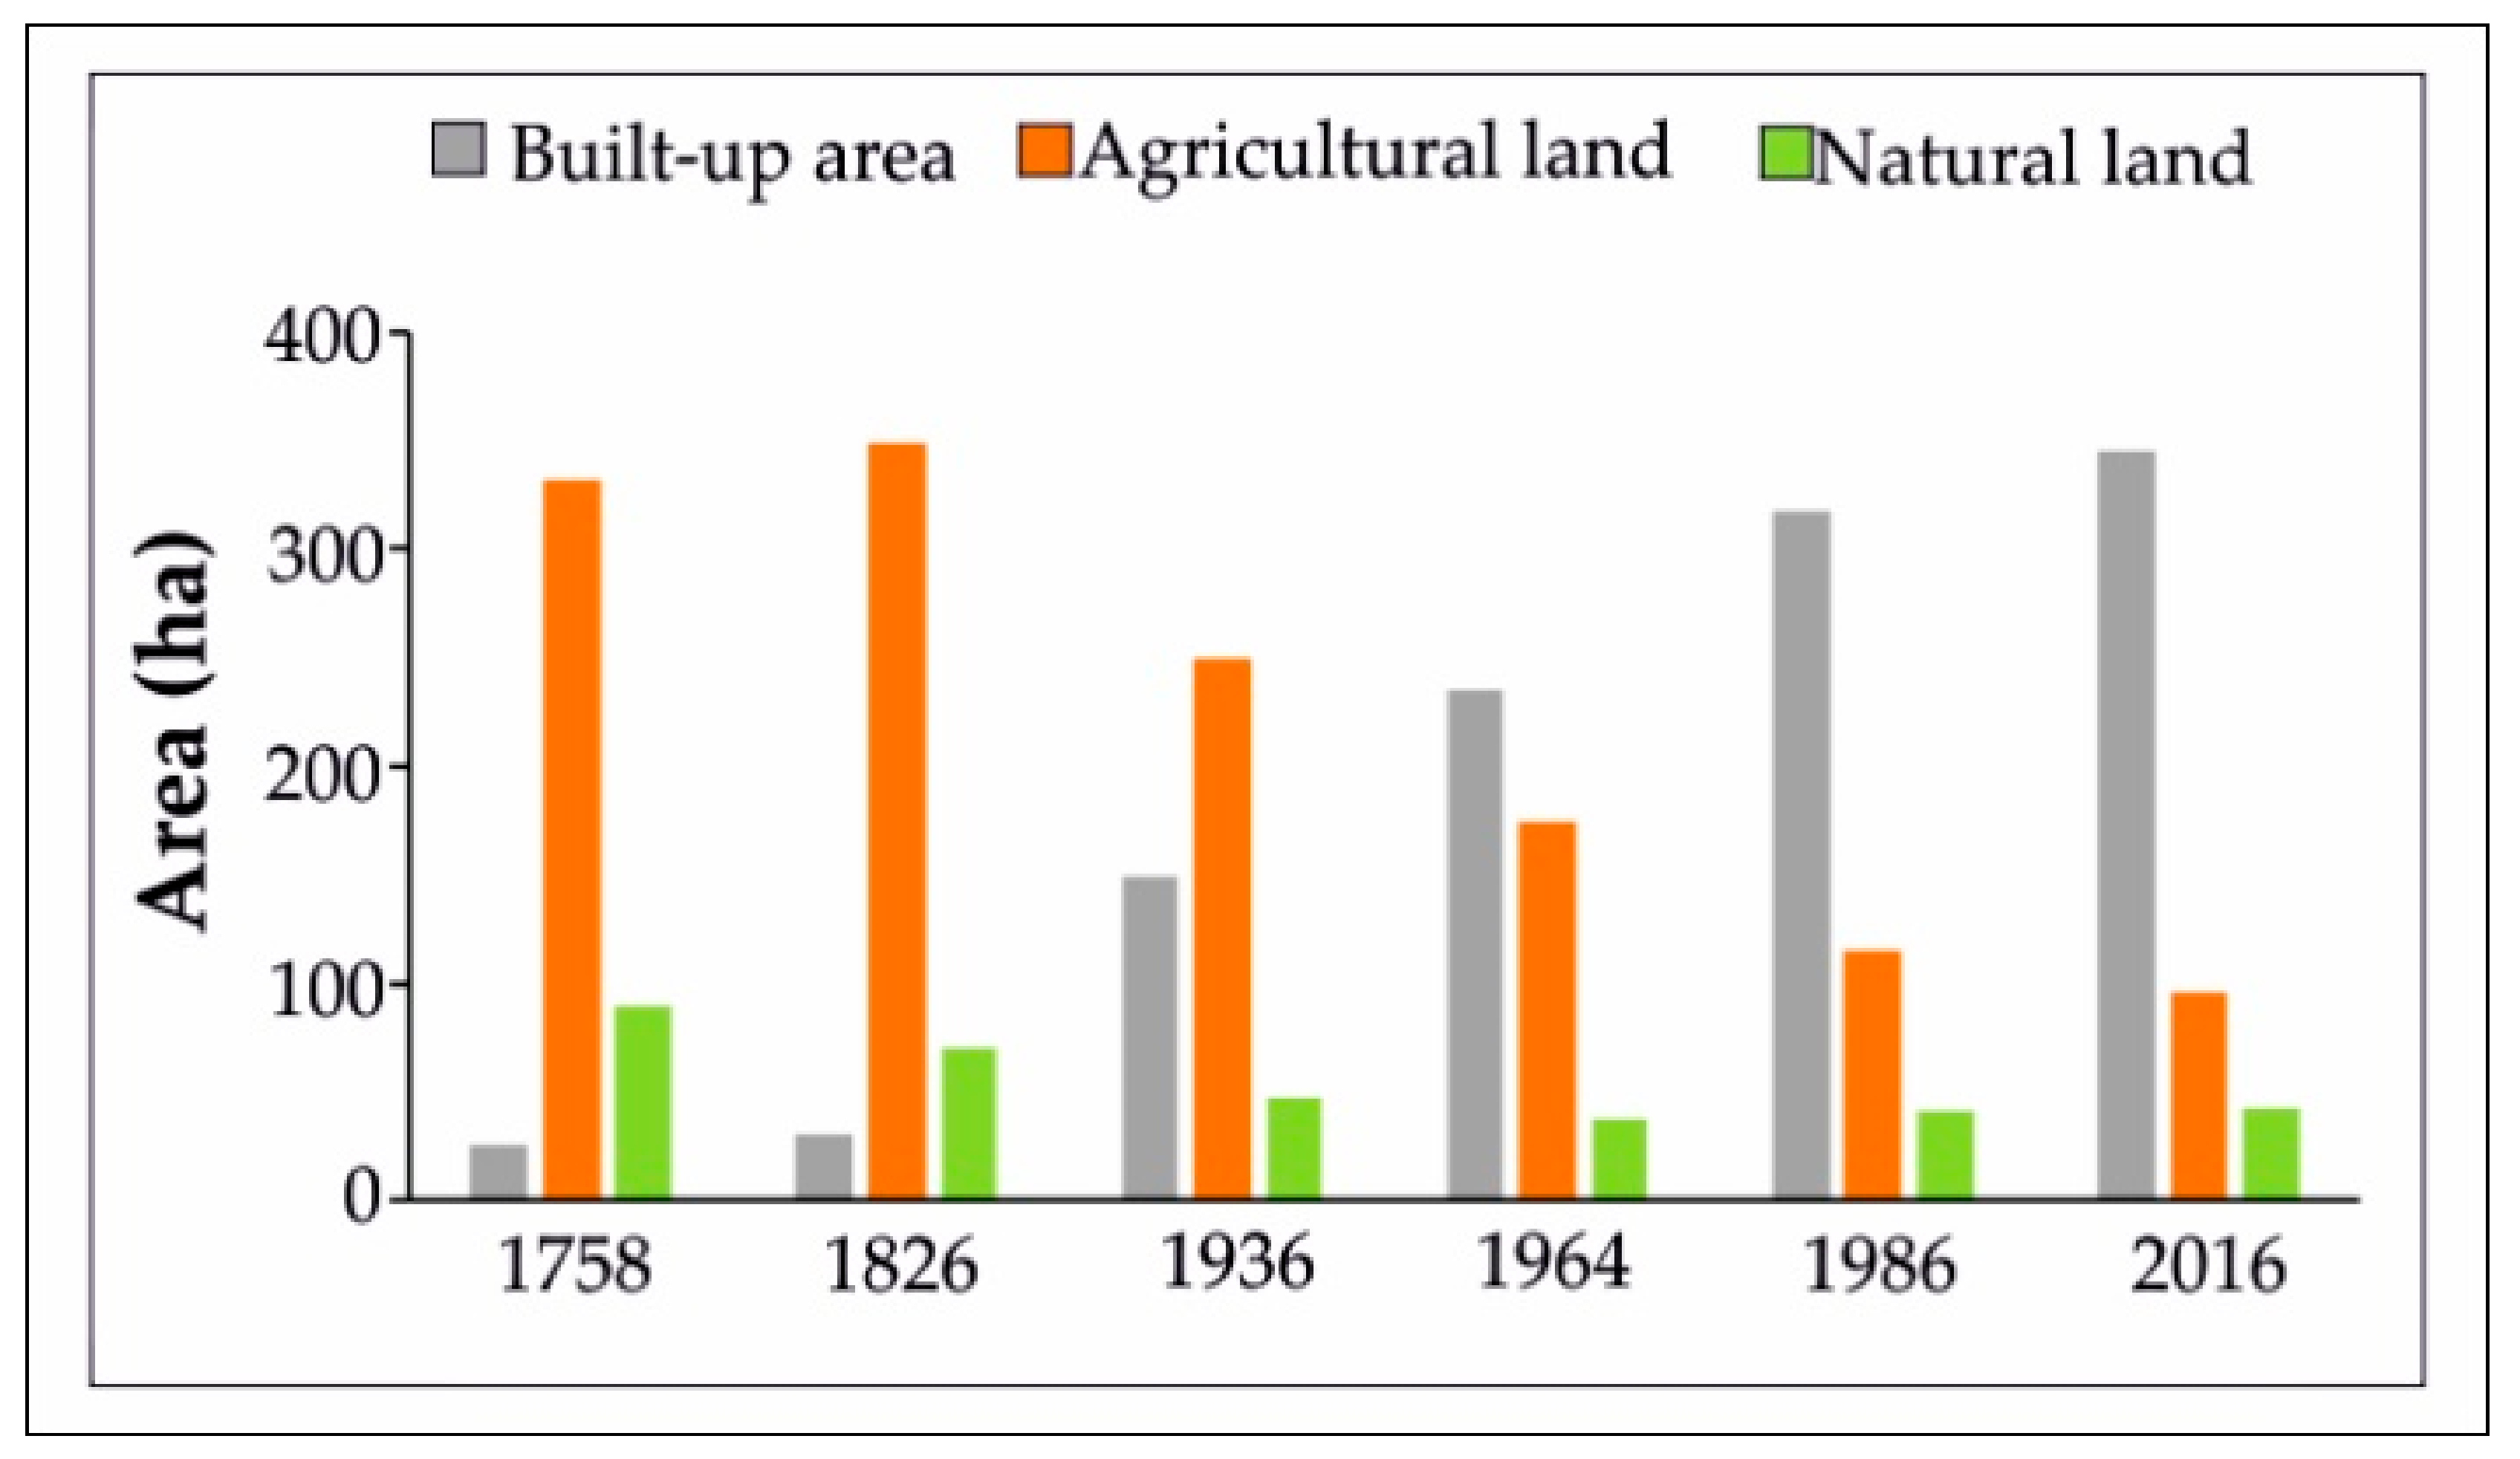
Sustainability 10 03727 g007
Figure 8. Land use modification over the last two centuries: built-up area includes urban fabric, port areas and artificial, non-agricultural vegetated areas; agricultural land includes complex cultivated land and olive groves; natural land includes forested areas, shores and watercourse.
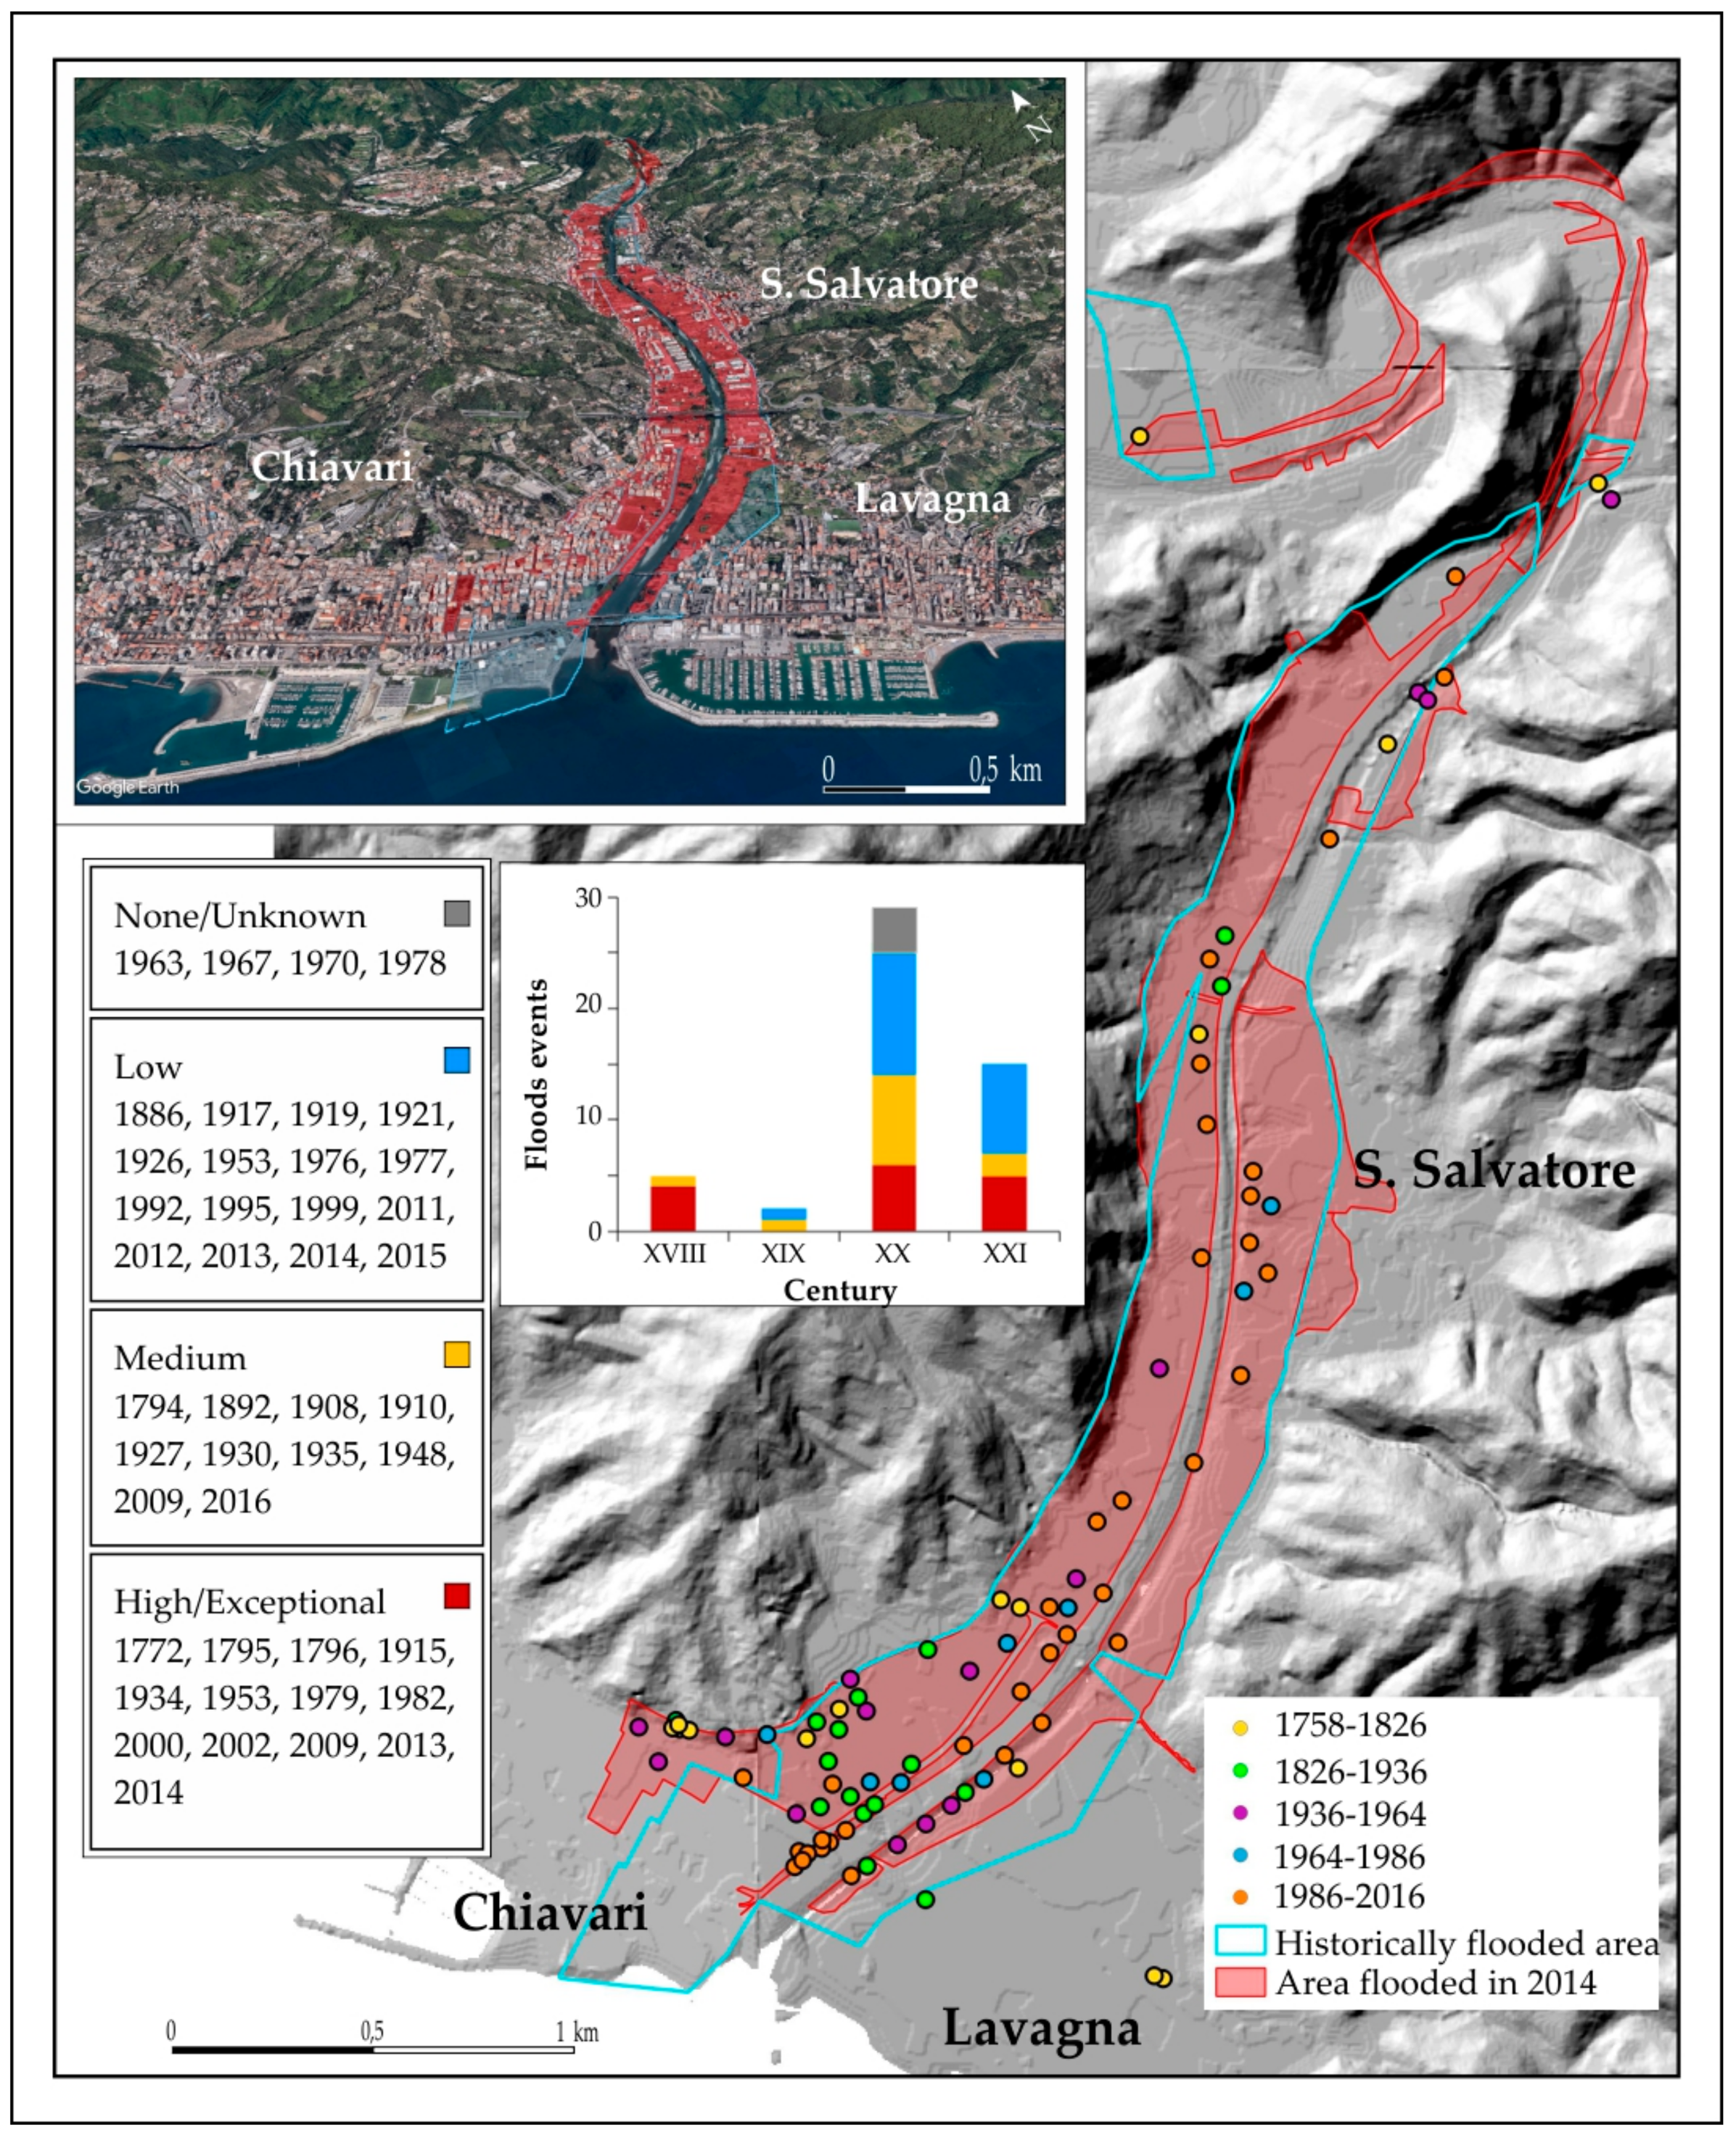
Sustainability 10 03727 g008
Figure 9. The main map shows the distribution of flood events (colored dots) that occurred in the Entella floodplain from 1758 to 2016. Events are classified into the five time breaks adopted in the historical analysis. Blue areas show the urban region historically flooded and red areas show the urban region that were inundated during the flood events of the year 2014. The table lists the years in which flood events occurred, classifying them according to the level of damage (none or unknown, low, medium and high or exceptional): years with exceptional floods are in bold, stars indicate years with events that caused fatalities. The graph shows the temporal distribution of the flood events.
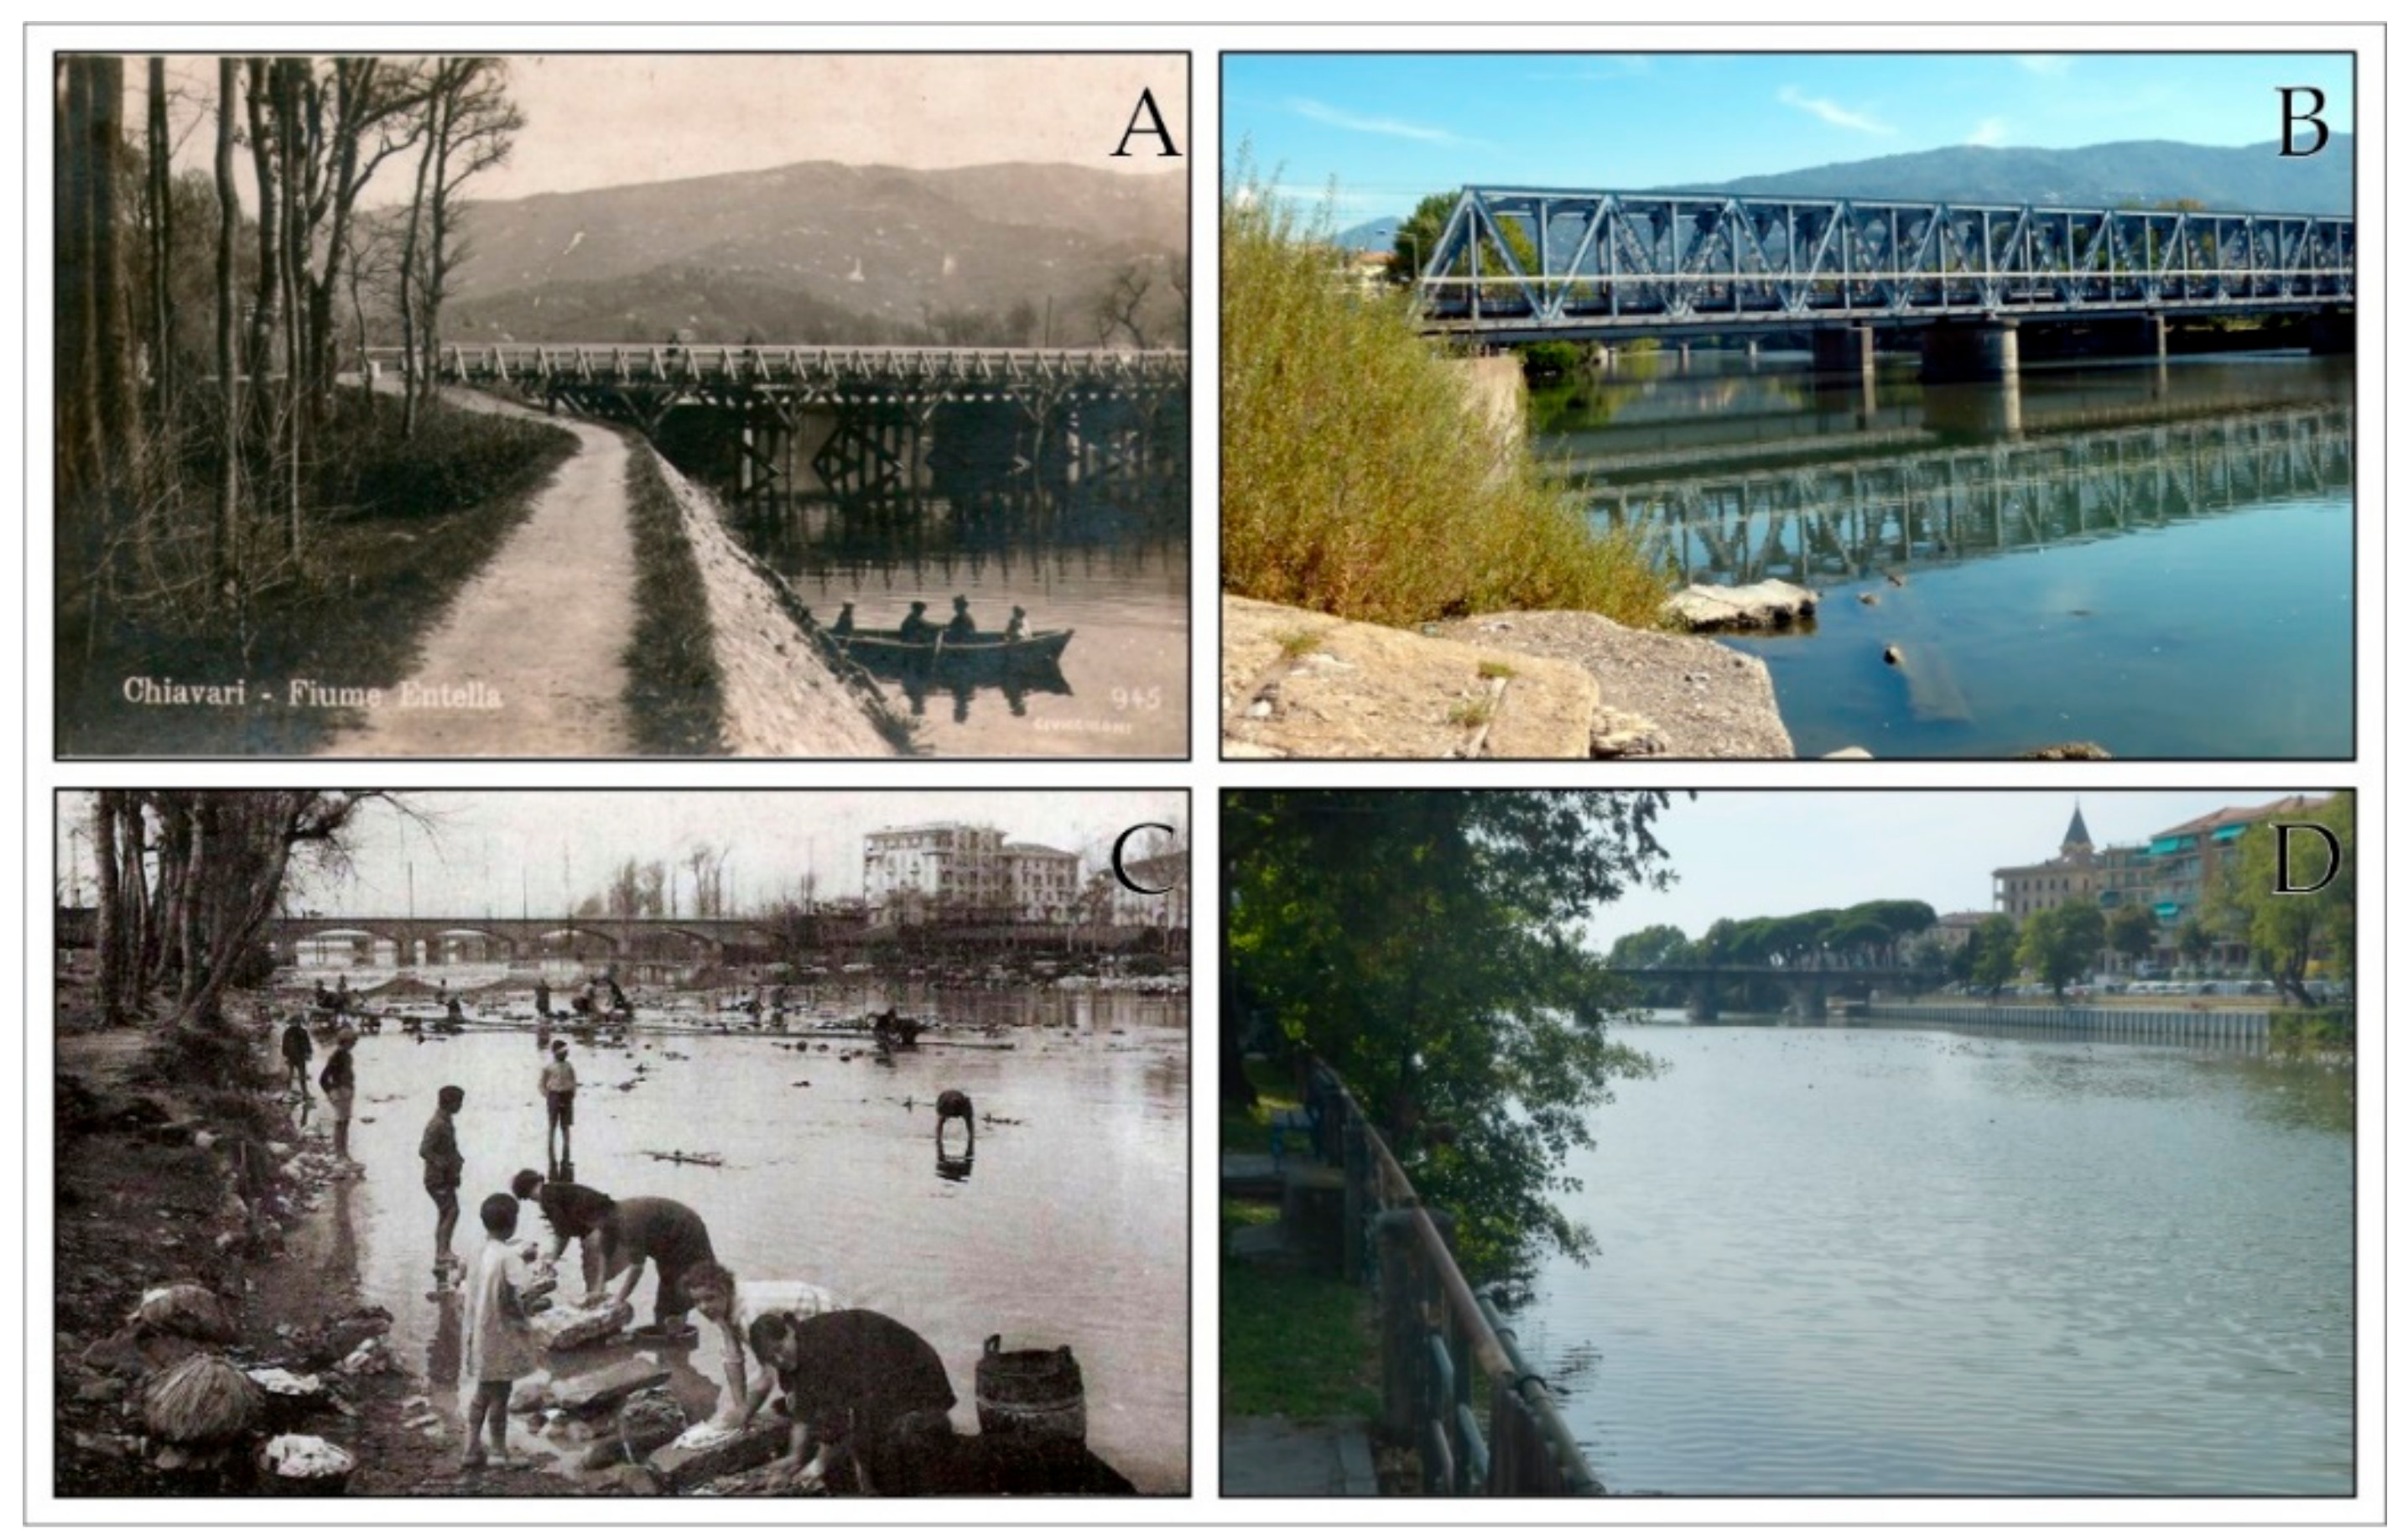
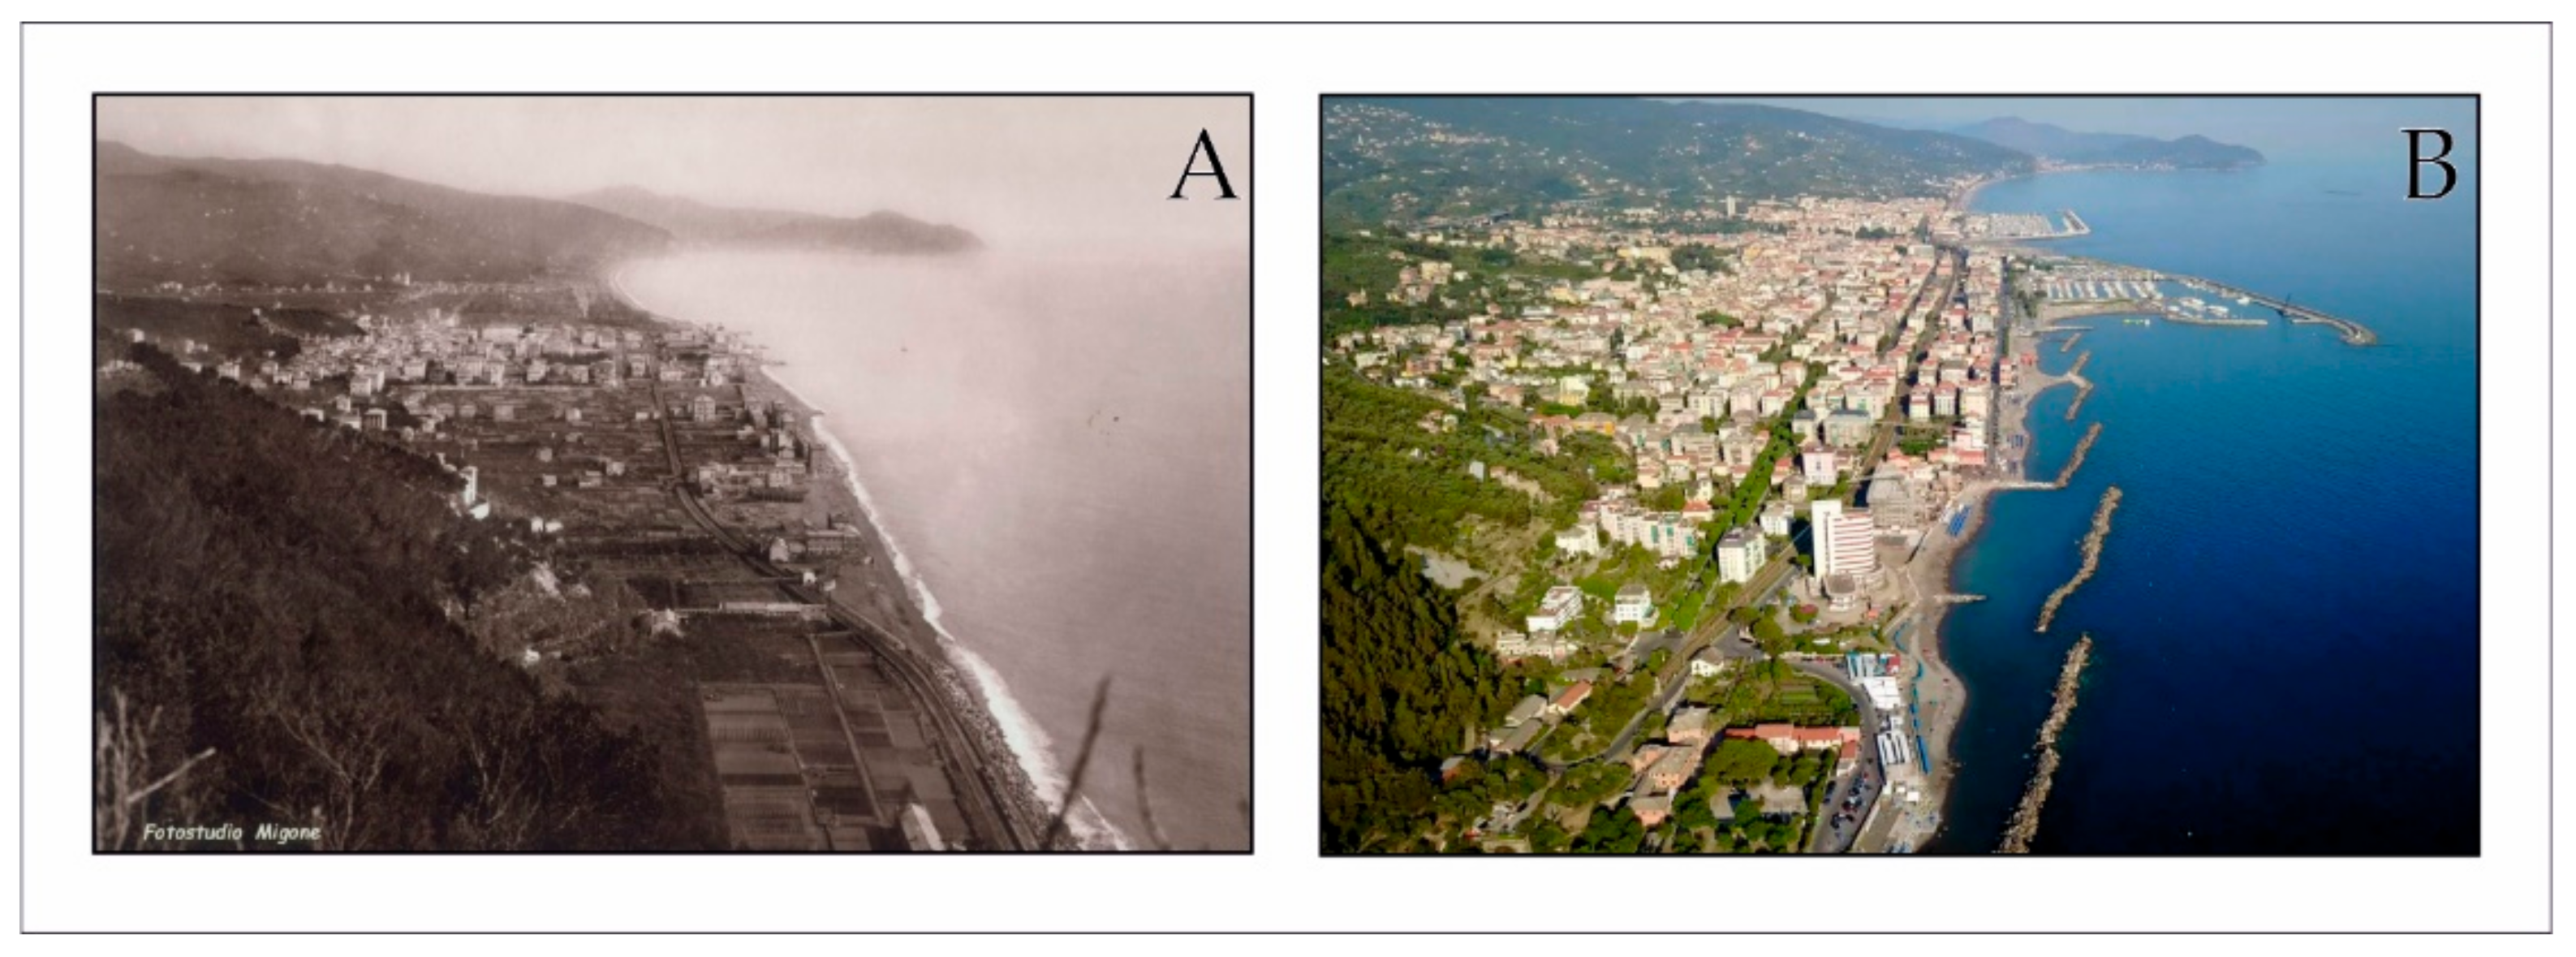
Sustainability 10 03727 g009
Figure 10. The Entella floodplain and its shoreline and land use modification over the last two centuries: (A) view of Chiavari and the western sector of the floodplain with market gardens, olive groves and vineyards in 1890 (“E. Migone”, photographer archive Chiavari); (B) recent view of Chiavari and its western urban districts and modified shoreline (Photo P. Giacomelli).
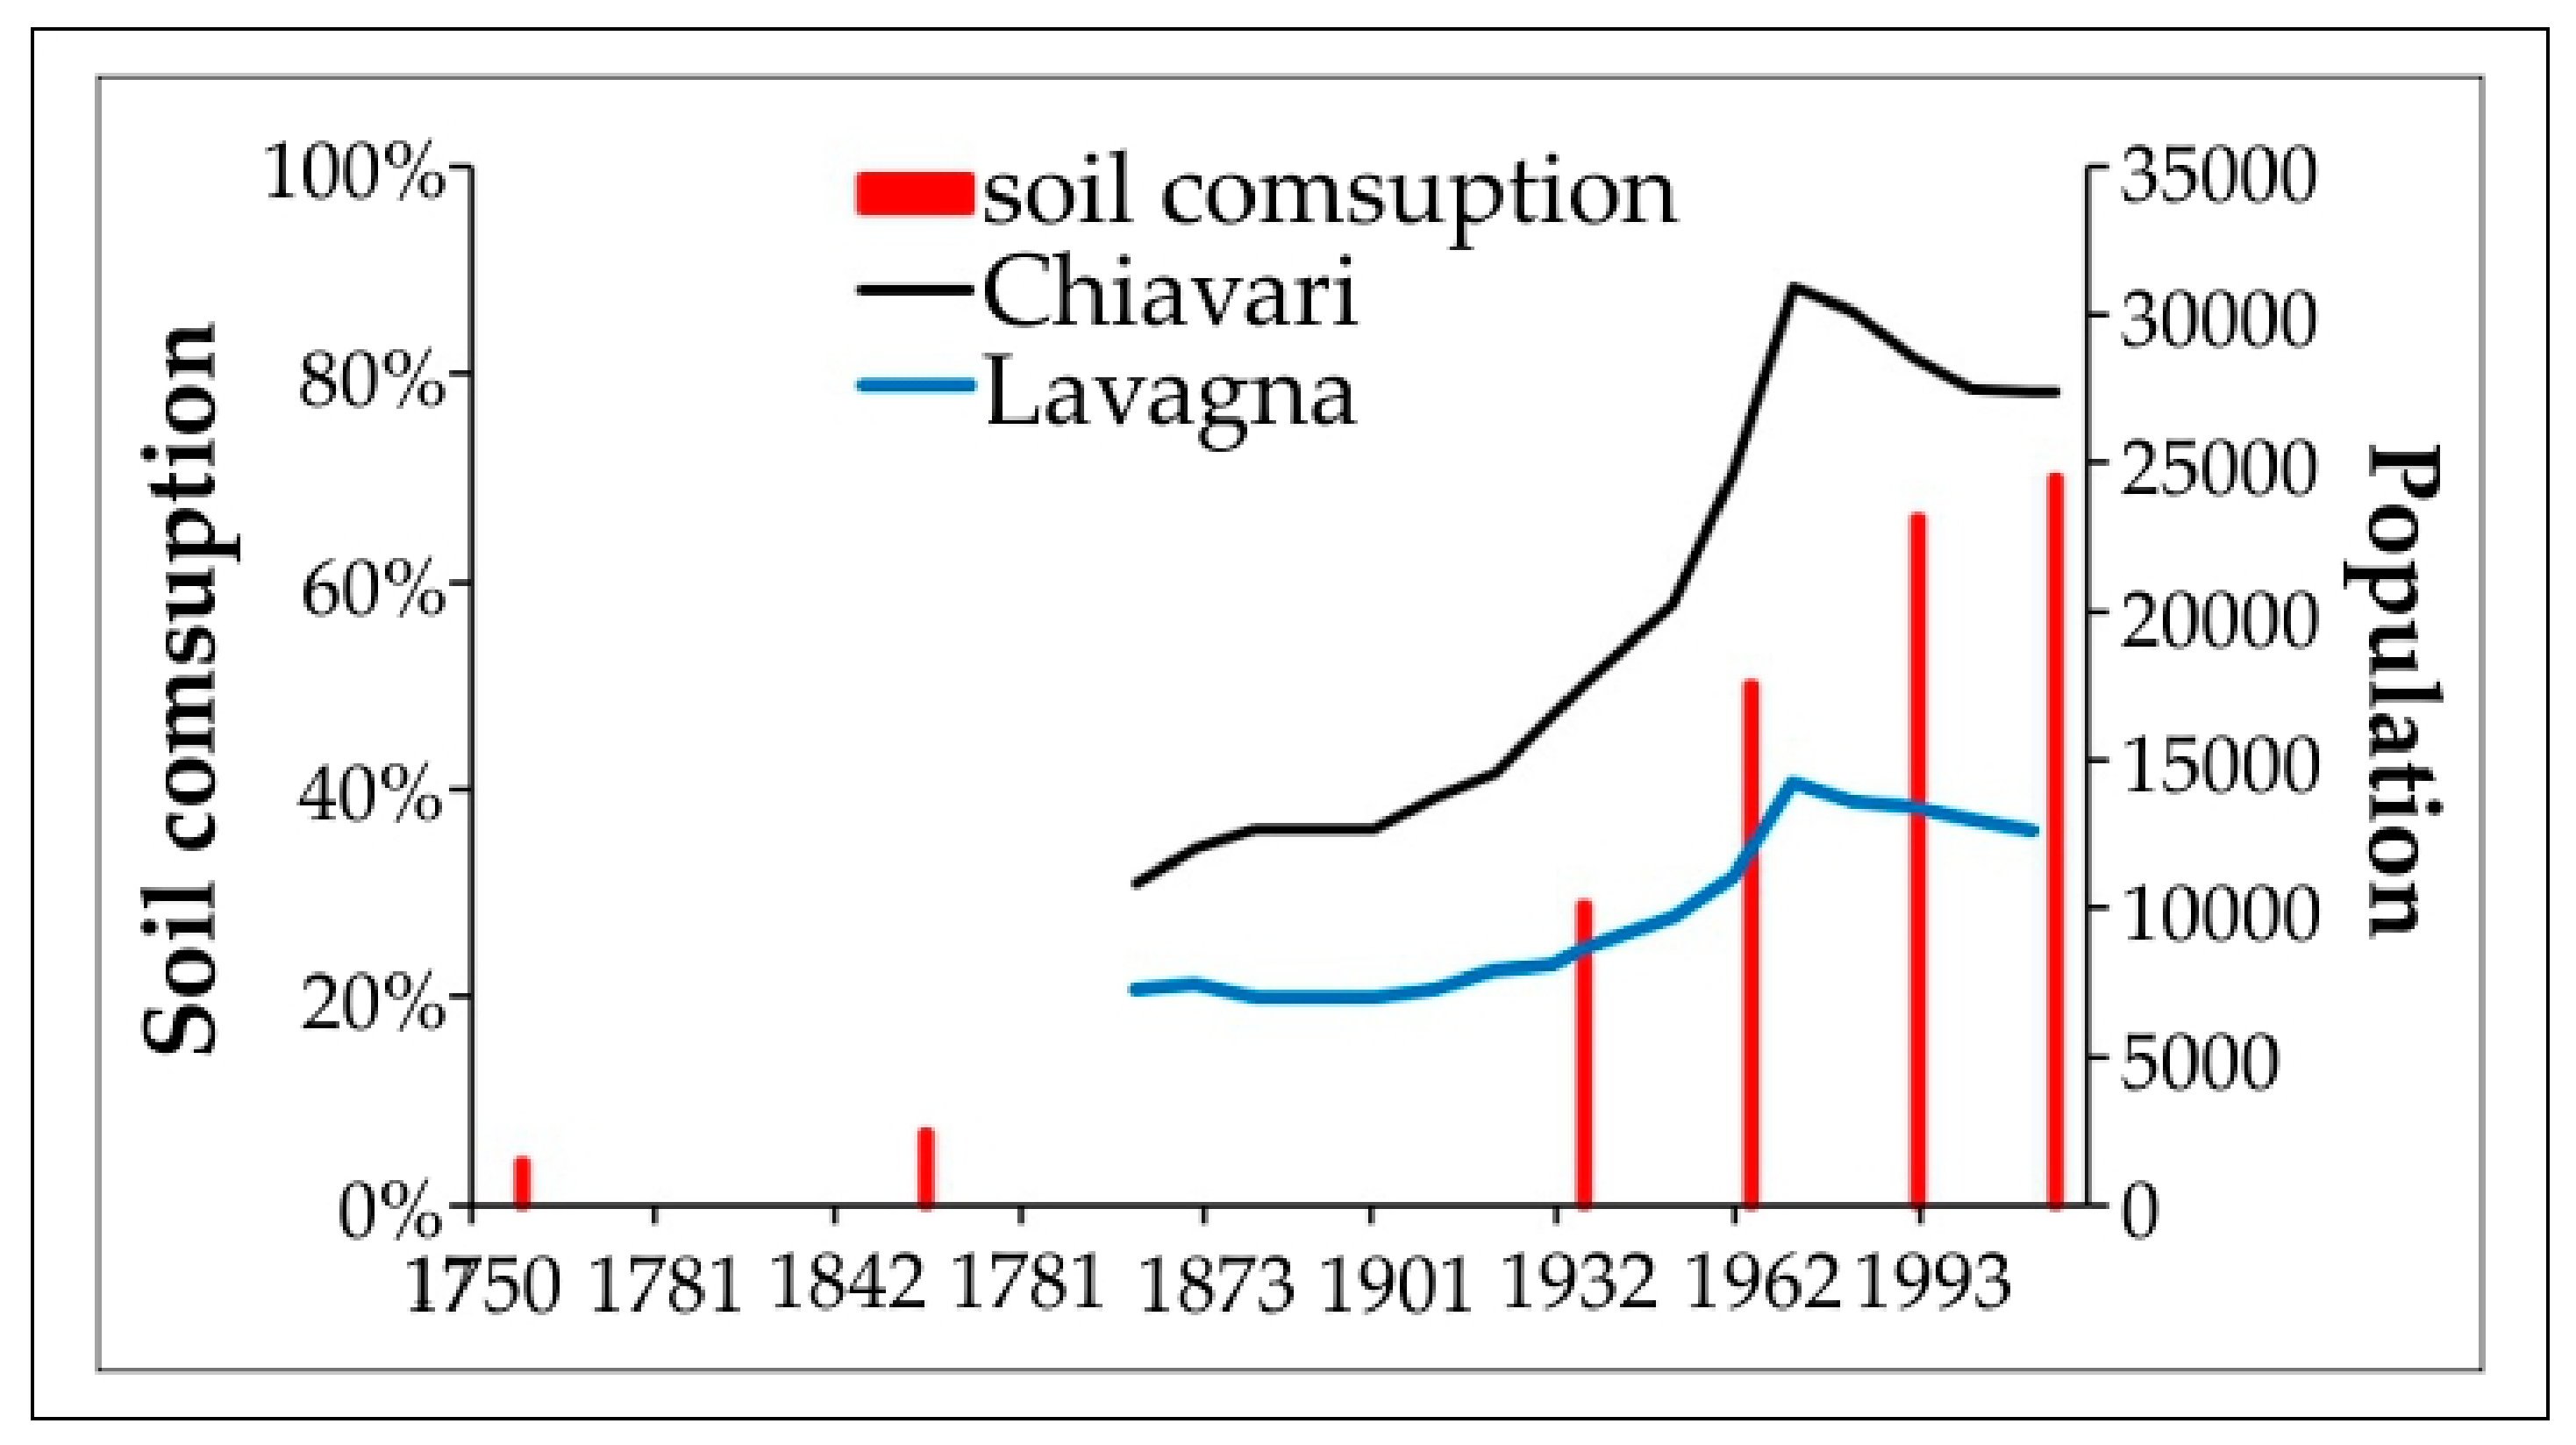
Sustainability 10 03727 g010
Figure 11. Soil consumption (%) correlated to the population increase (number of inhabitants) in Chiavari and Lavagna over the last 150 years (1861–2014). Red bars represent soil consumption, black and blue lines are the number of inhabitants registered in Chiavari and Lavagna, respectively, by population census from 1861 to 2014.
Sustainability 10 03727 g011
Figure 12. View of the Entella banks over the last two centuries: (A) concrete levees and fences at the beginning of the 20th century (Photographer’s Archives “E. Migone”, Chiavari) and (B) embankment at present day (Photo E. Roccati) along the western riverside, Chiavari; (C) levees at the beginning of the 20th century (Photo Web) and (D) bank and Cycle path at the present day (Photo E. Roccati) along the eastern riverside, Lavagna.
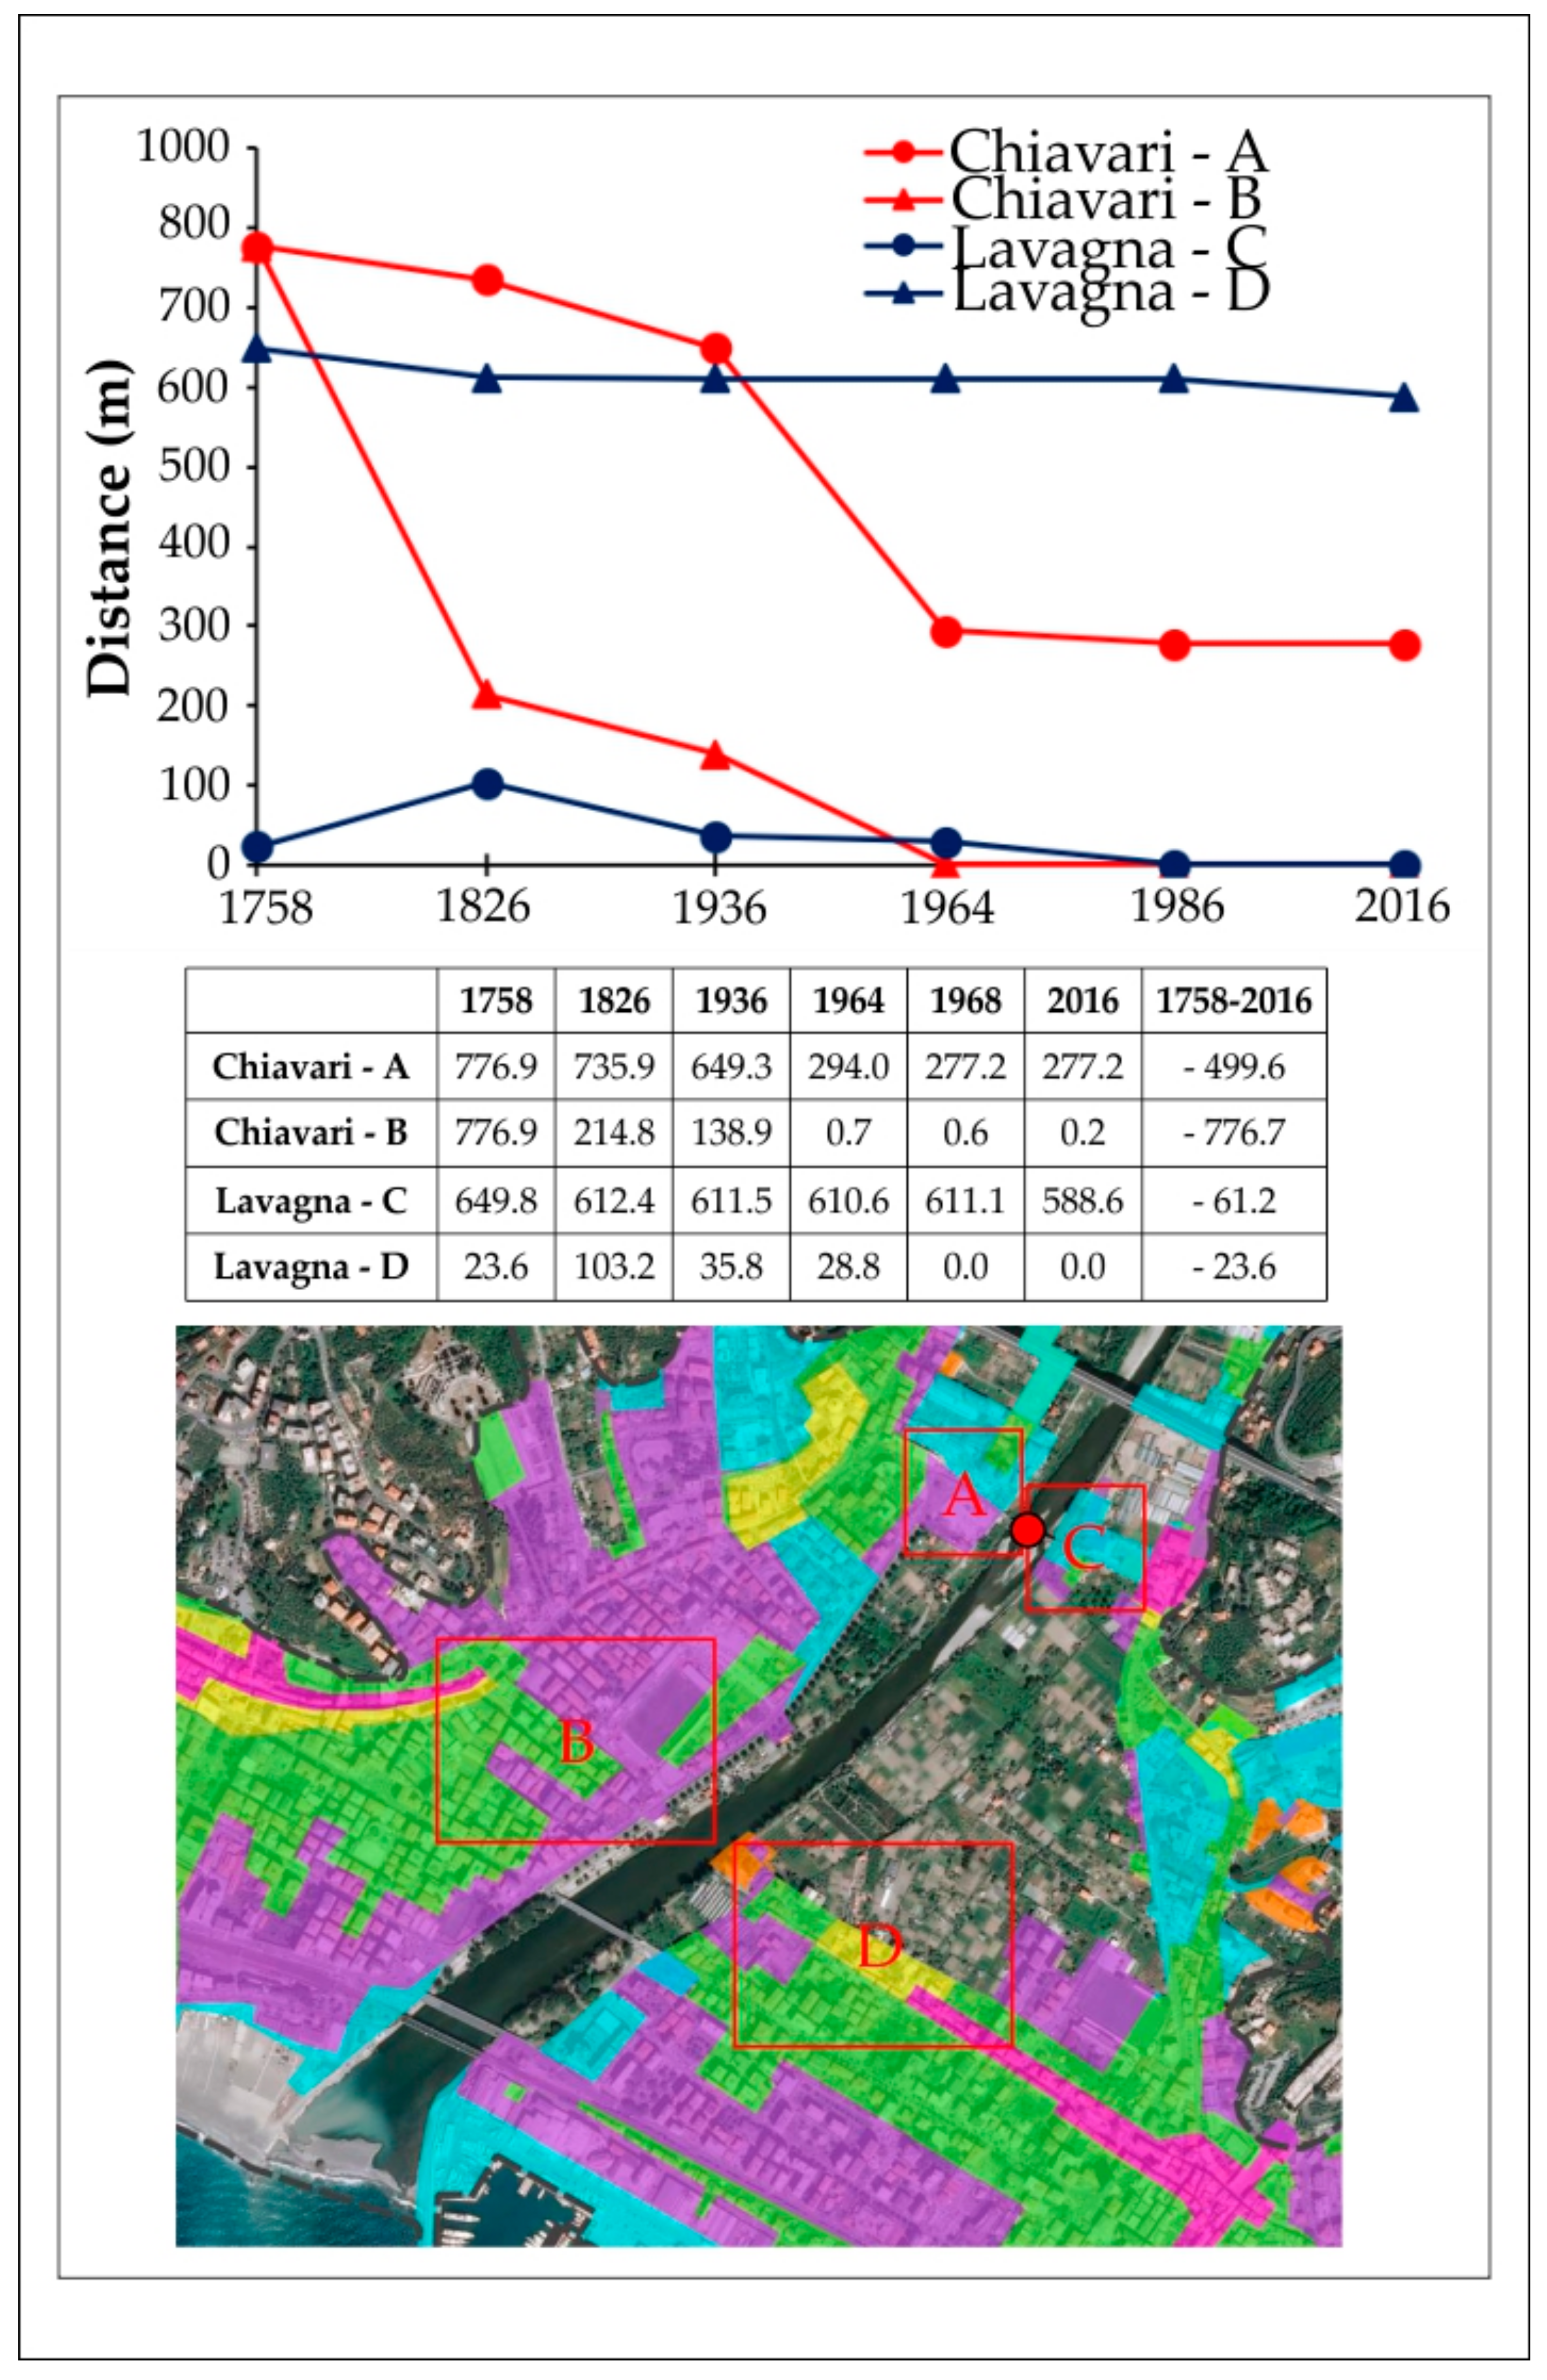
Sustainability 10 03727 g012
Figure 13. Variations in the distance of the river channel from the built-up area 1758–2016. A, B, C, D are the floodplain sectors (red rectangles in the map) where the distances of built-up area have been measured from the channel riversides at the “Ponte della Maddalena” bridge (red dot on map).
Sustainability 10 03727 g013
Table 1. Overview of the historical and recent maps and photos used in the research. A “palmo” (*) was an ancient unit of length measurement used in the Genoa district until the 19th century; in the metric system, it corresponds to 0.248083 m, as officially defined in the historical conversion table of the Kingdom of Italy [51].
Map NameAuthor/AuthorityScaleYearFig./Tab. Reference
Historical mapVinzoni M.Palmi *1758Figure 3A, Figure 4, Figure 5A and Figure 6A
Historical mapVinzoni M.Palmi *1773Figure 3B
Main mapUnknown-collection Italian Military Geographical Institute1:9,4501800Table 2 and Table 3
Cadastral and main mapNapoleonic Cadastre—Italian Military Geographical Institutevarious1809–1811Table 2 and Table 3
Details campaign mapSavoy Kingdom Army—Italian Military Geographical Institute1:9,4501815–1826Figure 4, Figure 5B, Figure 6B and Figure 7A, Table 2 and Table 3
Location planTirelli A.A.1:10,0001915Table 2 and Table 3
Topographical mapItalian Military Geographical Institute1:25,0001936Figure 4, Figure 5C, Figure 6C and Figure 7B, Table 2 and Table 3
Aerial photoItalian Military Geographical Institute1:65,0001954Table 2 and Table 3
Thematic maps related to regional land useLiguria Region1:25,0001964, 1973–1975Figure 5D and Figure 6D
Urban evolution mapLiguria Region1:50,0001986Figure 4, Figure 5E and Figure 6E
Land use CORINELiguria Region1:100,0001992Figure 4
Topographical mapLiguria Region1:25,0001995Figure 4
Technical mapLiguria Region1:50001990–2007Figure 4, Table 2 and Table 3
Land useLiguria Region1:10,0002015Figure 4, Figure 5F and Figure 6F
Satellite imageGoogle Earth-2016Figure 4, Figure 5F, Figure 6F and Figure 9, Table 2 and Table 3
Table 2. Errors in georeferencing the raster scans of the historical paper maps (in pixel), calculated using the Root Mean Square Error (RMSE).
YearsRMSEtot in XRMSEtot in YRMSEtot
17583.7046 × 10−81.5006 × 10−83.9969 × 10−8
17731.9541 × 10−73.0281 × 10−74.0085 × 10−7
18001.6854 × 10−81.5995 × 10−82.4000 × 10−8
18098.9178 × 10−74.3145 × 10−79.9051 × 10−7
18112.3704 × 10−91.1292 × 10−92.6289 × 10−9
18263.5653 × 10−45.8040 × 10−46.8115 × 10−4
19154.9937 × 10−71.3026 × 10−61.3945 × 10−6
19542.9019 × 10−79.7922 × 10−83.0626 × 10−7
Table 3. Land use classification system and type description.
CategoryDescription
Continuous urban fabricBuildings, roads, rail networks and artificially surfaced areas, including industrial or commercial units, coverage > 80%.
Discontinuous urban fabricBuildings, roads, rail network and artificially surfaced areas, including industrial or commercial units, coverage < 80%.
Port areaInfrastructures of port areas, including quays, dockyards and marinas.
Artificial, non-agricultural vegetated areaAreas with vegetation within the urban fabric, including parks and cemeteries, sport and leisure facilities with vegetation.
ShoreBeaches and expanses of sand or pebbles in coastal areas.
Forested areaArea occupied mainly by trees of different species (broad-leave or coniferous), including shrubs and bushes.
Olive groveAreas planted with olive trees, including mixed occurrence of olive trees, vines or chestnuts on the same parcel.
Cultivated areaHeterogeneous cultivated areas mainly occupied by small parcels of different crops, including open fields and under plastic or glass cultivation of vegetables, aromatic plants and fruits trees and flowers nurseries, interspersed with natural areas, including forests, moors, grassland or water bodies
Water courseNatural or artificial water courses serving as water drainage channel, with width channel > 100 m
Table 4. Values of the channel width measured at the bridge “Ponte della Maddalena” in the 1758–2017 period.
YearsWidth (m)
1758123
1773207
180089
1809103
1826101
191588
193658
195478
201683
Table 5. Distance of the sea from the Chiavari medieval walls reported in historical documents.
YearsDistance (m)
1530297
1656350
1790409
1810445
1830393
1846385
Table 6. Land type in the Entella floodplain from 1758 to 2016 (in ha).
Land Type175818261936196419862016
Artificial area25.731.2149.4234.9292.9345.5
Vegetated area378.9397.7274.3190.0126.6108.7
Watercourse44.535.123.223.330.230.3
Table 7. Land use in the Entella floodplain from 1758 to 2016 (in ha).
Land Use Category175818261936196419862016
Continuous urban fabric18.617.747.4112.7187.6221.9
Discontinuous urban fabric7.113.5101.7118.899.589.7
Port area0.00.00.00.024.827.8
Artificial, non-agricultural vegetated area0.00.00.33.45.86.3
Shore21.219.811.07.04.85.9
Forested area24.618.413.87.86.87.0
Olive grove34.229.016.811.96.35.8
Complex cultivated area289.9330.5232.8163.3108.890.0
Watercourse44.535.123.223.330.230.3
Table 8. Area statistics on land use types changes in the Entella floodplain from 1758 to 2016 (in ha).
Land Use type1758–18261826–19361936–19641964–19861986–20161758–2016
Artificial area5.5118.285.558.052.7319.9
Vegetated area18.8−123.3−84.3−63.4−17.9−270.2
Watercourse−9.4−11.90.16.90.1−14.1
Table 9. Area statistics on land use categories changes in the Entella floodplain from 1758 to 2016 (in ha).
Land Use Category1758–18261826–19361936–19641964–19861986–20161758–2016
Continuous urban fabric−0.929.765.374.934.3203.3
Discontinuous urban fabric6.488.217.1−19.3−9.982.6
Port area0.00.00.024.83.027.8
Artificial, non-agricultural vegetated area0.00.33.12.40.56.3
Shore−1.4−8.8−4.0−2.21.1−15.3
Forested area−6.2−4.6−6.0−1.00.3−17.5
Olive grove−5.2−12.2−4.8−5.7−0.5−28.5
Complex cultivated area31.6−97.7−69.5−54.5−18.8−208.9
Watercourse−9.4−11.90.16.90.1−14.1

