Article

Resource Assessment and Techno-Economic Analysis of a Grid-Connected Solar PV-Wind Hybrid System for Different Locations in Saudi Arabia

by
Yahya Z. Alharthi
*,
Mahbube K. Siddiki
and
Ghulam M. Chaudhry
Department of Computer Science Electrical Engineering, University of Missouri-Kansas City, 5110 Rockhill Rd, Kansas City, MO 64110, USA
*
Author to whom correspondence should be addressed.
Sustainability 2018, 10(10), 3690; https://doi.org/10.3390/su10103690
Submission received: 4 August 2018 / Revised: 10 October 2018 / Accepted: 10 October 2018 / Published: 15 October 2018
(This article belongs to the Collection Power System and Sustainability)

Abstract

:
The economic growth and demographic progression in Saudi Arabia increased spending on the development of conventional power plants to meet the national energy demand. The conventional generation and continued use of fossil fuels as the main source of electricity will raise the operational environmental impact of electricity generation. Therefore, using different renewable energy sources might be a solution to this issue. In this study, a grid-connected solar PV-wind hybrid energy system has been designed considering an average community load demand of 15,000 kWh/day and a peak load of 2395 kW. HOMER software is used to assess the potential of renewable energy resources and perform the technical and economic analyses of the grid-connected hybrid system. The meteorological data was collected from the Renewable Resources Atlas developed by the King Abdullah City of Atomic and Renewable Energy (KACARE). Four different cities in the Kingdom of Saudi Arabia, namely, the cities of Riyadh, Hafar Albatin, Sharurah, and Yanbu were selected to do the analyses. The simulation results show that the proposed system is economically and environmentally feasible at Yanbu city. The system at this city has the lowest net present cost (NPC) and levelized the cost of energy (LCOE), highest total energy that can be sold to the grid, as well as the lowest CO2 emissions due to a highly renewable energy penetration. This grid-connected hybrid system with the proposed configuration is applicable for similar meteorological and environmental conditions in the region, and around the world. Reduction of some greenhouse gasses as well as the reduction of energy costs are main contributors of this research.

1. Introduction

Tropical and hot climate regions all over the world are underutilized in generating power and providing alternative resources of energy [1]. For example, the Gulf Cooperation Council (GCC) countries in the Middle East, which have an abundance of natural resources, there is less incentive to develop Renewable Energy (RE) projects. Other reasons may be related to political and economic instability that deprive governments of financial resources to invest in new technology [2,3]. The Kingdom of Saudi Arabia (KSA) is considered to be one of the top countries for having some of the hottest weather worldwide. It is also the top fossil fuel consumer for electric power generation in the Middle East [4].
KSA’s power demand has significantly increased over the last two decades [5]. In 2003, the Saudi Electricity Company (SEC) report showed that the peak load of the national grid was 26.2 GW. In 2016, the total amount of electricity generated, reached more than 74 GW, as shown in Figure 1. It is expected to reach more than 100 GW by 2030 due to both rapid population and economic growth [6,7]. The report also presented the total number of customers, which was 3,622,390 in 2000, and recorded an average annual growth of 5.4% from 2000 to 2014.
The power sector of KSA relies heavily on fossil fuels for electric power generation [8,9]. Heavy Fuel Oil (HFO), natural gas, diesel oil, and crude oil are the types of fossil fuels used in power plants. Figure 2 illustrates the development of fuel consumed for power generation from 2000–2014 [6]. Due to the rapid increase in commercial and residential loads every year, appropriate and sufficient electrical power generation must be provided to meet the growth of such demands. However, continued dependence on fossil fuel as the primary energy source will cause fuel depletion, environmental pollution, and have an extremely negative impact on human health [10].
The report in Reference [11] shows that KSA is one of the top producers of carbon dioxide (CO2) emissions in the world. Hence, implementing renewable energy projects for power generation will not only reduce the level of CO2 emissions in KSA, but will also contribute to increasing the kingdom’s revenues [12]. KSA has several suitable locations for implementing renewable power generation projects. Wind and solar energy have the most potential renewable energy sources in the kingdom [13]. An analytical study, made for evaluating different renewable energy sources in Saudi Arabia, shows that photovoltaic (PV), concentrated solar power (CSP), and wind energy are the most effective RE technologies, respectively [14]. Another study, conducted by Munawwar et al. [15], reviewed the growth of the solar industry and renewable energy in the Gulf Cooperation Council (GCC) areas, and stated that solar power production is expected to represent up to 16–22% of the KSA’s total energy generation by 2032. The KSA authorities recognize the importance of wind energy, and will support investments in this sector [16].
In establishing the King Abdullah City of Atomic and Renewable Energy (KACARE) in 2010, the aim was to build renewable energy power sector for KSA. One of the most important projects is the renewable resources atlas of the KSA, which KACARE is developing. Almost 32 monitoring stations across the country provided extensive information about solar resources, and nine stations for wind resources provided limited information [17]. By using these types of data to analyze the potential of renewable energy resources in such hot climate regions, researchers, and power project developers contribute to the achievement of KSA’s 2032 and 2040 RE visions mentioned in References [18,19].
Analytical studies to explore and conduct the performance of solar and wind energy resources in KSA are few. For solar power, a study conducted by Erica et al. [20] summarized one year of solar resource measurement data for 30 stations, which KACARE was provided across the country. They analyzed the Global Horizontal Irradiance (GHI), Direct Normal Irradiance (DNI), and Diffuse Horizontal Irradiance (DHI) data, based on one-minute measurements. Arif et al. [21] addressed the solar energy future aspects and the applications of solar power along with different studies conducted in the same field with the aim of establishing energy polices for KSA [22,23]. In addition, Almarshoud [18] presented a review of the photovoltaic system for 32 sites of solar resources across KSA using three modes of a sun tracking system. That study showed a high productivity of energy and the difference in percentages of using a fixed tilt angle, and 1-axis and 2-axis tracking modes for the 32 sites. A.M. Ramli et al. [24] conducted experimental investigations to study the effect of weather conditions on a PV output power production using a simple rule-based model. This study came up with results presented as a percentage and showed the significant effect of dust, rain, and clouds on a PV panel’s efficiency.
For wind energy, researchers conducted several studies for evaluating the potential of wind energy and resources for different locations in Saudi Arabia. Starting from 2004, S. Rehman et al. [25] presented an analysis of 14 years of wind data for five costal locations in the KSA with the aim of assessing the potential wind energy. In their research paper, they found the most suitable location for harnessing the power of wind. Another study regarding wind power costs in 20 locations in KSA, used data recorded from 1970 to 1982. Here, S. Rehman et al. [26] showed that the minimum cost of electricity generated by using different wind turbines with a maximum output of 2500, 1300, and 600 kW was found to be 0.0234, 0.0295, and 0.0438 $/kWh in the same city. In 2005, Alabbadi [27] assessed the power density and wind energy resources for five locations by using the data collected between 1995 and 2002. Another assessment of wind energy performed in 2012, for five different locations in KSA, was introduced by Eltamaly et al. [28] through a computer program for the purpose of selecting the most effective size of wind turbine for each site. In 2015, Baseer et al. [29] analyzed and presented the characteristics of wind speed for Jubail Industrial City at three different heights. They also analyzed seven locations in the same city by using different wind data at 10 m above ground level (AGL) [30]. The results showed that the East of Jubail Industrial City is the most promising area for wind energy production from a 3 MW wind machine. S.M. Shaahid et al. [31] presented an economic feasibility study for the development of 75 MW wind power plants in four coastal regions in KSA using different combinations of 600 kW wind turbines (wind farms). This research showed that the energy from a wind electric conversion system (WECS) would not produce for 41–53% of the time during the year. Davut Solyali et al. [32] and Farivar Fazelpour et al. [33] did similar studies in other countries and presented the technical assessment of wind resources and energy density using the Weibull distribution function to do the estimation. Additionally, A. Dabbaghiyan et al. [34] and A. Allouhi et al. [35] evaluated the wind energy potential for different sites at various heights in Iran and Morocco using Weibull distribution to assess the wind power density. In the Bushehr province of Iran, the average wind power density was approximately 265 W/m2 at the height of 40 m. In Morocco, the results showed the most suitable location for harnessing the wind power among six coastal locations.
The literature review shows the potential of solar and wind resources based on the data of the Renewable Resource Monitoring and Mapping (RRMM) program, which KACARE provided, and other data of local sites in the KSA. The primary observation by the authors also shows that most of the existing research work focuses on the evaluation of renewable energy resources and feasibility of small-scale RE generation in KSA, specifically the solar PV. One very important missing aspect is to investigate the potential of a large-scale grid-connected PV/Wind hybrid system considering real grid prices. As per the authors’ knowledge, none of the existing work explored the technical and economic aspects of a large-scale grid-connected hybrid system for the KSA’s climate conditions.
In the present study, a resource assessment and techno-economic analyzes of grid-connected solar/wind hybrid systems for different cities was carried out. In order to develop a hybrid grid-connected system model to analyze the power production and identify the best economic configuration, the National Renewable Energy Laboratory’s (NERL) Hybrid Optimization of Multiple Electric Renewables (HOMER) was used. This software is considered the best and simplest tool to evaluate RES among other different renewable energy software [36]. For the selected locations, the load applied was a hypothetical community load with a maximum daily consumption of 15 MWh/day. The peak of this load is expected to occur during August due to the high temperatures with 2.395 MW, as illustrated in Figure 11. The analyses of the grid-connected hybrid systems were performed by simulating each system’s operation for 25 years—that is, the project lifetime. Capital costs, equipment replacement cost, operation and maintenance expenses, grid prices, and project lifetime are important data required by the simulation.
For the simulation of the grid-connected hybrid system, location and wind/solar resources were the considered key variables that were examined in order to determine which city had the best and optimal hybrid energy system based on costs, energy production, energy purchased and sold, and lowest CO2 emissions. For accurate results, ground reflectance, ambient temperature, wind site altitude, and hub height were included in the computations.

2. Resource Analysis

2.1. Solar Data

The analysis presented in this paper was carried out using the KACARE’s RRMM. To get an overview of the solar energy potential at the four selected cities in Table 1, the monthly average values of the GHI, DNI, and DHI were analysed for all 12 months of 2015. This analysis aims to explore the availability of solar resources based on the data available from different sites. For this purpose, we downloaded the solar data for Hafar Albatin, Riyadh, Sharurah, and Yanbu from the Renewable Resource Atlas. Figure 3 provides an overview of the stations installed across the country and were classified into the Tier 1 Research station, Tier 2 Mid-range stations, and Tier 3 Simple Stations. Sulaiman et al. [38] and Erica et al. [20] explained more about these types and the major equipment used for the Saudi solar resource network.
The DNI data are an important factor for Concentrating Solar Power (CSP) technologies. Figure 4 compares the measured values of the DNI for the four selected stations during 2015. This represents the average monthly data. The main selected cities were Hafar Albatin (Northeast region), Riyadh (middle of the country), Sharurah (South), and Yanbu (West coast). The maximum DNI occurred between June and July with approximately 7887 Wh/m2 as the maximum for Yanbu, 6937.7 Wh/m2 for Haver Albatin, and 6293 Wh/m2 for Riyadh. The minimum DNI for Hafar Albatin and Riyadh was during April with less than 3500 Wh/m2 and 4783.8 Wh/m2 for Yanbu during August. It can be seen from the DNI line graph that when the longitude has the same or a similar value, DNI will follow the uniform pattern as shown for Hafar Albatin and Riyadh-KSU. The DHI is the scattered solar radiation, and it does not include the DNI since it is available from the entire sky. In Figure 4, the Hafear Albatin and Riyadh stations recorded the highest amount of DHI radiation in the first quarter of 2015, while Sharurah had the maximum DHI during July, and Yanbu during August.
GHI is the input data used in HOMER software since it is an important factor to photovoltaic installations and it includes the DNI and DHI. In this part, we compared the GHI of the selected places using the data of the same year from January to December. The solar radiation started gradually increasing from the first quarter of the year and reached the maximum in June and July. Thereafter, it decreased from August until the minimum values occurred during December. We observed a uniform pattern for the GHI data from the line graph in Figure 4 with maximum values of 7400 to 8160 Wh/m2 during the summer season and the minimally recorded values during winter were in between 3239 and 5088 Wh/m2 for the sites.
In this study, we took different locations with different topographies into consideration to test and compare the performance of the solar monitoring stations in each city. We observed the minimum annual average daily total DNI at Hafar Albatin and the maximum at Sharurah as it can be seen in Figure 5. For the DHI, we recorded the maximum annual average daily total in Riyadh by 2614.04 Wh/m2. The maximum average daily total of GHI solar radiation was in Sharurah by 6681.62 Wh/m2, and the minimum was in Hafar Albatin with 5744.84 Wh/m2.

2.2. Wind Data

This part provides a brief description of the four locations considered in this study. The meteorological data were collected beginning in 2014 by the KACARE wind resource monitoring stations across the country. The measured parameters included temperature, relative humidity, pressure, wind speed, wind direction, and many other parameters at 40 m, 60 m, 80 m, 98 m, and 100 m above the ground surface. The measurements of the average monthly wind speed were made at 40 m, 60 m, 80 m, 98 m, and 100 m for each site, and the average wind directions were made at 37 m, 80 m, and 98 m. For this study, the details of the selected sites are summarized in Table 2. At all of these locations, the meteorological measurements were made at different heights. The data used in this analysis covers 12 months of measurements stretching from January to December 2015. The reason for choosing only one year is because we found some data missing for some of the months in 2014 and 2016. Figure 3 shows the map of Saudi Arabia. The figure shows the locations of the measurement sites presented in Table 2 and the current locations of the other wind sites in the country.
One of the most important factors about wind farm projects is the wind direction. To achieve the optimum design of a wind power plant, the prevailing wind direction of the selected locations must be assessed. In this paper, we applied the KACARE wind rose simulation for the locations under consideration to provide the diagrams at a height of 80 m above the ground. Each wind rose chart has 16 cardinal directions, as shown in Figure 6. These charts show the frequency and speed of the wind as it blows from each direction. Designers can make their decisions for a particular site by analyzing the rose plots. We can observe from these plots that the most prevailing wind direction for Sharurah and Riyadh was from the East-Northeast for about 21% of the time and from the Northeast for 13% of the time, respectively. The Hafar Albatin site recorded that the most wind direction was from the North for about 16% of the time, and 39% was from the North-Northwest direction for Yanbu, as seen in Figure 6. Hence, wind turbines can be installed upon these directions. Generally, modern wind energy conversion systems have different cut-in speeds that depends on the size of the installed wind turbine.
It is fundamental to analyze the wind energy regime before implementing any wind energy project since the cost of wind energy production is heavily dependent on the wind resources at these sites [39]. Speed critically influences the wind resources at a certain site. Accordingly, the average wind speed is important in assessing the wind energy potential at any site [40]. To describe the wind speed distribution, the literature shows several density functions that can be used. The Weibull and the Rayleigh functions are the two most common distributions. In this study, we used the Weibull distribution to do the wind distribution analysis for the selected sites. This type is characterized by two parameters, one is the scale parameter c (m/s), and the other is the shape parameter k (dimensionless). There are several methods for calculating these two parameters of the Weibull distribution for wind speed analysis [41,42]. We used the power density method (PDM) in this study to estimate the scale and shape parameters; it relates to the averaged data of wind speed. We then compared the results to the actual data, and we calculated the coefficient of determination (R2) in order to examine how well the distribution functions, and it fits the data set. Table 3 shows that R2 was 97% and above for all Weibull distributions. These results illustrate that the fitted functions describe the observed values of wind speed reasonably well.
Figure 7 and Figure 8 show the Weibull distribution, and Cumulative Distribution Function (CDF) at 80 m height for the selected sites. From these two graphs, we observed that the wind speed remained above 10 m/s for about 41% of the time at Yanbu, followed by 10 m/s for 27% at Hafar Albatin, 22% at Sharurah, and 14% at Riyadh. This also shows that the best location among these cities for wind energy production is Yanbu due to the high wind speed, as seen in Figure 7 and Figure 9. The results also indicate that Yanbu city has a better potential for using wind energy than the other three locations in the provinces examined. In Table 3, we found the annual mean wind power density (per unit area P/A) for the selected locations to be about 833.78 W/m2 at Yanbu, 426.20 W/m2 at Sharurah, 292.02 W/m2 at Riyadh, and 519.27 W/m2 at Hafar Albatin for winds at a height of 80 m.

3. Design and System Specifications
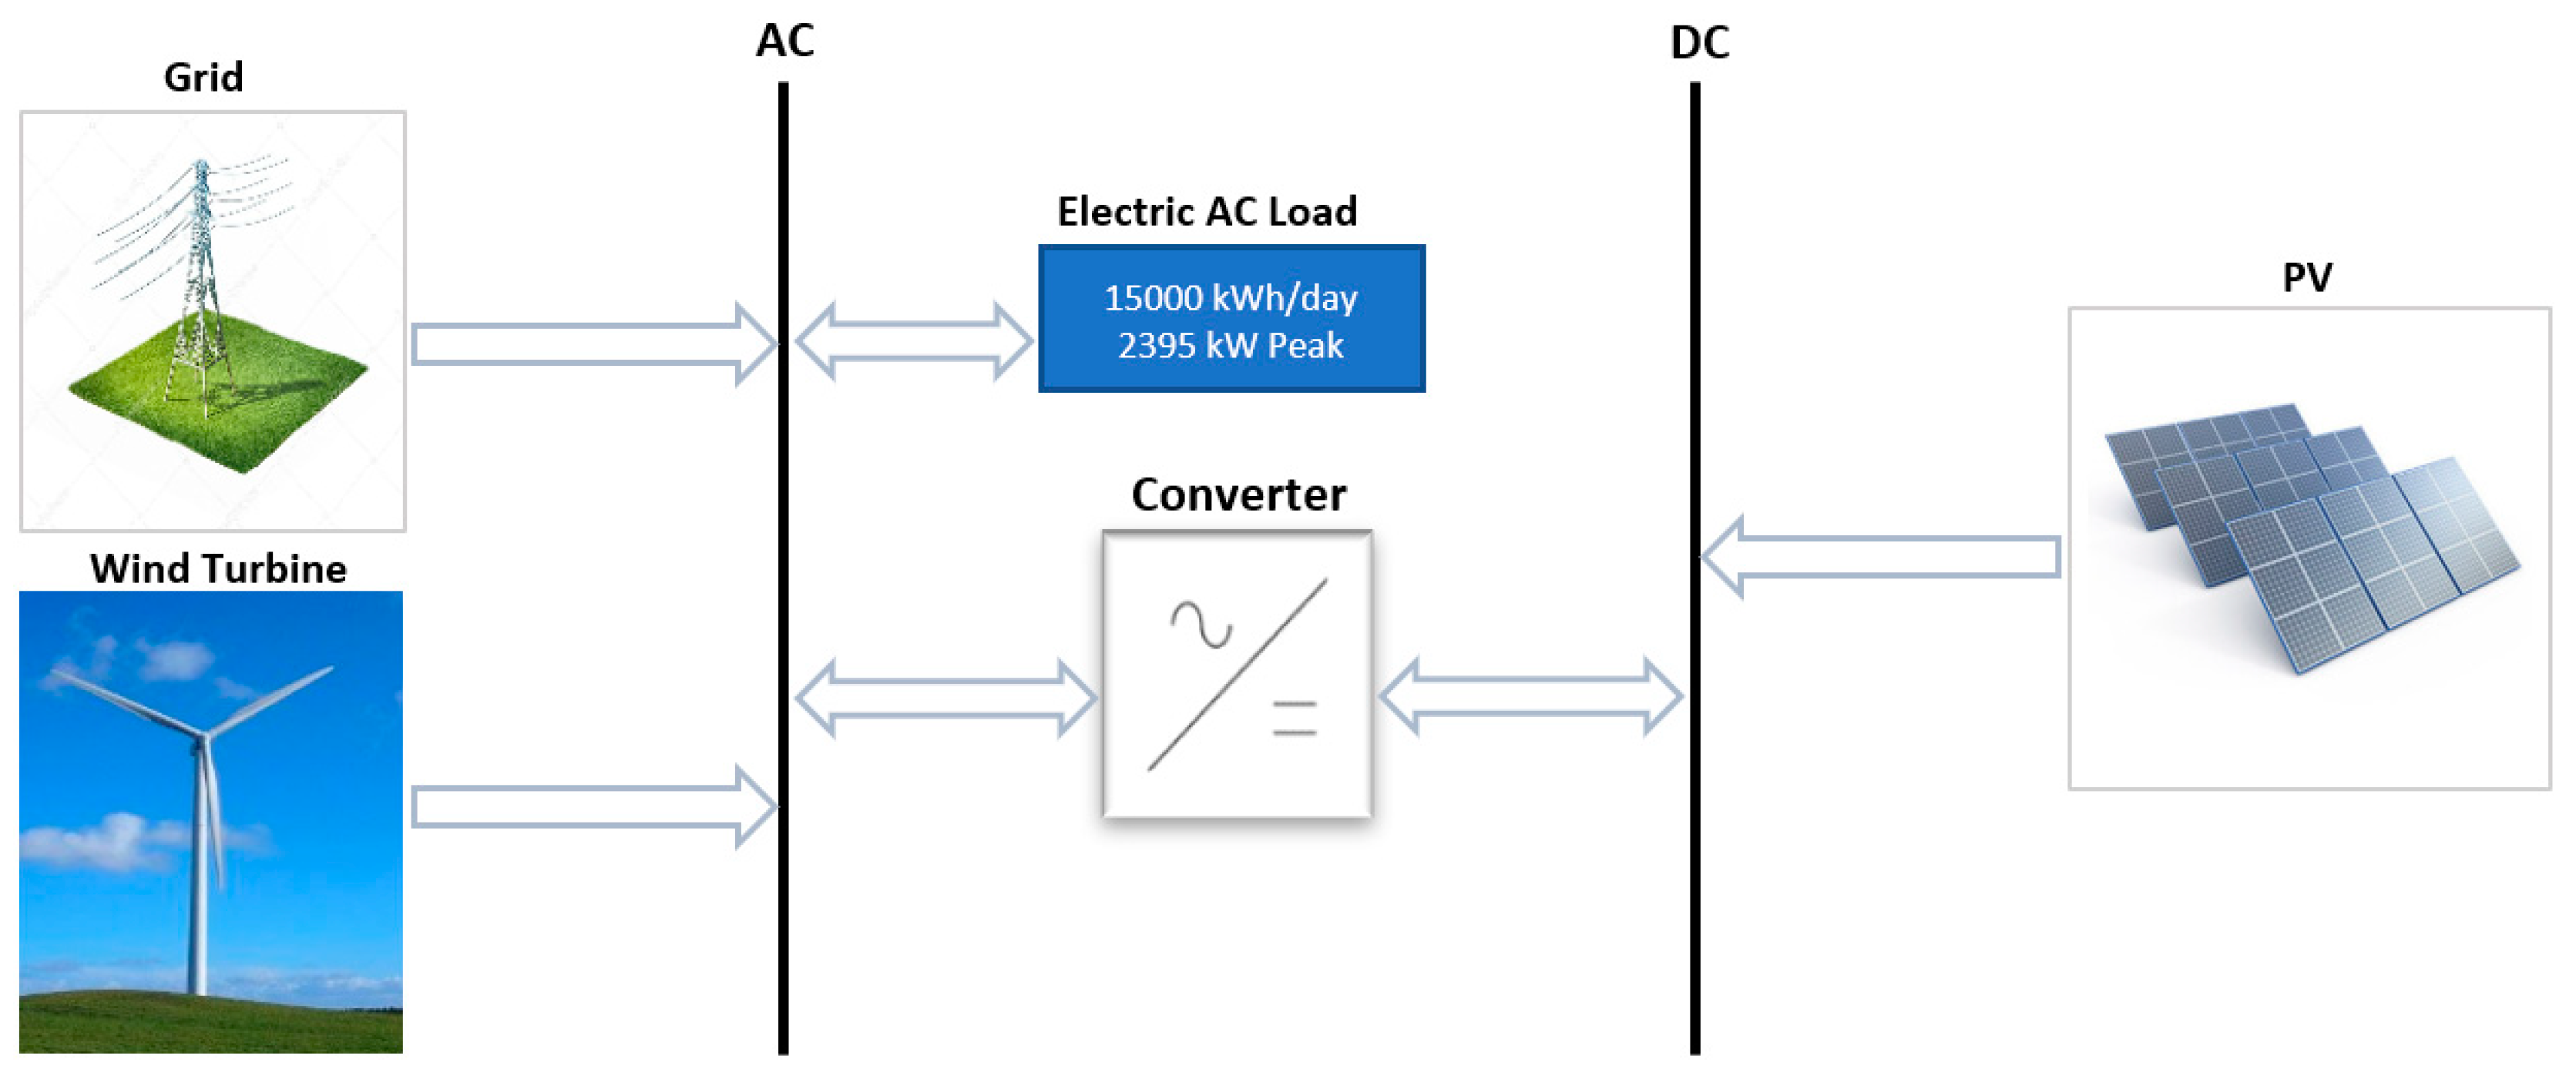
3.1. Model Design

The hypothetical load considered in this study is a 15 MWh/day community load. This load is the AC primary electric load that the designed system must meet in order to avoid the unmet load. Beside the load, the system consists of four other components: The grid system, DC to AC converter, solar PV array, and 1 MW wind turbine as presented in Figure 10. An inverter is required by the grid-connected system to adapt the direct current DC produced by the PV array and feed it to the AC busbar where the load connected. Since this design has no backup system, the utility grid will serve as a reliable supplier to the load due to the electric intermittence caused by the renewable energy sources.
Figure 11 shows the profile of the monthly average load with a peak demand beginning in May through August and declining from September to the end of the year. This increase is mainly due to the high temperatures during the summer, which cause the significant usage of air conditioning in KSA. The average scaled power consumed per day is 15 MWh/day with a peak of 2.395 MW occurring in August.

3.2. System Components

3.2.1. Electric Grid

The utility grid is the most reliable system that can be used, whereas the solar PV/wind system depends on the renewable energy resources only. However, if the produced power by the solar PV/wind exceeds the load requirements, the excess electricity is sold in a certain tariff to the grid. Several researches have proven that the LCOE is reduced when the excess energy is used in this way [43]. The Renewable Energy Feed in Tariff (REFIT) is an agreement to accelerate the investment in renewable energy technology. In KSA, A.M. Ramli et al. [44] conducted a study on the analysis of renewable energy feed-in tariffs and concluded that applying fixed REFIT helps to enhance sustainability by eliminating the inflation effect in such a region. In 2017, SEC changed the residential and commercial rate of electricity to new prices. The two consumption categories of the residential loads are 1–6000 kWh and more than 6000 kWh, which have the rate charge of 0.048 $/kWh and 0.080 $/kWh, respectively. Accordingly, the new rates utilized to schedule fixed prices at different times during the day and month, as shown in Figure 12. This figure shows the grid schedule rate for the whole day and each row represents the hours of the day starting at 00.00. The rate includes peak, shoulder, and off-peak times, whereas the sellback electric charges are 0.070 $/kWh, 0.040 $/kWh, and 0.038 $/kWh, as shown in Figure 13.

3.2.2. PV Modules and Wind Turbine

In this study, the hybrid solar PV/wind is a system integrated with the grid to reduce dependence on fossil fuels as a primary source of electricity. The size of a grid-connected RES depends on the system constraints. In the present design, the solar PV/wind hybrid system should be sized to meet at least 60% of the peak load demand, and this will identify the required output power from the hybrid grid-connected system. In HOMER, the PV output power can be calculated using Equation (1)
  P P V =   Y P V f P V ( G ¯ T G ¯ T , S T C ) [ 1 + α P ( T c T c , S T C ) ]  
where Y P V is the capacity of PV array in [kW], f P V refers to the derating factor in [%], G ¯ T PV solar irradiation in [kW/m2], G ¯ T , S T C is the incident radiation at standard test conditions and it is [1 kW/m2], α P is the Temp coefficient of power in [% /°C], T c PV cell Temp in current time step [°C], and T c , S T C the cell temperature under stander test conditions [25 °C].
It can be seen from Equation (1) that several factors, including solar irradiation and the cell temperature have the influence on the generated power from the PV. Table 4 presents the PV technical and financial input data and the inverter types. These types of PV and converters have shown a good performance in KSA [36]
The wind speeds have been described in the previous sections for all selected locations. The technical and estimated financial input data of the 1 MW wind turbine are presented in Table 4. Figure 14 shows the power curve of the considered wind turbine, which has the cut-in speed of 4 m/s, and the total output power of 1 MW can be obtained at a wind speed of 12 m/s to 20 m/s. The measurement of wind speed was taken at the height of 80 m and the approximate hub of the wind turbine is 80 m above the ground at which the rotor sits [45]. By knowing the hub height wind speed, the wind turbine power can be determined from the power curve. In HOMER software, the power curve is typically used to specify the performance of any wind turbine under conditions of standard temperature and pressure (STP). The power value shown by the power curve is multiplied by the air density ratio to adjust the actual conditions, as follows
  P W T G = ( ρ ρ 0 ) .   P W T G , S T P  
where P W T G is considered the actual output power of the wind turbine in kW,   P W T G , S T P   is the power output of the wind turbine at STP in kW, ρ is the actual air density kg/m3, and ρ 0 is the air density at STP, which is 1.225 kg/m3.

3.3. Economic Model

In HOMER, there are two main economic factors used to rank different system configurations. These are the net present cost (NPC), or the life-cycle cost and the levelized cost of energy (LCOE) [46]. NPC is defined as the present value of all system costs over the project’s lifetime, minus the value of all revenues earned. Additionally, it can be calculated from Equation (2). The LCOE is the average cost in $/kWh of the actual consumed energy produced by the system and it can be calculated from Equation (3)
  C N P C = C a n n , t o t C R F ( i , R p r o j )  
where i is the annual interest rate, Cann,tot represents the system total annualized cost, R P r o j is the project lifetime in years, and the capacity recovery factor (CRF) can be calculated by
  C R F = i ( 1 + i ) N ( 1 + i ) N 1  
i is the real discount rate and N refers to the number of years
  L C O E = C a n n , t o t R p r i m + R t o t , g r i d , s a l e s  
where R p r i m is the AC primary load in kWh/year and R t o t , g r i d , s a l e s   is the total grid sales in kWh/year.
An alternative economic performance measure could be investigated by decision makers along with the NPC and the cost of energy. The Return on Investment (ROI) is the yearly cost savings relative to the initial or reference system. In HOMER software, the ROI can be calculated using Equation (4)
  R O I = i = 0 R p r o j C i , r e f   C i R p r o j ( C c a p     C c a p , r e f )  
where C i , r e f is the nominal annual cash flow for the base (reference) system; C i is the nominal annual cash flow for current system; R p r o j is the project lifetime in years; C c a p is the capital cost of the current system, and C c a p , r e f is the capital cost of the base (reference) system, which is the grid.

4. Simulation Results and Discussion

Performance of the grid-connected solar PV/wind hybrid system in the selected cities is discussed in this section. Technical and economic details along with electricity production for four different cases are compared and then the saved CO2 emissions for the defined cases are considered.

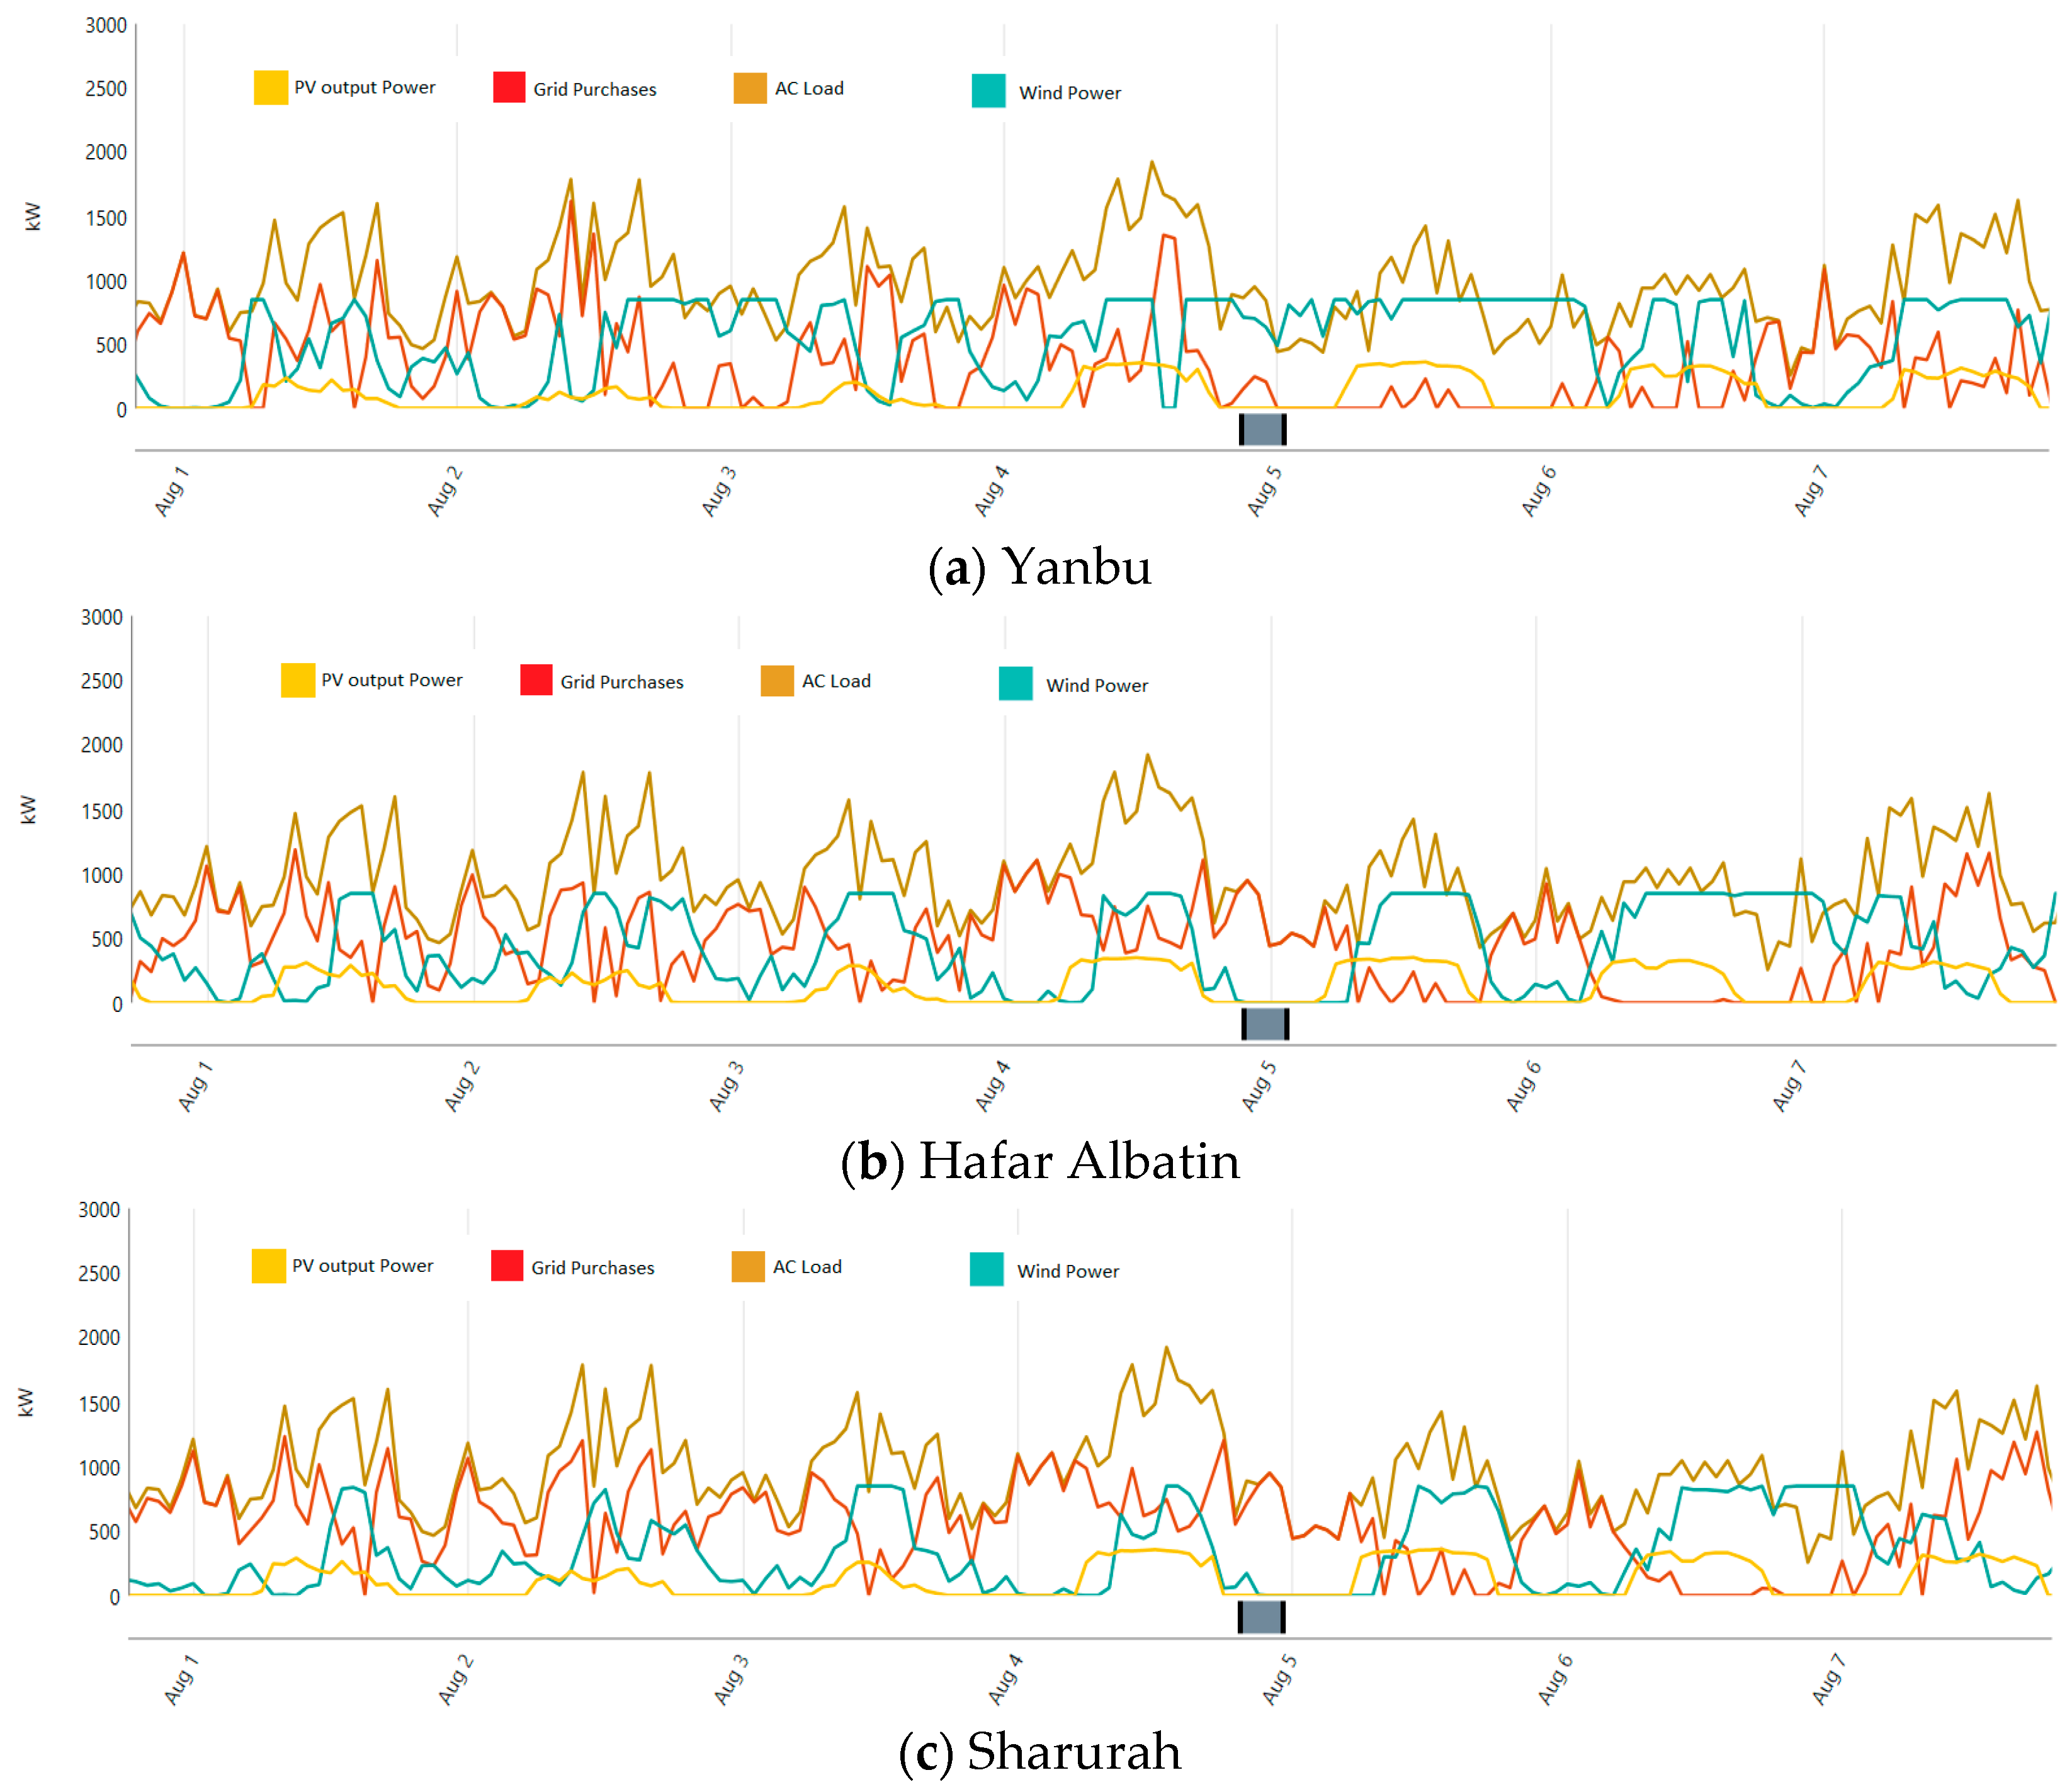
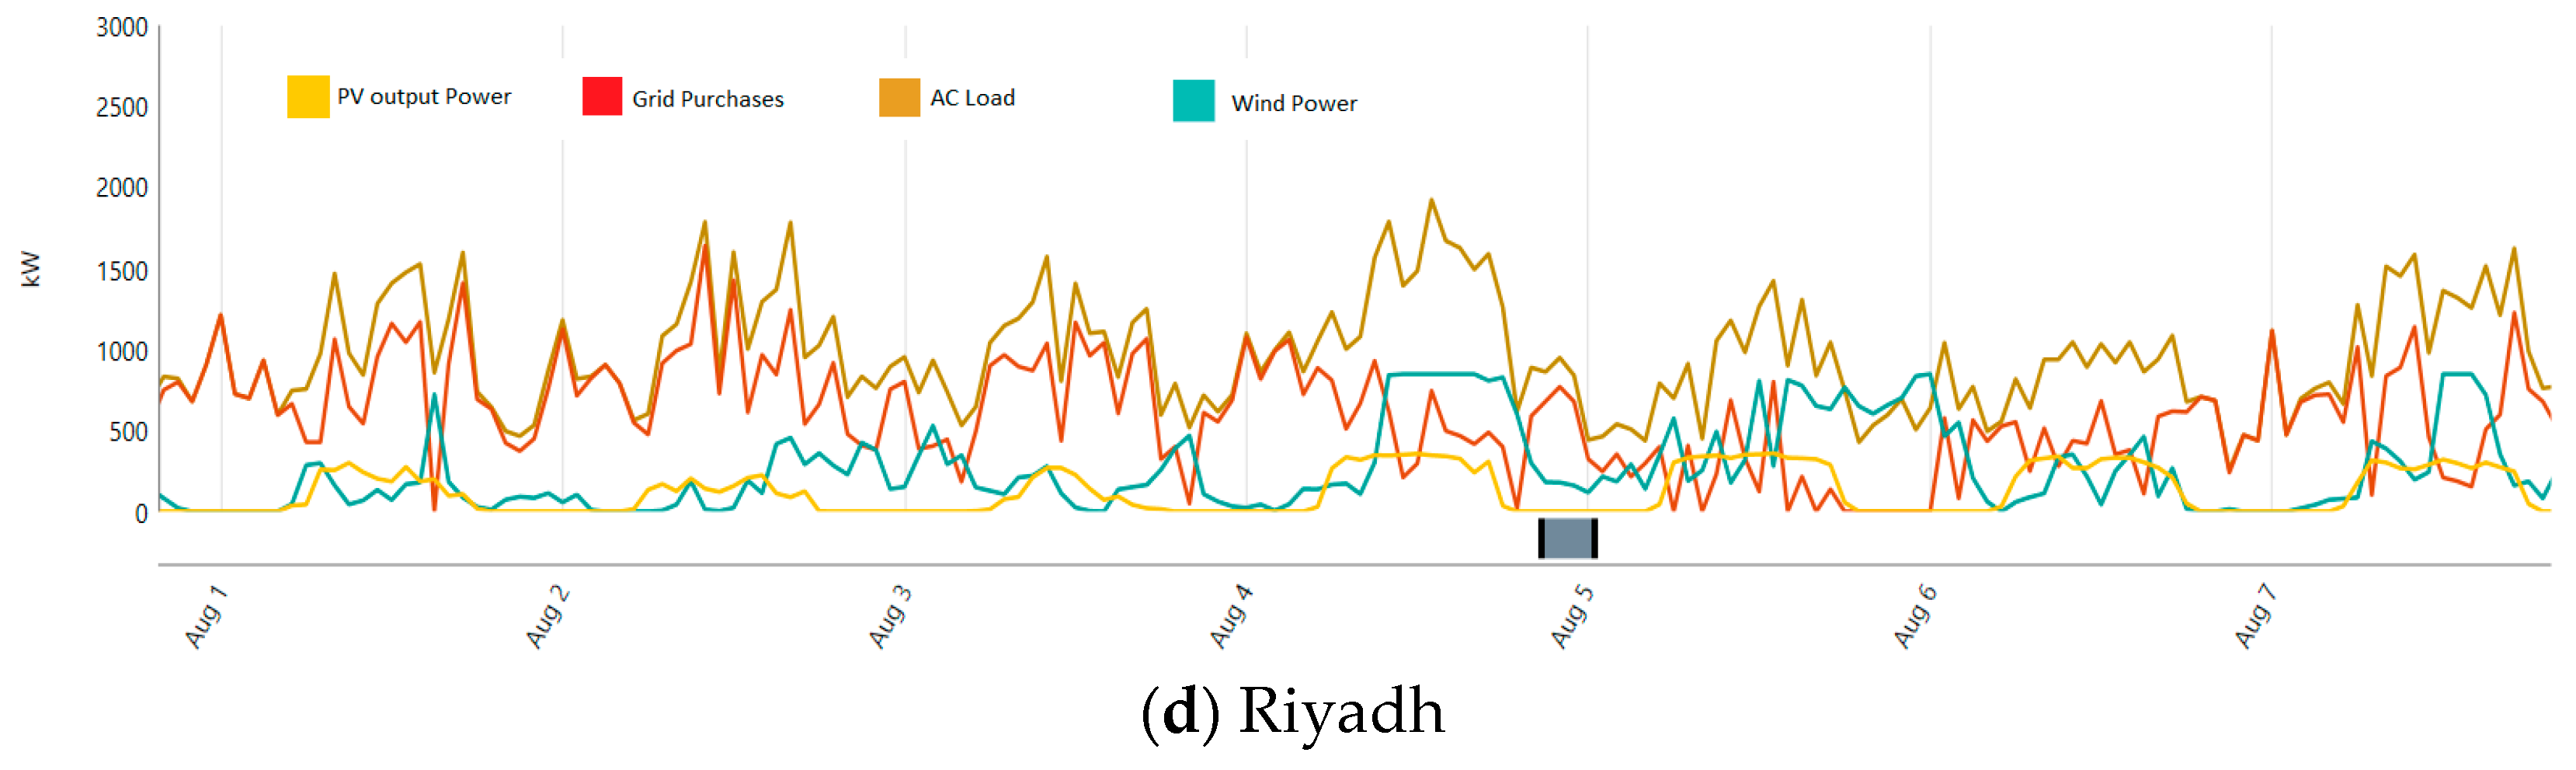
4.1. System Electricity Production

Figure 15 illustrates the total annual electricity production from the grid, wind turbine, and solar PV systems in kWh/yr. The effect of renewable energy penetration on the consumption from the grid can be seen from the graph. At Yanbu city, the annual electricity production from the RE system represents almost 70% out of the total due to the high output power, specifically from the wind turbine, which represents 53%. This reduces the annual energy purchased from the grid to 1,978,631 kWh/yr, which represents only 30% out of the total annually consumed power. The wind energy production in Yanbu city was compared to a study presented by S.M. Shaahid et al. [31] and the capacity factor of the wind turbine were higher in this study due to the different size and hub height of the wind turbine. The yearly total renewable power output at Hafar Albatin is 3993.2 MWh/yr versus 2418.7 MWh/yr from the grid. At this city, wind energy production represents 62%, whereas the solar PV is around 17%, and the remaining power produced by the grid. Sharurah city has the highest solar irradiation among others. 19% of the annual electricity production comes from the PV system. However, the wind energy and electricity purchased have almost the same amount of consumption, as illustrated in Figure 15. Riyadh city has recorded the highest electricity purchased from the grid due to the low renewable output power.
Figure 16 shows the time series analysis of the first week of August in all cities. As it can be seen from these graphs, all systems have the same load shape and different output power. As the output power produced by the hybrid system increases, the consumed power from the grid declines instantaneously. Additionally, the sum of the renewable output power and the grid power is equivalent to the total electrical load served, which indicates that the designed grid-connected system has met the electric load requirements with zero unmet power demand.
In KSA, the main source of electricity is fossil fuel-based power plants. As a consequence, the vast majority of CO2 emissions are from the power sector. Figure 17 shows the amount of CO2 emissions in kg/yr that can be saved if the renewable hybrid system is connected to the grid. The annual CO2 emission produced by the grid system only (with no hybrid system) is 3,460,200 kg/yr, which means that the hybrid grid-connected system has contributed significantly to lower CO2 emissions. As can be seen from the graph, the system performance at Yanbu city can reduce the CO2 emissions by almost 63%, which equals to 2,209,705 kg/yr followed by Hafar Albatin, Sharurah, and Riyadh, respectively.
One of the most important indicators of renewable energy system productivity is the capacity factor. Additionally, it is considered the most effective parameter in analyzing renewable energy system performance due to the direct effect on the cost of generated power. It is defined as the ratio of the real energy output to the theoretical full energy output over a specific period of time [34]. The annual capacity factor and the annual energy output power of wind and solar are evaluated in Figure 16 and Figure 17 using HOMER software. For both solar and wind, several parameters were considered including the temperature, derating factor, tracking system, wake, turbine hub height, and about 15% generation losses of wind turbine in order to evaluate the production. Figure 18 summarizes the annual capacity factors for the four considered systems. The results clearly show that the annual capacity factor is significantly affected by the availability of renewable energy resources. As indicated in the figure, Yanbu city has the highest capacity factor for wind energy and Riyadh city has the lowest potential for installing wind turbines. On the other hand, there is no significant difference between the PV system capacity factors in all selected cities.

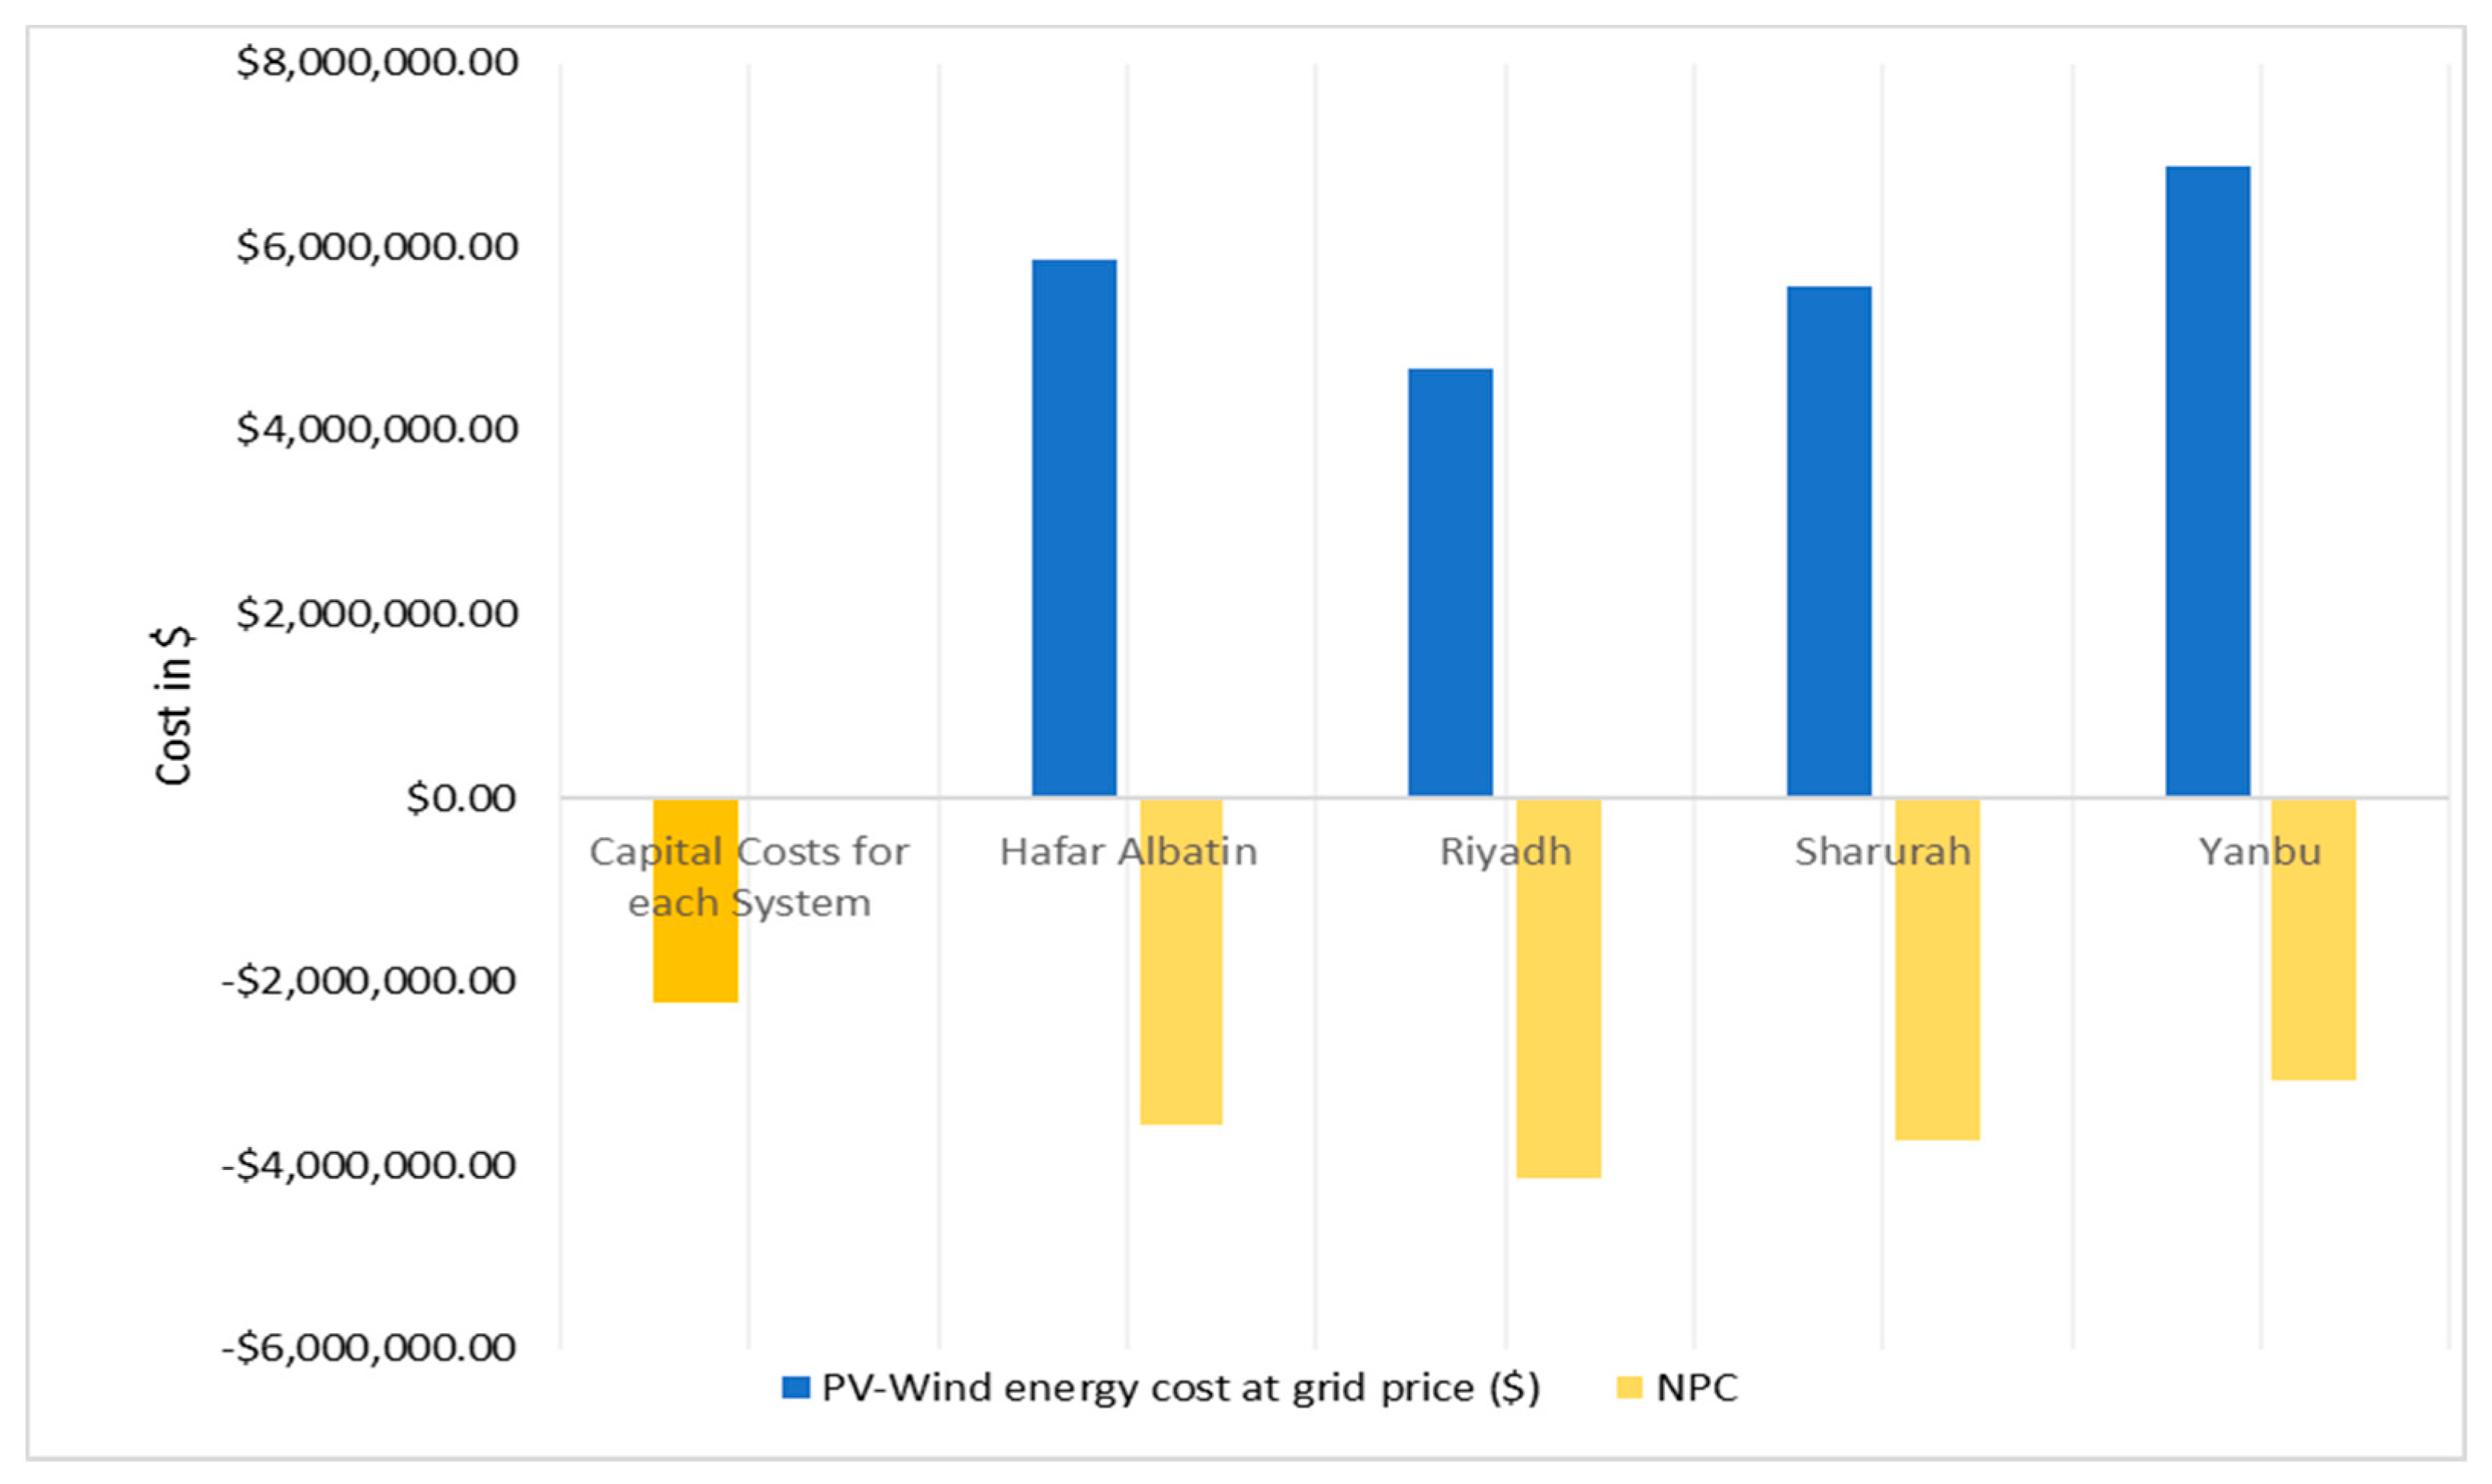
4.2. Economic Analysis

In HOMER, a discounted cash flow (DCF) is the nominal cash flow discounted to year zero. In this study, the considered real discount rate for each system is 6%. Figure 19 shows a comparison of the cumulative discounted cash flow for all considered grid-connected systems throughout the projects lifetime compared with the base case. This method was used to estimate the attractiveness of an investment opportunity in such cases. A DCF was completed for all projects located at the selected cities and compared to the grid as a base case. Consequently, NPC for each system was found by summing up the yearly total discounted cash flows of the project lifetime. In Figure 19, the system at Yanbu city demonstrated the lowest NPC and LCOE of $3,080,182.00 and 0.03655 $/kWh, respectively. At Hafar Albatin city, the system NPC is $3,558,756.30 and has a LCOE of 0.04392 $/kWh. In Sharurah city, the system performed reasonably, even with a high NPC and LCOE. Based on the annual solar irradiation and the mean wind energy density, Riyadh city is not particularly suitable for the installation of large-scale hybrid grid-connected system. Additionally, the electric and economic analysis showed that using only the grid system in Riyadh city is the best economical option due to the high cost and low production, as seen in Figure 15 and Figure 20. However, Yanbu city has more appropriate renewable energy resources, specifically for utilization of wind turbine technology. The model at this city recorded the highest ROI of 7.5%, which makes it the most suitable place since it makes a profit during the project’s lifetime. Thus, it is considered as the best city for wind energy development among all the others.
It is interesting to discuss the electricity purchasing and selling for each month during the year. The monthly power flow to and from the grid for the four considered systems is depicted in Figure 21 and Figure 22. In the first four months of the year, the air temperature and the load demand are at their lowest. Consequently, all systems show the highest amount of power sold to the grid. More than 50% of the total annual sold energy to the grid for all systems occurred during this period. However, because of the high demand, in addition to the rising temperatures during most of the year, all systems become more reliant on the grid. Among all cities, the Yanbu city grid-connected system has the highest amount of energy sold to the grid and it is 1118 MWh/yr followed by Hafar Albatin, Sharurah, and Riyadh with 863.5 MWh/yr, 824.6 MWh/yr, and 504.7 MWh/yr, respectively.
Figure 23 shows a comparison between the capital cost and the cost of the energy produced by PV/Wind system in each city. These results represent the energy cost at the grid price over the considered lifetime. In HOMER Pro, the capital cost is part of the NPC. Since one model was applied at all selected locations, the capital costs are almost the same for each system. However, the costs of the produced energy over the project’s life-time are different, as illustrated in the graph. From Figure 13 the applied grid prices are 0.08 $/kWh during peak demand and 0.048 $/kWh at the shoulder and off-peak times. At Yanbu city, the total annual electricity produced by PV/Wind systems is around 4684.53/yr MWh and the cost of this annual amount based on the grid prices exceeds 6.8 million dollars over the project’s life time, as seen in Figure 23. The system capital costs at Yanbu city represent only 32% of the energy cost. The model at Hafar albatin city shows a total annual production of 3993.2 MWh/yr from the PV/Wind system. Over 25 years, the expected energy cost at the same city is almost 5.8 million dollars and the capital costs represent around 38% of this value. Sharurah and Riyadh show the lowest energy production with 3774.6 MWh/yr and 3157.5 MWh/yr, respectively.

5. Conclusions

This paper presents an overview of the current status of Saudi Arabia’s power generation and a possible increase in the demand for electricity over the next 15 years. Additionally, an investigation of solar and wind energy resources along with technical and economic analysis of a grid-connected hybrid system for four selected locations are presented. Based on real data provided by KSA’s renewable resources atlas, the HOMER-Pro optimization tool developed by NREL is utilized to select the best system performance. The following are the key findings of this study:
-
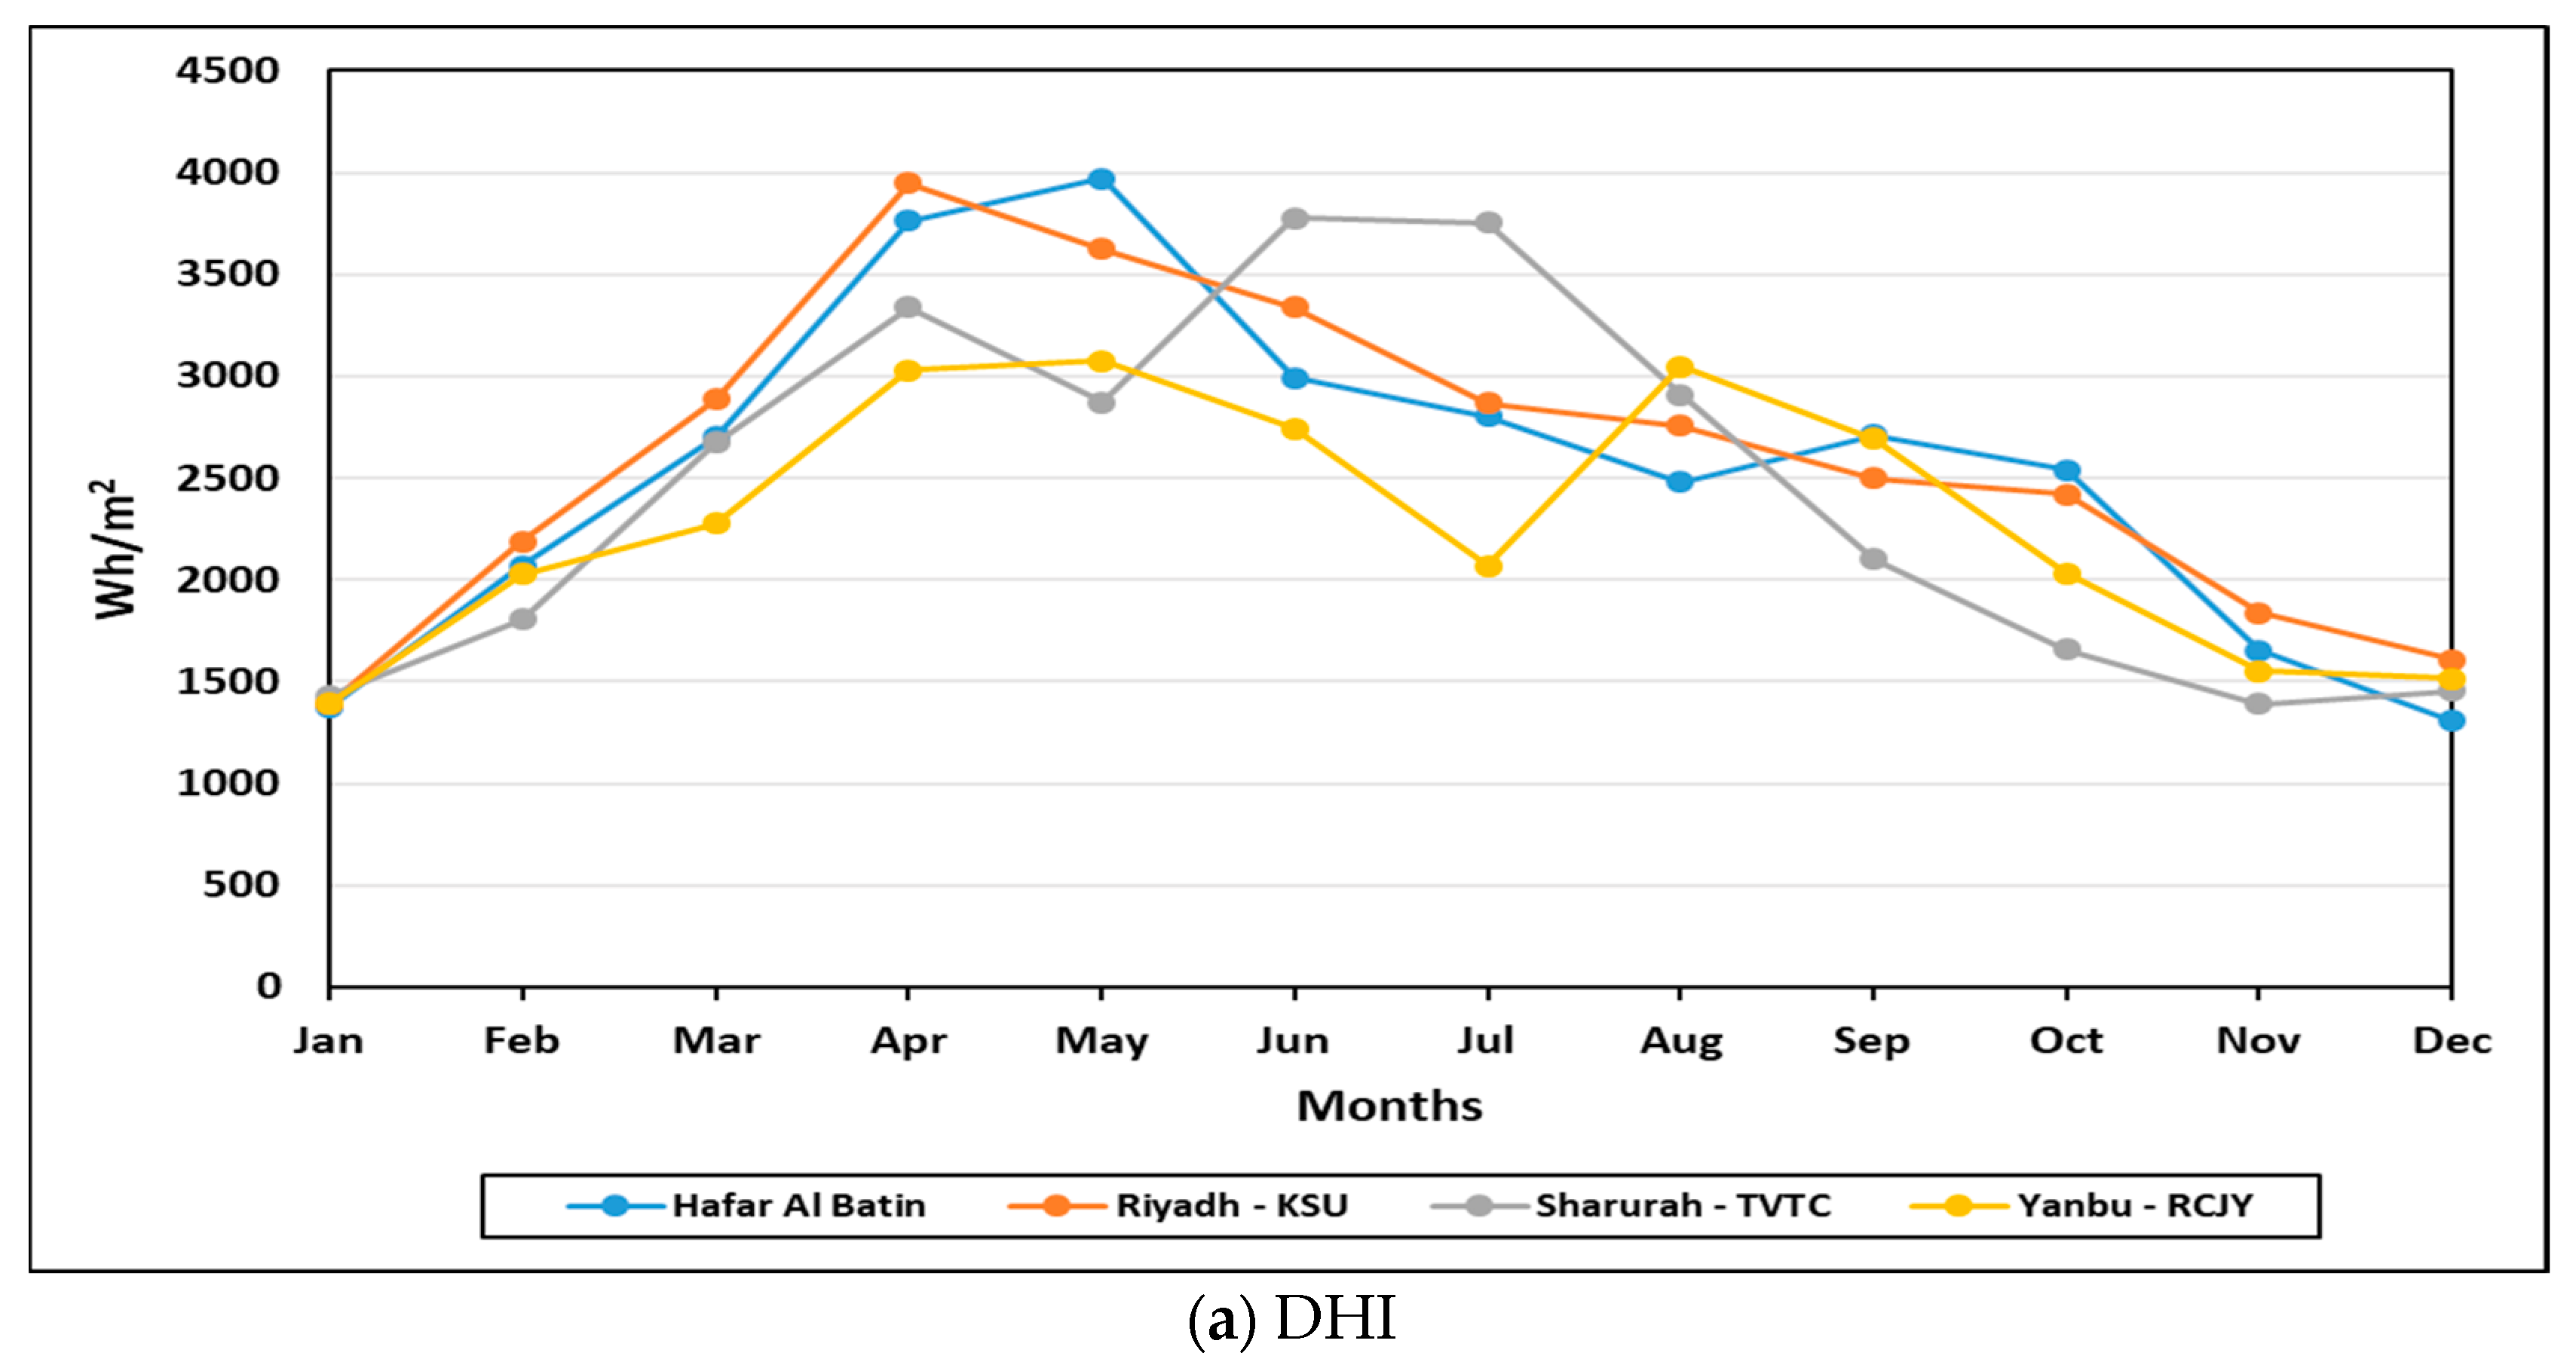
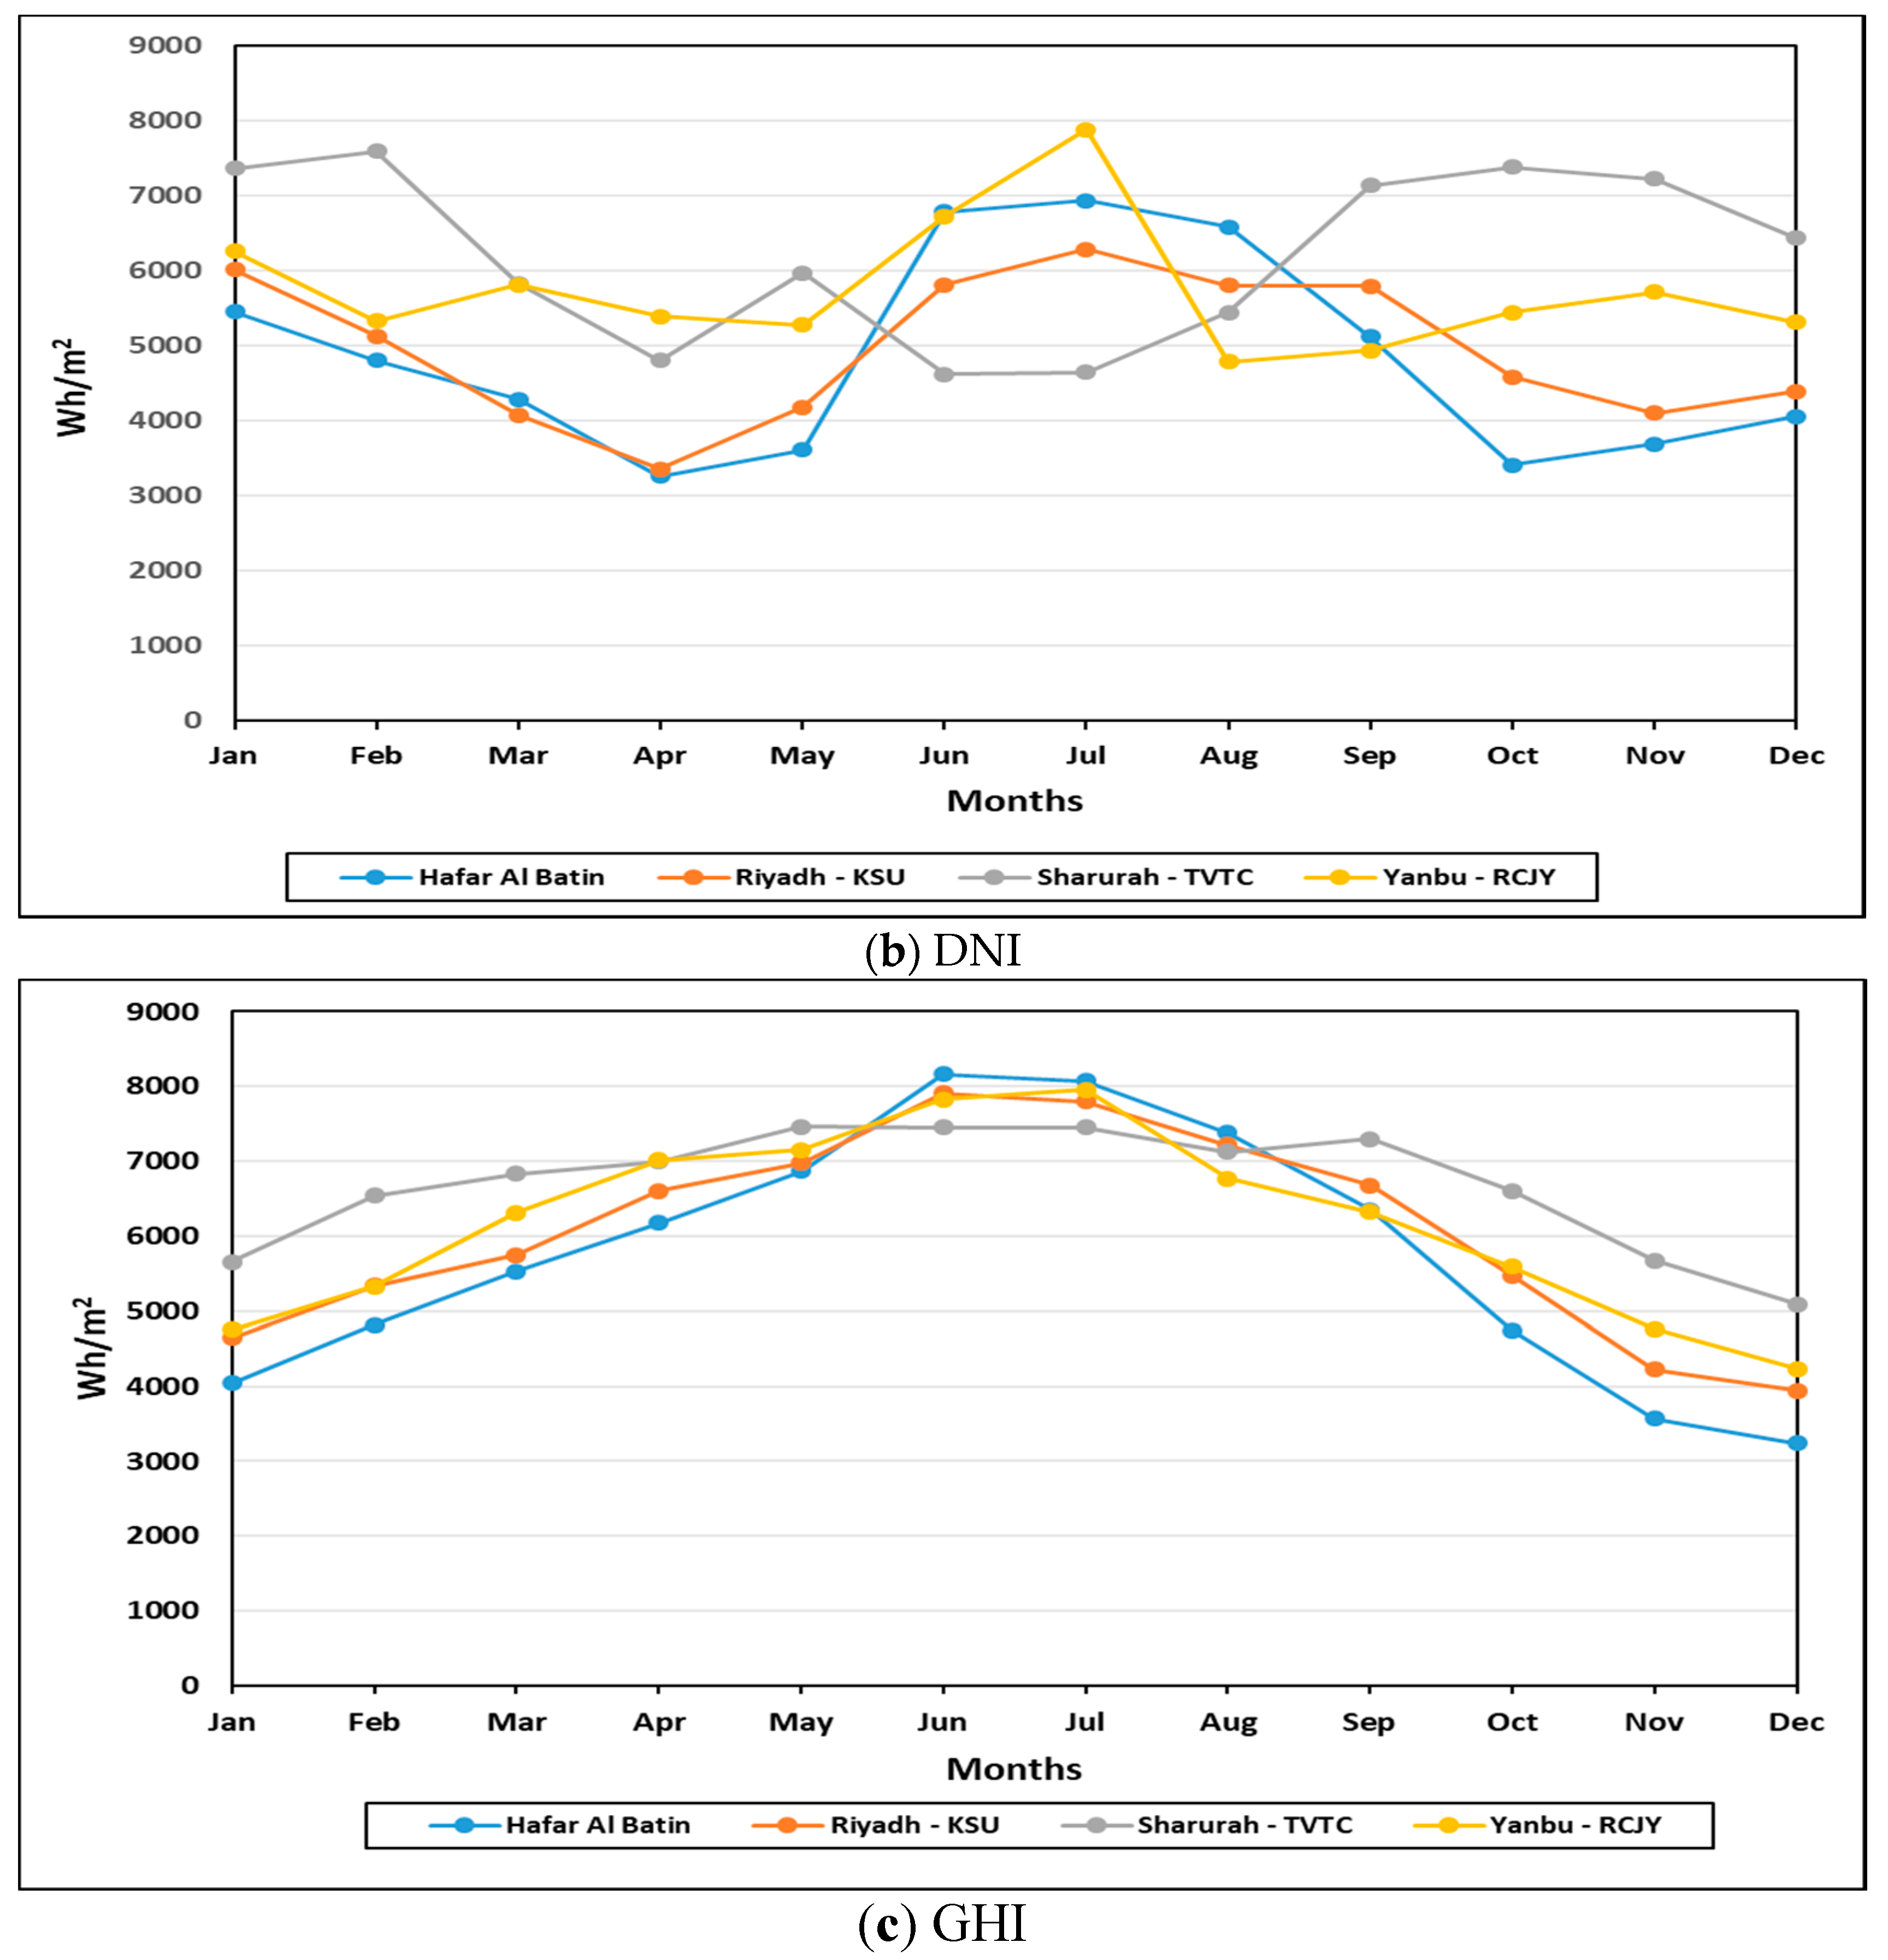
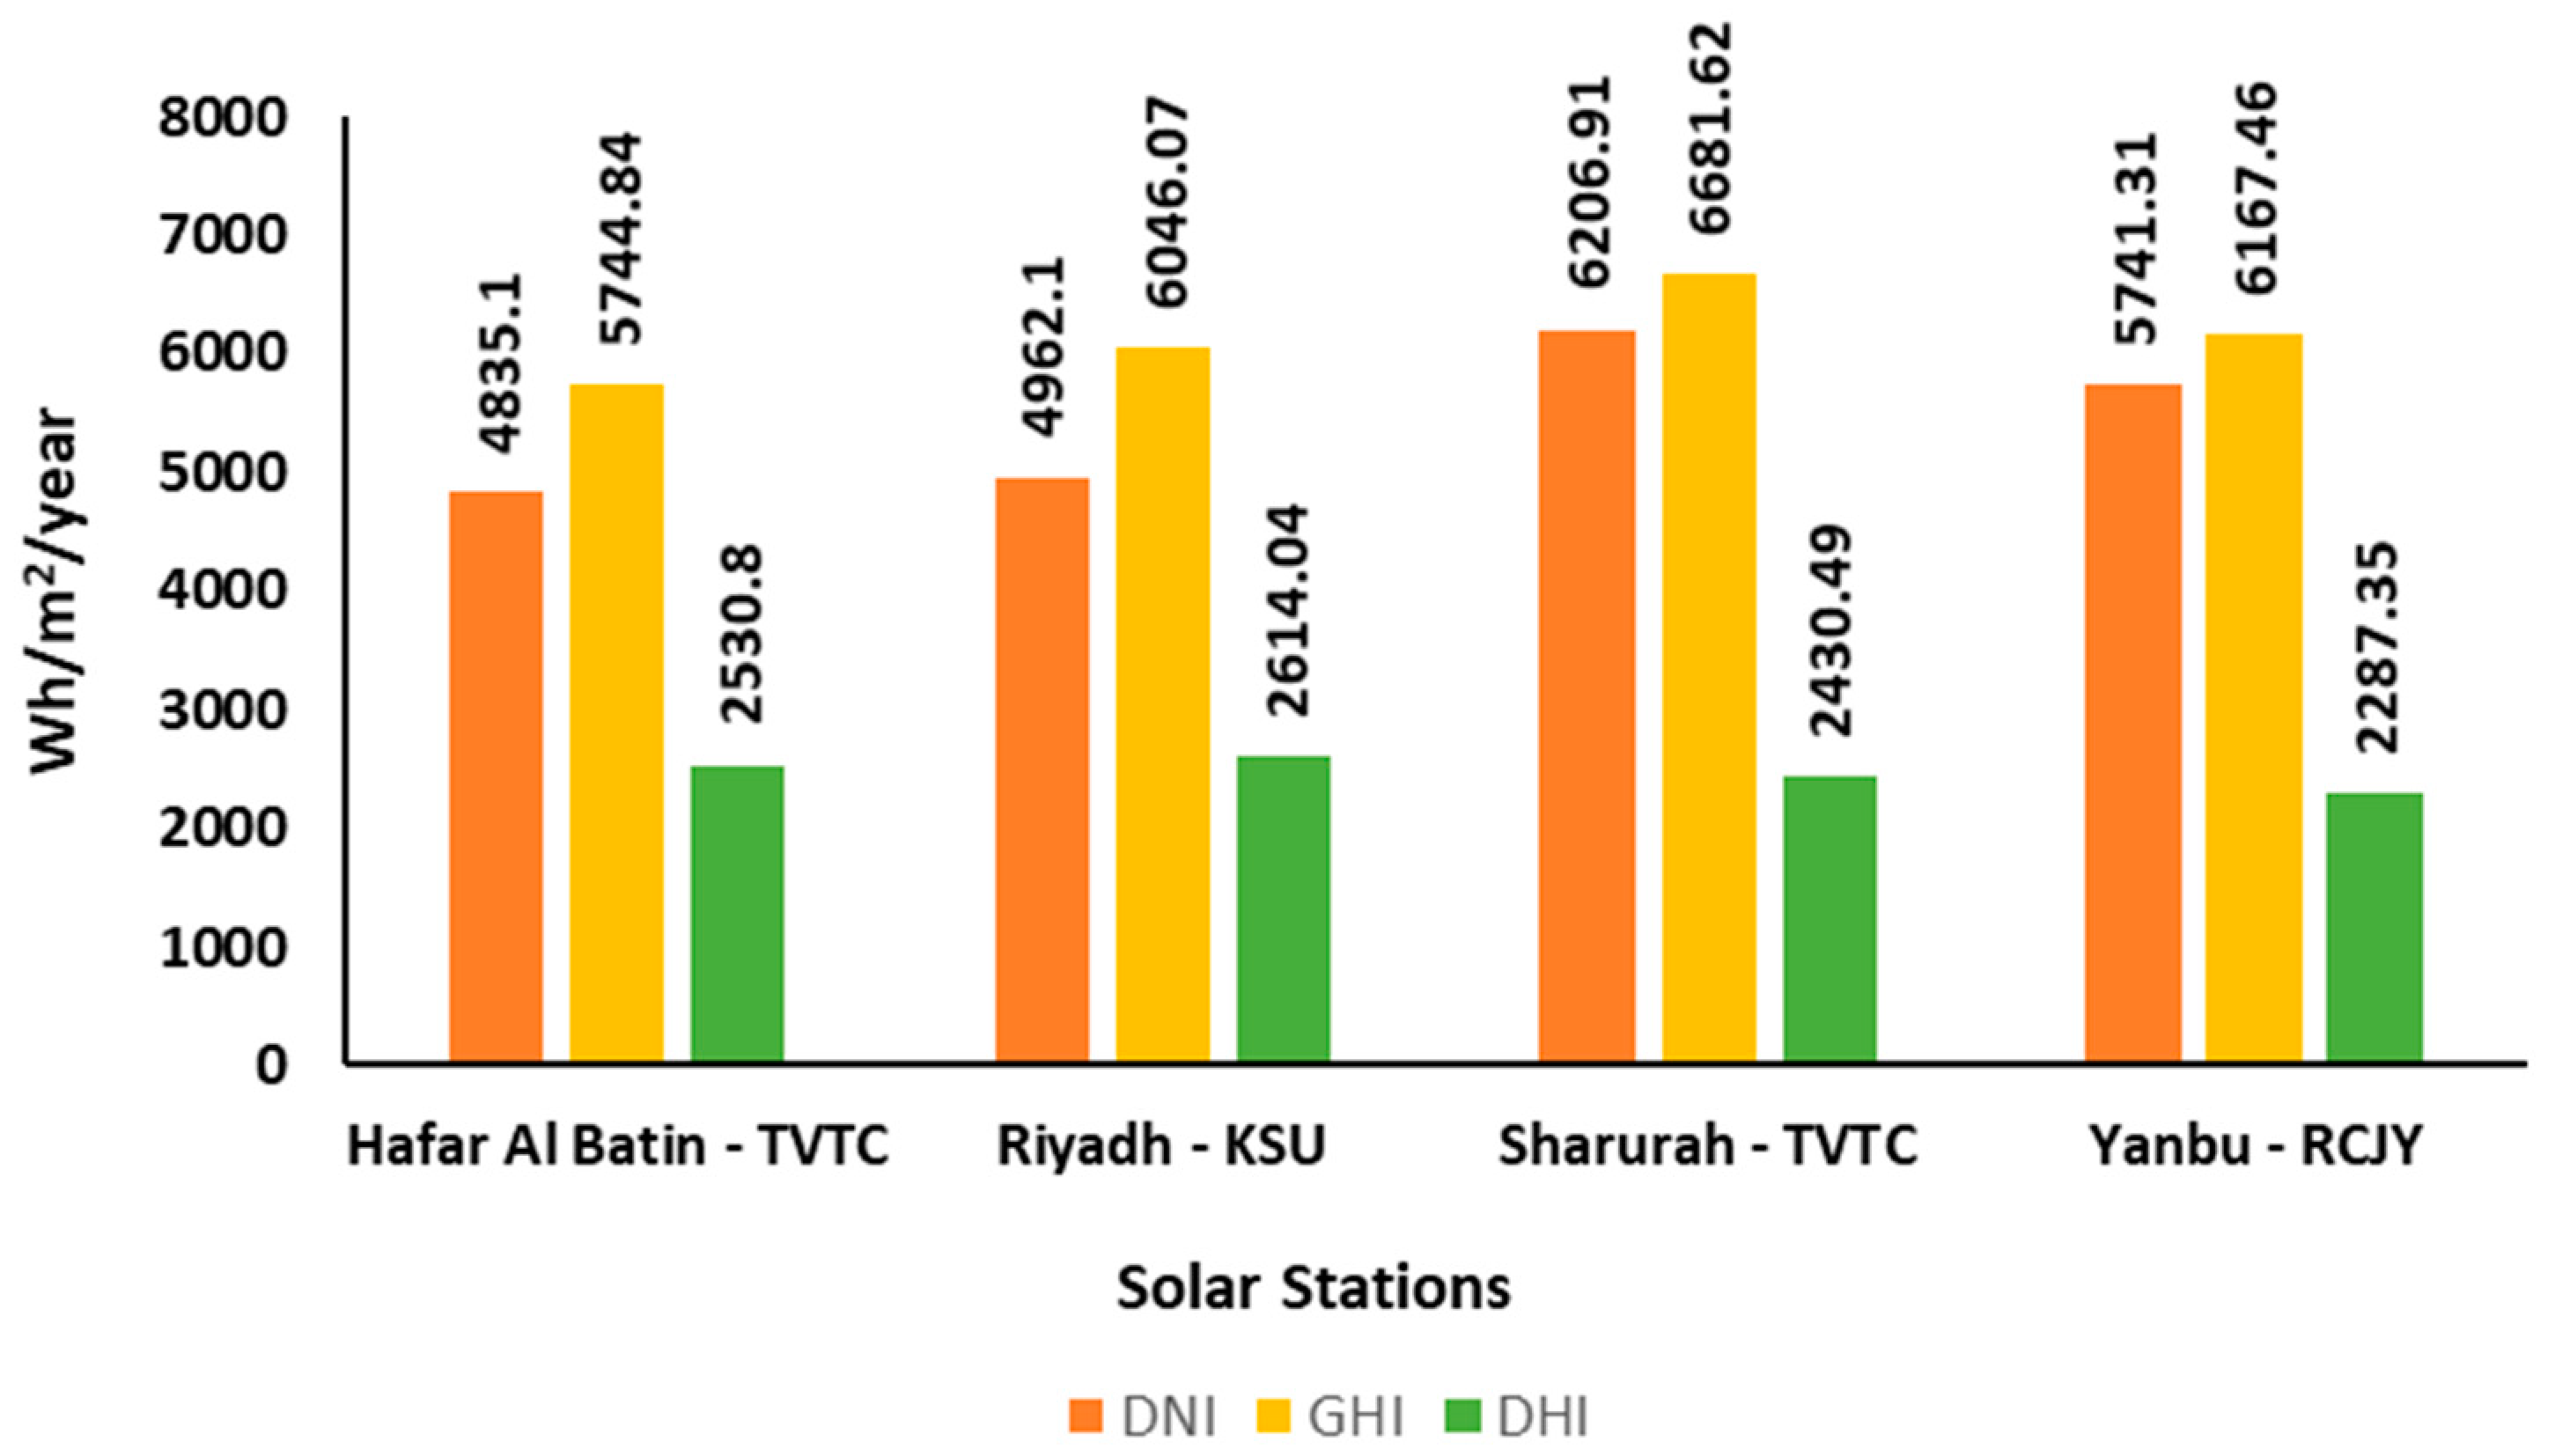
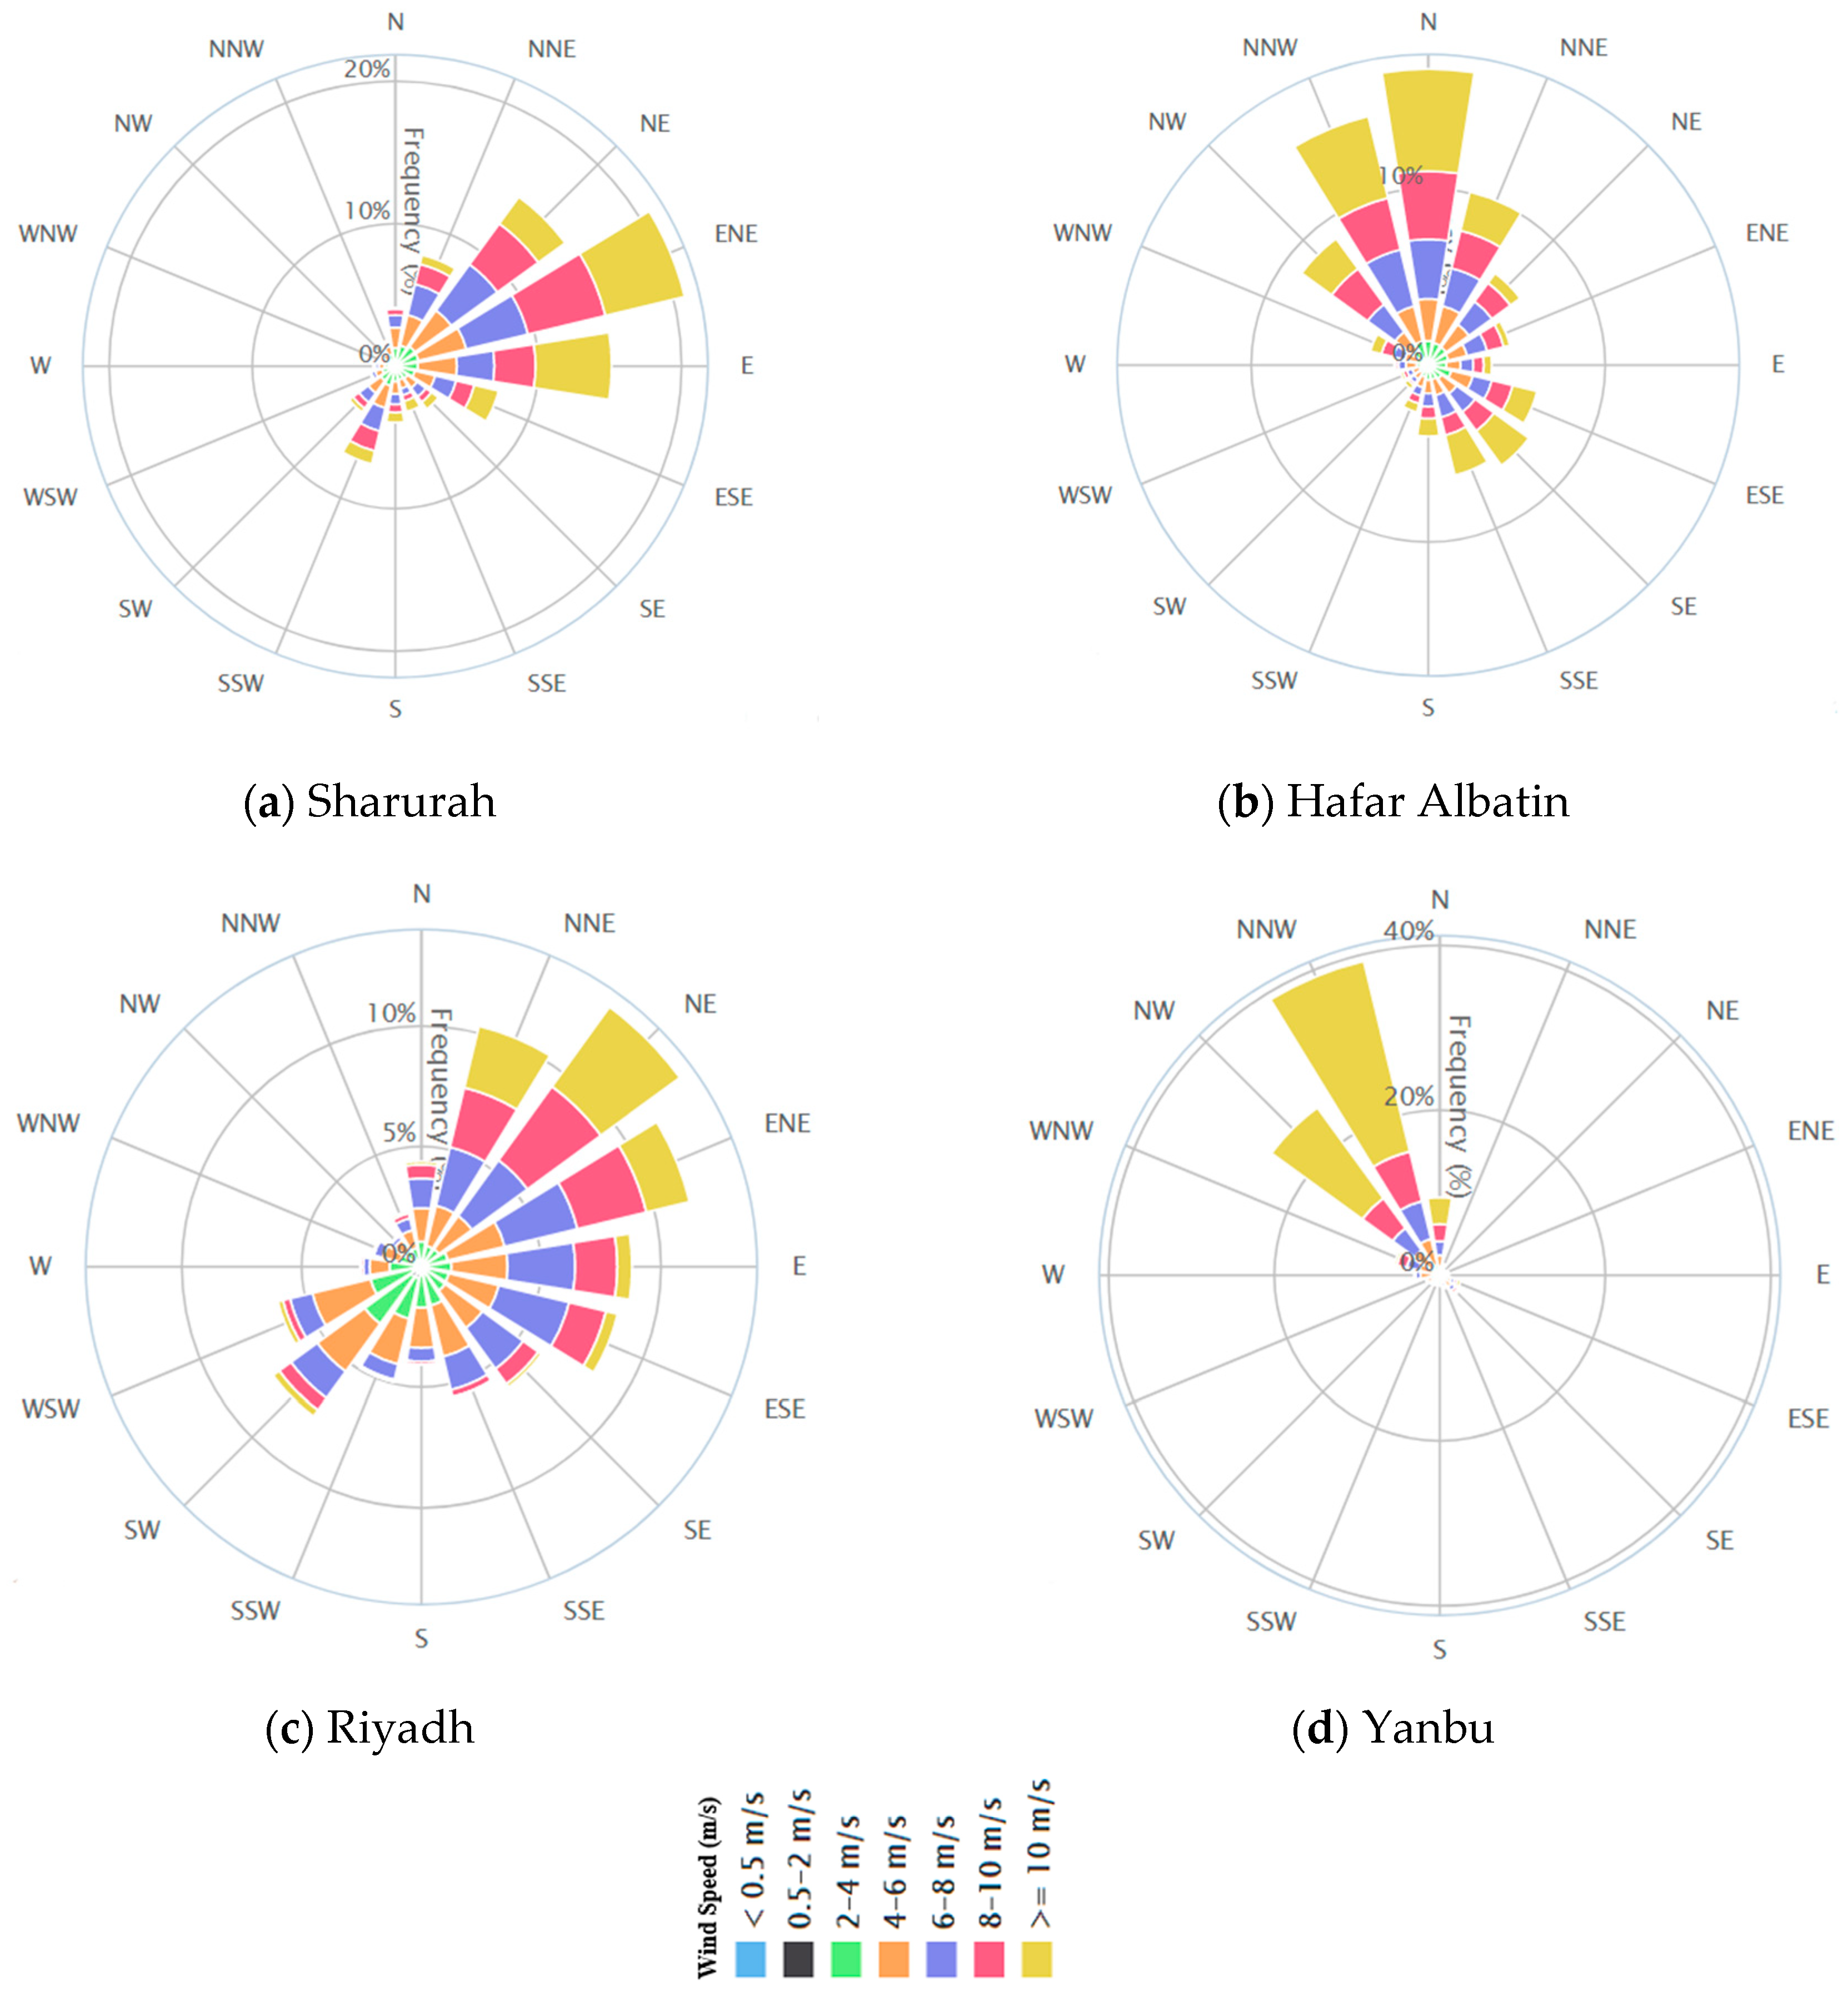
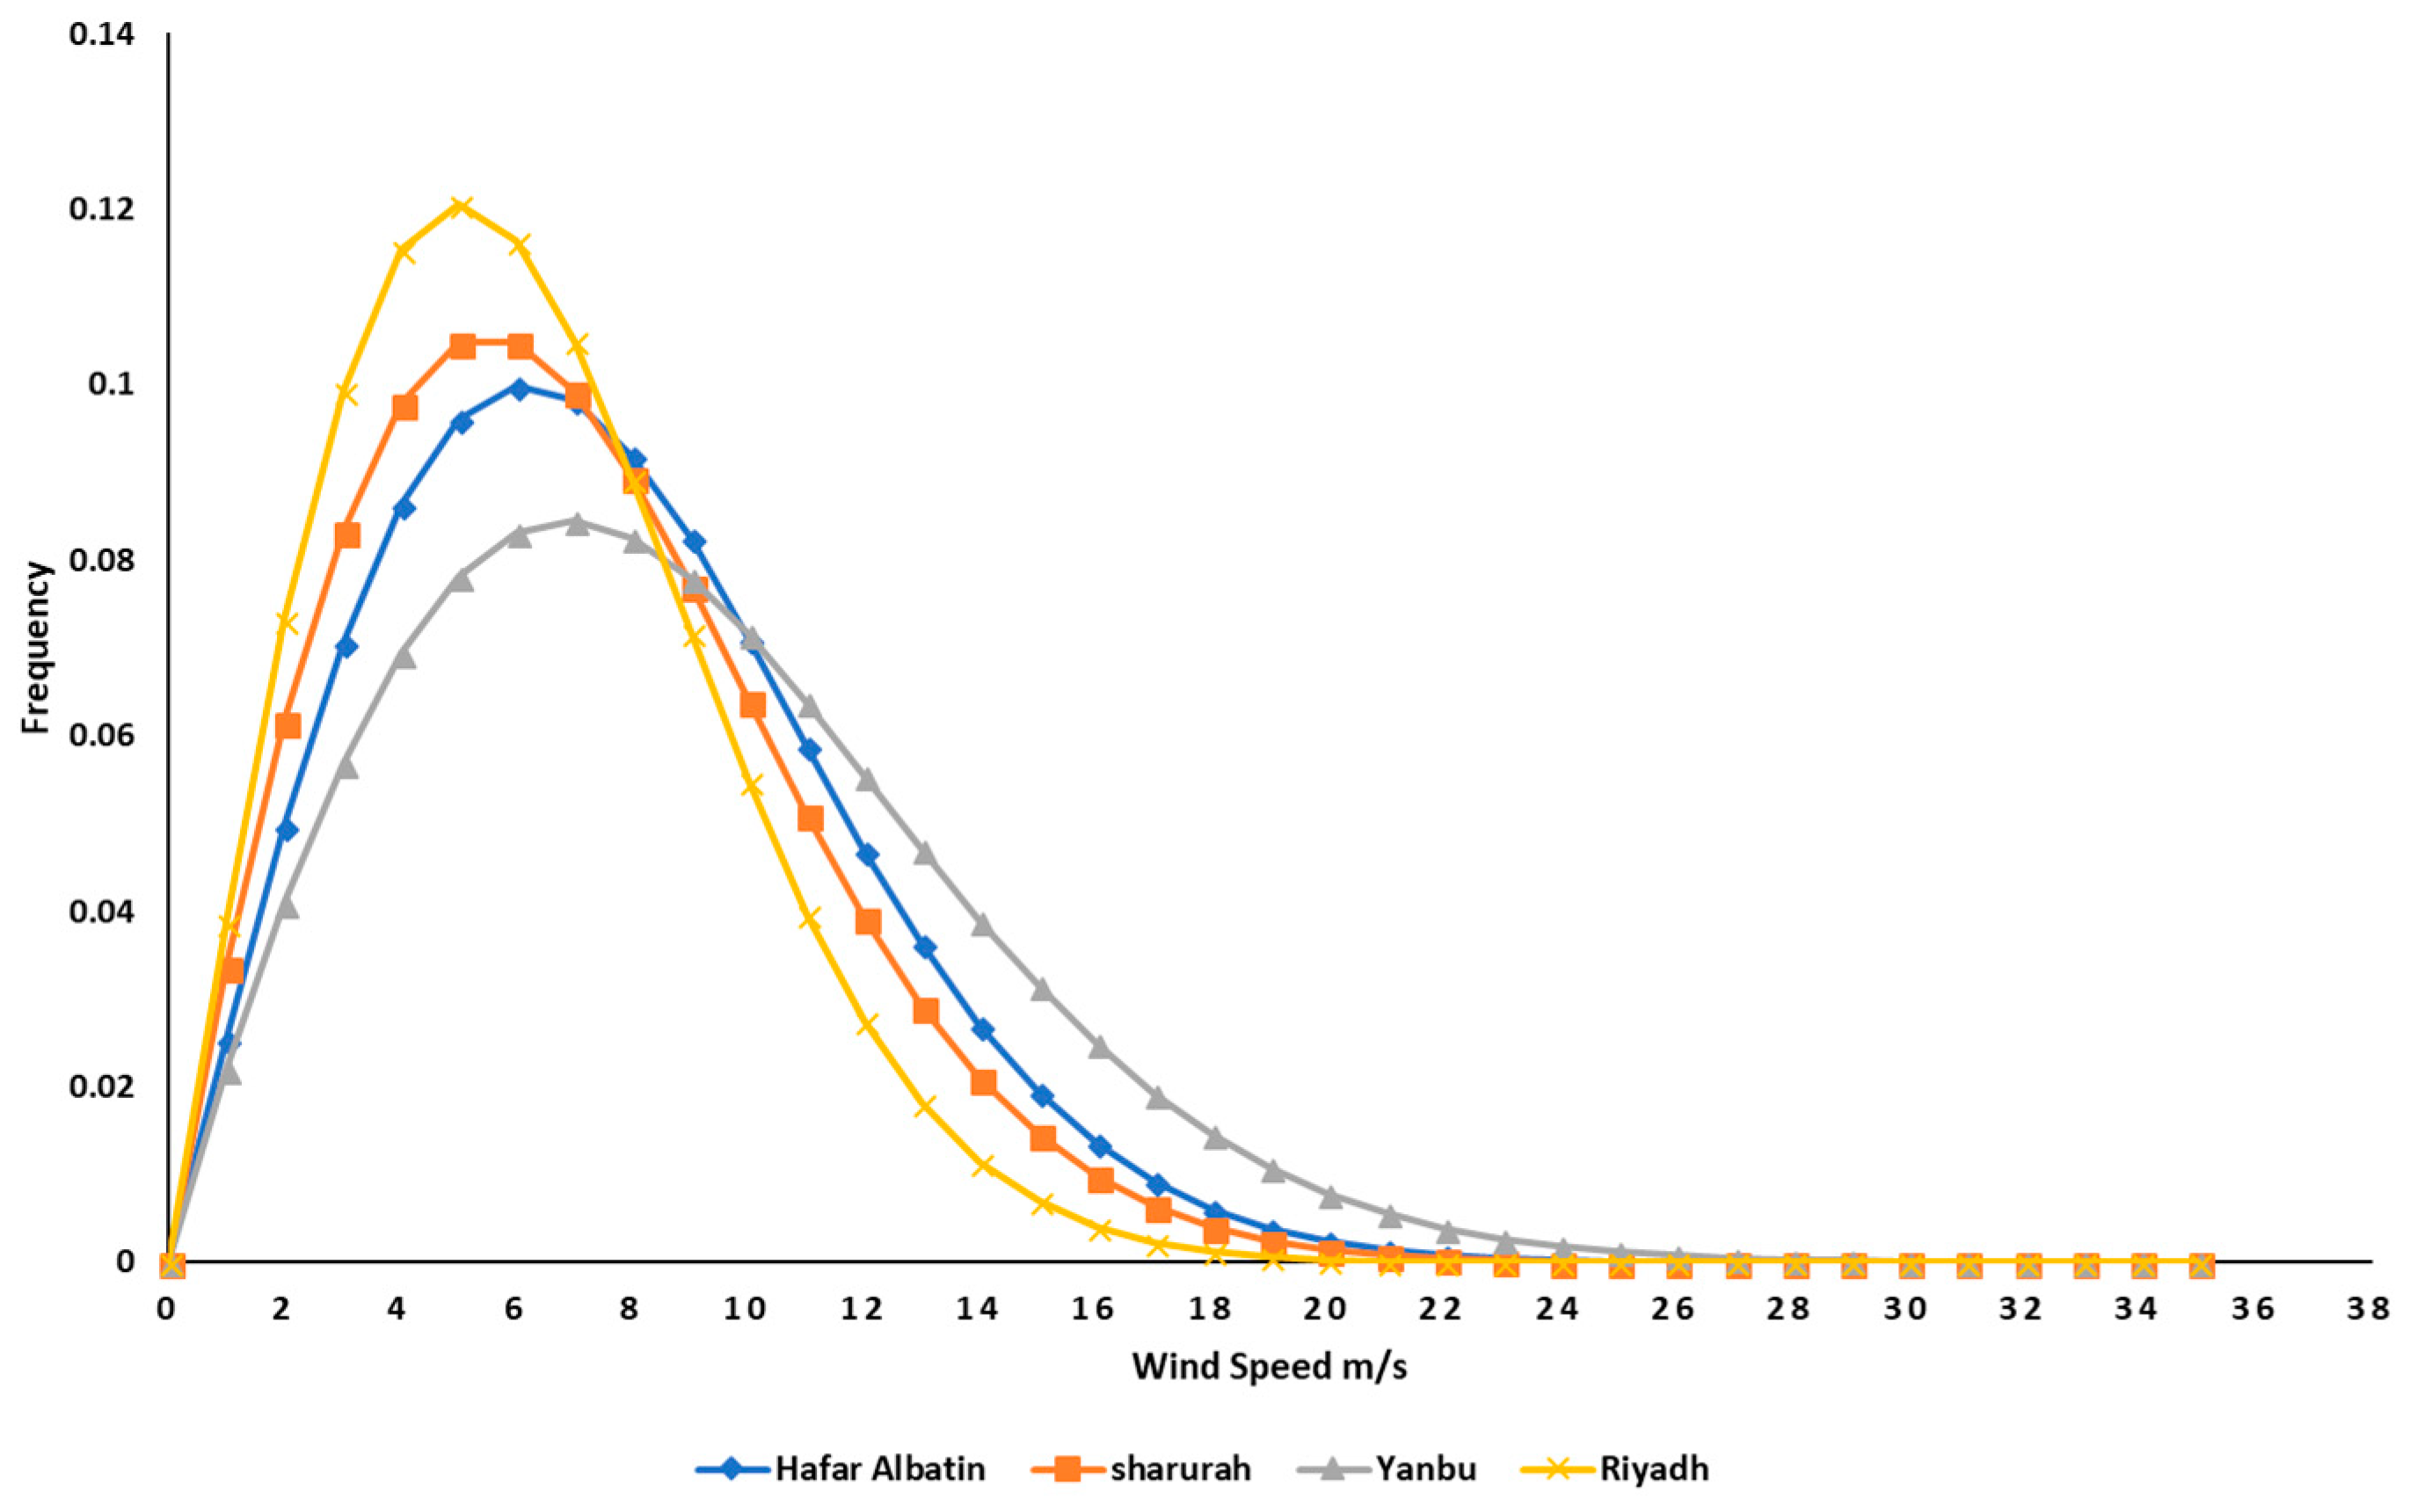
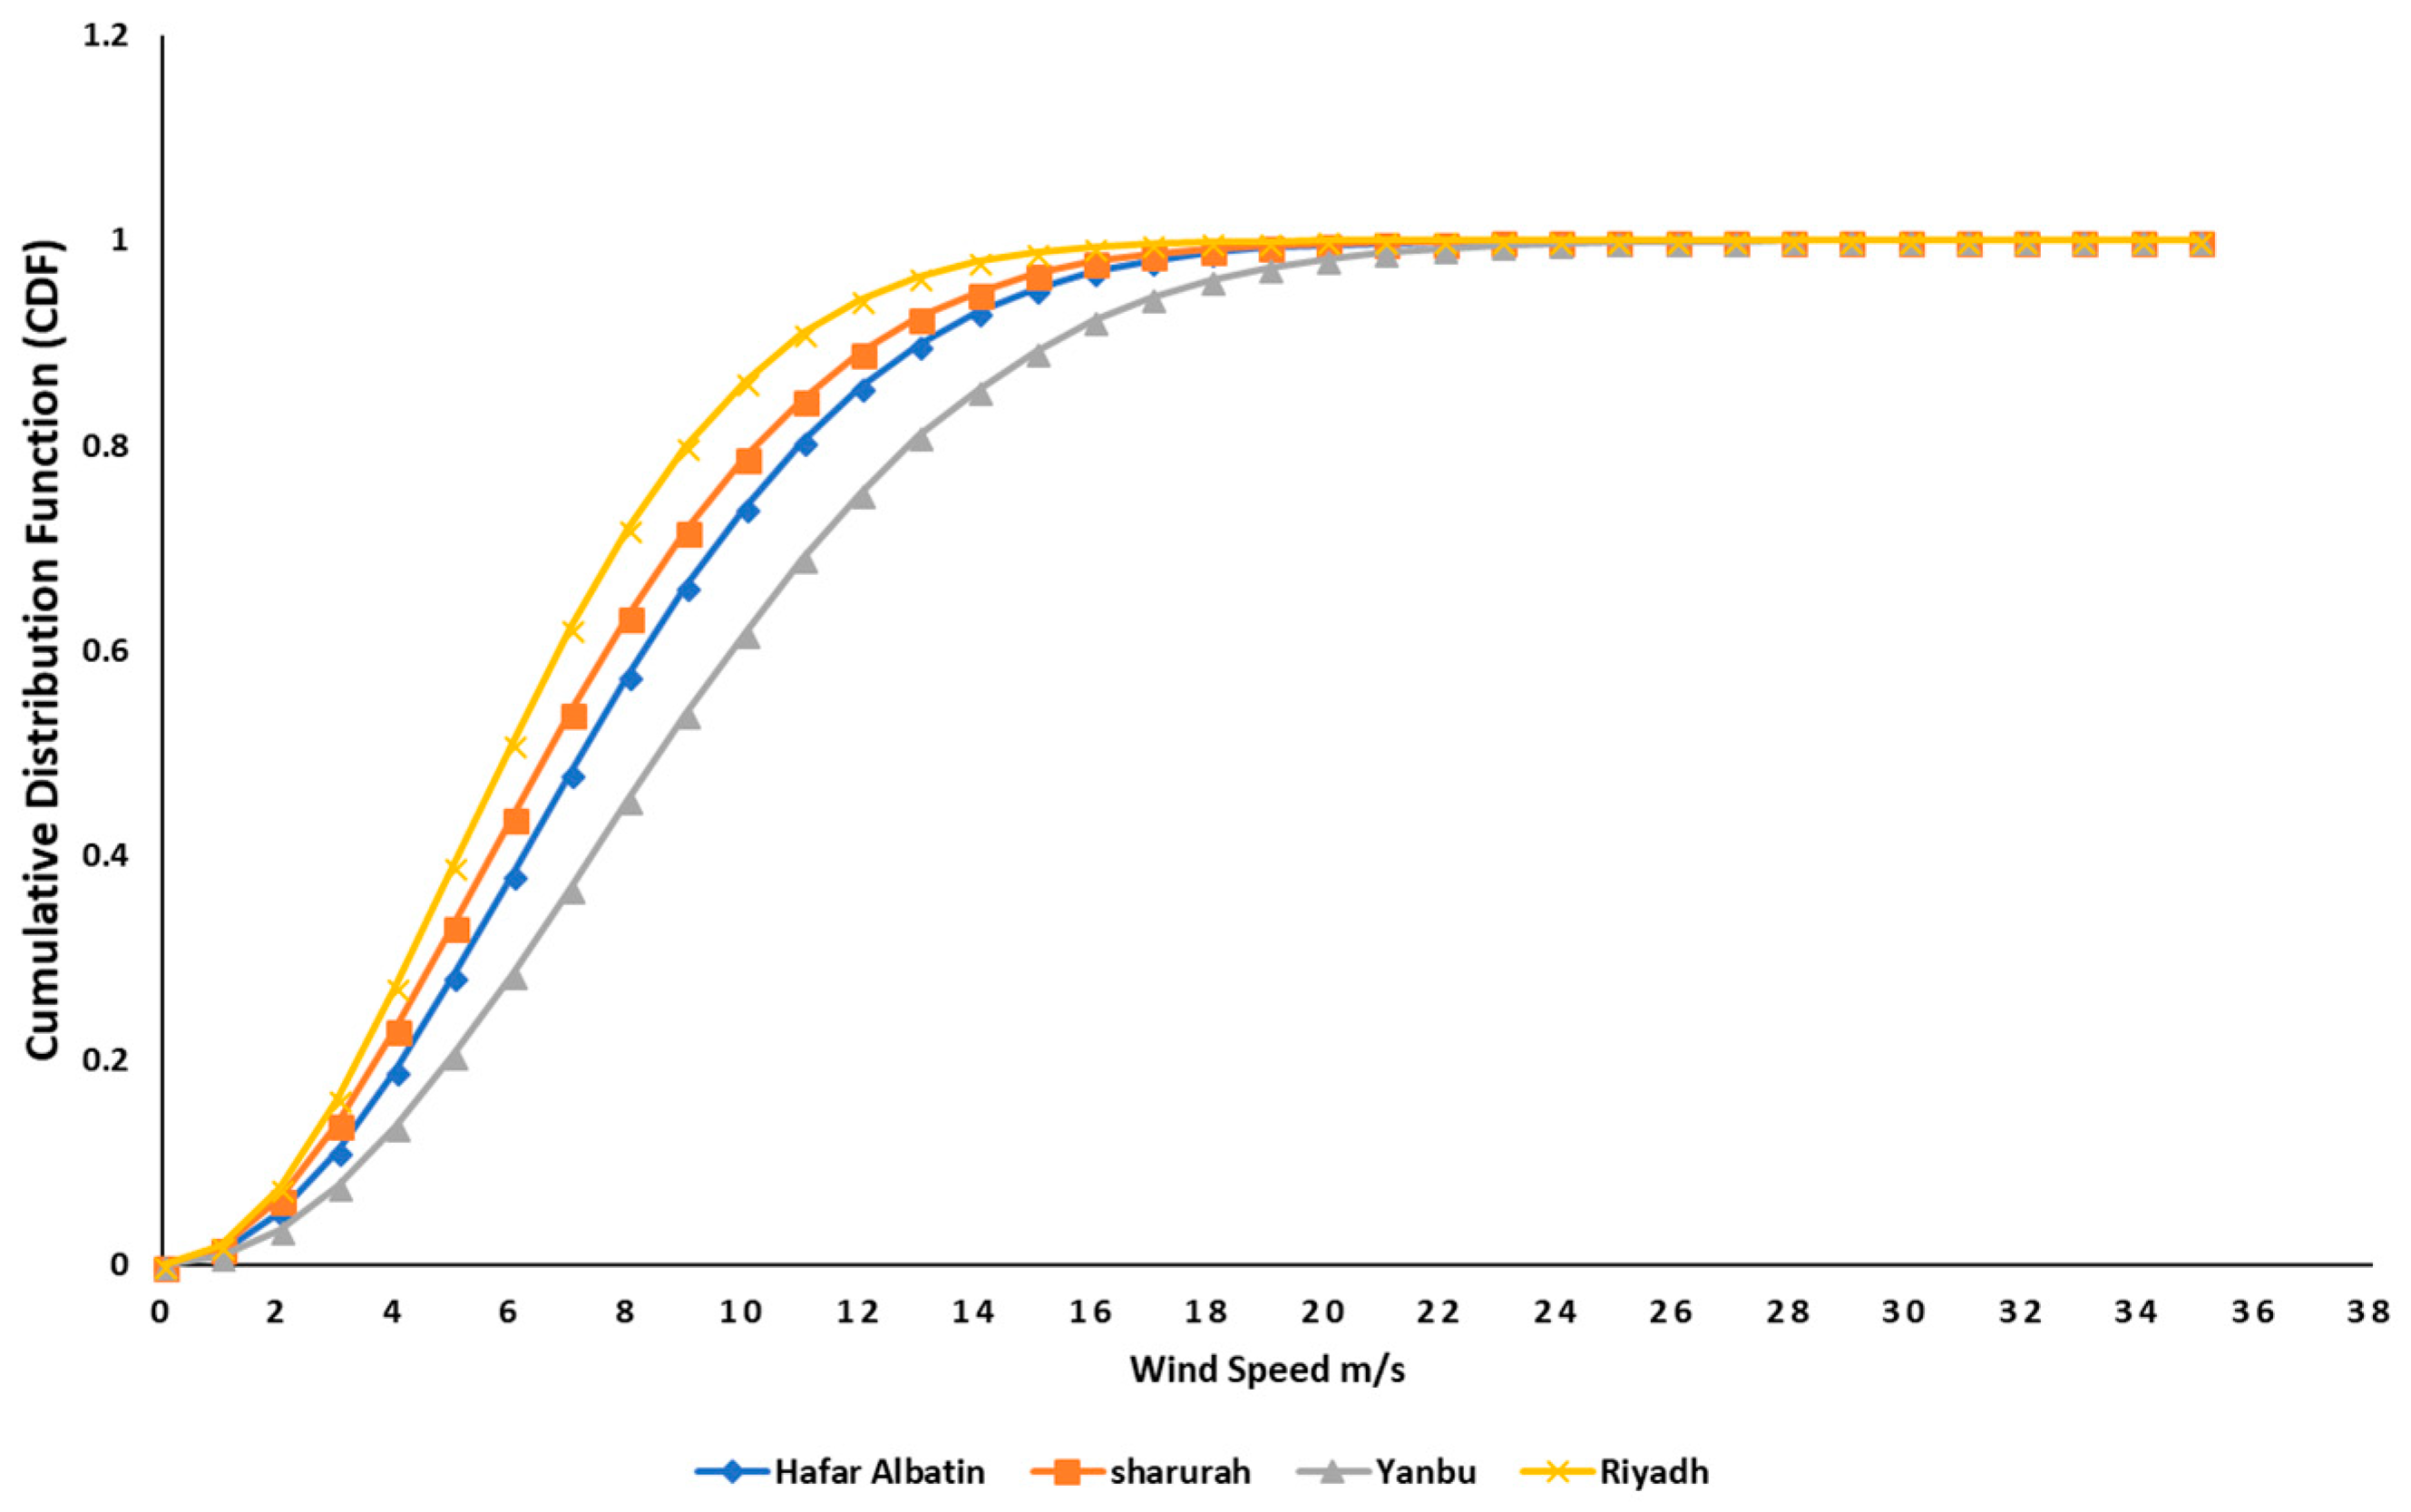
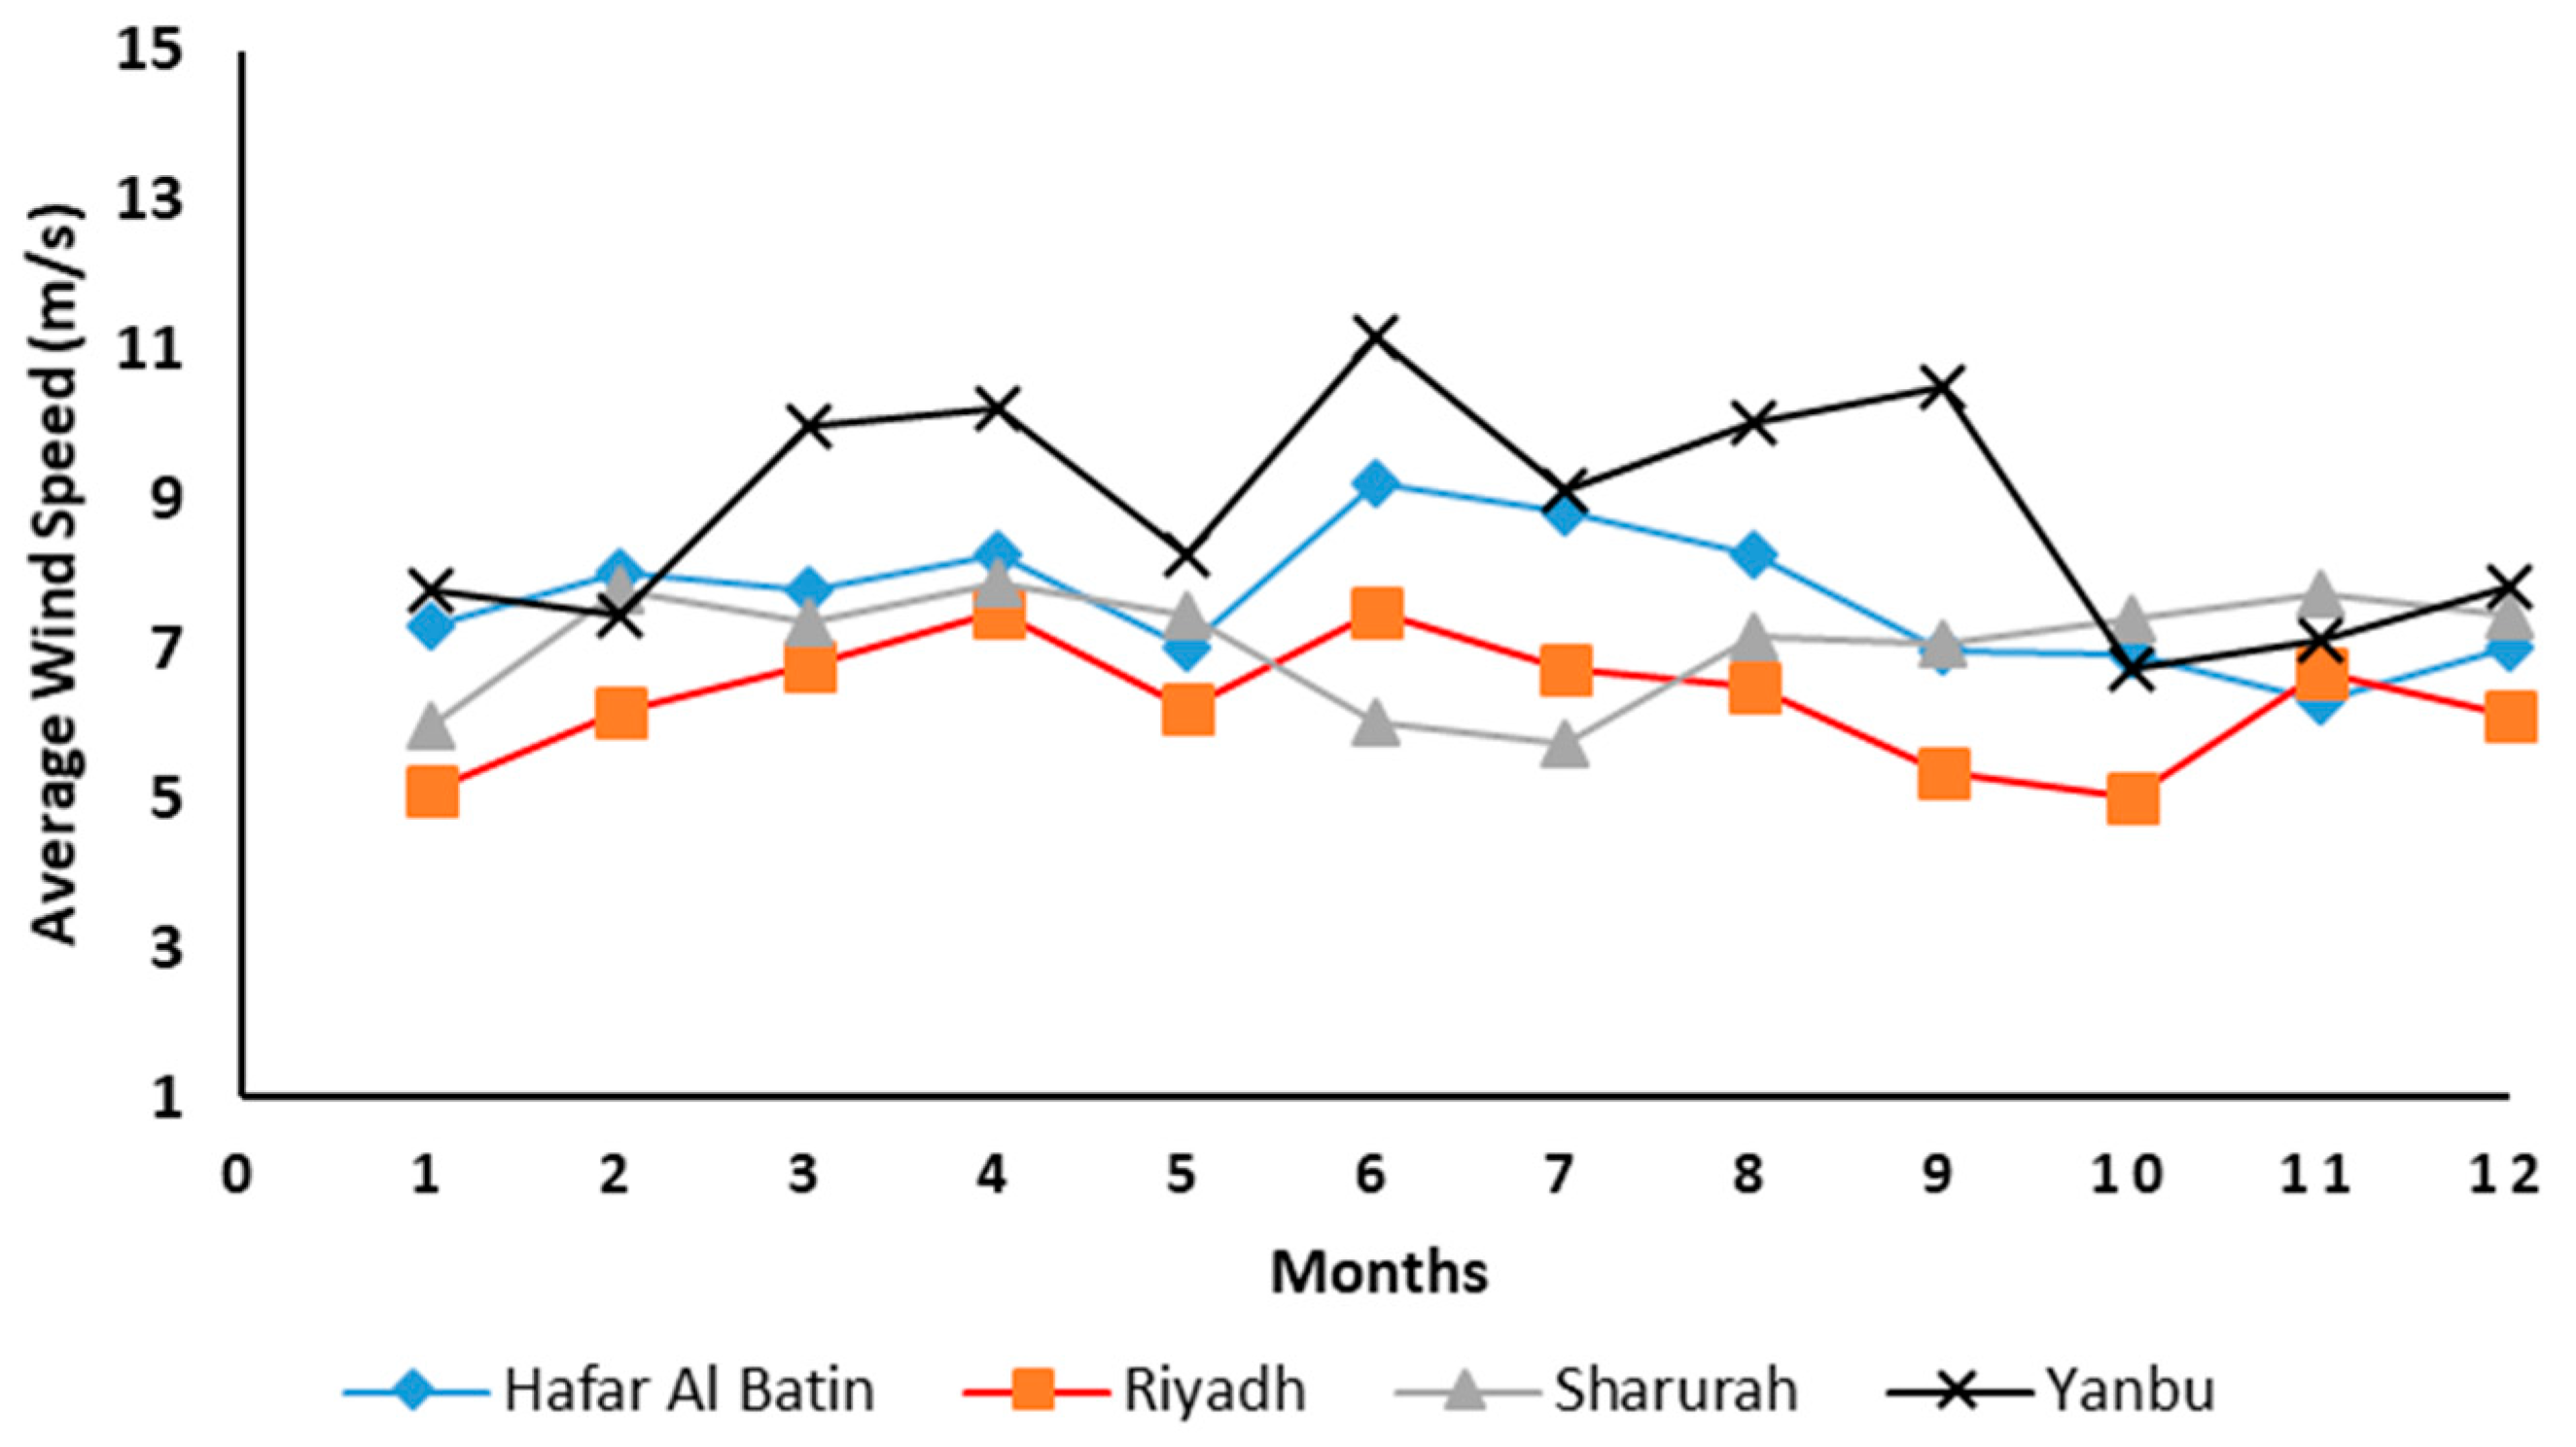
For solar resources, GHI values are high at all of our selected sites with relatively low variability. Due to the effect of pollution, dust, and clouds, DNI levels were more variable. The highest annual average daily total of GHI and DNI of solar radiation was in the city of Sharurah by 6681.62 Wh/m2 and 6206.91 Wh/m2, respectively. For wind energy resources, the frequency analysis showed that the availability of wind speeds above 10 m/s was 41% of the time at Yanbu followed by 27% at Hafar Albatin, 22% at Sharurah, and 14% at Riyadh at 80 m for the entire year. In addition, the annual mean wind power density for Yanbu city was the highest with 833.78 W/m2 at the height of 80 m, which indicates that this location is the best for wind energy production.
-
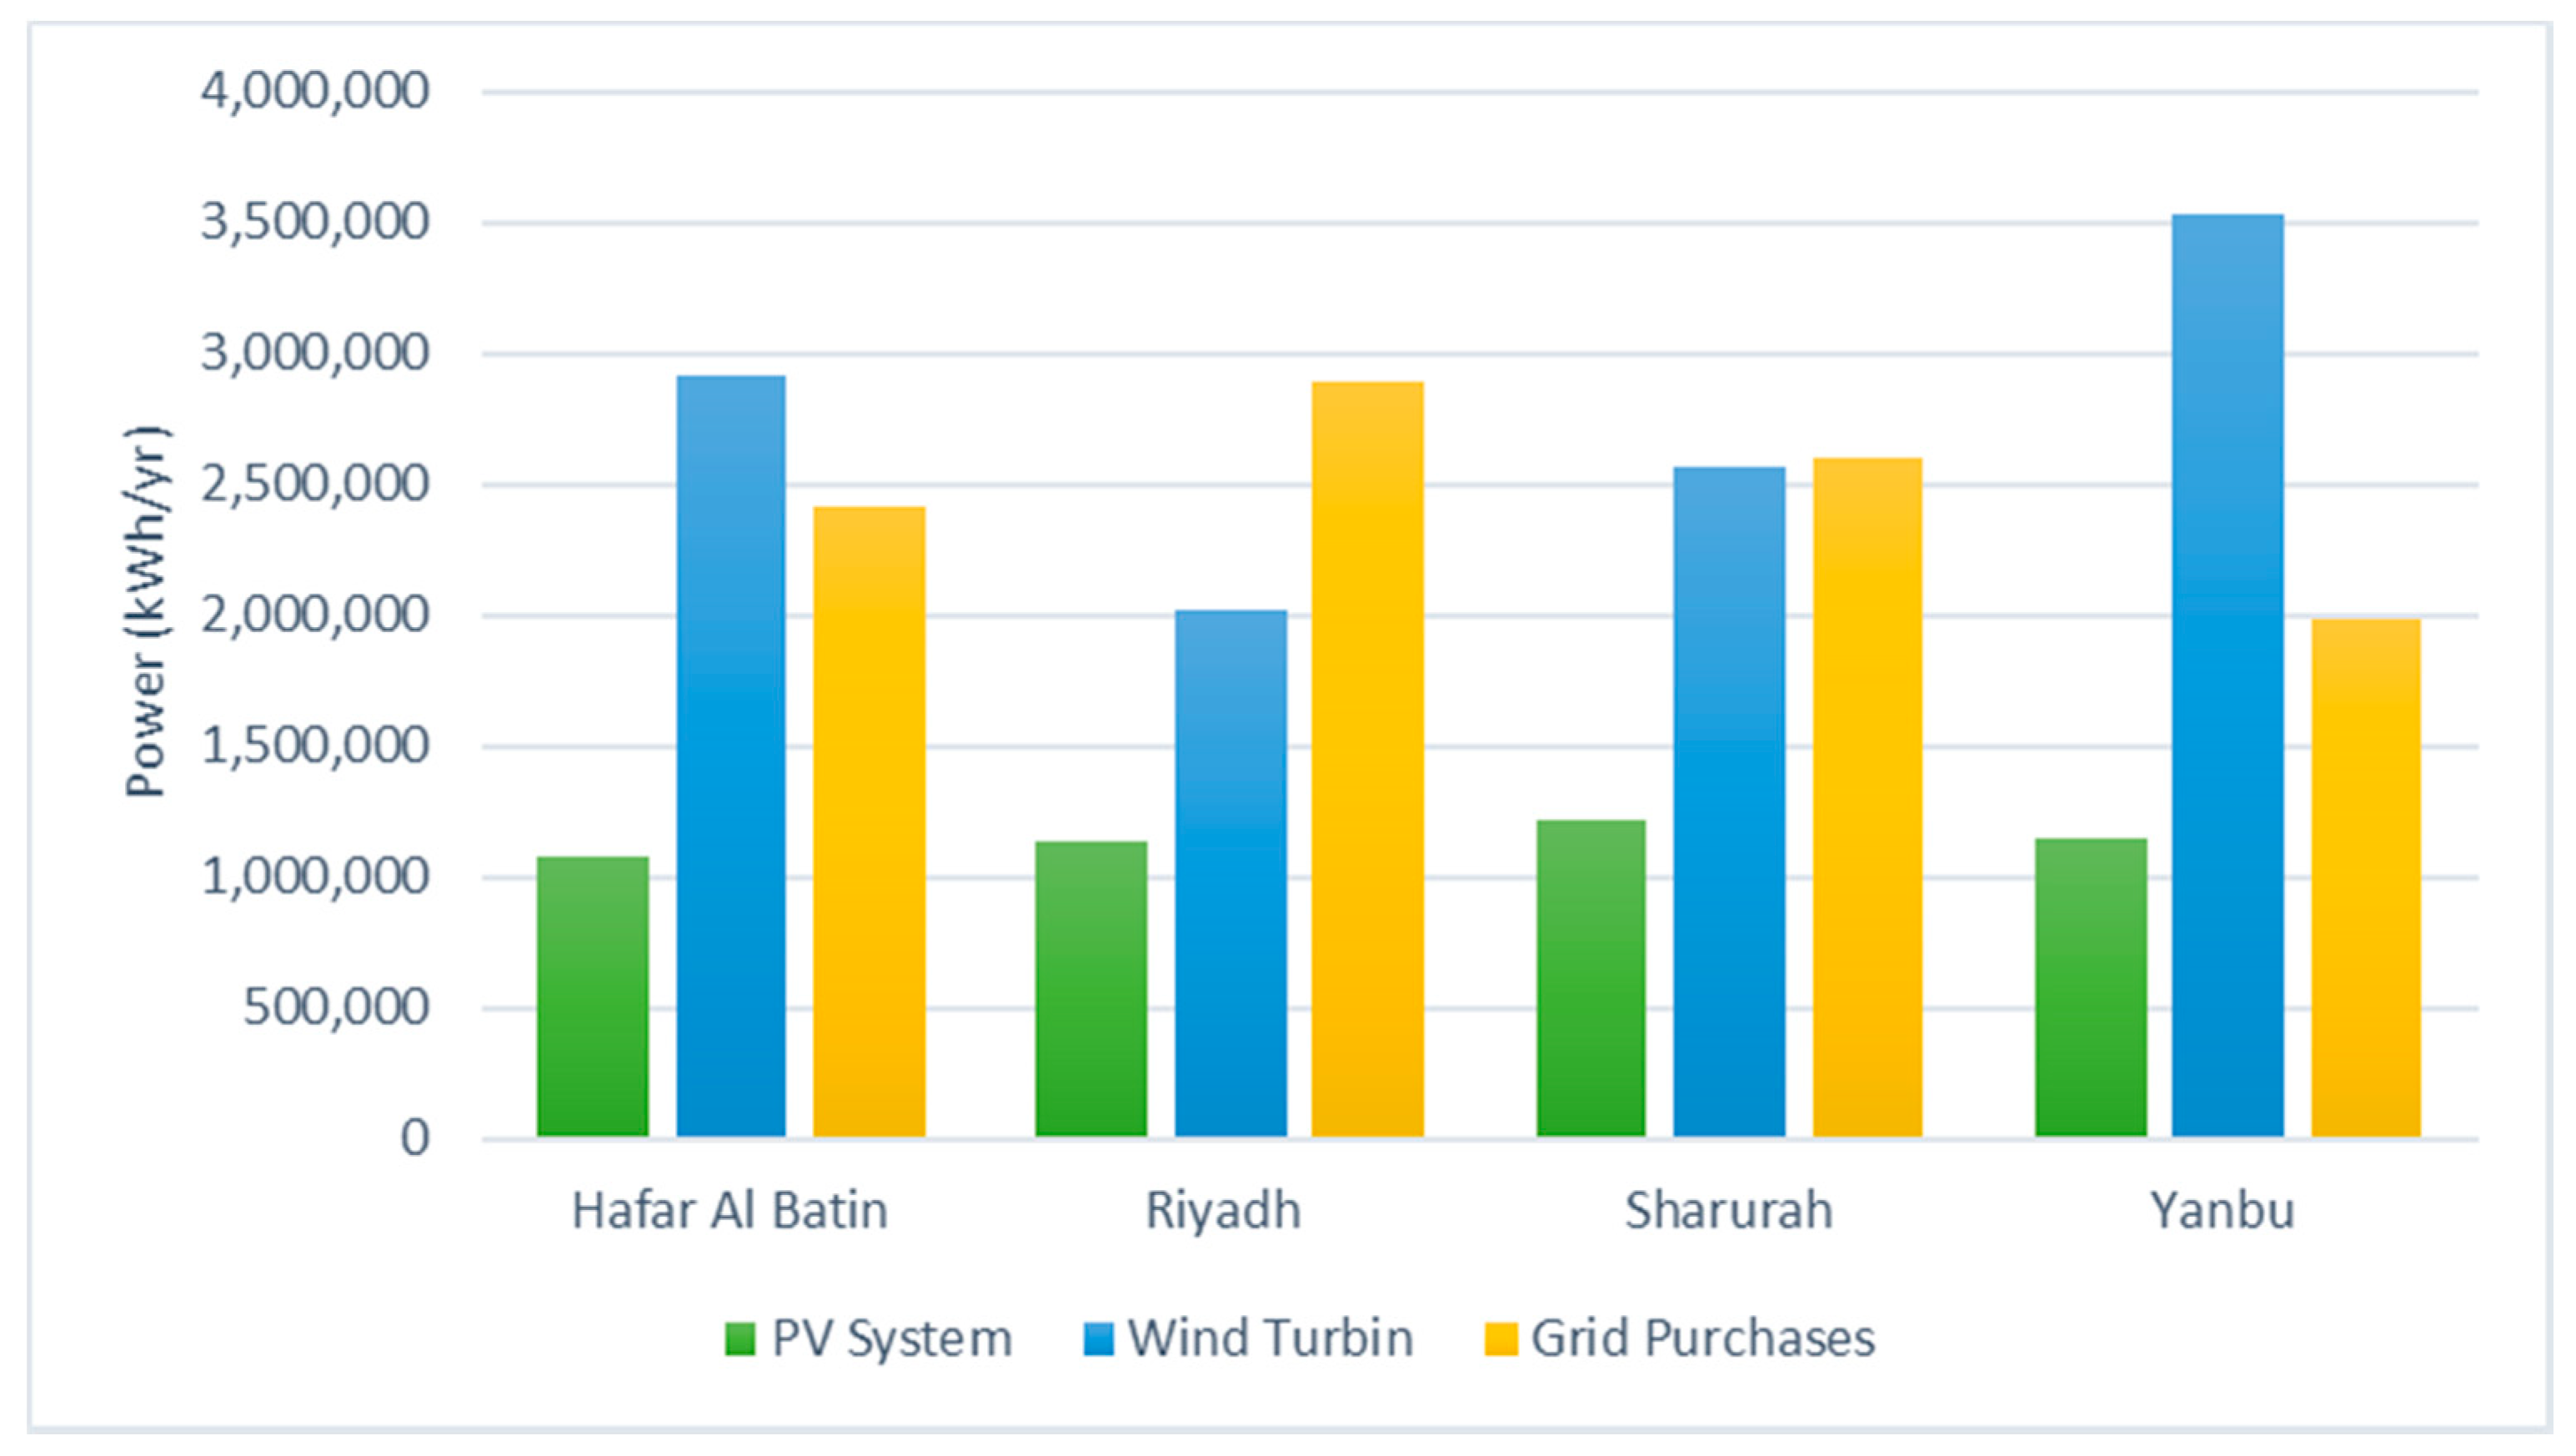
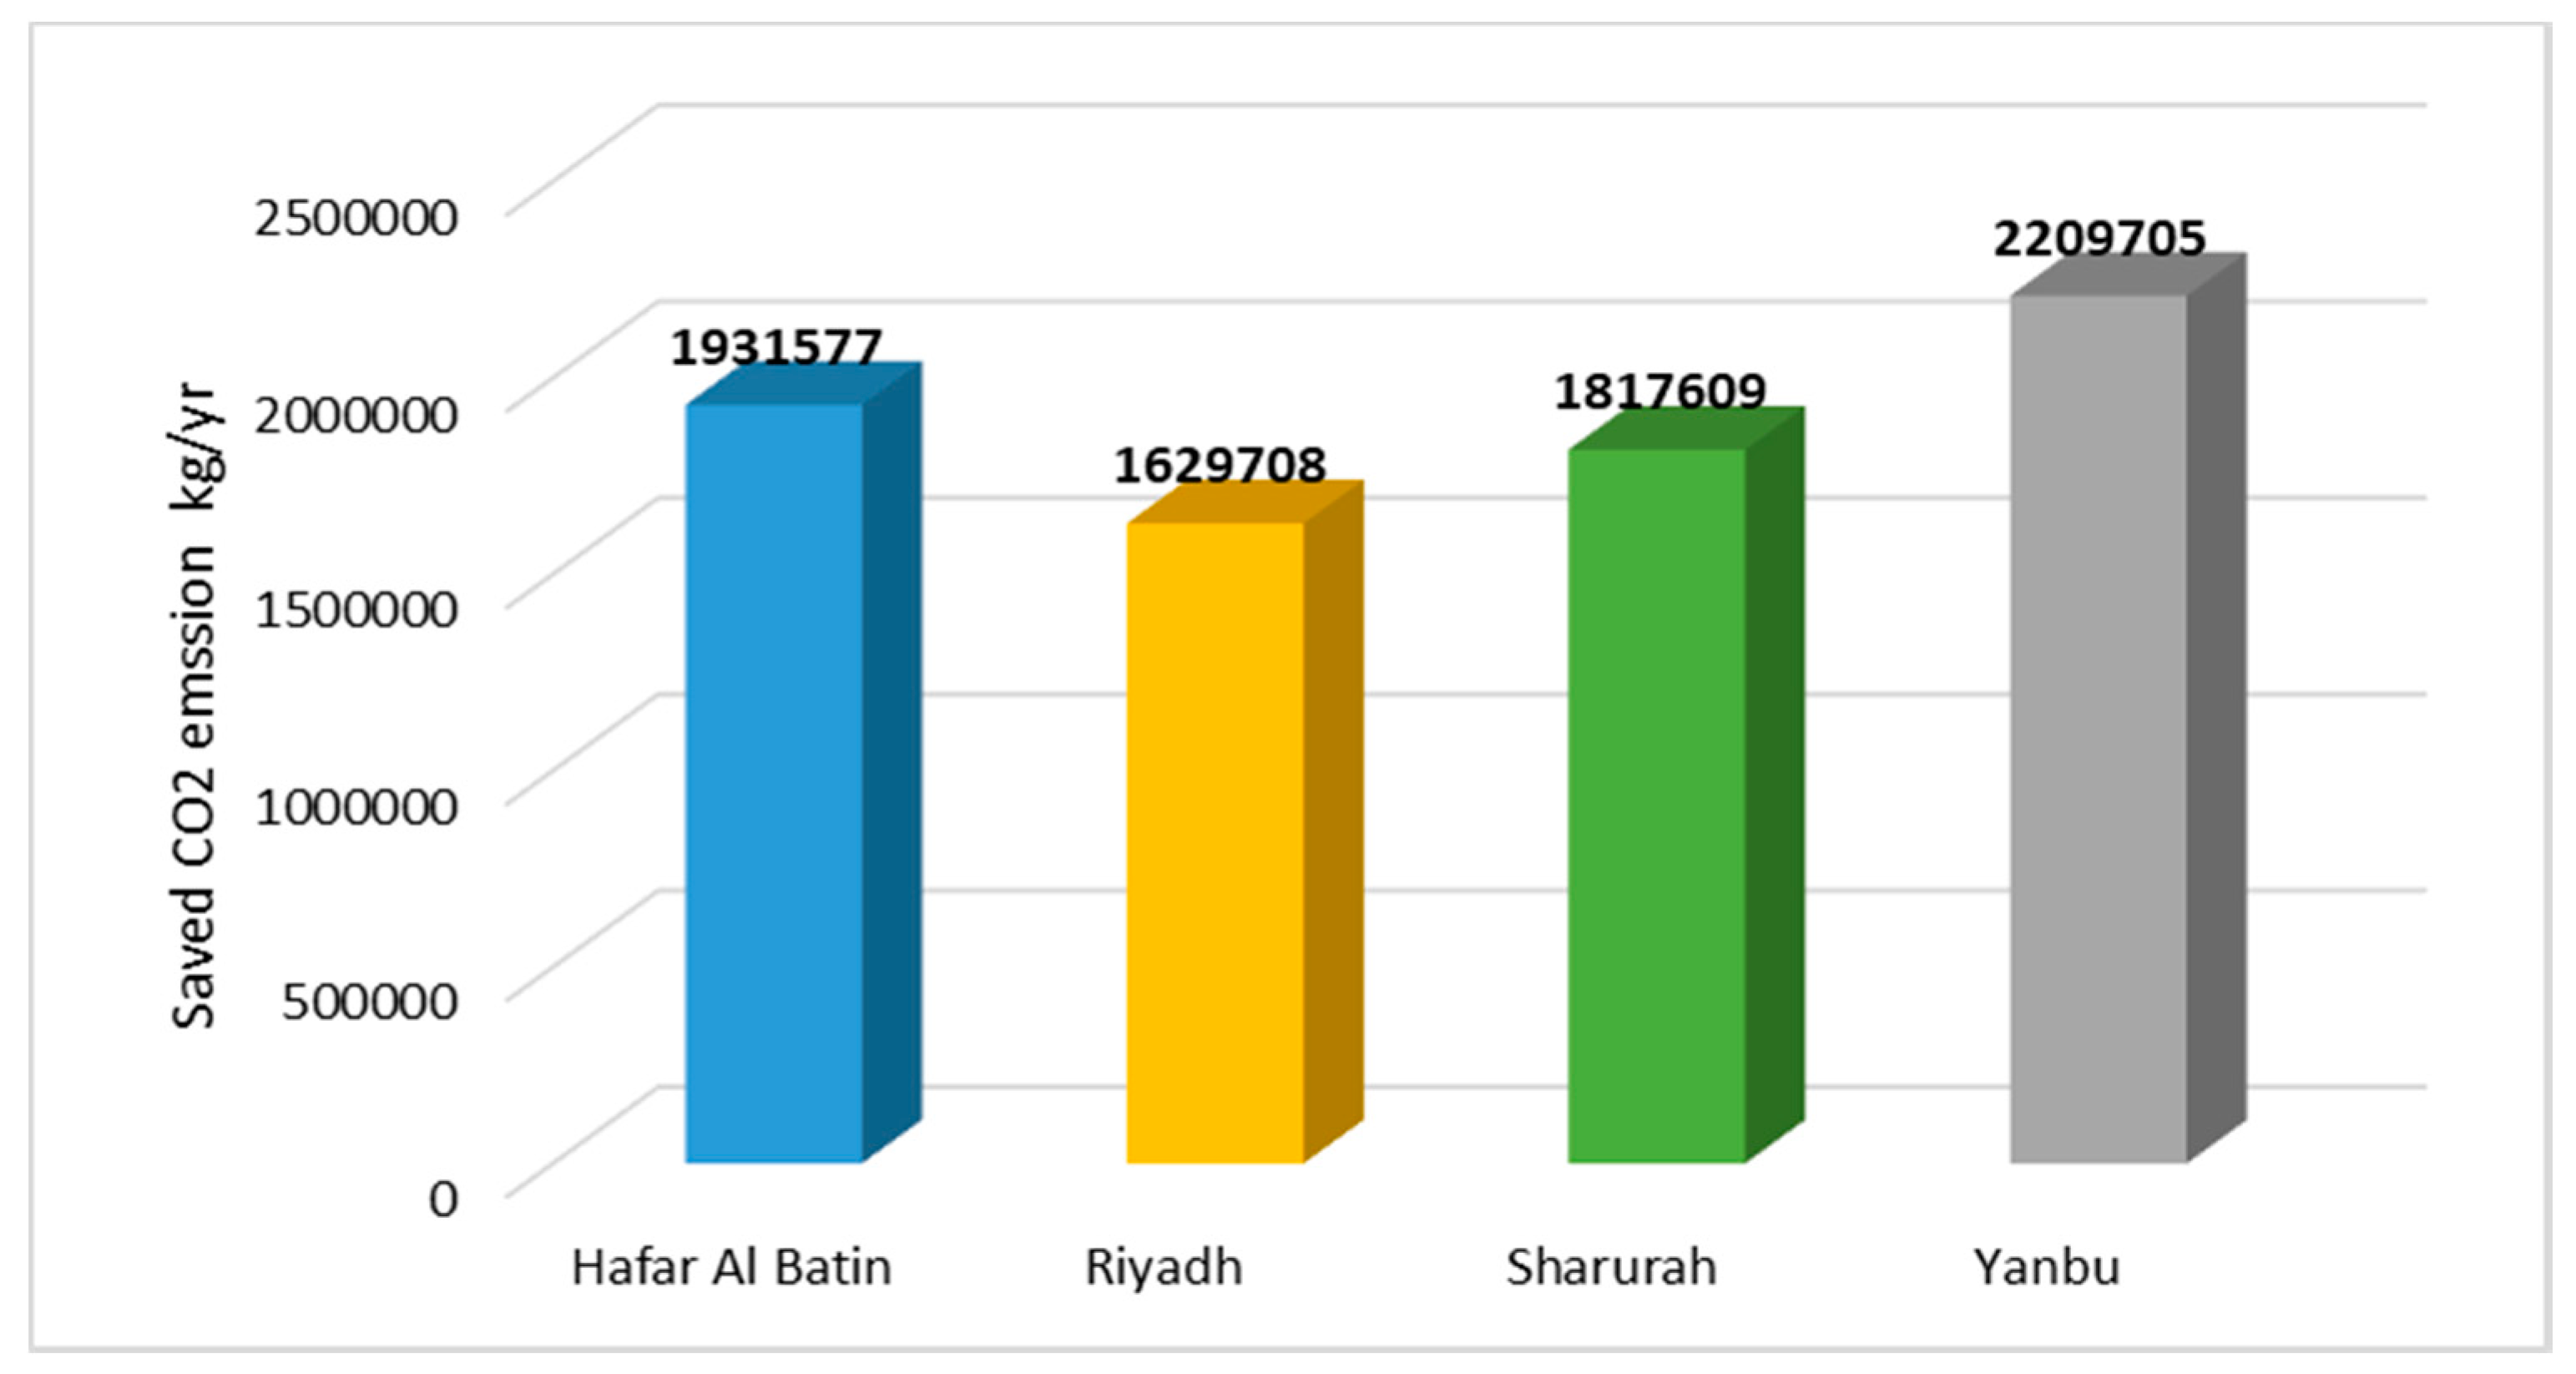
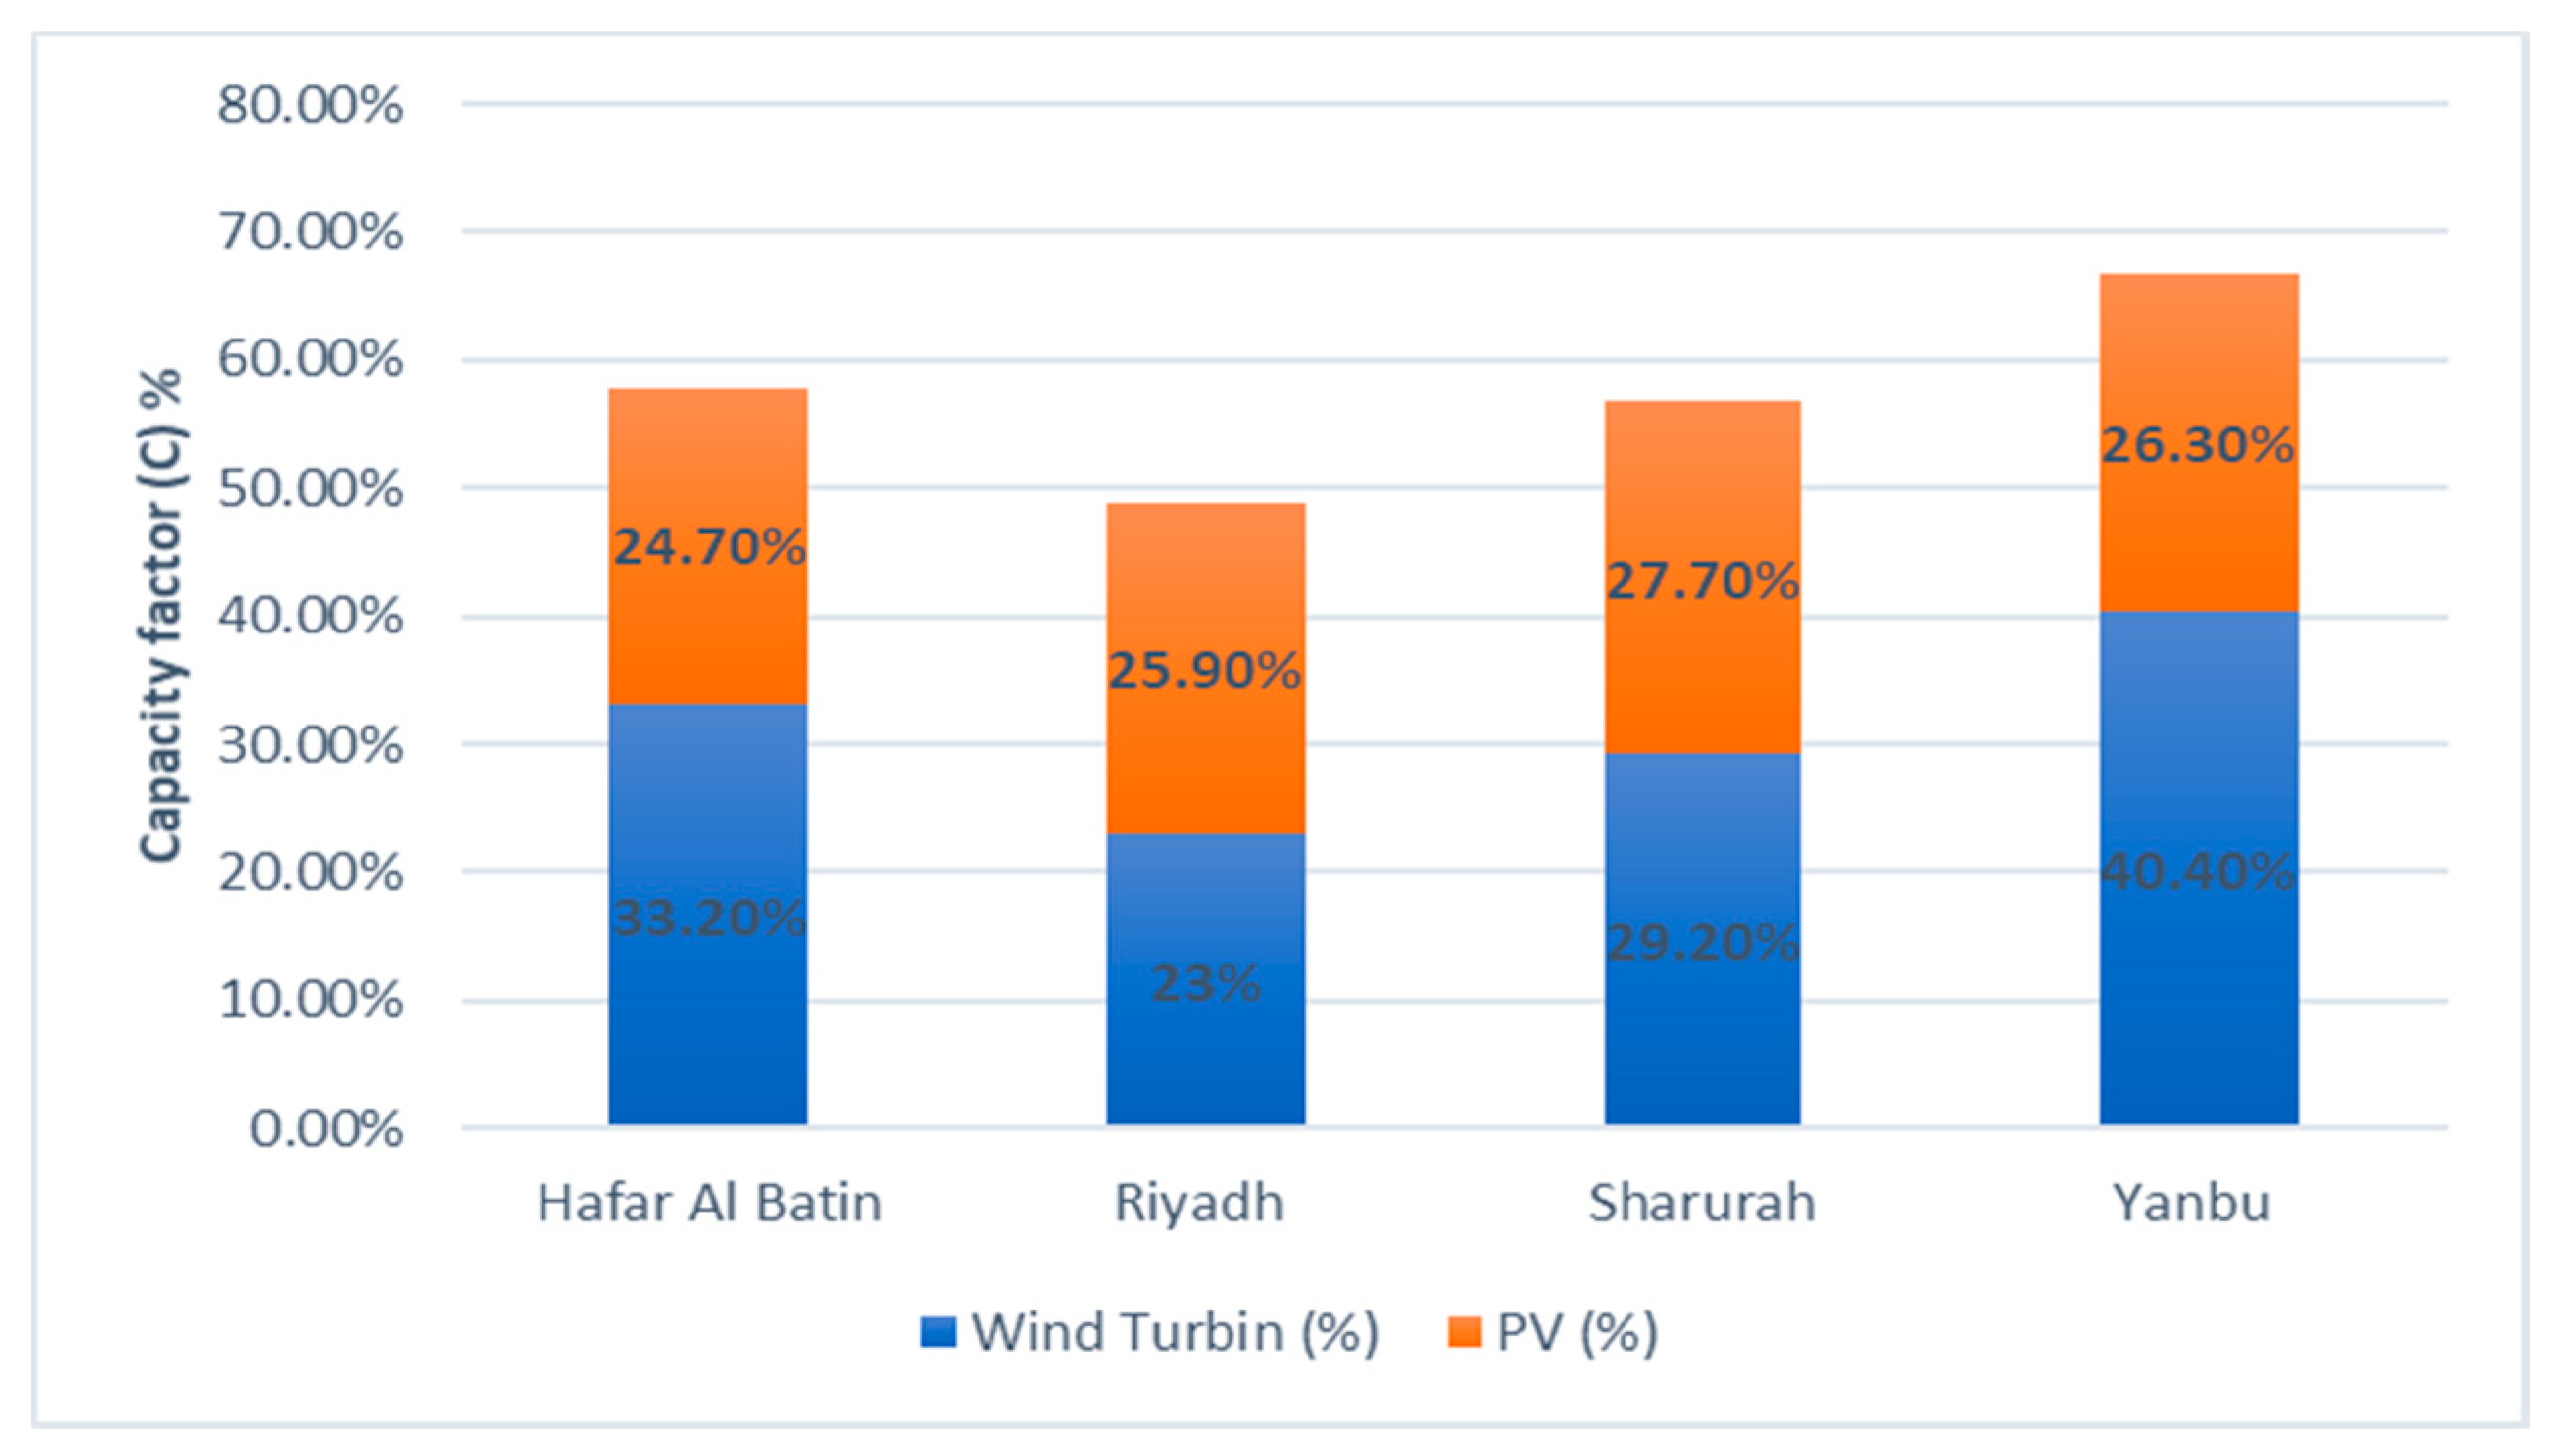
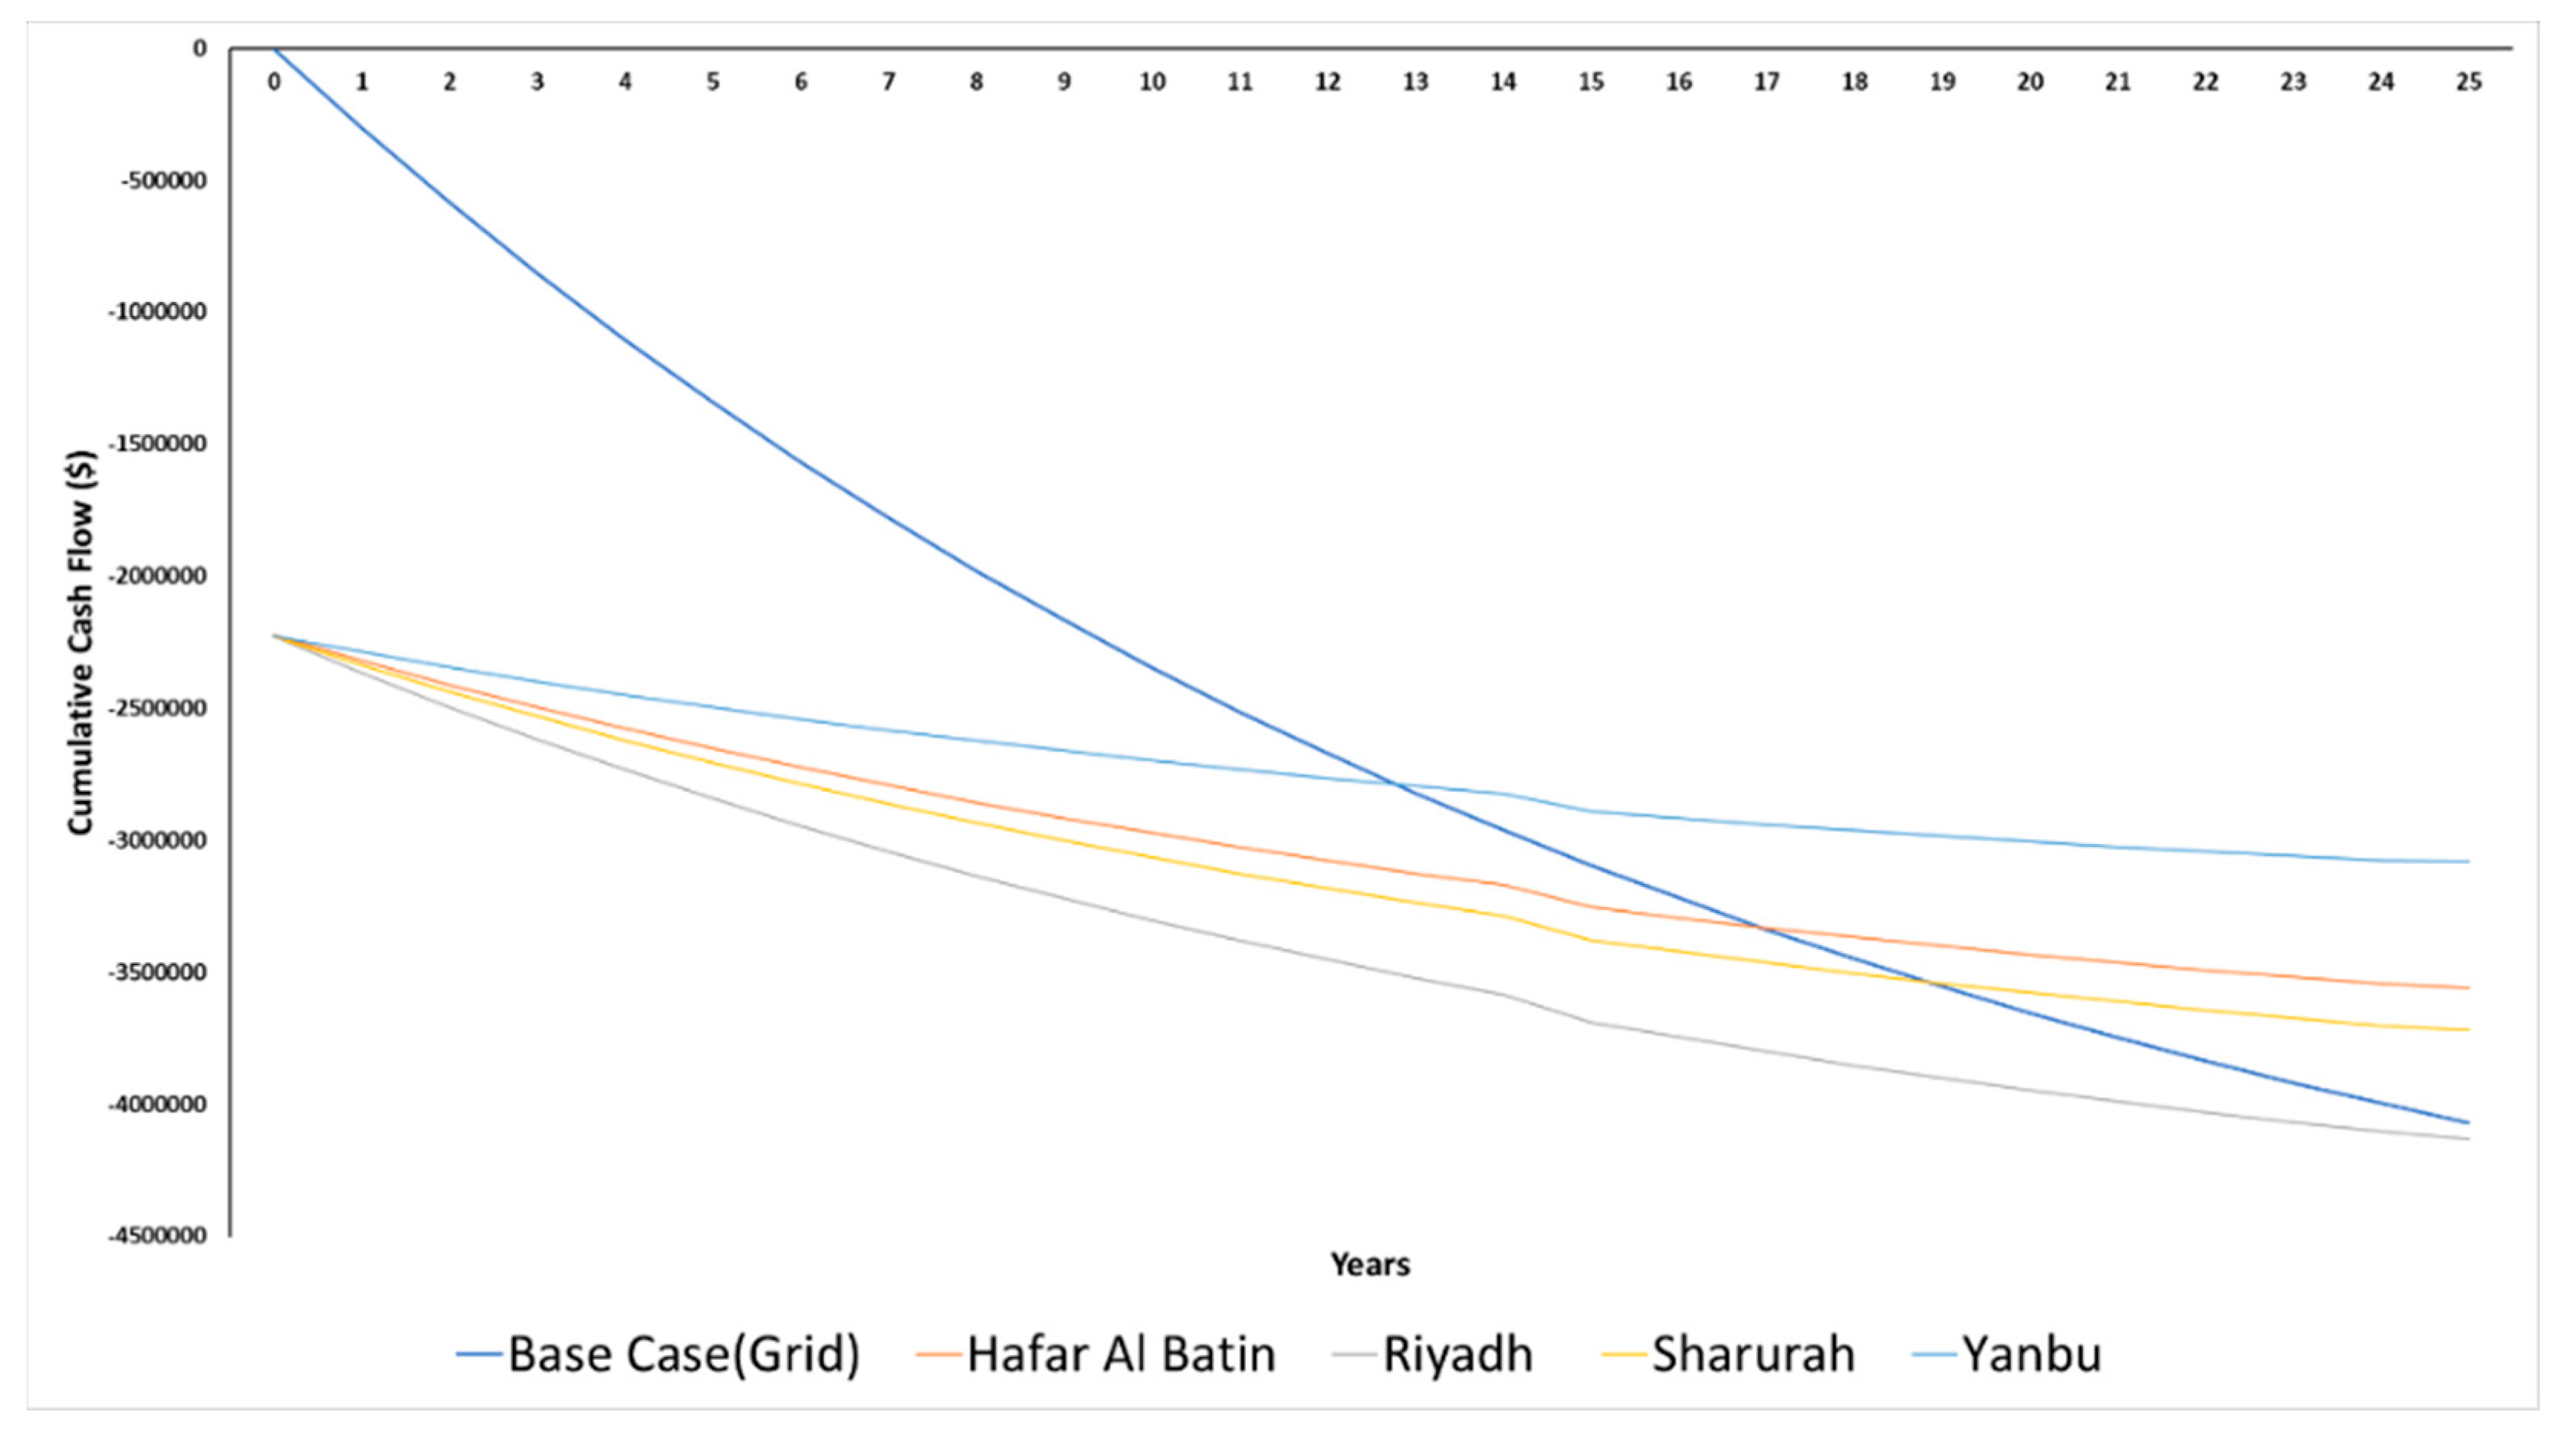
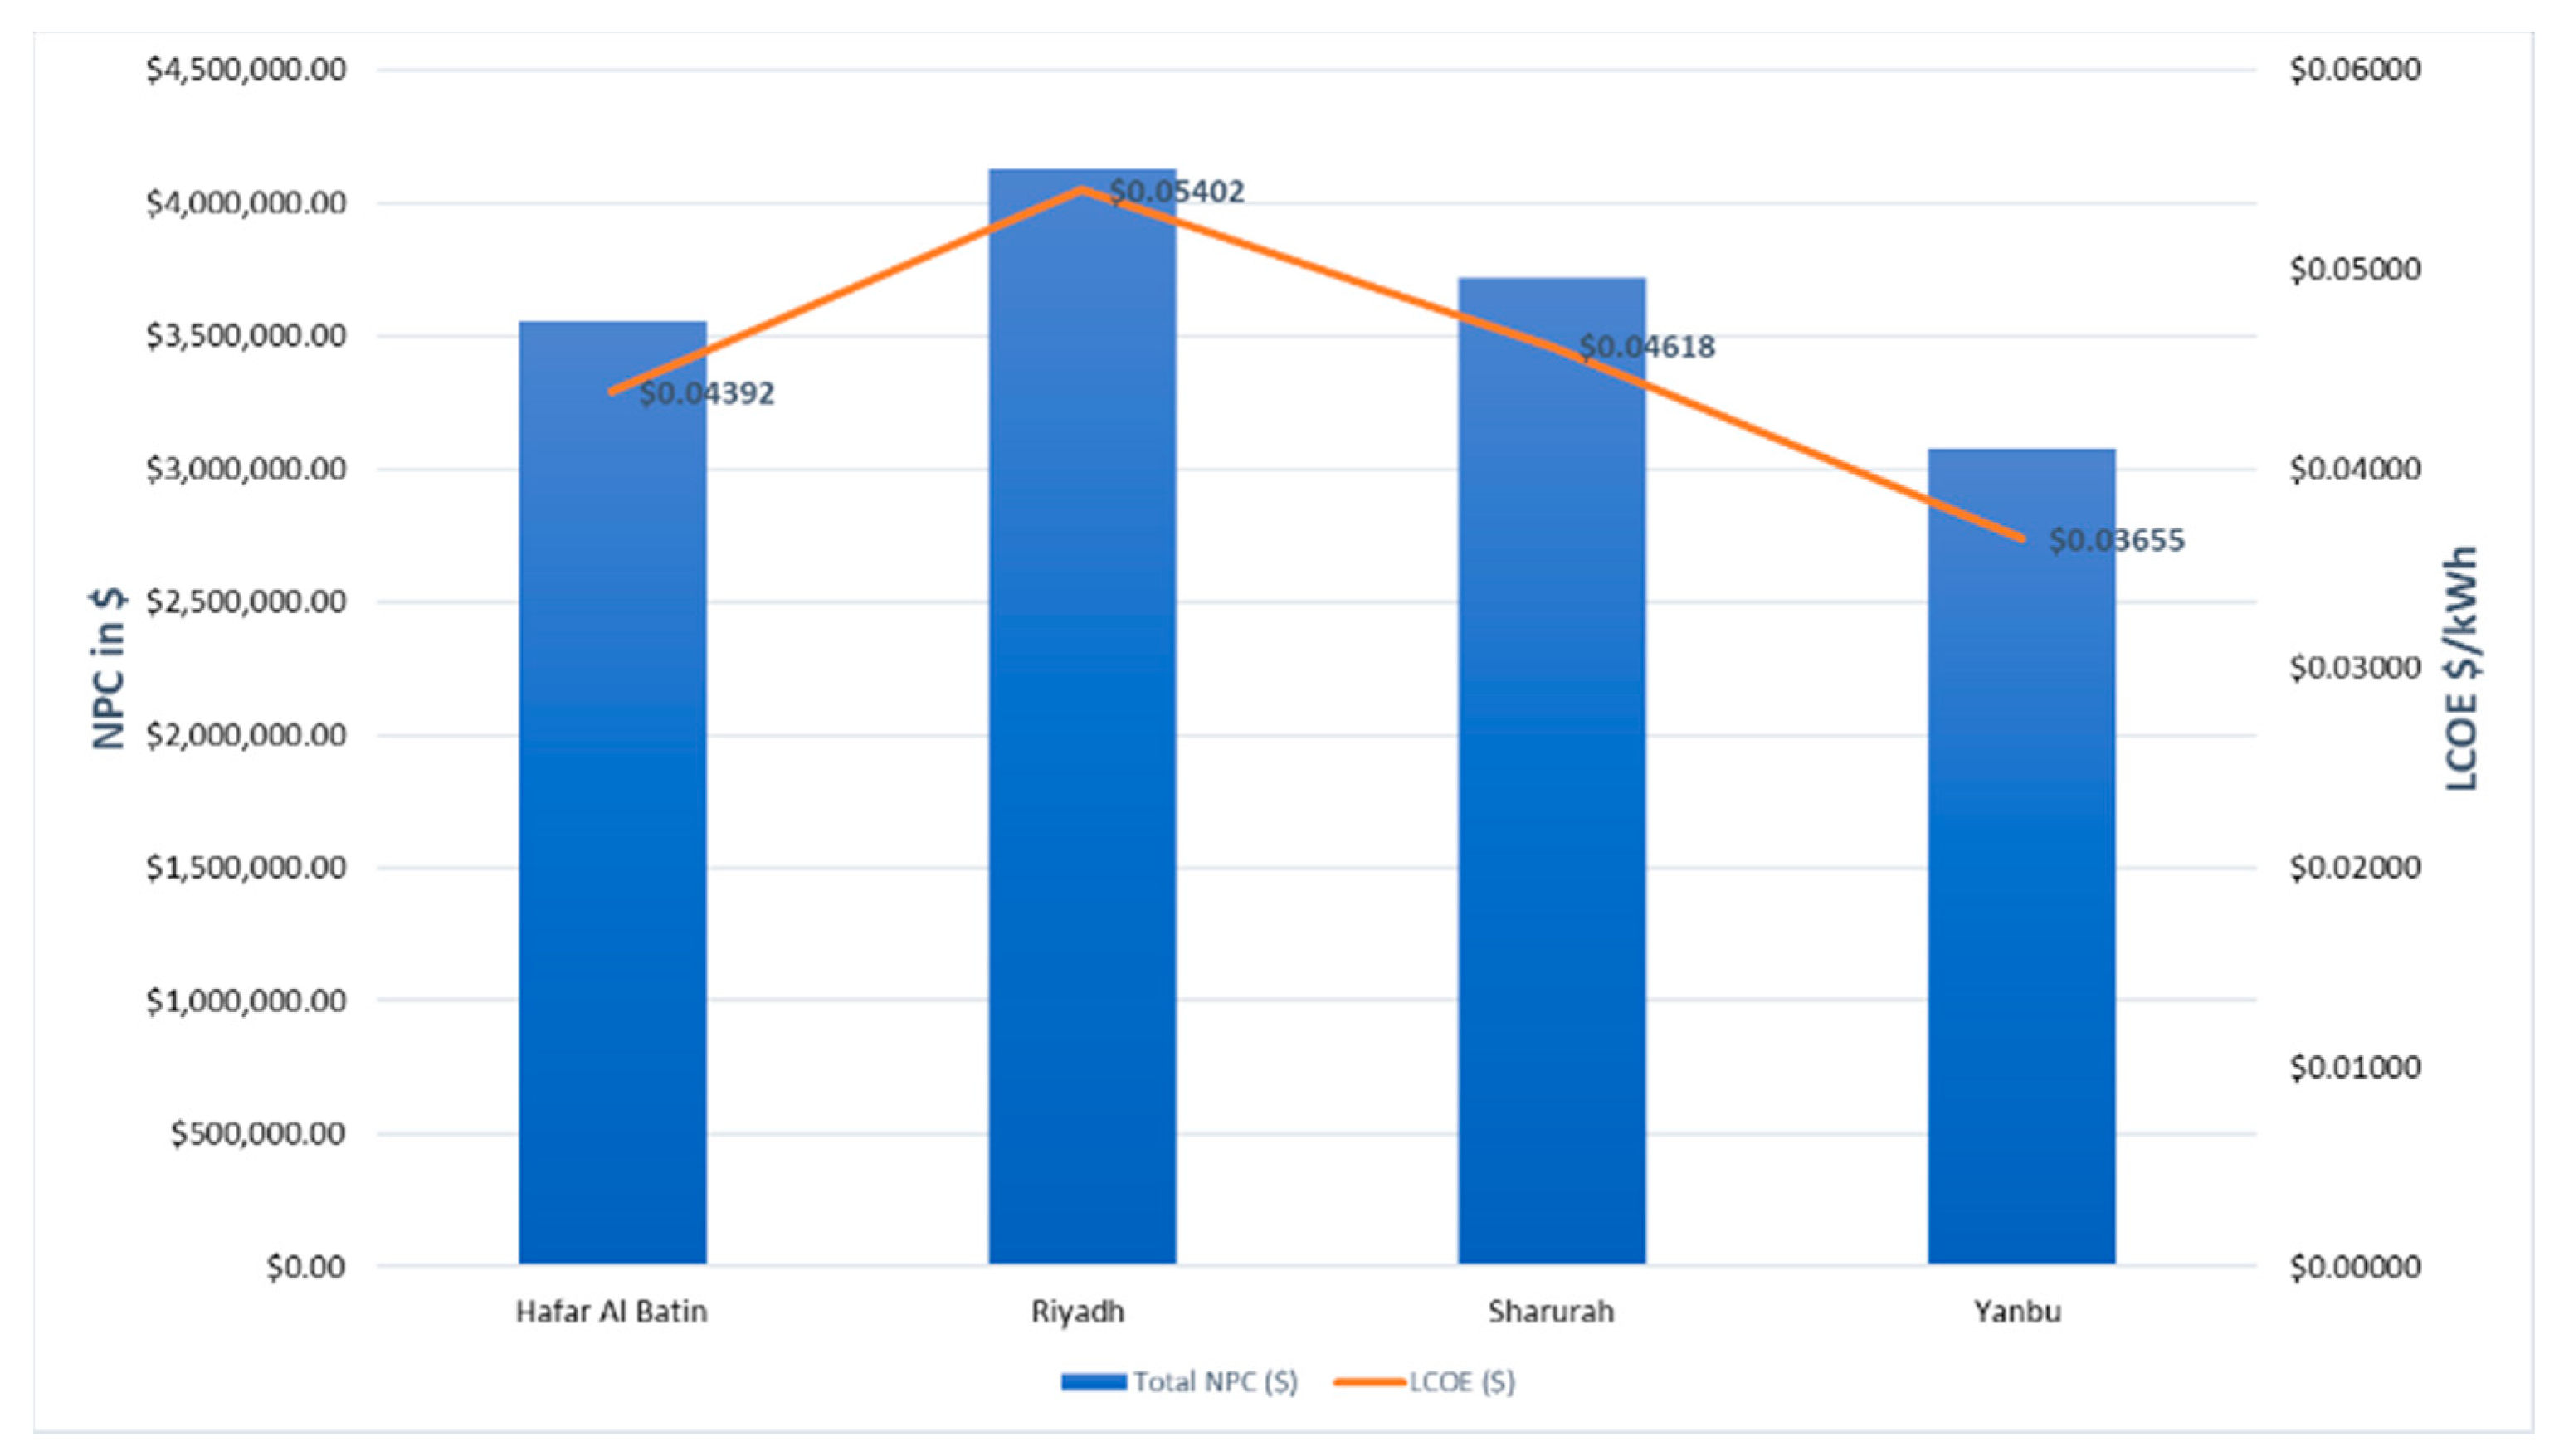
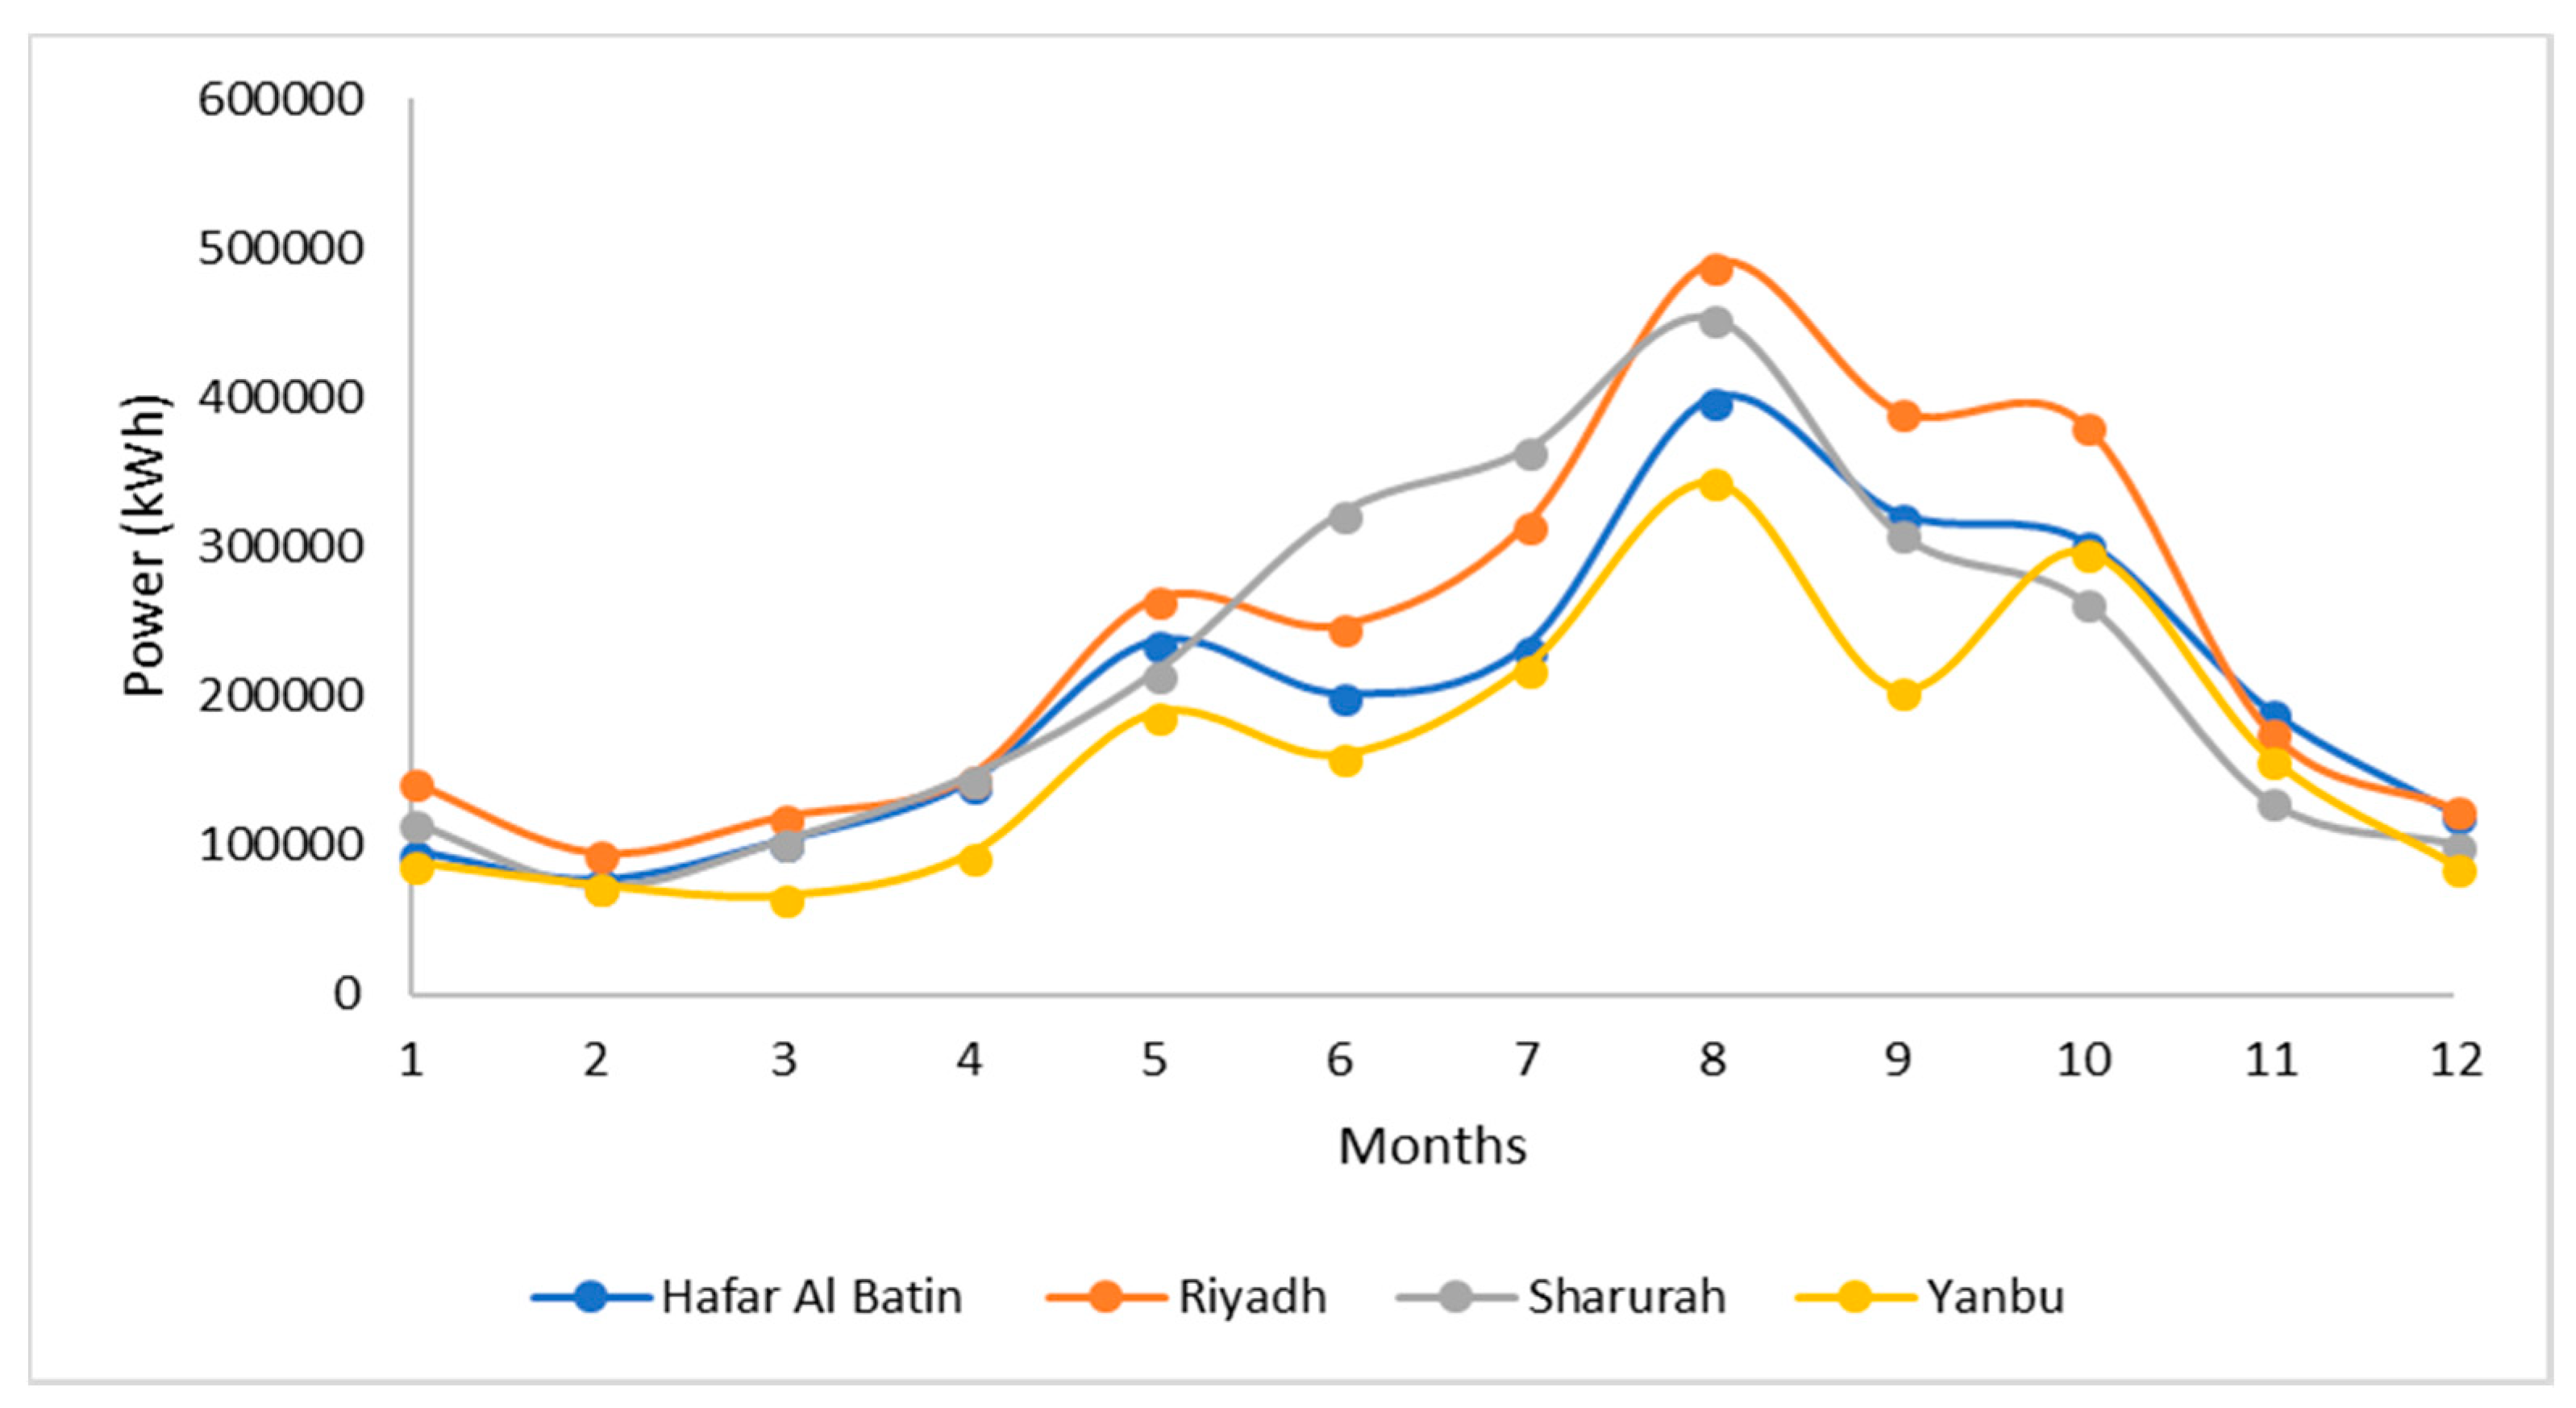
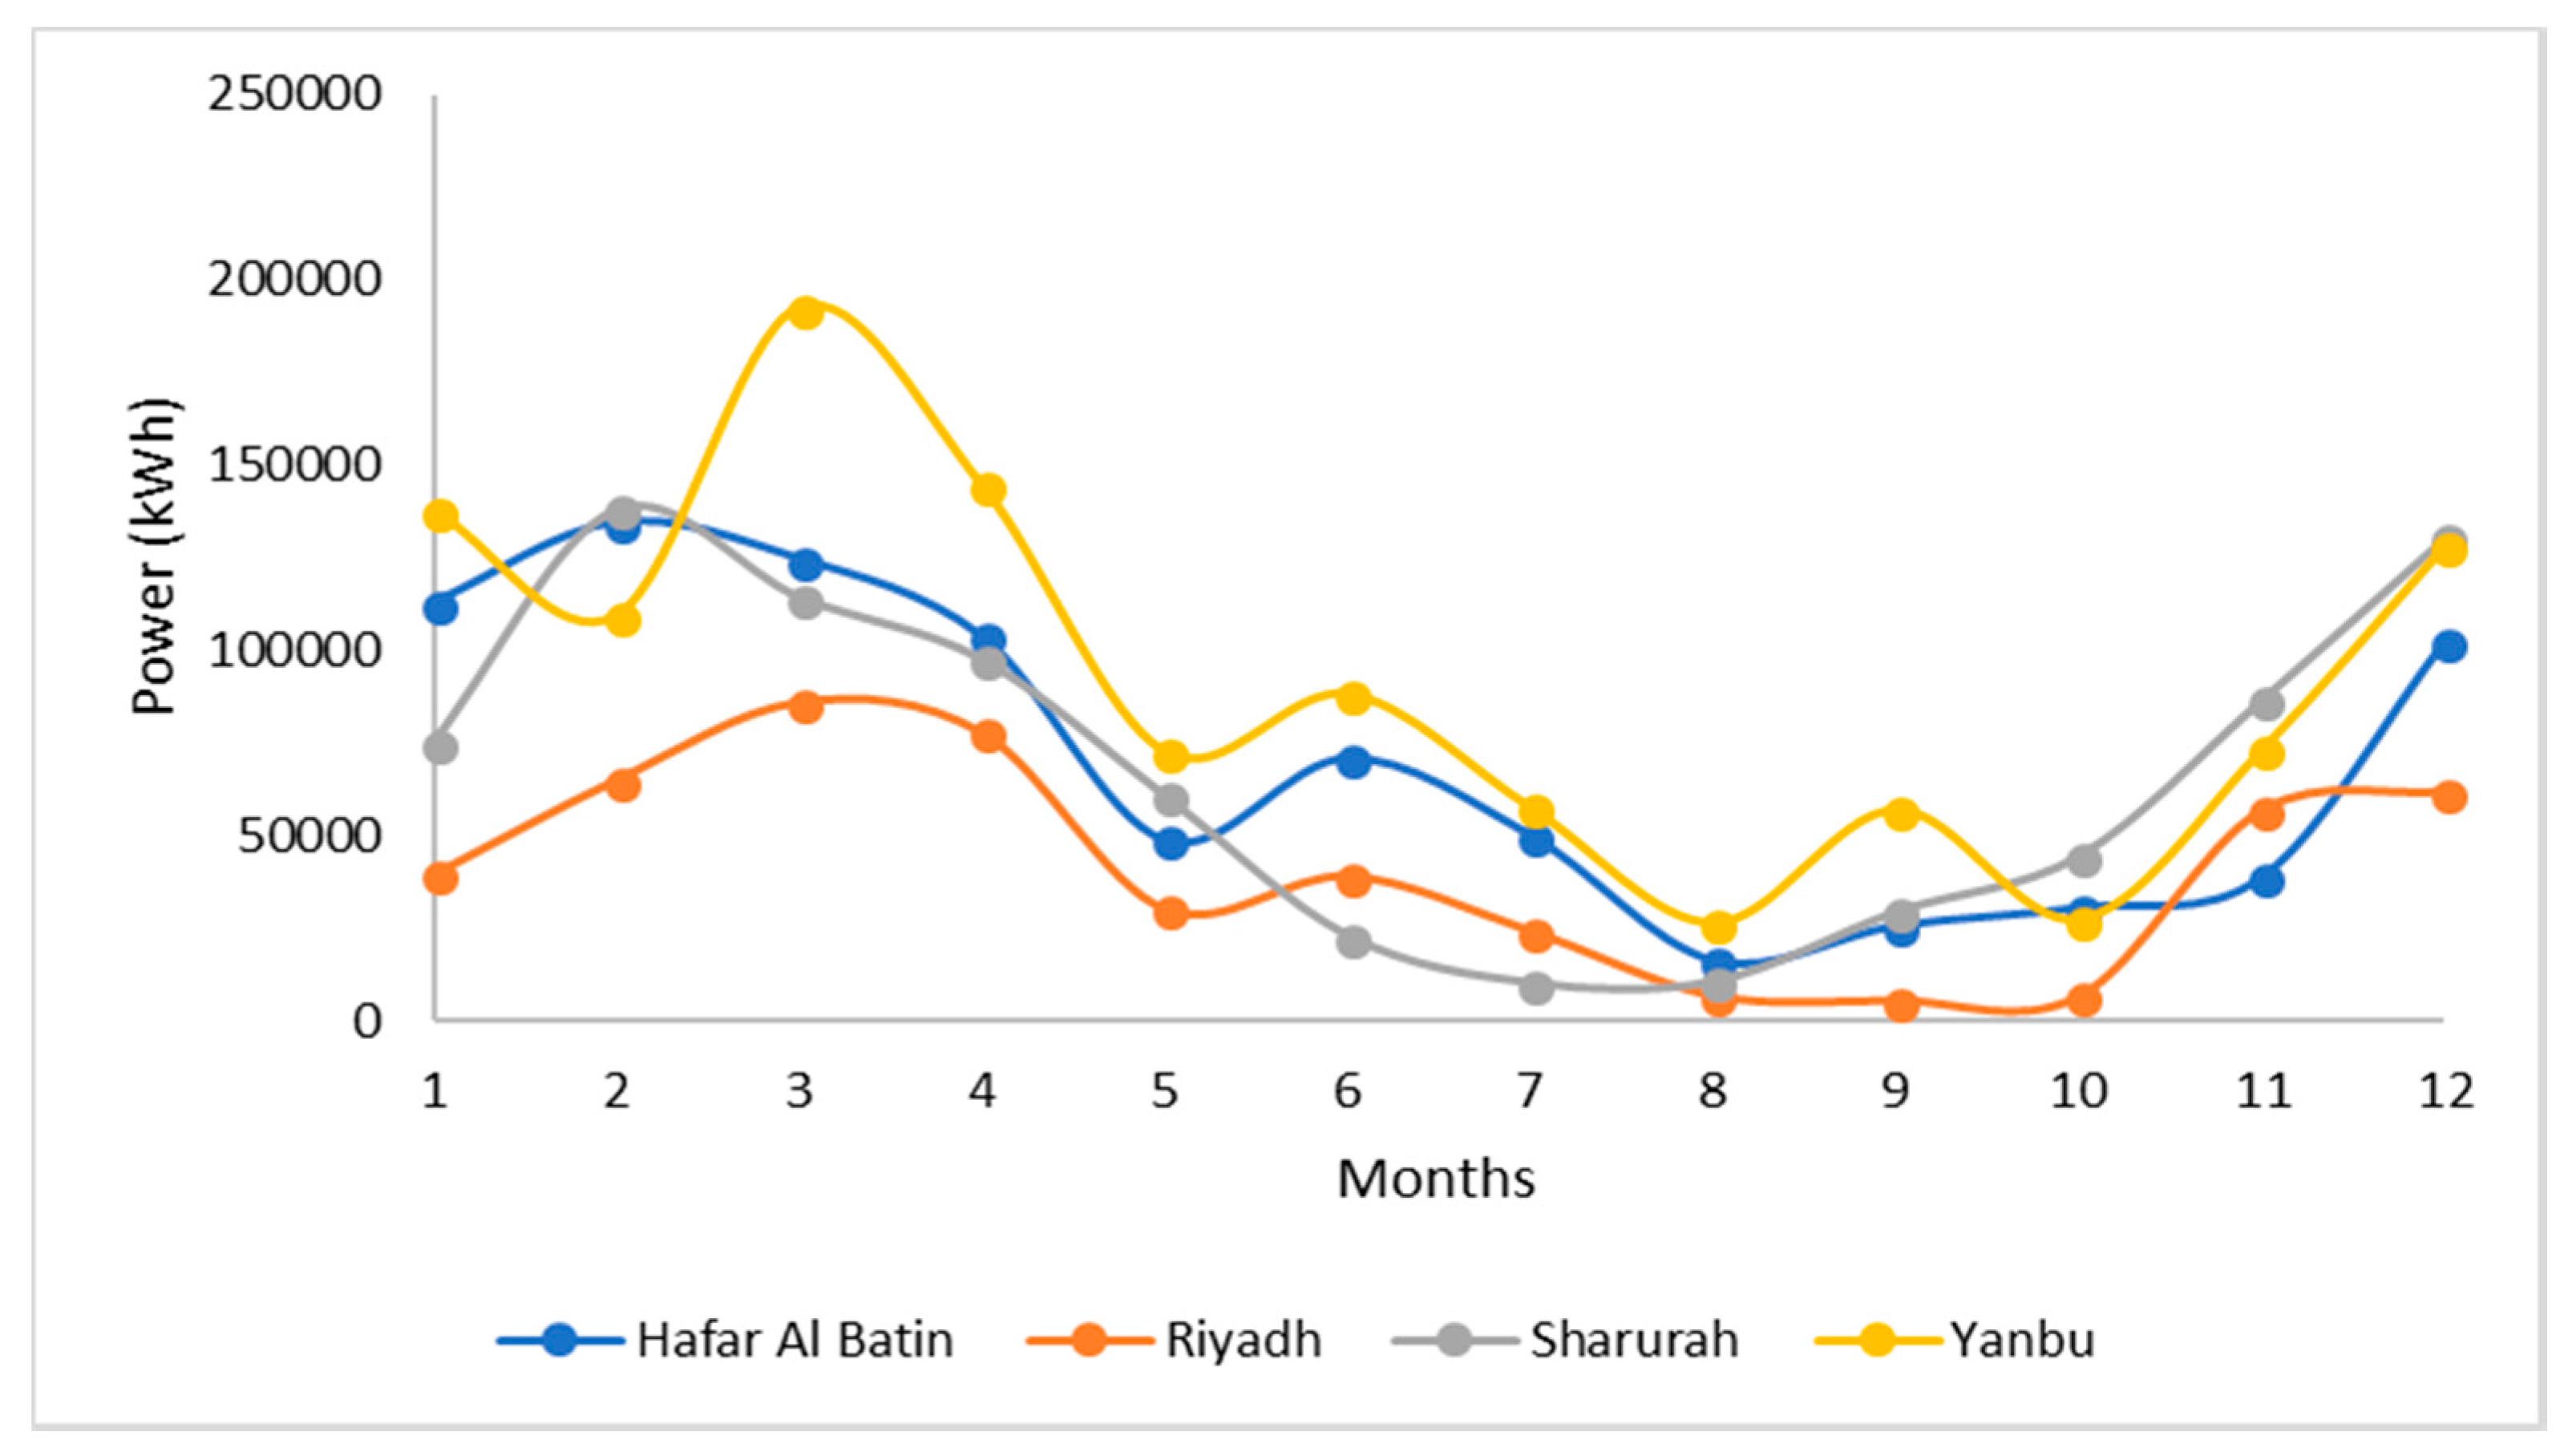
The effects of changing renewable energy resources on the power generation are analyzed. Four different grid-connected hybrid systems have the same components and the costs are considered. Since every location has a different wind speed and solar radiation intensity over the year, different configurations of power generation at each location are expected to meet the same load demand requirements. The simulation results show that the solar and wind resources potential at Yanbu city, leads to the minimum LCOE of $0.03655 followed by Hafar Albatin, Sharurah, and Riyadh. The system’s capacity factors at each location also show that Yanbu city has the highest renewable energy output power, particularly the power from the wind turbine which that represents 53% out of the total annual generation. The systems performance at Hafar Albatin and Sharurah shows reasonable power production and lower CO2 emissions even though the systems have high NPC and LCOE. However, the solar PV and wind turbine capacity factors at Riyadh city are low compared to other systems. Therefore, it is not economically viable.
The analyses presented in this study can have a strong influence on the selection of technology and location of solar and wind energy power plants in KSA. Additionally, the proposed system design and techno-economic analysis could be applied to any location worldwide to improve the performance of grid-connected hybrid solar/wind considering the variation of the components’ costs, load profile, and the sites’ metrological conditions. We should note that using long-term data analysis would help to understand the inter-annual variability of renewable energy resources that limit this study. Therefore, continuing the operations of renewable energy monitoring stations is needed to assemble data for long-term forecasting. In future research, performance analysis of a large-scale hybrid grid-connected solar-wind-biomass will be investigated for various locations with different metrological conditions.

Author Contributions

The main idea of this paper was proposed by Y.Z.A. All authors contributed to the data analysis and writing of the final manuscript. All authors read and approved the final manuscript.

Funding

This research received no external funding

Acknowledgments

The authors acknowledge the King Abdullah City of Atomic and Renewable Energy (KACARE) for facilitating access to the wind and solar Atlas of Saudi Arabia at (http://rratlas.kacare.gov.sa).

Conflicts of Interest

The authors declare no conflict of interest.

References

  1. Pierru, A.; Rioux, B.; Matar, W.; Murphy, F. Renewable Energy Markets and Prospects by Region. 2011. Available online: http://www.iea.org/publications/freepublications/publication/Renew_Regions.pdf (accessed on 20 March 2018).
  2. Wesseh, P.K., Jr.; Lin, B. Can African countries ef fi ciently build their economies on renewable energy? Renew. Sustain. Energy Rev. 2016, 54, 161–173. [Google Scholar] [CrossRef]
  3. Schwerho, G.; Sy, M. Financing renewable energy in Africa—Key challenge of the sustainable development goals. Renew. Sustain. Energy Rev. 2017, 75, 393–401. [Google Scholar] [CrossRef]
  4. Alkhathlan, K.; Javid, M. Carbon emissions and oil consumption in Saudi Arabia. Renew. Sustain. Energy Rev. 2015, 48, 105–111. [Google Scholar] [CrossRef]
  5. Aljebrin, M. Revisiting Electricity Consumption Function: The Case of Saudi Arabia. Bus. Econ. J. 2014, 5, 124. [Google Scholar] [CrossRef]
  6. Alharthi, Y.Z.; Siddiki, M.K.; Chaudhry, G.M. The New Vision and the Contribution of Solar Power in the Kingdom of Saudi Arabia Electricity Production. In Proceedings of the Ninth Annual IEEE Green Technologies Conference (GreenTech), Denver, CO, USA, 29–31 March 2017; pp. 83–88. [Google Scholar]
  7. Saudi Electricity Data Report from 2000–2014. 2015. Available online: https://www.se.com.sa/en-us/Pages/ElectricalData.aspx (accessed on 28 December 2017).
  8. Fattouh, B. Summer Again: The Swing in Oil Demand in Saudi Bassam Fattouh. Available online: https://www.oxfordenergy.org/publications/summer-again-the-swing-in-oil-demand-in-saudi-arabia/ (accessed on 10 October 2018).
  9. Matar, W.; Murphy, F.; Pierru, A.; Rioux, B. Lowering Saudi Arabia’s fuel consumption and energy system costs without increasing end consumer prices. Energy Econ. 2015, 49, 558–569. [Google Scholar] [CrossRef]
  10. Almasoud, A.H.; Gandayh, H.M. Future of solar energy in Saudi Arabia. J. King Saud Univ. Eng. Sci. 2015, 27, 153–157. [Google Scholar] [CrossRef]
  11. BP Statistical Review of World Energy. 2016. Available online: https://www.bp.com/ (accessed on 15 March 2018).
  12. Ramli, M.A.M.; Hiendro, A.; Al-turki, Y.A. Techno-economic energy analysis of wind/solar hybrid system: Case study for western coastal area of Saudi Arabia. Renew. Energy 2016, 91, 374–385. [Google Scholar] [CrossRef]
  13. Al-Sharafi, A.; Sahin, A.Z.; Ayar, T.; Yilbas, B.S. Techno-economic analysis and optimization of solar and wind energy systems for power generation and hydrogen production in Saudi Arabia. Renew. Sustain. Energy Rev. 2017, 69, 33–49. [Google Scholar] [CrossRef]
  14. Al, H.; Kassem, A.; Awasthi, A.; Komljenovic, D.; Al-haddad, K. A multicriteria decision making approach for evaluating renewable power generation sources in Saudi Arabia. Sustain. Energy Technol. Assess. 2016, 16, 137–150. [Google Scholar]
  15. Munawwar, S.; Ghedira, H. A review of renewable energy and solar industry growth in the GCC region. Energy Procedia 2015, 57, 3191–3202. [Google Scholar] [CrossRef]
  16. Al, A.E. Pairing between Sites and Wind Turbines for Saudi Arabia Sites. Arab. J. Sci. Eng. 2014, 39, 6225–6233. [Google Scholar]
  17. KACAR Renewable Resource Atlas. Available online: https://rratlas.kacare.gov.sa/RRMMPublicPortal/ (accessed on 25 June 2018).
  18. Almarshoud, A.F. Performance of solar resources in Saudi Arabia. Renew. Sustain. Energy Rev. 2016, 66, 694–701. [Google Scholar] [CrossRef]
  19. Renewables 2016 Global Status Report REN21. 2016. Available online: http://www.ren21.net/about-ren21/annual-reports/ (accessed on 2 March 2018).
  20. Zell, E.; Gasim, S.; Wilcox, S.; Katamoura, S.; Stoffel, T.; Shibli, H.; Engel-Cox, J.; AlSubieb, M. Assessment of solar radiation resources in Saudi Arabia. Sol. Energy 2015, 119, 422–438. [Google Scholar] [CrossRef]
  21. Hepbasli, A.; Alsuhaibani, Z. A key review on present status and future directions of solar energy studies and applications in Saudi Arabia. Renew. Sustain. Energy Rev. 2011, 15, 5021–5050. [Google Scholar] [CrossRef]
  22. Ramli, M.A.M.; Hiendro, A.; Sedraoui, K.; Twaha, S. Optimal sizing of grid-connected photovoltaic energy system in Saudi Arabia. Renew. Energy 2015, 75, 489–495. [Google Scholar] [CrossRef]
  23. Ramli, M.A.M.; Twaha, S.; Ishaque, K.; Al-Turki, Y.A. A review on maximum power point tracking for photovoltaic systems with and without shading conditions. Renew. Sustain. Energy Rev. 2017, 67, 144–159. [Google Scholar] [CrossRef]
  24. Ramli, M.A.M.; Prasetyono, E.; Wicaksana, R.W.; Windarko, N.A.; Sedraoui, K.; Al-Turki, Y.A. On the investigation of photovoltaic output power reduction due to dust accumulation and weather conditions. Renew. Energy 2016, 99, 836–844. [Google Scholar] [CrossRef]
  25. Rehman, S.; Ahmad, A. Assessment of wind energy potential for coastal locations of the Kingdom of Saudi Arabia. Energy 2004, 29, 1105–1115. [Google Scholar] [CrossRef]
  26. Rehman, S.; Halawani, T.O.; Mohandes, M. Wind power cost assessment at twenty locations in the Kingdom of Saudi Arabia. Renew. Energy 2003, 28, 573–583. [Google Scholar] [CrossRef]
  27. Al-Abbadi, N.M. Wind energy resource assessment for five locations in Saudi Arabia. Renew. Energy 2005, 30, 1489–1499. [Google Scholar] [CrossRef]
  28. Eltamaly, A.M.; Farh, H.M. Wind energy assessment for five locations in Saudi Arabia. J. Renew. Sustain. Energy 2012, 4, 022702. [Google Scholar] [CrossRef]
  29. Baseer, M.A.; Meyer, J.P.; Alam, M.M.; Rehman, S. Wind speed and power characteristics for Jubail industrial city, Saudi Arabia. Renew. Sustain. Energy Rev. 2015, 52, 1193–1204. [Google Scholar] [CrossRef] [Green Version]
  30. Baseer, M.A.; Meyer, J.P.; Rehman, S.; Alam, M.M. Wind power characteristics of seven data collection sites in Jubail, Saudi Arabia using Weibull parameters. Renew. Energy 2017, 102, 35–49. [Google Scholar] [CrossRef]
  31. Shaahid, S.M.; Al-Hadhrami, L.M.; Rahman, M.K. Economic feasibility of development of wind power plants in coastal locations of Saudi Arabia—A review. Renew. Sustain. Energy Rev. 2013, 19, 589–597. [Google Scholar] [CrossRef]
  32. Solyali, D.; Altunç, M.; Tolun, S.; Aslan, Z. Wind resource assessment of Northern Cyprus. Renew. Sustain. Energy Rev. 2016, 55, 180–187. [Google Scholar] [CrossRef]
  33. Fazelpour, F.; Markarian, E.; Soltani, N. Wind energy potential and economic assessment of four locations in Sistan and Balouchestan province in Iran. Renew. Energy 2017, 109, 646–667. [Google Scholar] [CrossRef]
  34. Dabbaghiyan, A.; Fazelpour, F.; Abnavi, M.D.; Rosen, M.A. Evaluation of wind energy potential in province of Bushehr, Iran. Renew. Sustain. Energy Rev. 2016, 55, 455–466. [Google Scholar] [CrossRef]
  35. Allouhi, A.; Zamzouma, O.; Islamb, M.R.; Saidurc, R.; Kousksoud, T.; Jamila, A.; Derouicha, A. Evaluation of wind energy potential in Morocco’s coastal regions. Renew. Sustain. Energy Rev. 2017, 72, 311–324. [Google Scholar] [CrossRef]
  36. Al Garni, H.Z.; Awasthi, A.; Ramli, M.A.M. Optimal design and analysis of grid-connected photovoltaic under different tracking systems using HOMER. Energy Convers. Manag. 2018, 155, 42–57. [Google Scholar] [CrossRef]
  37. Saudi Electrcity Company Annual Report. Available online: https://www.se.com.sa/en-us/Pages/AnnualReports.aspx (accessed on 15 July 2018).
  38. Alyahya, S.; Irfan, M.A. Analysis from the new solar radiation Atlas for Saudi Arabia. Sol. Energy 2015, 130, 116–127. [Google Scholar] [CrossRef]
  39. Pishgar-Komleh, S.H.; Keyhani, A.; Sefeedpari, P. Wind speed and power density analysis based on Weibull and Rayleigh distributions (a case study: Firouzkooh county of Iran). Renew. Sustain. Energy Rev. 2015, 42, 313–322. [Google Scholar] [CrossRef]
  40. Saleh, H.; Abou El-Azm Aly, A.; Abdel-Hady, S. Assessment of different methods used to estimate Weibull distribution parameters for wind speed in Zafarana wind farm, Suez Gulf, Egypt. Energy 2012, 44, 710–719. [Google Scholar] [CrossRef]
  41. Chaurasiya, P.K.; Ahmed, S.; Warudkar, V. Comparative analysis of Weibull parameters for wind data measured from met-mast and remote sensing techniques. Renew. Energy 2018, 115, 1153–1165. [Google Scholar] [CrossRef]
  42. Chaurasiya, P.K.; Ahmed, S.; Warudkar, V. Study of different parameters estimation methods of Weibull distribution to determine wind power density using ground based Doppler SODAR instrument. Alex. Eng. J. 2017. [Google Scholar] [CrossRef]
  43. Ismail, M.S.; Moghavvemi, M.; Mahlia, T.M.I.; Muttaqi, K.M.; Moghavvemi, S. Effective utilization of excess energy in standalone hybrid renewable energy systems for improving comfort ability and reducing cost of energy: A review and analysis. Renew. Sustain. Energy Rev. 2015, 42, 726–734. [Google Scholar] [CrossRef] [Green Version]
  44. Ramli, M.A.M.; Twaha, S. Analysis of renewable energy feed-in tariffs in selected regions of the globe: Lessons for Saudi Arabia. Renew. Sustain. Energy Rev. 2015, 45, 649–661. [Google Scholar] [CrossRef]
  45. WinWinDWWD-1 D60 1MW Turbine-Models. Available online: https://en.wind-turbine-models.com/turbines/486-winwind-wwd-1-d60 (accessed on 20 May 2018).
  46. Jamalaiah, A.; Raju, C.P.; Srinivasarao, R. Optimization and operation of a renewable energy based pv-fc-micro grid using homer. In Proceedings of the 2017 International Conference on Inventive Communication and Computational Technologies (ICICCT), Coimbatore, India, 10–11 March 2017; pp. 450–455. [Google Scholar]
Figure 1. Peak Load Versus Generation Capacity for (SEC) [37].
Sustainability 10 03690 g001
Figure 2. Development of Fuels Consumed in SEC Power Plants from 2000 to 2014 [6].
Sustainability 10 03690 g002
Figure 3. Solar and Wind Resource Monitoring Stations, by Province (RRATLAS).
Sustainability 10 03690 g003
Figure 4. Average Monthly DHI, DNI, and GHI at the selected stations.
Sustainability 10 03690 g004aSustainability 10 03690 g004b
Figure 5. Annual average daily total of DNI, GHI, and DHI.
Sustainability 10 03690 g005
Figure 6. Wind rose diagrams for the selected stations.
Sustainability 10 03690 g006
Figure 7. Weibull distribution of the measured data at 80 m.
Sustainability 10 03690 g007
Figure 8. Cumulative density of wind speed at 80 m.
Sustainability 10 03690 g008
Figure 9. Monthly mean wind speed in m/s.
Sustainability 10 03690 g009
Figure 10. Design configuration of Wind/PV grid-connected system.
Sustainability 10 03690 g010
Figure 11. The monthly average load profile applied.
Sustainability 10 03690 g011
Figure 12. Grid daily schedule rate for all months.
Sustainability 10 03690 g012
Figure 13. Defined rates during the day.
Sustainability 10 03690 g013
Figure 14. Wind turbine power curve.
Sustainability 10 03690 g014
Figure 15. Total annual electricity production from the grid, PV, and wind turbine.
Sustainability 10 03690 g015
Figure 16. One-week generation of grid along with PV/wind hybrid system to maintain load demand.
Sustainability 10 03690 g016aSustainability 10 03690 g016b
Figure 17. Saved CO2 emission by each system.
Sustainability 10 03690 g017
Figure 18. Solar PV and wind capacity factor in each city.
Sustainability 10 03690 g018
Figure 19. Cumulative Discounted Cash Flow for all Systems and Base Case.
Sustainability 10 03690 g019
Figure 20. Systems NPC and LCOE.
Sustainability 10 03690 g020
Figure 21. Monthly energy purchased from grid.
Sustainability 10 03690 g021
Figure 22. Monthly energy sold to grid.
Sustainability 10 03690 g022
Figure 23. Capital cost versus the total cost of energy produced by the PV/Wind system at the grid price.
Sustainability 10 03690 g023
Table 1. Solar monitoring stations details.
S. NOMonitoring SitesTierLongitude (E)Latitude (N)Operating Since
1Hafar Albatin245.957028.33206 October 2013
2Riyadh246.616324.723515 October 2014
3Yanbu1C38.204624.986529 October 2014
4Sharurah247.086117.47583 September 2013
Table 2. Wind monitoring stations details.
S. NOSiteLongitude (E)Latitude (N)Elevation (m)Data Collection Start
1Riyadh46.352724.576492413 August 2014
2Yanbu37.484424.34201818 August 2014
3Sharurah47.073117.323476426 August 2014
4Hafar Albatin44.203128.268836024 August 2014
Table 3. Annual estimated Weibull parameters.
SiteMean (m/s)Standard DeviationAverage WPD (W/m2)KC (m/s)R2
Riyadh City Site A6.303.27292.0227.110.976
Yanbu8.844.70833.781.959.980.980
Sharurah7.073.78426.201.957.980.981
Hafar Albatin7.653.94519.272.028.640.982
Table 4. Components Specifications.
ComponentsParametersValueUnit
PV (CS6K-280M-T4-4BB)Capacity1kW
Life time25Year
Capital1640$/kW
Replacement1640$/kW
O&M10$/yr
Dual axis tracker1000$
α P −0.50%/°C
f P V 80%
Efficiency18%
ConverterCapacity1kW
Life time15Year
Efficiency95%
Capital300$
Replacement300$
Wind TurbineInitial Capacity1,300,000.0$
Replacement1,300,000.0$
O&M1200$/yr
Life time25Year
Hub Height80m
Applied Losses15%
Capacity1MW
Economical parametersProject life time25Year
Real Discount Rate6%
PV/wind SizePV0.5MW
Wind Turbine1MW

