Characteristics and Trends of Research on New Energy Vehicle Reliability Based on the Web of Science

School of Management & Economics, Beijing Institute of Technology, Beijing 100081, China
*
Author to whom correspondence should be addressed.
Sustainability 2018, 10(10), 3560; https://doi.org/10.3390/su10103560
Submission received: 31 August 2018
/
Revised: 24 September 2018
/
Accepted: 25 September 2018
/
Published: 5 October 2018
Abstract
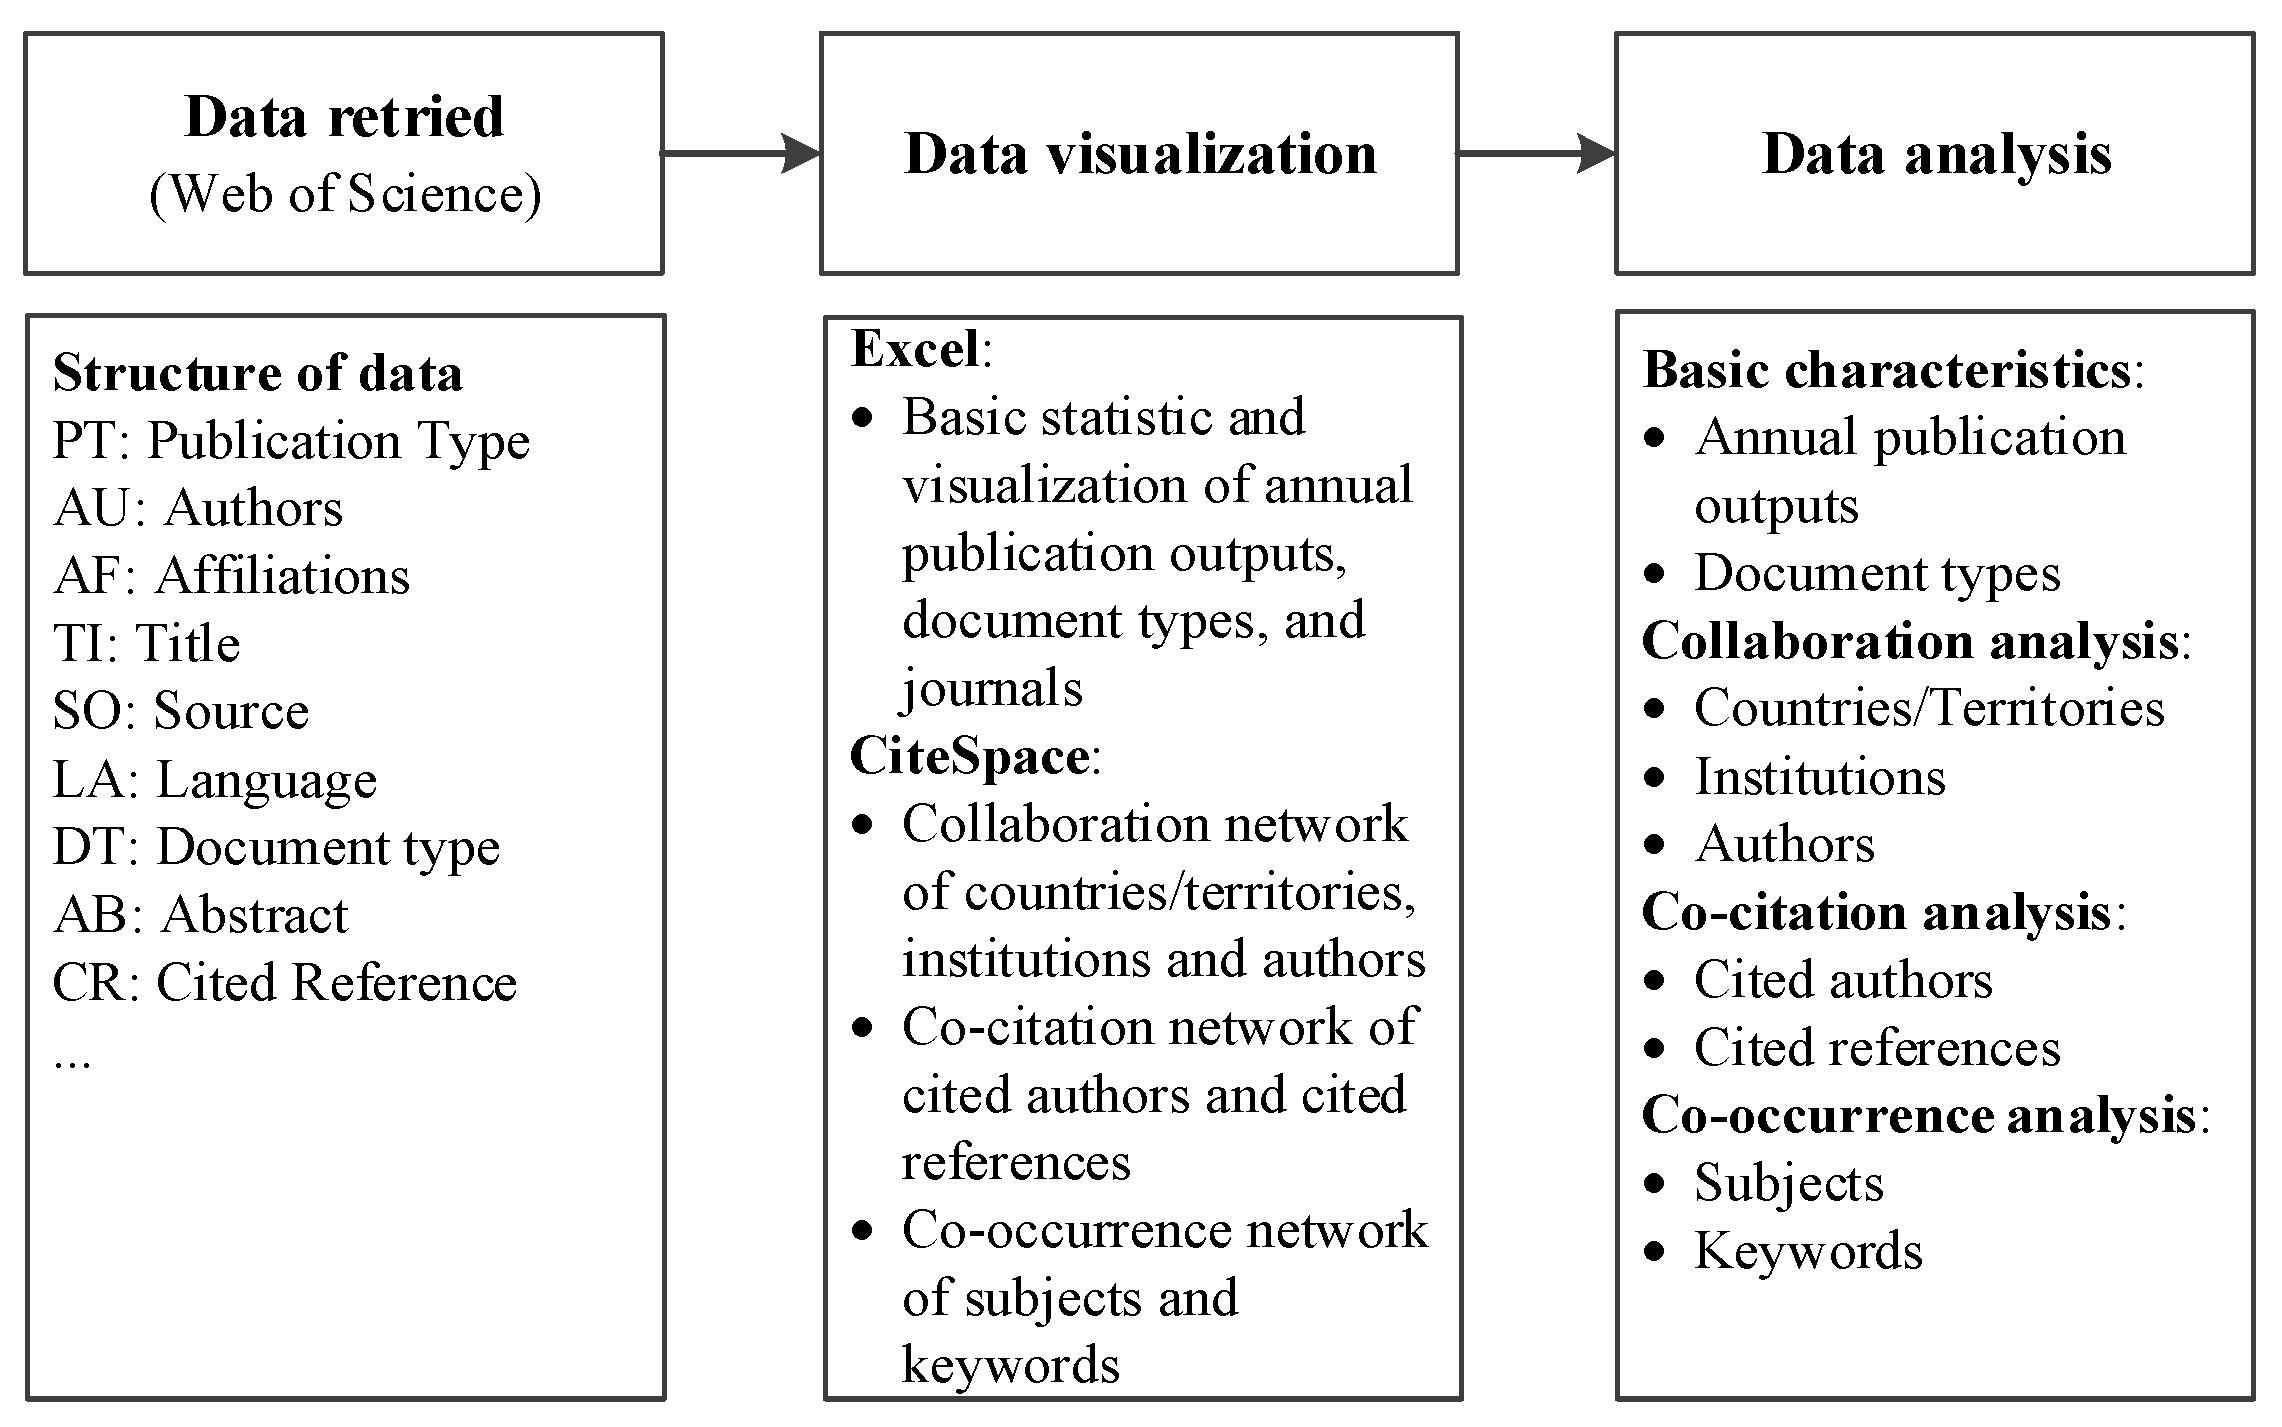
:In order to satisfy the increasing energy demand and deal with the environmental problem caused by the conventional energy vehicle; the new energy vehicle (NEV), especially the electric vehicle (EV), has attracted increasing attention and the corresponding research has developed rapidly in recent years. The electric vehicle requires a battery with high energy density and frequent charging. In order to ensure high performance of the electric vehicle; the reliability of its charging system is extremely important. In this paper; an overview of the research on electric vehicle charging system reliability from 1998 to 2017 is presented from a bibliometric perspective. This study provides a comprehensive analysis of the current research climate and the emerging trends from the following four aspects: basic characteristics of publication outputs; including annual publication outputs and document types; collaboration analysis of countries/territories; institutions and authors; co-citation analysis of cited authors and cited references; co-occurrence analysis of subjects and keywords. By using CiteSpace; the collaboration relationship; co-citation and co-occurrence networks are shown clearly. According to the analysis results; studies in this research field will keep developing rapidly in the near future and several future research directions are proposed in the conclusions.
1. Introduction
Currently, the primary energy sources of the demand-supply cycle for transportation are still petroleum products, such as compressed natural gas (CNG) and liquefied petroleum gas (LPG) [1]. However, these naturally available resources cannot satisfy the increasing energy demand, thereby leading to much higher fuel prices for conventional energy vehicles. On the other hand, the exhaust gas emitted by automobiles makes up a large part of the total greenhouse gas (GHG) emissions, which can result in air pollution and global warming [2]. For example, in the urban areas of China, the automobile exhaust, such as carbon monoxides, hydrocarbons, and nitrogen oxides, currently comprises 70–80% of air pollution [3]. Therefore, scientists and researchers are devoted to developing renewable energy vehicles to cope with the deficiency of natural energy reserves, the high fuel prices, and the environmental problem [4,5,6]. Substantial research has been carried out in recent years [7,8,9,10]. The electric vehicle (EV), one of the most significant categories of new energy vehicles, has been considered as a suitable replacement for the conventional energy vehicle [11,12]. EVs are usually classified into three main categories: battery electric vehicles (BEVs), hybrid electric vehicles (HEVs) and fuel cell electric vehicle (FCEVs) [13]. As a typical type of EV, a BEV has rechargeable battery packs which store chemical energy, instead of an internal combustion engine (ICE), such as fuel cell or fuel tank. An HEV involves both conventional ICE system and electric propulsion system, while an FCEV uses a fuel cell, instead of a battery, or in combination with a battery or super-capacitor, to power its on-board electric motor.
Many countries have enacted encouragement policies to promote the development of the EVs because of its energy saving and environmental friendliness. For example, the US Department of Energy (DoE) published the EV Everywhere Grand Challenge Blueprint in 2013, which set the target that every American family can afford a plug-in electric vehicle (PEV) by 2022. [14]. In China, the Industry Development Plan of Energy Saving and New Energy Vehicles announced that the cumulative production and sales volume of EVs were aimed to be at least 5 million until 2020 [3]. Germany launched a campaign to put 1 million EVs on road by 2020 and planned to provide $705 million of financial support [15]. Stimulated by such government support policies, EVs are increasingly favored by the market [16]. For example, the sales of EVs in China exceeded 500,000 in 2016 [3], and it accounted for 22% of the new car sales in the first quarter of 2015 in Norway [16]. The global market of EV is 1.7 million units in 2012, which is predicted to increase to 5.3 million units in 2020 [17].
The technologies of EV are still evolving, and the charging technology is one of the most important ones. The EV requires a battery with high energy density to ensure enough mileage, so many studies focus on the improvement of battery energy density [18,19,20]. However, due to the immature technology, the energy storage capacity of an EV battery is limited and thereby frequent charging is needed. Therefore, to satisfy different charging demands, the type of charge can be classified into three main categories according to its charging speed: slow charging, fast charging, and rapid charging [21]. Additionally, the type of charge can also be classified into static charging and dynamic charging. The static charging of EVs allows users to charge their vehicles at home or office parking [22], while the dynamic charging is used to power the moving EVs [23]. Recently, the study of battery chargers for EVs, especially for PHEVs, has received a lot of attention [24,25,26]. For instance, paper [24] developed a novel on-board battery charger which can operate in two directions, with the objective of minimizing the losses of power from/into the smart grid. Moreover, because of its convenience and efficiency, the wireless charger for EVs or PHEVs has become a popular type of battery charger. A comparison of characteristics of several different types of wireless chargers is discussed in [26]. However, the EV battery and its frequent charging are often accompanied by many reliability problems. For example, both the performance and life of the lithium-ion battery, which is widely applied for many EVs, are affected by operating temperature. Specifically, the available energy of a lithium-ion battery at −20 °C is only 60% of the room-temperature, while the high temperature will cause greater capacity loss because of the amplified aging effects [27].
Considering that the charging system has an important effect on the performance of the EV, high reliability of the charging system should be ensured. System reliability is a measure of how well a system meets its design objective [28]. The general reliability can be divided into five parts: (narrow) reliability, maintainability, testability, supportability, and safety. Reliability and maintainability occupy a great part of the reliability theory. Reliability is usually defined as the ability of an item to perform a required function under given environmental and operational conditions and for a stated period of time [29]. As for maintainability, two primary maintenance strategies are preventive maintenance and corrective maintenance. The proper application of maintenance strategies can improve the system reliability and avoid some losses caused by unexpected failures [30,31,32]. Many studies related to the electric vehicle charging system reliability have been conducted [33,34,35,36]. For example, the safety and reliability problems were studied for different aspects in the research of wireless charging systems [37]. Additionally, a systematic charging service reliability evaluation algorithm for plug-in EVs from the distribution network aspect was proposed [38]. Several studies relevant to maintenance policies are presented as follows. An optimal operation and maintenance model of electric vehicle batteries in smart grids considering vehicle-to-grid technology was studied [39]. A real-time estimation of battery aging was presented to strengthen the most advanced eco-driving concept, and a corresponding battery maintenance strategy is constructed for potential EV sustainability [40]. Another hot topic is the optimal distribution of charging facilities [41,42,43]. For example, a hybrid algorithm was proposed to optimize the allocation (siting and sizing) of charging station infrastructure in a city of India, and this algorithm led to better performance and improvement in the quality of solution compared with other two algorithms [43].
In order to present an overview of the scientific outputs of electric vehicle charging system reliability and analyze the hot topics, important articles, and emerging trends, the bibliometric method is applied. Bibliometrics is a quantitative tool to analyze the patterns in scientific literature to understand the knowledge structure and the emerging trends of a specific research area [44]. Bibliometric methods are used in many research fields to assess their patterns and emerging trends in countries, institutions, journals, authors, topics, and keywords [45,46,47,48]. A visualization software CiteSpace, which was invented in early 2004 by Professor Chaomei Chen, is used to visualize the statistical results.
Several overviews of the electric vehicle and its charging system have been published [13,49,50]. However, few consider the reliability of the electric vehicle charging system, and such research only overviews in a technical perspective instead of a bibliometric one. Therefore, a bibliometric review of the research on electric vehicle charging system reliability from 1998 to 2017 is presented in this paper.
The rest of this paper is organized as follows. In Section 2, the bibliometric methods and the process of data collection are introduced in detail. After retrieving the data, the bibliometric analysis is divided into four parts. Firstly, the basic characteristics of publication outputs, including the analysis of annual publication outputs, document types and journals, are presented in Section 3. Secondly, the collaboration relationships of countries/territories, institutions, and authors are analyzed in Section 4. Thirdly, the co-citation analyses of cited authors and cited references are discussed in Section 5. Finally, the co-occurrence analyses of subjects and keywords are shown in Section 6. Additionally, conclusions are presented in Section 7.
2. Methods and Data Collection
2.1. Methods
As introduced in Section 1, the bibliometric method is a useful approach to identify the emerging trends and abrupt changes in a research field. It contains a series of quantitative methods to study academic literature and develop the distribution patterns or internal relationship of a specific topic, field, institute, or country [51]. In order to visualize the statistical results of the distributions of authors, journals, institutes, countries/territories, references and keywords, many bibliometric analysis tools can be used, such as HistCite [52], VOSviewer [53], Network WorkBench [54], DIVA [55] and CiteSpace [56].
In this paper, CiteSpace V is chosen to perform the results of the analyses because of its outstanding analytics and visualization capabilities as well as its free access. CiteSpace is designed and developed as a useful tool to visualize and analyze the distribution patterns and emerging trends of scientific literature [57]. Based on scientific publications, structural and temporal analyses can be provided and visualized as different networks, including collaboration networks, author co-citation networks and document co-citation networks. Visualization knowledge maps created by CiteSpace are composed of nodes and links. Different nodes have different representations, involving institution, author, country, cited reference, subject and keyword, while different links denote relationships of collaboration, co-occurrence or co-citation. The nodes and lines have different colors, indicating different years [58]. Nodes with high centrality are indicated by purple rounds and can be considered as turning points or landmarks in a research area [59].
2.2. Data Source and Retrieval
Web of Science is one of the most authoritative data bases used in bibliometric studies, and the literature included in Web of Science has a longer time span than some other data bases such as Scopus. Therefore, Web of Science is more effective to analyze the overall development of a research field. Based on this, we choose Web of Science to conduct our research.
The data used in the present study are downloaded from Web of Science on 2 February 2018 and are collected from the following 6 databases in Web of Science Core Collection:
- Science Citation Index Expanded (SCI-EXPANDED)
- Social Sciences Citation Index (SSCI)
- Conference Proceedings Citation Index-Science (CPCI-S)
- Conference Proceedings Citation Index-Social Science & Humanities (CPCI-SSH)
- Current Chemical Reactions (CCR-EXPANDED)
- Index Chemicus (IC)
The main purpose of this study is to investigate the emerging trends of the search of electric vehicle charging system reliability, so the search query can be divided into three parts: “electric vehicle”, “charging system” and “reliability”. For each part, several similar or related terms are considered and the details are presented in Table 1.
According to Table 1, the search query is set as follows.
TS = ((“electric vehicle*” OR “EV” OR “electric car*” OR “electric automobile*” OR “BEV” OR “PEV” OR “HEV” OR “PHEV” OR “FCEV”) AND (charg* OR recharg* OR batter*) AND (reliability OR “mean time to failure” OR “MTTF” OR availability OR “mean time to first failure” OR “MTTFF” OR “mean time between failures” OR “MTBF” OR “maintenance strateg*” OR “maintenance polic*” OR “preventive maintenance” OR “corrective maintenance”)).
The maximum timespan in Web of Science is 1900–2017. However, only 50 records can be searched from 1900 to 1997. Considering that this amount only occupies a small part of the total number and has almost no obvious effect on the analysis results, the records from 1900 to 1997 are omitted. Therefore, the research timespan is set as 1998–2017, i.e., the recent 20 years. Additionally, no language or document type is restricted. The data are downloaded on 2 February 2018 and imported into CiteSpace V for further analyses. The parameters of CiteSpace are set as follows: time slicing (from 1998 to 2017), years per slice (1), term source (all selection), node types (choose one at a time), selection criteria (differ for each in order to obtain an optimal visualization), pruning (pruning sliced networks) and visualization (cluster view-static, show merged network). As a result, a total of 1188 records are retrieved from the databases. An overall methodology is shown in Figure 1.
3. Basic Characteristics of Publication Outputs
3.1. Analysis of Annual Publication Outputs
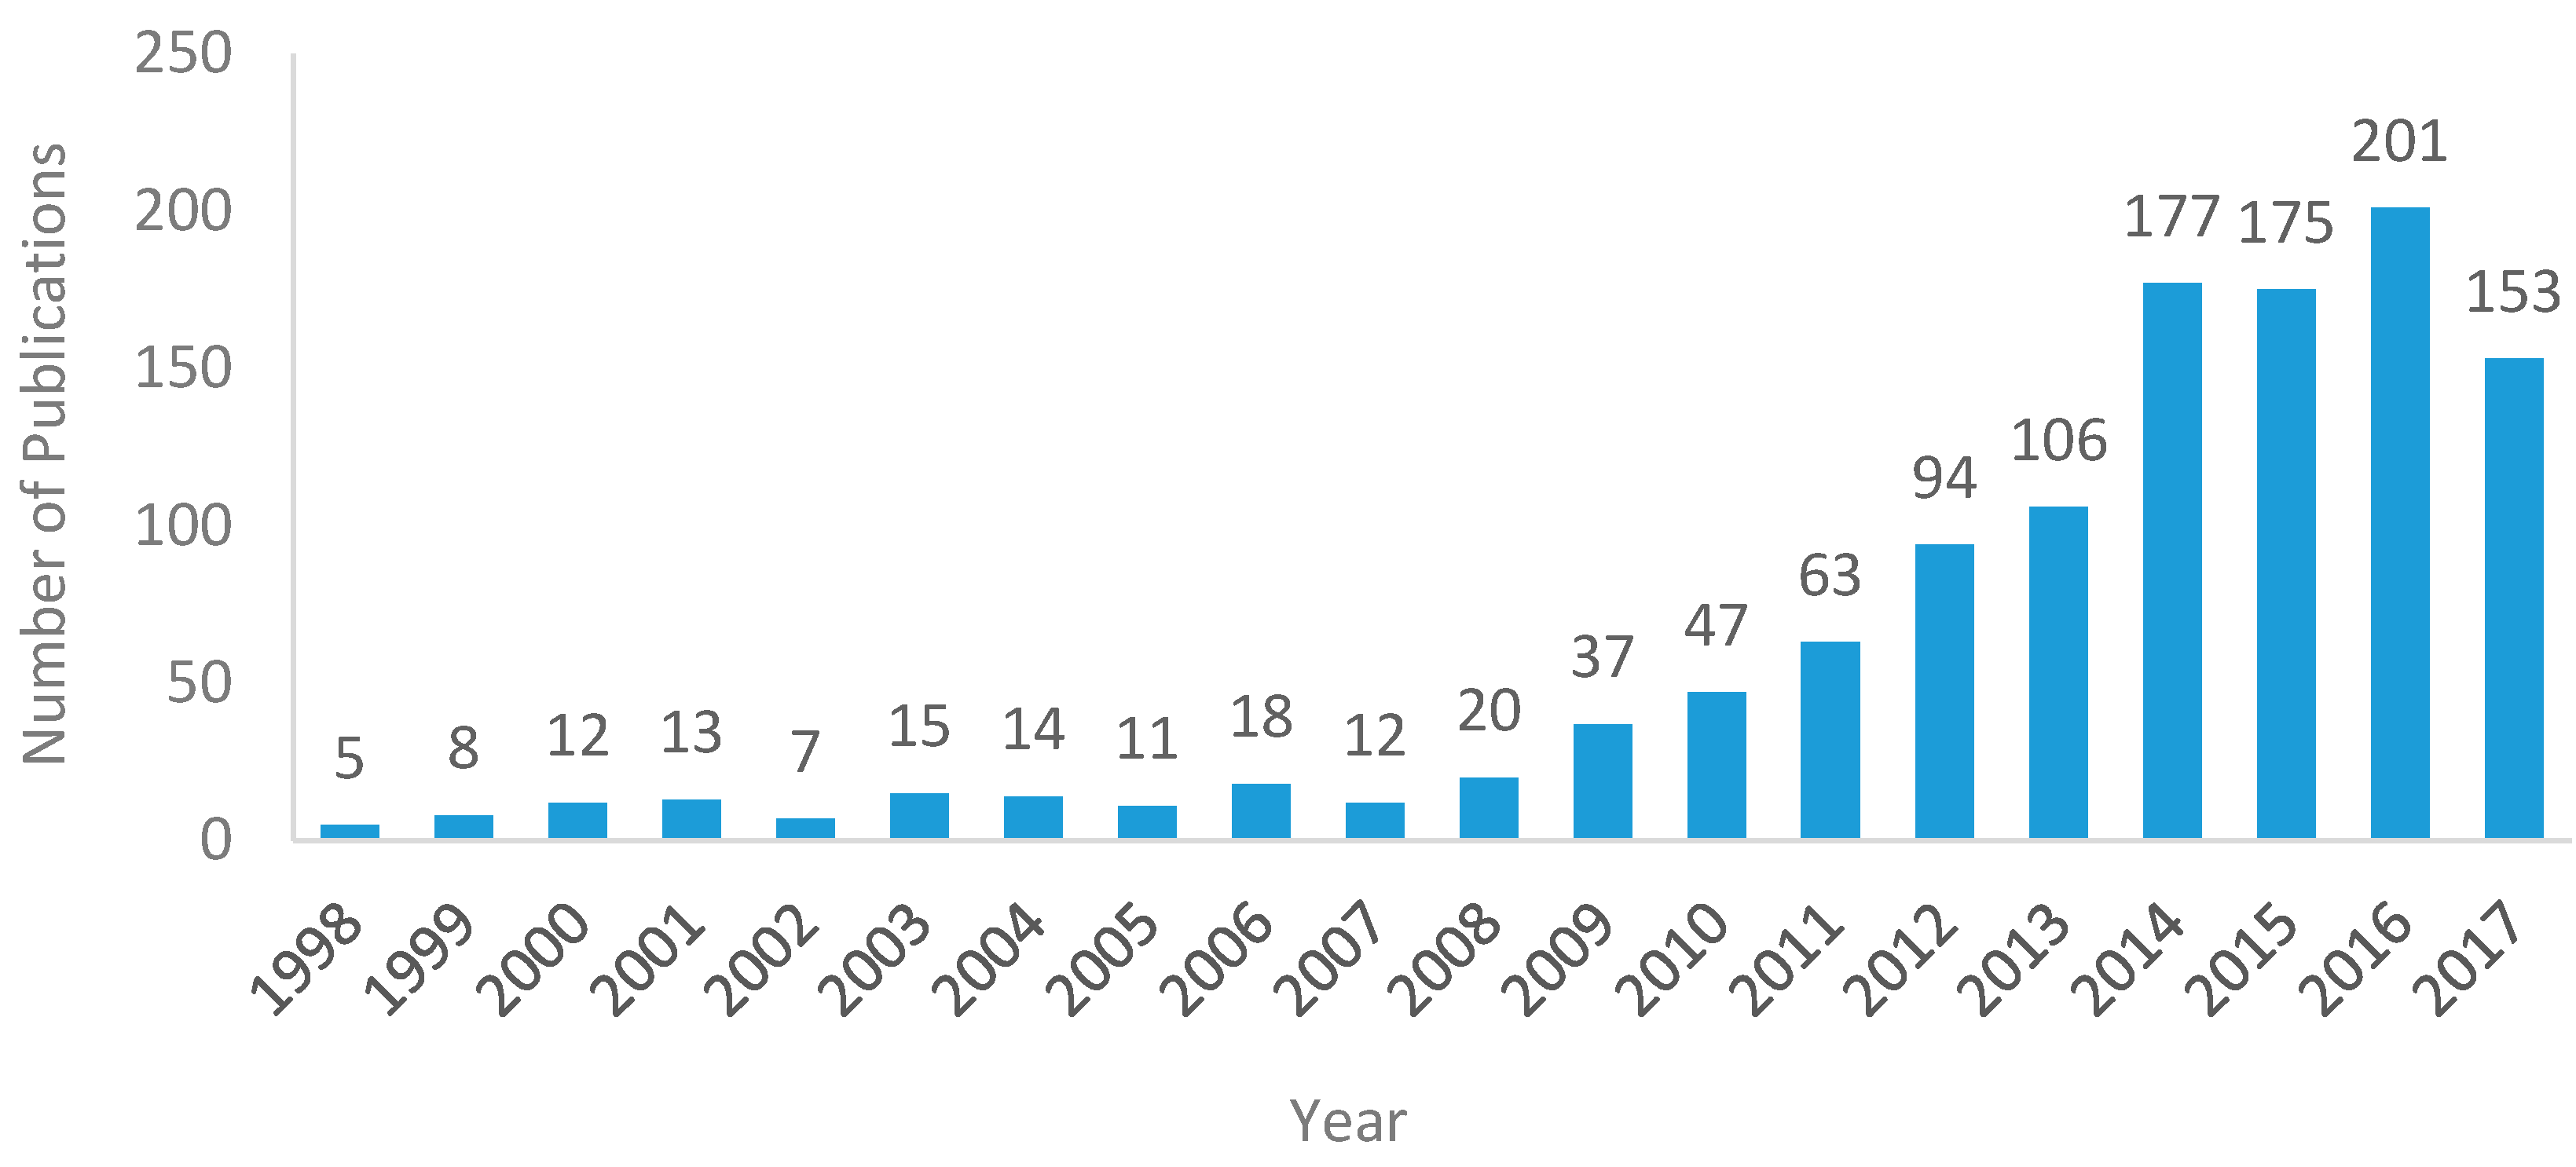
A total of 1188 documents have been published in the selected databases from 1998 to 2017. The annual number of publications is increasing over the past 20 years but with some fluctuations, which can be seen from Figure 2. The lowest output appears in 1998 with only five publications, while it reaches a peak in 2016 with 201 publications after the development of nearly two decades.
Three development stages can be easily observed from Figure 2: a slow-growth period (1998–2007), a steady-growth period (2008–2013) and a rapid-growth period (2014–2017). During the slow-growth period, a total of 115 documents have been published in the 9 years spanning from 1998 through 2007, which only accounts for 9.84% of the total amount. This indicates that the industry of electric vehicle and its charging system grow slowly and insufficient research was carried out on the electric vehicle charging system reliability during that period. However, the number of publications increased year by year over the second period from 2008 to 2013. A reasonable explanation to this phenomenon is that the outbreak of the financial crisis in 2008 has brought a turning point or a new opportunity to the auto industry. The global financial crisis triggered a downturn of the real economy. In order to get rid of the economic depression and revitalize the global auto market, developing new energy vehicles was a common strategy choice for the auto industries of most countries. For example, the Chinese government issued Auto Industry Restructuring and Revitalization Pan on 14 January 2009, which clearly pointed out that China should possess 500,000 new energy vehicles in 2011. Similar policies were also carried out in many other countries. As a result, this significant transformation received increasing attention of related researchers, and the publication outputs rose since then. Subsequently, it is interesting to note that a sharp increase occurs in 2014, where the number of publications jumps from 106 (2013) to 175 (2014) according to Figure 2. Then, the annual publications stay at a high level exceeding 150. This phenomenon demonstrates that 2014 is a remarkable year in the development of the electric vehicle and its charging system. In 2014, the demand of electric vehicles climbs up to a new level with a considerable increase of available vehicle types. More than 100 types of Blade Electric Vehicles (BEV) or Plug-in Hybrid Electric Vehicles (PHEV) are provided for customers all over the world. In order to satisfy the needs of customers, it is extremely necessary to develop corresponding charging system with high performance and reliability. Additionally, the efficiency and benefits of the policies put forward during the past five years (2008–2013) begin to show up and reach a summit in 2014. Due to the above two aspects, relevant researches increase rapidly over this period. However, a decline occurs in 2017, although it still keeps high. It can be reasonably speculated that the relevant research researches a choke point and more efforts are needed to break through.
As for the developing trend, a sustainable growth of the annual publication outputs is expected in the near future. In 2017, many countries have issued compulsory policies to stimulate the development of the new energy vehicles in the international market. Several illustrations are introduced as follows. The USA has enacted legislation that requires 4.5% of all vehicles sold in 2018 to be “zero emission vehicle” (ZEV). This amount is supposed to keep increasing and attain 22% in 2025. The European emission standards stipulate that the average emissions from a new car must not exceed 95g per kg until 2021 for each European Union country. Otherwise, a penalty of hundreds of millions of euros is required. In conclusion, the development of new energy vehicle is still in a rapid growth stage and the potential increase can be foreseen. In order to obtain the developing trend scientifically, a simple statistic regression analysis is used. With the help of Excel, the optimal fitting curve is gained and identified to be a parabola following the equation with , as shown in Figure 3. Obviously, the amount keeps going up in the next two years according to the fitting curve, and this forecast conforms the practical situation introduced above.
3.2. Analysis of Document Types
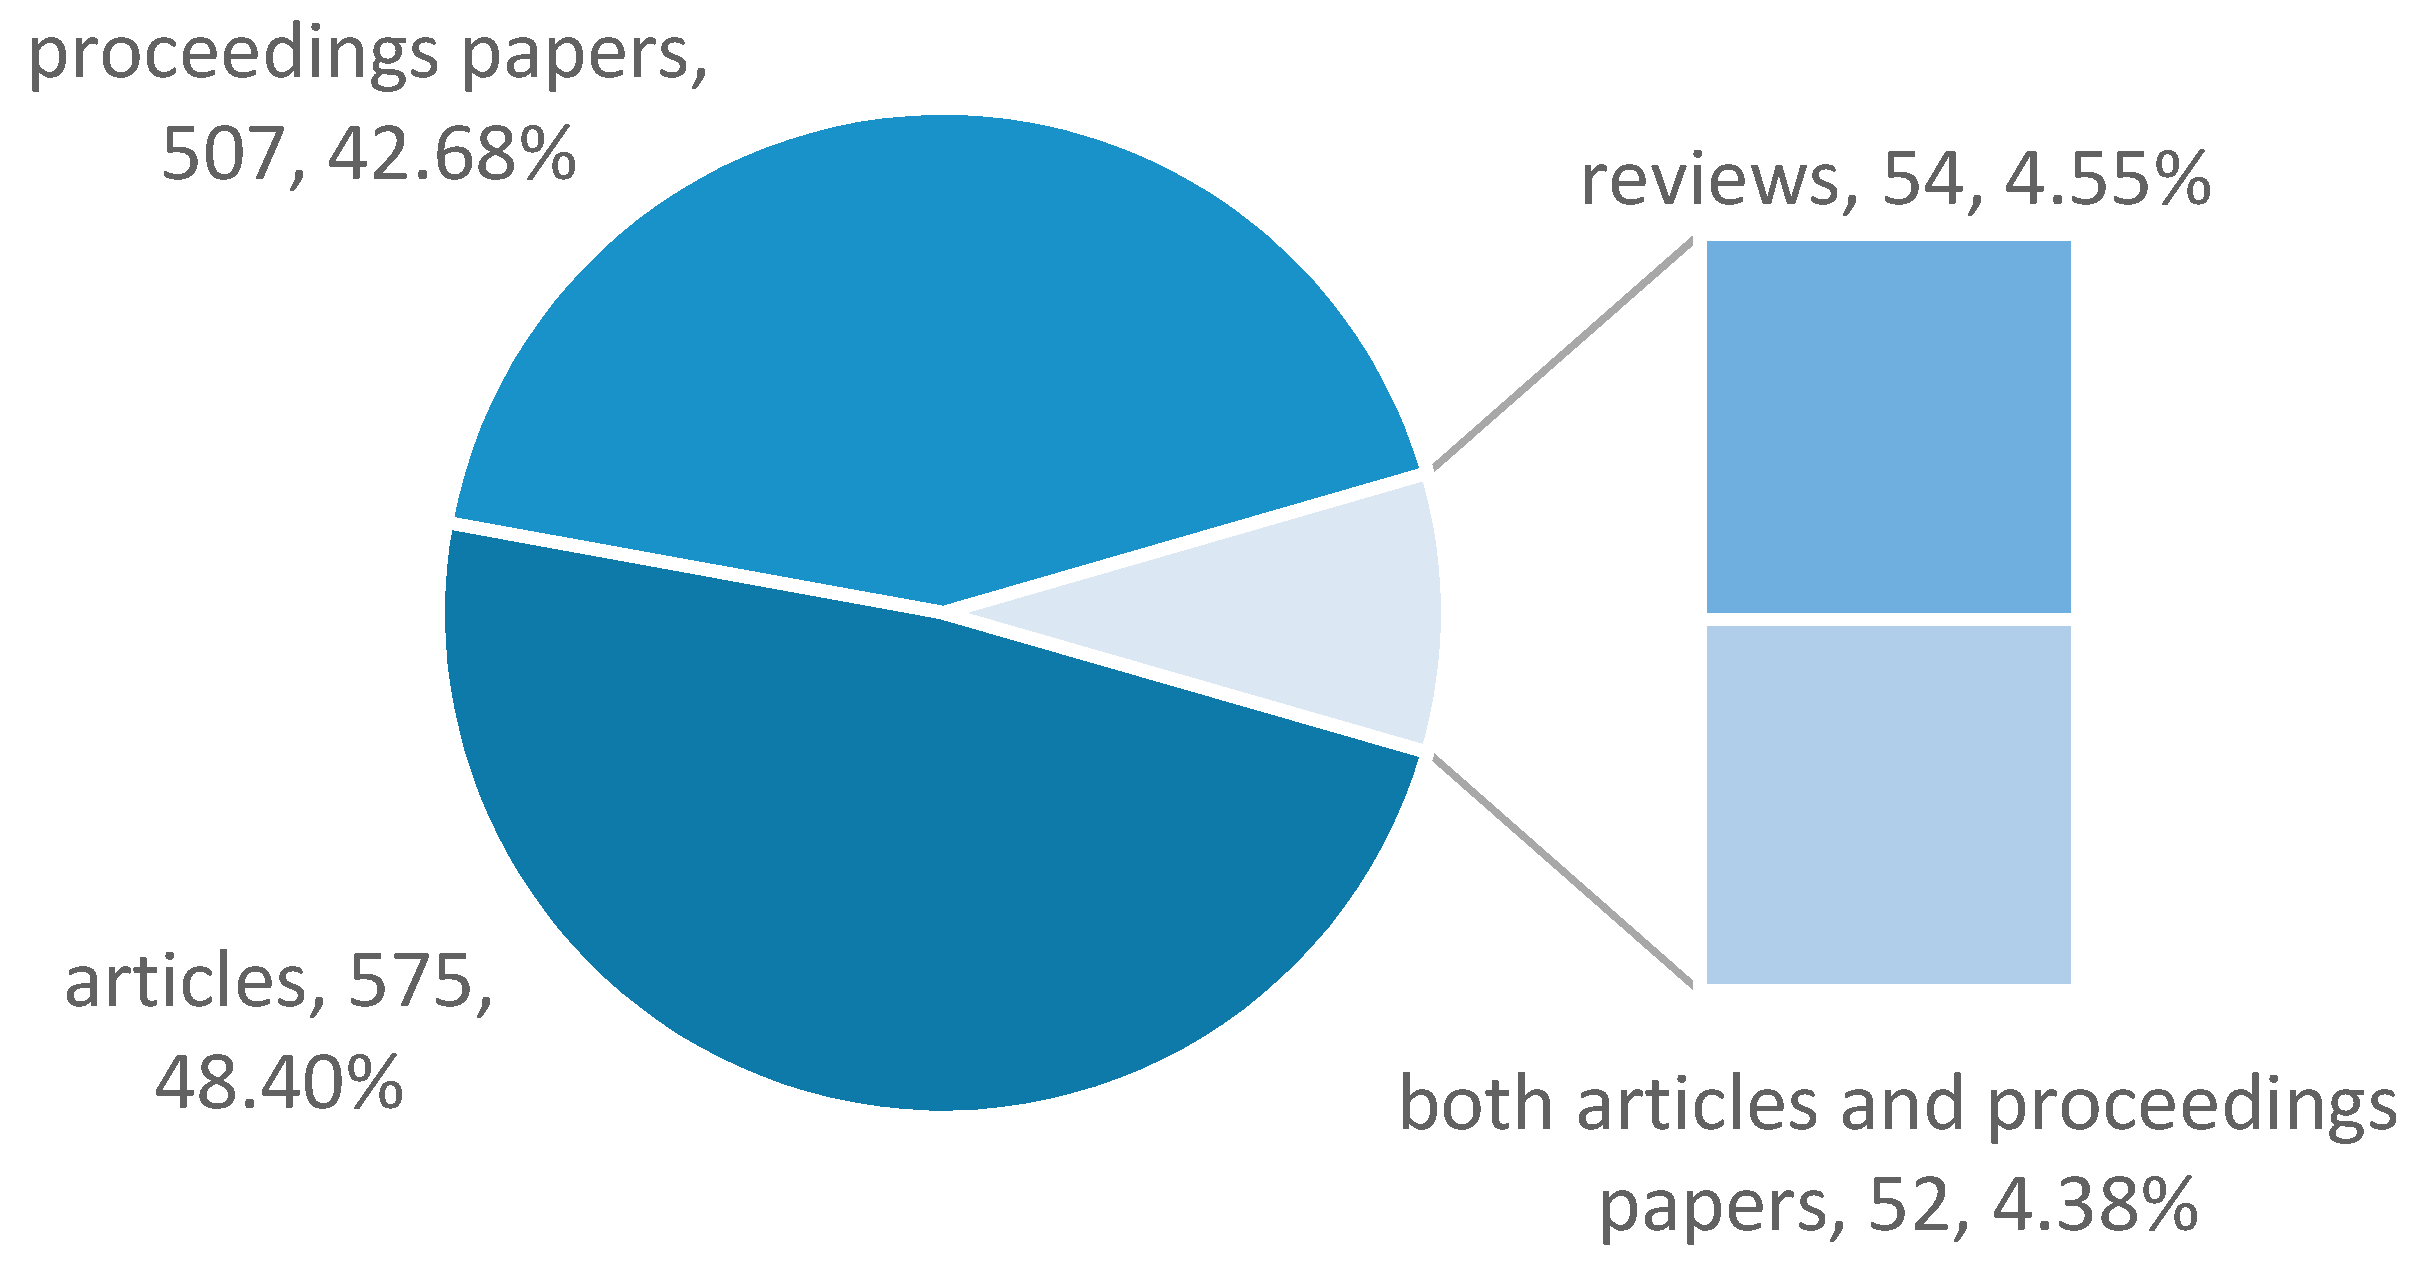
According to Web of Science, the document types mainly concentrate on three categories: articles (627), proceedings papers (559), and reviews (54). Considering that the document types of some publications can be identified as both articles and proceedings papers in the Web of Science, it is reasonable to recalculate the amounts: both articles and proceedings papers (524.38%), articles (575, 48.40%), proceedings papers (507, 42.68%), and reviews (544.55%), as shown in Figure 4.
According to Web of Science, the article (including those identified as both article and proceedings paper) with the highest citation frequency is [60]. This paper defined the three vehicle types that are able to offer “vehicle-to-grid” (V2G) power, and showed how to calculate the capacity that three types of electric vehicles provided for grid power. The results suggested that the engineering fundamental and economic motivation for V2G power are remarkable. The basic concept of V2G power is that EVs, including battery electric vehicle, fuel cell vehicle or a plug-in hybrid vehicle, provide power to the grid while parked. When EVs are connected to the grid, they can serve in two modes: (1) Charging mode, where an EV is considered as a load for the grid. (2) Discharging mode, where an EV provides energy to grid [61]. The application of V2G has many benefits, including an extra source of revenue for clean energy vehicles, enhanced stability and reliability of the electric grid, lower expenses of electric system, and inexpensive storage and backup for renewable electricity [61].
The proceedings paper (including those identified as both article and proceedings paper) with the highest citation frequency is [62]. The use of plug-in hybrid electric vehicles (PHEVs) is a significant innovation to replace petroleum with cleaner fuel. This article focused on the assessment of two modes, Electric Vehicle (EV) mode and Blended mode, for PHEVs and their comparison with traditional vehicle and HEV performance. The results revealed that the control problem for PHEVs includes not only fuel economy but also external factors, such as electricity price, energy market and regulations, charging availability, battery life issues, and so on [62].
The review with the highest citation frequency is [63], published in Science in 2011. The battery system is a crucial factor to increase the energy storage system reliability. This review introduced three main battery systems, including sodium-sulfur batteries which are available in the market for grid applications, redox-flow batteries with low cost, and lithium-ion batteries whose development for commercial electronics and electric vehicles has wide application to grid storage [63].
3.3. Analysis of Journals
The analysis of journals is also an interesting topic, because it helps find the most possible journals to publish relevant studies. All the 1188 publications were published in 290 different journals, and the top 11 most prolific journals are presented in Table 2.
As shown in Table 2, 20.79% (approximately 1/5) of the publications (247 papers) were published in the top 11 most prolific journals. The top-ranked journal is Journal of Power Sources (IF = 6.945), which published 45 papers in total, occupying 3.79% of all the publications. The following two journals are Applied Energy (IF = 7.900) and Energies (IF = 2.676), and they both have 33 publications. It can also be observed that the top three journals with the highest IF are Renewable & Sustainable Energy Reviews (9.184), Applied Energy (7.900), and IEEE Transactions on Smart Grid (7.364). According to this result, authors can choose their ideal journal to publish papers related to this research field.
4. Collaboration Analysis
4.1. Analysis of Countries/Territories
The researchers on electric vehicle charging system reliability are from all over the world. The geographic distribution of the 1188 publications covers 63 countries/territories. The top 10 countries are presented in Table 3. The USA contributes the most publications (327, 27.52%), followed by China (288, 24.24%). The publication outputs of the USA and China make up more than half of the total amount. Figure 5 presents a comparison of the annual publication outputs of the USA and China. It indicates that researchers in the USA focus on the study of electric vehicle charging system reliability earlier than those in China. This is because the history of electric vehicles derives from western countries. The first of China’s domestically designed electric vehicle was produced in 2003 by the fuel cell research team in Tongji University, and relevant studies sprang up since then. Moreover, the amount has increased rapidly since 2008 in both countries, while the dominance of China has accelerated in recent years, particularly since 2014.
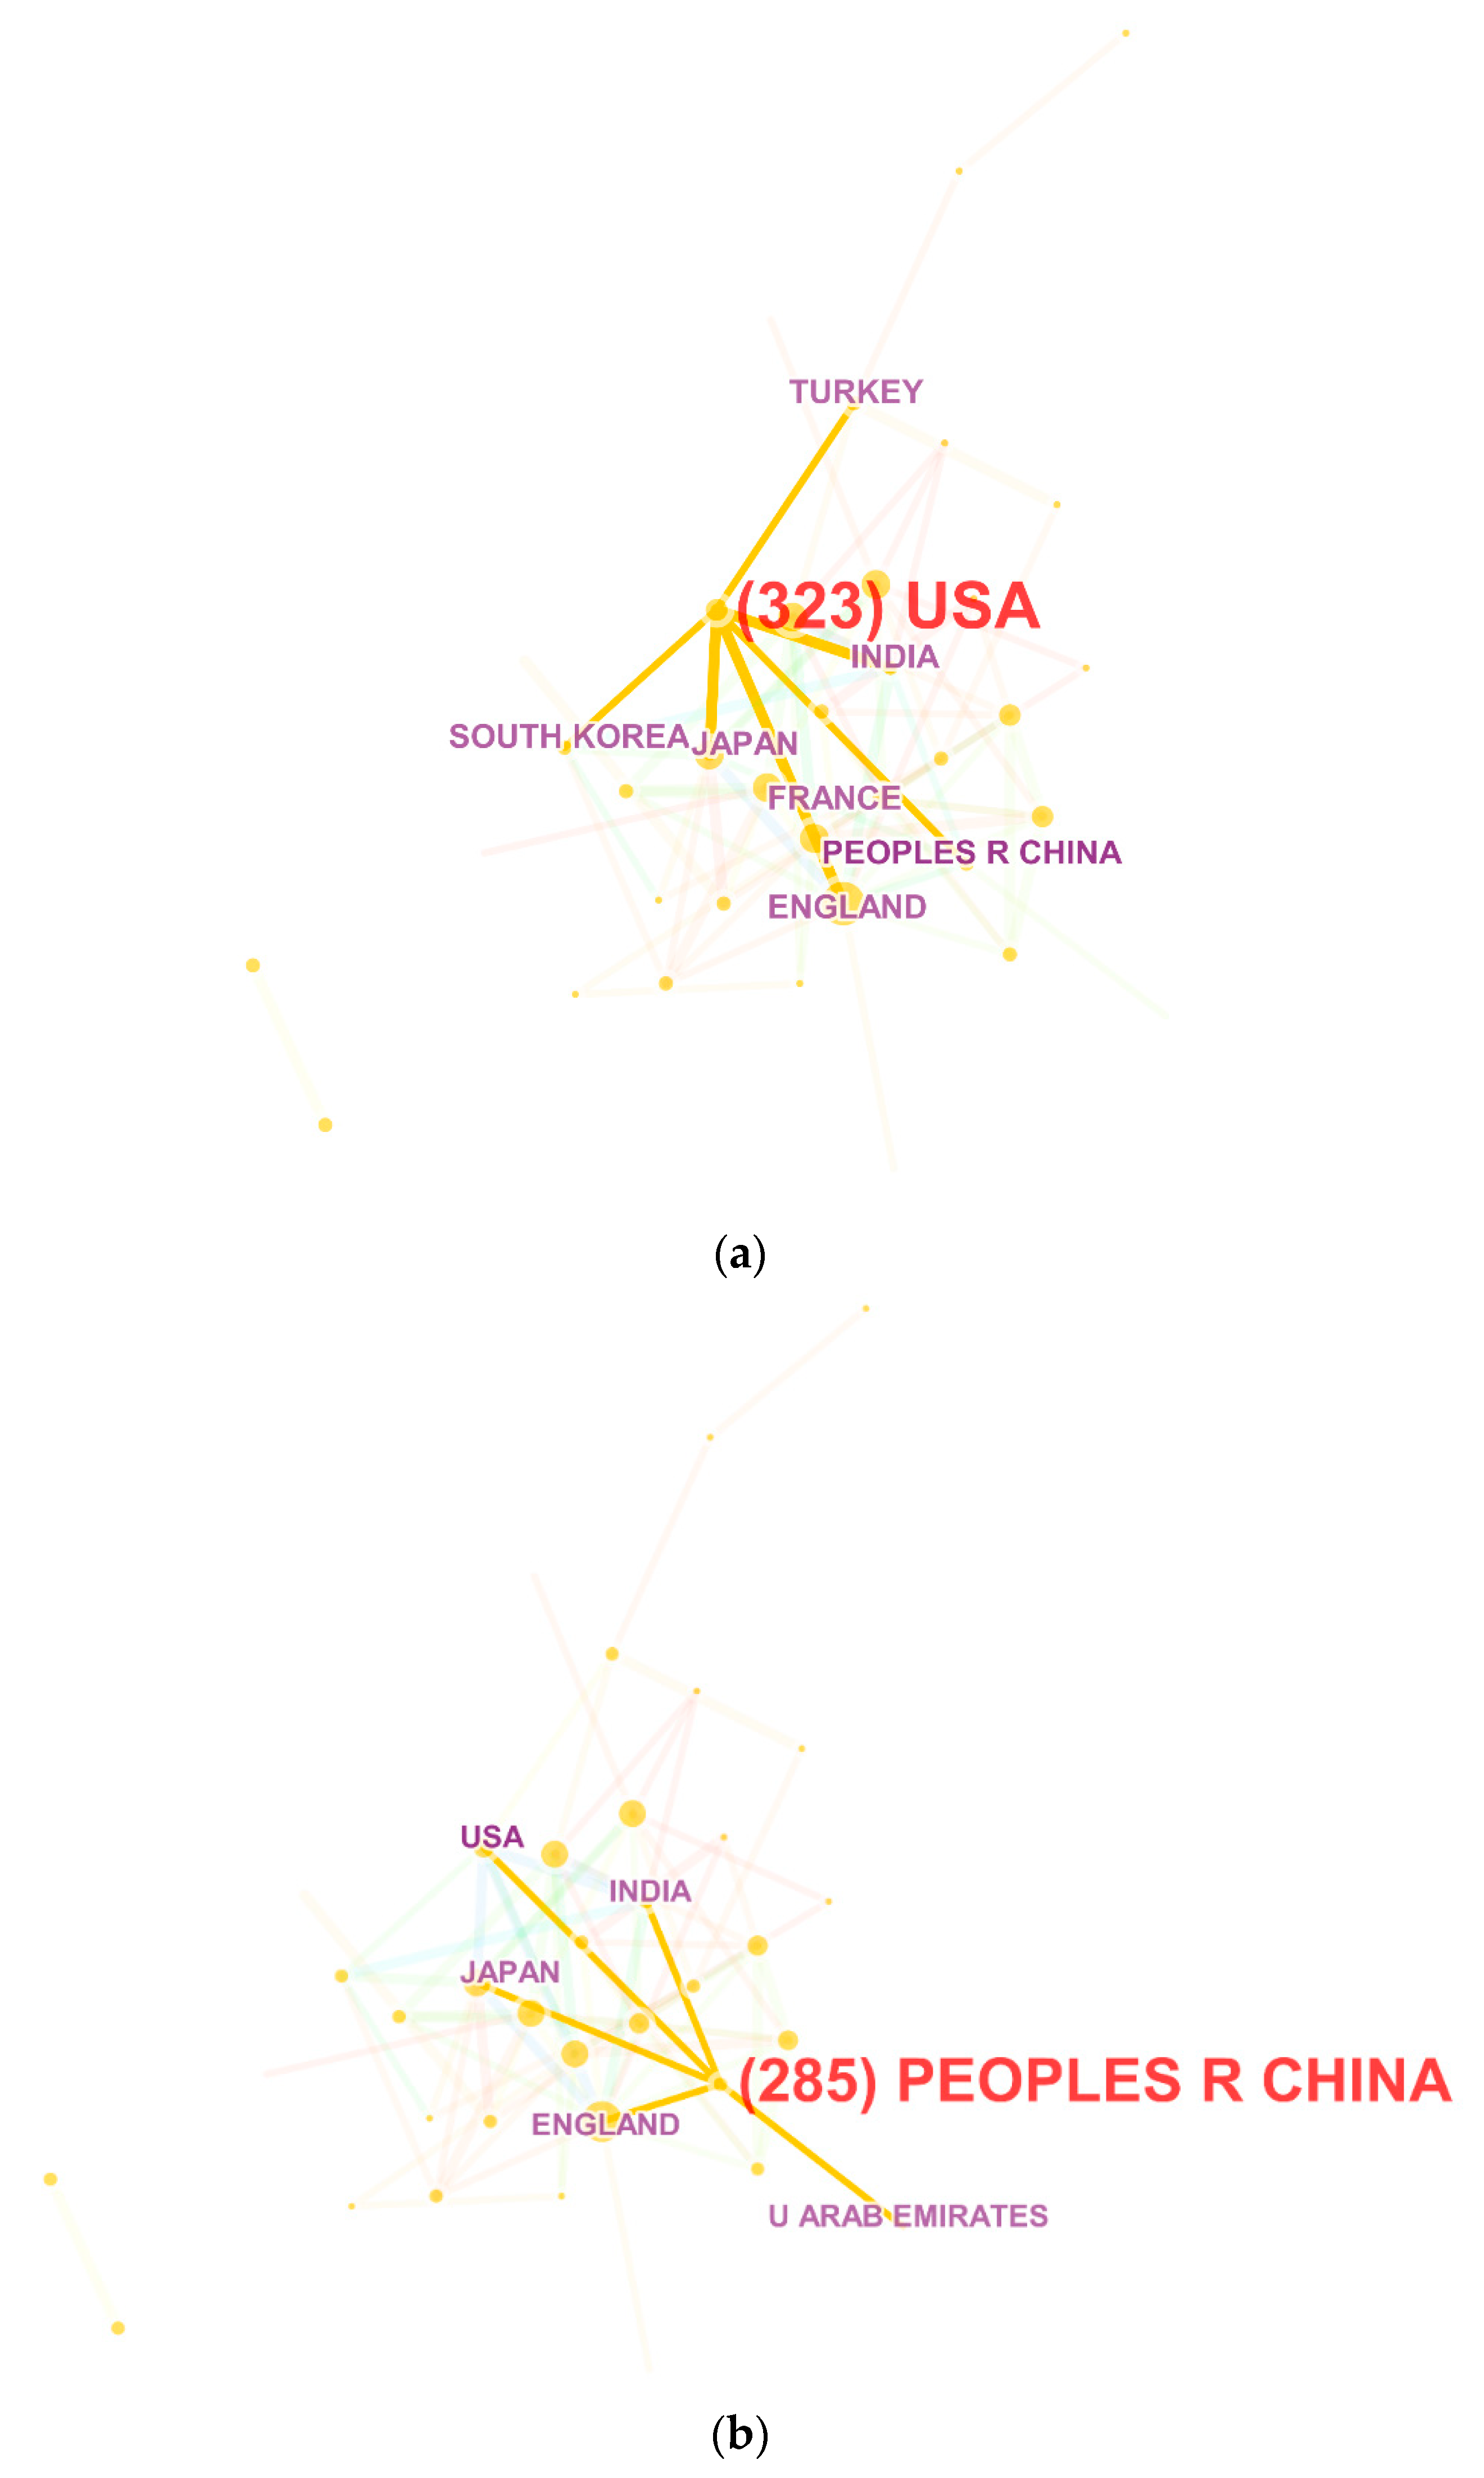
Additionally, a USA-centered and China-centered collaboration network is shown in Figure 6a,b, respectively. Each note represents a different country/territory. The link between two nodes represents the cooperation between two countries/territories, and the link thickness represents the intensity of collaboration. Note that the publication outputs of the USA (323) and China (285) are less than the total number shown in Table 3, because several publications are omitted in the operational process of CiteSpace to gain an optimal visualization. As shown in Figure 6a, the American researchers tend to cooperate with those in England, France, Japan, South Korea, India, and Turkey, while Chinese researchers prefer those in the USA, India, Japan, England, and United Arab Emirates.
4.2. Analysis of Institutions
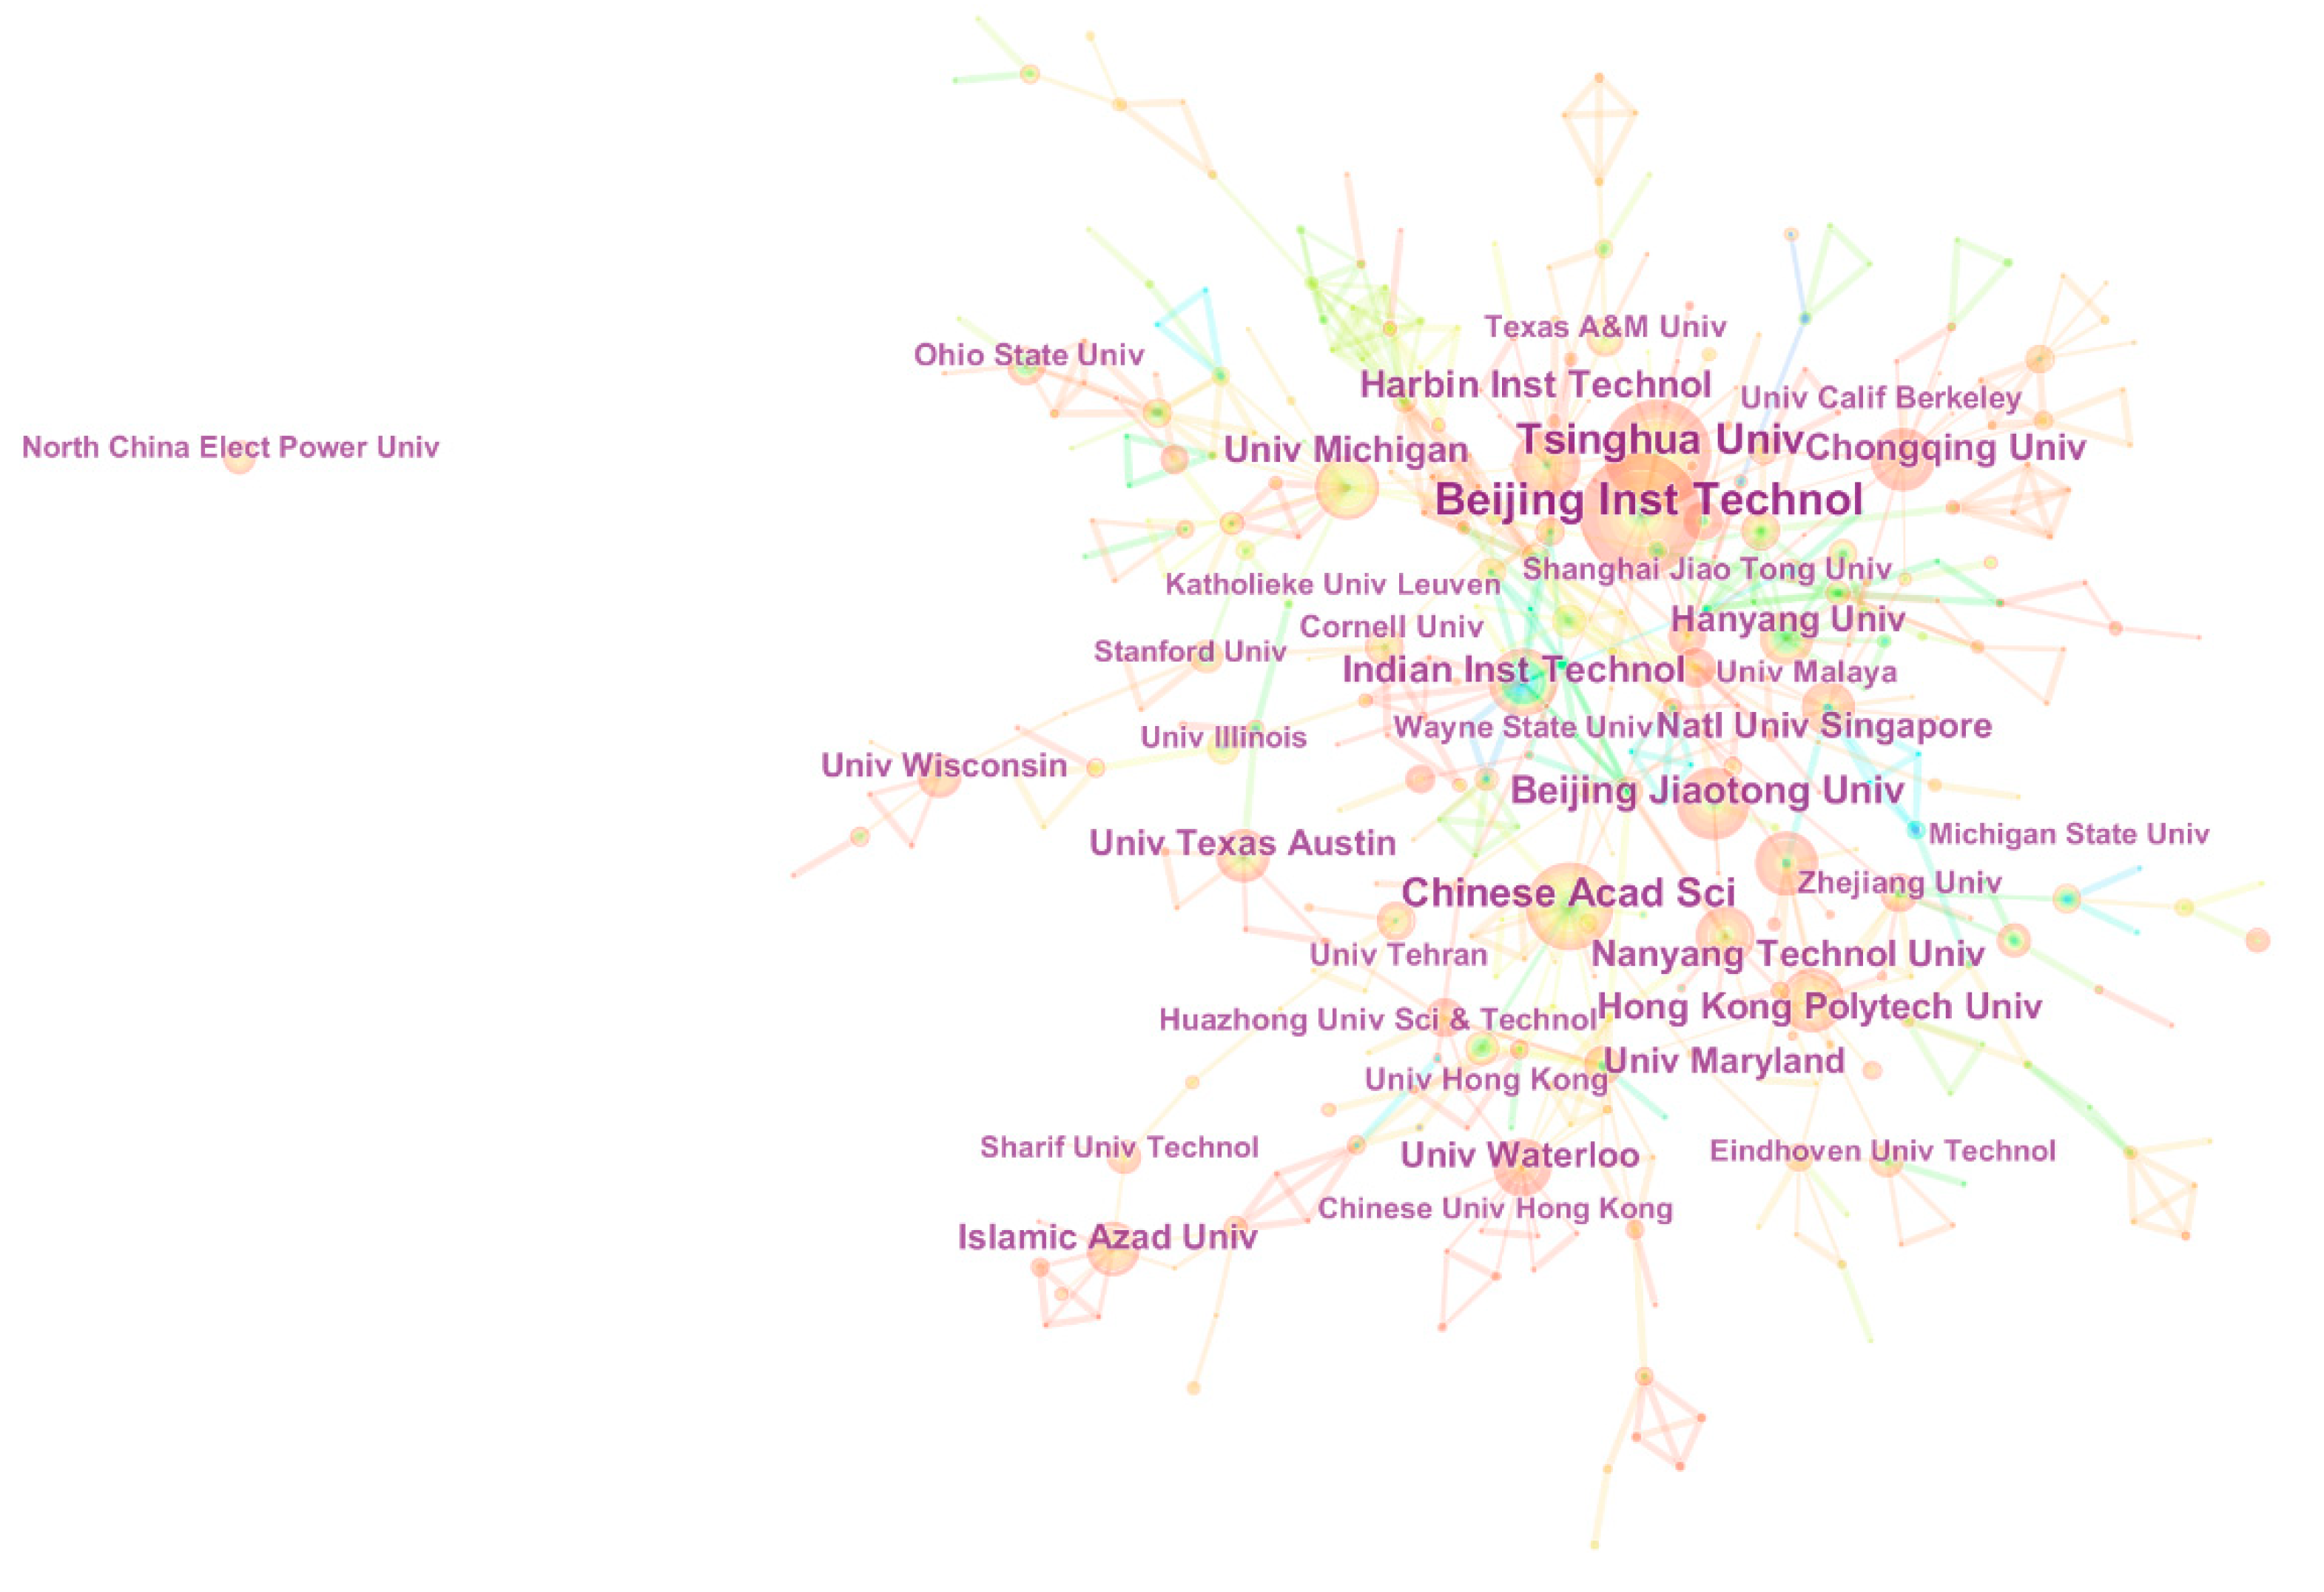
1105 institutions in total are identified to participate in the research of electric vehicle charging system reliability. The top 10 most productive institutions are presented in Table 4. This small group of institutions contributes a large number of publications on this research field. Beijing Institute of Technology (BIT) is the leading institution with 25 publications. Definitely, BIT is in the leading position of vehicle engineering research in China. Most of the top 10 institutions are from China, while others are from India, the USA and Singapore.
The collaborations of the institutions from 1998 to 2017 are analyzed below, and the collaboration network is shown as Figure 7. As previously introduced, each node in Figure 7 indicates a different institution. The connecting lines between nodes denote their collaboration, and the thickness of the lines describes the collaboration degree. The distribution of the institutions is quite concentrated, and the top 10 most productive institutions can be observed as the core institutions of some main collaborations. This demonstrates that several institutions may establish a stable partnership of collaboration and achieve great productivity on the research of electric vehicle charging system reliability.
4.3. Analysis of Authors
A total of 3747 authors have contributed to the research of electric vehicle charging system reliability. To some degree, the productivity level can represent the contribution of an author, and the top 10 most productive authors are presented in Table 5. It is clear to see that Wang LF, from University of Toledo in the USA, is the most productive author with 11 publications in total. Jiang JC and Sun FC, from Beijing Jiaotong University and Beijing Institute of Technology in China, appear in the second and third place with 10 and nine publications, respectively. Most of the top 10 authors are from China, followed by the USA and South Korea.
The collaboration network of the authors consists of 190 nodes and 222 links, generating numerous closed-loop circuits. A main part of the whole network is shown in Figure 8. It is obvious that the strongest collaboration exists in a primary circuit connecting 28 researchers with several core authors such as Jiang JC, Pecht M, Xiong R, Zhang L, and Chen ZH, making up a remarkable segment of the whole collaboration network. Except Chen ZH, the other four researchers all appear in the top 10 most productive authors, suggesting that they contribute numerous publications and promote the research to a higher level through cooperating. However, not all productive authors are included in this circuit, such as Wang LF, Li Y, and Xu GQ. They mainly work with only a small group, which generates some main clusters with several core authors. It is universally known that the cooperation is extremely important in scientific research, so more collaborations are needed for those authors who are excluded in the primary circuit.
5. Co-Citation Analysis
5.1. Analysis of Cited Authors
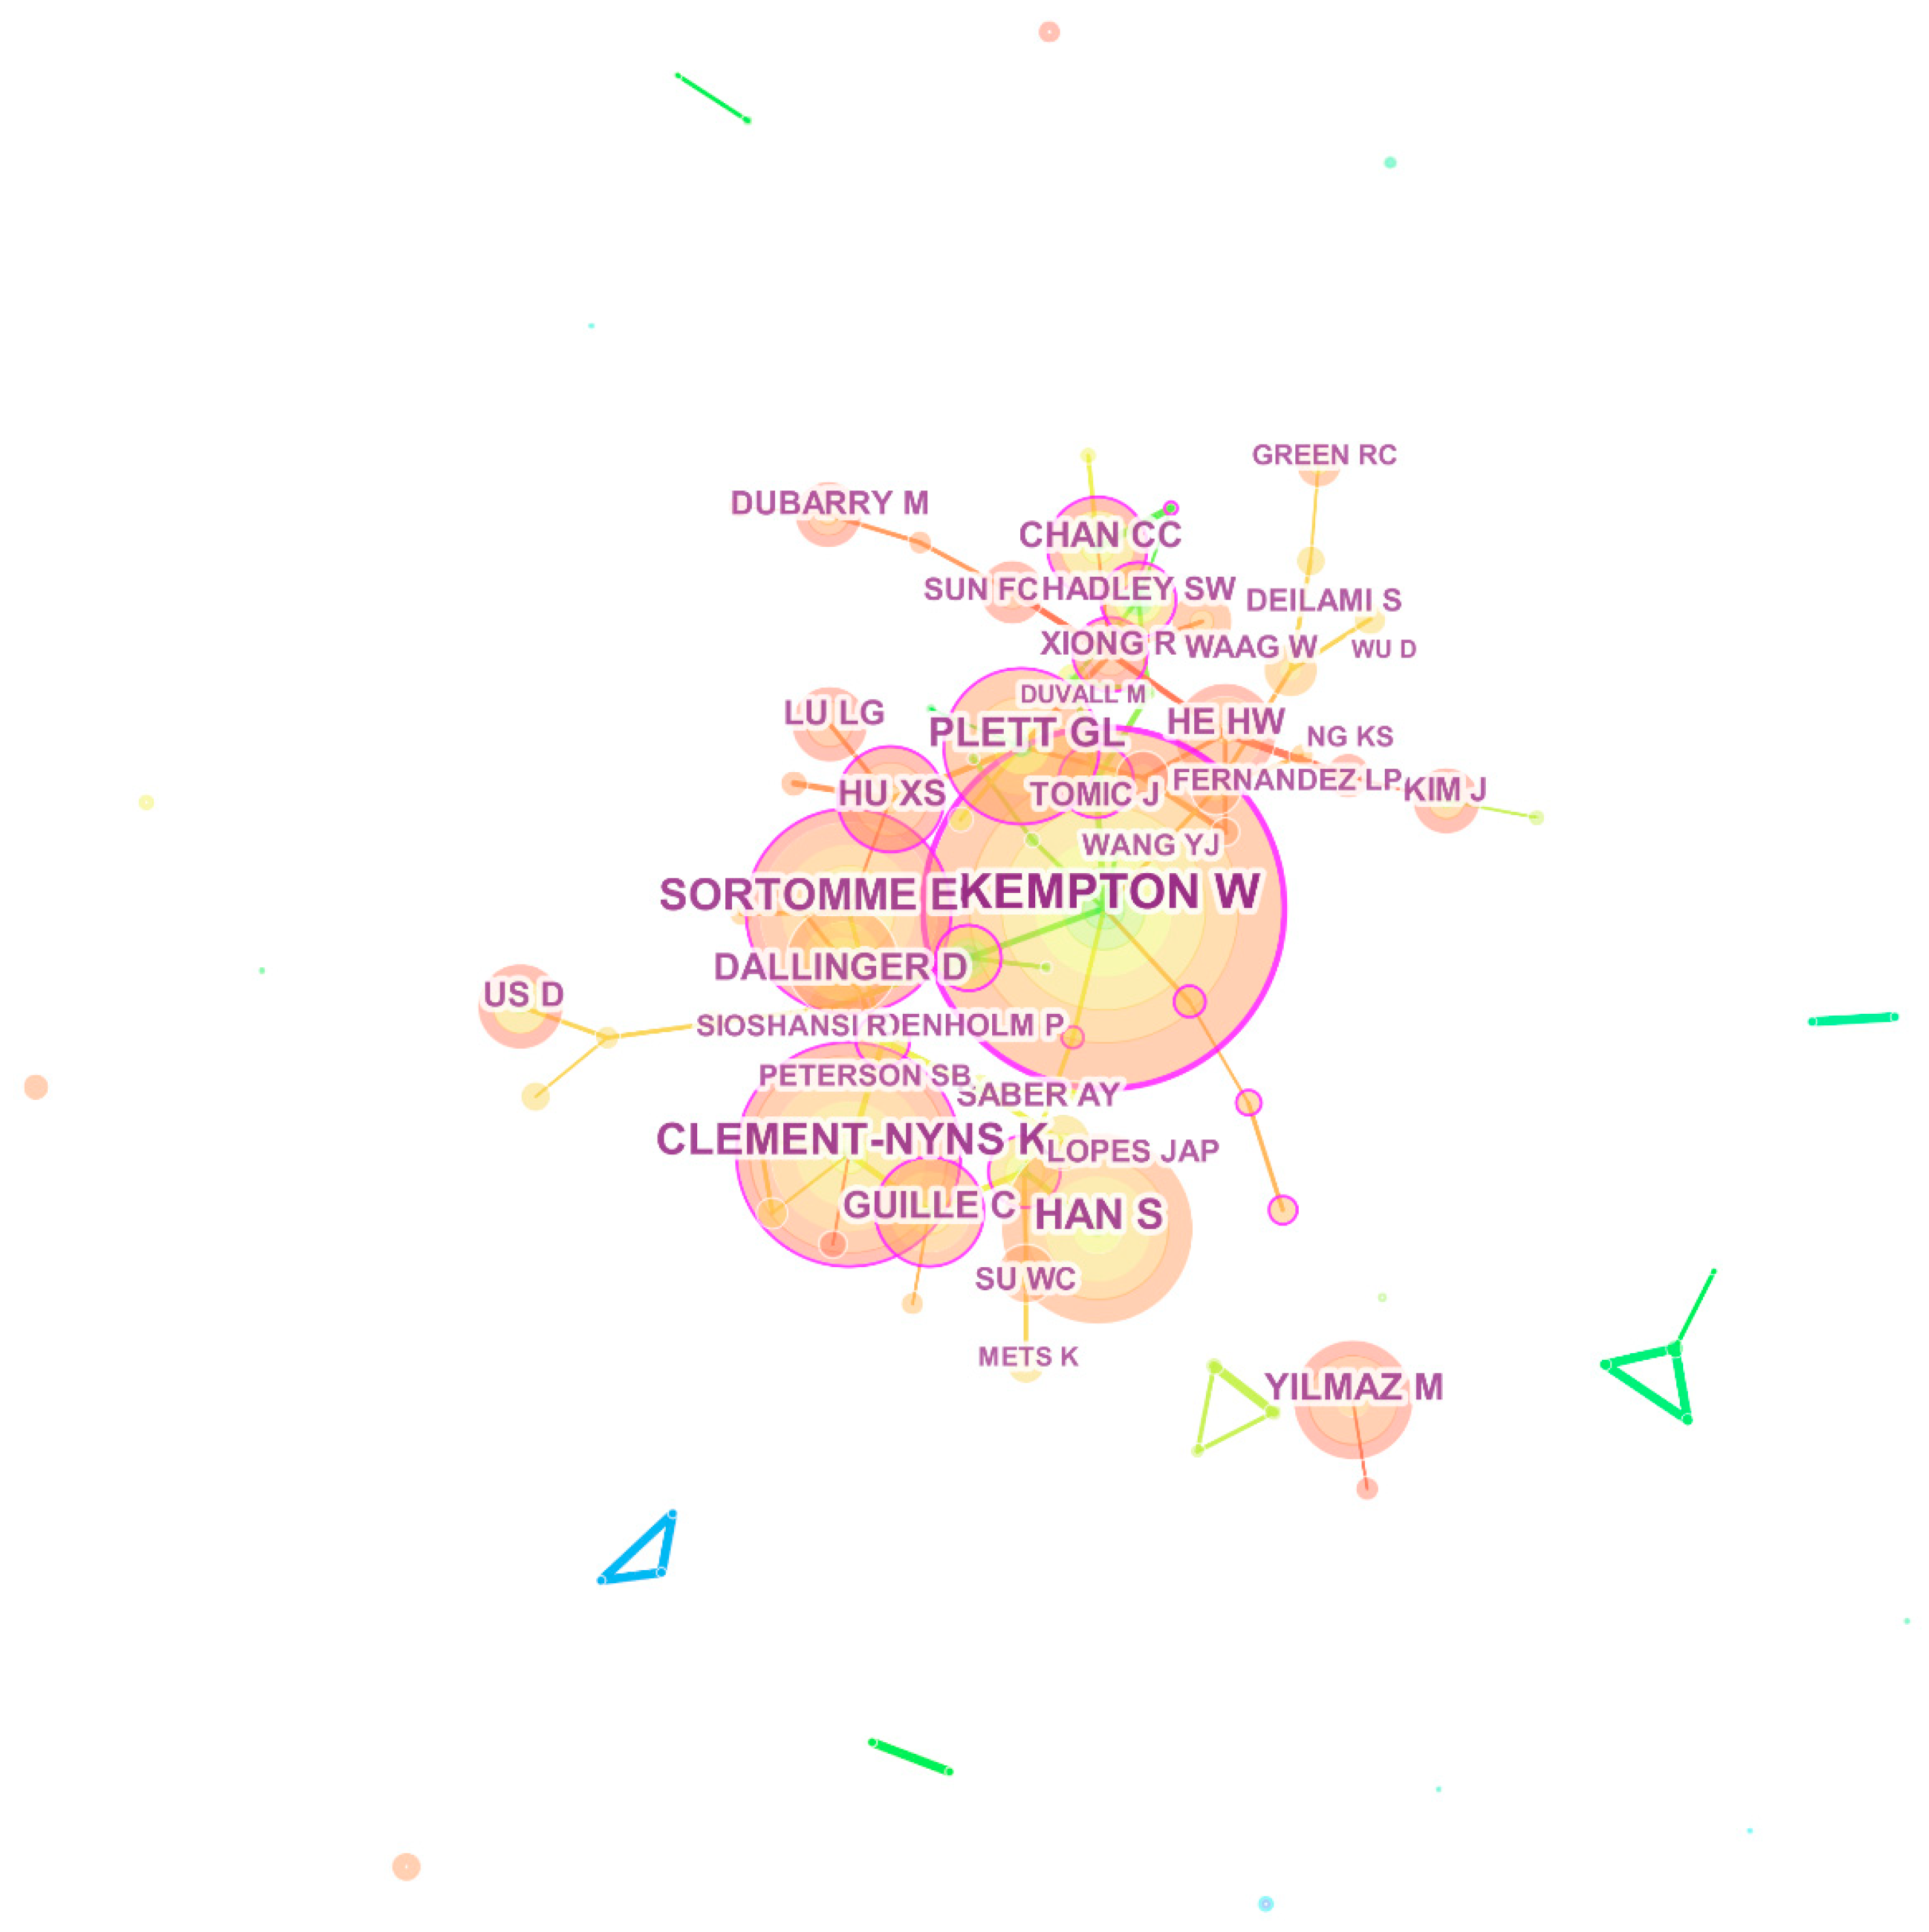
The top 10 cited authors ranked by count and betweenness centrality are presented in Table 6 respectively. The co-citation network of cited authors is shown in Figure 9, in which 118 nodes and 123 links are generated. The cited authors are denoted by the nodes and the top 27 are noted. The top 5 cited authors ranked by count are Kempton W (114), Clement-Nyns K (71), Sortomme E (65), Han S (61), and Plett GL (49). This suggests that their research has an important influence on this research field. The top 5 cited authors with high betweenness centrality are Kempton W (0.38), Xiong R (0.20), Saber AY (0.19), Clement-Nyns K (0.18), and Peterson SB (0.18). Note that Kempton W and Clement-Nyns K exist in the top 5 authors ranked both by count and by betweenness centrality, indicating that their contributions must not be overlooked. Kempton W, coming from the University of Delaware, leads a research team which focuses on the project of V2G and has made a series of great contributions in this research area. For example, one of his studies focuses on the systems and processes that need to obtain energy in vehicles and V2G is developed [61]. Clement-Nyns K is interested in the research of hybrid and electric vehicles. For example, in one of her studies, coordinated charging and discharging of PHEVs is developed and a voltage constraint is introduced to solve the local grid problems caused by uncoordinated charging of PHEVs.
5.2. Analysis of Cited References
The analysis of co-cited references is one of the most important indicators of bibliometrics. According to the results of CiteSpace, the top 5 cited references ranked by count and betweenness centrality are shown in Table 7 and Table 8, respectively. The top 18 references with the strongest citation bursts are shown in Table 9. In Figure 10, the co-citation network of cited references is presented. 156 nodes and 190 links are generated in Figure 10. The nodes denote the cited references and the top 42 are noted by the first author and the publication year. Additionally, the large nodes represent the references which are frequently cited. The most highly cited reference is [64], written by Clement-Nyns K in 2010. In this paper, in order to minimize the power losses and ensure high efficiency of grid operation [64]. Moreover, the paper with the highest betweenness centrality (0.63) is [65], written by Sortomme E in 2011. This paper developed an algorithm for unidirectional Vehicle-to-Grid to minimize the aggregator profit, constraining the optional system load and price [65]. The top 5 cited references ranked by betweenness centrality can be identified as the nodes with purple circles in Figure 10. Clearly, these references have a great impact on the connection of the two main clusters.
The top 18 references with the strongest citation bursts are shown in Table 9. The reference with the strongest burst is [60], written by Kempton W and published by Journal of Power Sources in 2005. The main research of this paper has been introduced briefly in Section 3.2. due to the highest citation frequency of this article. It is clear to see that this paper is extremely significant in the development of the research. Additionally, its burst lasts for the longest time (2008–2013, 6 years) among the top 18 references. The latest two articles whose bursts last from 2016 to 2017 are introduced specifically as follows. In paper [85], published by He HW in 2011, a dual polarization (DP) model was proposed in order to enhance the use of lithium ion batteries in EV applications. The DP model is able to simulate the electrochemical polarization and concentration polarization separately. By comparison with other four traditional models, the DP model has the best dynamic performance and provides the most accurate state of charge (SOC) estimation [85]. The paper [72], written by Lu LG and published in 2010, briefly introduced the features of the battery management system (BMS) and some relevant critical issues such as battery cell voltage measurement, battery states estimation, battery uniformity and equalization, and battery fault diagnosis, in order to enhance the research of the BMS.
6. Co-Occurrence Analysis
6.1. Analysis of Subjects
Each article indexed by the Web of Science belongs to one or more subject categories. There are 102 subject categories involved in total. Table 10 presents the top 10 subjects ranked by count and betweenness centrality, respectively. Figure 11 shows the co-occurrence network of different subject categories. Among all the subjects, Engineering (692, 58.25%) is found to be involved in the most publications, followed by Engineering, electrical & electronic (555, 46.71%) and Energy & fuels (366, 30.81%). The definition of betweenness centrality is given by Freeman in 1977 [86], which is a measure of centrality in a graph based on shortest paths. It is equal to the number of shortest paths from all vertices to all others that pass through that node. In the view of bibliometric, a node with high betweenness centrality in the co-occurrence network of subjects represents a major intellectual turning points connecting the studies performed in different subjects and may have significant effects on the development of a certain research field. In the present study, the subjects with the top 10 highest betweenness centralities are shown in Table 10. Engineering (0.59) takes the first place, followed by Energy & fuels (0.35) and Physics (0.33). In CiteSpace, nodes with high betweenness are indicated by purple rounds, as shown in Figure 11. In the top 10 subjects ranked by betweenness centrality, 2 subjects are excluded in the top 10 ranked by count, as shown in Table 10 in italics. They are Chemistry (0.1) and Engineering, multidisciplinary (0.09). Although only occupying a small part of the research of electric vehicle charging system reliability, these subjects may lead the research to a new perspective.
6.2. Analysis of Keywords
The keywords derived from Web of Science include “Author Keywords (DE)” and “Keywords Plus (ID)”. DE consists of the keywords supplied by the authors, while ID includes the keywords supplied by the journals [87].
Keywords (concentrated expression of current research issues or concepts) provide a reasonable description for research hotpots. According to Table 11, the keyword with the highest frequency is electric vehicle (327, 27.53%), followed by system (113, 9.51%), reliability (100, 8.42%), lithium ion battery (73, 6.14%), and battery (72, 6.06%), which exactly belong to three categories of the search query (“electric vehicle”, “charging system”, and “reliability”). The keywords with the top 5 highest betweenness centrality are the same. Three newly-presented keywords, Hybrid electric vehicle (0.10), Demand (0.09), and Technology (0.08), are indicated in Table 11 in italics. They may bring great contributions to the interdisciplinary research. Regardless of the three basic keywords (Electric vehicle, system, reliability), lithium ion battery has an important impact in both rankings. Lithium-ion batteries have been widely applied for consumer electronics due to the outstanding features, such as the high energy density, high power density, long service life, and environmental friendliness [72]. Remaining useful life prediction and state of charge (SOC) estimation are two important research topics for the lithium ion battery [88]. The mechanism of performance degradation and remaining useful life (RUL) estimation are closely related to the operation state and its reliability. Furthermore, RUL prediction of lithium ion battery is crucial for the operation scheduling, spare parts management, and maintenance decision for electric vehicle charging systems [89]. Hence, it has become an important topic of the research of lithium ion battery. To indicate the performance of battery residual energy and power output capability for a battery pack, the state of charge (SOC) is a commonly used index [90]. To avoid the abuse of batteries and improve the driving safety, the SOC is required to be estimated accurately [91]. However, the main difficulties of accurate estimation of SOC are the strong time-varying and nonlinear characteristics of battery cells, so it has received much attention and still requires further research [92].
Bursting keywords (emerging trends or abrupt changes) can be used as indicators to investigate the research frontiers. Table 12 presents the top 16 keywords with the strongest citation bursts, along with the strength and occurrence timespan. The time interval is plotted on the blue line and the period of a burst keyword is plotted on the red line, which indicate the beginning and end of the time interval of each burst [93]. According to Table 12, the most recent two keywords are shown as follows:
- Vehicle-to-grid (V2G). The basic concept has been introduced in Section 3.2. This idea is useful to establish an entire set of instantly available distributed energy storage devices [94]. According to its concept, different applications and many types of batteries have been put into the market [95,96,97]. It can also help to increase the performance of a supply grid in terms of system efficiency, reliability, stability, and generation dispatch of distribution networks [98,99]. Nevertheless, the technology of V2G is also confronted with challenges, such as battery degradation, communication overhead between an EV and a grid, and changes in whole infrastructure of a distribution network [94]. Therefore, further research is required to solve these problems.
- Energy management. Hybrid electric vehicles have different power sources, so a critical problem is to decide which power source is supposed to be activated [100]. An energy management system (EMS) has the function of controlling the energy source to charge the electric motor. Equivalently, it is an energy splitting instrument among several power sources [101]. The EMS helps control the power flow and satisfy the requirements of the market in a vehicle energy system with a hybrid energy sources [102]. The configuration and controller design are challenging due to its complexity arising from the demand of integration among other related systems [103]. Continuous studies on energy management have been done [104,105,106], but most of them are only limited to computer simulation [107]. Therefore, the EMS requires further development in the field of hardware or real-time applications in order to improve the reliability of an HEV [102].
In order to analyze the development of keywords chronologically, the timelines for co-occurrence keywords clusters are shown in Figure 12. It is evident that Cluster #0 (lithium-ion batteries) has a high concentration of nodes, which echoes the fact that the research of lithium-ion batteries can be explored for numerous perspectives. Note that the Cluster #0 (lithium-ion batteries), Cluster #3 (smart charging approach) and Cluster #6 (electric vehicle power supply) are the most recently formed clusters, indicating that the research of these subjects just starts recently. It seems that Cluster #5 (aluminum oxide insulator) does not have much current high-profile publications.
7. Conclusions
In this paper, the research of electric vehicle charging system reliability from 1998 to 2017 is overviewed from a bibliometric perspective. The main goal of this study is to outline the characteristics of the objective research field, and provide the research trends in the near future.
According to the emerging trend forecast of the annual publication outputs based on the historical data, relevant studies will keep developing rapidly in the next few years. China and the USA are two influential countries which contribute greatly to this research field. Institutions and authors from these two countries collaborate a lot and provide high-quality scientific research. Several prolific journals are also identified, for the convenience of researchers to discover relevant studies and to choose proper journals when submitting their own papers.
According to the co-occurrence analysis, two major topics identified in this review are vehicle-to-grid (V2G) and energy management. Several challenges confronted by V2G are presented in Section 6.2, so corresponding research can be done, such as the analysis of the degradation process of batteries, the technologies to extend the battery life, and the reliability of the connection between an EV and a grid. Another hotspot issue is the energy management system for hybrid electric vehicles. According to the analysis in Section 6.2, further research may focus on the hardware or real-time applications of EMS, the technologies to improve the effectiveness, reliability and stability of the EMS, and so on.
Additionally, it is found that maintenance strategies of the electric vehicle charging system have not attracted much attention until now. In practice, the EV charging system is not steady enough, so it may sometimes break down because of the immature technology. Due to the huge price of system failure, high reliability is required for the EV charging system. Appropriate maintenance strategies play an important role to ensure high performance of EVs, so research is supposed to be taken into consideration in the future.
Author Contributions
Conceptualization, X.Z.; methodology, X.Z., S.W., and X.W.; validation, X.Z.; formal analysis, X.Z., S.W., and X.W.; investigation, X.Z., S.W., and X.W.; resources, X.Z., S.W., and X.W.; data curation, X.Z., S.W., and X.W.; writing—original draft preparation, S.W.; writing—review and editing, X.Z., and X.W.; visualization, X.Z., S.W., and X.W.; supervision, X.Z.; project administration, X.Z.; funding acquisition, X.Z.
Funding
This research was funded by the National Natural Science Foundation of China, grant number 71572014.
Conflicts of Interest
The authors declare no conflict of interest.
References
- Atabani, A.E.; Badruddin, I.A.; Mekhilef, S.; Silitonga, A.S. A review on global fuel economy standards, labels and technologies in the transportation sector. Renew. Sustain. Energy Rev. 2011, 15, 4586–4610. [Google Scholar] [CrossRef]
- Hao, H.; Geng, Y.; Li, W.; Guo, B. Energy consumption and GHG emissions from China’s freight transport sector: Scenarios through 2050. Energy Policy 2015, 85, 94–101. [Google Scholar] [CrossRef]
- Wang, N.; Tang, L.; Pan, H. Effectiveness of policy incentives on electric vehicle acceptance in China: A discrete choice analysis. Transp. Res. A Policy Pract. 2017, 105, 210–218. [Google Scholar] [CrossRef]
- Madawala, U.K.; Thrimawithana, D.J. A bidirectional inductive power interface for electric vehicles in V2G systems. IEEE Trans. Ind. Electron. 2011, 58, 4789–4796. [Google Scholar] [CrossRef]
- Saidur, R.; Abdelaziz, E.A.; Demirbas, A.; Hossain, M.S.; Mekhilef, S. A review on biomass as a fuel for boilers. Renew. Sustain. Energy Rev. 2011, 15, 2262–2289. [Google Scholar] [CrossRef]
- Mekhilef, S.; Faramarzi, S.Z.; Saidur, R.; Salam, Z. The application of solar technologies for sustainable development of agricultural sector. Renew. Sustain. Energy Rev. 2013, 18, 583–594. [Google Scholar] [CrossRef]
- Boys, J.T.; Elliott, G.A.J.; Covic, G.A. An Appropriate Magnetic Coupling Co-Efficient for the Design and Comparison of ICPT Pickups. IEEE Trans. Power Electr. 2007, 22, 333–335. [Google Scholar] [CrossRef]
- Hannan, M.A.; Azidin, F.A.; Mohamed, A. Hybrid electric vehicles and their challenges: A review. Renew. Sustain. Energy Rev. 2014, 29, 135–150. [Google Scholar] [CrossRef]
- Yuan, X.; Liu, X.; Zuo, J. The development of new energy vehicles for a sustainable future: A review. Renew. Sustain. Energy Rev. 2015, 42, 298–305. [Google Scholar] [CrossRef]
- Wu, X.; Wu, Y.; Zhang, S.; Liu, H.; Fu, L.; Hao, J. Assessment of vehicle emission programs in China during 1998-2013: Achievement, challenges and implications. Environ Pollut. 2016, 214, 556. [Google Scholar] [CrossRef] [PubMed]
- Chau, K.T.; Wong, Y.S.; Chan, C.C. An overview of energy sources for electric vehicles. Energy Convers. Manag. 1999, 40, 1021–1039. [Google Scholar] [CrossRef]
- Tie, S.F.; Tan, C.W. A review of energy sources and energy management system in electric vehicles. Renew. Sustain. Energy Rev. 2013, 20, 82–102. [Google Scholar] [CrossRef]
- Wilberforce, T.; El-Hassan, Z.; Khatib, F.N.; Makky, A.A.; Baroutaji, A.; Carton, J.G.; Olabi, A.G. Developments of electric cars and fuel cell hydrogen electric cars. Int. J. Hydrog. Energy 2017, 42, 25695–25734. [Google Scholar] [CrossRef]
- Miller, J.F.; Howell, D. The EV Everywhere Grand Challenge. In Proceedings of the Electric Vehicle Symposium and Exhibition, Barcelona, Spain, 17–20 November 2013; pp. 1–6. [Google Scholar]
- Gong, H.; Wang, M.Q.; Wang, H. New energy vehicles in China: Policies, demonstration, and progress. Mitig. Adapt. Strateg. Glob. Chang. 2013, 18, 207–228. [Google Scholar] [CrossRef]
- Wei, Z.; Li, Y.; Zhang, Y.; Cai, L. Intelligent Parking Garage EV Charging Scheduling Considering Battery Charging Characteristic. IEEE Trans. Ind. Electron. 2017, 65, 2806–2816. [Google Scholar] [CrossRef]
- Wang, L.; Sharkh, S.; Chipperfield, A. Optimal coordination of vehicle-to-grid batteries and renewable generators in a distribution system. Energy 2016, 113, 1250–1264. [Google Scholar] [CrossRef] [Green Version]
- Song, K.; Agyeman, D.A.; Park, M.; Yang, J.; Kang, Y.M. High-Energy-Density Metal–Oxygen Batteries: Lithium–Oxygen Batteries vs Sodium–Oxygen Batteries. Adv. Mater. 2017, 29, 1606572. [Google Scholar] [CrossRef] [PubMed]
- Lu, C.; Rooney, D.W.; Jiang, X.; Sun, W.; Wang, Z.; Wang, J.; Sun, K. Achieving high specific capacity of lithium-ion battery cathodes by modification with “N–O˙” radicals and oxygen-containing functional groups. J. Mater. Chem. A 2017, 5, 24636–24644. [Google Scholar] [CrossRef]
- Andre, D.; Hain, H.; Lamp, P.; Maglia, F.; Stiaszny, B. Future high-energy density anode materials from an automotive application perspective. J. Mater. Chem. A 2017, 5, 17174–17198. [Google Scholar] [CrossRef]
- Martínez-Lao, J.; Montoya, F.G.; Montoya, M.G.; Manzano-Agugliaro, F. Electric vehicles in Spain: An overview of charging systems. Renew. Sustain. Energy Rev. 2017, 77, 970–983. [Google Scholar] [CrossRef]
- Budhia, M.; Covic, G.A.; Boys, J.T.; Huang, C.Y. Development and evaluation of single sided flux couplers for contactless electric vehicle charging. In Proceedings of the Energy Conversion Congress and Exposition, Phoenix, AZ, USA, 17–22 September 2011; pp. 614–621. [Google Scholar]
- Kalwar, K.A.; Aamir, M.; Mekhilef, S. Inductively coupled power transfer (ICPT) for electric vehicle charging—A review. Renew. Sustain. Energy Rev. 2015, 47, 462–475. [Google Scholar] [CrossRef]
- Gallardo-Lozano, J.; Milanés-Montero, M.I.; Guerrero-Martínez, M.A.; Romero-Cadaval, E. Electric vehicle battery charger for smart grids. Electr. Power Syst. Res. 2012, 90, 18–29. [Google Scholar] [CrossRef]
- Shi, C.; Tang, Y.; Khaligh, A. A single-phase integrated onboard battery charger using propulsion system for plug-in electric vehicles. IEEE Trans. Ind. Electron. 2017, 66, 10899–10910. [Google Scholar] [CrossRef]
- Li, W.; Zhao, H.; Deng, J.; Li, S.; Mi, C.C. Comparison study on SS and double-sided LCC compensation topologies for EV/PHEV wireless chargers. IEEE Trans. Ind. Electron. 2016, 65, 4429–4439. [Google Scholar] [CrossRef]
- Jaguemont, J.; Boulon, L.; Dubé, Y. A comprehensive review of lithium-ion batteries used in hybrid and electric vehicles at cold temperatures. Appl. Energy 2016, 164, 99–114. [Google Scholar] [CrossRef]
- Griffith, W.S. Optimal Reliability Modeling: Principles and Applications. Technometrics 2004, 46, 112. [Google Scholar] [CrossRef]
- Ziegel, E.R. System Reliability Theory: Models, Statistical Methods, and Applications; E. Horwood: Chichester, UK, 2004; pp. 79–80. [Google Scholar]
- Poppe, J.; Basten, R.J.I.; Boute, R.N.; Lambrecht, M.R. Numerical study of inventory management under various maintenance policies. Reliab. Eng. Syst. Safe 2017, 168, 262–273. [Google Scholar] [CrossRef]
- Keizer, M.C.A.O.; Flapper, S.D.P.; Teunter, R.H. Condition-based maintenance policies for systems with multiple dependent components: A review. Eur. J. Oper. Res. 2017, 261, 405–420. [Google Scholar] [CrossRef]
- Zhao, X.; Guo, X.; Wang, X. Reliability and maintenance policies for a two-stage shock model with self-healing mechanism. Reliab. Eng. Syst. Safe 2018, 172, 185–194. [Google Scholar] [CrossRef]
- Du, H.; Guo, C.L. Reliability Evaluation of Fast-Charging EV Station Entry to Generation and Transmission Electrical System. Adv. Mater. Res. 2013, 860–863, 1096–1100. [Google Scholar] [CrossRef]
- Davidov, S.; Pantoš, M. Planning of electric vehicle infrastructure based on charging reliability and quality of service. Energy 2016, 118, 1156–1167. [Google Scholar] [CrossRef]
- Wang, X.; Karki, R. Exploiting PHEV to Augment Power System Reliability. IEEE Trans. Smart Grid 2016, 8, 2100–2108. [Google Scholar] [CrossRef]
- Bai, H.; Miao, S.; Qian, T.; Zhang, P. Reliability assessment based on combined power generation system for distribution system with electric vehicle. Trans. China Electrotech. Soc. 2015, 30, 127–137. [Google Scholar]
- Wang, H.L.; Liu, J.; Cao, M.; Chen, X.F.; Wang, D.D.; Zhang, S.Q. Safety and Reliability of Wireless Charging System for Electric Vehicles Based on the Yunnan Power Grid. Appl. Mech. Mater. 2014, 518, 324–328. [Google Scholar] [CrossRef]
- Cheng, L.; Chang, Y.; Wu, Q.; Lin, W.X.; Singh, C.A. Evaluating Charging Service Reliability for Plug-In EVs From the Distribution Network Aspect. IEEE Trans. Sustain. Energy 2014, 5, 1287–1296. [Google Scholar] [CrossRef]
- Zhao, Q.; Han, Y.H.; Xue, Y.B. Optimal operation of electric vehicle batteries in smart grids considering vehicle-to-grid technology. Dyna-Bilbao 2016, 91, 319–325. [Google Scholar]
- Valentina, R.; Viehl, A.; Bringmann, O.; Rosenstiel, W. Battery Aging Estimation for Eco-driving Strategy and Electric Vehicles Sustainability. In Proceedings of the IECON 2014—40th Annual Conference of the Ieee Industrial Electronics Society, Dallas, TX, USA, 28 October–1 November 2014; IEEE: New York, NY, USA, 2014; pp. 5622–5627. [Google Scholar]
- Xi, X.; Sioshansi, R.; Marano, V. Simulation–optimization model for location of a public electric vehicle charging infrastructure. Transp. Res. D Transp. Environ. 2013, 22, 60–69. [Google Scholar] [CrossRef]
- Arias, N.B.; Franco, J.F.; Lavorato, M.; Romero, R. Metaheuristic optimization algorithms for the optimal coordination of plug-in electric vehicle charging in distribution systems with distributed generation. Electr. Power Syst. Res. 2017, 142, 351–361. [Google Scholar] [CrossRef]
- Awasthi, A.; Venkitusamy, K.; Padmanaban, S.; Selvamuthukumaran, R.; Blaabjerg, F.; Singh, A.K. Optimal planning of electric vehicle charging station at the distribution system using hybrid optimization algorithm. Energy 2017, 133, 70–78. [Google Scholar] [CrossRef]
- Chen, C.; Hu, Z.; Liu, S.; Tseng, H. Emerging trends in regenerative medicine: A scientometric analysis in CiteSpace. Expert Opin. Biol. Ther. 2012, 12, 593. [Google Scholar] [CrossRef] [PubMed]
- Chen, D.; Liu, Z.; Luo, Z.; Webber, M.; Chen, J. Bibliometric and visualized analysis of emergy research. Ecol. Eng. 2016, 90, 285–293. [Google Scholar] [CrossRef]
- Li, C.; Wu, K.; Wu, J. A bibliometric analysis of research on haze during 2000–2016. Environ. Sci. Pollut. Res. 2017, 24, 24733–24742. [Google Scholar] [CrossRef] [PubMed] [Green Version]
- Wang, J.; Zhao, X.; Guo, X.; Li, B. Analyzing the research subjects and hot topics of power system reliability through the Web of Science from 1991 to 2015. Renew. Sustain. Energy Rev. 2018, 82, 700–713. [Google Scholar] [CrossRef]
- Sarin, S.; Haon, C.; Belkhouja, M. A Bibliometric Analysis of the Knowledge Exchange Patterns Between Major Technology and Innovation Management Journals (1999–2013). J. Prod. Innov. Manag. 2018, 35, 2–8. [Google Scholar] [CrossRef]
- Li, J.Q. Battery-electric transit bus developments and operations: A review. Int. J. Sustain. Transp. 2016, 10, 157–169. [Google Scholar] [CrossRef]
- Bhatti, A.R.; Salam, Z.; Aziz, M.J.B.A.; Yee, K.P. A critical review of electric vehicle charging using solar photovoltaic. Int. J. Energy Res. 2016, 40, 439–461. [Google Scholar] [CrossRef]
- Pörtner, H.O. Ecosystem effects of ocean acidification in times of ocean warming: A physiologist’s view. BMC Biotechnol. 2008, 373, 203–217. [Google Scholar]
- Tho, S.W.; Yeung, Y.Y.; Wei, R.; Chan, K.W.; So, W.M. A Systematic Review of Remote Laboratory Work in Science Education with the Support of Visualizing its Structure through the HistCite and CiteSpace Software. Int. J. Sci. Math. Educ. 2016, 15, 1217–1236. [Google Scholar] [CrossRef]
- Jeong, D.; Koo, Y. Analysis of Trend and Convergence for Science and Technology using the VOSviewer. Int. J. Contents 2016, 12, 54–58. [Google Scholar] [CrossRef] [Green Version]
- Pullen, J.M. The Network Workbench: Network simulation software for academic investigation of Internet concepts. Comput. Netw. 2000, 32, 365–378. [Google Scholar] [CrossRef]
- Morris, S.; Deyong, C.; Wu, Z.; Salman, S.; Yemenu, D. DIVA: A visualization system for exploring document databases for technology forecasting. Comput. Ind. Eng. 2002, 43, 841–862. [Google Scholar] [CrossRef]
- Li, X.; Guo, D.; Cheng, J. Study on map knowledge domains of transgenic maize: Based on CiteSpace. In Proceedings of the International Conference on Biotechnology and Medical Science, Offenburg, Germany, 26–28 September 2017; pp. 618–624. [Google Scholar]
- Chen, C. Searching for intellectual turning points: Progressive knowledge domain visualization. Proc. Natl. Acad. Sci. USA 2004, 101 (Suppl. 1), 5303. [Google Scholar] [CrossRef]
- Liang, Y.D.; Li, Y.; Zhao, J.; Wang, X.Y.; Zhu, H.Z.; Chen, X.H. Study of acupuncture for low back pain in recent 20 years: A bibliometric analysis via CiteSpace. J. Pain Res. 2017, 10, 951–964. [Google Scholar] [CrossRef] [PubMed]
- Chen, C. The centrality of pivotal points in the evolution of scientific networks. In Proceedings of the International Conference on Intelligent User Interfaces, San Diego, CA, USA, 10–13 January 2005; pp. 98–105. [Google Scholar]
- Kempton, W.; Tomić, J. Vehicle-to-grid power fundamentals: Calculating capacity and net revenue. J. Power Sources 2005, 144, 268–279. [Google Scholar] [CrossRef]
- Kempton, W.; Tomić, J. Vehicle-to-grid power implementation: From stabilizing the grid to supporting large-scale renewable energy. J. Power Sources 2005, 144, 280–294. [Google Scholar] [CrossRef]
- Tulpule, P.; Marano, V.; Rizzoni, G. Effects of Different PHEV Control Strategies on Vehicle Performance. In Proceedings of the American Control Conference, St. Louis, MO, USA, 10–12 June 2009; pp. 3950–3955. [Google Scholar]
- Dunn, B.; Kamath, H.; Tarascon, J.M. Electrical Energy Storage for the Grid: A Battery of Choices. Science 2011, 334, 928–935. [Google Scholar] [CrossRef] [PubMed]
- Clement-Nyns, K.; Haesen, E.; Driesen, J. The Impact of Charging Plug-In Hybrid Electric Vehicles on a Residential Distribution Grid. IEEE Trans. Power Syst. 2010, 25, 371–380. [Google Scholar] [CrossRef] [Green Version]
- Sortomme, E.; El-Sharkawi, M.A. Optimal Charging Strategies for Unidirectional Vehicle-to-Grid. IEEE Trans. Smart Grid 2011, 2, 131–138. [Google Scholar] [CrossRef]
- Han, S.; Han, S.; Sezaki, K. Development of an Optimal Vehicle-to-Grid Aggregator for Frequency Regulation. IEEE Trans. Smart Grid 2010, 1, 65–72. [Google Scholar]
- Guille, C.; Gross, G. A conceptual framework for the vehicle-to-grid (V2G) implementation. Energy Policy. Energy Policy 2009, 37, 4379–4390. [Google Scholar] [CrossRef]
- Tomić, J.; Kempton, W. Using fleets of electric-drive vehicles for grid support. J. Power Sources 2007, 168, 459–468. [Google Scholar] [CrossRef]
- Dubarry, M.; Liaw, B.Y. Identify capacity fading mechanism in a commercial LiFePO4 cell. J. Power Sources 2009, 194, 541–549. [Google Scholar] [CrossRef]
- Noori, M.; Tatari, O. Development of an agent-based model for regional market penetration projections of electric vehicles in the United States. Energy 2016, 96, 215–230. [Google Scholar] [CrossRef]
- Nykvist, B.; Nilsson, M. Rapidly falling costs of battery packs for electric vehicles. Nat. Clim. Chang. 2015, 5, 329–332. [Google Scholar] [CrossRef] [Green Version]
- Lu, L.; Han, X.; Li, J.; Hua, J.; Ouyang, M. A review on the key issues for lithium-ion battery management in electric vehicles. J. Power Sources 2013, 226, 272–288. [Google Scholar] [CrossRef]
- Ebensperger, A.; Maxwell, P.; Moscoso, C. The lithium industry: Its recent evolution and future prospects. Resour Policy 2005, 30, 218–231. [Google Scholar] [CrossRef]
- Sioshansi, R.; Denholm, P. The Value of Plug-In Hybrid Electric Vehicles as Grid Resources. Energy J. 2010, 31, 1–24. [Google Scholar] [CrossRef]
- Dallinger, D.; Krampe, D.; Wietschel, M. Vehicle-to-Grid regulation reserves based on a dynamic simulation of mobility behavior. IEEE Trans. Smart Grid 2011, 2, 302–313. [Google Scholar] [CrossRef]
- Lopes, J.A.P.; Soares, F.J.; Almeida, P.M.R. Integration of Electric Vehicles in the Electric Power System. Proc. IEEE 2010, 99, 168–183. [Google Scholar] [CrossRef]
- Peterson, S.B.; Whitacre, J.F.; Apt, J. The economics of using plug-in hybrid electric vehicle battery packs for grid storage. J. Power Sources 2010, 195, 2377–2384. [Google Scholar] [CrossRef]
- Quinn, C.; Zimmerle, D.; Bradley, T.H. The effect of communication architecture on the availability, reliability, and economics of plug-in hybrid electric vehicle-to-grid ancillary services. J. Power Sources 2010, 195, 1500–1509. [Google Scholar] [CrossRef]
- Bhangu, B.S.; Bentley, P.; Stone, D.A.; Bingham, C.M. Nonlinear observers for predicting state-of-charge and state-of-health of lead-acid batteries for hybrid-electric vehicles. IEEE Trans. Ind. Electron. 2005, 54, 783–794. [Google Scholar] [CrossRef]
- Su, W.; Chow, M.Y. Performance Evaluation of an EDA-Based Large-Scale Plug-In Hybrid Electric Vehicle Charging Algorithm. IEEE Trans. Smart Grid 2012, 3, 308–315. [Google Scholar] [CrossRef] [Green Version]
- Weiller, C. Plug-in hybrid electric vehicle impacts on hourly electricity demand in the United States. Energy Policy 2011, 39, 3766–3778. [Google Scholar] [CrossRef]
- Clement-Nyns, K.; Haesen, E.; Driesen, J. The impact of vehicle-to-grid on the distribution grid. Electr. Power Syst. Res. 2011, 81, 185–192. [Google Scholar] [CrossRef]
- Hajimiragha, A.; Canizares, C.A.; Fowler, M.W.; Elkamel, A. Optimal Transition to Plug-In Hybrid Electric Vehicles in Ontario, Canada, Considering the Electricity-Grid Limitations. IEEE Trans. Ind. Electron. 2010, 57, 690–701. [Google Scholar] [CrossRef]
- Kiviluoma, J.; Meibom, P. Methodology for modelling plug-in electric vehicles in the power system and cost estimates for a system with either smart or dumb electric vehicles. Energy 2011, 36, 1758–1767. [Google Scholar] [CrossRef]
- He, H.; Xiong, R.; Fan, J. Evaluation of Lithium-Ion Battery Equivalent Circuit Models for State of Charge Estimation by an Experimental Approach. Energies 2011, 4, 582–598. [Google Scholar] [CrossRef] [Green Version]
- Freeman, L.C. A Set of Measures of Centrality Based on Betweenness. Sociometry 1977, 40, 35–41. [Google Scholar] [CrossRef]
- Song, J.; Zhang, H.; Dong, W. A review of emerging trends in global PPP research: Analysis and visualization. Scientometrics 2016, 107, 1111–1147. [Google Scholar] [CrossRef]
- Chen, C. CiteSpace II: Detecting and Visualizing Emerging Trends and Transient Patterns in Scientific Literature; John Wiley & Sons, Inc.: Hoboken, NJ, USA, 2006; pp. 359–377. [Google Scholar]
- Su, C.; Chen, H.J. A review on prognostics approaches for remaining useful life of lithium-ion battery. In Proceedings of the IOP Conference Series: Earth and Environmental Science, Zvenigorod, Russia, 4–7 September 2017. [Google Scholar]
- Zhao, X.; Cai, Y.; Yang, L.; Deng, Z.; Qiang, J. State of charge estimation based on a new dual-polarization-resistance model for electric vehicles. Energy 2017, 135, 40–52. [Google Scholar] [CrossRef]
- Lin, C.; Mu, H.; Xiong, R.; Shen, W. A novel multi-model probability battery state of charge estimation approach for electric vehicles using H-infinity algorithm. Appl. Energy 2016, 166, 76–83. [Google Scholar] [CrossRef]
- Xiong, R.; Sun, F.; He, H.; Nguyen, T.D. A data-driven adaptive state of charge and power capability joint estimator of lithium-ion polymer battery used in electric vehicles. Energy 2013, 63, 295–308. [Google Scholar] [CrossRef]
- Zhou, X.; Zhao, G. Global Liposome Research in the Period of 1995–2014: A Bibliometric Analysis; Springer: New York, NY, USA, 2015; pp. 231–248. [Google Scholar]
- Habib, S.; Kamran, M.; Rashid, U. Impact analysis of vehicle-to-grid technology and charging strategies of electric vehicles on distribution networks—A review. J. Power Sources 2015, 277, 205–214. [Google Scholar] [CrossRef]
- Kempton, W.; Tomic, J.; Letendre, S.; Brooks, A.; Lipman, T. Vehicle-to-Grid Power: Battery, Hybrid, and Fuel Cell Vehicles as Resources for Distributed Electric Power in California; Institute of Transportation Studies Working Paper; Institute of Transportation Studies, UC Davis: Davis, CA, USA, 2001. [Google Scholar]
- Gage, T.B. Development and Evaluation of a Plug-in HEV with Vehicle-to-Grid Power Flow; International Committee for Abrasive Technology: Chennai, India, 2003. [Google Scholar]
- Bevis, T.; Hacker, B.; Edrington, C.S.; Azongha, S. A review of PHEV grid impacts. In Proceedings of the North American Power Symposium, Starkville, MS, USA, 4–6 October 2009; pp. 1–6. [Google Scholar]
- Denholm, P.; Short, W. An Evaluation of Utility System Impacts and Benefits of Optimally Dispatched Plug-In Hybrid Electric Vehicles; Office of Scientific & Technical Information Technical Reports; National Renewable Energy Lab.: Golden, CO, USA, 2006.
- Srivastava, A.K.; Annabathina, B.; Kamalasadan, S. The Challenges and Policy Options for Integrating Plug-in Hybrid Electric Vehicle into the Electric Grid. Electr. J. 2010, 23, 83–91. [Google Scholar] [CrossRef]
- Hannan, M.A.; Azidin, F.A.; Mohamed, A. Multi-sources model and control algorithm of an energy management system for light electric vehicles. Energy Convers. Manag. 2012, 62, 123–130. [Google Scholar] [CrossRef]
- Li, C.Y.; Liu, G.P. Optimal Fuzzy Power Control And Management Of Fuel Cell/Battery Hybrid Vehicles. J. Power Sources 2009, 192, 525–533. [Google Scholar] [CrossRef]
- Sulaiman, N.; Hannan, M.A.; Mohamed, A.; Majlan, E.H.; Daud, W.R.W. A review on energy management system for fuel cell hybrid electric vehicle: Issues and challenges. Renew. Sustain. Energy Rev. 2015, 52, 802–814. [Google Scholar] [CrossRef]
- Thanapalan, K.; Zhang, F.; Premier, G.; Maddy, J.; Guwy, A. Energy management effects of integrating regenerative braking into a Renewable Hydrogen Vehicle. In Proceedings of the UKACC International Conference on Control, Cardiff, UK, 3–5 September 2012; pp. 924–928. [Google Scholar]
- Kwon, Y.; Kwasinski, A.; Kwasinski, A. Coordinated Energy Management in Resilient Microgrids for Wireless Communication Networks. IEEE J. Emerg. Sel. Top. Power Electron. 2016, 4, 1158–1173. [Google Scholar] [CrossRef]
- Vatanparvar, K.; Al Faruque, M.A. OTEM: Optimized thermal and energy management for hybrid electrical energy storage in electric vehicles. In Proceedings of the Design, Automation & Test in Europe Conference & Exhibition, Dresden, Germany, 14–18 March 2016; pp. 19–24. [Google Scholar]
- Xiao, J.; Wang, P.; Setyawan, L. Multilevel Energy Management System for Hybridization of Energy Storages in DC Microgrids. IEEE Trans. Smart Grid 2016, 7, 847–856. [Google Scholar] [CrossRef]
- Zheng, C.H.; Lin, W.S. Self-optimizing energy management strategy for fuel-cell/ultracapacitor hybrid vehicles. In Proceedings of the International Conference on Connected Vehicles and Expo, Las Vegas, NV, USA, 2–6 December 2013; pp. 87–93. [Google Scholar]
Figure 1.
Research methodology.

Figure 2.
The annual numbers of publications from 1998 to 2017.

Figure 3.
The fitting curve of the publication outputs developing trend.

Figure 4.
The distribution of document types.

Figure 5.
The annual publication outputs of the USA and China from 1998 to 2017.
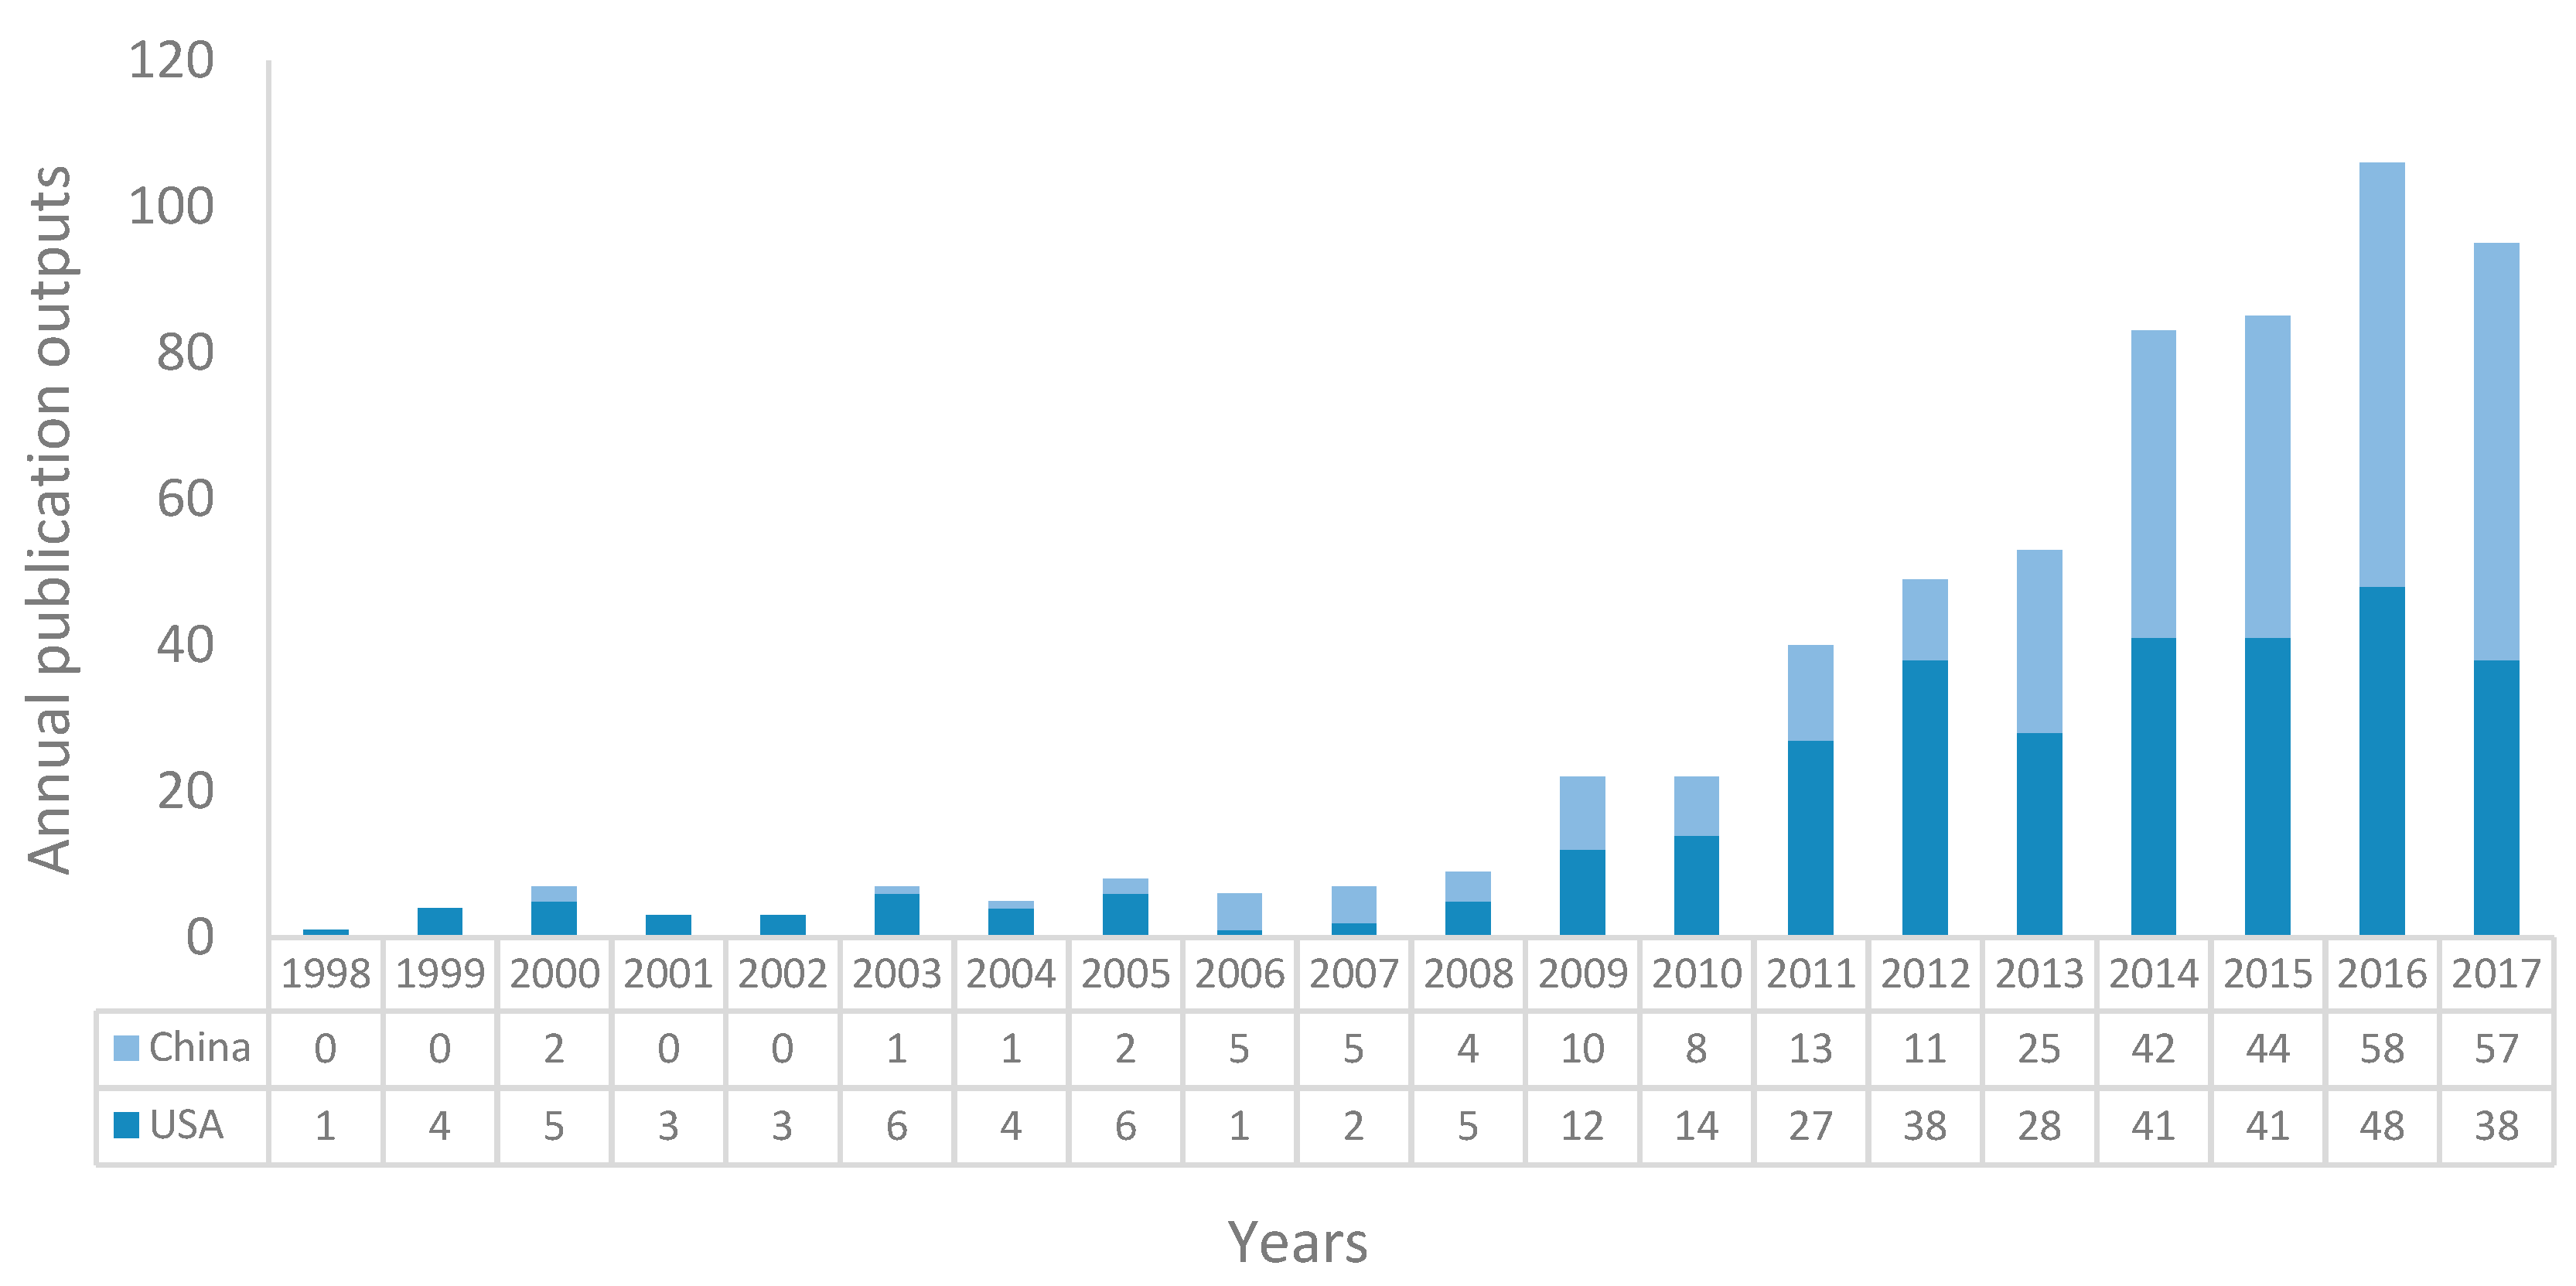
Figure 6.
(a) A USA-centered collaboration network; (b) A China-centered collaboration network.

Figure 7.
The collaboration network of institutions.

Figure 8.
The collaboration network of authors.
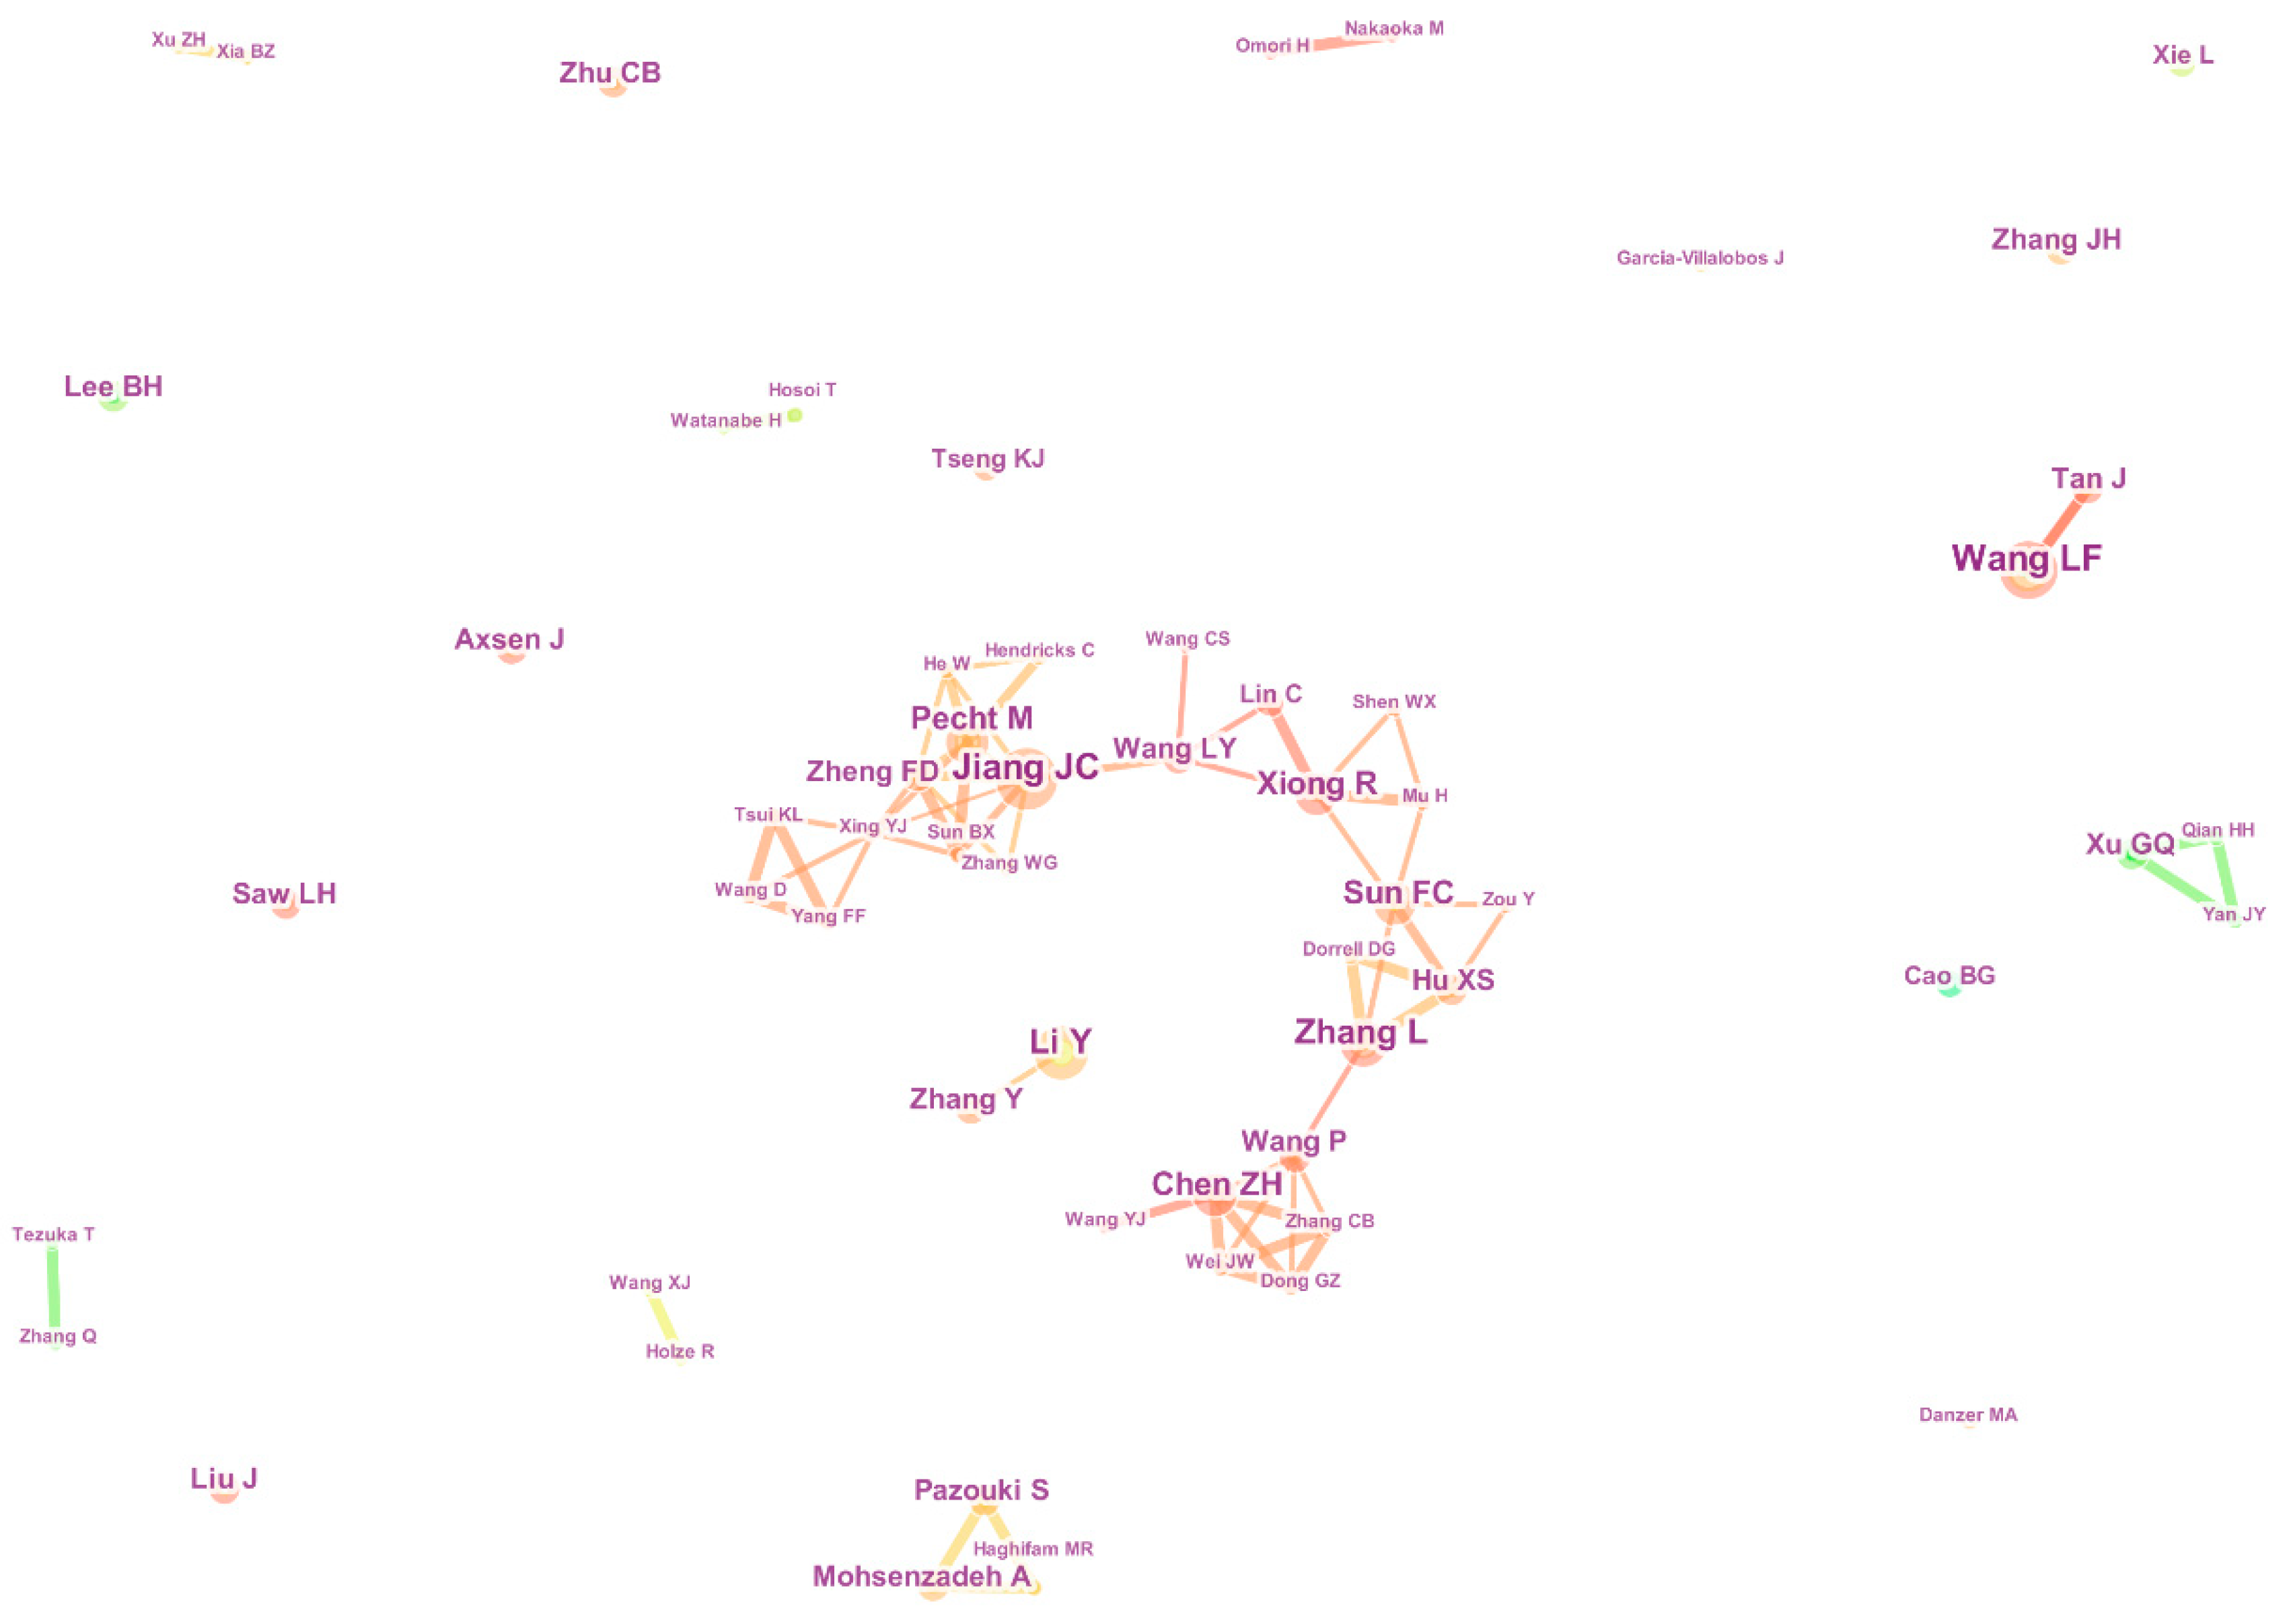
Figure 9.
The co-citation network of cited authors.

Figure 10.
The co-citation network of cited references.
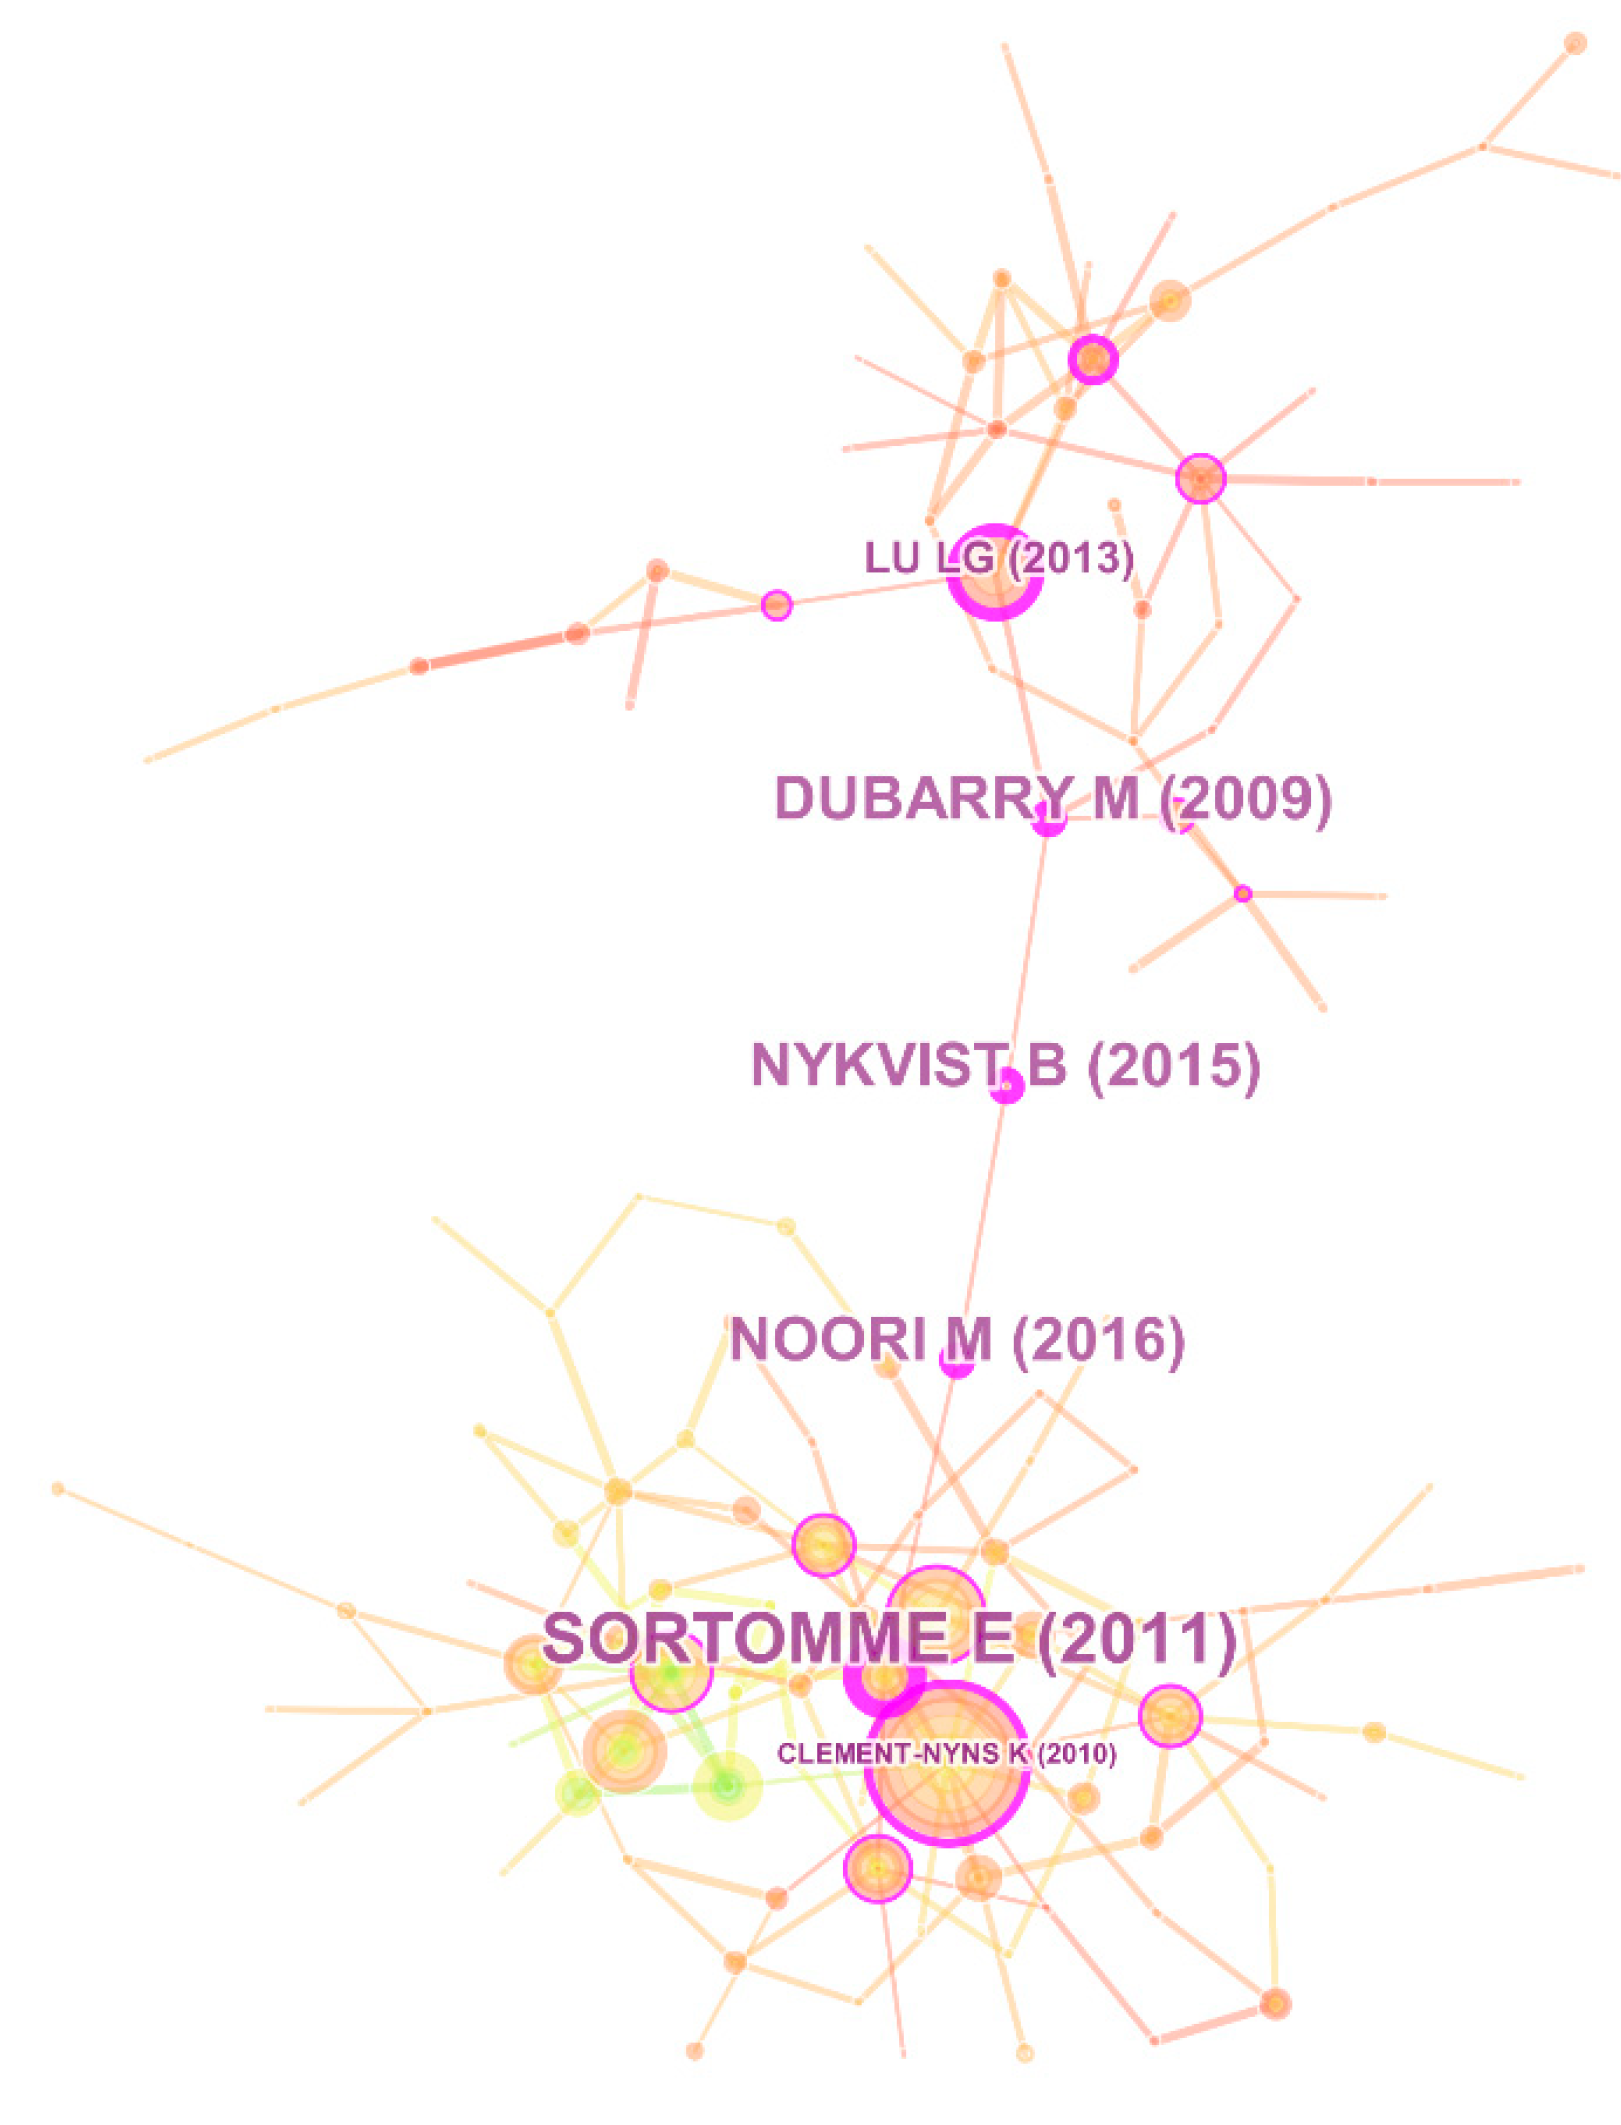
Figure 11.
The co-occurrence network of different subject categories.
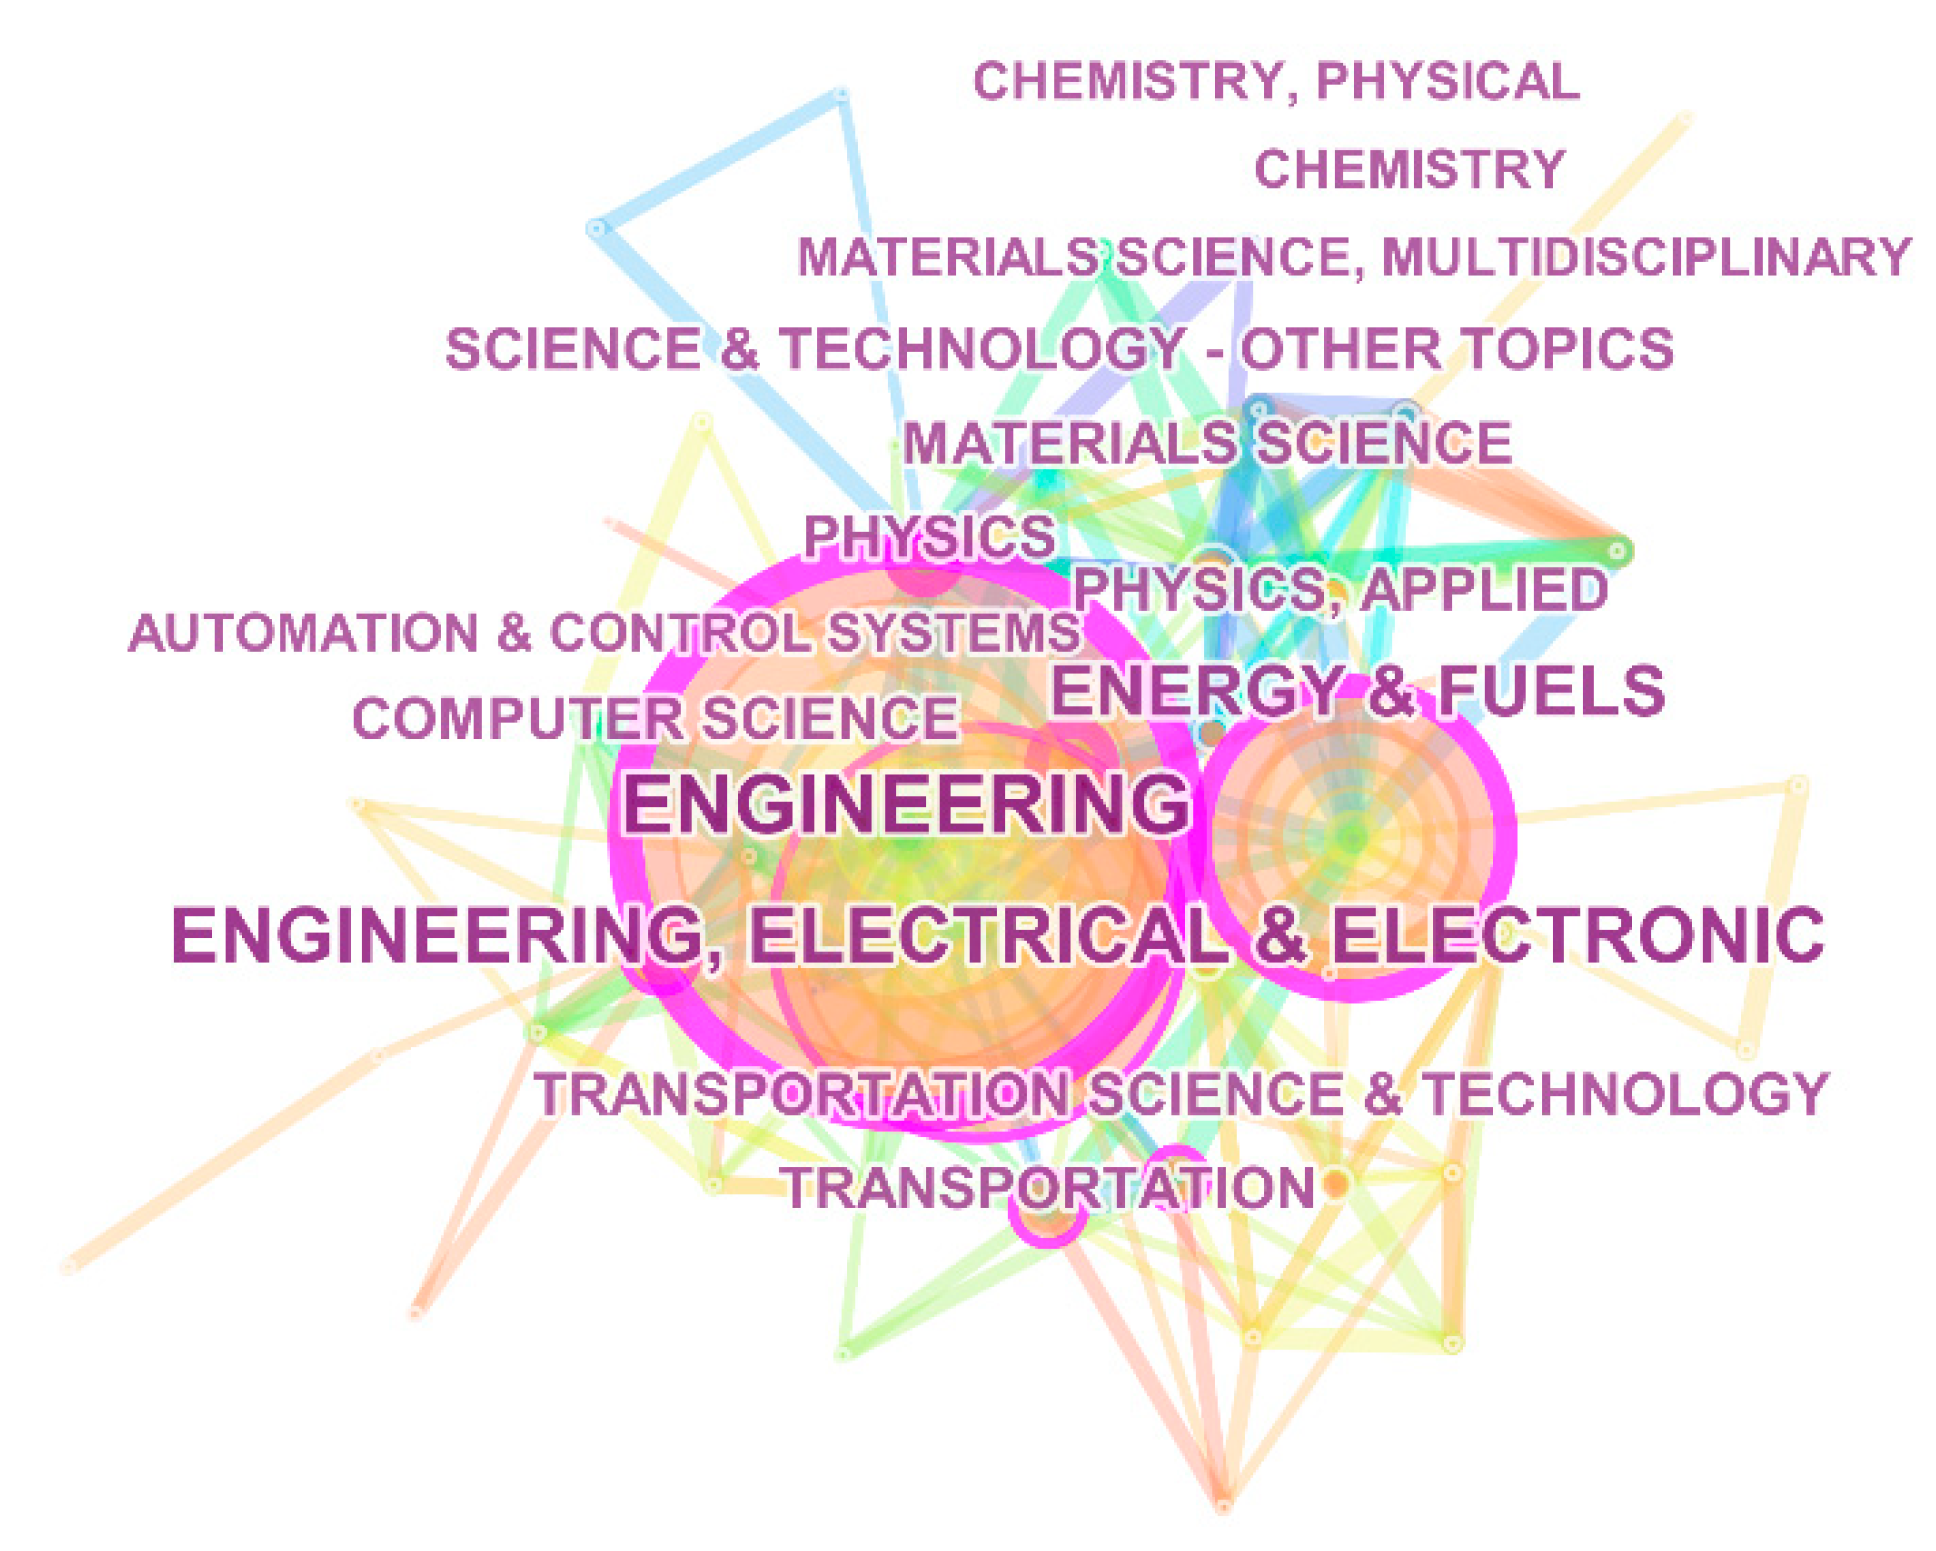
Figure 12.
The timelines for co-occurrence keywords clusters.


Table 1.
Search terms.
| No. | Category | Keywords |
|---|---|---|
| 1 | Electric vehicle | “Electric vehicle” or “EV” or “electric car” or “electric automobile” |
| 1.1 | Battery electric vehicle | “BEV”(Battery/Blade electric vehicle) or “PEV”(pure electric vehicle) |
| 1.2 | Hybrid electric vehicle | “HEV” or “PHEV”(Plug-in hybrid electric vehicle) |
| 1.3 | Fuel cell electric vehicle | “FCEV” |
| 2 | Charging system | “Charge” or “recharge” or “charging” or “recharging” or “battery” |
| 3 | Reliability | “Reliability” or “mean time to failure” or “MTTF” or “availability” or “mean time to first failure” or “MTTFF” or “mean time between failures” or “MTBF” or “maintenance strategy” or “maintenance policy” or “preventive maintenance” or “corrective maintenance” |
Table 2.
The top 11 most prolific journals.
| Rank | Journal | Count | Percent | IF (2017) |
|---|---|---|---|---|
| 1 | Journal of Power Sources | 45 | 3.79% | 6.945 |
| 2 | Applied Energy | 33 | 2.78% | 7.900 |
| 3 | Energies | 33 | 2.78% | 2.676 |
| 4 | Energy | 23 | 1.94% | 4.968 |
| 5 | IEEE Transactions on Smart Grid | 23 | 1.94% | 7.364 |
| 6 | Renewable & Sustainable Energy Reviews | 19 | 1.60% | 9.184 |
| 7 | Journal of Applied Physics | 16 | 1.35% | 2.176 |
| 8 | IEEE Transactions on Electron Devices | 15 | 1.26% | 2.620 |
| 9 | Applied Physics Letters | 14 | 1.18% | 3.495 |
| 10 | IEEE Transactions on Power Electronics | 13 | 1.09% | 6.812 |
| 11 | IEEE Transactions on Vehicular Technology | 13 | 1.09% | 4.432 |
Table 3.
The top 10 most productive countries with the corresponding count and percent.
| Rank | Country | Count | Percent | Rank | Country | Count | Percent |
|---|---|---|---|---|---|---|---|
| 1 | USA | 327 | 27.52% | 6 | South Korea | 55 | 4.63% |
| 2 | China | 288 | 24.24% | 7 | Italy | 49 | 4.12% |
| 3 | Germany | 80 | 6.73% | 8 | India | 48 | 4.04% |
| 4 | Canada | 67 | 5.64% | 9 | Japan | 47 | 3.96% |
| 5 | England | 56 | 4.71% | 10 | Iran | 44 | 3.70% |
Table 4.
The top 10 most productive institutions.
| Rank | Institution | Country | Count | Percent |
|---|---|---|---|---|
| 1 | Beijing Institute of Technology | China | 25 | 2.10% |
| 2 | Tsinghua University | China | 22 | 1.85% |
| 3 | Chinese Academy of Sciences | China | 18 | 1.52% |
| 4 | Beijing Jiaotong University | China | 15 | 1.26% |
| 5 | Harbin Institute of Technology | China | 14 | 1.18% |
| 6 | Indian Institute of Technology | India | 14 | 1.18% |
| 7 | University of Michigan | USA | 13 | 1.09% |
| 8 | Nanyang Technological University | Singapore | 13 | 1.09% |
| 9 | Hong Kong Polytechnic University | China | 13 | 1.09% |
| 10 | Chongqing University | China | 13 | 1.09% |
Table 5.
The top 10 most productive authors.
| Rank | Author | Institution | Country | Count |
|---|---|---|---|---|
| 1 | Wang LF | University of Toledo | USA | 11 |
| 2 | Jiang JC | Beijing Jiaotong University | China | 10 |
| 3 | Sun FC | Beijing Institute of Technology | China | 9 |
| 4 | Li Y | Shandong University | China | 8 |
| 5 | Xiong R | Beijing Institute of Techonology | China | 8 |
| 6 | Lee BH | Hanyang University | South Korea | 7 |
| 7 | Pecht M | University of Marylan | USA | 7 |
| 8 | Wang LY | Wayne State University | USA | 7 |
| 9 | Zhang L | Northeast Electric Power University | China | 7 |
| 10 | Xu GQ | Beijing Institute of Technology | China | 7 |
Table 6.
The top 10 cited authors ranked by count and betweenness centrality, respectively.
| Rank | Count | Cited Author | Betweenness Centrality | Cited Author |
|---|---|---|---|---|
| 1 | 114 | Kempton W | 0.38 | Kempton W |
| 2 | 71 | Clement-Nyns K | 0.20 | Xiong R |
| 3 | 65 | Sortomme E | 0.19 | Saber AY |
| 4 | 61 | Han S | 0.18 | Clement-Nyns K |
| 5 | 49 | Plett GL | 0.18 | Peterson SB |
| 6 | 38 | Yilmaz M | 0.17 | Guille C |
| 7 | 35 | Dallinger D | 0.17 | Tomic J |
| 8 | 34 | Guille C | 0.17 | Quinn C |
| 9 | 33 | Hu XS | 0.15 | Chan CC |
| 10 | 32 | He HW | 0.15 | Hadley SW |
Table 7.
The top 5 cited references ranked by count.
| Rank | Count | Reference |
|---|---|---|
| 1 | 59 | Clement-Nyns K (2010) [64] |
| 2 | 36 | Han S (2010) [66] |
| 3 | 32 | Guille C (2009) [67] |
| 4 | 31 | Tomic J (2007) [68] |
| 5 | 29 | Kempton W (2005) [61] |
Table 8.
The top 5 cited references ranked by betweenness centrality.
| Rank | Betweenness Centrality | Reference |
|---|---|---|
| 1 | 0.63 | Sortomme E (2011) [65] |
| 2 | 0.57 | Dubarry M (2009) [69] |
| 3 | 0.56 | Noori M (2016) [70] |
| 4 | 0.55 | Bykvist B (2015) [71] |
| 5 | 0.42 | Lu LG (2013) [72] |
Table 9.
The top 18 references with the strongest citation bursts.
| Reference | Burst | Duration | Range (1998–2017) |
|---|---|---|---|
| Kempton W (2005) [60] | 16.4371 | 2008–2013 | ▂▂▂▂▂▂▂▂▂▂▃▃▃▃▃▃▂▂▂▂ |
| Tomic J (2007) [68] | 5.5099 | 2011–2013 | ▂▂▂▂▂▂▂▂▂▂▂▂▂▃▃▃▂▂▂▂ |
| Kempton W (2005) [61] | 11.297 | 2011–2013 | ▂▂▂▂▂▂▂▂▂▂▂▂▂▃▃▃▂▂▂▂ |
| Ebensperger A (2005) [73] | 3.2865 | 2012–2012 | ▂▂▂▂▂▂▂▂▂▂▂▂▂▂▃▂▂▂▂▂ |
| Sioshansi R (2010) [74] | 3.2865 | 2012–2012 | ▂▂▂▂▂▂▂▂▂▂▂▂▂▂▃▂▂▂▂▂ |
| Dallinger D (2011) [75] | 3.0456 | 2012–2014 | ▂▂▂▂▂▂▂▂▂▂▂▂▂▂▃▃▃▂▂▂ |
| Lopes JAP (2010) [76] | 3.4071 | 2013–2014 | ▂▂▂▂▂▂▂▂▂▂▂▂▂▂▂▃▃▂▂▂ |
| Peterson SB (2010) [77] | 4.6309 | 2013–2014 | ▂▂▂▂▂▂▂▂▂▂▂▂▂▂▂▃▃▂▂▂ |
| Han S (2010) [66] | 3.3026 | 2013–2014 | ▂▂▂▂▂▂▂▂▂▂▂▂▂▂▂▃▃▂▂▂ |
| Quinn C (2010) [78] | 3.658 | 2013–2013 | ▂▂▂▂▂▂▂▂▂▂▂▂▂▂▂▃▂▂▂▂ |
| Bhangu BS (2005) [79] | 4.2728 | 2013–2013 | ▂▂▂▂▂▂▂▂▂▂▂▂▂▂▂▃▂▂▂▂ |
| Su WC (2012) [80] | 3.5532 | 2014–2014 | ▂▂▂▂▂▂▂▂▂▂▂▂▂▂▂▂▃▂▂▂ |
| Weiller C (2011) [81] | 3.1618 | 2014–2015 | ▂▂▂▂▂▂▂▂▂▂▂▂▂▂▂▂▃▃▂▂ |
| Clement-Nyns K (2011) [82] | 3.5532 | 2014–2014 | ▂▂▂▂▂▂▂▂▂▂▂▂▂▂▂▂▃▂▂▂ |
| Hajimiragha A (2010) [83] | 3.3426 | 2015–2015 | ▂▂▂▂▂▂▂▂▂▂▂▂▂▂▂▂▂▃▂▂ |
| Kiviluoma J (2011) [84] | 3.3426 | 2015–2015 | ▂▂▂▂▂▂▂▂▂▂▂▂▂▂▂▂▂▃▂▂ |
| He HW (2011) [85] | 3.697 | 2016–2017 | ▂▂▂▂▂▂▂▂▂▂▂▂▂▂▂▂▂▂▃▃ |
| Lu LG (2013) [72] | 4.8206 | 2016–2017 | ▂▂▂▂▂▂▂▂▂▂▂▂▂▂▂▂▂▂▃▃ |
Table 10.
The top 10 subjects ranked by count and betweenness centrality respectively.
| Rank | Subject | Count | Percent | Subject | Betweenness Centrality |
|---|---|---|---|---|---|
| 1 | Engineering | 692 | 58.25% | Engineering | 0.59 |
| 2 | Engineering, electrical & electronic | 555 | 46.72% | Energy & fuels | 0.35 |
| 3 | Energy & fuels | 366 | 30.81% | Physics | 0.33 |
| 4 | Physics | 144 | 12.12% | Science & technology-other topics | 0.23 |
| 5 | Transportation | 136 | 11.45% | Engineering, electrical & electronic | 0.15 |
| 6 | Transportation science & technology | 126 | 10.61% | Transportation | 0.15 |
| 7 | Computer science | 118 | 9.93% | Computer science | 0.14 |
| 8 | Physics, applied | 113 | 9.51% | Transportation science & technology | 0.1 |
| 9 | Materials science | 106 | 8.92% | Chemistry | 0.1 |
| 10 | Science & technology-other topics | 94 | 7.91% | Engineering, multidisciplinary | 0.09 |
Table 11.
The top 10 keywords ranked by count and betweenness centrality, respectively.
| Rank | Keyword | Count | Percent | Keyword | Betweenness Centrality |
|---|---|---|---|---|---|
| 1 | Electric vehicle | 327 | 27.53% | Electric vehicle | 0.34 |
| 2 | System | 113 | 9.51% | System | 0.21 |
| 3 | Reliability | 100 | 8.42% | Reliability | 0.19 |
| 4 | Lithium ion battery | 73 | 6.14% | Lithium ion battery | 0.15 |
| 5 | Battery | 72 | 6.06% | Battery | 0.14 |
| 6 | Model | 65 | 5.47% | Smart grid | 0.11 |
| 7 | Smart grid | 60 | 5.05% | Hybrid electric vehicle | 0.10 |
| 8 | Management | 51 | 4.29% | Demand | 0.09 |
| 9 | Optimization | 48 | 4.04% | Optimization | 0.08 |
| 10 | Energy | 47 | 3.96% | Technology | 0.08 |
Table 12.
The top 16 keywords with the strongest citation bursts.
| Keywords | Year | Strength | Begin | End | Range (1998–2017) |
|---|---|---|---|---|---|
| Reliability | 1998 | 12.8844 | 2000 | 2012 | ▂▂▃▃▃▃▃▃▃▃▃▃▃▃▃▂▂▂▂▂ |
| Film | 1998 | 3.9664 | 2000 | 2008 | ▂▂▃▃▃▃▃▃▃▃▃▂▂▂▂▂▂▂▂▂ |
| Oxide | 1998 | 4.7488 | 2000 | 2006 | ▂▂▃▃▃▃▃▃▃▂▂▂▂▂▂▂▂▂▂▂ |
| Battery | 1998 | 4.6551 | 2001 | 2013 | ▂▂▂▃▃▃▃▃▃▃▃▃▃▃▃▃▂▂▂▂ |
| Electric vehicle | 1998 | 18.4077 | 2005 | 2012 | ▂▂▂▂▂▂▂▃▃▃▃▃▃▃▃▂▂▂▂▂ |
| Smart grid | 1998 | 5.8148 | 2011 | 2012 | ▂▂▂▂▂▂▂▂▂▂▂▂▂▃▃▂▂▂▂▂ |
| Vehicle to grid | 1998 | 2.361 | 2012 | 2014 | ▂▂▂▂▂▂▂▂▂▂▂▂▂▂▃▃▃▂▂▂ |
| System | 1998 | 4.61 | 2012 | 2013 | ▂▂▂▂▂▂▂▂▂▂▂▂▂▂▃▃▂▂▂▂ |
| Energy storage | 1998 | 2.7195 | 2012 | 2013 | ▂▂▂▂▂▂▂▂▂▂▂▂▂▂▃▃▂▂▂▂ |
| Power system | 1998 | 2.2313 | 2014 | 2015 | ▂▂▂▂▂▂▂▂▂▂▂▂▂▂▂▂▃▃▂▂ |
| V2G | 1998 | 2.9758 | 2014 | 2015 | ▂▂▂▂▂▂▂▂▂▂▂▂▂▂▂▂▃▃▂▂ |
| Vehicle | 1998 | 3.0208 | 2014 | 2015 | ▂▂▂▂▂▂▂▂▂▂▂▂▂▂▂▂▃▃▂▂ |
| Market | 1998 | 1.5111 | 2014 | 2015 | ▂▂▂▂▂▂▂▂▂▂▂▂▂▂▂▂▃▃▂▂ |
| Electric vehicle (ev) | 1998 | 2.2313 | 2014 | 2015 | ▂▂▂▂▂▂▂▂▂▂▂▂▂▂▂▂▃▃▂▂ |
| Energy management | 1998 | 1.4687 | 2014 | 2017 | ▂▂▂▂▂▂▂▂▂▂▂▂▂▂▂▂▃▃▃▃ |
| Vehicle-to-grid (V2G) | 1998 | 2.1761 | 2015 | 2017 | ▂▂▂▂▂▂▂▂▂▂▂▂▂▂▂▂▂▃▃▃ |
© 2018 by the authors. Licensee MDPI, Basel, Switzerland. This article is an open access article distributed under the terms and conditions of the Creative Commons Attribution (CC BY) license (http://creativecommons.org/licenses/by/4.0/).
Share and Cite
MDPI and ACS Style
Zhao, X.; Wang, S.; Wang, X. Characteristics and Trends of Research on New Energy Vehicle Reliability Based on the Web of Science. Sustainability 2018, 10, 3560. https://doi.org/10.3390/su10103560
AMA Style
Zhao X, Wang S, Wang X. Characteristics and Trends of Research on New Energy Vehicle Reliability Based on the Web of Science. Sustainability. 2018; 10(10):3560. https://doi.org/10.3390/su10103560
Chicago/Turabian StyleZhao, Xian, Siqi Wang, and Xiaoyue Wang. 2018. "Characteristics and Trends of Research on New Energy Vehicle Reliability Based on the Web of Science" Sustainability 10, no. 10: 3560. https://doi.org/10.3390/su10103560
Note that from the first issue of 2016, this journal uses article numbers instead of page numbers. See further details here.