Determinants of Environmental Efficiency of the EU Countries Using Two-Step DEA Approach


1
Department of Economics, Faculty of Business Economics with seat in Košice, University of Economics in Bratislava, Tajovského 13, 041 30 Košice, Slovakia
2
Department of Quantitative Methods, Faculty of Business Economics with seat in Košice, University of Economics in Bratislava, Tajovského 13, 041 30 Košice, Slovakia
*
Author to whom correspondence should be addressed.
Sustainability 2018, 10(10), 3525; https://doi.org/10.3390/su10103525
Submission received: 26 August 2018
/
Revised: 21 September 2018
/
Accepted: 29 September 2018
/
Published: 30 September 2018
Abstract
:The article discusses the environmental efficiency of the countries of the European Union and its main objective is to verify models that could be used to explain changes in efficiency in selected countries and to add to the contributions of other authors. Two-step Data Envelopment Analysis (DEA) has been used, which is a suitable method for verifying the statistical significance of environmental variables. Two DEA models—CCR and BCC—were used and efficiencies have undergone a double-bootstrap procedure. As input variables, three emission per capita indices were computed to single output GDP per capita. Three truncated regression models have been proposed. Results have shown that the model with drivers of climate change and variables connected to socio-economic factors is the most relevant and significant. There are common variables, whose improvement increases the efficiencies in all European Union countries, but there are also indices which have to be considered in individual/subgroup policies and implications, such as environmental taxes, waste management, resources productivity, and transport of goods management.
1. Introduction
Measuring environmental efficiency is one of the basic processes for improving the quality of the environment. Such measurement provides us with valuable information about the current state of the environment, but also provides implications for sustainable improvement of environmental policies in the future. At present, the main issue is the reduction of greenhouse gases emissions. In this study, we aim to evaluate the environmental efficiency of the European Union (EU) countries and explain efficiency obtained by selected indicators. We also focus on identifying selected issues that could imply a change in EU policies on assessment and improvement of the environment.
As the aim of this study is to assess the impact of the efficiency determinants in the EU, we researched the studies which researched the political or geological group of countries. In the previous literature, there are several studies that have addressed the topic of environmental efficiency of selected countries, economic or political communities. Some of these studies addressed global environmental issues [1,2,3,4], some addressed issues of selected political groups, such as the V4 [5], selected geographic groupings [6], or selected countries of the world [7,8,9,10,11], but many studies have dealt with the issue of environmental efficiency and the state of the environment in the EU. The authors of study [12] analyzed the countries of the European Union in 2001–2008 from the point of view of energy and environmental eco-efficiency; the authors found that countries with strong environmental policies are less efficient than countries where the environment is not so important, also pointing to the inefficiency of Eastern European countries. Another study [13] dealt with efficiency in the agricultural sphere and the associated planning of environmentally friendly measures, pointing again to the higher efficiency of the countries that joined the EU earlier, recommending to focus also on environmental resource overexploitation. The study of [14] points to the fact that although the countries that joined the EU later have lower environmental efficiency, their productivity growth has been higher. Other authors [15] have focused more on the efficiency of environmental burden measures and have provided selected countries with Europe as a benchmark for those whose environmental policies are not so successful. The European countries were also surveyed in another [16] study in the period 2001–2012, and differences in the efficiency of selected countries were found in contrast to the above-mentioned studies, as the most environmentally friendly countries included the countries that joined the EU later, such as Latvia or Estonia. In the same period, the efficiency of EU countries was also examined in a further study [17], and it was found that the share of renewable and nonrenewable resources is significant for the level of environmental efficiency. They also found that environmental tax revenue effects are negatively stronger in less efficient countries in contrast to transport taxes. In a further study [18], the EU countries were analyzed in 1990–2011 and divided by the authors into the EU-15 countries, the countries that joined in recent years, and the candidate countries, and it was found that the EU-15 countries had a higher potential to increase GDP while reducing CO2 emissions. In a further study [19], the European and Asian countries were compared and on the basis of the results, it was clear that the Asian countries expressed the need for a greater reduction in CO2 emissions, while the European countries had to reduce government spending.
Based on the above-mentioned literature review, it can be argued that environmental efficiency is a field of research where some of the results of studies are unified, but in some results, they are dissolving. In most studies, authors used the efficiency measured by the Data Envelopment Analysis (DEA) method and its various modifications. Many studies focus on environmental performance and the efficiency of selected countries of geopolitical clusters, but few of them also describe the potential impacts of selected indicators of environmental pollution and other economic factors of environmental efficiency, and such research is completely missing in the case of EU countries. It is not only important to point to the need to reduce greenhouse gas emissions as a proxy for environmental improvement policies but also to look for and confirm new causes and factors whose improvement may ultimately lead to environmental improvements. The EU is a union of sovereign countries joining a common EU policy, which some countries have adopted later, and it is necessary to examine whether environmental improvement policies should not be adapted to certain groups of countries. Wide use of the DEA in energy and environmental efficiency was confirmed also in [20]. Few studies attempt to determine possible determinants of this efficiency [6,13]. Therefore, in this study, we focus on possible determinants of environmental efficiency from the point of view of existing research.
The social dimension concerns the need to minimize any negative impacts from industrial activities, and the economic dimension refers to the efficiency of business operations, creating a balance between the resources used for manufacturing products and offering services to people. Environmental sustainability, which is the focus of this study, addresses the preservation and protection of natural resources for future generations.
In fact, the improvement of environmental efficiency in the sector of emissions will improve the sustainable environmental growth. Based on [21], the environmental sustainable growth and eco-efficiency are two highly correlated groups and we have to take into account also the social dimension and the economic dimension which refers to the efficiency of business operations, creating a balance between the resources used for manufacturing products and offering services to people. So, we have to find the suitable “mix” of indices which are affecting the environmental efficiency. Environmental sustainability, which is the focus of this study, addresses the preservation and protection of natural resources for future generations. The aim of this article is to verify some models with possible determinants of the efficiency and identify key indicators of the efficiency improvement to ensure more sustainable growth in environmental processes of the EU as a whole.
2. Materials and Methods
As part of this study, the two-step DEA method was used to obtain the results. The main idea of this approach is to obtain the values of environmental efficiency in the first step, and in the second step to determine the impact of the selected determinants of the environmental efficiency. In the first step, the Farrell efficiency [22] was used, using the input models assuming the constant returns to scale (CCR) and variable returns to scale (BCC) proposed by [23]. The CCR DEA model which was used has the following envelopment program form:
The DEA BCC model has the following envelopment program form:
In the second step, Simar’s and Wilson’s [24] second algorithm was used to ensure consistent regression results, after double bootstrap based on [24] truncated regression was performed, which is applied in many studies from other areas [25,26] and environmental efficiency [6].
The 26 countries of the European Union (Malta and Luxembourg were excluded due to the lack of reliable data and small area of the countries) have been researched during 2008 to 2016. This will create a window of 26 countries for 9 years—234 Decision making units (DMUs) as it is proposed by [27]. The main idea of this approach is that each decision-making unit in each year is seen as a separate DMU.
In the first step, we use emissions input variables in relation to the population. Many of the studies we mentioned in Section 1 apply the emission variables as undesirable output, and use other variables (e.g., labor, capital indicators, energy consumption, fertilizers use) as the input variables. But according to our judgment, the higher number of employed people or the higher capital used in a country does not have to implicate higher emissions, and many of the studies [28,29,30] treat the undesirable outputs, which, in fact, emissions are, as the input variable. This approach is relevant because the aim of the DEA method is to reduce inputs or maximize outputs, and the emissions have to be downsized in the case of improving the efficiency. But we have also measured the efficiencies using traditional inputs (energy consumption and consumption of nitrogen fertilizers), desirable output (GDP per capita), and undesirable outputs (CO2/capita, N2O/capita, and Methane/capita); the correlation between efficiency measurement with greenhouse gases as inputs and traditional measurement of efficiency is in the case of BCC model 0.75 and in the case of CCR model 0.93, which are high correlations, and we would rather use the traditional input variables as explanatory variables in the second step to assess their impact on efficiency of emissions. EUROSTAT [31] provides much valuable information in its databases, and all of our data comes from the EUROSTAT database, in terms of greenhouse gas emissions, mainly CO2, methane, and nitrous oxide in kilograms. These input variables are in proportion to the number of inhabitants in the given year for the needs of our study. The only output is the GDP per capita.
As for the explanatory variables used in the second step of the two-step analysis, we have used the following variables:
- EnerCon—Energy consumption in t per capita
- Fert(Nitr)—Fertilizers use (nitrogen in t per capita)
- Ln(ProdIn)—Logarithm of productivity index where 100% is in year 2010
- RoadTr—Road freight transport in t per capita
- Waste—Waste produced in county in kg per capita
- MeanInc—Mean income of inhabitants in €
- ResProd—Resources productivity in € per kg
- EnvTax—Total environmental taxes in € per capita
According to Eurostat, the first 5 variables are the drivers of climate change, and we want to verify their significance. We selected these 5 drivers (one of each category) on the basis of their availability for the selected period and for the countries investigated. The remaining three variables cover the economic characteristics and environmental policies of the EU countries.
To verify the impact of selected environmental efficiency determinants, we used truncated regression. The dependent variable is bias-corrected CCR or BCC input efficiency—. We have proposed three models. Model 1 verifies the influence of all the determinants, Model 2 verifies the influence of variables known as drivers of climate change, and Model 3 combines the variables used in Models 1 and 2. Three models have been designed by the authors:
We will verify the above-mentioned models in the end of Section 3. Computations were made in the program RStudio.
3. Results
In this section we summarize the results of our research. Table 1 lists the basic descriptive characteristics of the input variables and output variable of the models DEA CCR and BCC.
Table 2 shows the basic characteristics for the explanatory variables used in the second step of the analysis in the individual models.
Table 3 shows the results of measuring efficiency after the double-bootstrap process. The values are average for each country for the researched period.
The lowest average efficiency values achieved were for Poland and Bulgaria, where these values were around 0.17, which is significantly less than the most efficient country, Sweden, averaging at 0.86. Austria, United Kingdom (UK), and France were also highly efficient. Effective countries (i.e., benchmarks) were in the UK in 2015 and Sweden in 2016. Slacks show how much the inputs should be reduced in order for countries to reach the benchmark efficiency. The average efficiency values in column 6 after duplicating with the double-bootstrap algorithm are lower for all countries, due to the fact that this algorithm approximates to real values of efficiencies and also includes a statistical error [24]. As it is evident that the “Eastern Block” countries of the EU are less efficient than western located countries, we have decided to divide these countries into two groups. The first group (Group 1A) consists of 15 western European countries and the second group (Group 2A) is the 11 Eastern Block countries that joined the EU later. Development of countries efficiency is shown in Appendix A in the Figure A1 and Figure A2. Table 4 shows the results of DEA BCC model computation.
Compared to the CCR model, the performance of the BCC model was slightly different. Many countries that had low efficiencies in CCR models are closer to the efficiency threshold (e.g., Romania, Bulgaria, Hungary, Croatia, Portugal) in the case of the BCC model. Conversely, there has been no reduction in efficiency because BCC efficiency is always at least equal to or higher than CCR efficiency. Similar results also apply to double-bootstrapped efficiencies. We divided the countries as in the CCR model into two groups, but the geopolitical division was not appropriate, so we grouped countries with an efficiency of more than 0.75 in 2016 in Group 1B, and all other countries in Group 2B. Breakdown into groups and development of efficiency is recorded in Appendix A in Figure A3 and Figure A4. Table 5 shows the results of modeling of efficiency determinants for the window of all countries researched over the reference period.
From the three models we have constructed, Model 1 is the most appropriate model, which also explains the relatively high percentage—86.32%—variability of the dependent variable. In this model, unlike in Model 2, the variables, which are drivers of climate change, are not statistically significant. This points to the need to address environmental variables of the economic environment. Model 1 has an unexpected effect of only the variable Waste, which is not statistically significant, unlike in Models 2 and 3, where the variables Waste and EnerCon have an unexpected effect. The increase in production also implies an increase in efficiency, but this variable is not statistically significant even in one model. An interesting fact is the negative impact of environmental taxes on efficiency. On the contrary, increasing revenue and resource productivity and reducing road freight transport and fertilizer consumption can increase the efficiency of the sample. Table 6 describes the results of the modeling with the dependent variable BCC double-bootstrapped efficiency.
The results for BCC efficiency as a dependent variable are similar to CCR for Model 1. The only significant difference is that the increase in production reduces the efficiency. It has been confirmed that higher levels of waste per person increase efficiency. Models 2 and 3 are less important than Model 1, as was the case with CCR efficiency as the dependent variable. Table 7 presents model results for countries divided into 2 groups.
For models built for Group 1A, again, Model 1 is the most relevant model. Unlike the model that included all countries, drivers of climate change are statistically significant, while on the other hand, tax and productivity variables are statistically insignificant. Model 2 has a relatively low explanation power. For all variables except ln(ProdIn), their effect is as expected.
In the Group 2A models, a similar trend in the predictive ability of the models is observed as for Group 1A. However, in Model 2, the higher statistical significance of individual independent variables is observable than in Model 1. Unlike Group 1A, there was an increase in R-squared and change of influence of environmental taxes on efficiency where the impact was positive. However, an unexpected effect was recorded in this group of countries on all three models for the EnerCon and Waste variables. Table 8 shows the results for Groups 1B and 2B.
In this case, it was also confirmed that Model 1 is the most significant and relevant model for both groups of countries. Models 2 and 3 explain less variability of the statistical set. In the case of Group 1B, there have been several unexpected effects of explanatory variables on efficiency—the variables FertNitr, RoadTr, ResProd. An interesting fact when comparing both groups for Model 1 is that for more efficient countries, the increase in environmental taxes has a positive effect on efficiency, while for less efficient countries, the impact is negative. In less efficient countries, increasing productivity increases resource efficiency, while Group 1B is the opposite. Differences in impact compared to Group 1B were observed also in the variables RoadTr, Ln(ProdIn), Waste, FertNitr, and EnerCon.
4. Discussion
We can divide our results implications in two aspects; the first is the level of environmental efficiency of the EU countries researched and the second is the verification of the impact of selected explanatory variables on environmental efficiency.
We used a slightly different approach to input and output indicators, as in the most studies, with inputs being emissions that we want to reduce with fixed output—GDP per capita. Our research, however, confirmed that the results of the models did not differ significantly, as shown below. The DEA recommends lowering greenhouse gas inputs for more environmentally efficient EU countries based on slacks, as in [19], and this applies to other countries as well (e.g., China [32]). This means that a similar level of GDP per capita can be achieved with significantly lower greenhouse gas emissions. Comparison between the CCR and BCC models shows interesting results. Based on the results of the measuring of efficiency in the first step, it is obvious that, on the basis of environmental efficiency, EU countries can be divided into two groups, similar to the division of countries into smaller units as in [13,33]. The efficiency of the countries that joined the EU more recently is, in the case of CCR model, lower than in [14], but it is not the case of the BCC model. However, this does not have to apply to the efficiency of selected industries as indicated by [34]. Some countries, as we mentioned in the previous section, are significantly more efficient in the BCC model, and it is therefore assumed that in their case they may be thinking of rising yields on the scale; the countries that implement more technology into their technologies than the more environmentally friendly countries can benefit from growth of variable yields on a scale. Conversely, countries such as Austria, Belgium, and Finland have not achieved a more robust increase in efficiency for the BCC model, as evidenced by low environmental awareness of emissions [15]. It is difficult to determine which DEA model is more suitable for the assessment, so we would have to know the environmental status and policies of each surveyed country, as it is [16]. The BCC model is, however, more realistic, since the precalculation for constant yields on a scale is, in real terms, rather theoretical.
In terms of meeting the article objectives, the second step of the analysis is more important. The results of truncated regression modeling suggest that, as in [19], less environmentally efficient countries have to develop their own policies to mitigate climate change impacts, as drivers of climate change play a larger role than in more efficient countries. It is precisely the economic variables that predominate over the drivers of climate change in the models for the whole EU. It is a visible change in the perception of policymaking, with similar conclusions suggested by [35]. However, the models with dependent variable, efficiency of all EU countries, not just the selected sample, appear to be appropriate for explaining the effectiveness of greenhouse gas production, especially for DEA CCR. However, the most relevant model seems to be Model 1, which includes drivers of climate change as well as other socio-economic factors. This is true in all cases. Another finding is that the effect of the selected variables is significantly different in the case of BCC efficiency among the divided groups of countries. In countries with higher efficiency, efficiency increases with environmental tax increase, while in less efficient countries, raising taxes could lead to a fall in efficiency. Similarly, in the case of waste policies, for the less efficient countries, the effect is unexpected and thus the increase in waste per capita is causing higher efficiency. In countries where the amount of waste per capita has a significant impact, it would be possible to apply the proposals presented in [36,37]. It is precisely from this finding that this could be caused by another technology stemming from the different internal policies of the countries. One can point to the need for individual access to selected countries. Relatively significant variations in the models can also be caused by the high variability of European countries’ efficiency, which is also confirmed by [38]. On the contrary, for Model 1, the dependent variable BCC efficiency is the same effect of the average income level on citizens of EU countries, and this fact proves that not only production and services can have the effect of enhancing environmental efficiency, but also increasing the income of the population can increase environmental efficiency. However, if we want to model efficiency for selected subgroups of EU countries, we would need more indicators to have higher reporting capabilities.
The possibility of further research is to modify and apply the approach proposed by [39] to create a dynamic, large data model that adapts to changing circumstances. It is also possible to test variables such as the Gini Index [1] or the Quality of Life Index, the Human Development Index, the Environmental Performance Index, and similar aggregate indices.
5. Conclusions
In general, the results have shown that aggregate models for the whole EU can be used as well as diversified models for less environmentally efficient countries and more efficient countries. If we want to apply a model for all countries of the EU, it is necessary to prioritize economic policies rather than drivers of climate change when building policies. In this case, it is important to sanction the objectives of the EU’s environmental policies to reduce direct impacts, such as the use of fertilizers or road freight transport, but also to assess indirect impacts such as average income of inhabitants and resource productivity, and last but not least, to adjust environmental tax policy to have a positive effect on increasing efficiency. It turns out that higher taxes do not have a positive impact on environmental efficiency nor on the performance of EU countries.
We propose some policy implications: (i) it is necessary to focus not only on the classic drivers of climate change but also on other socio-economic variables, and to address the demanding need to build extended, big data databases that will serve to verify the impacts of selected factors on changes in the quality of the environment; (ii) the EU must take into account that some factors may have a positive impact on environmental efficiency of each country, but the indices, as we have done, for example, in the field of environmental taxes, can have a negative impact not only on environmental efficiency but also on the state of the environment; (iii) continuous feedback of measures and assessment of impacts of these measures, which can be achieved by building an integrated model of environmental risk management; (iv) raising the standard of living of the population, with the need to verify aggregate indicators of quality of life and the environment for the EU, which is an opportunity for further research; (v) the creation of country clusters for the individual application of selected factors and measures to meet the common environmental objectives of the EU. Only by harmonizing national policies with regard to the individuality of each country is it possible to achieve sustainable growth in consumption and production, or to reduce greenhouse gas emissions at a given level of economic wealth.
The results in general have shown that Model 2, which contains only variable drivers of climate change, has in many cases worse results than models in which variables are drivers of climate change with socio-economic variables. The results have therefore shown that environmental efficiency may not only be related to variables, which EUROSTAT directly identifies as drivers, that directly affect the environment and climate state. There are other drivers of climate change, therefore, and we trust that increasing environmental efficiency on the same level of GDP per capita (i.e., changes in technology) will result in a sustainable reduction in greenhouse gas emissions and ensure sustainable growth of the countries. However, if the EU’s goal is a common policy, then the EU should seek to find new indicators, such as the ones which have been applied in this article.
Author Contributions
This research was designed, carried out, and written principally by R.L.; Z.H. commented and contributed mainly to the Introduction and Methodology Sections; and R.L. commented and contributed mostly to the Results, Discussion, and Conclusion Sections. All authors were involved in the finalization of the submitted manuscript.
Funding
This research received no external funding.
Conflicts of Interest
The authors declare no conflict of interest.
Appendix A
Figure A1.
Efficiencies of Group 1A countries.
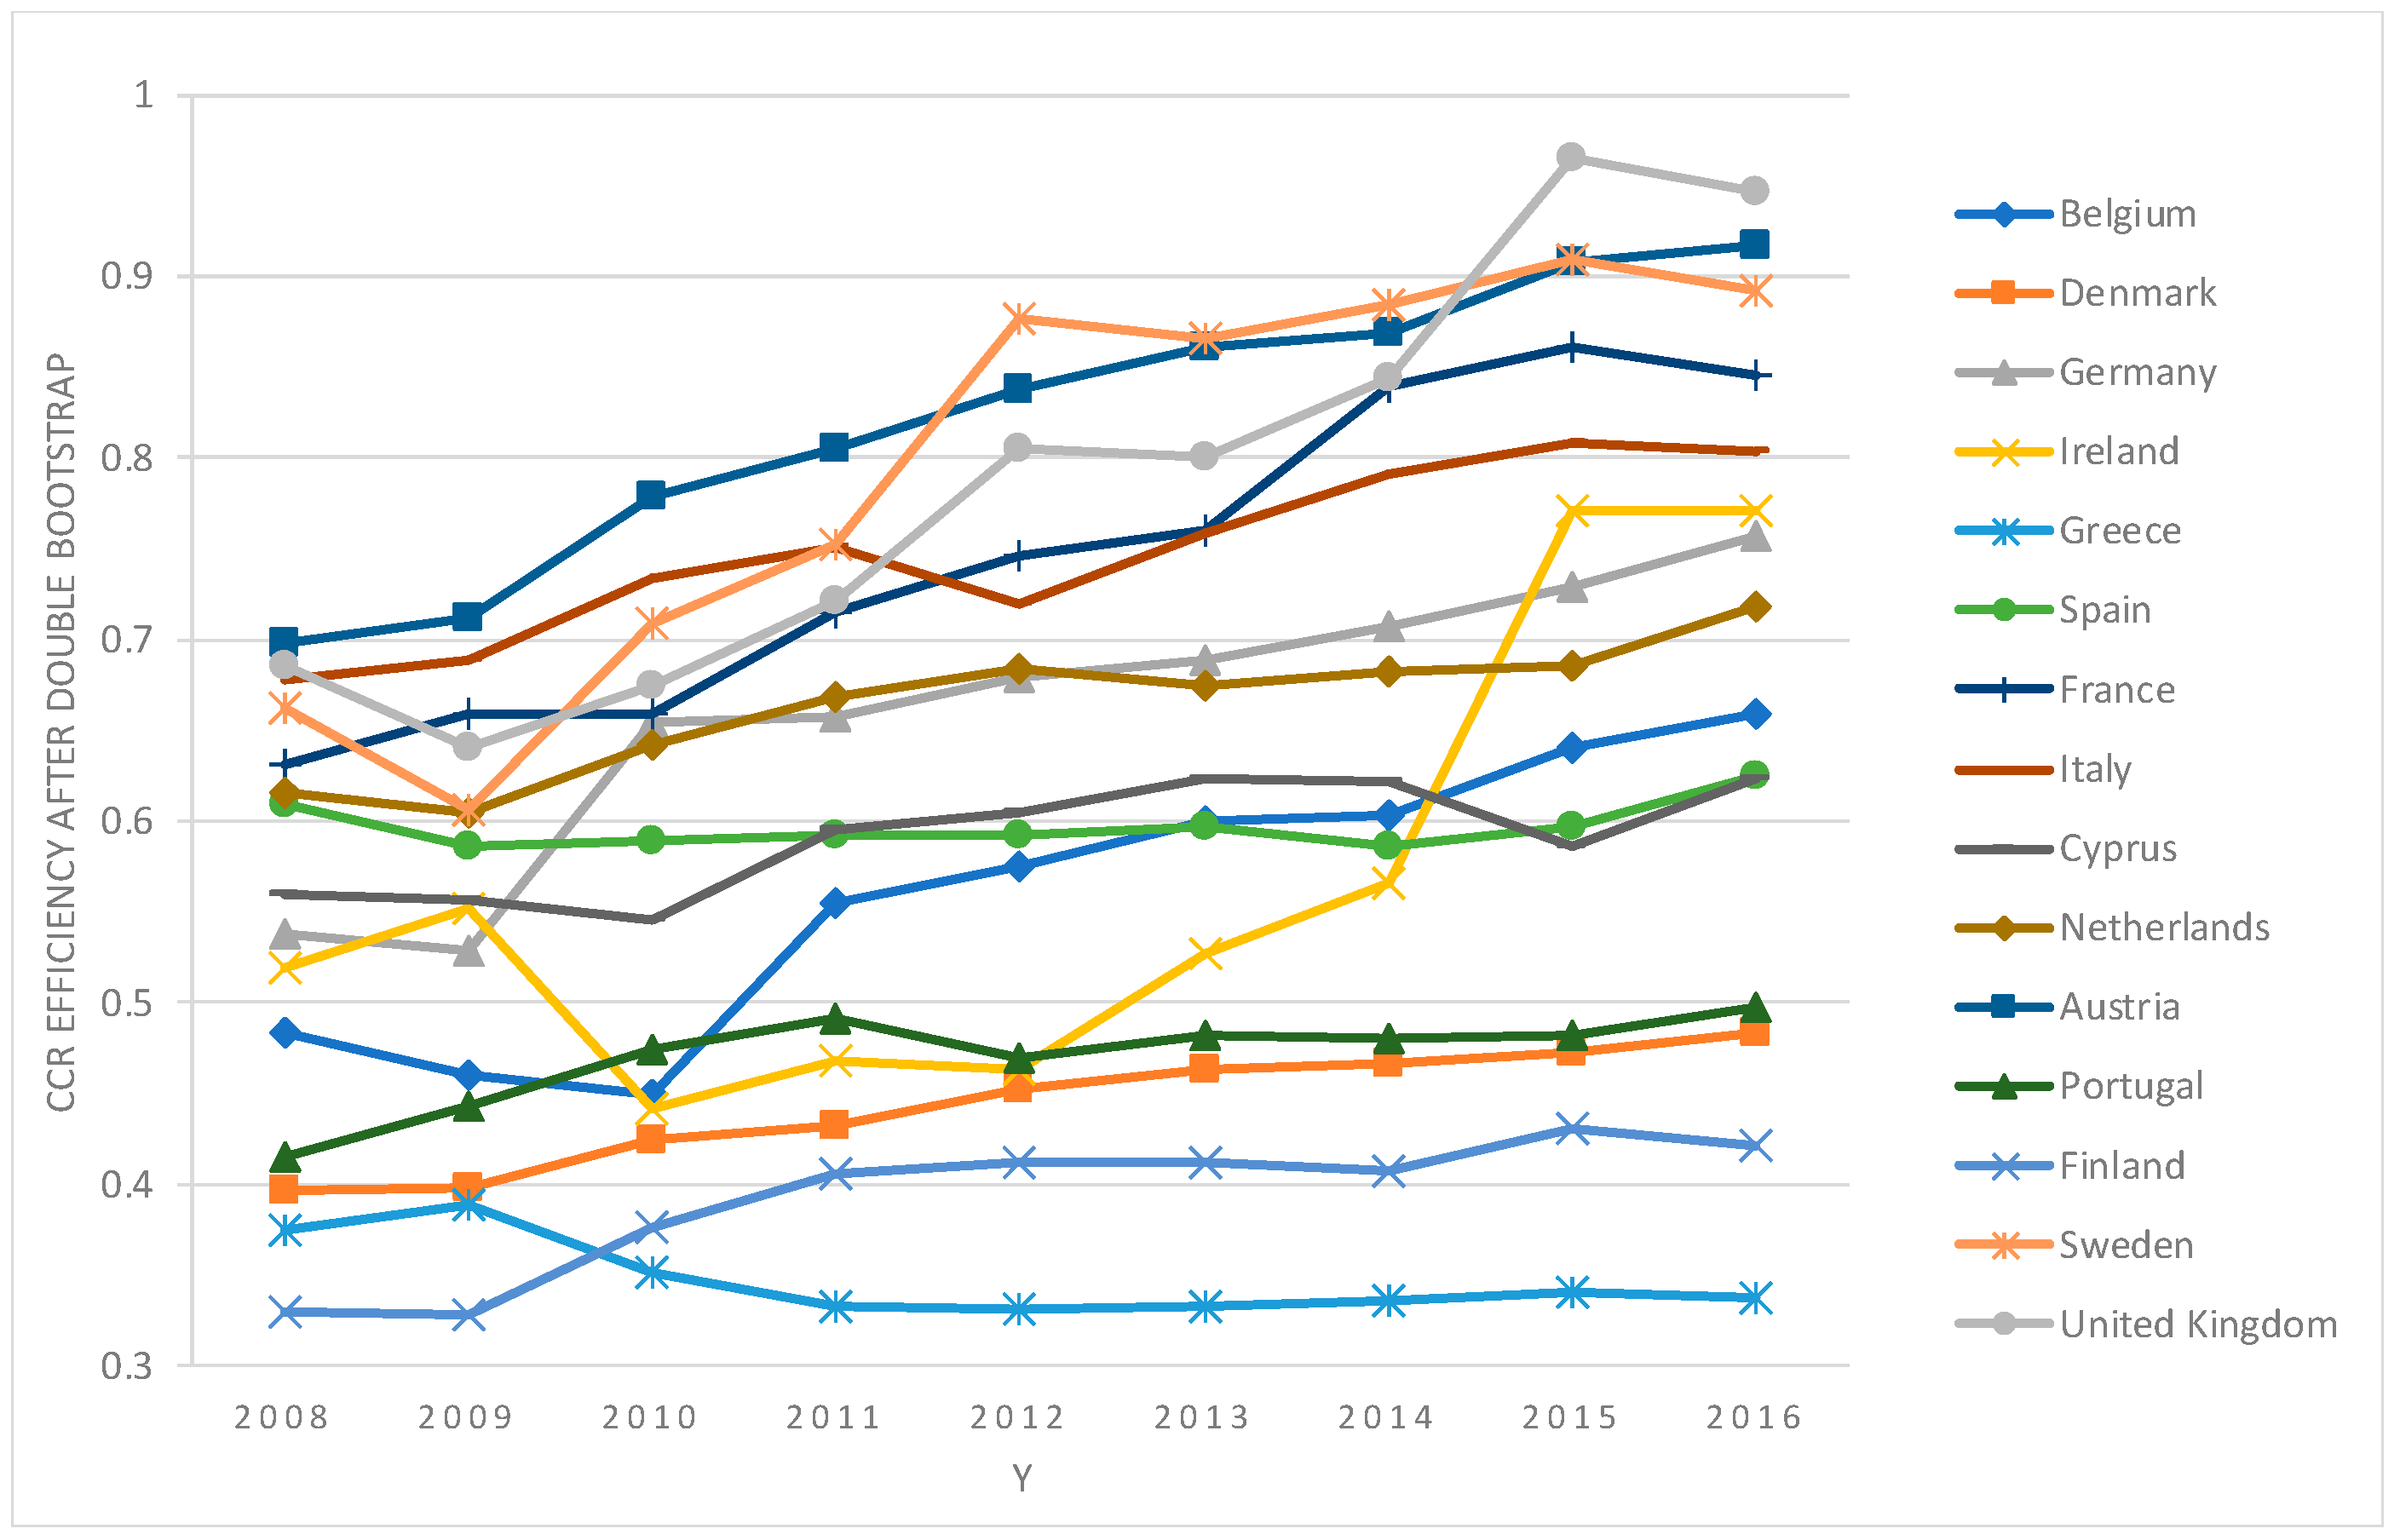
Figure A2.
Efficiencies of Group 2A countries.

Figure A3.
Efficiencies of Group 1B countries.
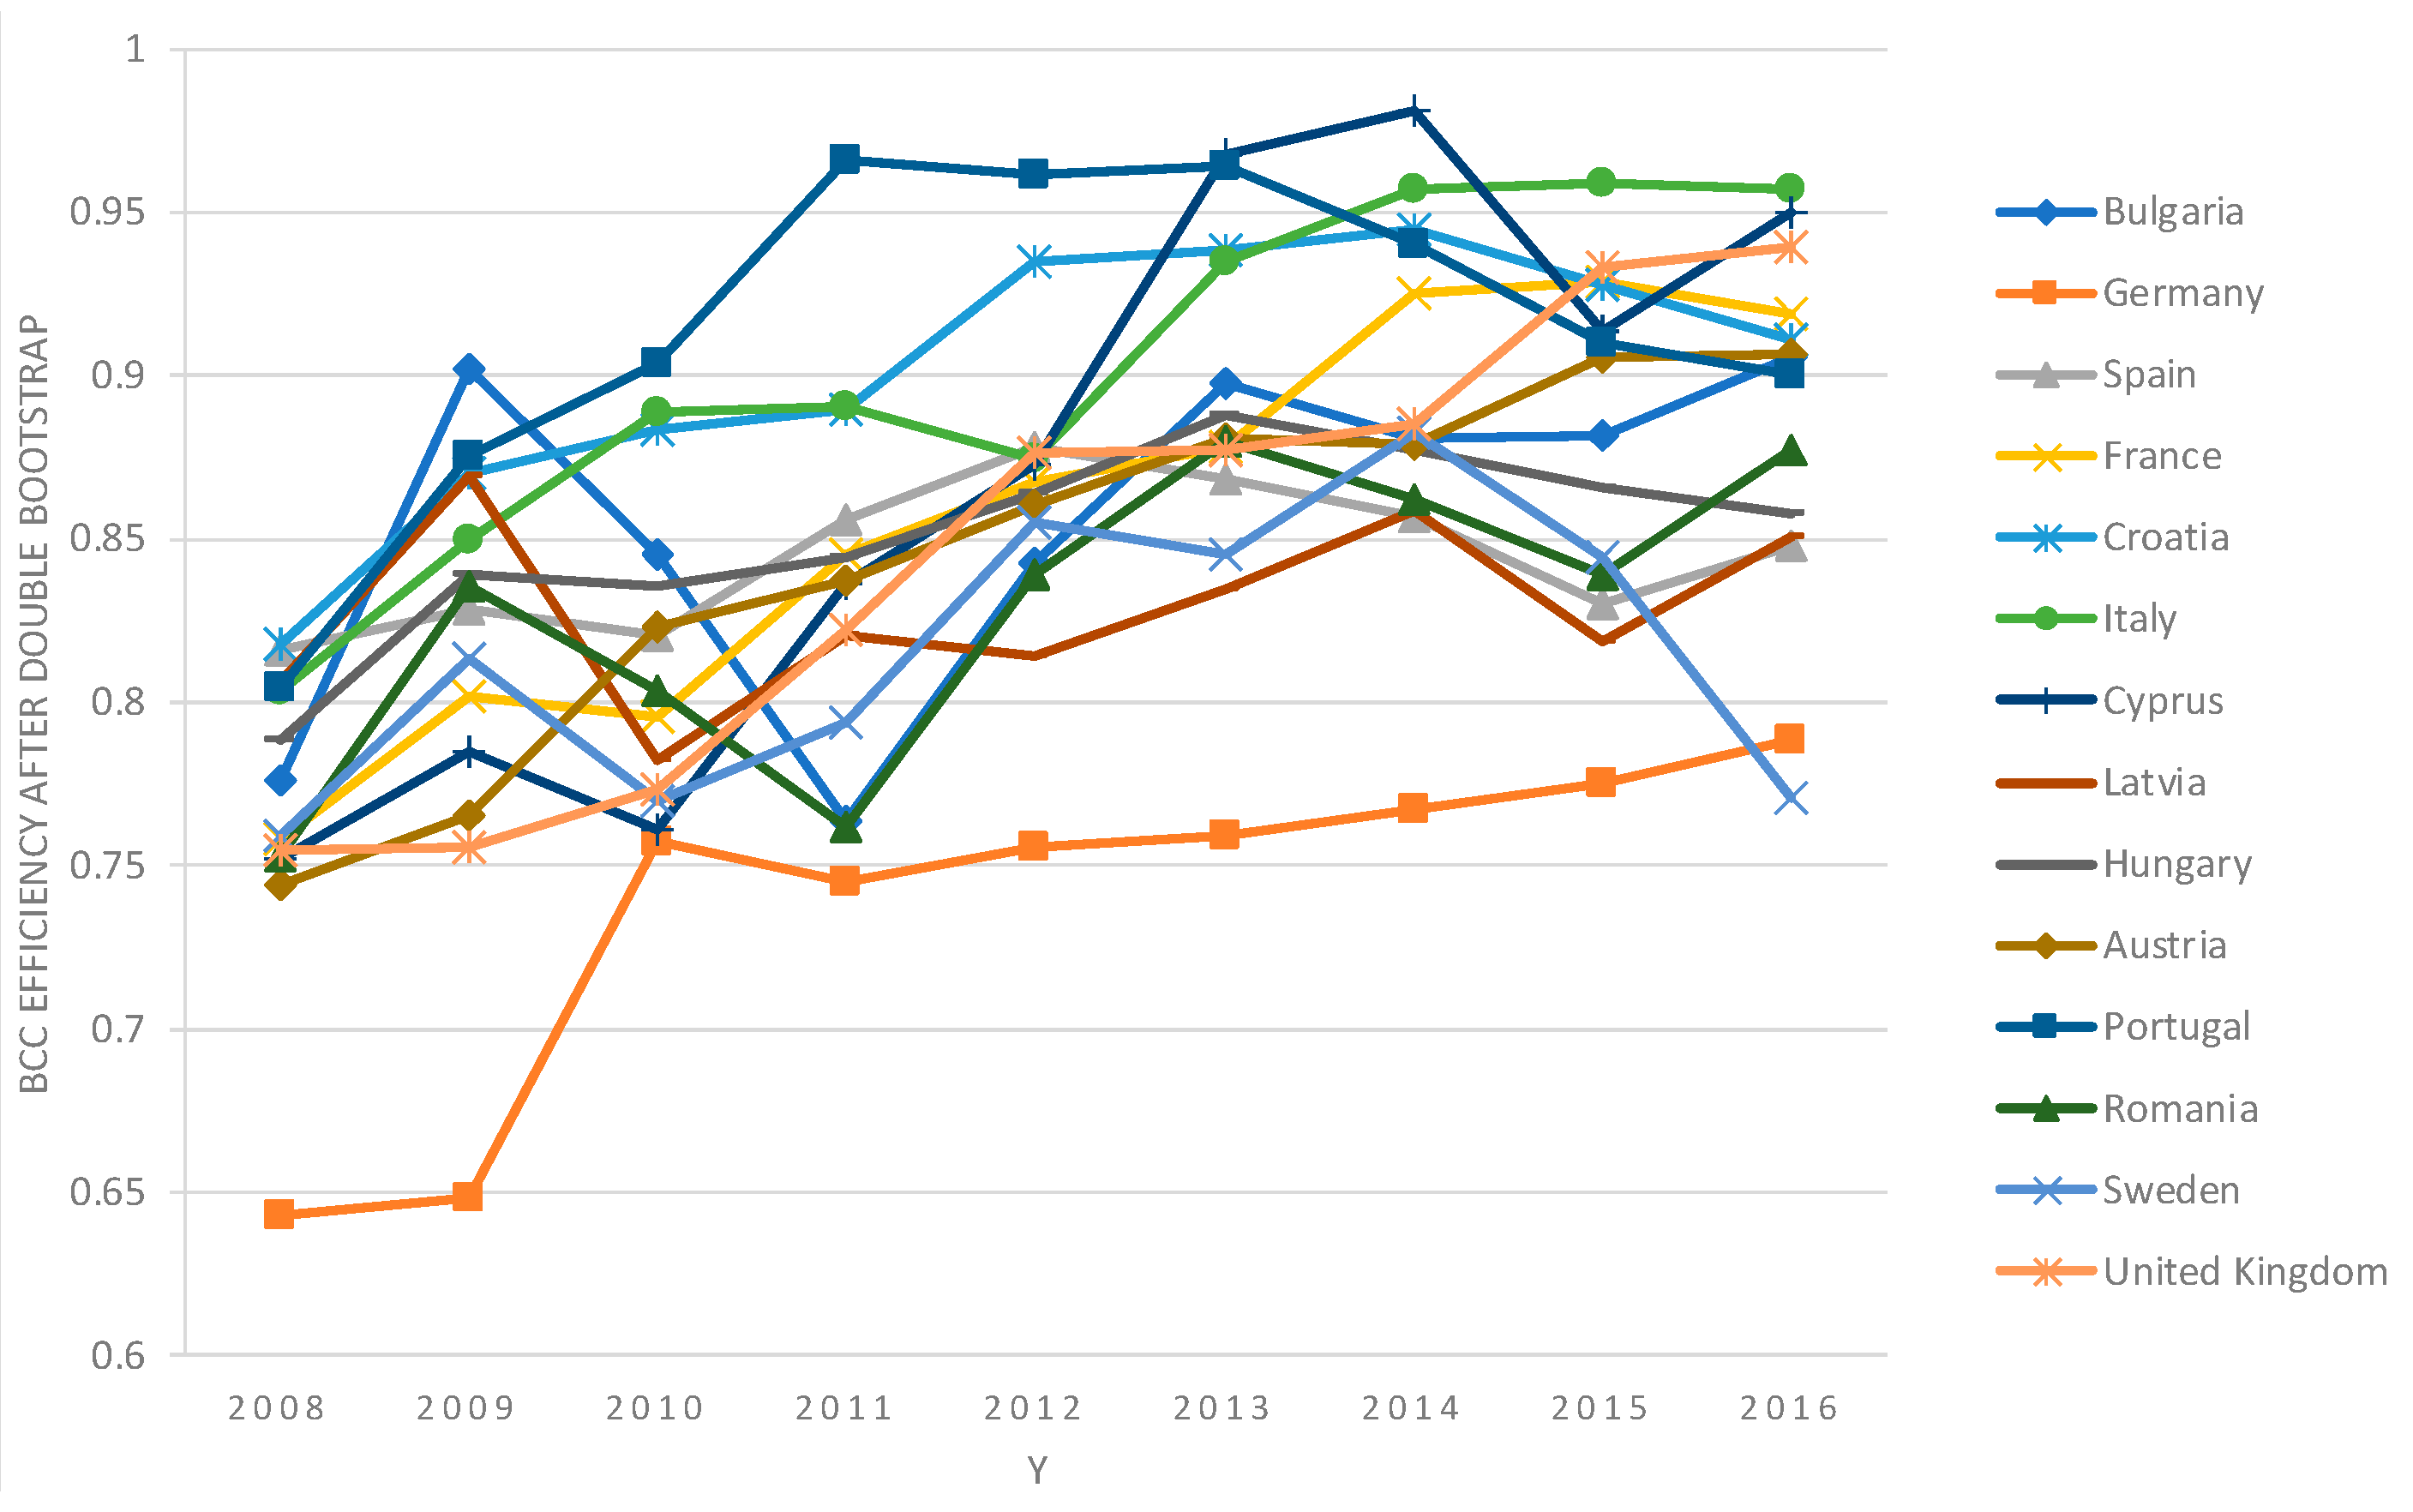
Figure A4.
Efficiencies of Group 2B countries.

References
- Soares, T.C.; Fernandes, E.A.; Toyoshima, S.H. The CO2 emission Gini index and the environmental efficiency: An analysis for 60 leading world economies. EconomiA 2018, 19, 266–277. [Google Scholar] [CrossRef]
- Vaninsky, A. Energy-environmental efficiency and optimal restructuring of the global economy. Energy 2018, 153, 338–348. [Google Scholar] [CrossRef]
- Iftikhar, Y.; Wang, Z.; Zhang, B.; Wang, B. Energy and CO2 emissions efficiency of major economies: A network DEA approach. Energy 2018, 147, 197–207. [Google Scholar] [CrossRef]
- Tajudeen, I.A.; Wossink, A.; Banerjee, P. How significant is energy efficiency to mitigate CO2 emissions? Evidence from OECD countries. Energy Econ. 2018, 72, 200–221. [Google Scholar] [CrossRef]
- Gałaś, S.; Gałaś, A.; Zeleňáková, M.; Zvijáková, L.; Fialová, J.; Kubíčková, H. Environmental Impact Assessment in the Visegrad Group countries. Environ. Impact Assess. Rev. 2015, 55, 11–20. [Google Scholar] [CrossRef]
- Jebali, E.; Essid, H.; Khraief, N. The analysis of energy efficiency of the Mediterranean countries: A two-stage double bootstrap DEA approach. Energy 2017, 134, 991–1000. [Google Scholar] [CrossRef]
- Xu, T.; Gao, P.; Yu, Q.; Fang, D. An Improved Eco-Efficiency Analysis Framework Based on Slacks-Based Measure Method. Sustainability 2017, 9, 952. [Google Scholar] [CrossRef]
- Solnørdal, M.T.; Thyholdt, S.B. Drivers for energy efficiency: An empirical analysis of Norwegian manufacturing firms. Energy Procedia 2017, 142, 2802–2808. [Google Scholar] [CrossRef]
- Saikku, L.; Mattila, T.J. Drivers of land use efficiency and trade embodied biomass use of Finland 2000–2010. Ecol. Indic. 2017, 77, 348–356. [Google Scholar] [CrossRef]
- Cecchini, L.; Venanzi, S.; Pierri, A.; Chiorri, M. Environmental efficiency analysis and estimation of CO2 abatement costs in dairy cattle farms in Umbria (Italy): A SBM-DEA model with undesirable output. J. Clean. Prod. 2018, 197, 895–907. [Google Scholar] [CrossRef]
- Testa, F.; Styles, D.; Iraldo, F. Case study evidence that direct regulation remains the main driver of industrial pollution avoidance and may benefit operational efficiency. J. Clean. Prod. 2012, 21, 1–10. [Google Scholar] [CrossRef]
- Vlontzos, G.; Niavis, S.; Manos, B. A DEA approach for estimating the agricultural energy and environmental efficiency of EU countries. Renew. Sustain. Energy Rev. 2014, 40, 91–96. [Google Scholar] [CrossRef]
- Toma, P.; Miglietta, P.P.; Zurlini, G.; Valente, D.; Petrosillo, I. A non-parametric bootstrap-data envelopment analysis approach for environmental policy planning and management of agricultural efficiency in EU countries. Ecol. Indic. 2017, 83, 132–143. [Google Scholar] [CrossRef]
- Sanz-Díaz, M.T.; Velasco-Morente, F.; Yñiguez, R.; Díaz-Calleja, E. An analysis of Spain’s global and environmental efficiency from a European Union perspective. Energy Policy 2017, 104, 183–193. [Google Scholar] [CrossRef]
- Kwon, D.S.; Cho, J.H.; Sohn, S.Y. Comparison of technology efficiency for CO2 emissions reduction among European countries based on DEA with decomposed factors. J. Clean. Prod. 2017, 151, 109–120. [Google Scholar] [CrossRef]
- Madaleno, M.; Moutinho, V.; Robaina, M. Economic and Environmental Assessment: EU Cross-country Efficiency Ranking Analysis. Energy Procedia 2016, 106, 134–154. [Google Scholar] [CrossRef]
- Moutinho, V.; Madaleno, M.; Robaina, M. The economic and environmental efficiency assessment in EU cross-country: Evidence from DEA and quantile regression approach. Ecol. Indic. 2017, 78, 85–97. [Google Scholar] [CrossRef]
- Duman, Y.S.; Kasman, A. Environmental technical efficiency in EU member and candidate countries: A parametric hyperbolic distance function approach. Energy 2018, 147, 297–307. [Google Scholar] [CrossRef]
- Tsai, W.-H.; Lee, H.-L.; Yang, C.-H.; Huang, C.-C. Input-Output Analysis for Sustainability by Using DEA Method: A Comparison Study between European and Asian Countries. Sustainability 2016, 8, 1230. [Google Scholar] [CrossRef]
- Mardani, A.; Zavadskas, E.K.; Streimikiene, D.; Jusoh, A.; Khoshnoudi, M. A comprehensive review of data envelopment analysis (DEA) approach in energy efficiency. Renew. Sustain. Energy Rev. 2017, 70, 1298–1322. [Google Scholar] [CrossRef]
- Di Vaio, A.; Varriale, L.; Alvino, F. Key performance indicators for developing environmentally sustainable and energy efficient ports: Evidence from Italy. Energy Policy 2018, 122, 229–240. [Google Scholar] [CrossRef]
- Farrell, M.J. The Measurement of Productive Efficiency. J. R. Stat. Soc. Ser. Gen. 1957, 120, 253. [Google Scholar] [CrossRef]
- Cooper, W.W.; Seiford, L.M.; Tone, K. Data Envelopment Analysis: A Comprehensive Text with Models, Applications, References and DEA-Solver Software, 2nd ed.; Springer US: New York, NY, USA, 2007; ISBN 978-0-387-45281-4. [Google Scholar]
- Simar, L.; Wilson, P.W. Estimation and inference in two-stage, semi-parametric models of production processes. J. Econ. 2007, 136, 31–64. [Google Scholar] [CrossRef] [Green Version]
- Wijesiri, M.; Viganò, L.; Meoli, M. Efficiency of microfinance institutions in Sri Lanka: A two-stage double bootstrap DEA approach. Econ. Model. 2015, 47, 74–83. [Google Scholar] [CrossRef]
- Fernandes, F.D.S.; Stasinakis, C.; Bardarova, V. Two-stage DEA-Truncated Regression: Application in banking efficiency and financial development. Expert Syst. Appl. 2018, 96, 284–301. [Google Scholar] [CrossRef]
- Charnes, A.; Clark, C.T.; Cooper, W.W.; Golany, B. A developmental study of data envelopment analysis in measuring the efficiency of maintenance units in the U.S. air forces. Ann. Oper. Res. 1984, 2, 95–112. [Google Scholar] [CrossRef] [Green Version]
- Wang, K.; Wei, Y.-M.; Zhang, X. A comparative analysis of China’s regional energy and emission performance: Which is the better way to deal with undesirable outputs? Energy Policy 2012, 46, 574–584. [Google Scholar] [CrossRef]
- Shi, G.-M.; Bi, J.; Wang, J.-N. Chinese regional industrial energy efficiency evaluation based on a DEA model of fixing non-energy inputs. Energy Policy 2010, 38, 6172–6179. [Google Scholar] [CrossRef]
- Bian, Y.; Yang, F. Resource and environment efficiency analysis of provinces in China: A DEA approach based on Shannon’s entropy. Energy Policy 2010, 38, 1909–1917. [Google Scholar] [CrossRef]
- Database—Eurostat. Available online: https://ec.europa.eu/eurostat/data/database (accessed on 10 August 2018).
- Cheng, S.; Liu, W.; Lu, K. Economic Growth Effect and Optimal Carbon Emissions under China’s Carbon Emissions Reduction Policy: A Time Substitution DEA Approach. Sustainability 2018, 10, 1543. [Google Scholar] [CrossRef]
- Zhao, C.; Zhang, H.; Zeng, Y.; Li, F.; Liu, Y.; Qin, C.; Yuan, J. Total-Factor Energy Efficiency in BRI Countries: An Estimation Based on Three-Stage DEA Model. Sustainability 2018, 10, 278. [Google Scholar] [CrossRef]
- Alsaleh, M.; Abdul-Rahim, A.S.; Mohd-Shahwahid, H.O. Determinants of technical efficiency in the bioenergy industry in the EU28 region. Renew. Sustain. Energy Rev. 2017, 78, 1331–1349. [Google Scholar] [CrossRef]
- Arbolino, R.; Carlucci, F.; De Simone, L.; Ioppolo, G.; Yigitcanlar, T. The policy diffusion of environmental performance in the European countries. Ecol. Indic. 2018, 89, 130–138. [Google Scholar] [CrossRef]
- Andreasi Bassi, S.; Christensen, T.H.; Damgaard, A. Environmental performance of household waste management in Europe—An example of 7 countries. Waste Manag. 2017, 69, 545–557. [Google Scholar] [CrossRef] [PubMed]
- Mrkajić, V.; Stanisavljevic, N.; Wang, X.; Tomas, L.; Haro, P. Efficiency of packaging waste management in a European Union candidate country. Resour. Conserv. Recycl. 2018, 136, 130–141. [Google Scholar] [CrossRef]
- Woo, C.; Chung, Y.; Chun, D.; Seo, H.; Hong, S. The static and dynamic environmental efficiency of renewable energy: A Malmquist index analysis of OECD countries. Renew. Sustain. Energy Rev. 2015, 47, 367–376. [Google Scholar] [CrossRef]
- Wu, Y.; Chen, Z.; Xia, P. An extended DEA-based measurement for eco-efficiency from the viewpoint of limited preparation. J. Clean. Prod. 2018, 195, 721–733. [Google Scholar] [CrossRef]

Table 1.
Descriptive statistics of DEA model input and output variables.
| Stat | CO2/Cap | Methan/Cap | NitrousOxide/Cap | GDP/Cap |
|---|---|---|---|---|
| N | 234 | 234 | 234 | 234 |
| Mean | 6519.595 | 39.083 | 1.845 | 23,533.760 |
| St. Dev. | 2629.122 | 16.966 | 0.977 | 12,698.280 |
| Min | 3012.348 | 11.866 | 0.903 | 4900 |
| Max | 15,727.490 | 113.893 | 5.587 | 57,500 |
Own processing according to data collected from EUROSTAT.
Table 2.
Descriptive statistics of truncated regression models.
| Stat | EnerCon | Fert(Nitr) | ln(ProdIn) | RoadTr | Waste | MeanInc | ResProd | EnvTax |
|---|---|---|---|---|---|---|---|---|
| N | 234 | 234 | 234 | 234 | 234 | 234 | 234 | 234 |
| Mean | 2.257 | 0.024 | 4.628 | 29.472 | 472.034 | 13,313.250 | 1.532 | 620.040 |
| St. Dev. | 0.763 | 0.014 | 0.129 | 11.284 | 121.084 | 5301.647 | 0.960 | 398.465 |
| Min | 1.090 | 0.008 | 4.081 | 8.600 | 247 | 3062 | 0.243 | 110.225 |
| Max | 4.885 | 0.076 | 5.056 | 79.725 | 830 | 23,112 | 4.474 | 1931.471 |
Own processing according to data collected from EUROSTAT.
Table 3.
Results of DEA CCR input model and double-bootstrap procedure.
| Country | CCR_In_Eff Non Bootstr. (Average) | Slacks (Average) | Double-Bootstrapped Efficiency Characteristics | |||||
|---|---|---|---|---|---|---|---|---|
| CO2 (kg per Capita) | Methan (kg per Capita) | Nitrous Oxide (kg per Capita) | Average | Min | Max | StDev | ||
| Belgium | 0.5742 | 5.8682% | 0.0000% | 0.0000% | 0.5586 | 0.4500 | 0.6599 | 0.0729 |
| Bulgaria | 0.1727 | 8.5988% | 0.0000% | 0.9849% | 0.1576 | 0.1202 | 0.1949 | 0.0261 |
| Czech Rep. | 0.2823 | 4.0432% | 5.8626% | 0.0000% | 0.2778 | 0.2608 | 0.2940 | 0.0118 |
| Denmark | 0.4524 | 8.6478% | 0.0000% | 0.0000% | 0.4433 | 0.3963 | 0.4831 | 0.0301 |
| Germany | 0.6697 | 23.3072% | 0.0000% | 0.0000% | 0.6601 | 0.5294 | 0.7566 | 0.0741 |
| Estonia | 0.2176 | 11.3121% | 0.0000% | 0.0000% | 0.2125 | 0.1812 | 0.2619 | 0.0233 |
| Ireland | 0.5846 | 0.0000% | 43.2554% | 29.7273% | 0.5643 | 0.4422 | 0.7710 | 0.1171 |
| Greece | 0.3573 | 1.4671% | 2.2932% | 0.0000% | 0.3474 | 0.3309 | 0.3888 | 0.0196 |
| Spain | 0.6139 | 1.4890% | 10.6341% | 0.0000% | 0.5972 | 0.5858 | 0.6255 | 0.0120 |
| France | 0.7780 | 0.0000% | 42.1232% | 25.9003% | 0.7461 | 0.6308 | 0.8605 | 0.0827 |
| Croatia | 0.2909 | 0.0000% | 14.1513% | 4.8547% | 0.2736 | 0.2260 | 0.3397 | 0.0320 |
| Italy | 0.7658 | 5.4902% | 4.7242% | 0.0000% | 0.7478 | 0.6782 | 0.8078 | 0.0447 |
| Cyprus | 0.5973 | 19.8501% | 18.4051% | 0.0000% | 0.5909 | 0.5450 | 0.6235 | 0.0291 |
| Latvia | 0.2838 | 0.0000% | 16.1791% | 16.1796% | 0.2725 | 0.1878 | 0.3340 | 0.0438 |
| Lithuania | 0.2163 | 0.0000% | 11.8785% | 11.6234% | 0.2076 | 0.1864 | 0.2365 | 0.0158 |
| Hungary | 0.2732 | 0.0000% | 11.3008% | 0.9046% | 0.2573 | 0.2438 | 0.2675 | 0.0062 |
| Netherlands | 0.6755 | 11.9761% | 0.4678% | 0.0000% | 0.6640 | 0.6046 | 0.7180 | 0.0344 |
| Austria | 0.8377 | 8.0002% | 0.0000% | 0.0000% | 0.8206 | 0.6972 | 0.9164 | 0.0746 |
| Poland | 0.1671 | 0.0000% | 1.8132% | 0.0000% | 0.1621 | 0.1343 | 0.1883 | 0.0173 |
| Portugal | 0.4842 | 0.0000% | 21.6440% | 0.0000% | 0.4706 | 0.4152 | 0.4973 | 0.0244 |
| Romania | 0.1963 | 0.0000% | 14.1238% | 0.0000% | 0.1839 | 0.1581 | 0.2282 | 0.0246 |
| Slovenia | 0.4194 | 4.8087% | 5.4348% | 0.0000% | 0.4115 | 0.3960 | 0.4335 | 0.0115 |
| Slovakia | 0.2635 | 1.3708% | 0.0000% | 0.0000% | 0.2563 | 0.1803 | 0.3273 | 0.0476 |
| Finland | 0.4223 | 3.9356% | 0.3728% | 0.6482% | 0.3916 | 0.3278 | 0.4316 | 0.0364 |
| Sweden | 0.8636 | 0.9979% | 2.3410% | 0.7337% | 0.7954 | 0.6065 | 0.9084 | 0.1077 |
| UK | 0.8035 | 8.0368% | 11.7177% | 0.0000% | 0.7875 | 0.6405 | 0.9654 | 0.1104 |
Own processing according to data collected from EUROSTAT.
Table 4.
Results of DEA BCC input model and double-bootstrap procedure.
| Country | BCC_In_Eff Non Bootstr. (Average) | Slacks (Average) | Double-Bootstrapped Efficiency Characteristics | |||||
|---|---|---|---|---|---|---|---|---|
| CO2 (kg per Capita) | Methan (kg per Capita) | Nitrous Oxide (kg per Capita) | Average | Min | Max | StDev | ||
| Belgium | 0.6676 | 1.1367% | 0.0000% | 0.0000% | 0.6394 | 0.5633 | 0.7064 | 0.0520 |
| Bulgaria | 0.9395 | 1.4464% | 0.0000% | 0.0000% | 0.8548 | 0.7635 | 0.9053 | 0.0503 |
| Czech Rep. | 0.6029 | 7.3695% | 9.9839% | 0.0000% | 0.5926 | 0.5518 | 0.6266 | 0.0207 |
| Denmark | 0.4986 | 13.7999% | 2.9272% | 0.3433% | 0.4406 | 0.3767 | 0.5794 | 0.0608 |
| Germany | 0.7618 | 21.9921% | 0.0000% | 0.0000% | 0.7375 | 0.6431 | 0.7882 | 0.0506 |
| Estonia | 0.5090 | 8.7290% | 0.0000% | 0.0000% | 0.4721 | 0.4542 | 0.5139 | 0.0165 |
| Ireland | 0.6495 | 0.0000% | 24.1708% | 15.5208% | 0.5584 | 0.4546 | 0.7599 | 0.1031 |
| Greece | 0.6545 | 0.0000% | 0.0000% | 0.0000% | 0.6339 | 0.5556 | 0.6827 | 0.0436 |
| Spain | 0.8710 | 1.3858% | 3.3357% | 0.0000% | 0.8445 | 0.8156 | 0.8781 | 0.0207 |
| France | 0.9103 | 0.0000% | 1.1466% | 1.2333% | 0.8577 | 0.7578 | 0.9290 | 0.0587 |
| Croatia | 0.9450 | 0.0000% | 0.0000% | 12.1491% | 0.9020 | 0.8177 | 0.9448 | 0.0389 |
| Italy | 0.9344 | 4.7705% | 1.3703% | 0.0000% | 0.9015 | 0.8032 | 0.9585 | 0.0515 |
| Cyprus | 0.8836 | 27.3742% | 24.0988% | 0.0000% | 0.8688 | 0.7517 | 0.9813 | 0.0847 |
| Latvia | 0.8631 | 0.0000% | 3.4553% | 47.9455% | 0.8283 | 0.7824 | 0.8696 | 0.0261 |
| Lithuania | 0.6493 | 0.0000% | 2.0054% | 35.3218% | 0.6235 | 0.5810 | 0.7419 | 0.0478 |
| Hungary | 0.8887 | 0.0000% | 0.0000% | 0.2146% | 0.8509 | 0.7881 | 0.8875 | 0.0275 |
| Netherlands | 0.6861 | 12.7075% | 1.4868% | 0.0000% | 0.6592 | 0.6101 | 0.7116 | 0.0300 |
| Austria | 0.8749 | 7.6829% | 0.0000% | 0.0000% | 0.8445 | 0.7436 | 0.9066 | 0.0550 |
| Poland | 0.5497 | 0.0000% | 0.0000% | 0.0000% | 0.5345 | 0.4807 | 0.5561 | 0.0201 |
| Portugal | 0.9305 | 0.0000% | 28.7814% | 0.0000% | 0.9141 | 0.8048 | 0.9660 | 0.0492 |
| Romania | 0.8602 | 0.0000% | 36.7540% | 1.4658% | 0.8278 | 0.7527 | 0.8802 | 0.0438 |
| Slovenia | 0.7553 | 7.5039% | 4.8335% | 0.0000% | 0.7402 | 0.7152 | 0.7729 | 0.0163 |
| Slovakia | 0.6841 | 0.0000% | 0.0000% | 0.0000% | 0.6595 | 0.5575 | 0.7298 | 0.0529 |
| Finland | 0.5000 | 0.8427% | 0.0000% | 0.5963% | 0.4651 | 0.4053 | 0.5210 | 0.0356 |
| Sweden | 0.9175 | 0.1257% | 0.3798% | 0.1889% | 0.8149 | 0.7589 | 0.8827 | 0.0416 |
| UK | 0.8759 | 8.0246% | 10.7360% | 0.0000% | 0.8462 | 0.7544 | 0.9392 | 0.0683 |
Own processing according to data collected from EUROSTAT.
Table 5.
Models results for the panel of all countries—CCR.
| Dependent Variable | DEA CCR Input Efficiency Double Bootstrapped | ||
|---|---|---|---|
| Explanatory Variables | Model 1 | Model 2 | Model 3 |
| Intercept | −0.235170 | 0.012534 | 0.004464 |
| EnerCon | −0.029970 | 0.145195 *** | 0.050919 *** |
| FertNitr | −1.870600 *** | −4.380676 *** | −2.429000 *** |
| Ln(ProdIn) | 0.065336 | −0.004878 | - |
| RoadTr | −0.002291 ** | −0.005278 *** | −0.000735 |
| Waste | 0.000054 | 0.000846 *** | 0.000377 *** |
| MeanInc | 0.000038 *** | ||
| ResProd | 0.082396 *** | 0.111090 *** | |
| EnvTaxes | −0.000139 *** | ||
| Sigma | 0.083568 *** | 0.161080 *** | 0.111090 *** |
| Log-Lik (df) | 249.72 (10) | 100.16 (7) | 187.18 (7) |
| R2 | 0.863156 | 0.490403 | 0.762161 |
Note: significance lvl. *** p < 0.001; ** p < 0.01; Own processing.
Table 6.
Models results for the panel of all countries—BCC.
| Dependent Variable | DEA BCC Input Efficiency Double Bootstrapped | ||
|---|---|---|---|
| Explanatory Variables | Model 1 | Model 2 | Model 3 |
| Intercept | 1.394100 *** | 1.905100 *** | 1.053500 *** |
| EnerCon | −0.035126 | −0.053342 ** | −0.066360 *** |
| FertNitr | −3.863200 *** | −4.976900 *** | −4.858100 *** |
| Ln(ProdIn) | −0.117390 | −0.179520 * | |
| RoadTr | −0.005259 *** | −0.005405 *** | −0.004750 *** |
| Waste | 0.000380 ** | 0.000146 | 0.000078 |
| MeanInc | 0.000012 ** | ||
| ResProd | 0.043247 ** | 0.039897 ** | |
| EnvTaxes | −0.000323 *** | ||
| Sigma | 0.113590 *** | 0.130190 *** | 0.130390 *** |
| Log-Lik (df) | 204.23 (10) | 178.01 (7) | 176.95 (7) |
| R2 | 0.561430 | 0.416311 | 0.414725 |
Note: significance lvl. *** p < 0.001; ** p < 0.01; * p < 0.05. Own processing.
Table 7.
Models results for the Group 1A and Group 2A countries separately—CCR.
| DEA CCR Input Efficiency Group 1A Western Europe | DEA CCR Input Efficiency Group 2A Eastern Europe | |||||
|---|---|---|---|---|---|---|
| Model 1 | Model 2 | Model 3 | Model 1 | Model 2 | Model 3 | |
| Intercept | −0.199570 | −1.126038 * | 0.418730 *** | −1.478400 * | −2.021457 ** | −0.007913 |
| EnerCon | −0.106230 *** | 0.054736 ** | 0.029056 | 0.005685 | 0.370590 *** | 0.261327 *** |
| FertNitr | −1.458300 ** | −2.557034 ** | −1.542100 * | −0.695960 | −3.381870 * | −1.797841 |
| Ln(ProdIn) | 0.152030 * | 0.433915 *** | 0.347790 ** | 0.409588 ** | ||
| RoadTr | −0.001912 * | −0.007441 *** | −0.002436 | −0.009998 *** | −0.009850 *** | −0.008495 ** |
| Waste | −0.000670 *** | −0.000184 | −0.000005 | 0.000805 *** | 0.001318 *** | 0.001019 *** |
| MeanInc | 0.000049 *** | 0.000008 | ||||
| ResProd | 0.019415 | 0.107350 *** | 0.124070 | 0.176447 ** | ||
| EnvTaxes | −0.000040 | 0.001288 *** | ||||
| Sigma | 0.084678 *** | 0.138612 *** | 0.012412 *** | 0.010889 *** | 0.001318 *** | 0.136078 *** |
| Log-Lik (df) | 142.7 (10) | 78.6 (7) | 93.7 (7) | 99.6 (10) | 69.0 (7) | 69.8 (7) |
| R2 | 0.717735 | 0.260045 | 0.414279 | 0.583597 | 0.421865 | 0.433924 |
Note: significance lvl. *** p < 0.001; ** p < 0.01; * p < 0.05. Own processing.
Table 8.
Models results for the Group 1B and Group 2B countries separately—BCC.
| DEA BCC Input Efficiency Group 1B Stronger Efficient Countries | DEA BCC Input Efficiency Group 2B Weaker Efficient Countries | |||||
|---|---|---|---|---|---|---|
| Model 1 | Model 2 | Model 3 | Model 1 | Model 2 | Model 3 | |
| Intercept | 2.597000 *** | 2.436400 *** | 0.921650 *** | -0.158730 | 0.150600 | 1.009000 *** |
| EnerCon | −0.172530 *** | −0.006604 | 0.015241 | 0.030750 | 0.009336 | −0.001347 |
| FertNitr | 2.566600 *** | 0.724210 | 0.422020 | −4.635100 *** | −4.353900 *** | −2.985600 *** |
| Ln(ProdIn) | −0.319100 *** | −0.315180 *** | 0.212500 ** | 0.188660 ** | ||
| RoadTr | 0.000434 | −0.001349 | −0.005315 *** | −0.004961 *** | −0.005025 *** | −0.003953 *** |
| Waste | −0.000435 *** | −0.000185 * | 0.000440 | 0.000579 *** | 0.000223 *** | −0.000018 |
| MeanInc | 0.000009 ** | 0.000006 | ||||
| ResProd | −0.055936 *** | 0.009109 | 0.075125 *** | 0.059669 *** | ||
| EnvTaxes | 0.000391 *** | −0.000262 *** | ||||
| Sigma | 0.047689 *** | 0.056734 *** | 0.060089 *** | 0.067011 *** | 0.070526 *** | 0.071340 *** |
| Log-Lik (df) | 215.61 (10) | 192.5 (7) | 183.27 (7) | 164.32 (10) | 149.78 (7) | 153.27 (7) |
| R2 | 0.578961 | 0.398869 | 0.294819 | 0.549793 | 0.489620 | 0.478865 |
Note: significance lvl. *** p < 0.001; ** p < 0.01; * p < 0.05. Own processing.
© 2018 by the authors. Licensee MDPI, Basel, Switzerland. This article is an open access article distributed under the terms and conditions of the Creative Commons Attribution (CC BY) license (http://creativecommons.org/licenses/by/4.0/).
Share and Cite
MDPI and ACS Style
Lacko, R.; Hajduová, Z. Determinants of Environmental Efficiency of the EU Countries Using Two-Step DEA Approach. Sustainability 2018, 10, 3525. https://doi.org/10.3390/su10103525
AMA Style
Lacko R, Hajduová Z. Determinants of Environmental Efficiency of the EU Countries Using Two-Step DEA Approach. Sustainability. 2018; 10(10):3525. https://doi.org/10.3390/su10103525
Chicago/Turabian StyleLacko, Roman, and Zuzana Hajduová. 2018. "Determinants of Environmental Efficiency of the EU Countries Using Two-Step DEA Approach" Sustainability 10, no. 10: 3525. https://doi.org/10.3390/su10103525
Note that from the first issue of 2016, this journal uses article numbers instead of page numbers. See further details here.