Article

Researching the Main Causes of the Romanian Shadow Economy at the Micro and Macro Levels: Implications for Sustainable Development

by
Gheorghe H. Popescu
1,2,
Adriana Ana Maria Davidescu
3,4,* and
Catalin Huidumac
5
1
Department of Finance, “Dimitrie Cantemir” Christian University, 176, Splaiul Unirii, District 4, 040042 Bucharest, Romania
2
Center for Applied Macroeconomic Analysis, American Association for Economic Research, 30-18 50thStreet, Woodside, New York, NY 11337, USA
3
Department of Statistics and Econometrics, Bucharest University of Economic Studies, Romana Square, 15-17 Dorobanți St., Sector 1, 010552 Bucharest, Romania
4
Labour Market Policies Department, National Scientific Research Institute for Labour and Social Protection, 6-8, Povernei Street, 010643 Bucharest, Romania
5
Department of Economics and Economic Policies, Bucharest University of Economic Studies, Romana Square, 15-17 Dorobanți St., Sector 1, 010552 Bucharest, Romania
*
Author to whom correspondence should be addressed.
Sustainability 2018, 10(10), 3518; https://doi.org/10.3390/su10103518
Submission received: 6 September 2018 / Revised: 26 September 2018 / Accepted: 27 September 2018 / Published: 30 September 2018

Abstract

:
The Sustainable Development Goals (SDGs) that were established by the United Nations for the year 2030 are considered the blueprint for reaching a sustainable future through addressing poverty eradication, education, social protection, environmental protection, climate change, health, job opportunities, and strong institutions. Until now, sustainable development has focused mainly on the formal sector, somehow neglecting the potential contributions of the informal sector to sustainable futures. In this context, the paper aims to analyze the main causes of the Romanian shadow economy (SE) both at the micro and macro levels, and how they can make a considerable impact on achieving a more sustainable future. The main purpose of the paper is to highlight the relevance of knowing the main determinants of this phenomenon, emphasizing that keeping the incidence of the shadow economy and its causes under control could offer an alternative in the process of achieving sustainable development. In order to do that, we use an improved MIMIC (Multiple Causes Multiple Indicators) specification of the causal variables that is grounded in an evidence-based approach through using the points of view of the Romanian entrepreneurs. Their opinions are based on a national representative survey that is based on quarterly data covering the period 2000–2017. The empirical analysis pointed out the roles of tax avoidance, bribery, a lack of trust in public officials, the poor quality of business legislation, the poor government support for entrepreneurs, high social contributions, a relatively high of corruption, high tax rates, and uncertainty about regulation policies in increasing incidences of shadow economic activity. The macroeconomic results that were revealed to be the main causes for the Romanian SE were self-employment, unemployment, part-time employment, and the lack of trust in public institutions. Therefore, policymakers need to focus on building reliable and transparent institutions with a lower level of corruption, regulations, and bureaucracy, regaining people’ confidence in public institutions, and elaborating effective strategies for tackling the undeclared activities that will contribute to the achievement of sustainable development desideratum by the fulfillment of two main SDGs. These are Goal 8: Decent work and economic growth, and Goal 16: Peace, justice, and strong institutions.

1. Introduction

The Sustainable Development Goals (SDGs) that were established in 2015 are the central elements of the United Nations (UN)’s 2030 Agenda for Sustainable Development, and represent a driving force incorporating global efforts for achieving sustainable development.
Grounded on the success of the Millennium Development Goals (MDGs), the SDGs aims to promote prosperity through addressing a variety of social needs, including poverty eradication, education, social protection, environmental protection, climate change, health, job opportunities, and strong institutions.
In the last decade, the literature on sustainable development mainly took into account the shifts within the official sector; even if the informal economy is present in every economy in a smaller or larger proportion, sustainable development somehow has neglected the potential contributions of the informal sector to sustainable futures.
On the other hand, informality is considered to be a challenging topic among policymakers all over the world. Until now, there has not been a clear agreement among specialists regarding their definition, and the differences concern more or less the size, sources, the degree of interest, and the policies of tackling. Although it captures different facets of the same phenomenon, the various terms that have been used reflected more or less the same fact. Within the paper, the concept of the shadow economy has been adopted, which is a common nomenclature in the literature that has also been used by Schneider and Buehn [1] and Schneider and Williams [2].
This paper aims to identify and examine the most important determinants of the Romanian shadow economy at the micro and macro level and analyze the way in which they can be controlled in order to achieve sustainable development.
This is even more important for a former transition country such as Romania, with its own specificities, taking into account the international relevance of the phenomenon in the context of the establishment of a European Platform designed to enhance cooperation in tackling the undeclared work at the European Union (EU) level in 2016. Although there are many empirical studies capturing the magnitude of such an economy in the literature, until now, Romania and other southeastern European countries have been only part of a more extended panel of countries, and the results obtained in these studies were quite sensitive to the selection of the countries in the panel. Therefore, this study could represent a valuable tool in analyzing the causes of the shadow economic activity both for countries such as Romania, and also for other European countries, and also highlight the implications of controlling such a phenomenon for the achievement of sustainable development desideratum.
Could the shadow economy be a path to provide the sustainable development goals? This is the main question of our research. In attempting to answer this question, it is important to mention that the shadow economy is not fully acknowledged, nor is it clearly separated from the official economy. It is also difficult to identify and measure the main drivers.
More in depth, the research aims to identify the most important determinants of the Romanian shadow economy using an improved Multiple Causes Multiple Indicators (MIMIC) specification of the causal variables grounded in an evidence-based approach using the perceptions of the Romanian entrepreneurs, and also analyze how each of those drivers can offer valuable information for the achievement of the Sustainable Development Goals.
The main advantage of the MIMIC model is the ability to simultaneously consider multiple causes and multiple indicators of the shadow economy—a structural equation model—which allows policymakers to draw specific policies for the prevention and deterrence of informality, taking into account the specificities of Romania. The only real constraint of this approach refers to the choice of variables [3].
Therefore, we propose a prior identification and reformulation of the key determinants of undeclared work, which will lead to more robust findings and a much wider acceptability of the results, starting from the perceptions of Romanian entrepreneurs concerning the shadow economic activity.
Until now, at least for the Romanian economy, the selection of possible determinants of undeclared work was mainly based on the theoretical considerations regarding the relationship between the size of undeclared work and various policy measures. By identifying the main drivers of the shadow economic activity, taking into account the perceptions of Romanian entrepreneurs, the direct result will be an improved MIMIC specification of the causal variables grounded in an evidence-based approach.
The empirical analysis will be structured on three levels. On the first one, we will determine the main causes of the Romanian shadow economic activity based on the perceptions of Romanian entrepreneurs. At the second level, we will incorporate these explanatory variables along with other variables specified in the literature as potential causes of the shadow economy in the process of obtaining empirical evidence regarding the main causes of the Romanian shadow economy using the MIMIC model. At the third level, we will carefully analyze its implications for sustainable development.
The paper is organized in the following sections. Section 2 presents a brief overview of the most relevant studies regarding the relationship between the shadow economy and sustainable development and the main determinants of the shadow economic activity in the literature. Section 3 underlines the main estimates of the Romanian shadow economy both at the national and international level. Section 4 highlights the process of identifying the main causes of the shadow economy, and is divided into two main sections. The first one presents the survey design, some theoretical considerations, the methodology, and the data. The second part of this section is dedicated to empirical results, which are divided into five main subsections. The first one is dedicated to the presentation of a profile of Romanian entrepreneurs. The second one reveals the opinions of Romanian entrepreneurs regarding the shadow economic activity. The third one presents the process of identifying the main determinants of the Romanian shadow economy using the MIMIC model. The fourth subsection emphasizes the main implications of the shadow economy for sustainable development, and the last subsection is dedicated to the computation of the dimension of the unofficial economy over the period 2000–2017. The paper ends with main conclusions and policy implications, which are considered fundamental in the process of tackling the shadow economic activities and its implications for sustainable development, as well as some suggestions for future work.

2. Theoretical Considerations and Hypothesis Development

In the last decade, the literature on sustainable development has concentrated mainly on shifts within the official sector. Even if the informal economy is present in every economy in a smaller or larger proportion, sustainable development has somehow neglected the potential contributions of the informal sector to sustainable futures. Therefore, disregarding the informal economy and its implications for sustainable development may be omitting an important part of some developing nations’ economies. Based on the most recent average estimates of the shadow economies worldwide provided by Medina and Schneider [4] for the period 1991–2015, the biggest size of the shadow economy has been registered in countries such as Georgia (64.87%), Bolivia (62.28%), and Zimbabwe (60.64%). Among the European Union countries, the largest size of the shadow economy measured as a percentage of official gross domestic product (GDP) has been registered by Romania (30.14%) and Bulgaria (29.17%).
The shadow economy can be seen from both perspectives: positive and negative. On the one hand, the shadow economy is associated with entrepreneurship, flexibility, and resilience, and is considered to be even more innovative, resilient and resource-efficient than its formal counterpart (Gurtoo and Williams [5]; Williams and Gurtoo [6]; Williams and Nadin [7]; Enste [8]). It leads to market creation, entrepreneurship intensification, and an increase in financial resources (Asea [9]). Schneider and Enste [10] stated that it is a sector that creates additional added value, and this is used in the official economy. Also, it works as a social buffer for unemployment, facilitating employment for the unemployed (Galli and Kucera [11]). Additionally, it can be seen as a pathway to reducing poverty and inequality, supporting the working poor in the unofficial sector (Chen et al. [12,13]).
On the other hand, it is related to smaller salaries, poor working conditions, and the shortage of social security benefits (Farzanegan and Hassan [14]). La Porta and Schleifer [15], Gerxhani [16], or Schneider and Enste [10] considered that a really large dimension of the unofficial economy could have negative externalities on the official economy, absorbing capital assets and labor force from the formal economy, limiting state resources, creating imbalances in the official statistics, and inequitable competition with the companies operating in the formal sector who obey tax payment legal regulations.
As a consequence, tax revenues will obviously decrease, as well as the quality of basic public goods and services. In times of busts, inputs (labor and capital) go from the official economy to the informal sector, highlighting a negative relationship between the two economies. The informal sector generates a negative externality on the formal economy’s efficiency, using the public infrastructure that is maintained by the contributions of formal companies and individuals without having any participation in expanding these public goods (Loayza [17]; Oviedo et al. [18]). From an environmental perspective, the unofficial sector will increase pollution due to the informal companies lacking access to financial resources that could implement green technology (Biswass et al. [19]), while the same sector could obstruct the expansion of the export market (Bacchetta et al. [20]). These negative externalities are the main reason why it is necessary to tackle and to control this type of economy.
The opinions in the literature analyzing the relationship between the shadow economy and sustainable development have both pros and cons.
On the one hand, Briassoulis [21] pointed out the difficulty of measuring economic sustainability in the informal sector, since the participants do not own resources, and their results have become uncertain. On the other side, Ruzek [22] argued that the unofficial sector could offer the necessary shift in economic models, assuming it to be a step toward a sustainable future.
Briassoulis [21] drew attention to the control and regulation of such activities, considering the legalization of this sector to be unreliable, while Ruzek [22] believed that supervising the unofficial sector through a combination of policies and economic freedom will lead to new jobs, while also keeping the negative effects under control.
Also, the aspect of environmental management has created different opinions. Briassoulis [21] considered the inclusion of environmental control into the informal sector to be unsustainable, while Smit and Musango [23] highlighted several informal activities that in contrast contribute to sustainable development.
If we take social sustainability into account, Briassoulis [21] thought that the mere existence of the informal economy will lead to a separation of rich and poor, official and unofficial workers, or rich and poor countries, while according to Ruzek [22], it supplies the poor people with goods and services that they could not otherwise afford in the official sector, and also offers the same possibilities to different socioeconomic categories.
Also, Rupani [24] highlighted the positive aspects of the shadow economy, considering it to be an important source for individuals mostly in developing countries, and seeing this sector as a sustainable development driver.
Analyzing the ways in which the shadow economy could promote sustainable development, the informal economy could be seen as a safety valve for the unemployed individuals, increasing mostly in countries with high levels of unemployment. If the policymakers could keep the level of unemployment under control, and thus also the level of the unofficial sector, this can have implications for achieving Goal 8: Decent work and economic growth.
Chambwera et al. [25] stated that informal employment can be a solution for the achievement of MDGs, stimulating gender equality, poverty, and hunger eradication, contributing in such a way also to SDG 1: No poverty, Goal 2: Zero hunger, and Goal 5: Gender equality. Also, Ruzek [22] emphasized the positive effects of the shadow economy in generating new jobs, sustaining local economies, or offering goods and services to those who cannot access the official market, allowing for the necessary shift toward a sustainable future and also contributing to the achievement of SDG Goal 8.
Beeton [26] has brought additional arguments in support of the informal economy, considering it to be an incubator of human capital formation that offers possibilities in education and business establishment, and contributing to the achievement of SDG Goal 4: Quality education, and Goal 10: Reduced inequalities.
The contribution of the shadow economy to the green economy has been highlighted by the studies of Smit and Musango [23], Acey and Culhane [27], or Agamuthu [28] through organic waste management, urban farming, household-scale energy technologies, or waste collection as an informal productive employment contributing to sustainability. In such a way, it contributes to Goal 12: Responsible consumption and production.
In order to acquire sustainable development, it is essential to substantially reduce the level of corruption and bribery, and increase the trust in public institutions and the level of satisfaction with public services, contributing in such a way to the achievement of Goal 16: Peace, justice, and strong institutions.
In this context, the relationship between finance, business, and corruption has been empirically analyzed. The study of Jha [29] shows that financial reforms reduce corruption, with the impact of these reforms being related to the quality of the governance, while financial development impacts businesses (Guiso et al. [30]).
Analyzing the factors impacting corruption in the literature, it is worth to mention that factors such as culture (Jha and Panda [31]), legal enforcement (Fisman and Miguel [32]), colonial origins, economic development, and even women’s representation in parliament (Jha and Sarangi [33]) have been found to impact corruption across countries. Exploring the relationship between individualism/collectivism and corruption, Jha and Panda [31] proved that more individualistic countries have smaller levels of corruption perception. Analyzing the cultural norms and legal enforcement among officials regarding parking behavior, Fisman and Miguel [32] stated that legal enforcement has a significant negative impact on corruption. In their paper, Jha and Sarangi [33] explored the role of women on impacting corruption, highlighting a negative and statistically significant impact on corruption as policymakers. Heshmati [34] emphasized the role of the shadow economy and corruption as development impediments, proving a negative relationship with economic growth.
So, it becomes increasingly clear that if the objective is sustainable development, there is a need for this to be rooted in a sound understanding of the shadow economy. Through providing extensive knowledge about its specificities and determinants of the shadow economy and taking them into account, controlling the magnitude could contribute to the achievement of sustainable development desideratum.
Based on the previous theoretical considerations, we will make the following hypotheses stipulating how the shadow economy determinants could contribute to sustainability by the fulfillment of two of the sustainable development goals, namely Goal 8 and Goal 16:
  • HA1: Monitoring the unemployment rate contributes to sustainability through the achievement of Sustainable Development Goal 8: Decent work and economic growth.
  • HA2: Monitoring the employment rate and its components (the self-employment rate and part-time employment rate) contributes to sustainability through the achievement of Sustainable Development Goal 8: Decent work and economic growth.
  • HA3: Monitoring the real growth contributes to sustainability through the achievement of Sustainable Development Goal 8: Decent work and economic growth.
  • HB: Monitoring the government efficiency contributes to sustainability through the achievement of Sustainable Development Goal 16: Peace, justice and strong institutions.
In order to do this, it is essential to have extensive knowledge about the main determinants of the shadow economic activity. The main studies in the field—Dell’Anno and Solomon [35], Schneider and Buehn [1,36], Schneider [37] and also Schneider and Williams [2]—pointed out the main causes of the shadow economy in general.
Dell’Anno and Solomon [35] mentioned the tax burden, the quality of public services, major government regulation, and the unemployment rate as the main causes of the shadow economy. In particular, an increase in the unemployment rate will make working in the informal sector a more enticing alternative for individuals, who will shift from the formal sector to the unofficial one. Increasing government regulations led to an increase in the labor cost in the official sector, offering a strong incentive for preferring the shadow activity instead of the official one.
The same authors explained in their paper how a rise in the shadow economy will affect the official economy by increasing the demand for currency (as the majority of the transactions in the unofficial economy are made by cash). Many other empirical studies highlighted the tax burden as a crucial determinant of the shadow economy.
The papers of Schneider and Buehn [1,36], Schneider and Williams [2], or Schneider [37] pointed out the main determinants of the shadow economy: tax components, tax morale, the institutional credibility, public sector services, labor market regulation, the official economy, self-employment, and unemployment.
The shadow economy can either complement the official economy, or become a substitute.
In their paper, Schneider and Williams [2] pointed out a potential contribution of the main causes to the size of the shadow economy, highlighting that the highest influence was manifested by tax and social security contributions, which explain 45–52% of the variation in the shadow economy, followed by the quality of state institutions (10–17%) and labor market regulation, transfer payments, and public sector services (7–9%).

3. A Brief Overview of the Main Estimates of the Romanian Shadow Economy

In the context of analyzing the implications of the shadow economy on the drivers for sustainable development, it is important to also know the patterns and the magnitude of this sector over time.
The dynamics and the size of the Romanian shadow economy have been the subject of interest for different institutions and independent researchers (Table 1), which include: the evaluations of The National Institute of Statistics, as well as the studies of Albu [38] and Albu et al. [39,40], Alexandru and Dobre [41], Davidescu [42,43], and Andrei, Ştefănescu, and Oancea [44] at the national level; and the studies of Schneider, Buehn, and Montenegro [45], Schneider [37,46,47], and Medina and Schneider [4] at the international level.
Previous studies regarding the size and the characteristics of the Romanian shadow economy have been realized by French et al. [48], Kaufamann and Kaliberda [49], Johnson et al. [50,51], Lacko [52], Eilat și Zinnes [53], Schneider et al. [10,54,55,56,57,58], and Schneider [59,60].
Using official statistical data, The National Institute of Statistics evaluated the size of the shadow economy using the labor input method to the value of 18.1% of official GDP (gross domestic product) in 2000, and followed a decreasing trend, registering about 15.4% of official GDP in 2003. Since 2004, the size of the SE began to slowly increase, attainting about 20% in 2007, and 23.5% in 2010.
The empirical estimates of Albu [38] and Albu et al. [39,40], who used the income discrepancy method, stated that the share of informal income in total household income decreased in Romania during 2000–2007, from 21.7–22.3% in 2000 to about 14.6–15% in 2007.
The empirical results of Andrei, Ştefănescu, and Oancea [44] were based on the monetary method, and revealed that the proportion of cash of unregistered transactions in total cash in the economy oscillated between 25–35% during 2000–2009.
Quarterly estimates of the SE were provided by Alexandru and Dobre [41] based on the currency demand approach; the unofficial activity measured almost 36.5% of official GDP in 2000, decreasing to about 34% in 2003 and registering about 31.6% at the middle of 2010.
Using panel data, several studies of Schneider, Buehn, and Montenegro [45], Schneider [46], Schneider [37], and Medina and Schneider [4] reported among other countries information related to the dimension of the Romanian shadow economy, revealing an estimate of 34.4% in 2000, 30.5% of official GDP in 2005, 24% in 2013, 28% in 2015, and 27.6% in 2016.

4. Measuring Progress toward the Sustainable Development Goals—the Case of Romania

In September 2015, Romania adopted alongside other countries the 2030 Agenda for Sustainable Development, committing to promote the three dimensions of sustainable development: economic, social, and environmental. Romania is committed to implementing the Sustainable Development Goals not only at the national level, but also at the international level through the official development assistance offered to developing countries. The experience gained in the transition process could be useful for countries interested in such assistance.
In this context, the main aim of this section is to shed light on the progress made by Romanian toward the 2030 Sustainable Development Goals, emphasizing the country performance in assessing the SGDs and highlighting the areas requiring more action.
In 2018, the Bertelsmann Stiftung and the Sustainable Development Solutions Network (SDSN) released the latest information regarding the assessment of countries’ distance to achieving the Sustainable Development Goals (SDGs) for all 193 United Nations (UN) Member States into the 2018 SDG Index and Dashboards report [61].
What is even more important is that they released the score for the SDG Index, which is a synthetic measure capturing the country performance on the 17 SGDs, ranging between 0 (the worst outcomes) and 100 (the best outcomes). Romania’s overall index score in 2018 was 71.2, suggesting that the country is on average 71.2% of the way to the best possible outcome across the 17 SDGs.
Analyzing the average performance of Romania by each sustainable development goal, it can be highlighted that if sustained efforts have been made for certain goals, additional efforts are still needed for others.
The best results have been achieved on the goals: SDG 1: No poverty (95.3), SDG 6: Clean water and sanitation (93.7), and SDG 13: Climate action (92.9). On the opposite side, Romania has achieve the worst results for goals SDG 10: Reduced inequalities (30.1), SDG 9: Industry, innovation, and infrastructure (38.5), SDG 14: Life below water (56.3), and SDG 17: Partnership for the goals (58.7) (Figure 1).
It is important to mention that for both of the SDGs targeted by our research, SDG 8 and SDG 16, more action and additional progress are required, since actually, Goal 8 registered a progress of 73.1%, and Goal 16 has been implemented in even a smaller proportion, 65.2%.
Also, examining SDG trends, we can mention that even if Goal 8 exhibited positive trends, Goal 16 is characterized by stagnation; therefore, additional efforts are needed in order to achieve the fulfillment of these objectives (Figure 2).
In such a context, the perspective of considering the presence of the unofficial sector in tackling sustainable development becomes even more feasible, if it is to take into account the non-negligible size of this sector in the whole economy.

5. Identifying the Main Causes of the Romanian Shadow Economy

5.1. Data and Methodology

The empirical analysis will be structured on three levels. On the first level, in order to identify the main determinants of the shadow economy, the improved MIMIC approach will incorporate the potential causes of shadow economic activity based on the opinions of Romanian entrepreneurs highlighted by the survey of Romanian company owners/managers. The survey was conducted in February and March 2017.
Using a random stratified sampling to assure the national representativeness for companies with more than five employees, 420 respondents were interviewed based on the computer-assisted web interviewing (CAWI) method.
We decided to use the information provided by the company managers of registered businesses in order to investigate the main determinants of the shadow economic activity, because as experts in their industry, they are likely to have information about the types and causes of the unofficial activities as well as the practices of unregistered businesses, because these companies compete with the registered ones.
Instead of a classical survey in which the perceptions of individuals or households are investigated, the study emphasized the employers’ points of view.
The questionnaire contains information related to the firms’ attitudes regarding the level of satisfaction with the National Agency for Fiscal Administration, the government’s tax policy, business legislation, tax evasion, bribery, government aid for entrepreneurs, tax morale, opportunities in the business environment, barriers in the business environment, and the main obstacles in starting a business.
The level of satisfaction of firms regarding the National Agency for Fiscal Administration activity, the government’s tax policy, business legislation, and the government’s aid for entrepreneurs were measured using four statements measured on a five-point scale, where “1” is very low satisfaction, and “5” is very high satisfaction.
The entrepreneurs’ tolerance toward tax evasion and bribery were captured using two statements: Tax avoidance is tolerated behavior in Romania/Bribing is tolerated behavior in Romania, using a five-point Likert scale, where “1” indicates “completely disagree”, and “5” indicates “completely agree”.
Membership in the local community and personal contributions to the growth of the economy have been evaluated using the following statements: Being a member of the local community is important to me/Businesses such as yours contribute a lot to growth of the country’s economy and society in general, with five-point Likert scale where, “1” indicates “completely disagree” (low implication) and “5” indicates “completely agree” (high implication).
The survey evaluated the barriers encountered by the business environment using three statements: “Min_Wage = Increasing the minimum wage leads firms to hire unskilled or low-skilled workers without legal forms”, “Unempl_Allow = The low amount of the unemployment allowance determines whether the unemployed accept work without legal forms while also receiving the unemployment benefit” and “Soc_Contr = High social contributions make firms hire workers without legal forms, using a five-point Likert scale where, “1” indicates “completely disagree” and “5” indicates “completely agree”.
Entrepreneurs were also asked to evaluate the potential obstacles for their companies, pointing out either no obstacles (1), minor obstacles (2), moderate obstacles (3), severe obstacles (4), or very severe obstacles (5) in relation to the following elements: Tax administration (TA), tax rates (TR), Trade and custom regulation (TCR), Business licencing and permits (BLP), Functioning of the judiciary/courts (FJC), Uncertainty about regulation policies (UARP), Corruption (C), the Anti-competitive practices of other competitors (ACPOC), Political instability (PI), Increasing the minimum wage (IMW), and the role of the union in setting the minimum wage (RUSW).
On the second level, the information provided by the entrepreneurs regarding the factors that are considered to be the drivers of the Romanian shadow economy, together with the other variables that are identified in the literature, will be incorporated into an improved MIMIC specification grounded in an evidence-based approach, which will be used to reveal the main causes and also provide some patterns over time regarding such phenomenon.
All of these findings will be incorporated in the MIMIC model, while also taking into account other potential causes specified in the literature. Therefore, the modeling process was based on a 10–1–3 MIMIC model with 10 potential explanatory variables such as: the fiscal regime and its components, government employment, unemployment, self-employment, government consumption, part-time employment, the quality of public institutions, and three indicators: the index of real GDP, the currency ratio, and the labor force participation rate.
In the estimation process of the shadow economy, we used quarterly data for the period 2000Q1–2017Q3. The data used in the modeling process were the Eurostat databases, Monthly Bulletins of the National Bank of Romania, and the Tempo database of the National Institute of Statistics. Appendix A offers the details on the dataset.
At the third level, knowing the main determinants of shadow economic activity, we will carefully analyze their implications for sustainable development and how they can be kept under control in to order to achieve this desideratum.
In the next section, we will present the main variables that are taken into consideration in the MIMIC model:
Indicator 1: Index of real GDP (2005 = 100)
Regarding the relationship between the official and unofficial sectors, the literature supported on the one hand a positive connection, such as in the studies of Adam and Ginsburgh [62] for Belgium, Giles and Tedds [63] for Canada, Schneider, Chaudhuri, and Chatterjee [56] for Asian countries, and on the other hand a negative relationship, supported by the studies of Loayza [64] for 14 Latin American countries, Kaufmann and Kaliberda [49], Eilat and Zinnes [53] for transition countries, Schneider and Enste [54] for 76 countries, Dell’Anno ([65,66]) for Italy and for Latin American countries, Dell’Anno, Gomez-Antonio, and Pardo [67] for France, Greece, and Spain. Schneider [59] claimed that the interdependencies between both economies are related to the degree of economic development. Also, Dell’Anno [66] treated the relationship between the official and shadow economy for the case of Latin American countries, revealing that both sectors can be seen as complements, with the shadow economy sustaining economic growth. Using a panel of 161 countries, Berdiev and Saunoris [68] revealed that that financial development reduces the size of the shadow economy. Kaufmann and Kaliberda [49] analyzed the link between both economies, highlighting the speedy release of markets, macro stability, and a stable and moderate tax regime as the main drivers of the unofficial economy.
The reference variable that was used to estimate the model is the index of real GDP (2005 = 100), making the assumption that both economies are most likely substitutes, and setting out the value to −1 in the model estimation. Another possible explanation for the choice for the sign of the scale coefficient resides in the sign of explanatory variables. A positive sign for the coefficient revealed a negative impact of causal variables on the informal economy, which contradicts the economic theory and empirical results in the field.
Hypothesis 1. 
The larger the size of the shadow economy, the lower the GDP index, ceteris paribus.
Indicator 2: Currency ratio (C/M1)
As a monetary indicator, the currency ratio (C/M1) has been used in the model. Its sign is expected to be positive, taking into account the hypothesis according to which a significant portion of informal transactions use cash as the main medium of exchange, because it leaves no traces. According to the National Bank of Romania, the ratio of currency in circulation outside the banking system to the total money supply increased continuously from 25.6% at the end of 2008 to almost 33.8% in the middle of 2015.
Hypothesis 2. 
The larger the size of the shadow economy, the larger the currency held by the public, ceteris paribus.
Indicator 3: Labor force participation rate
As an indicator of labor, the labor force participation rate was used, starting from the hypothesis that a decline in this indicator could mean that part of the official employees go to the informal sector, but the expected sign is doubtful. On the one hand, a positive sign could suggest the lack of involvement of individuals in informal activities in the period of economic decline, while on the other hand, a negative sign represents a movement of workers between the two sectors.
Dell’Anno, Gomez-Antonio, and Pardo [67] claimed that individuals do not give up their jobs to work exclusively in the informal sector; rather, they choose to work in both sectors. Schneider and Bajada [69] mentioned that the activity from the formal economy can be unaffected by the presence of shadow activities if they take place after the working time or during the weekends.
Hypothesis 3. 
The larger the shadow economy, the lower the official participation rate, ceteris paribus.
Causes 1–3: The fiscal regime and its components (direct taxes, indirect taxes, and social contributions) are considered in most studies to be the main causes of increasing the size of the informal economy; a positive sign is expected. As Schneider and Williams [2] stated, a reduction in the fiscal regime will lead most likely to a decline in the dimension of the shadow economy. This hypothesis was supported also by the studies of Johnson et al. [51,70], Giles and Tedds [63], Dell’Anno [65], and Christopoulos [71].
Hypotheses 1–3. 
The higher the fiscal regime or its components, the larger the size of the shadow economy, ceteris paribus.
Cause 4: Government employment is used in the model as proxy for the regulation degree of the economy. The expected sign of this indicator could be positive, highlighting that an excessive regulation will determine whether companies manage their activities in the informal sector [35].
Hypothesis 4. 
The higher the government employment, the larger the size of the shadow economy, ceteris paribus.
Cause 5: The potential impact of unemployment could be positive or negative. There is a quite incisive debate in the literature regarding the potential influence of unemployment. According to Gilles and Tedds [63], some of the people who are officially unemployed work, at least partially in the unofficial economy, in order to increase their earnings; thus, a positive relationship could be highlighted. Also, Dell’Anno and Solomon [35] highlighted that the shadow economy was acting as a buffer, absorbing part of the officially unemployed workers. A very interesting remark is that offered by Tanzi [72], pointing out that in the recession periods, the number of jobs in the informal sector is also limited, and thus, the expected sign could be negative. Luo and Shang [73] stated that the unemployment rate serves as an index for describing the economy. Saafi and Farhat [74] and Saafi, Farhat, Mohamed, and Bel [75] proved that there is causality between unemployment and the unofficial sector.
Hypothesis 5. 
The higher the unemployment, the larger the size of the shadow economy, ceteris paribus.
Cause 6: It is also expected that self-employment measured as a percentage of the labor force positively influences the informal economy, given that there are more alternatives to evade due to the higher number of deductions in personal income taxes [76].
Hypothesis 6. 
The higher the self-employment rate, the larger the size of the shadow economy, ceteris paribus.
Cause 7: Government consumption is also used as a proxy for public sector services; it quantifies the state activities, and the expected sign should be positive [65].
Hypothesis 7. 
The higher the rate of government consumption, the larger the size of the shadow economy, ceteris paribus.
Cause 8: Part-time employment could also be seen as a determinant of SE, given that for some workers, it could be more attractive to have part-time contracts or no contract at all. Also, those who are already working in the official labor market can decide to work in the informal sector to supplement their revenues. Bacchetta, Ernst, and Bustamante [20] mentioned the lack of protection of such workers accepting this kind of activity, pointing out the major difficulties of such informal employed workers to benefit from formal education and the training programs financed by public authorities.
Hypothesis 8. 
The higher the rate of part-time employment, the larger the size of the shadow economy, ceteris paribus.
Cause 9: The poor quality of public institutions and public services represented an incentive for informal activity, since the presence of highly corrupt government officials would be related to more unofficial activity [77]. In order to quantify the perceptions of citizens regarding the quality of public institutions, the quality of public services, and the credibility of the government’s commitment, we have used in the model two indices: regulatory quality and government effectiveness, with a negative sign being expected.
As Hokamp and Seibold [78] stated, increasing trust in public institutions will also increase tax compliance. Dell’Anno and Solomon [79] stressed that the relationship between the shadow economy and income inequality depends on the quality of institutions. Kucera and Roncolato [80] mentioned that “strong labor market regulations can be viewed as a determinant of informal employment” (p. 321).
Hypothesis 9. 
The better the quality of public institutions, the smaller the size of the shadow economy, ceteris paribus.
According to Schneider, Buehn, and Montenegro [45], the model considers the shadow economy as a “latent variable” that is influenced by the causes of the shadow economy, and reflected some indicators of the shadow economy.
Following Schneider and Buehn [81], the MIMIC model relies on the statistical theory of unobserved variables, and mainly consists in comparing two covariance matrices, with one of the observable variables being a theoretical one.
The model has two kinds of equations: “the structural model, [which] revealed the relationships among the latent variable (η) and the causes (Xq), and the measurement model, [which] links indicators (Yp) with the latent variable (non-observed economy)” ([4], p. 6,7).
The   structural   model :   η = γ X + ξ
where: X = ( X 1 , X q ) is the vector of causes; γ = ( γ 1 , γ 2 , , γ q ) is the vector of structural coefficients; and ξ is the vector of error terms with the variance ψ . The covariance matrix of q causes is denoted by Θ .
The   measurement   model :   Y = λ η + ε
where: Y = ( Y 1 , Y p ) is the vector of indicators; λ ( p × 1 ) is the vector of regression coefficients; and ε ( p × 1 ) is the vector of error terms. The covariance matrix of error terms is Θε.
The normalization of a parameter to a pre-assigned value is the condition that will allow the estimation of the system formed by Equations (1) and (2) [82].
Usually, the model is estimated using the maximum likelihood method (ML), with special attention offered to the detection of the multivariate normality of original data. If the multivariate normality is violated, it is recommendable to use robust maximum likelihood or the Satorra–Bentler chi-square test to improve the chi-square statistic in case of a non-normal time-series, returning the same values for parameters as ML estimation.
Following Bollen [82] and Long [83], in order to evaluate the models and select the optimal model, the the goodness of fit of the models has been evaluated, including: the statistical significance of parameters, the p-value of the chi-square test evaluating the model against the saturated model, the root mean square error of approximation (RMSEA), the standardized root mean square residual (SRMR), the comparative fit index (CFI), the Tucker–Lewis index (TLI), and the values of the coefficient of determination (CD), the values of information criteria Akaike (AIC)and Schwarz (SBC).
The chi-square test evaluated the performance of the MIMIC model against the saturated model, which fits the covariances perfectly. In order to accept that the model fits, as well as the saturated model, the p-value needs to be 1. The RMSEA is the value of the root mean squared error of approximation, and p-close is the probability that the RMSEA value is less than 0.05. The probability need to be much closer to 1 in an optimal model.
The AIC and SBC criteria are used to compare models, with smaller values indicating a better model. CFI and TLI are two indices whose values close to 1 indicate a good fit.
A value of 0 for SRMR indicates a perfect fit, while a value smaller than 0.08 indicates a good fit. A value of the coefficient of determination close to 1 indicates a good fit.
The model offers only relative figures for the shadow economy, which provide some information about the evolution of the shadow economy over time rather than estimates for such a phenomenon. Dell’Anno and Solomon [35] and Schneider, Buehn, and Montenegro [45] mentioned that the MIMIC index needs to be converted into figures that are measured as the percentage of official gross domestic product (GDP) to obtain the size and trend of the shadow economy. Thus, it is necessary to apply a calibration procedure. Dell’Anno and Schneider [84] and Dell’Anno and Solomon [35] provided several benchmark procedures.
The Census X-13 method has been used as a seasonal adjustment method. The non-stationarity has been analyzed using unit roots tests (Augmented Dickey-Fuller (ADF) and Phillips-Perron (PP) tests), highlighting that the series have been differenced to achieve stationarity.
The empirical results of Mardia [85], Doornik–Hansen [86], and Henze–Zirkler [87] revealed a rejection of the hypothesis of multivariate normality, leading to the estimation of several specifications of the MIMIC model using the maximum likelihood method with the Sattora–Bentler option, which offers the same values of parameters, but the model’s reliability statistics (Chi-square) and the standard errors are corrected. The empirical results of Mardia’s test for the optimal model were provided in Appendix B.

5.2. Empirical Results

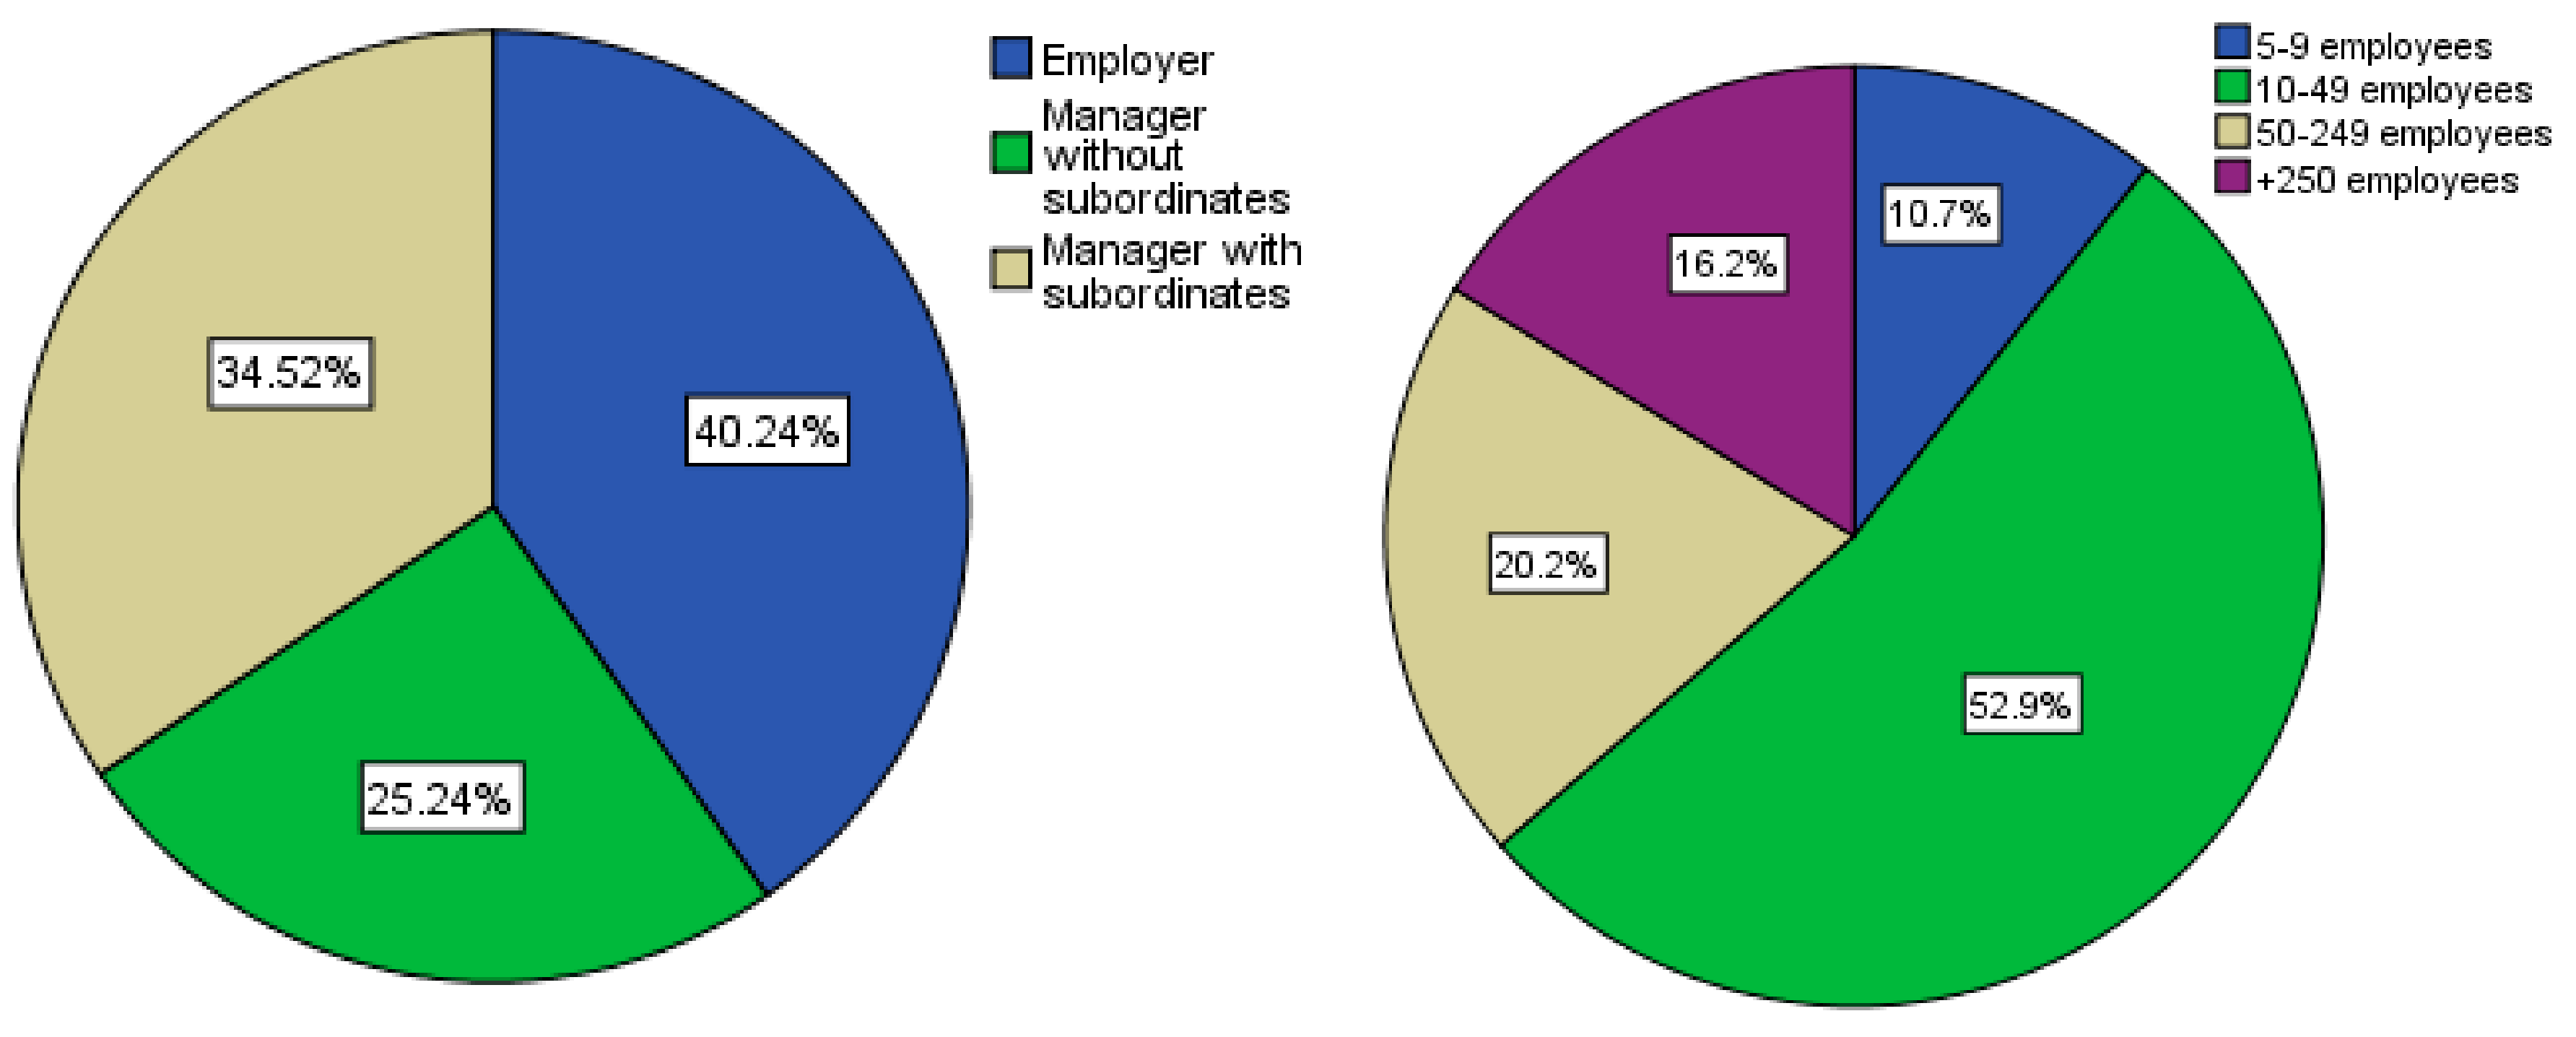
5.2.1. The Sample Profile of Romanian Entrepreneurs

Analyzing the responses offered by entrepreneurs, it can be highlighted that 40.24% of the respondents are employers, while 34.52% of them are managers with subordinates, and only 25.24% are managers without subordinates. The majority of enterprises surveyed (52.9%) are small companies with 10–49 employees, while 20.2% of companies had between 50–249 employees. Only 16.2% of the companies are large companies, and 10.7% of the companies are micro-enterprises (Figure 3).
Regarding the residence area of the company, the majority of the companies are from urban areas (87.1%), with most of them residing in Bucharest (22.4%), followed by the northwest (15%) and central regions (13.8%) (Figure 4).
Taking into account the area of activity, the results highlighted that the majority work in the services field (26.9%), followed by other sectors (21.7%), with manufacturing constituting the largest proportion (17.4%). The overwhelming majority of companies are privately owned with a majority of Romanian capital (70.7%), followed by private ownership with a majority of foreign capital (19.5%) (Figure 5).

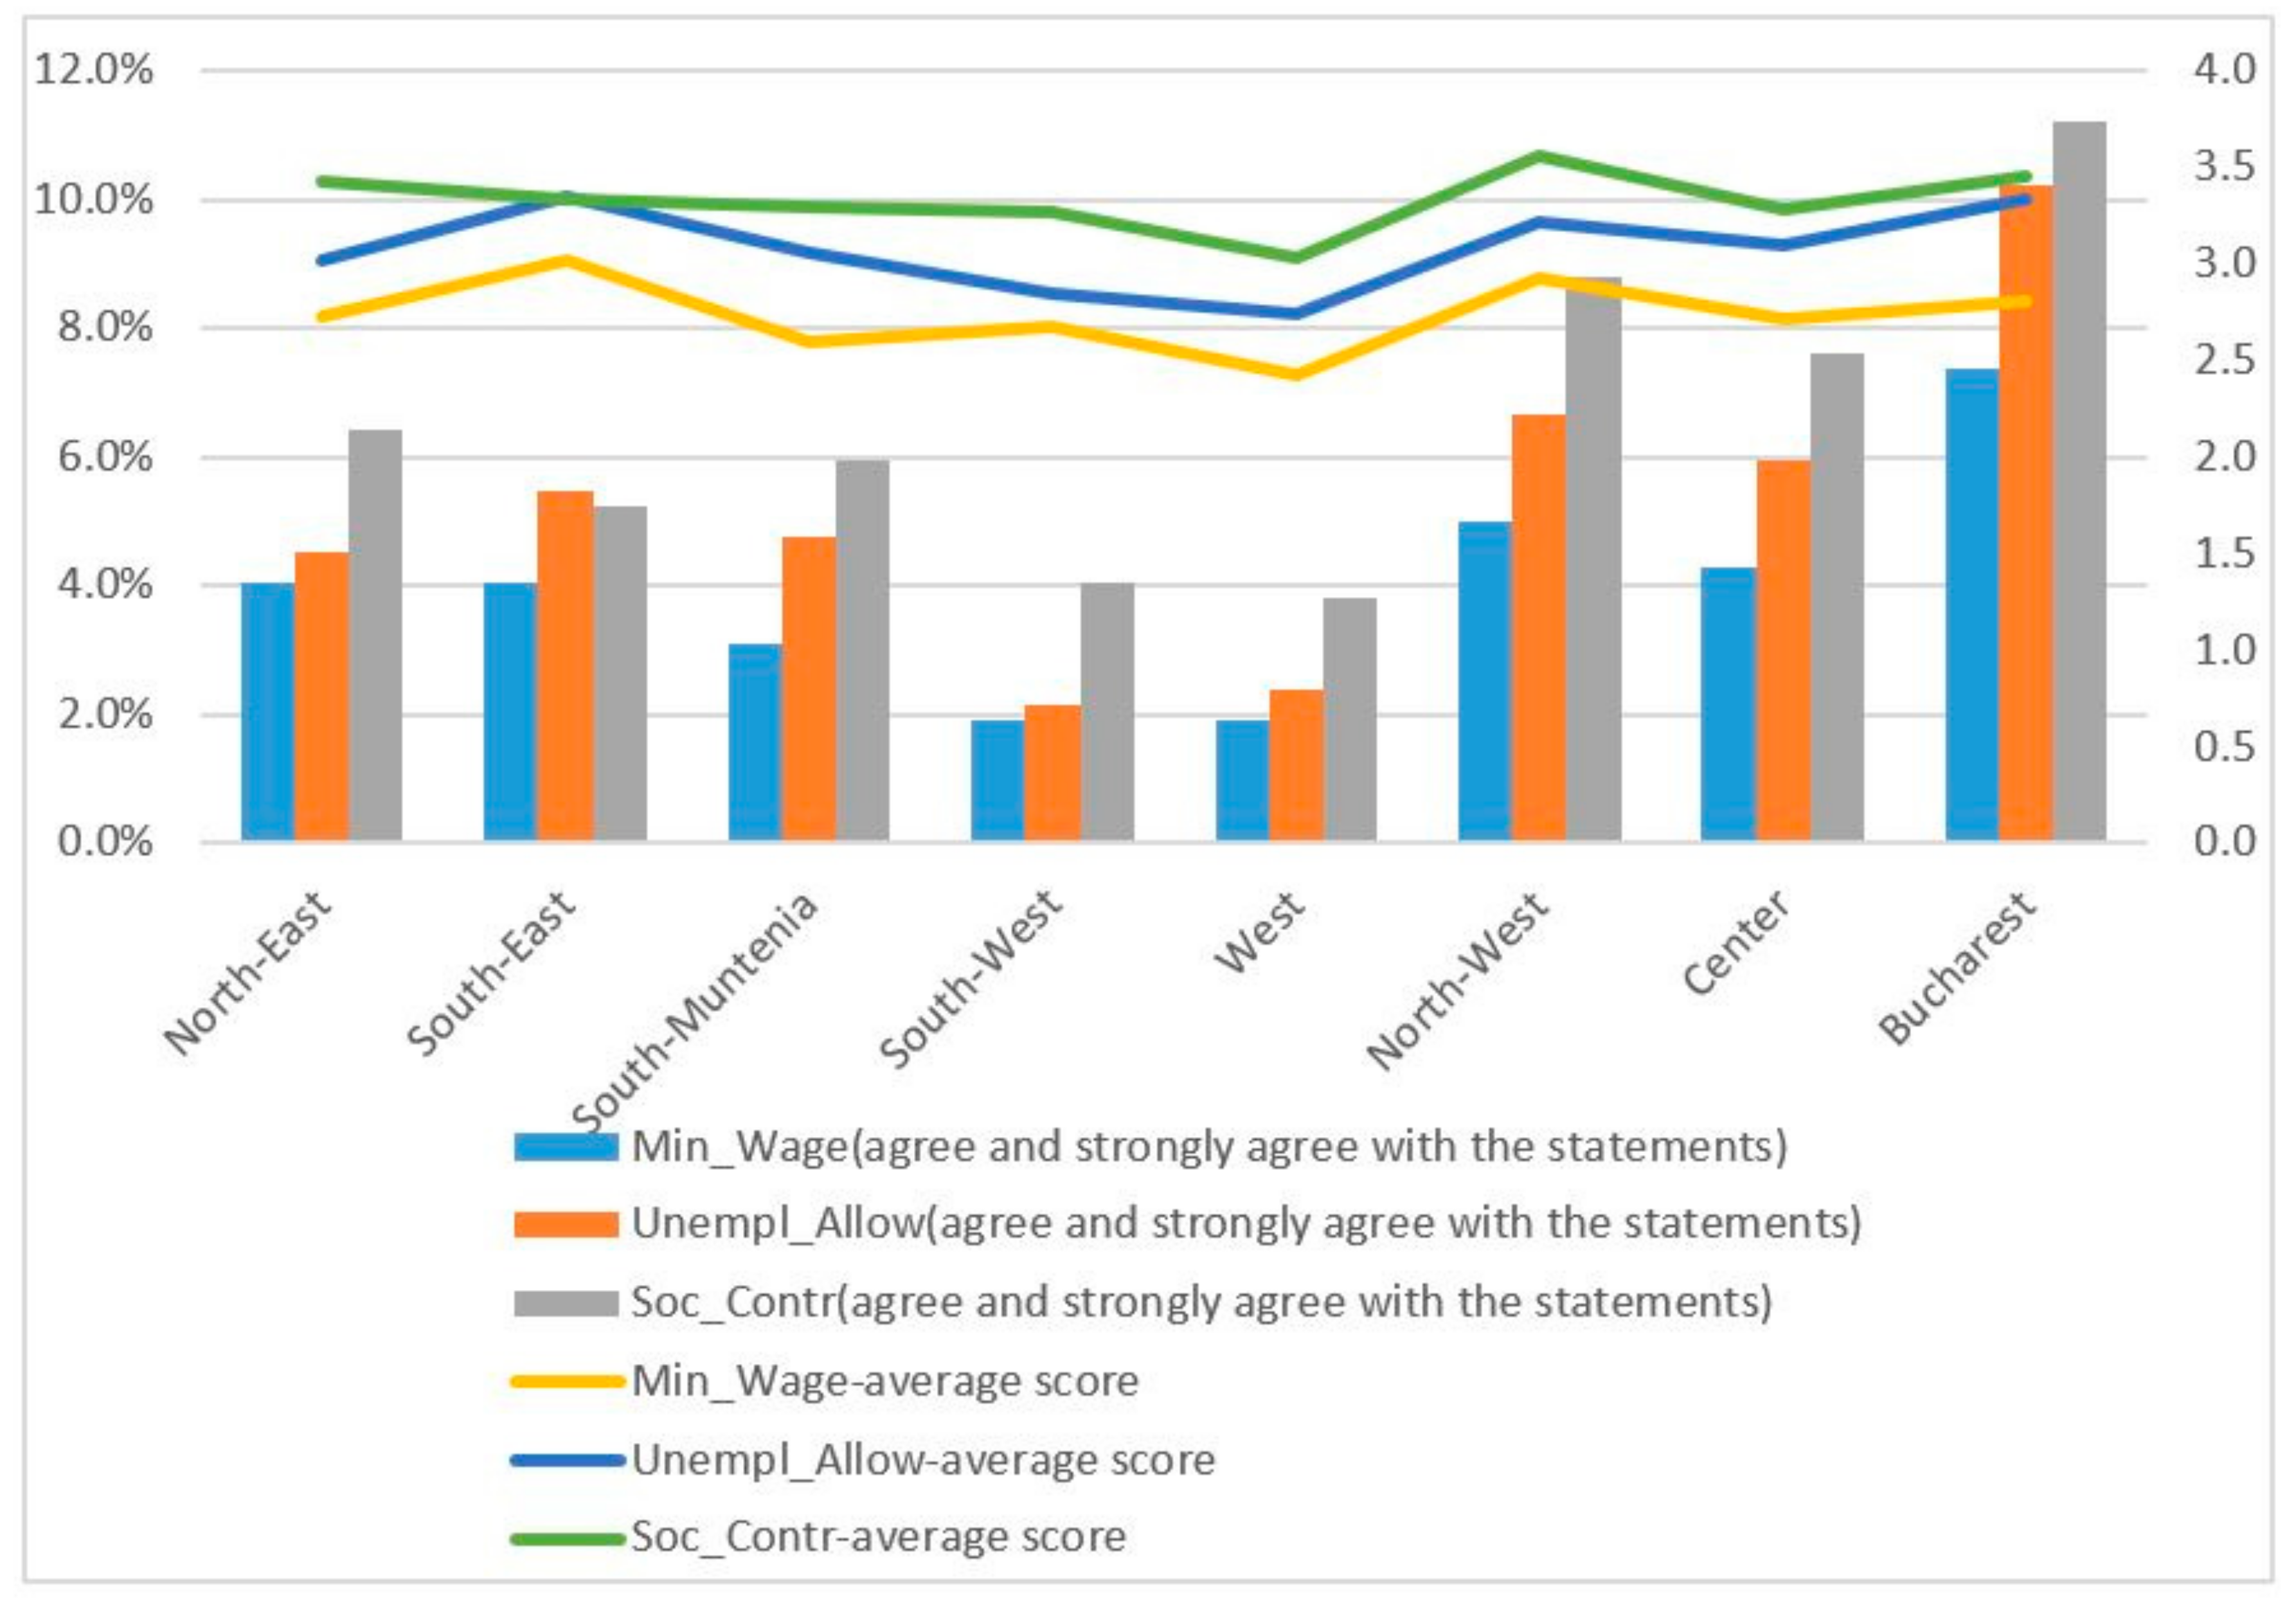
5.2.2. Highlighting the Opinions of Romanian Entrepreneurs Regarding the Romanian Shadow Economic Activity

Analyzing the responses offered by the Romanian entrepreneurs, an overwhelming proportion perceived tax avoidance and bribery (about 61.4%), with 63.4% of entrepreneurs declaring that they highly tolerated this kind of behavior, revealing also a very low level of tax morality. Therefore, all of these facts will lead to a higher level of shadow activity (Figure 6).
The trust in public officials and satisfaction regarding tax policies and business legislation are related to a lower level of the shadow economy. The major reasons for dissatisfaction among Romanian entrepreneurs concerns the quality of business legislation, the government’s tax policy, and government support for entrepreneurs, while the National Agency for Fiscal Administration (NAFA) is associated with a higher level of satisfaction.
Therefore, more than one quarter of the interviewed Romanian entrepreneurs declared that they were satisfied with the activity of the National Agency for Fiscal Administration with regard to tax administration, while fewer of them (7.4%) declared to be satisfied with the quality of business legislation (Figure 7).
Analyzing the responses of Romanian entrepreneurs, it can be highlighted that membership to the local community and the personal contribution to the economy’s growth are quite important for a high proportion of them (almost 74%) (Figure 8).
If the potential barriers of the business environment are taken into account, most of the entrepreneurs (53.1%) considered high social contributions to be the main driver that determines whether companies to hire workers without legal forms. On the opposite side, companies do not consider that the influence of the minimum wage could determine a significant flow in the shadow activity (Figure 9).
Entrepreneurs were asked also to evaluate potential obstacles for their companies, and pointed out corruption, the anti-competitive practices of other competitors, political instability, tax rates, and uncertainty about regulation policies as major obstacles that were encountered by the companies. On the opposite side, increases in the minimum wage, trade and custom regulation, and tax administration were considered to be the smallest obstacles in developing a business in Romania (Figure 10).
Taking into account the regional disparities, the analysis of Romanian entrepreneurs’ perceptions regarding the potential determinants of the shadow economic activity by regions are presented in detail in Appendix C, and offer valuable information confirming the results at the national level.
Summarizing the main results regarding the perceptions of Romanian entrepreneurs, we can mention the following:
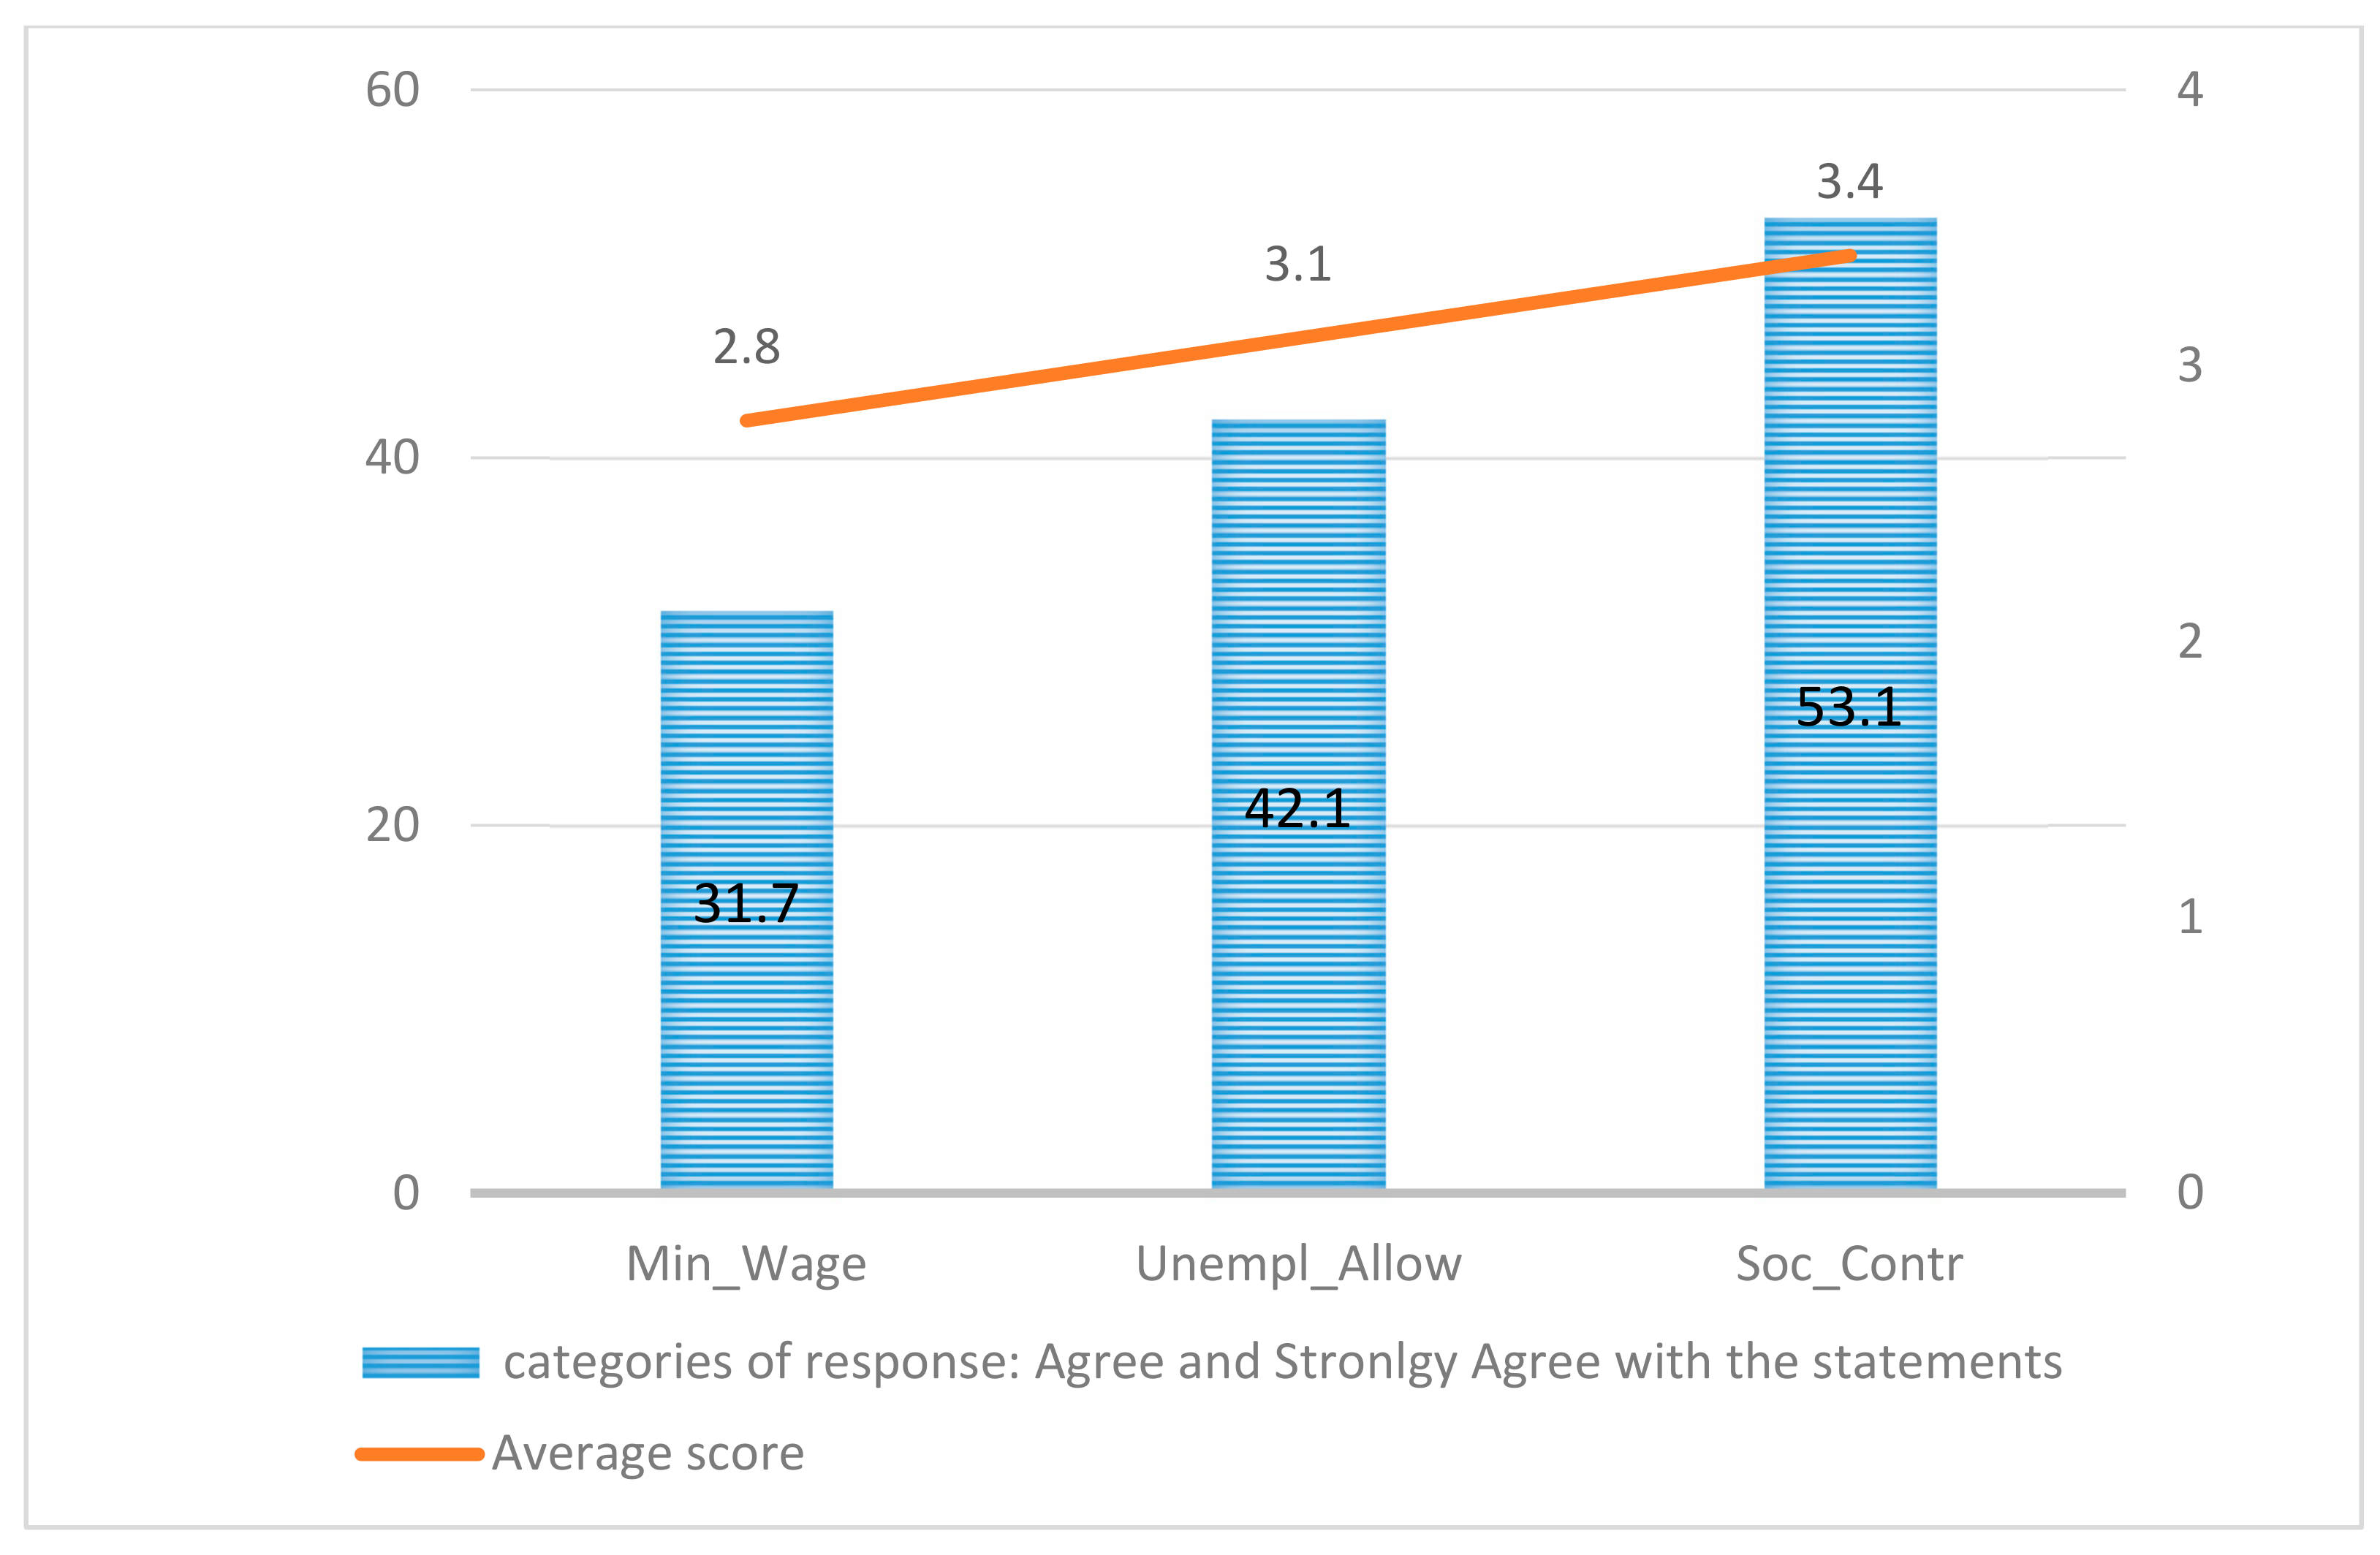
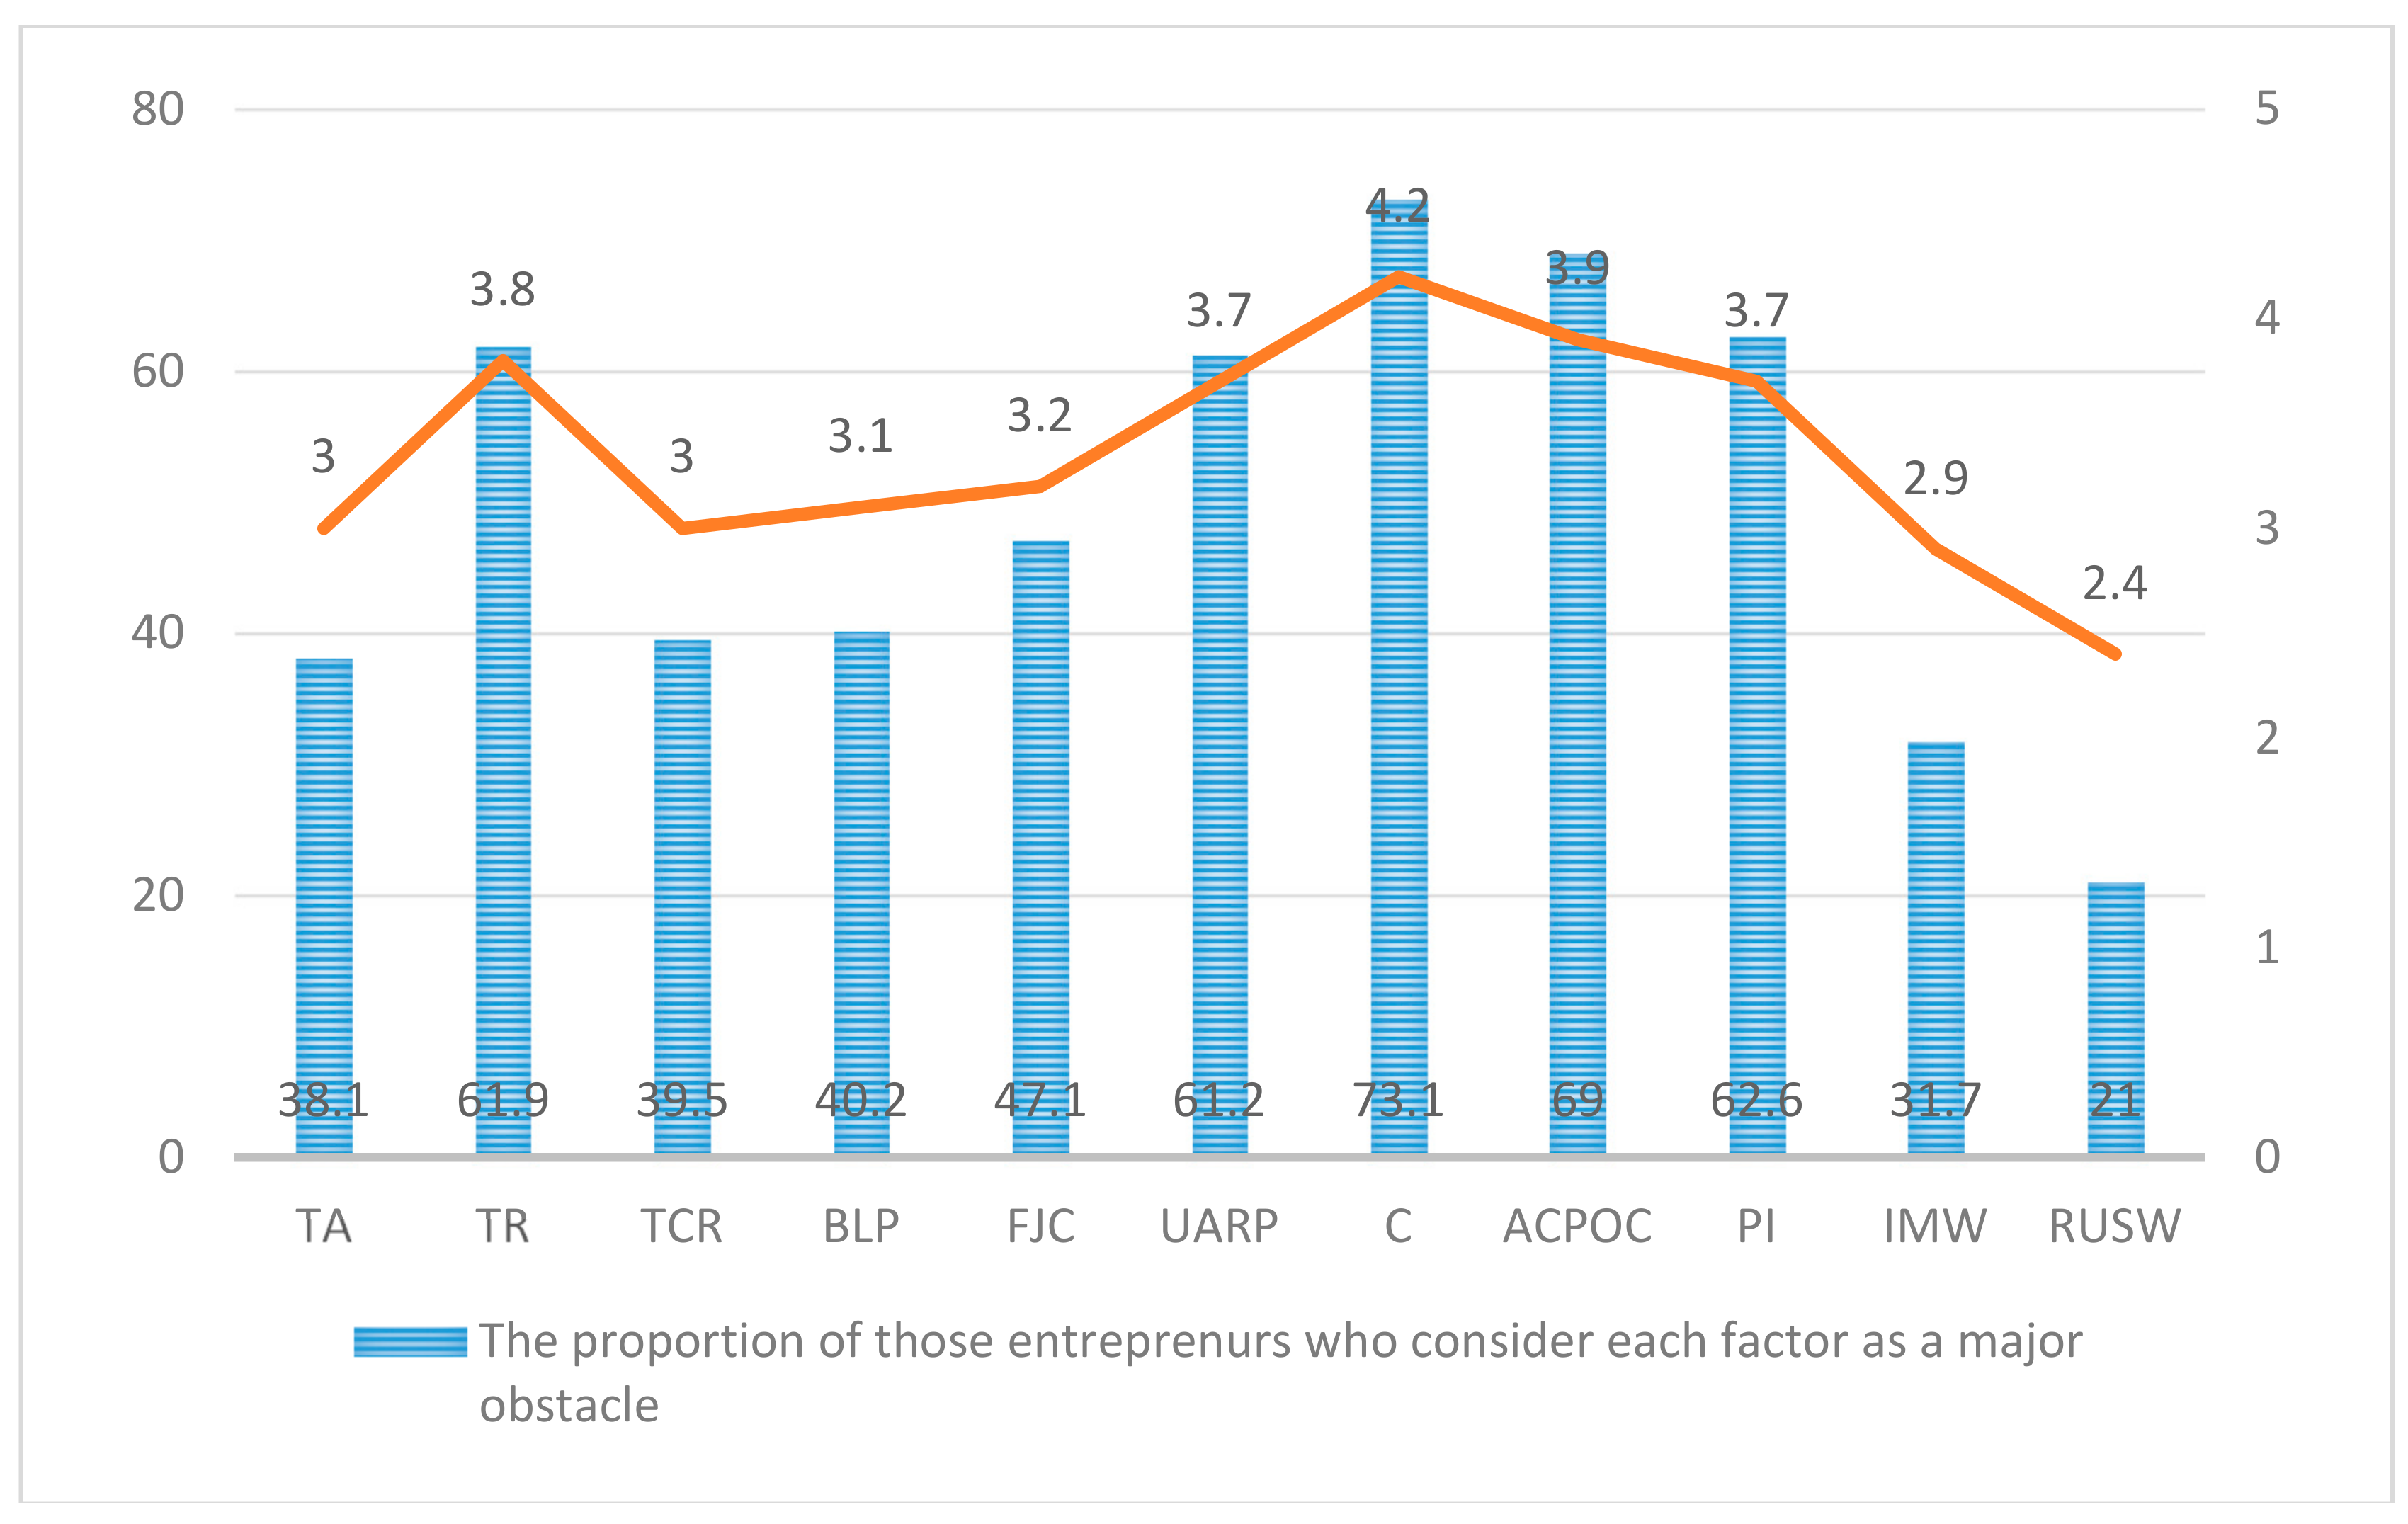
  • There is a high level of tolerance for bribery and tax avoidance, which is a common behavior among Romanian mangers.
  • The lack of trust in public officials was associated with a high level of dissatisfaction regarding tax policies and business legislation, which is related to a higher level of shadow economy.
  • A poor quality of business legislation, the government’s tax policy, and little government support for entrepreneurs led to an increase in shadow economic activity.
  • High social contributions determined whether companies hired workers without legal forms.
  • A relatively high level of corruption, anti-competitive practices of other competitors, political instability, high tax rates, and a certain uncertainty about regulation policies also led to an increase in the unofficial sector.

5.2.3. Identifying the Main Determinants of the Romanian Shadow Economy Using the MIMIC Model

The opinions of the Romanian entrepreneurs have been incorporated into the MIMIC models. In order to obtain the optimal model, several specifications of the MIMIC model were estimated (Table 2). The estimation process started from a more general model specifications, a 9-1-3 MIMIC model that incorporated fiscal regime components, unemployment, self-employment, government employment, part-time employment, and by turn regulatory quality and government effectiveness, and in which the size of the shadow economy was reflected in the currency ratio and the labor force participation rate.
Furthermore, we continued testing different specifications of the MIMIC model, eliminating from the model the variable that suffers the most from the lack of statistical significance.
Analyzing the empirical results it can be highlighted that the unemployment rate, self-employment rate, part-time employment, regulatory quality, and government effectiveness exhibited a significant impact in almost all of the models.
It is worth to mention that the fiscal variables quantified by the tax burden and also its components—indirect taxes, direct taxes and social contributions—do not have any impact on the dynamics of the shadow economy.
The unemployment rate and self-employment rate manifested a strong statistically impact in all of the models, which was expected.
Government consumption and the government employment do not have a statistically significant impact on the magnitude of the shadow economy.
Regarding alternative governance measures, the empirical results revealed a significant negative impact of regulatory quality and government effectiveness on the size of the shadow economy, highlighting that a better ability of government to promote efficient policies and regulations, a better quality of public services, and a higher credibility of the government’s commitment to such policies will certainly decrease the incidence of the shadow economy.
Concerning the indicators, the positive sign regarding the labor force participation rate revealed that workers from the unofficial sector also worked in the official economy, while a high incidence of shadow economic activity was reflected by the increased use of currency, which is the most usual instrument used in shadow transactions because it does not leave any traces.
Summarizing, we can conclude the following about the indicators:
Hypothesis 1 was supported by the positive sign of causal variables (especially the fiscal regime and its components) in accordance with the economic theory and the empirical results in the field. Therefore, both the official and unofficial economies were substitutes; a decrease in the official economy was associated with an increase in the informal economy. From the perspective of the negative impact on the official economy, the informal economy is causing unfair competition for companies in the official sector. Companies that work in the hidden economy do not pay taxes, have no legal regulations to respect, and can juggle with prices to increase their profit. As a consequence, tax revenues will drop, as will the quality of basic public goods and services. If the government could find a way to lower the magnitude of the shadow economy and impose a tax morality in which each individual becomes aware of the contribution of his work to public money, then this tax morality would translate into an increase in value of taxes that could be found in a better infrastructure and high-quality public services and goods, which will ultimately lead to an increase in economic growth and in living standards.
Hypothesis 2 was supported by the positive and statistically significant coefficient of the currency ratio, confirming again that most informal transactions are made by cash, and an increase of the shadow economy will be reflected by a cash increase.
Hypothesis 3 was supported by the positive and statistically significant coefficient of the labor force participation rate, confirming that workers from the unofficial sector also work in the official economy.
Regarding the main hypotheses concerning the causes of the shadow economy, we can conclude that:
Hypotheses 1–3 were not supported by the empirical results of the study, due to the lack of significance of the coefficients (both tax burden and its components), even if the sign was positive, confirming that tax burden and its components—indirect taxes, direct taxes, and social contributions—do not manifest any impact on the dynamics of the shadow economy.
Hypothesis 4 was not supported, given the lack of significance of the government employment coefficient, and there not being enough evidence to state that excessive regulation encourages companies to manage their activities in the informal sector.
Hypothesis 5 has been confirmed by the strong evidence of unemployment; the positive sign revealing that it is likely that officially unemployed persons are somehow forced by the low amount of the unemployment benefit to work at least partially in the unofficial economy in order to augment their revenues.
Hypothesis 6 was also highly supported by the positive and statistically significant impact of self-employment on the size of the shadow activity, confirming that these individuals have more possibilities to evade taxes.
Hypothesis 7 has been confirmed due to the lack of statistical significance for the government consumption coefficient, pointing out that the low quality of public sector services does not constitute an incentive to go into the unofficial sector.
Hypothesis 8 was supported by the positive and statistically significant sign of part-time employment, proving that some of the workers who have official jobs also simultaneously work in the unofficial sector to increase their earnings.
Hypothesis 9 has been also highly supported by the negative sign of regulatory quality revealing that the trust of individuals in the public authorities and the credibility of the government’s commitment are fundamental for the reduction of shadow economic activity.
In the process of selecting the optimal model, we followed the criteria mentioned above, giving a high importance to the statistical significance of the variables included in the model, to the results of chi-square test, the RMSEA value, SRMR, CFI, and TLI fit indices, the value of the coefficient of determination (CD), the AIC value, and the SBC value. Based on all of these, we identified two potential optimal 4-1-3 MIMIC models. The first one revealed the significance of several variables that were correlated with the shadow economy in Romania: unemployment rate, self-employment rate, part-time employment, and regulatory quality. The second one revealed the significance of several other variables that were correlated with the shadow economy in Romania: the unemployment rate, the self-employment rate, part-time employment, and government effectiveness.
On the basis of the SRMR, CFI, TLI, CD, and the AIC and SBC values, the best model was identified as the 4-1-3b MIMIC model, with the main drivers of SE being the unemployment rate, the self-employment rate, part-time employment, and government effectiveness; the shadow economy was reflected in the rise of currency ratio and the labor force participation rate. One potential explanation for the positive impact of unemployment could be that it acts as a safety valve for the official sector, with the shadow economy offering to “official” unemployed individuals the chance to supplement their revenues, confirming the Dell’Anno, Gomez-Antonio, and Pardo [67] flow theory between both sectors.
The influence of the self-employment rate, which was significant in all of the models, revealed the impact of self-employment on SE, because these workers have more possibilities to evade.
Part-time employment could be considered a determinant of SE, since for some workers, it could be more attractive to have part-time contracts or no contract at all. Also, those who are already working on the official labor market can decide to work in the informal sector to supplement their revenues.
The government effectiveness had the expected negative impact on the decision to work in the unofficial sector. The quality of public services of policy formulation and implementation together with an increase level of trust in government’s commitment weighed heavily in making this decision and also contributed to the reduction of such phenomenon.
Friedman et al. [88] stated that corruption is associated with more uncovered activities, highlighting that the main motivation for entrepreneurs to go into the informal sector is based more on reducing the burden of bureaucracy and corruption than avoiding the taxes.
According to Razmi, Falahi, and Montazeri [89], the decision of entering into the informal sector is dramatically influenced by the low level of institutional credibility, the major lack of transparency, the high level of perceived corruption and bribery, and a weak rule of law. If people feel that governments are unable to formulate viable policies, and that their taxes are not efficiently allocated and spent, they suffer due to the rule of law, and they will have sufficient incentives to take into consideration the possibility of entering into the shadow economic activity.
Analyzing the standardized coefficients of the optimal model (4-1-3b MIMIC) in order to quantify the influence of each cause, it was revealed that self-employment can be considered the main determinant having the biggest influence on shadow activities (0.78) followed by unemployment (0.63), part-time employment (0.47), and government effectiveness (−0.19).
The main explanation for the highly significant impact of self-employment and unemployment on the magnitude of shadow economic activities could be the notable number of deductions that the type of self-employed workers have, while in the case of the unemployed, we are talking about income deprivation, and these individuals make efforts to recover this deprivation from the activity in the unofficial sector.
Two of the main drivers identified at macro level—the trust in public institutions and part-time employment—have been also stipulated by the entrepreneurs as being potential causes of shadow activity.

5.2.4. Emphasizing the Main Implications of the Shadow Economy for Sustainable Development

Having extensive knowledge concerning the main drivers of the shadow economic activity in Romania will offer alternative paths that, taking into account the presence of the unofficial sector, which has not yet been considered so far in research, will contribute toward the achievement of the Sustainable Development Goals.
Therefore, knowing more about this phenomenon proved to be a useful tool for simultaneously addressing two issues: tackling and controlling shadow economic activities and also contributing to the achievement of sustainable development. In such a way, policymakers can have a useful instrument to tackle a double target: shadow economy and sustainability.
Analyzing the question of the paper, “Could the shadow economy be a path to provide the sustainable development goals?”, it is worth mentioning that the empirical results of our research fully support this statement.
The empirical results lead us to the main conclusion that aggregates as the unemployment rate, the employment rate with its components (self-employment or part-time employment), real growth, or government efficiency definitively can contribute to sustainable development if they are properly monitored and analyzed, because they are also key indicators in the United Nations (UN) Agenda for Sustainable Development. Thus, the first three indicators—the unemployment rate, the employment rate with its components (self-employment or part-time employment), and the real growth—are mentioned as key indicators within Goal 8 (SDG8): Decent work and economic growth. Meanwhile the last one—government efficiency—is part of the key indicators of Goal 16: Peace, justice, and strong institutions.
Therefore, they have a double role and relevance contributing actively to the knowledge of two major phenomena—the shadow economy on one hand, and sustainable development on the other.
The diminishing size of the unofficial sector can lead to sustainable development growth, helping in particular the achieving of target 8.1 of SDG8, having as our aim an annual per capita economic growth of at least 7% in the least developed countries through 2030.
This could be possible through the negative relationship between sectors, according to which both economies are substitutes. Therefore, in recession periods, in which the official economy decreases, the unofficial economy tends to grow, since it is considered a safety valve mainly for vulnerable groups. In the economic boom periods, the size of the unofficial sector tends to decrease, since people aimed to come back in the formal sector. Thus, the focus needs to be on enhancing the attractiveness of the official economy and producing a disincentive for going in the unofficial sector.
Another important contribution toward the achievement of the 8.3 target of SDG8 aiming to support job creation is related to a decreasing proportion of informal employment, capturing all of the jobs in unregistered enterprises.
The unofficial sector, through its labor market determinants, can have an important influence in the achievement of target 8.5 of SDG8: achieving efficient employment and decent work for all, through the important roles of the unemployment, self-employment, and part-time employment rates.
If in the case of the unemployment rate, the positive relationship with shadow activity can be explained by an income deprivation, usually through individuals making efforts to recover this deprivation from the activity in the unofficial sector. The impact of self-employment can be due to the notable number of deductions that type of workers have. For part-time employees, it could be efficient to work simultaneously in both sectors in order to increase their revenues. “Envelope wages” is considered to be the most usual form of underreporting activity in Romania; employers opt for the payment of an official wage (often at the level of minimum wage) and give the rest as envelope payments, mainly to avoid social insurance contribution payments.
Therefore, diminishing the size of the unofficial sector, by reducing the level of unemployment and increasing the amount of allowance, by decreasing the number of deductions for self-employed workers, and by promoting the official full-time employment, can significantly contribute to the achievement of SDG 8: Decent work and economic growth.
Another relevant finding of our research emphasized the important contribution of the major lack of institutional confidence and the high perceived level of corruption as important determinants for entering into the unofficial sector.
Therefore, the substantial reduction of corruption and bribery together with the development of strong and transparent institutions can make an important contribution toward the achievement of SDG16: Peace, justice, and strong institutions, through the fulfillment of targets 16.5 and 16.6.
Based on the value of the Corruption Perception Index released by the Transparency International Organization [90], which is considered the most widely used indicator of corruption worldwide, Romania registered the value of 48 for 2017, with scores being on a scale of 0–100, where 0 indicated a highly corrupt country, and 100 indicated a clean country. On this scale, Romania is positioned less than halfway from a perfectly clean country.
According to the data provided by the WDI (World Development Indicators-World Bank), the bribery incidence was 9.8% in 2013, meaning that 9.8% of Romanian companies experienced at least one bribe payment request in 2013.
The trust in public institutions and the level of satisfaction with public services are essential for the achievement of sustainable development and also for the decision of operating in the unofficial sector. The value of government effectiveness in 2016 (−0.17) is an important governance indicator capturing the government’s commitment and quality of public services, and revealed a rather low quality of public services.
If individuals perceive that the level of corruption and bribery have diminished, and their confidence level in the government efficiency to formulate viable policies and efficiently allocate their taxes considerably increased, then this can be translated into a lower probability to access the unofficial sector, contributing in such a way to the achievement of the Sustainable Development Goals.
In conclusion, the empirical results highly supported the four hypotheses of the paper, with the presence of the unofficial sector offering alternative solutions for increasing the progress toward the achievement of two Sustainable Development Goals, helping a country such as Romania increase its overall performance in achieving this desideratum.
Therefore, the main focus need to be on improving the quality of public institutions and the level of citizens’ trust in such institutions, as well as monitoring the level of unemployment, self-employment, or part-time employment in order to actively contribute to the achievement of sustainable future by the fulfillment of two main SDGs: Goal 8: Decent work and economic growth, and Goal 16: Peace, justice, and strong institutions.

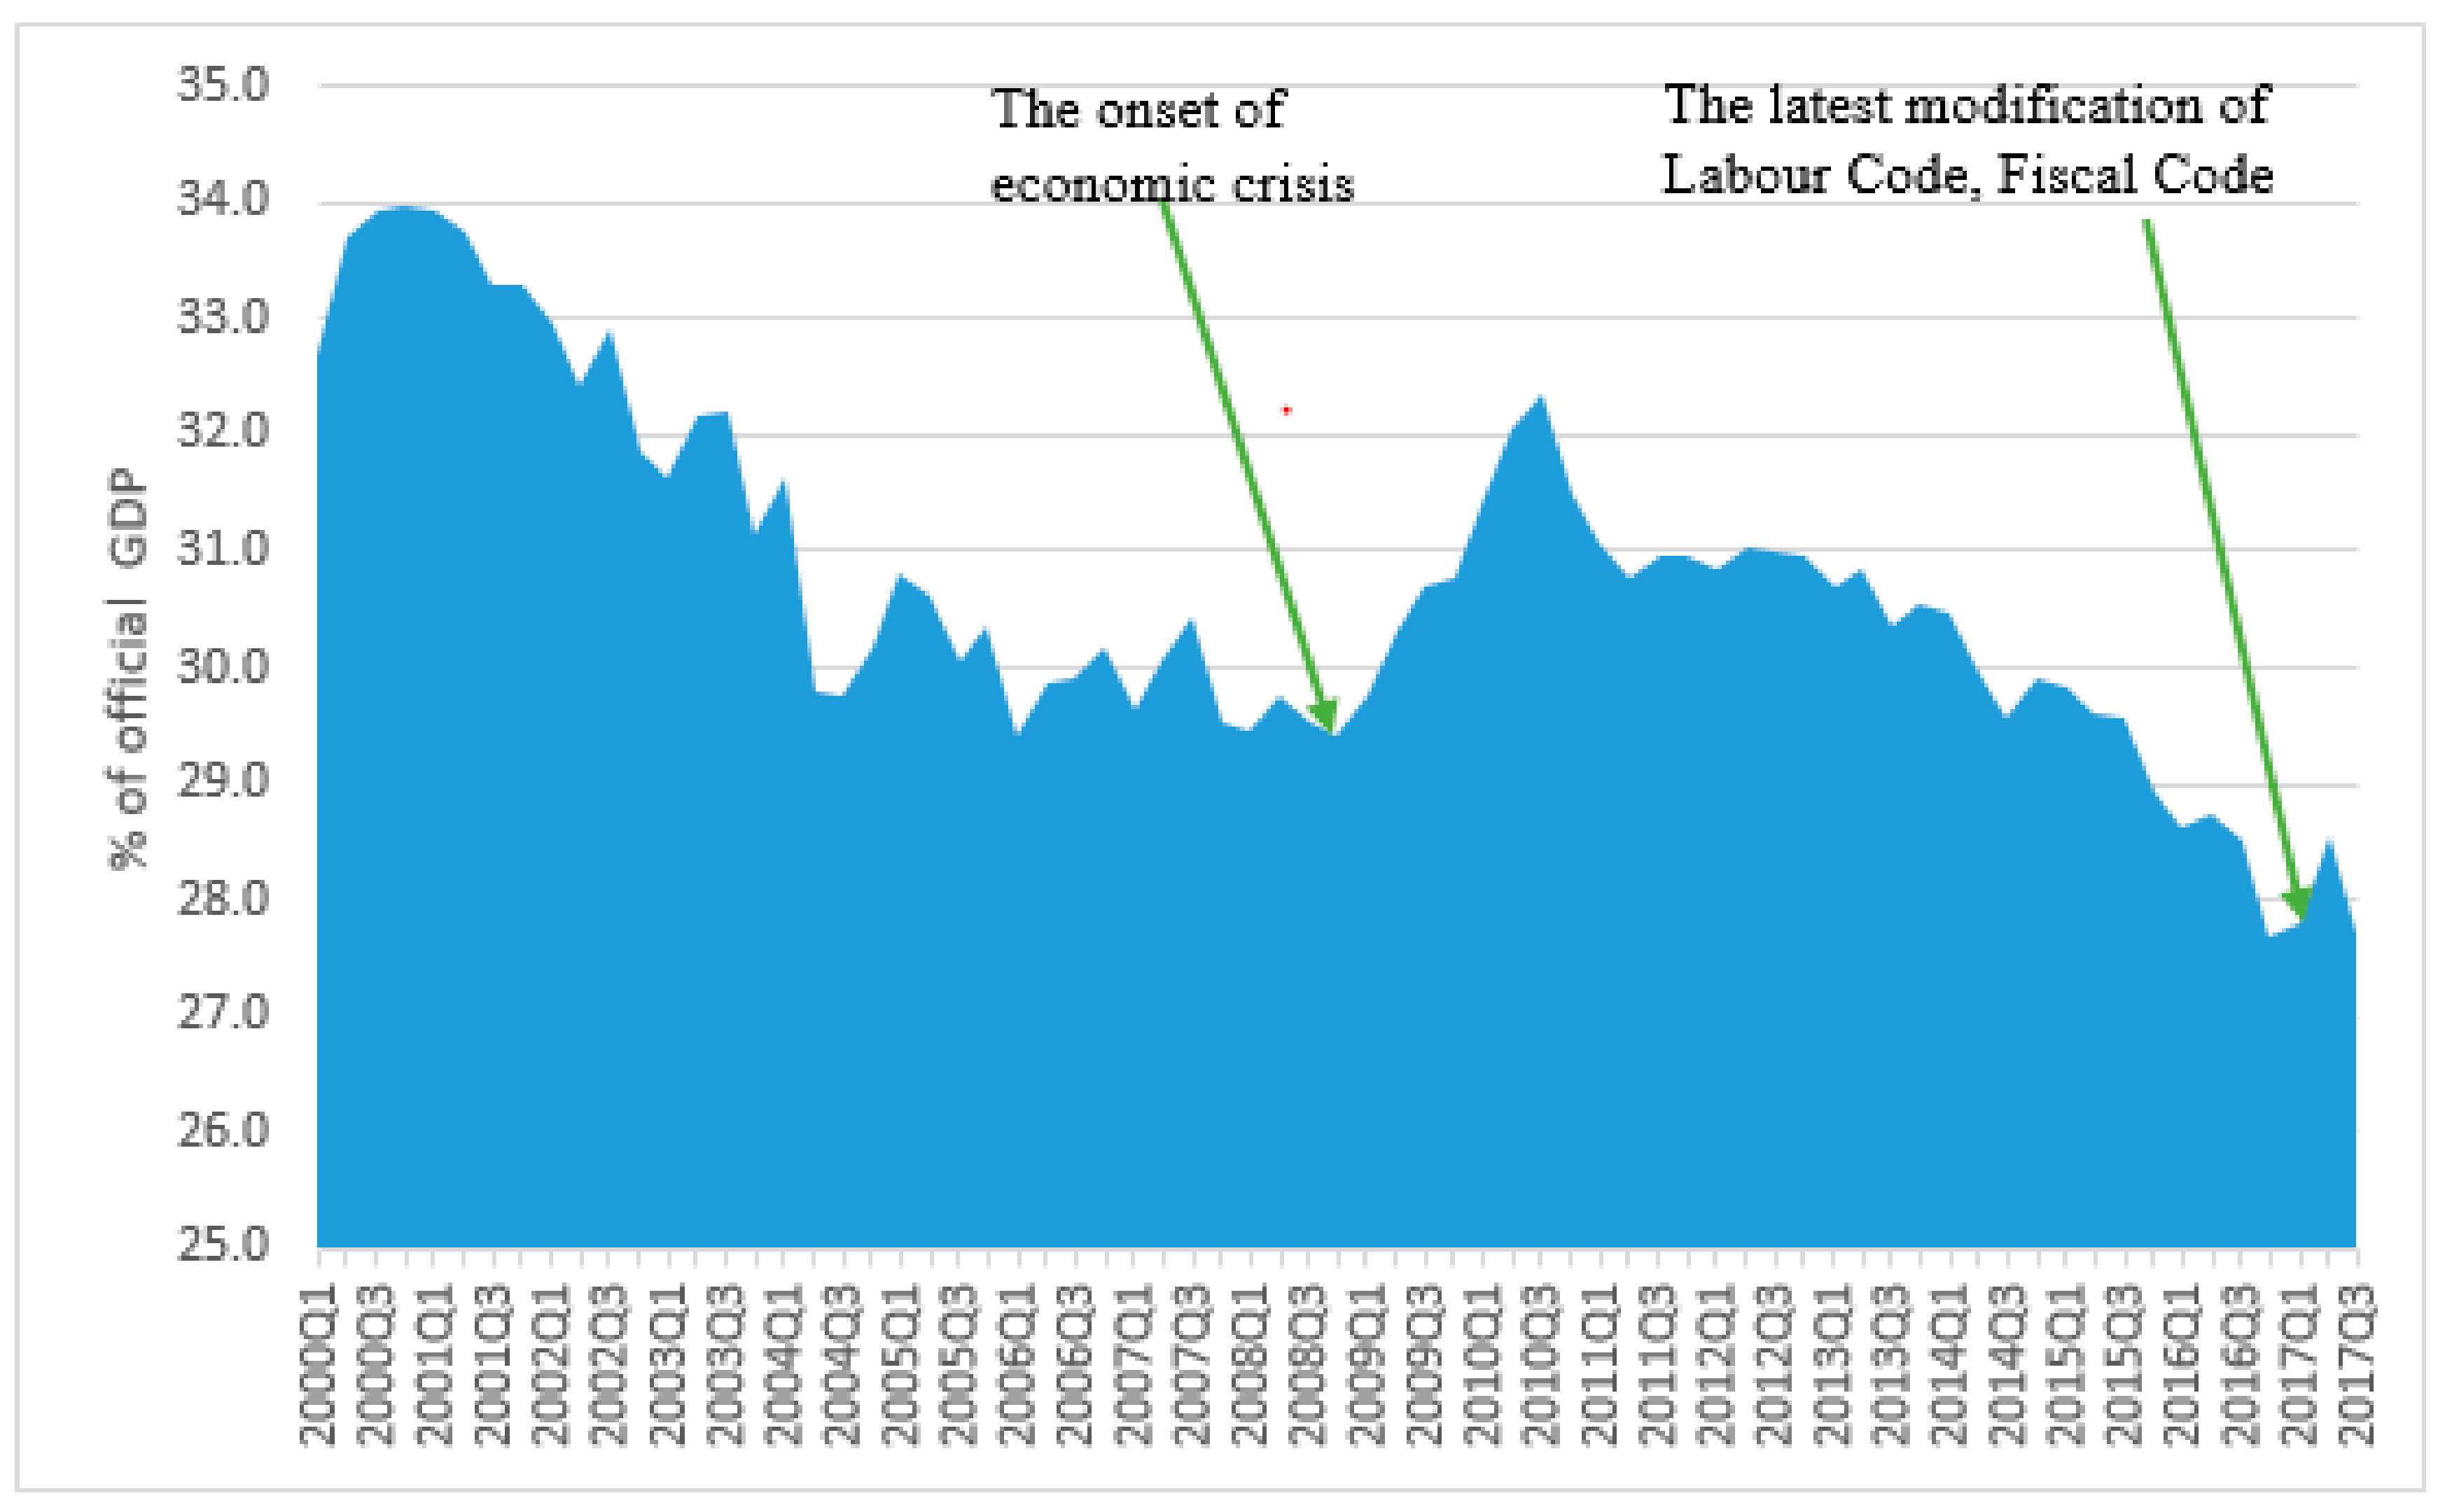
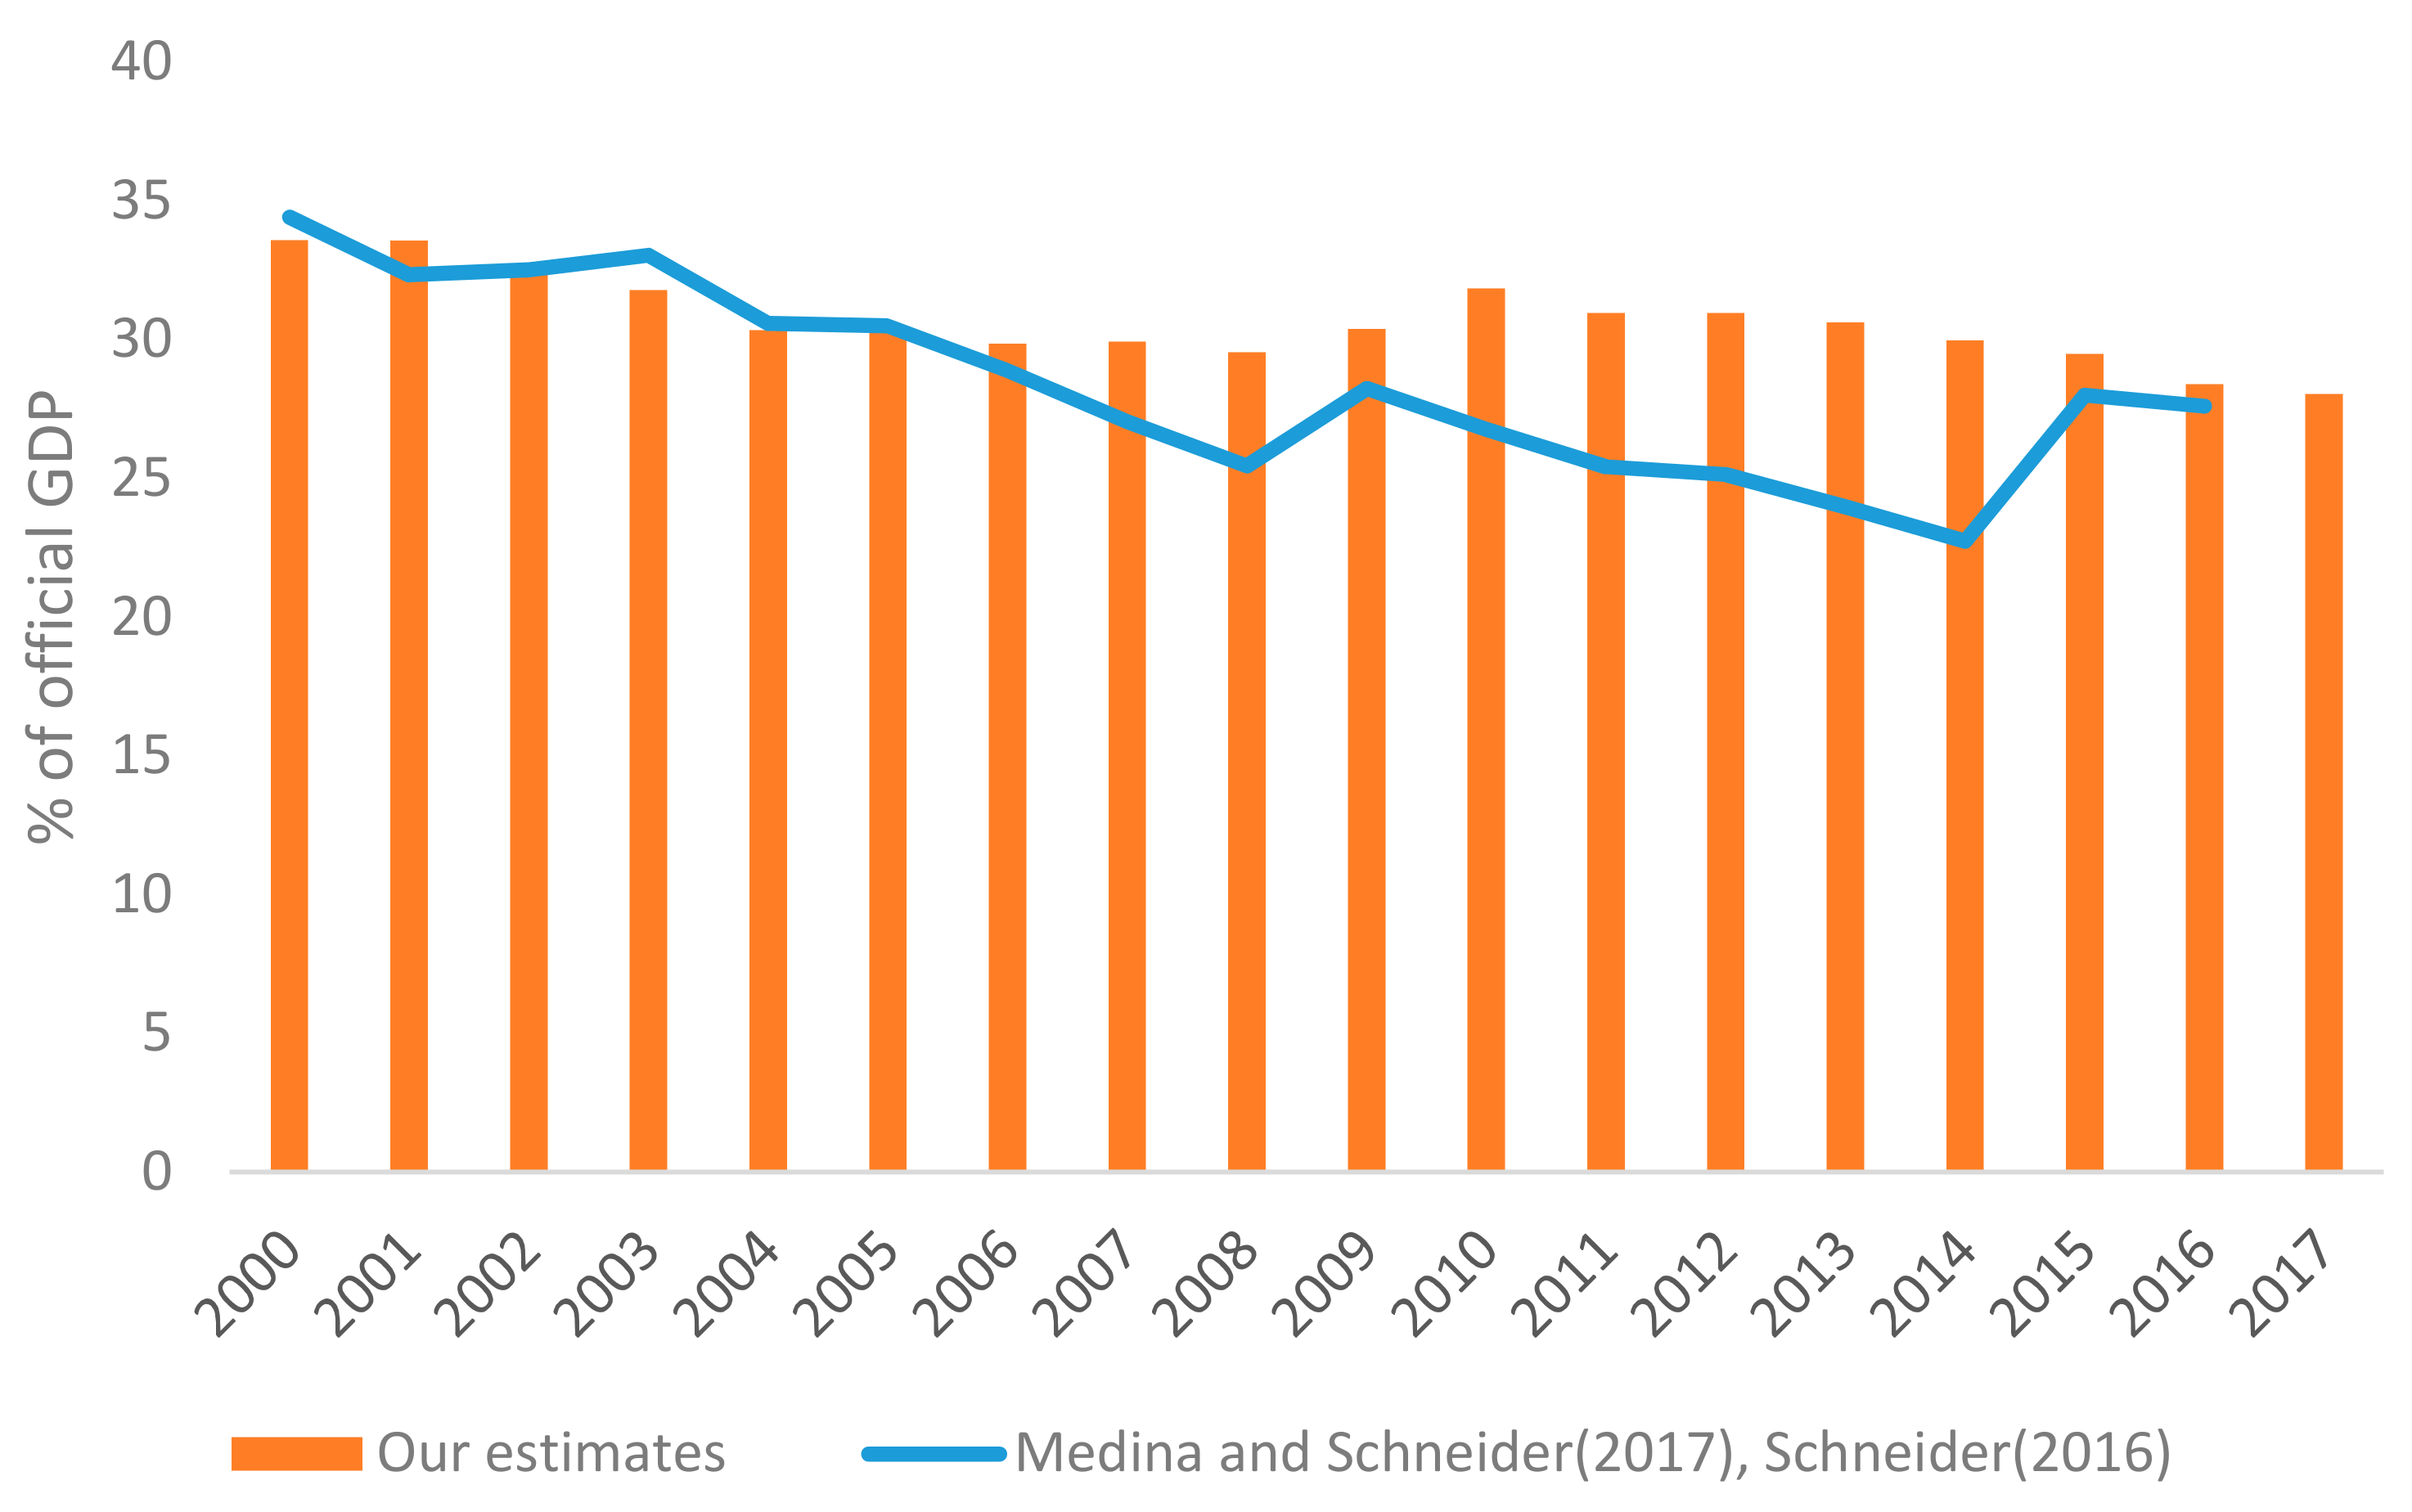
5.2.5. Computing the Size of the Romanian Shadow Economy

Using the coefficients of the 4-1-3b MIMIC model and applying the calibration procedure, the relative estimates produced by the MIMIC model have been transformed into real estimates using an exogenous value of SE for the reference year (2005). This value for the official GDP has been taken from Medina and Schneider [20]: 30.49%.
The ordinal time series index of the shadow economy is based on the structural model:
Δ η ˜ t G D P 2005 = 0.823 Δ S e l f _ e m p l t + 0.796 Δ U R t + 0.285 Δ P a r t _ t i m e _ e m p l t 2.187 Δ G o v _ e f f e c t t
In order to express the SE in terms of the ratio of the current GDP, the main steps of the calibration procedure are the following:
η ˜ t G D P 2005 η 2005 * η ˜ 2005 G D P 2005 G D P t = η ^ t G D P t
where:
  • η ˜ t G D P 2005 is the index of the SE computed by Equation (3).
  • η 2005 * G D P 2005 = 30.49 % is the exogenous estimate of the SE.
  • η ˜ 2005 G D P 2005 is the value of the index computed by Equation (4) in 2005.
  • G D P 2005 G D P t is a measure that is used to make the conversion from the base year to current GDP.
  • η ^ t G D P t is the estimated SE as a percentage of official GDP.
In the beginning of 2000, the size of the SE registered the value of 34% and followed a declining trend, attaining almost 29.4% by the end of 2008, which was considered the start of the economic crisis in Romania. As a consequence, the SE increased to almost 32.3% in 2010. Until the beginning of 2011, the size of the shadow economy decreased slowly, and was at 27.7% at the end of 2016.
From the beginning of 2017, due to the modifications brought to the Labour Code and Fiscal Code, and also due to the political instability and the increasing lack of trust in public officials under the perspective of a future “Tax Revolution” (implying the transfer of contributions from employer to the employee), it a reversal of the trend can be highlighted: the size of the shadow economy following an ascendant evolution, registering an increase with more than 1 ppt. in the second quarter of 2017 (28.6% of official GDP) (Figure 11).
From this point of view, it would be very useful to quantify the impact of all of these legislative changes that came into force at the beginning of 2018 on different forms of undeclared work, with some of them targeted at reducing such a phenomenon.
The empirical results that were obtained are in line with the most recent empirical studies in the field. Medina and Schneider [20] and Schneider [19] have offered the most recent estimates for shadow economies around the world in the last 20 years, highlighting a magnitude of the Romanian shadow economy of 34.4% in 2000, 26.8% in 2010, and 27.6% in 2016 (Figure 12).

6. Conclusions and Further Research

6.1. Main Conclusions and Suggestions for Future Work

In last decade, the literature on sustainable development has focused mainly on changes within the formal sector, even if the informal sector has continued to rise; the sustainable development has somehow neglected the potential contributions of the informal sector to sustainable futures.
Therefore, disregarding the informal economy and its implications for sustainable development may be omitting an important part of some developing nations’ economies.
In this context, the paper aimed to analyze the main causes of the Romanian shadow economy both at the micro and macro level, and assess how it can make a considerable impact on achieving a more sustainable future. The main purpose of the paper is to highlight the relevance of knowing the main causes of this phenomenon, emphasizing that keeping the incidence of the shadow economy and its causes under control could offer an alternative in the process of achieving sustainable development.
In achieving the established goals, an improved version of the MIMIC model has been applied that takes the perspective of the Romanian entrepreneurs into account.
So, it becomes increasingly clear that the objective is sustainable development; this needs to be rooted in a sound understanding of the shadow economy.
From the perspective of Romanian entrepreneurs, the lack of trust in public officials, and the poor quality of business legislation, the government’s tax policy, and government support for entrepreneurs, accompanied by relatively high social contributions, corruption, political instability, high tax rates, and an uncertainty about regulation policies, have all increased shadow economic activity.
Incorporating all of these potential drivers of the shadow economy along with the other variables that have been specified in the literature as potential causes of the shadow economy in the MIMIC model, and using quarterly data covering the period 2000–2017, the empirical results revealed the self-employment rate, the unemployment rate, the part-time employment rate, and government effectiveness as the main causes for the Romanian SE.
The results have been also confirmed by the opinions of entrepreneurs who pointed out the lack of trust in public institutions and officials, and part-time employment.
Having information about the main drivers of the shadow economic activity clearly offers valuable references about the implications of the unofficial sector of a former transition country, with all of its specificities on achieving the objectives of sustainable development, namely Goal 8: Decent work and economic growth, and Goal 16: Peace, justice, and strong institutions.
If the policy makers will focus on improving the quality of public institutions and the trust of citizens in such institutions, while also keeping the level of unemployment, self-employment, and part-time employment under control, the magnitude of such a phenomenon can be diminished, and simultaneously, all of these will contribute to the achievement of sustainable development desideratum.
An important field of further research will be the impact of transferring contributions from the employer to the employee on the size of the shadow economy activity and how this fiscal modification could affect the sustainable futures.
The New Tax revolution that started at the beginning of 2018 confirms the intentions of the government to pass the burden of social contributions exclusively to employees, reduce the Pillar II contribution of pensions, and reduce the income tax from 16% to 10%. The transfer of contributions will increase bureaucracy by concluding additional acts on all of the individual labor contracts. All of these most likely will lead to an increase in the shadow economic activity.

6.2. Policy Implications

The shadow economy can provide essential elements in the fight toward sustainability. For fulfilling the sustainable development goals of decent work and economic growth as well as justice and strong institutions, policymakers need to focus on reducing unemployment, promoting appropriate policies that support productive activities, decent job creation, and entrepreneurship; achieving efficient employment; substantially reducing bribery, corruption, tax avoidance, and informal employment; as well as enhancing the trust of citizens in the public institutions.
In this context, it is important to consolidate the attractiveness of the formal economy for employers and employees by reducing costs for formal business, increasing penalties, and also increasing the likelihood of identifying informal activities and encouraging employers and employees to practice formal activity.
Among the main measures pointed out for reducing the incidence of undeclared work, there can be mentioned:
(1)
Reducing the administrative burden of businesses. This involves simplifying the procedures for obtaining licenses and authorizations by accelerating the release of documents required for entrepreneurship, reducing bureaucratic barriers for such documents, and increasing the transparency of the whole process.
(2)
Increasing the amount of fines for companies that practice informal economic activity; specifically, penalties for the non-compliance with labor regulation.
(3)
Enforcement of institutions responsible for labor inspections and controls.
(4)
Increasing the number of information campaigns.
(5)
Introduction of more electronic instruments of contract registration.
(6)
Enforcement of penalties for situations where undeclared work is considered as ‘significant’.
(7)
Discouraging the use of cash by increasing the popularity of electronic payments. In the last period, the ratio of currency in circulation as a % of GDP was almost 60%, revealing a level that was six times higher than the level recorded by the countries of the Eurozone. In 2013 in Romania, a person makes on average 4.3 electronic payments (excluding card payments and including applications such as internet banking, home banking, mobile banking, electronic transactions made at ATMs) annually, which was about 18 times less than the European Union (EU) average and 11 times less than the average in the Central and East European countries, placing Romania in the last position of the ranking of EU countries. Also, a person makes on average 9.4 card payments annually, which is about 10 times less than the EU average and five times less than the average in the Central and East European countries, and was ahead of only two states, Greece and Bulgaria. The level of undeclared work in Romania, Bulgaria, and Greece seems to be related to the high proportion of cash payments.
(8)
Elaborating multiannual studies of the shadow economy by carrying out disaggregated analyses by sectors, or types of taxes, aiming at knowing more precisely where, through who, and how the existing fraud occurs.
(9)
Developing a functional collaboration between different public administrations: establishing an effective collaboration between the regional and local tax administrations, promoting co-responsibility and the consortium in the fight against tax fraud.
(10)
Creating a shared database: the different territorial administrations must share a tax database and the subsidies granted with information from the central, regional, and local spheres.
(11)
Improving the efficiency and the speed of the procedures: improve the actions and investigations of the administrations by means of the revision of the procedures and management methods to reduce the duration of the files and the litigation.
(12)
Carrying out a better monitoring of risk contributors: the creation of a file of insolvent fiscal debtors (with limitations on the right to obtain subsidies, create companies, occupy positions, and take on public works until they enter or guarantee the debts).
(13)
Carrying out fiscal reforms, creating a battery of fiscal measures that help prevent fraud and strengthen the fight against the underground economy.
(14)
Revising the taxation of small and medium-sized enterprises (SMEs) and the self-employed to adapt to the economic difficulties of a time of crisis. For this, it is recommended that employers and professionals pay under direct estimation as a general rule, and that the module system is only allowed to micro entrepreneurs who sell exclusively to the final consumer.
(15)
Establishing electronic transaction control systems.
(16)
Creating an awareness and training plan on the negative effects of the shadow economy.
According to the results of the Fiscal Council Report [91], the economic sectors with the largest size of the undeclared work are industry, construction, and trade, transport, and communications, as well as hotels and restaurants in which undeclared activities are paid with cash.
The studies of Blanco-Portela et al. [92], Lozano et al. [93], Nuñez-Cacho et al. [94], or Núñez-Cacho et al. [95] could offer some insights on new measures that can be adopted to combat the shadow economy.
Regarding the measures implemented by other states to encourage electronic payments and reduce the shadow economy, it is worth mentioning the following: limiting cash payments (also adopted by Romania), fostering the infrastructure development, and stimulating electronic payments and the fiscalization of transactions.
Knowing more about the incidence of shadow economy, its determinants, its, size and evolution over time, and the main characteristics and motivations of people who are working in such activities, will help governments in the process of the elaboration of specific policy measures that can contribute to controlling the incidence of such phenomenon, as well as providing an alternative path of development that is required for a sustainable future.

Author Contributions

In this article, all the authors were equally involved in the conceptualization phase, in choosing the research methodology, in data analysis, as well as in validation process of the results and in discussions. All the authors have equally participated to the manuscript preparation and have approved the submitted manuscript.

Funding

The survey data collection of this research was supported through the project PN 16440102 entitled “The impact of labour market institutions on informality. Micro and macro approaches”, National Institute for Labour and Social Protection.

Conflicts of Interest

The authors declare no conflict of interest. The funders had the role in the collection of survey data, but no role the design of the study; in the analyses, or interpretation of data; in the writing of the manuscript, and in the decision to publish the results.

Appendix A. The Description and Source of the Data

VariablesUnit RootDescriptionSources
Fiscal regimeI (1) Total fiscal revenues/GDP, %Quarterly Government Finance Statistics, Eurostat.
Direct taxes (X1)I (1) Current taxes on income, wealth/GDP, %Quarterly Government Finance Statistics, Eurostat.
Indirect taxes (X2)I (1)Taxes on production and imports/GDP, %Quarterly Government Finance Statistics, Eurostat.
Social contributions (X3)I (1) Net social contributions/GDP, %Quarterly Government Finance Statistics, Eurostat.
Unemployment rate (X4)I (1) ILO unemployment rate, %.Labour Force Survey, Eurostat.
Self-employment (X5)I (1)Self-employed persons/active pop, %Labour Force Survey, Eurostat.
Government consumption (X6)I (1) Final consumption expenditure of general government/GDP, %. Quarterly Government Finance Statistics of Eurostat.
Part-time employment as a percentage of the total employment (X7)I (1) Part-time employment rate, %Labour Force Survey, Eurostat
Government employment (X8)I (1) Government employment/active pop. %.Labour Force Survey, Eurostat.
Regulatory Quality (X9)I (1) The scores of this index lie between −2.5 and 2.5, with higher scores corresponding to better outcomes.Worldwide Governance Indicators, WB
Government Effectiveness (X9′) It ranges from approximately −2.5 (weak) to 2.5 (strong) governance performance.Worldwide Governance Indicators, WB
Index of real GDP (2005=100)I (1) Chain linked volumes, index 2005=100Quarterly National Accounts database of Eurostat.
C/M1I (1) C/M1, %. It corresponds to the currency outside the banks as a proportion of M1.Monthly Bulletins of National Bank of Romania
Labour force participation rateI (1)Labour force participation rate, %.Labour Force Survey, Eurostat.

Appendix B. The Empirical Results of Mardia Test

Sustainability 10 03518 i001

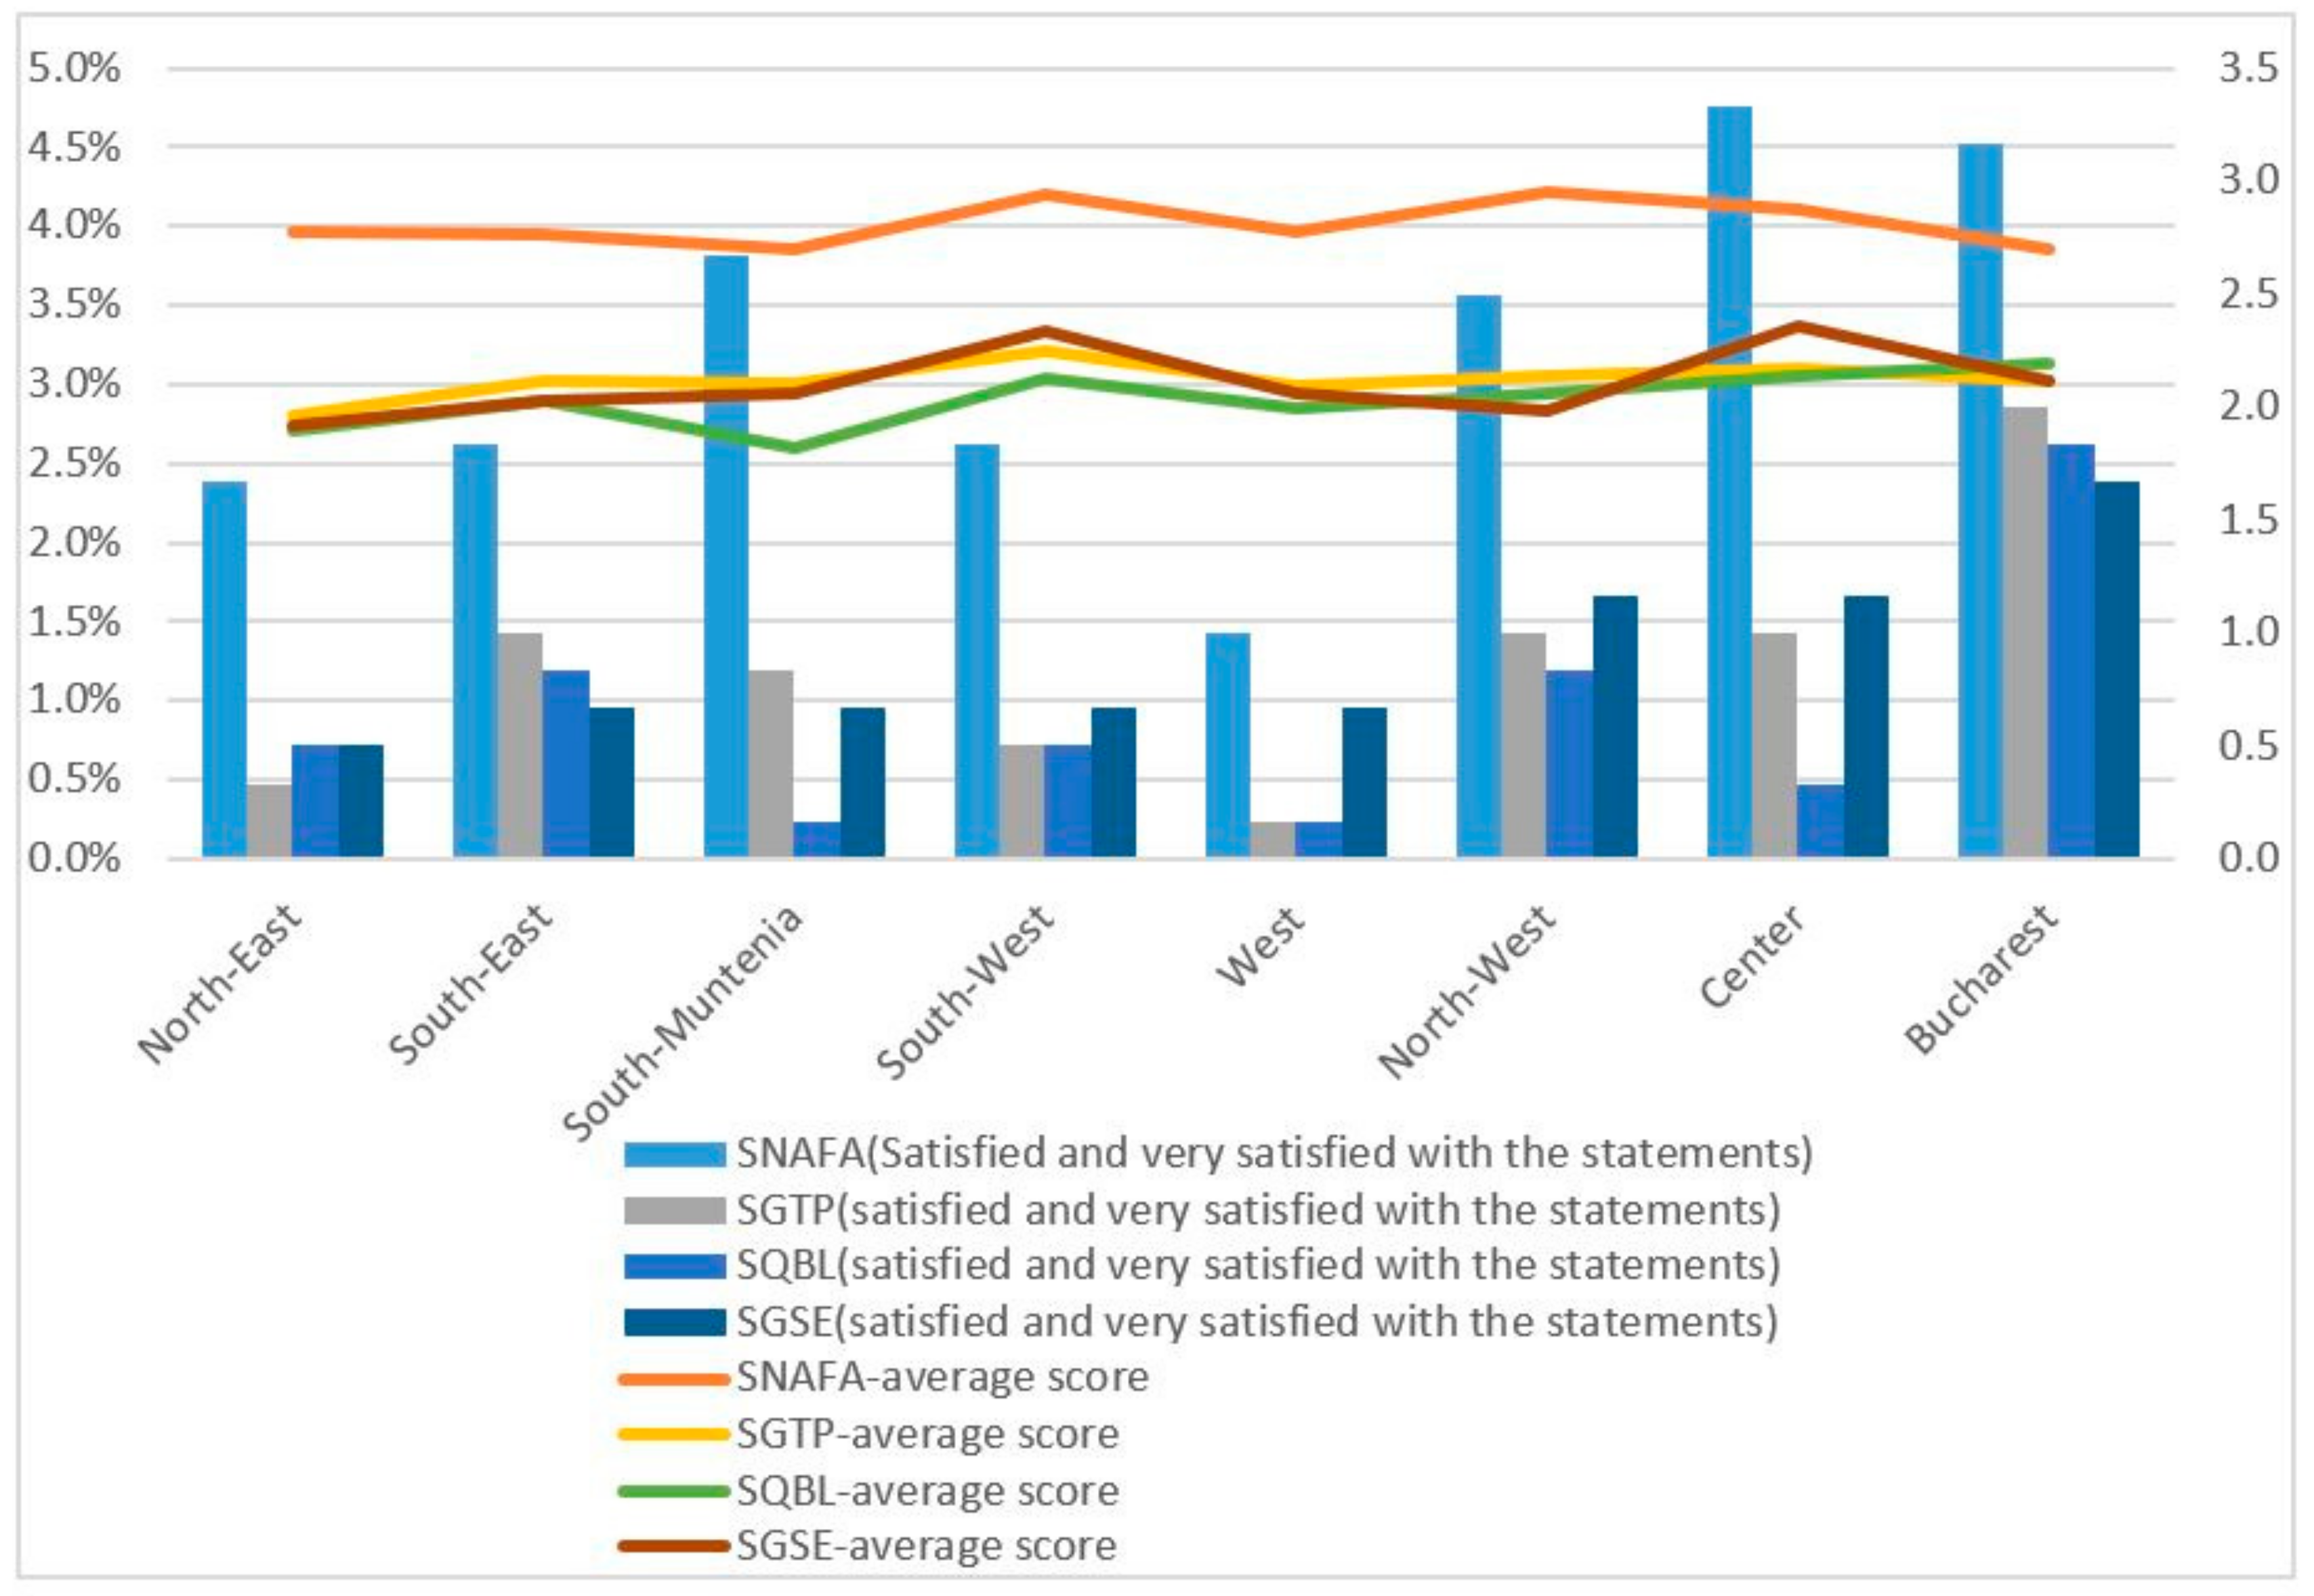
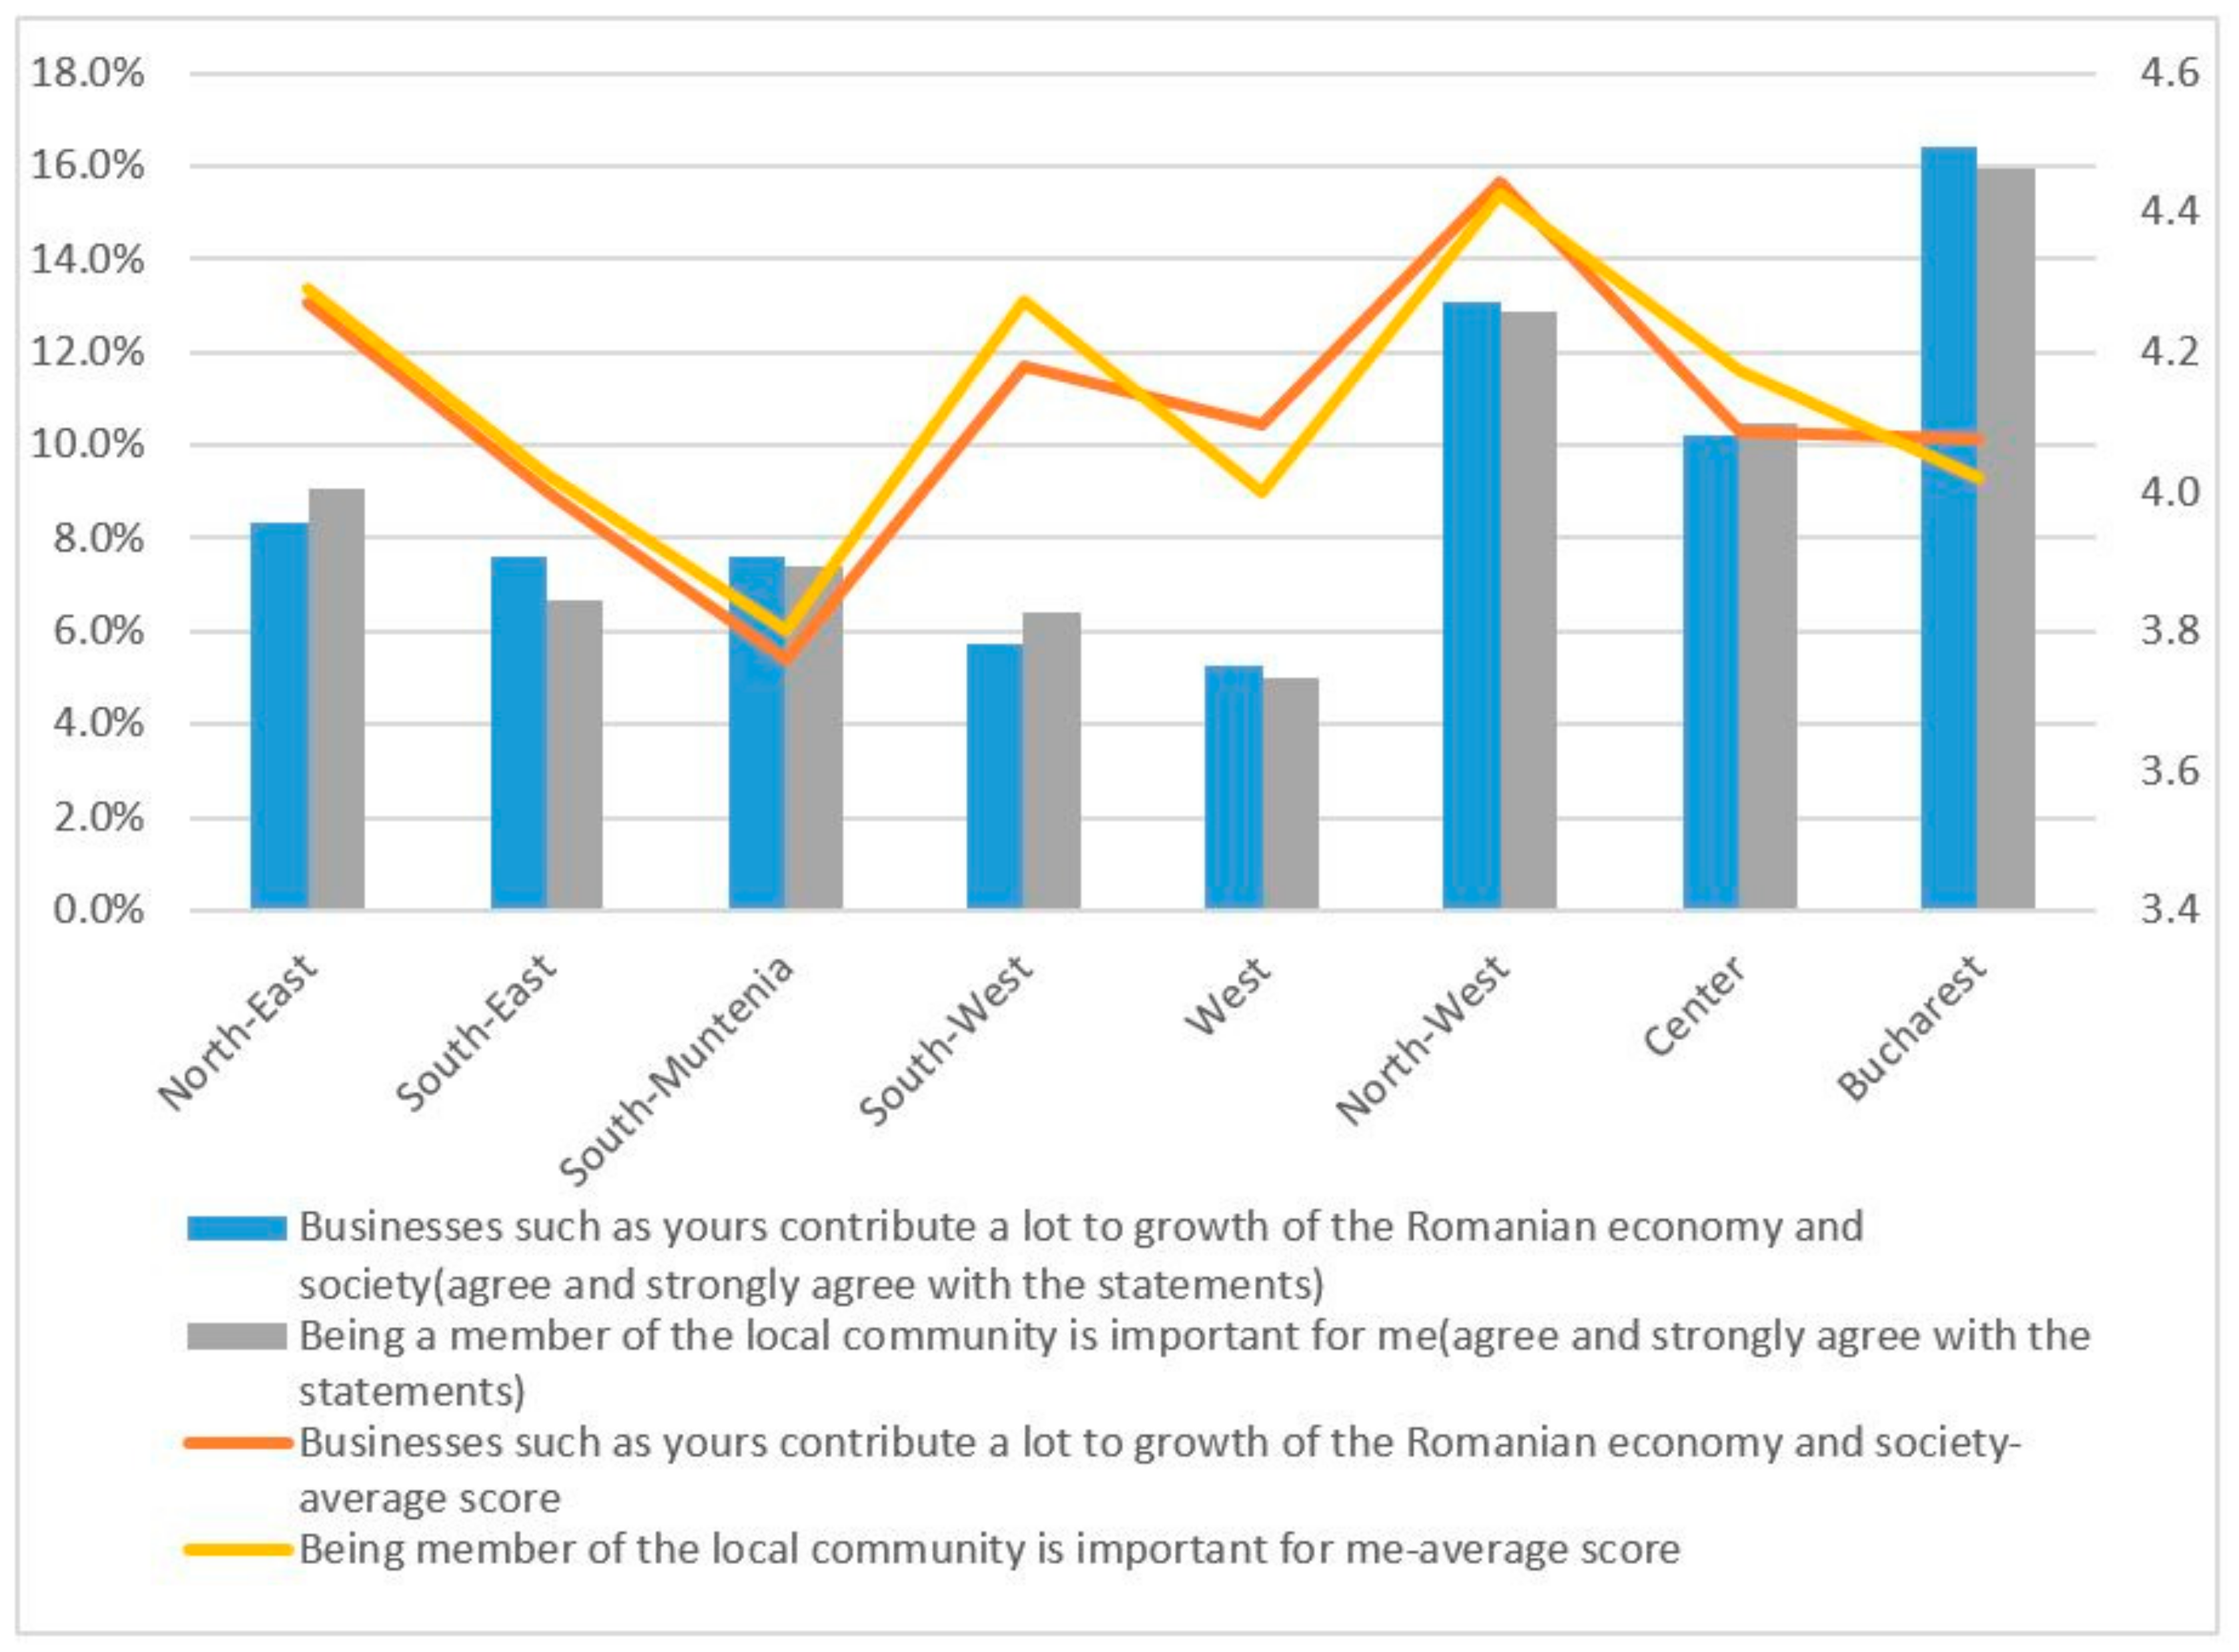
Appendix C. The Regional Analysis of the Main Determinants of Shadow Economic Activity

The analysis by regions regarding tax avoidance and bribery revealed that if in South-East and South-Muntenia the perceptions of entrepreneurs were that tax avoidance is a more tolerated behavior than bribery, in the other regions the beliefs are quite reversed. The highest degree of tolerance related to bribery and tax avoidance was registered in Bucharest and North-West regions (Figure A1).
Figure A1. Perceptions regarding tax avoidance and bribery behavior by regions.
Sustainability 10 03518 g0a1
It is worth to point out the entrepreneurs from all regions unanimously claimed that the highest level of satisfaction is related to the performance of the National Agency for Fiscal Administration with regards to tax administration, with highest percentages in Center, South-Muntenia and Bucharest. On the second place, individuals declared to be satisfied with government’s tax policy in Bucharest, South-Muntenia and South-East, while in the other regions people tend to be more satisfied with government’s support offered to entrepreneurs. At the opposite side, entrepreneurs from various regions were deeply disappointed by the quality of business legislation (Figure A2).
Figure A2. Satisfaction degree towards the government and tax authority by regions. SNAFA: Satisfaction with the performance of the National Agency for Fiscal Administration with regards to tax administration; SGTP: Satisfaction with the government’s tax policy; SQBL: Satisfaction with the quality of business legislation; SGSE: Satisfaction with the government’s support to entrepreneurs;
Sustainability 10 03518 g0a2
Analyzing the responses of Romanian entrepreneurs from different regions of the country, it can be highlighted that the membership to local community and the personal contribution to the economy’s growth are mostly important for entrepreneurs from Bucharest, North-West and Center and not very important for those from West and South-West (Figure A3).
Analyzing the perceptions about potential barriers of business environment by regions, unanimously entrepreneurs from all regions considered high social contributions as being main driver who determines companies to hire workers without legal forms followed by the low amount of the unemployment benefit, the only thing that make the difference are the percentage of importance. People from Bucharest, Center and North-West strongly agree with these statements, in contradiction to a lower percentage of entrepreneurs from South-West and West regions (Figure A4).
Figure A3. Perceptions regarding the membership to local community and business community by regions.
Sustainability 10 03518 g0a3
Figure A4. Differences in perceptions regarding barriers of business environment by regions. Min_Wage = Increasing the minimum wage leads firms to hire unskilled or low-skilled workers without legal forms; Unempl_Allow = the low amount of the unemployment benefit determines the unemployed to accept to work without legal forms while receiving also the indemnity/unemployment benefit; Soc_Contr = High social contributions make firms hire workers without legal forms.
Sustainability 10 03518 g0a4
Asked to evaluate potential obstacles for their companies, entrepreneurs from all regions unanimously pointed out the corruption of being the major obstacle encountered by the companies, followed immediately by political instability, tax rates, anti-competitive practices of other competitors and uncertainty about regulation policies (Figure A5).
Figure A5. Differences regarding major obstacles affecting Romanian companies by regions. TA: Tax administration; TR: tax rates; TCR: Trade and custom regulation; BLP: Business licencing and permits; FJC: Functioning of the judiciary/courts; UARP: Uncertainty about regulation policies; C: Corruption; ACPOC: Anti-competitive practices of other competitors; PI: Political instability; IMW: Increase of the minimum wage; RUSW: The role of the union in setting the minimum wage.
Sustainability 10 03518 g0a5

References

  1. Schneider, F.; Buehn, A. Estimating the Size of the Shadow Economy: Methods, Problems and Open Questions. 2013. Available online: http://papers.ssrn.com/sol3/papers.cfm?abstract_id=2353281 (accessed on 15 March 2018).
  2. Schneider, F.; Williams, C. The Shadow Economy; The Institute of Economic Affairs: London, UK, 2013. [Google Scholar]
  3. Thomas, J.J. Informal Economic Activity, LSE, Handbooks in Economics; Harvester Wheatsheaf: London, UK, 1992. [Google Scholar]
  4. Medina, L.; Schneider, F. Shadow Economies around the World: What did We Learn over the Last 20 Years? IMF Working Paper WP/18/17. 2017. Available online: https://papers.ssrn.com/sol3/papers.cfm?abstract_id=3124402 (accessed on 20 May 2018).
  5. Gurtoo, A.; Williams, C.C. Entrepreneurship and the informal sector: Some lessons from India. Int. J. Entrep. Innov. 2009, 10, 55–62. [Google Scholar] [CrossRef]
  6. Williams, C.C.; Gurtoo, A. Women entrepreneurs in the Indian informal sector: Marginalisation dynamics or institutional rational choice? Int. J. Gend. Entrep. 2011, 3, 6–22. [Google Scholar] [CrossRef]
  7. Williams, C.C.; Nadin, S. Entrepreneurship and the informal economy: An overview. J. Dev. Entrep. 2010, 15, 361–378. [Google Scholar]
  8. Enste, D.H. Shadow economy and institutional change in transition countries. In The Informal Economy in the EU Accession Countries: Size, Scope, Trends and Challenges to the Process of EU Enlargement; Centre for the Study of Democracy: Sofia, Bulgaria, 2003; pp. 81–113. [Google Scholar]
  9. Asea, P.K. The informal sector: Baby or bath water? A comment. In Carnegie-Rochester Conference Series on Public Policy; Elsevier: North-Holland, The Netherlands, 1996; Volume 45, pp. 163–171. [Google Scholar]
  10. Schneider, F.; Enste, D. Shadow Economies: Size, Causes and Consequences. J. Econ. Lit. 2000, 38, 73–110. [Google Scholar] [CrossRef]
  11. Kucera, D.; Galli, R. Informal Employment in Latin America: Movements over Business Cycles and the Effects of Worker Rights. 2003. Available online: https://papers.ssrn.com/sol3/papers.cfm?abstract_id=403481 (accessed on 20 January 2018).
  12. Chen, M.A.; Vanek, J.; Carr, M. Mainstreaming Informal Employment and Gender in Poverty Reduction: A Handbook for Policy-Makers and Other Stakeholders; Commonwealth Secretariat: London, UK, 2004. [Google Scholar]
  13. Chen, M.A.; Vanek, J.; Lund, F.; Heintz, J.; Jhabvala, R.; Bonner, C. Progress of the World’s Women 2005: Women, Work, and Poverty; UNIFEM: New York, NY, USA, 2005. [Google Scholar]
  14. Farzanegan, M.R.; Hassan, M. The Impact of Economic Globalization on the Shadow Economy in Egypt. 2017. Available online: https://papers.ssrn.com/Sol3/papers.cfm?abstract_id=2965941 (accessed on 10 September 2018).
  15. La Porta, R.; Shleifer, A. Informality and development. J. Econ. Perspect. 2014, 28, 109–126. [Google Scholar] [CrossRef] [Green Version]
  16. Gerxhani, K. The informal sector in developed and less developed countries: A literature survey. Public Choice 2004, 120, 267–300. [Google Scholar] [CrossRef]
  17. Loayza, N. The causes and consequences of informality in Peru. Serie de Documento de Trabajo 2007, 18, 1–22. [Google Scholar]
  18. Oviedo, A.M.; Thomas, M.R.; Karakurum-Özdemir, K. Economic Informality: Causes, Costs, and Policies-a Literature Survey. The World Bank, 2009. Available online: https://elibrary.worldbank.org/doi/abs/10.1596/978-0-8213-7996-7 (accessed on 10 September 2018).
  19. Biswas, A.; Farzanegan, M.R.; Thum, M. Pollution, shadow economy and corruption: Theory and evidence. Ecol. Econ. 2012, 75, 114–125. [Google Scholar] [CrossRef] [Green Version]
  20. Bacchetta, M.; Ernst, E.; Bustamante, J.P. Globalization and Informal Jobs in Developing Countries. International Labour Organization: Geneva, Switzerland, 2009. Available online: https://www.wto.org/english/res_e/booksp_e/jobs_devel_countries_e.pdf (accessed on 20 May 2018).
  21. Briassoulis, H. Sustainable development and the informal sector: An uneasy relationship? J. Environ. Dev. 1999, 8, 213–237. [Google Scholar] [CrossRef]
  22. Ruzek, W. The informal economy as a catalyst for sustainability. Sustainability 2014, 7, 23–34. [Google Scholar] [CrossRef]
  23. Smit, S.; Musango, J.K. Towards connecting green economy with informal economy in South Africa: A review and way forward. Ecol. Econ. 2015, 116, 154–159. [Google Scholar] [CrossRef] [Green Version]
  24. Rupani, K.F. The Organization of the Informal Sector for Sustainable Development. In Proceedings of the 3rd International Conference on Global Business, Economics, Finance and Social Sciences (GB14Mumbai Conference), Mumbai, India, 19–21 December 2014; ISBN 978-1-941505-21-2. [Google Scholar]
  25. Chambwera, M.; MacGregor, J.; Baker, A. The Informal Economy. In A Primer for Development Professionals on the Importance of the Informal Economy in Developing Countries; International Institute for Environment and Development: London, UK, 2011. [Google Scholar]
  26. Beeton, J. Very Small Is Beautiful for the Majority of Our People: Entrepreneurs Informal Traders. 2010. Available online: http://www.ngopulse.org/search/node/Ligthelm (accessed on 10 September 2018).
  27. Acey, C.S.; Culhane, T.H. Green jobs, livelihoods and the post-carbon economy in African cities. Local Environ. Int. J. Justice Sustain. 2013, 18, 1046–1065. [Google Scholar] [CrossRef]
  28. Agamuthu, P. The Role of Informal Sector for Sustainable Waste Management. Waste Manag. Res. J. Int. Solid Wastes Public Clean. Assoc. 2010, 28, 671–672. [Google Scholar] [CrossRef] [PubMed]
  29. Jha, C.K. Financial Reforms and Corruption: Which Dimensions Matter? Int. Rev. Financ. Forthcom. 2018. [Google Scholar] [CrossRef]
  30. Guiso, L.; Sapienza, P.; Zingales, L. Does local financial development matter? Q. J. Econ. 2004, 119, 929–969. [Google Scholar] [CrossRef]
  31. Jha, C.; Panda, B. Individualism and Corruption: A Cross-Country Analysis. Econ. Pap. J. Appl. Econ. Policy 2017, 36, 60–74. [Google Scholar] [CrossRef] [Green Version]
  32. Fisman, R.; Miguel, E. Corruption, norms, and legal enforcement: Evidence from diplomatic parking tickets. J. Polit. Econ. 2007, 115, 1020–1048. [Google Scholar] [CrossRef]
  33. Jha, C.K.; Sarangi, S. Women and corruption: What positions must they hold to make a difference? J. Behav. Organ. 2018, 151, 219–233. [Google Scholar] [CrossRef]
  34. Heshmati, A. The Shadow Economy and Corruption as Development Impediments. Economic Integration, Currency Union, and Sustainable and Inclusive Growth in East Africa; Springer: Cham, Switzerland, 2016; pp. 115–133. [Google Scholar]
  35. Dell’Anno, R.; Solomon, O.H. Shadow economy and unemployment rate in USA: Is there a structural relationship? An empirical analysis. Appl. Econ. 2008, 40, 2537–2555. [Google Scholar] [CrossRef]
  36. Schneider, F.; Buehn, A. Shadow Economies in 10 Transition and 6 Developing OECD Countries: What Are the Driving Forces? 2013. Available online: Studien/pfuschneu/2013/ShadEcOECD_DrivForces2013.doc (accessed on 20 January 2018).
  37. Schneider, F. Size and Development of the Shadow Economy of 31 European and 5 Other OECD Countries from 2003 to 2014: Different Developments? J. Self-Gov. Manag. Econ. 2015, 3, 7–29. [Google Scholar]
  38. Albu, L.L. A Model to Estimate Spatial Distribution Of Informal Economy. J. Econ. Forecast. Inst. Econ. Forecast. 2008, 5, 111–124. [Google Scholar]
  39. Albu, L.L.; Iorgulescu, R.; Stanica, C. Estimating Hidden Economy and Hidden Migration: The Case of Romania. J. Econ. Forecast. Inst. Econ. Forecast. 2010, 2, 46–56. [Google Scholar]
  40. Albu, L.L.; Ghizdeanu, I.; Stanica, C. Spatial Distribution of the Informal Economy. A Theoretical and Empirical Investigation; SCIENZE REGIONALI, Franco Angeli Editore: Milan, Italy, 2011; pp. 63–80. [Google Scholar]
  41. Alexandru, A.A.; Dobre, I. The Impact of unmployment rate on the size of Romanian shadow economy. Public Financ. Rev. 2013, 41, 608–632. [Google Scholar]
  42. Davidescu, A.A. Estimating the size of Romanian shadow economy. A labour Approach. J. Soc. Econ. Stat. 2014, 3, 25–37. [Google Scholar]
  43. Davidescu, A.A. Mapping the Informal Employment in Romania. A Comparative Analysis based on Labour and Discrepancy Approaches. J. Appl. Quant. Methods 2016, 11, 64–88. [Google Scholar]
  44. Andrei, T.; Ştefănescu, D.; Oancea, B. Quantitative Methods for Evaluating the Informal Economy. Case Study at the Level of Romania. Theor. Appl. Econ. 2010, 7, 15. [Google Scholar]
  45. Schneider, F.; Buehn, A.; Montenegro, C.E. Shadow Economies All over the World: New Estimates for 162 Countries from 1999 to 2007; Policy Research Working Paper 5356; The World Bank Development Research Group Poverty and Inequality Team & Europe and Central Asia Region Human Development Economics Unit: Washington, DC, WA, USA, 2010. [Google Scholar]
  46. Schneider, F. Size and Development of the Shadow Economy of 31 European and 5 Other OECD Countries from 2003 to 2013: A Further Decline; Johannes Kepler Universität: Linz, Austria, 2013; pp. 5–7. Available online: http://www.econ.jku.at/members/schneider/files/publications/2013/shadeceurope31_jan2013.pdf (accessed on 20 May 2018).
  47. Schneider, F. Size and Development of the Shadow Economy of 31 European and 5 other OECD Countries from 2003 to 2016: Different Developments. Unpublished work. 2016. [Google Scholar]
  48. French, R.; Balaita, M.; Ticsa, M. Estimating the Size and Policy Implications of the Underground Economy in Romania, US Department of the Treasury; Office of Technical Assistance: Bucharest, Romania, 1999. [Google Scholar]
  49. Kaufmann, D.; Kaliberda, A. Integrating the Unofficial Economy into the Dynamics of Post-Socialist Economies: A Framework of Analysis and Evidence; World Bank Policy Research Working Paper WPS1691; World Bank: Washington, DC, USA, 1996. [Google Scholar]
  50. Johnson, S.; Kaufmann, D.; Shleifer, A. The Unofficial Economy in Transition. Brook. Pap. Econ. Act. 1997, 28, 159–240. [Google Scholar] [CrossRef]
  51. Johnson, S.; Kaufmann, D.; Zoido-Lobatón, P. Regulatory discretion and the unofficial economy. Am. Econ. Rev. 1998, 88, 387–392. [Google Scholar]
  52. Lackó, M. Hidden Economy an Unknown Quantity? Comparative Analyses of Hidden Economies in Transition Countries in 1989–95; Working Paper; Department of Economics, University of Linz: Linz, Austria, 1999. [Google Scholar]
  53. Eilat, Y.; Zinnes, C. The Shadow Economy in Transition Countries Friend or FOE. A Policy Perspective. World Dev. 2002, 30, 1233–1254. [Google Scholar] [CrossRef]
  54. Schneider, F.; Enste, D. Increasing Shadow Economies all over the World—Fiction or Reality? A Survey of the Global Evidence of their Size and of their Impact from 1970 to 1995; The Institute for the Study of Labor (IZA): Bonn, Germany, 1998. [Google Scholar]
  55. Schneider, F.; Enste, D. The Shadow Economy: Theoretical Approaches, Empirical Studies, and Political Implications; Cambridge University Press: Cambridge, UK, 2002. [Google Scholar]
  56. Schneider, F.; Chaudhuri, K.; Chatterjee, S. The Size and Development of the Indian Shadow Economy and a Comparison with Other 18 Asian Countries: An Empirical Investigation (No. 0302); Working Paper; Department of Economics, Johannes Kepler University of Linz: Linz, Austria, 2003. [Google Scholar]
  57. Schneider, F.; Klinglmair, R. Shadow Economies around the World: What Do We Know? IZA Discussion Papers 1043; Institute for the Study of Labor (IZA): Bonn, Germany, 2004. [Google Scholar]
  58. Schneider, F.; Buehn, A. Shadow economies and corruption all over the world: Revised estimates for 120 countries, Economics—The Open-Access, Open-Assessment E-Journal. Kiel Inst. World Econ. 2007, 1, 1–53. [Google Scholar]
  59. Schneider, F. Shadow economies around the world: What do we really know? Eur. J. Polit. Econ. 2005, 21, 598–642. [Google Scholar] [CrossRef]
  60. Schneider, F. Shadow Economies and Corruption All Over the World: What Do We Really Know? Economics Working Papers 2006-17; Department of Economics, Johannes Kepler University Linz: Linz, Austria, 2006. [Google Scholar]
  61. Sustainable Development Solutions Network (SDSN). The 2018 SDG Index and Dashboards Report. Global Responsibilities. Implementing the Goals, Bertelsmann Stiftung, 2018. Available online: http://www.sdgindex.org/reports/2018/ (accessed on 22 September 2018).
  62. Adam, M.C.; Ginsburgh, V. The effects of irregular markets on macroeconomic policy: Some estimates for Belgium. Eur. Econ. Rev. 1985, 29, 15–33. [Google Scholar] [CrossRef]
  63. Giles, D.E.A.; Tedds, L.M. Taxes and the Canadian Underground Economy; Canadian Tax Paper n.106; Canadian Tax Foundation: Toronto, ON, Canada, 2002.
  64. Loayza, N.V. The Economics of the Informal Sector: A Simple Model and Some Empirical Evidence from Latin America. In Carnegie-Rochester Conference Series on Public Policy; World Bank: Washington, DC, USA, 1996; Volume 45, pp. 129–162. [Google Scholar]
  65. Dell’Anno, R. Estimating the Shadow Economy in Italy: A Structural Equation Approach; Working Paper 2003–2007; Department of Economics, University of Aarhus: Aarhus, Denmark, 2003. [Google Scholar]
  66. Dell’Anno, R. What is the relationship between unofficial and official economy? An analysis in Latin American countries. Eur. J. Econ. Financ. Adm. Sci. 2008, 12, 185–203. [Google Scholar]
  67. Dell’Anno, R.; Gómez-Antonio, M.; Pardo, A. The shadow economy in three Mediterranean countries: France, Spain and Greece. A MIMIC approach. Empir. Econ. 2007, 33, 51–84. [Google Scholar] [CrossRef]
  68. Berdiev, A.N.; Saunoris, J.W. Financial development and the shadow economy: A panel VAR analysis. Econ. Model. 2016, 57, 197–207. [Google Scholar] [CrossRef]
  69. Schneider, F.; Bajada, C. The Size and Development of the Shadow Economies in the Asia-Pacific (No. 0301); Working Paper; Department of Economics, Johannes Kepler University of Linz: Linz, Austria, 2003. [Google Scholar]
  70. Johnson, S.; Kaufmann, D.; Zoido-Lobatón, P. Corruption, Public Finances and the UNOFFICIAL Economy; MIT, The World Bank: Washington, DC, USA, 1998. [Google Scholar]
  71. Christopoulos, D.K. Does underground economy respond symmetrically to tax changes? Evidence from Greece. Econ. Model. 2003, 20, 563–570. [Google Scholar] [CrossRef]
  72. Tanzi, V. Uses and Abuses of Estimates of the Underground Economy. Econ. J. 1999, 109, 338–347. [Google Scholar] [CrossRef]
  73. Luo, J.; Shang, J. Exploratory data analysis on unemployment rates in USA. Adv. Appl. Stat. 2016, 48, 303–316. [Google Scholar]
  74. Saafi, S.; Farhat, A. Is there a causal relationship between unemployment and informal economy in Tunisia: Evidence from linear and non-linear Granger causality? Econ. Bull. 2015, 35, 1191–1204. [Google Scholar]
  75. Saafi, S.; Farhat, A.; Mohamed, H.; Bel, M. Testing the relationships between shadow economy and unemployment: Empirical evidence from linear and nonlinear tests. Stud. Nonlinear Dyn. Econom. 2015, 19, 585–608. [Google Scholar] [CrossRef]
  76. Bordignon, M.; Zanardi, A. Tax evasion in Italy. Giornale degli Economisti 1997, 56, 169–210. [Google Scholar]
  77. Feld, L.P.; Schneider, F. Survey on the shadow economy and undeclared earnings in OECD countries. Ger. Econ. Rev. 2010, 11, 109–149. [Google Scholar] [CrossRef]
  78. Hokamp, S.; Seibold, G. Tax Compliance and Public Goods Provision—An Agent-based Econophysics Approach. ArXiv, 2014; arXiv:1409.8528. [Google Scholar]
  79. Dell’Anno, R.; Solomon, H.O. Informality, Inequality, and ICT in Transition Economies. Eastern Eur. Econ. 2014, 52, 3–31. [Google Scholar] [CrossRef]
  80. Kucera, D.; Roncolato, L. Informal employment: Two contested policy issues. Int. Lab. Rev. 2008, 147, 321–348. [Google Scholar] [CrossRef]
  81. Schneider, F.; Buehn, A. Estimating the Size of the Shadow Economy: Methods, Problems and Open Questions, 2016, IZA DP No. 9820. Available online: http://ftp.iza.org/dp9820.pdf (accessed on 20 March 2018).
  82. Bollen, K.A. A new incremental fit index for general structural equation models. Sociol. Methods Res. 1989, 17, 303–316. [Google Scholar] [CrossRef]
  83. Long, J.S. Covariance Structure Models: An Introduction to LISREL; Sage Publishing Company: Beverly Hills, CA, USA, 1983. [Google Scholar]
  84. Dell’Anno, R.; Schneider, F. A complex approach to estimate shadow economy: The structural equation modelling. In Coping with the Complexity of Economics; Faggnini, M., Looks, T., Eds.; Springer: Berlin, Germany, 2009; pp. 110–130. [Google Scholar]
  85. Mardia, K.V. Measures of multivariate skewness and kurtosis with applications. Biometrika 1970, 57, 519–530. [Google Scholar] [CrossRef]
  86. Doornik, J.A.; Hansen, H. An omnibus test for univariate and multivariate normality. Oxford Bull. Econ. Stat. 2008, 70, 927–939. [Google Scholar] [CrossRef]
  87. Henze, N.; Zirkler, B. A class of invariant consistent tests for multivariate normality. Commun. Stat. Theory Methods 1990, 19, 3595–3617. [Google Scholar] [CrossRef]
  88. Friedman, E.; Johnson, S.; Kaufman, D.; Zoldo-Lobaton, P. Dodging the Grabbing Hand: The Determinants of Unofficial Activity in 69 Countries. J. Public Econ. 2000, 76, 459–493. [Google Scholar] [CrossRef]
  89. Razmi, M.J.; Falahi, M.A.; Montazeri, S. Institutional Quality and Underground Economy of 51 OIC Member Countries. Univers. J. Manag. Soc. Sci. 2013, 3, 1–14. [Google Scholar]
  90. Transparency International. Corruption Perception Index. Available online: https://www.transparency.org/news/feature/corruption_perceptions_index_2017#table (accessed on 1 September 2018).
  91. Fiscal Council. Fiscal Council’s Opinions. 2013. Available online: http://www.fiscalcouncil.ro/publicatii-opinii-en.2013.pdf (accessed on 15 February 2018).
  92. Blanco-Portela, N.; Benayas, J.; Pertierra, L.R.; Lozano, R. Towards the integration of sustainability in Higher Education Institutions: A review of drivers of and barriers to organisational change and comparison against those found of companies. J. Clean. Prod. 2017, 166, 563–578. [Google Scholar] [CrossRef]
  93. Lozano, R.; Suzuki, M.; Carpenter, A.; Tyunina, O. An analysis of the contribution of Japanese business terms to corporate sustainability: Learnings from the “looking-glass” of the east. Sustainability 2017, 9, 188. [Google Scholar] [CrossRef]
  94. Nuñez-Cacho, P.; Górecki, J.; Molina-Moreno, V.; Corpas-Iglesias, F.A. What Gets Measured, Gets Done: Development of a Circular Economy Measurement Scale for Building Industry. Sustainability 2018, 10, 2340. [Google Scholar] [CrossRef]
  95. Núñez-Cacho, P.; Molina-Moreno, V.; Corpas-Iglesias, F.A.; Cortés-García, F.J. Family Businesses Transitioning to a Circular Economy Model: The Case of “Mercadona”. Sustainability 2018, 10, 538. [Google Scholar] [CrossRef]
Figure 1. The average performance of Romania for each Sustainable Development Goal (SDG) in 2018.
Sustainability 10 03518 g001
Figure 2. An overview of the current assessment of Romania SDGs.
Sustainability 10 03518 g002aSustainability 10 03518 g002b
Figure 3. Position of the respondents in the interviewed companies and the dimension of the companies.
Sustainability 10 03518 g003
Figure 4. Residential environment and headquarters region of the companies interviewed.
Sustainability 10 03518 g004
Figure 5. Field of activity and the source of social capital.
Sustainability 10 03518 g005
Figure 6. Perceptions regarding tax avoidance and bribery behavior in Romania.
Sustainability 10 03518 g006
Figure 7. Satisfaction degree toward the government and tax authority. SNAFA: Satisfaction with the performance of the National Agency for Fiscal Administration with regards to tax administration; SGTP: satisfaction with the government’s tax policy; SQBL: satisfaction with the quality of business legislation; SGSE: satisfaction with the government’s support to entrepreneurs.
Sustainability 10 03518 g007
Figure 8. Perceptions regarding membership to the local community and business community.
Sustainability 10 03518 g008
Figure 9. Perceptions regarding barriers of the business environment. Min_Wage = Increasing the minimum wage leads firms to hire unskilled or low-skilled workers without legal forms; Unempl_Allow = the low amount of the unemployment benefit determines whether the unemployed accept work without legal forms while also receiving the indemnity/unemployment benefit; Soc_Contr = High social contributions make firms hire workers without legal forms.
Sustainability 10 03518 g009
Figure 10. Major obstacles affecting Romanian companies. TA: tax administration; TR: tax rates; TCR: trade and custom regulation; BLP: business licencing and permits; FJC: functioning of the judiciary/courts; UARP: uncertainty about regulation policies; C: corruption; ACPOC: anti-competitive practices of other competitors; PI: political instability; IMW: increase of the minimum wage; RUSW: the role of the union in setting the minimum wage.
Sustainability 10 03518 g010
Figure 11. The size of the Romanian shadow economy (% of official GDP).
Sustainability 10 03518 g011
Figure 12. Comparing the size of the size of the Romanian informal economy using a different source.
Sustainability 10 03518 g012
Table 1. The size of the Romanian shadow economy (SE) (% of official gross domestic product (GDP)). MIMIC: Multiple Causes Multiple Indicators.
AuthorsApproachSize of SE (% of Official GDP)
Albu [38]
Albu et al. [39,40]
Income discrepancy method21.7–22.3% (2000)
20.6–21.2% (2001)
20.2–20.7% (2002)
19.3–19.6% (2003)
17.6–17.6% (2004)
17.2–17.3% (2005)
16.3–16.5% (2006)
14.6–15.0% (2007)
National Institute of StatisticsLabor input method18.1% (2000)
15.4% (2003)
16.6% (2005)
20.0% (2007)
21.3% (2009)
23.5% (2010)
Andrei, Ştefănescu, Oancea [44]Monetary method25–35% (2000–2009)
Schneider, Buehn and Montenegro [45]
Schneider [37,46,47]
Medina and Schneider [4]
the MIMIC approach34.4% (2000)
30.5% (2005)
26.8% (2010)
29.1% (2012)
24.0% (2013)
28.0% (2015)
27.6% (2016)
Alexandru and Dobre [41]Currency demand approach
Vector Error Correction Models (VECM)
36.5% (2000)
34.23% (2003)
33.6% (2005)
32.1% (2008)
31.6% (2010)
Table 2. Estimated Coefficients of the MIMIC Models. CD: coefficient of determination, CFI: comparative fit index, GDP: gross domestic product, SRMR: standardized root mean square residual, TLI: Tucker–Lewis index.
ModelsCausesIndicators
Tax BurdenDirect TaxesIndir. TaxesSocial Contr.Gov. Cons.Unempl. RateSelf-Empl.Gov. Empl.Reg. Qual.Govern. EffectivenessPart-Time Empl.Real GDP Index C M 1 Lab. Force Part. Rate
MIMIC 9-1-3a-0.0840.1500.1430.1021.229 *1.003 ***0.650 −4.79 *0.086−10.476 *0.059
MIMIC 9-1-3b 0.0660.1790.1620.0821.190 **0.793 *0.706−5.90 * 0.135−10.481 *0.039
MIMIC 8-1-3a--0.1110.1310.1121.274 *0.967 **0.644-−5.11 *0.104−10.483 *0.052
MIMIC 8-1-3b--0.1490.1520.0881.223 **0.755 *0.687−6.18 *-0.155−10.492 *0.035
MIMIC 7-1-3a--0.1480.1460.0701.213 **0.758 *-−5.17 *-0.208 *−10.5880.080
MIMIC 7-1-3b0.031---0.1111.194 *0.820 **0.872−5.21 * 0.166−10.491 *0.044
MIMIC 7-1-2a--0.1720.245-1.232 **0.756 *0.767−7.03 *-0.134−10.443 *-
MIMIC 6-1-3a--0.1140.141-1.100 **0.819 **-−4.30 *-0.268 *−10.661 *0.195 *
MIMIC 6-1-3b--0.0160.069-0.859 *0.876 **--−2.62 *0.281 *−10.606 *0.421 *
MIMIC 5-1-3a--0.026--0.743 *0.789 *-−1.00 *-0.292 *−10.710 *0.428 **
MIMIC 5-1-3b--0.008--0.807 *0.829 **--−2.20 *0.285 *−10654 *0.461 *
MIMIC 4-1-3a-----0.668 *0.769 **-−0.535 *-0.286 *−10.705 *0.477 **
MIMIC 4-1-3b-----0.796 * 0.823 ** --−2.18 *0.285 * −10651 * 0.471 **
Global Goodness of Fit StatisticsChi-square 2
(p-value)
RMSEA 3
(p-value)
CFITLISRMRCDAICSBC
MIMIC 9-1-3a23.22 +
(0.182)
0.06 +
(0.197)
0.5770.2940.0620.3641779.911941.80
MIMIC 9-1-3b24.11 +
(0.151)
0.07 +
(0.142)
0.5940.3240.0620.3651779.801941.70
MIMIC 8-1-3a19.56 +
(0.24)
0.056 +
(0.199)
0.6850.4690.0650.3581572.241709.40
MIMIC 8-1-3b19.80 +
(0.229)
0.058 +
(0.17)
0.7130.5160.0660.3671572.461709.62
MIMIC 7-1-3a16.46 +
(0.286)
0.05 +
(0.192)
0.7890.639 0.0670.4101588.061702.74
MIMIC 7-1-3b20.07 +
(0.128)
0.079 +
(0.088)
0.5890.2950.0720.339 1424.181538.85
MIMIC 7-1-2a4.34 +
(0.63)
0.00 +
(0.822)
1.001.3820.0280.3161108.741216.67
MIMIC 6-1-3a12.65 +
(0.39)
0.028 +
(0.295)
0.9350.886 0.0630.5141283.881378.31
MIMIC 6-1-3b12.31 +
(0.42)
0.019 +
(0.47)
0.9580.926 0.0600.8671283.541377.98
MIMIC 5-1-3a12.15 +
(0.275)
0.055 +
(0.275)
0.7940.6290.0650.7781093.191169.63
MIMIC 5-1-3b10.44 +
(0.402)
0.025 +
(0.455)
0.9440.9000.0640.8621093.111169.55
MIMIC 4-1-3a9.18 +
(0.32)
0.046 +
(0.295)
0.8800.7750.0660.820843.27903.98
MIMIC 4-1-3b7.89+
(0.44)
0.00+
(0.44)
1.0001.0250.0650.872842.68903.39
Notes: ***, **, * represents 1%, 5% and 10%; + Means good fitting (p-value > 0.05). 2 If the structural equation model is correct and the population parameters are known, then the matrix S (sample covariance matrix) will equal to Σ(θ) (model-implied covariance matrix); therefore, the perfect fit corresponds to p-value = 1. This test has a statistical validity if there are large sample and multinormal distributions. 3 p-value for test of close fit (RMSEA < 0.05). In bold, there is the optimal model 4-1-3b MIMIC.

