Spatial Pattern and Factor Analyses for Forest Sustainable Development Goals within South Korea’s Civilian Control Zone

1
Inter-Korean Forest Research Team, Division of Global Forestry, National Institute of Forest Science, Seoul 02455, Korea
2
Department of Forest Management, Division of Forest Sciences, College of Forest and Environmental Sciences, Kangwon National University, Chuncheon 24341, Korea
*
Author to whom correspondence should be addressed.
Sustainability 2018, 10(10), 3500; https://doi.org/10.3390/su10103500
Submission received: 27 July 2018
/
Revised: 22 September 2018
/
Accepted: 26 September 2018
/
Published: 29 September 2018
(This article belongs to the Special Issue Forest Biodiversity, Conservation and Sustainability)
Abstract
:The United Nations’ Sustainable Development Goals (SDGs) offer specific guidelines for improving sustainable forest management, especially Goal 15. Goal 15 protects, restores and promotes the sustainable use of land ecosystems, manages forests sustainably, prevents was against desertification, stops and reverses land degradation and prevents biodiversity loss. The Civilian Control Zone (CCZ) south of the Demilitarized Zone (DMZ) separating North and South Korea has functioned as a unique biological preserve due to traditional restrictions on human use but is now increasingly threatened by deforestation and development. We used hot spot analysis and structural equation modeling (SEM) to analyze spatial patterns of forest land use and land cover (LULC) change and variables influencing these changes, within the CCZ. Remote sensing imagery was used to develop land cover classification maps (2010 and 2016) and a GIS database was established for three change factors (topography, accessibility and socioeconomic characteristics). As a result of Hotspot analysis, Hotspots of change were distributed mainly due to agricultural activities and the development of forest and expansion of villages. Subsequent factor analysis revealed that accessibility had greater influence (−0.635) than the other factors. Among the direct factors, change to bare land had the greatest impact (−0.574) on forest change. These results shed light on forest change patterns and causes in the CCZ and provide practical data for efficient forest management in this area with regards to the SDGs.
1. Introduction
In September 2000, the United Nations (UN) presented Millennium Development Goals (MDGs) aimed at enhancing the quality of human life [1]. However, these MDGs set no concrete objectives for solving fundamental problems posed by factors hampering efforts to enhance quality of life. The 2012 UN Conference on Sustainable Development (UNCSD), “Rio + 20,” produced the outcome document “The Future We Want” which set a new sustainable development agenda called Sustainable Development Goals (SDGs) [2]. In 2015, the UN adopted the “2030 Agenda for Sustainable Development” containing 17 SDGs and 169 targets [3]. The SDGs’ primary goal is eradicating poverty, with a focus on balanced economic, social and environmental developments.
A broad range of forest-related issues, from forest management to forest-added value, were considered in multiple SDGs including Goal 3 (Good Health and Well-being), Goal 6 (Clean Water and Sanitation), Goal 13 (Climate Action) and Goal 15 (Life on Land) [4]. Goal 15, “Protect, restore and promote sustainable use of terrestrial ecosystems, sustainably manage forests, combat desertification and halt and reverse land degradation and halt biodiversity loss,” is particularly associated with forestry; its targets emphasize the value of forests for biodiversity conservation along with marine and coastal areas [5].
In the Korean Peninsula, the area along the demilitarized zone between North and South Korea (DMZ) is valued as a treasure house of biodiversity together with the Baekdudaegan (Baekdu Mountains, the longest mountain chain running along the Korean Peninsula) and coastal islands. The DMZ was designated as one of the axes of the “Ecological Network of the Korean Peninsula” by the Ministry of Environment in 2002 [6]. The area is divided into the DMZ itself (about 4 km wide) and the Civilian Control Zone (CCZ), an area 5–20 km wide extending from the DMZ’s Southern Limit Line to the Civilian Control Line further south. In the past, civilians were not allowed to enter the Civilian Control Zone (except during guarded tourist expeditions) and so its intact natural environment and ecosystems have been highly valued together with the DMZ [7]. However, as active government-led development programs are being implemented in the CCZ, its forests are exposed to increasing deforestation and forest degradation [8]. These processes degrade plant and animal habitats and disturb the ecological and environmental functions of the area, counteracting efforts to achieve the SDGs [9]. With increasing socioeconomic activities in the CCZ, the ongoing change from forest to non-forest land use is becoming increasingly complex [10]. The forests in the CCZ encompass a broad swath across the Korean Peninsula and proper understanding of forest land use and land cover (LULC) change factors is essential for integrated planning and management [11,12,13,14].
LULC change does not take place independently of the surrounding environment; it is therefore important to consider associations and correlations with adjacent areas when analyzing its causes [15]. Jeong et al. [16] emphasized the importance of understanding the cluster and diffusion aspects of LULC distribution and identifying the underlying social, economic and environmental factors when setting up land-management plans. Of the various analytical approaches used to explore this topic, Hot spot analysis has been increasingly prioritized as an intuitive spatial-statistical analysis method compared to more complicated calculation methods [17]. This approach, developed by Ord and Getis [18], expresses the similarities and differences of spatial values measured and summarized for clustered locations [19]. For example, Lee [20] used remote sensing data to identify the relationship between LULC change and a vegetation index. Choi et al. [21] found that Hot spot analysis was useful for exploring the clustered factors related to LULC change and socioeconomic data but also noted the method’s limitations with regards to determining the effects of individual factors. Analyzed various influential factors for LULC change and explored the differing effects of these factors [22].
On the other hand, structural equation modeling (SEM) is widely used in social humanities studies for its ability to compare correlations between various factors and to determine the inter-factor differences in impact [23,24,25]. For example, Jang and Kim [26] evaluated the impact of development density for various land types on the land’s value and Asadi et al. [27] evaluated the impact of economic, social and environmental factors on cropland changes. To date, however, most related studies have used cross-sectional data rather than time-series data and hardly any studies have performed comprehensive spatial data analysis.
In this study, we have conducted studies forest management and various factors influencing for DMZ forest, the only area in the world. We used Hot spot analysis to analyze patterns of forest LULC change and SEM to determine the effects of various factors influencing forest LULC change. Our results provide practical data for setting up comprehensive forest management programs in the CCZ as part of ongoing efforts to achieve SDGs.
2. Materials and Methods
2.1. Study Site
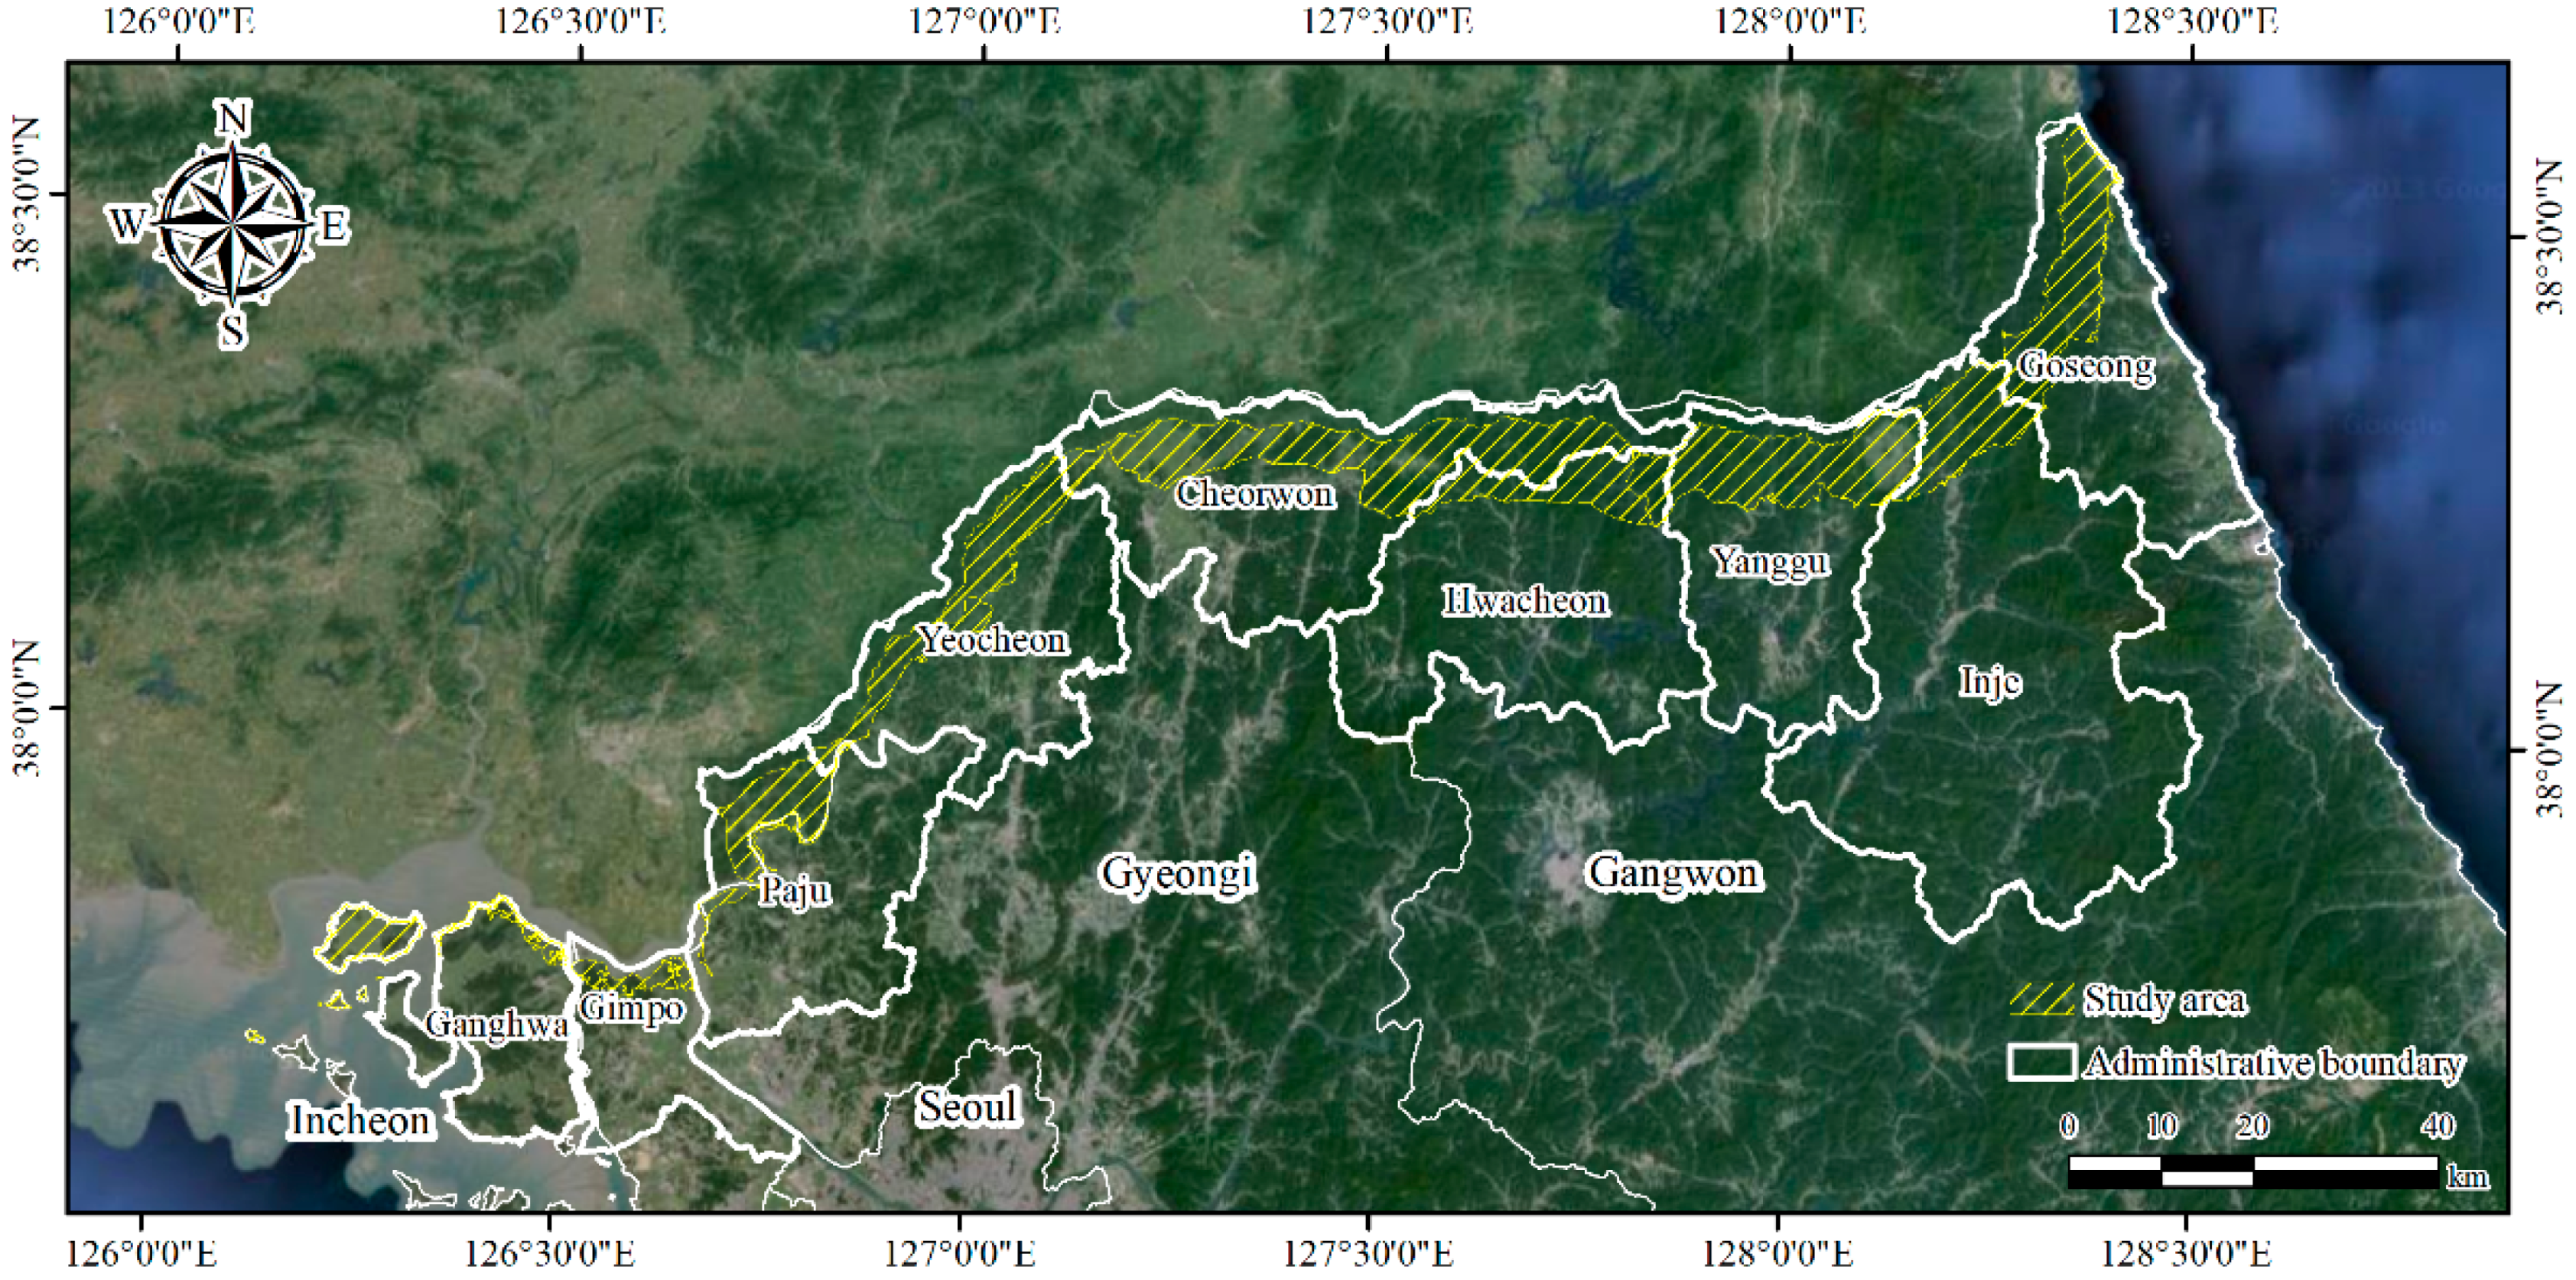
The CCZ was designated by Article 2(1) of the “Special Act on Management of Mountainous Districts North of The Civilian Control Line” and Article 5(2) of the “Protection of Military Bases and Installations Act” [28]. It extends over an area of ~120,000 ha, accounting for ~18% of the administrative divisions intersecting the DMZ area (Figure 1). The CCZ has a broad distribution of land use for military facilities due to its intrinsic nature but recent years have seen steady LULC changes related to the development of tourist attractions [29]. The Gyeonggi-do part of the CCZ is flat and low (<300 m above sea level) with intensive agricultural activities taking place on a residential or commuting basis. The Gangwon-do part of the CCZ is predominantly mountainous (≥1000 m above sea level) except for Cheorwon-gun [30].
2.2. Materials
We used three types of data for our analyses: remote sensing (RS), geographic and statistical (Table 1). The RS data consisted of 2010 and 2016 land cover maps produced by applying maximum-likelihood supervised classification to medium-resolution satellite imagery using Envi 5.0 software. The land cover map was made using three scenes (path 116/row 33, path 116/row 34, path 115/row 33) and using Landsat 5 and Landsat 8 images. The classification accuracy of the land cover map was as follows, Overall accuracy: 93, Kappa: 0.91 in 2010, Overall accuracy: 943, Kappa: 0.92. The classification accuracy of the land cover maps was high in both overall accuracy and Kappa. Reference data for the accuracy of classification maps were used for field survey and Google earth images. The geographic data consisted of geographic information system (GIS) layers for administrative boundaries map provided by the Korea Forestry Service, the Southern Limit Line provided by the Gangwon Development Research Institute and CCZ, Digital topographic maps (scale of 1:25,000), cadastral valuation data and local population data provided by the Ministry of Land, Infrastructure and Transport. The statistical data consisted of tourist attraction information provided by the Korea Tourism Organization as spatial information. Typical tourist attractions of CCZ are “Unification Observatory”, “DMZ Museum” and “Dam of Peace”.
2.3. Methods
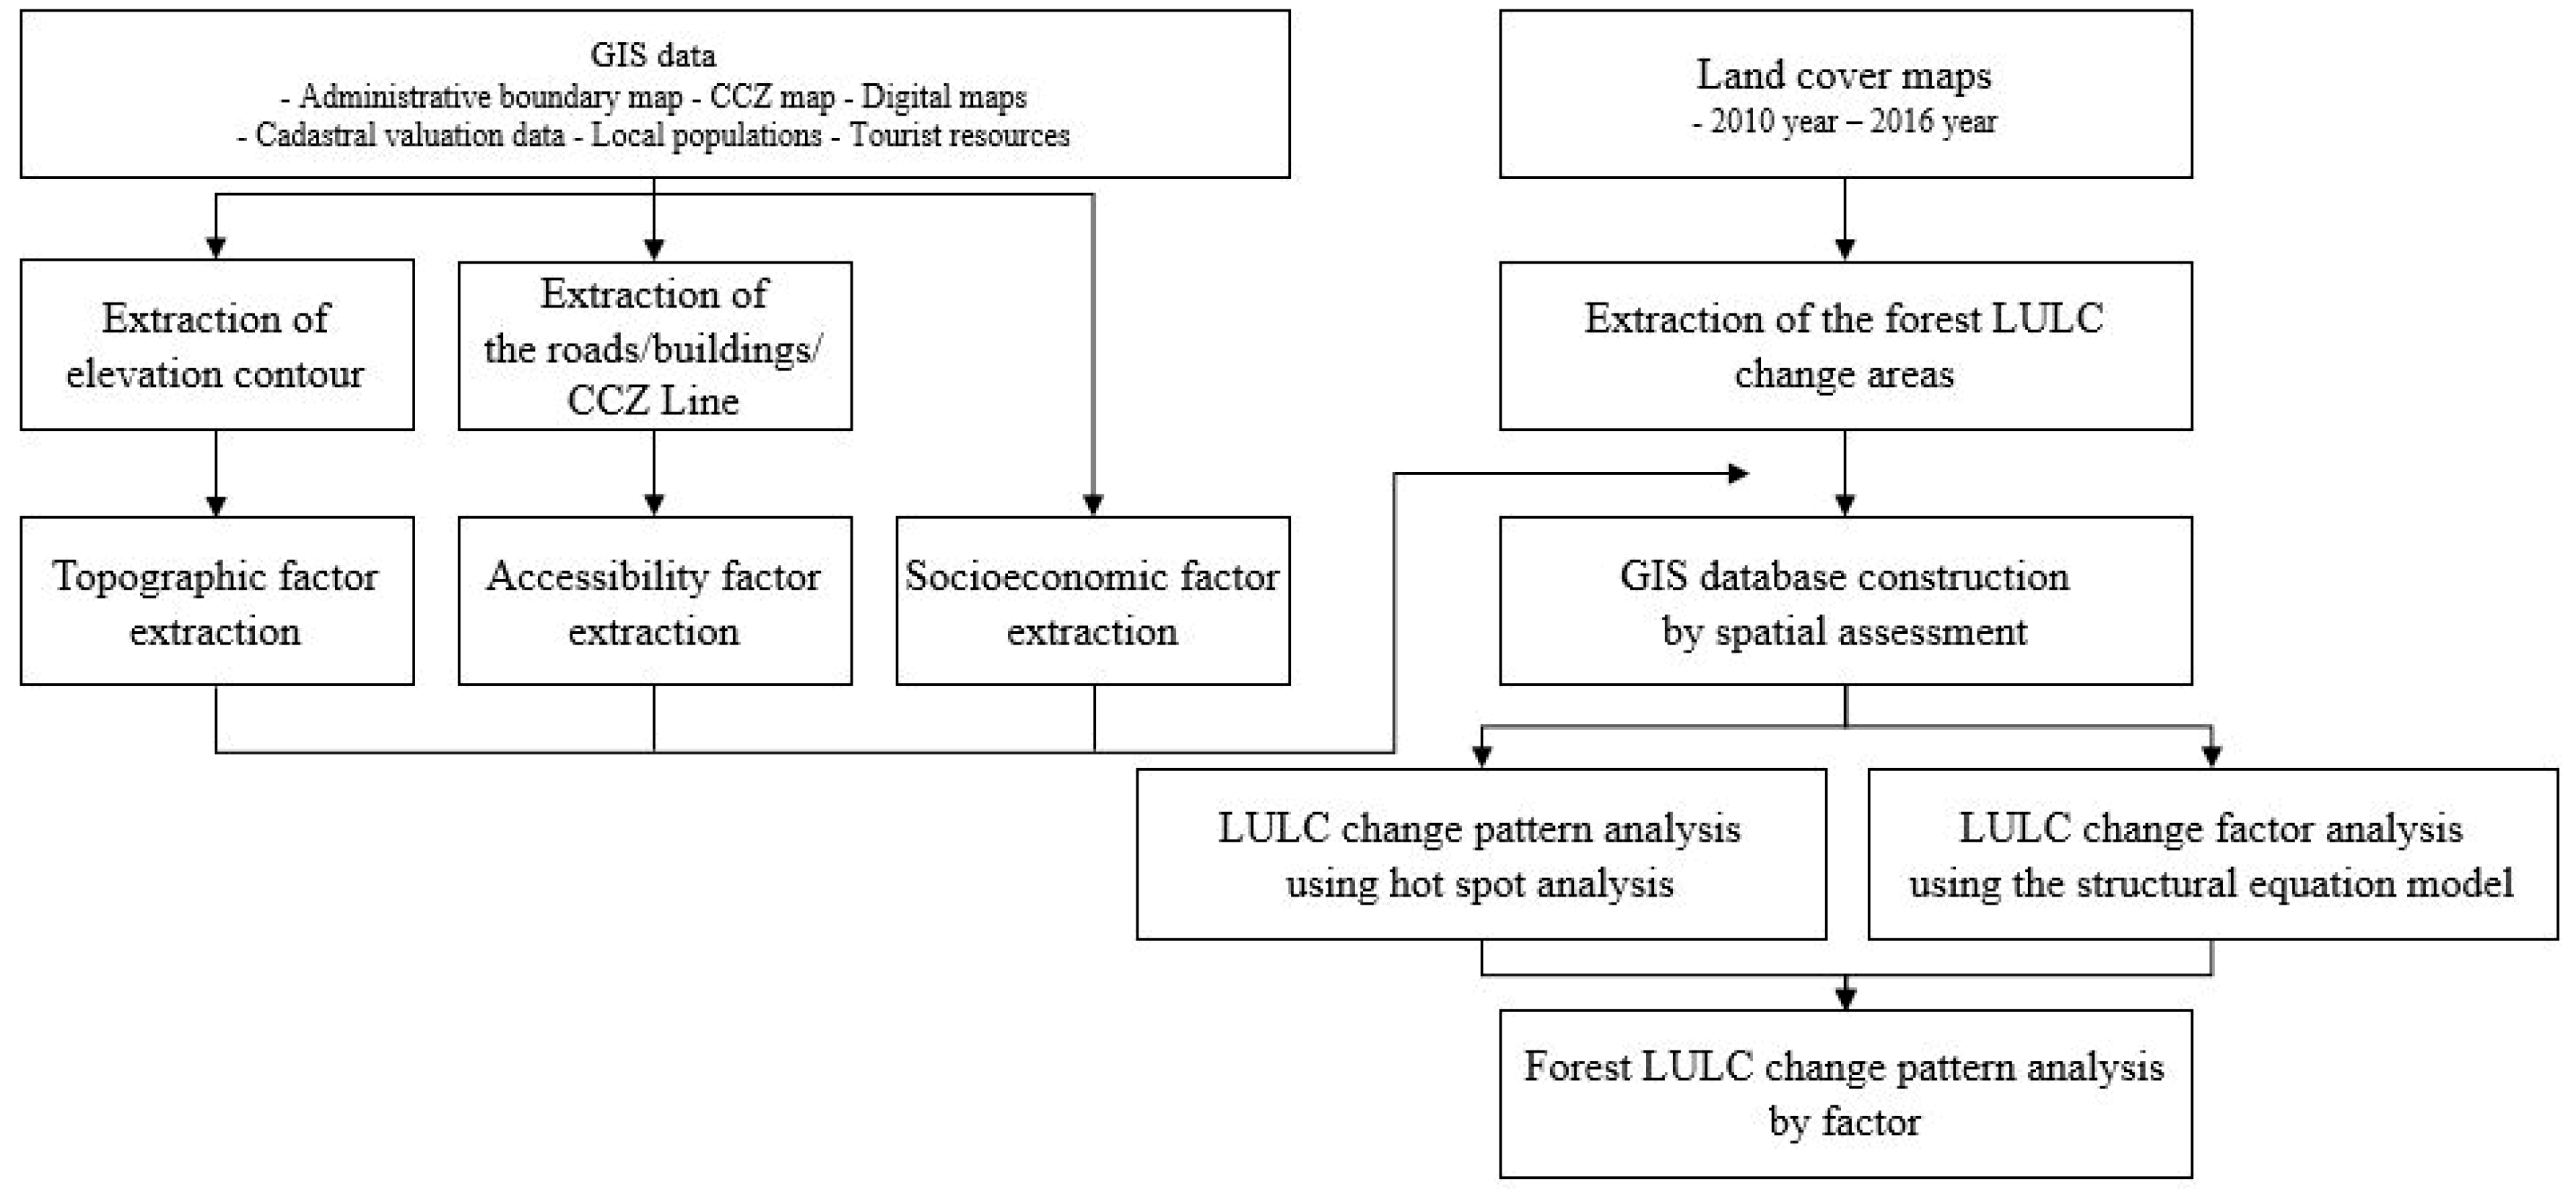
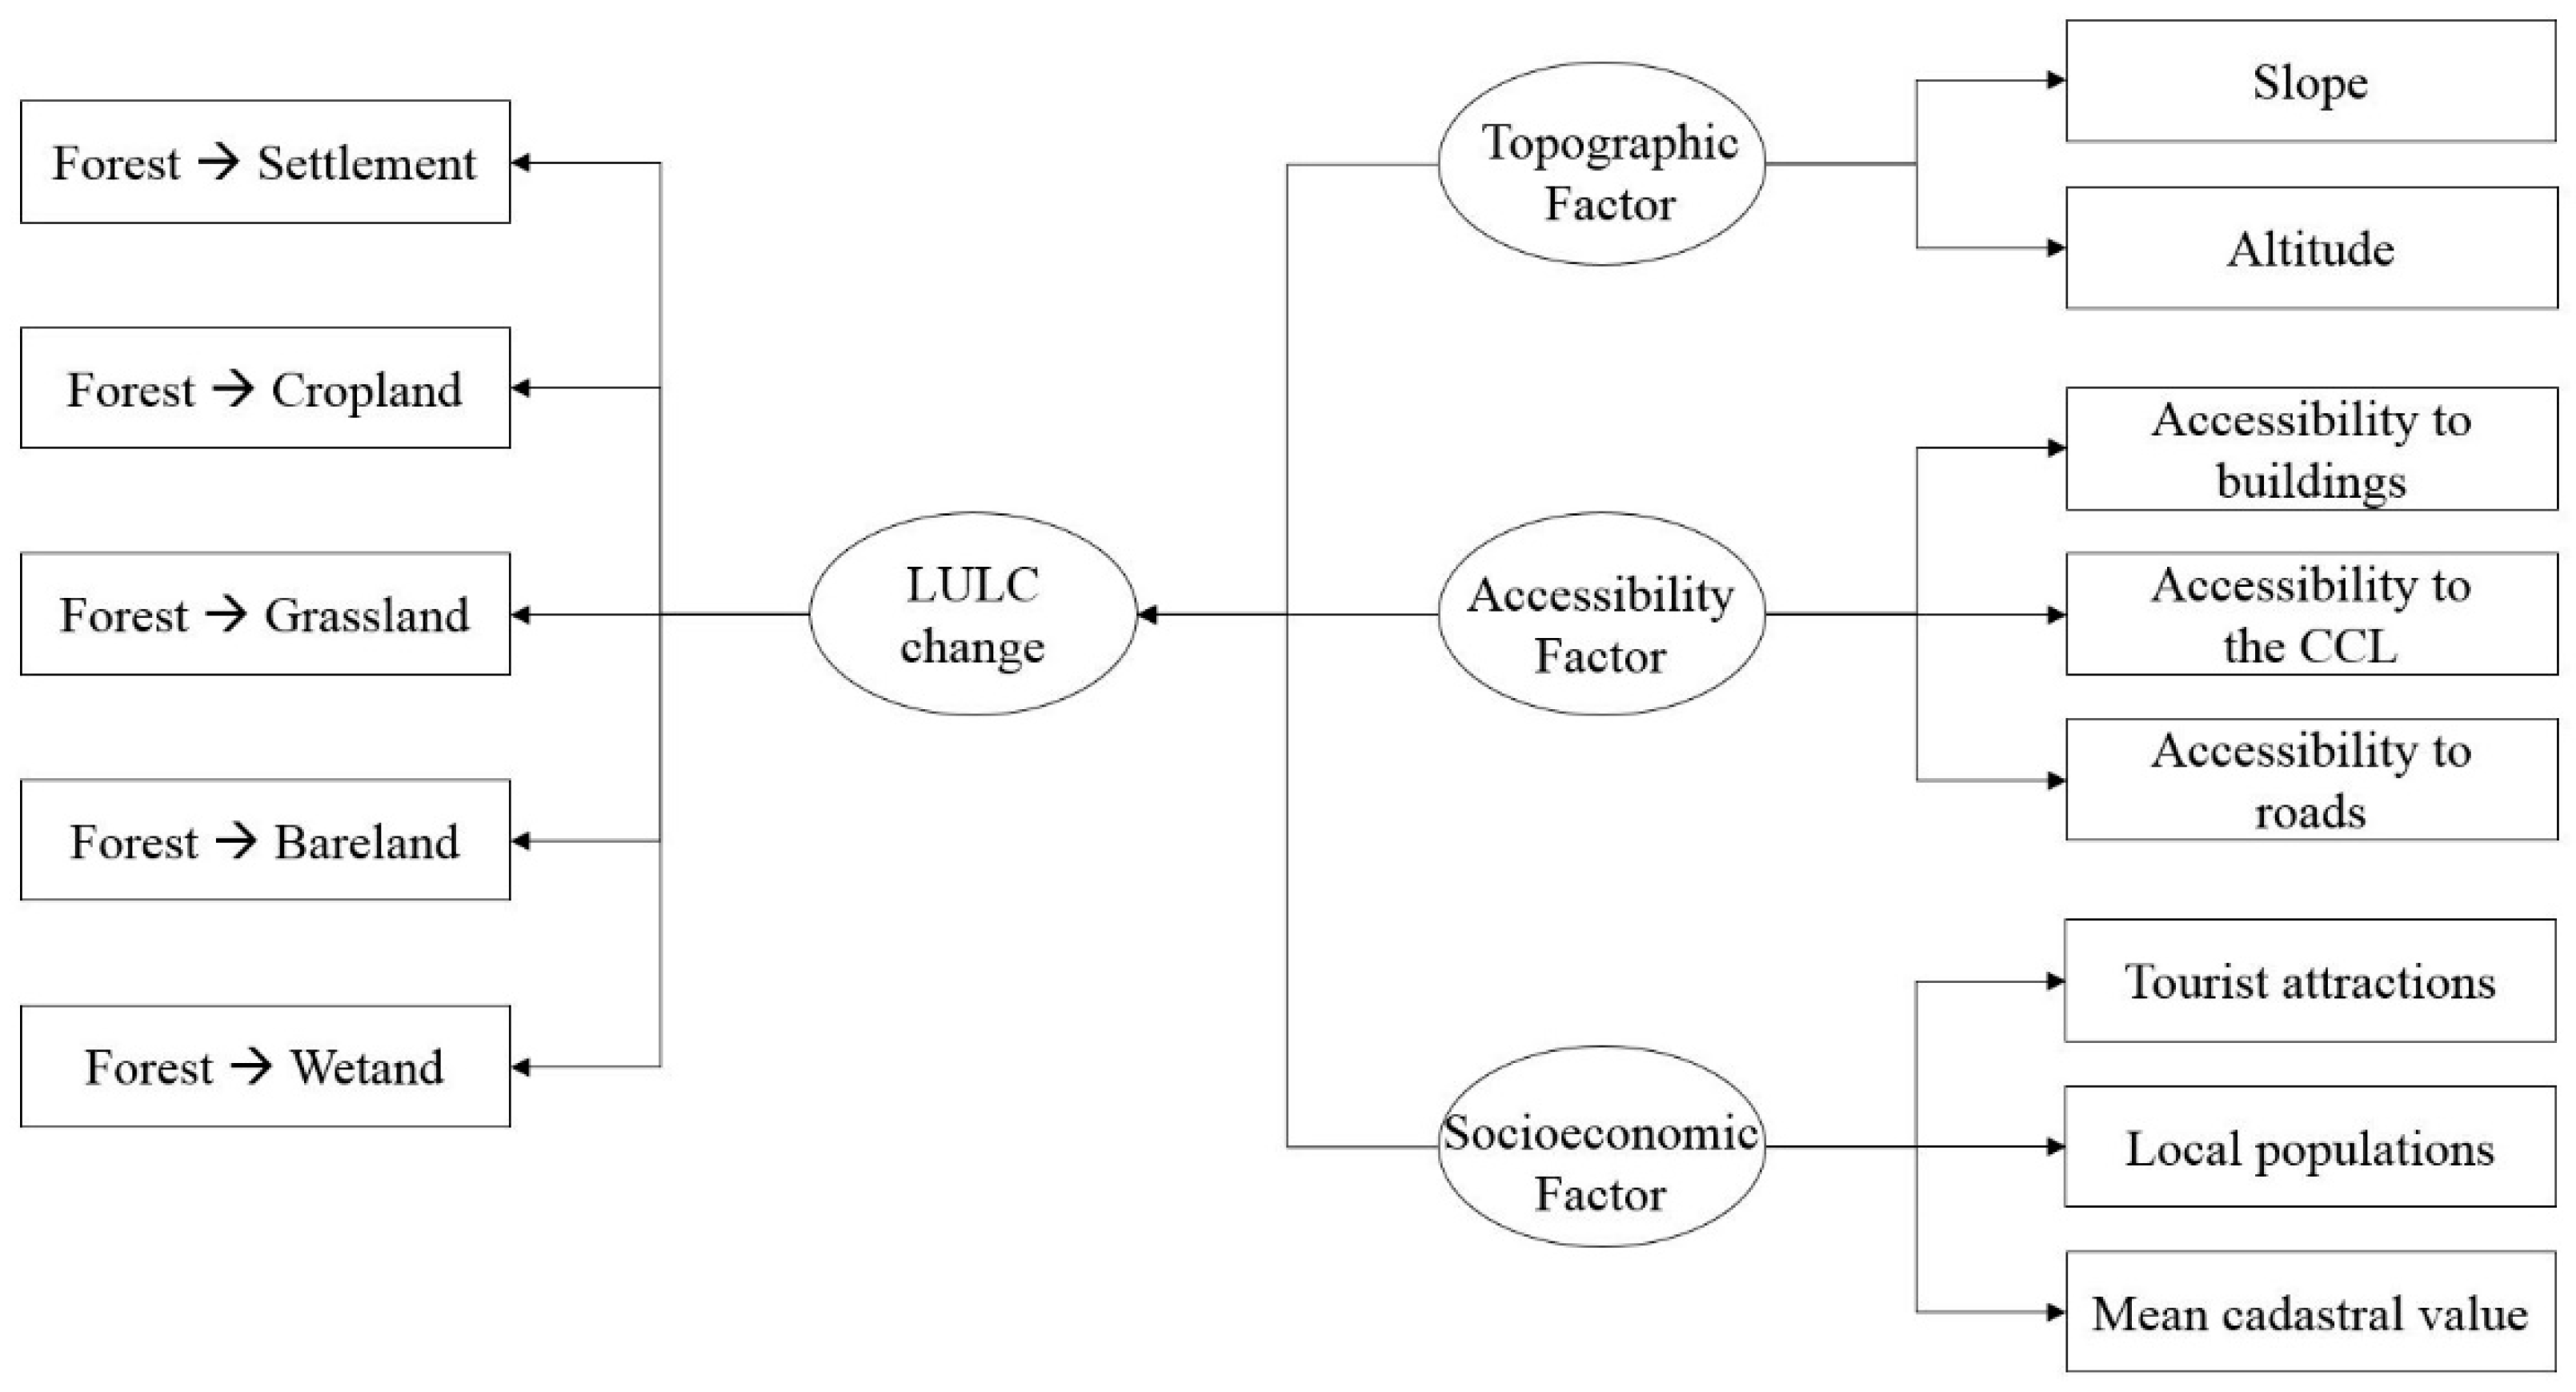
We analyzed the spatial patterns associated with forest LULC change and related factors in an effort to seek efficient ways to achieve the SDGs for forests within the CCZ. Areas that underwent change from forested to non-forest landed (forest change areas) were extracted by superimposing the 2010 and 2016 land-cover maps. A GIS database was then established by spatial assessment along with related change factors such as topography (slope and elevation), accessibility (access to roads, buildings and the CCZ) and socioeconomic characteristics (cadastral value, local population and tourist attractions). This was then used for the forest change pattern and change factor analyses using Hot spot analysis and SEM, respectively (Figure 2). Both assessments used the basic geographic unit ri (village), “ri” is the smallest administrative division in South Korea.
2.3.1. Forest LULC Change Spatial Analysis Using Spatial Statistics
In this study, spatial autocorrelation analysis (Hotspot analysis) was performed to analyze the pattern of forest land changing to other land.
LULC change is not independent of the surrounding environment, being influenced by adjacent land [20,31]. Therefore, we quantified interactions with surrounding areas using spatial autocorrelation, which measures the spatial similarity and/or dissimilarity of different regions in terms of proximity [32].
We used the Getis-Ord Gi*, developed by [18], as the spatial autocorrelation index. This statistic calculates the proportions of the reference and neighboring spaces’ values and measures the degree of spatial association between physical objects based on the concentration of weights. Getis-Ord Gi* expresses spatial clusters of high and low values as hot and cold spots, respectively. When distribution patterns are randomly dispersed (without clusters) the values are close to zero [33].
- = attribute value of
- = spatial weight (spatial weight matrix value)
- = standard deviation
- n = total number of cases
- and are adjacent = 1
- and are not adjacent = 0
2.3.2. Forest LULC Change Factor Analysis Using SEM
SEM Background and Selection of Variables
SEM combines confirmatory factor analysis and path analysis, stemming from psychometrics and econometrics, respectively, through which causation and correlation between variables can be tested [34]. SEM is useful for estimating complicated causal relationships among multiple variables and simultaneously explaining direct and indirect effects between observable and unobservable (“latent”) variables [35,36]. Furthermore, inter-variable relationships are displayed in schematic diagrams, allowing intuitive understanding of the analysis results [37]. In this study, SEM-based factor analysis involved multiple steps: selecting measurement variables with the potential to influence forest LULC, performing exploratory factor analysis to assess the inter-variable effects, building a study model based on the relationships among the measurement variables and analyzing the factors for forest LULC change by examining the causal relationships and associations among the variables.
SEMs have a structural component (path analysis) and a measurement component (factor analysis), in which the causal relationships are shown between dependent (endogenous) and independent (exogenous) variables and latent (constructs or factors) and observed (measured) variables, respectively. In the model we built for this study, the extent of forest LULC change per unit area was used as the measurement (dependent) variable. Latent variables including topographic (elevation (m) and slope (°)), accessibility (m) (to roads, buildings and the CCZ) and socioeconomic (population distribution, tourist attractions and mean cadastral value (W)) factors were selected on the assumption that they could influence LULC change [12,38,39]. Elevation and slope information are constructed using digital topographic maps and accessibility is the distance (Unit: m) from the forest change areas of roads, buildings and CCZ. Population distribution and tourist attractions units are numbers and unit of mean cadastral value is won (W). The input data for these observable variables were calculated as averages by ri, except for tourist attractions, which used the total number. The units of the input variables were homogenized and the final variables selected by means of exploratory factor analysis [40].
SEM Construction and Assessment of Model Fit
Figure 3 presents the SEM for the forest LULC change area. The two left-hand columns show the dependent variables consisting of five measurement variables and one latent variable. The two right-hand columns show the independent variables consisting of three latent variables and eight measurement variables.
The SEM was evaluated using absolute and incremental fit indices (Table 2) to test how well the observed data fit into the model and how closely the measurement and latent variables were related to one another. An absolute fit index tests how well the proposed model predicts the sample covariance matrix and an incremental fit index measures the improvement in fit of the proposed model in comparison with the basic model [34,41].
3. Results and Discussion
3.1. Spatial Pattern Analysis of the Forest Change Area
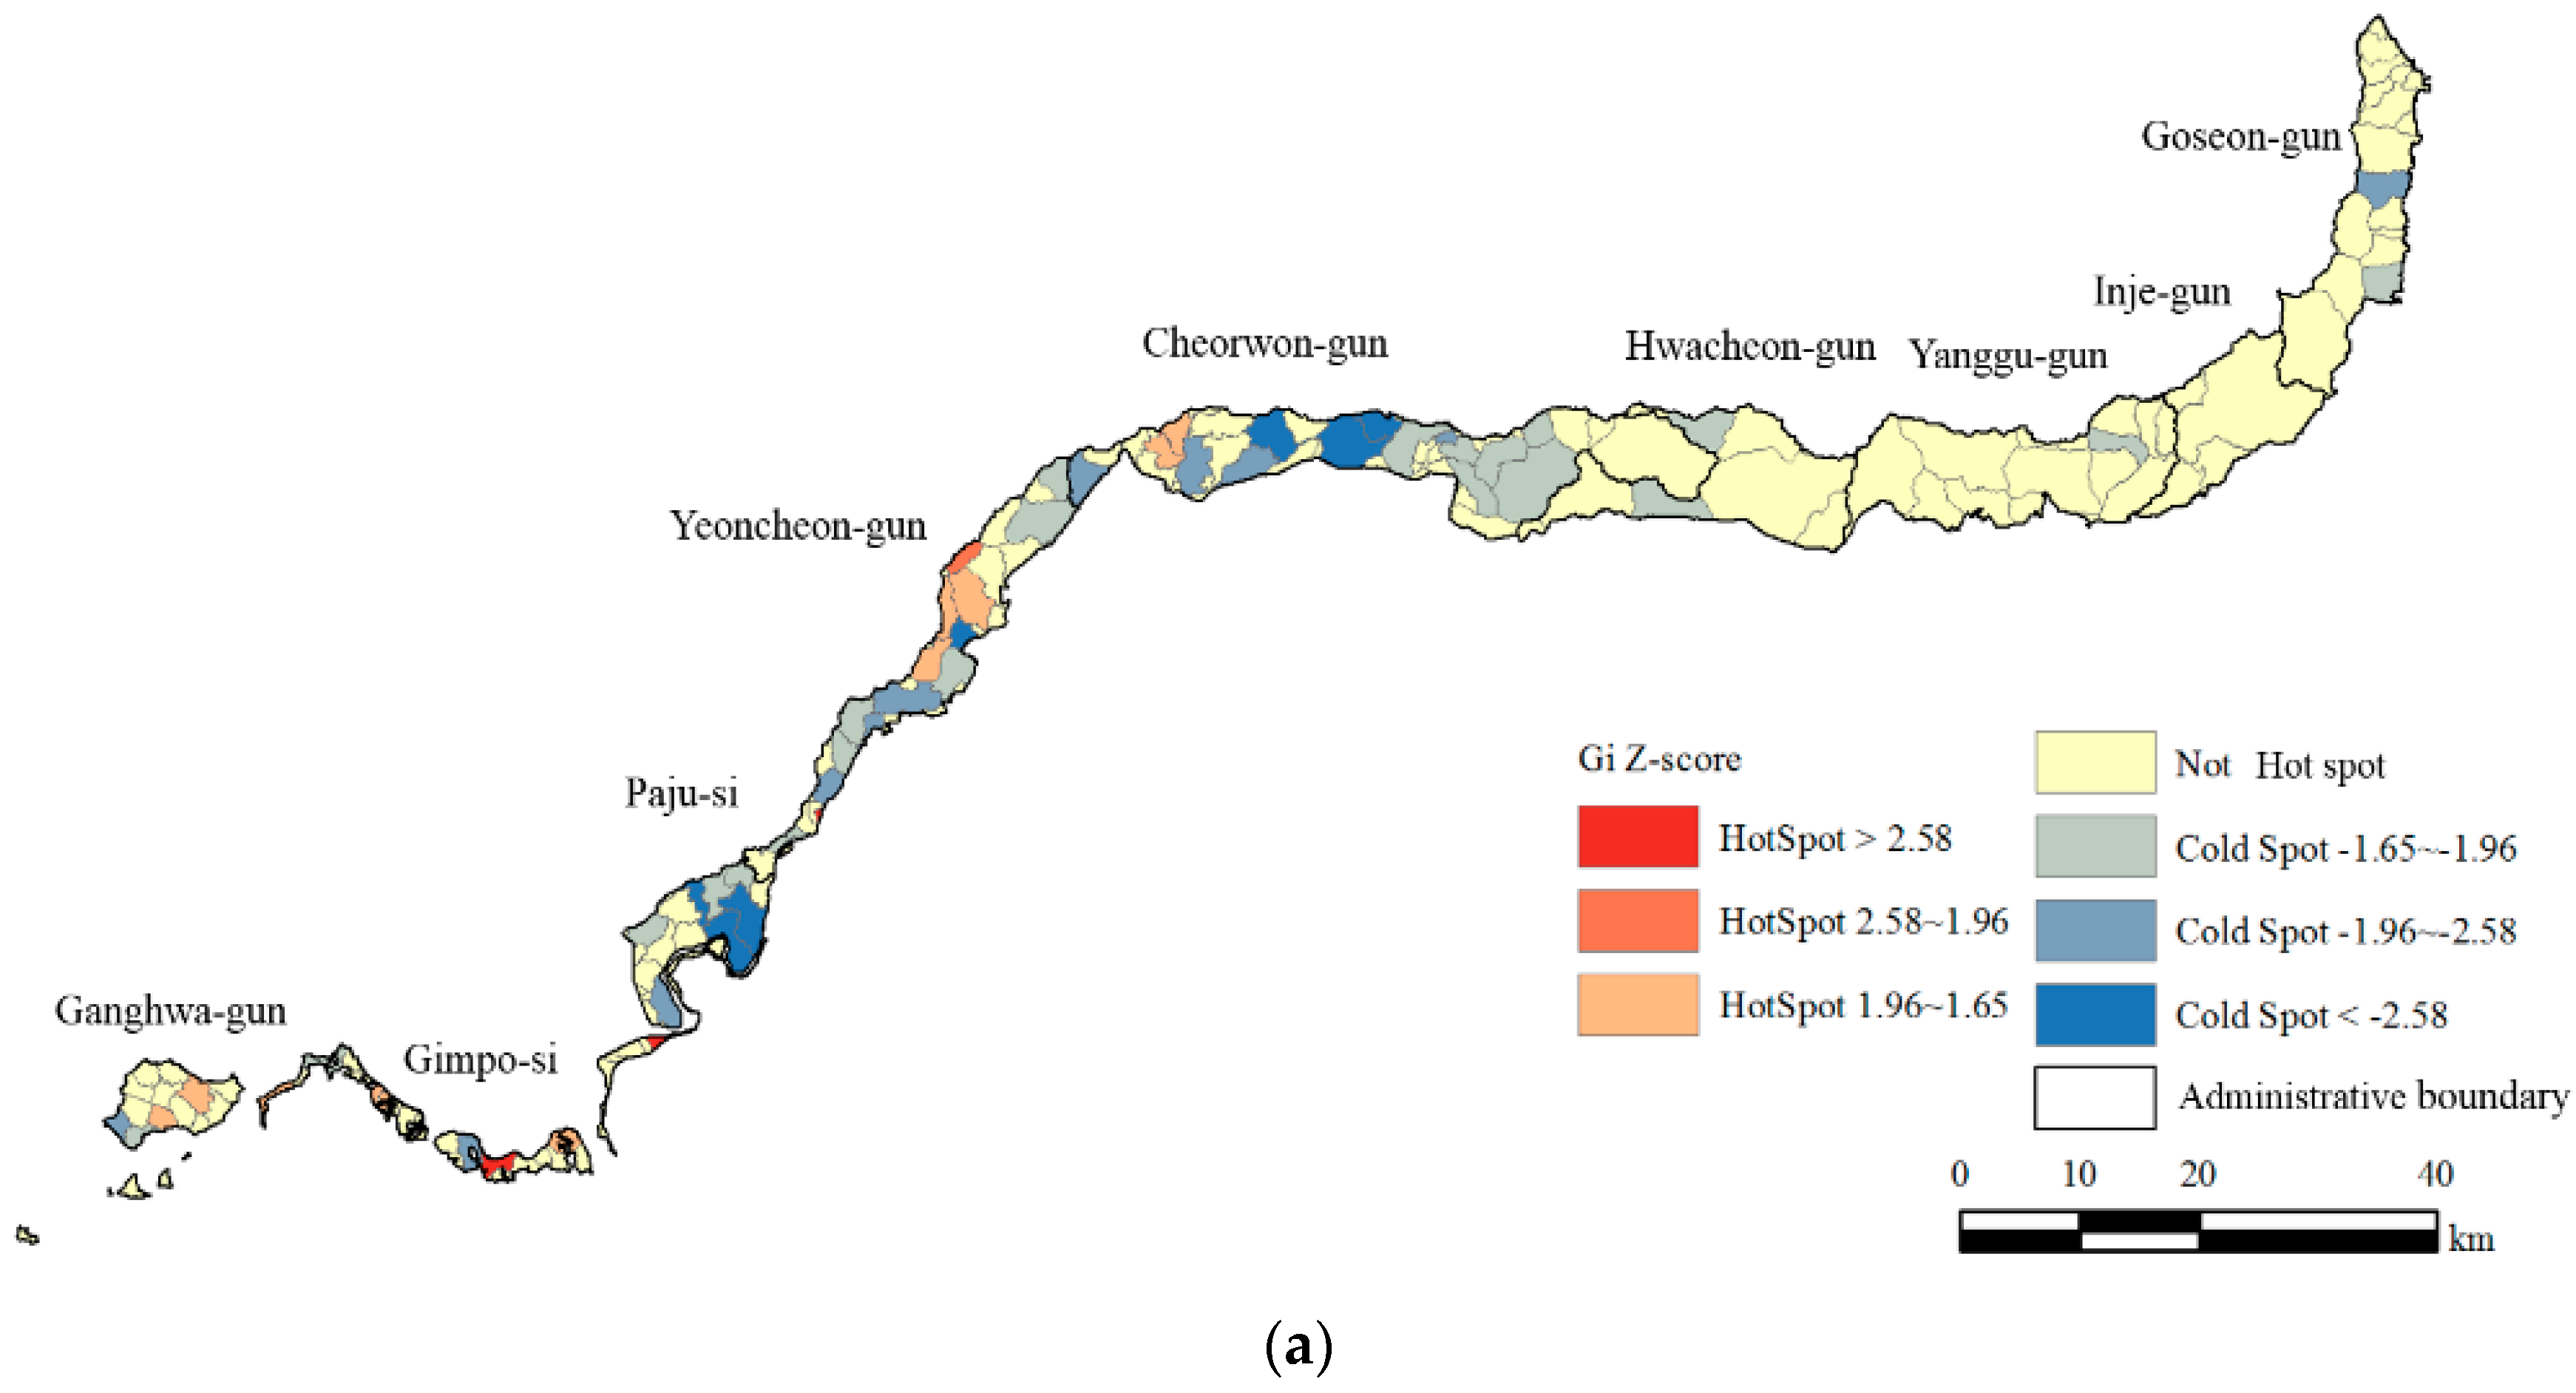
Statistically significant Hot spots for land-use change from forest to settlement in Ganghwa-gun, Gimpo-si, Yeoncheon-gun and Cheorwon-gun (Figure 4a). Jogang-ri in Gimpo-si and Naka-ri in Yeoncheon-gun displayed especially high Hot spot densities with Z-scores of 3.40 and 3.02, respectively. Frequent intense clusters of cold spots in Paju-si, Yeoncheon-gun and Cheorwon-gun also indicated the high rate of change from forest to settlement in these areas. Sung et al. [29] noted that deforestation in the CCZ is primarily due to the development of cropland and villages in Gyeonggi-do and the western part of Gangwon-do. Similarly, Lee [42] reported that the distribution density of villages in cities and counties with Hot spots accounted for about 74% of the overall distribution of villages in the CCZ. Village construction and expansion is especially intensive in Paju-si, Yeoncheon-gun and Cheorwon-gun, where agricultural activities are allowed on a residential or commuting basis.
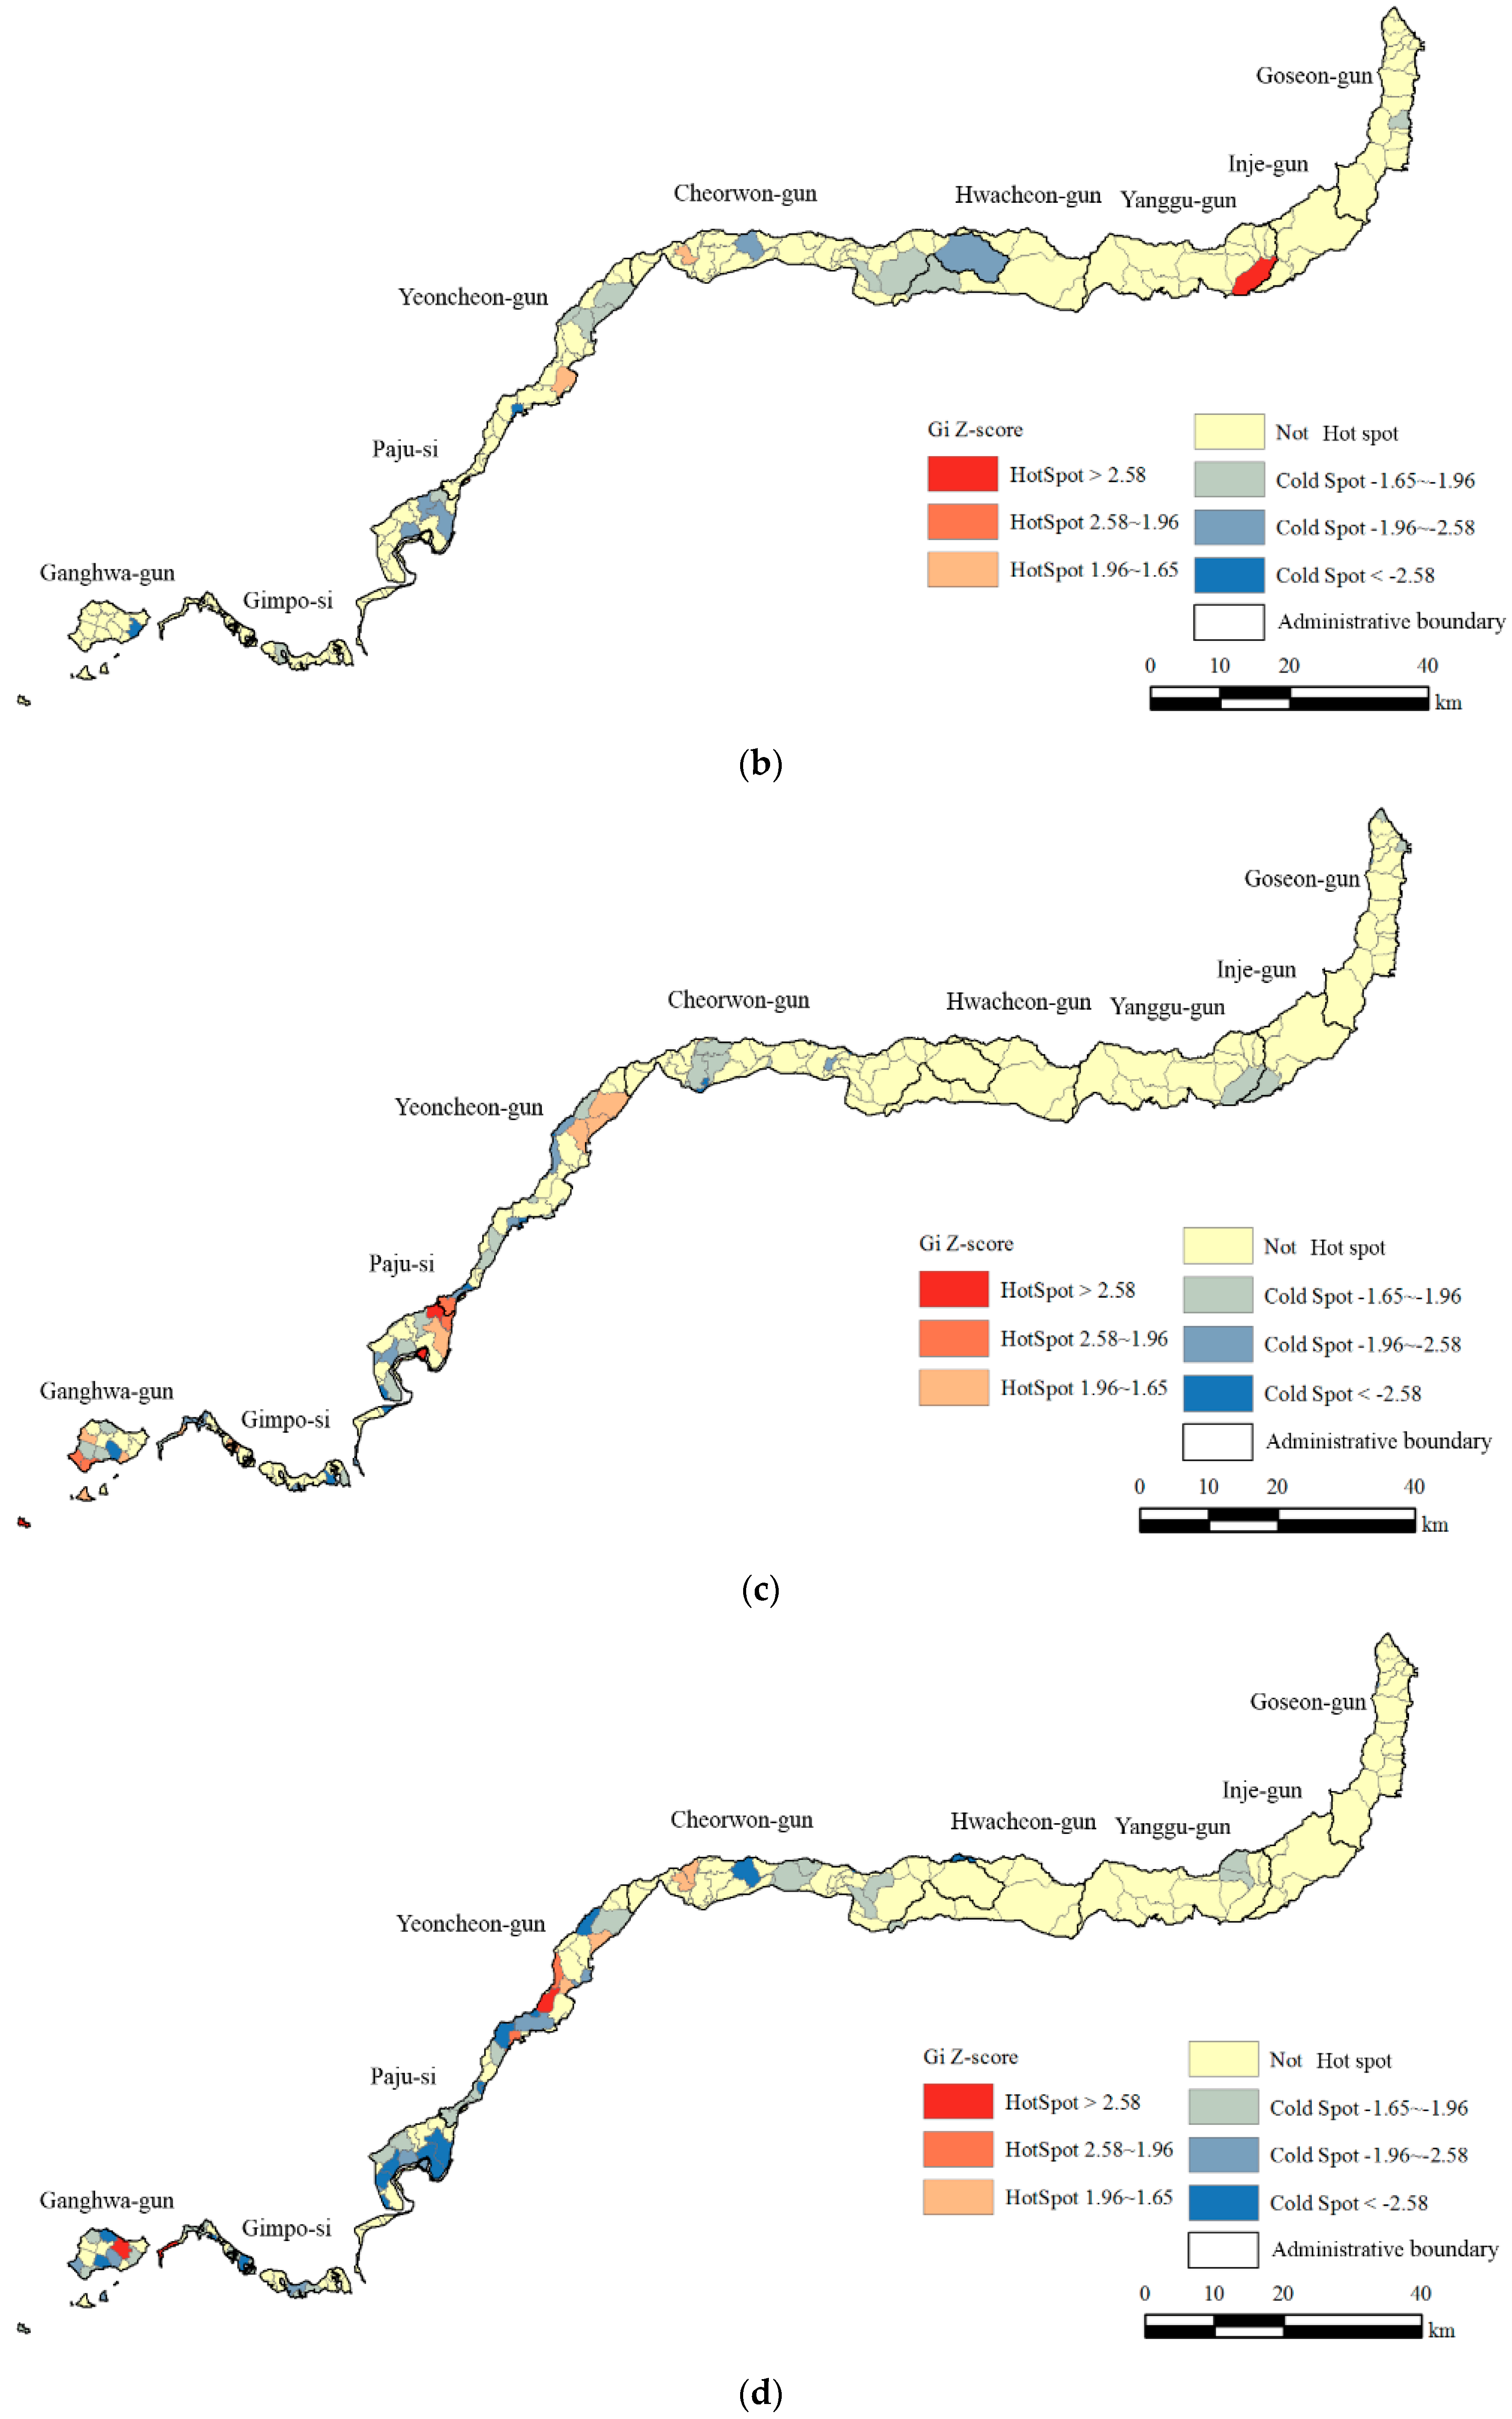
Statistically significant Hot spots for land-use change from forest to cropland t in Gangnae-ri in Yeoncheon-gun, Woechon-ri in Cheorwon-gun and Mandae-ri in Yanggu-gun (Figure 4b). The latter displayed an especially high Hot spot density with a Z-score of 4.24. Hae’an-myeon and the surrounding area are characterized by intensive farming, with cropland accounting for 37.2% of the total area. Agricultural activities in this area are also diversifying into flowers, decorative plants, fruits and so forth, which continues to drive the conversion of forest into fields and orchards [43]. Park and Nam [44] reported on the continuously increasing land used for ginseng cultivation in this area since it hosted the “Gaeseong Ginseng Festival” in 2005. Sung et al. [29] also noted that expanding rice paddies and fields are a major cause of deforestation and emphasized that ginseng cultivation fields not only damage the primarily affected terrain but also cause secondary damage to surrounding terrain, weakening soils and degrading other vegetation. The increasing damage to forest edges in affected areas of Ganghwa-gun, Paju-si and Yeoncheon-gun can thus be attributed to the active ginseng cultivation operations in these areas in conjunction with broadly scattered small-scale agricultural land intermingled with forest.
Statistically significant Hot spots for land-use change from forest to grassland in Ganghwa-gun, Paju-si and Yeoncheon-gun (Figure 4c). The highest Hot spot densities by Z-score occurred in Cho-ri and Banjeong-ri in Paju-si and Majeon-ri and Dapgok-ri in Yeoncheon-gun (Figure 4c).
Statistically significant Hot spots for land-use change from forest to bare land in Ganghwa-gun, Yeoncheon-gun and Cheorwon-gun (Figure 4d). High-density Hot spots appeared in Gogu-ri in Ganghwa-gun and Hwoengsan-ri in Yeoncheon-gun (Z-scores: 3.94 and 3.59, respectively). Song et al. [45] reported that the LULC change rate was rapidly increasing after the government announced its “Master Plan for Border Area Land Use Development” in 2011. “Master Plan for Border Area Land Use Development” is a plan announced by the Ministry of the Interior in 2011. This plan sets out the vision and goals for the development of CCZ. However, because this plan prioritizes development, forest researchers are worried that this plan will increase deforestation and degradation. Sung et al. [29] reported on continuous illegal clearing of trees and vegetation for soybean and ginseng cultivation in Yeoncheon-gun and Cheorwon-gun. The change from forest to bare land within the CCZ from Ganghwa-gun to Cheorwon-gun is thus ascribable to such land-use projects and illegal cropland development.
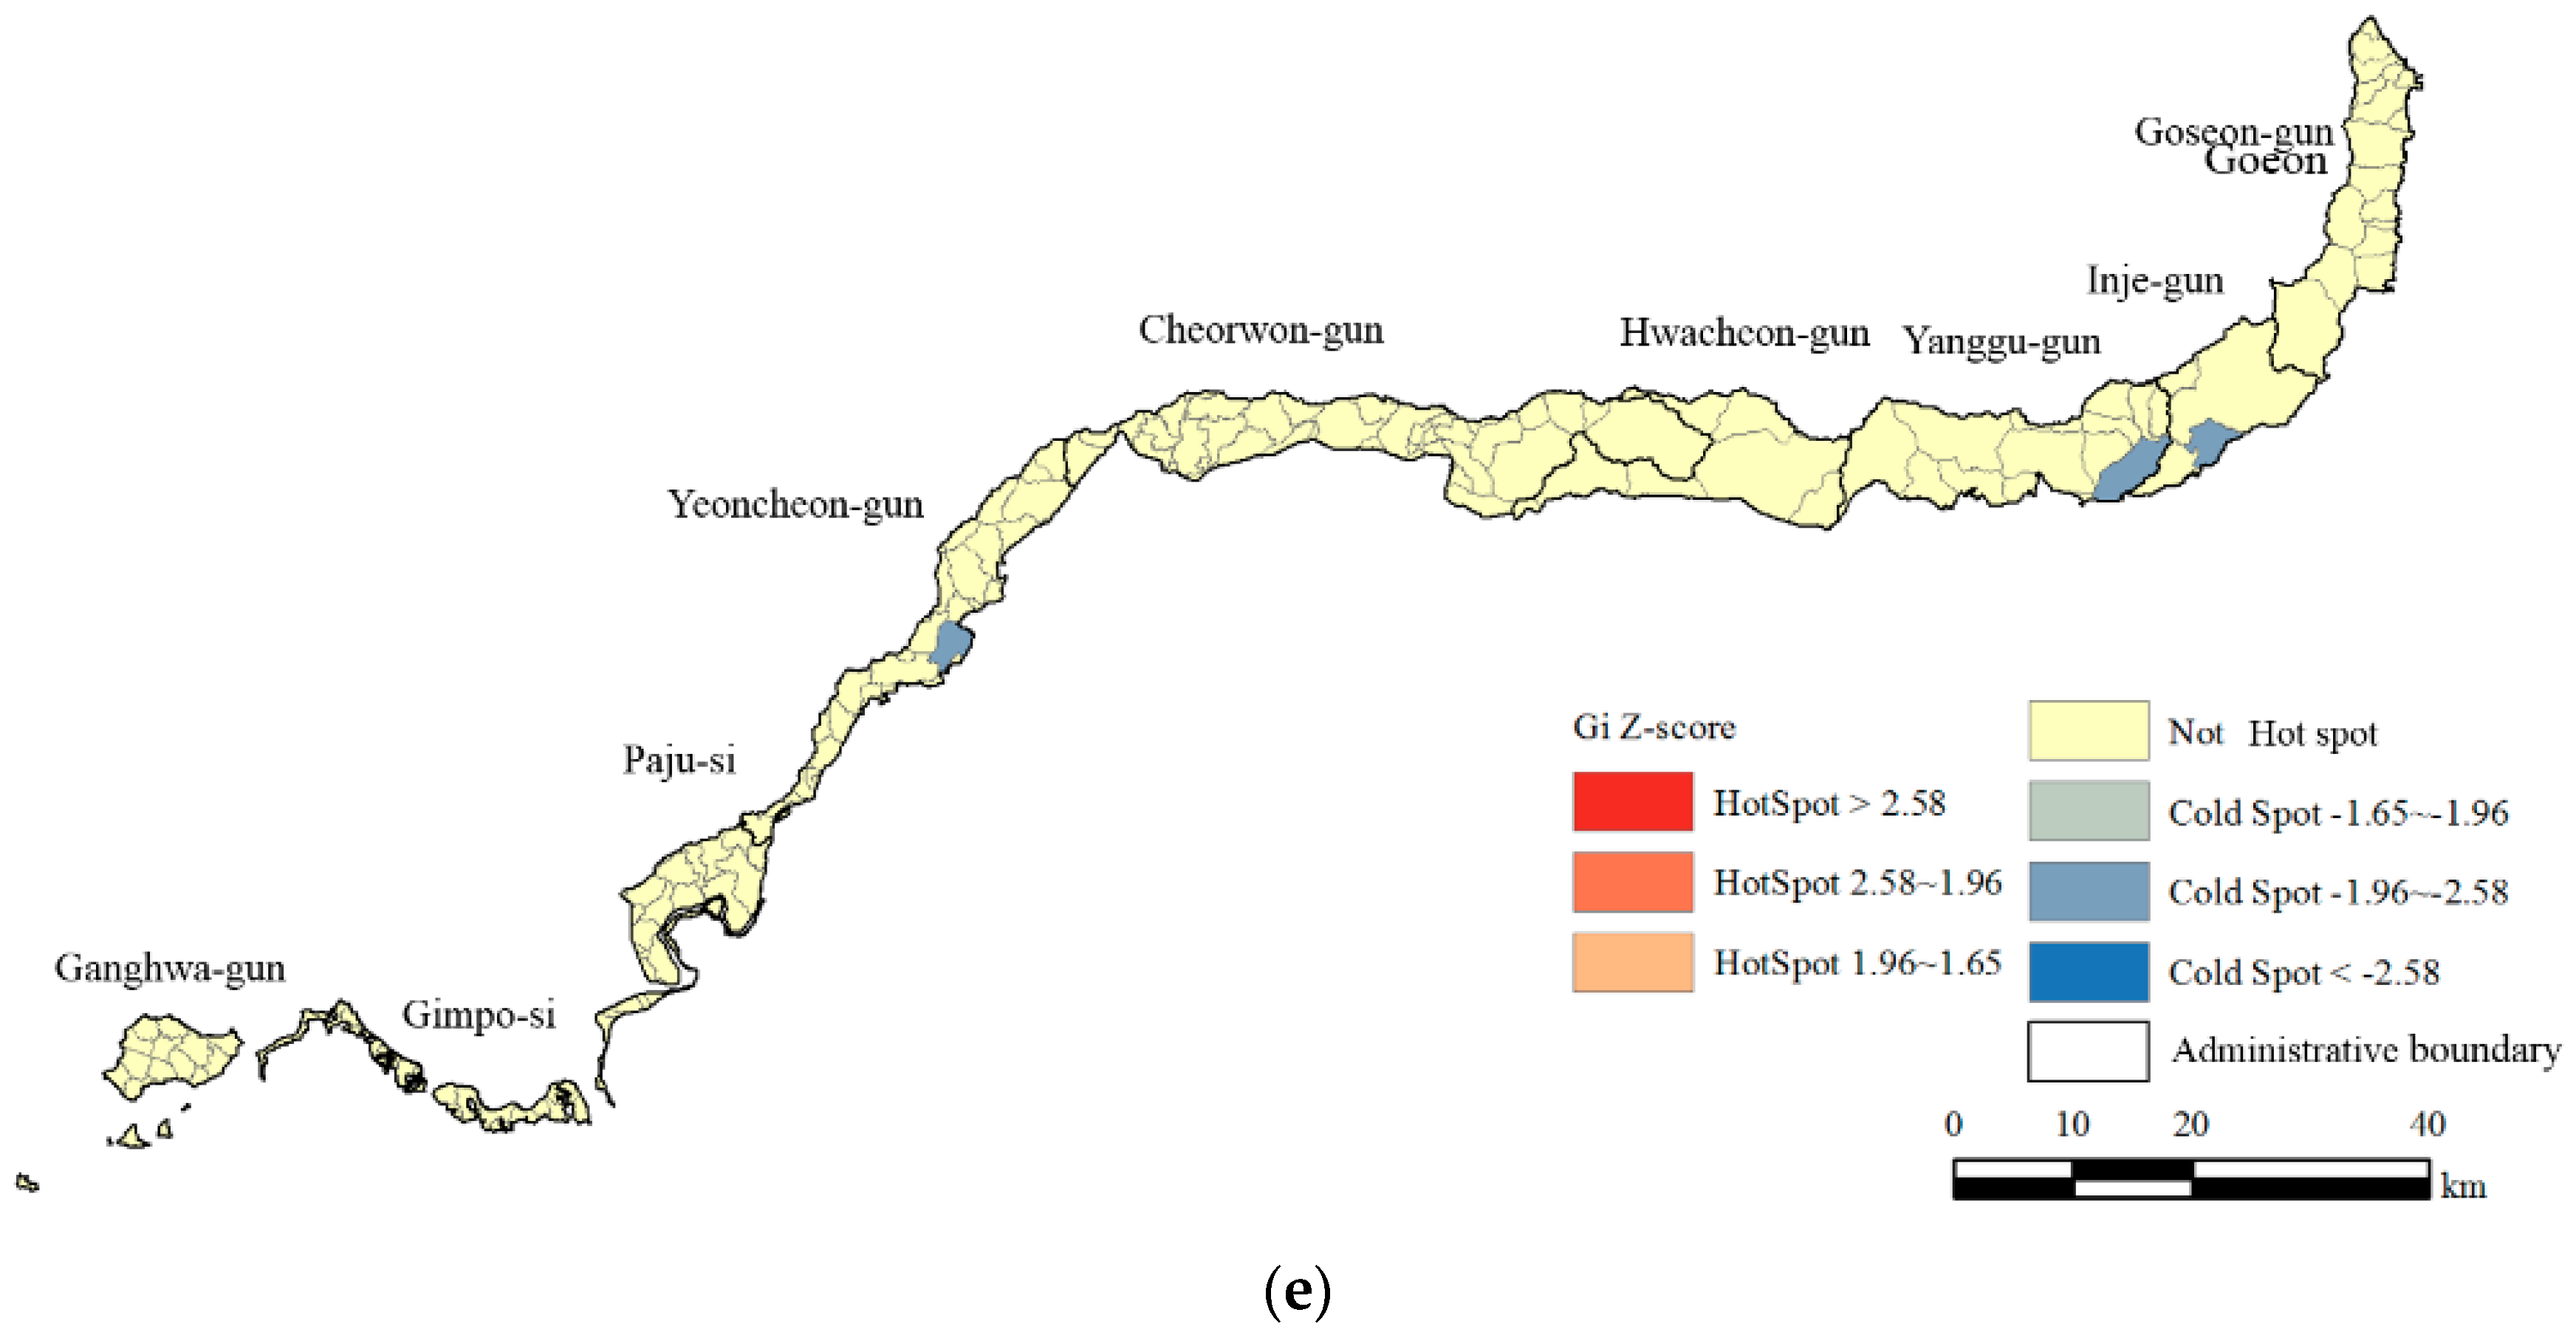
No Hot spots appeared in the spatial pattern indicating change from forest to wetland but cold spots appeared in Gangnae-ri in Yeoncheon-gun, Mandae-rin In Yanggu-gun and Seohwa-ri in Inje-gun (Figure 4e). Small-scale increases in wetland were at first assumed to be the result of precipitation but rainfall data for June 2010 and May 2016, the periods corresponding to the RS data used for the analysis, showed insufficient rainfall to cause significant changes in land cover during these periods [46,47]. A conversion of forest to wetland was interpreted as artefact, because no factual evidence was found in the field.
3.2. Determination of Variables by Factor Analysis and SEM Fit Test
Factor analysis is a statistical method used to test the validity of variables to be measured, in which variables with low validity are excluded from analysis or modified [48]. We used the Kaiser-Meyer-Olkin (KMO) test to assess correlations among variables for factor analysis and Bartlett’s Test to determine the suitability of the factor analysis model. In general, a KMO value of 0.9 or above was deemed excellent, 0.8–0.9 good, 0.7–0.8 reasonable and 0.5 or less unacceptable [48]. The KMO and Bartlett’s Test values for this study’s variables were found to be good, at 0.815 and 0.000, respectively, demonstrating the suitability of the model used.
Commonality is the rate at which a specific variable is explained for various factor. Variables with a commonality of less than 0.4 are excluded from the factor analysis [49]. The variables used in this study were found to be suitable for factor analysis with communalities in excess of 0.4 (Table 3). All model fit indices were within acceptable ranges, so the model was judged to be suitable for hypothesis testing and quantifying causal relationships [37] (Table 4).
3.3. Factor Analysis of Forest LULC Change
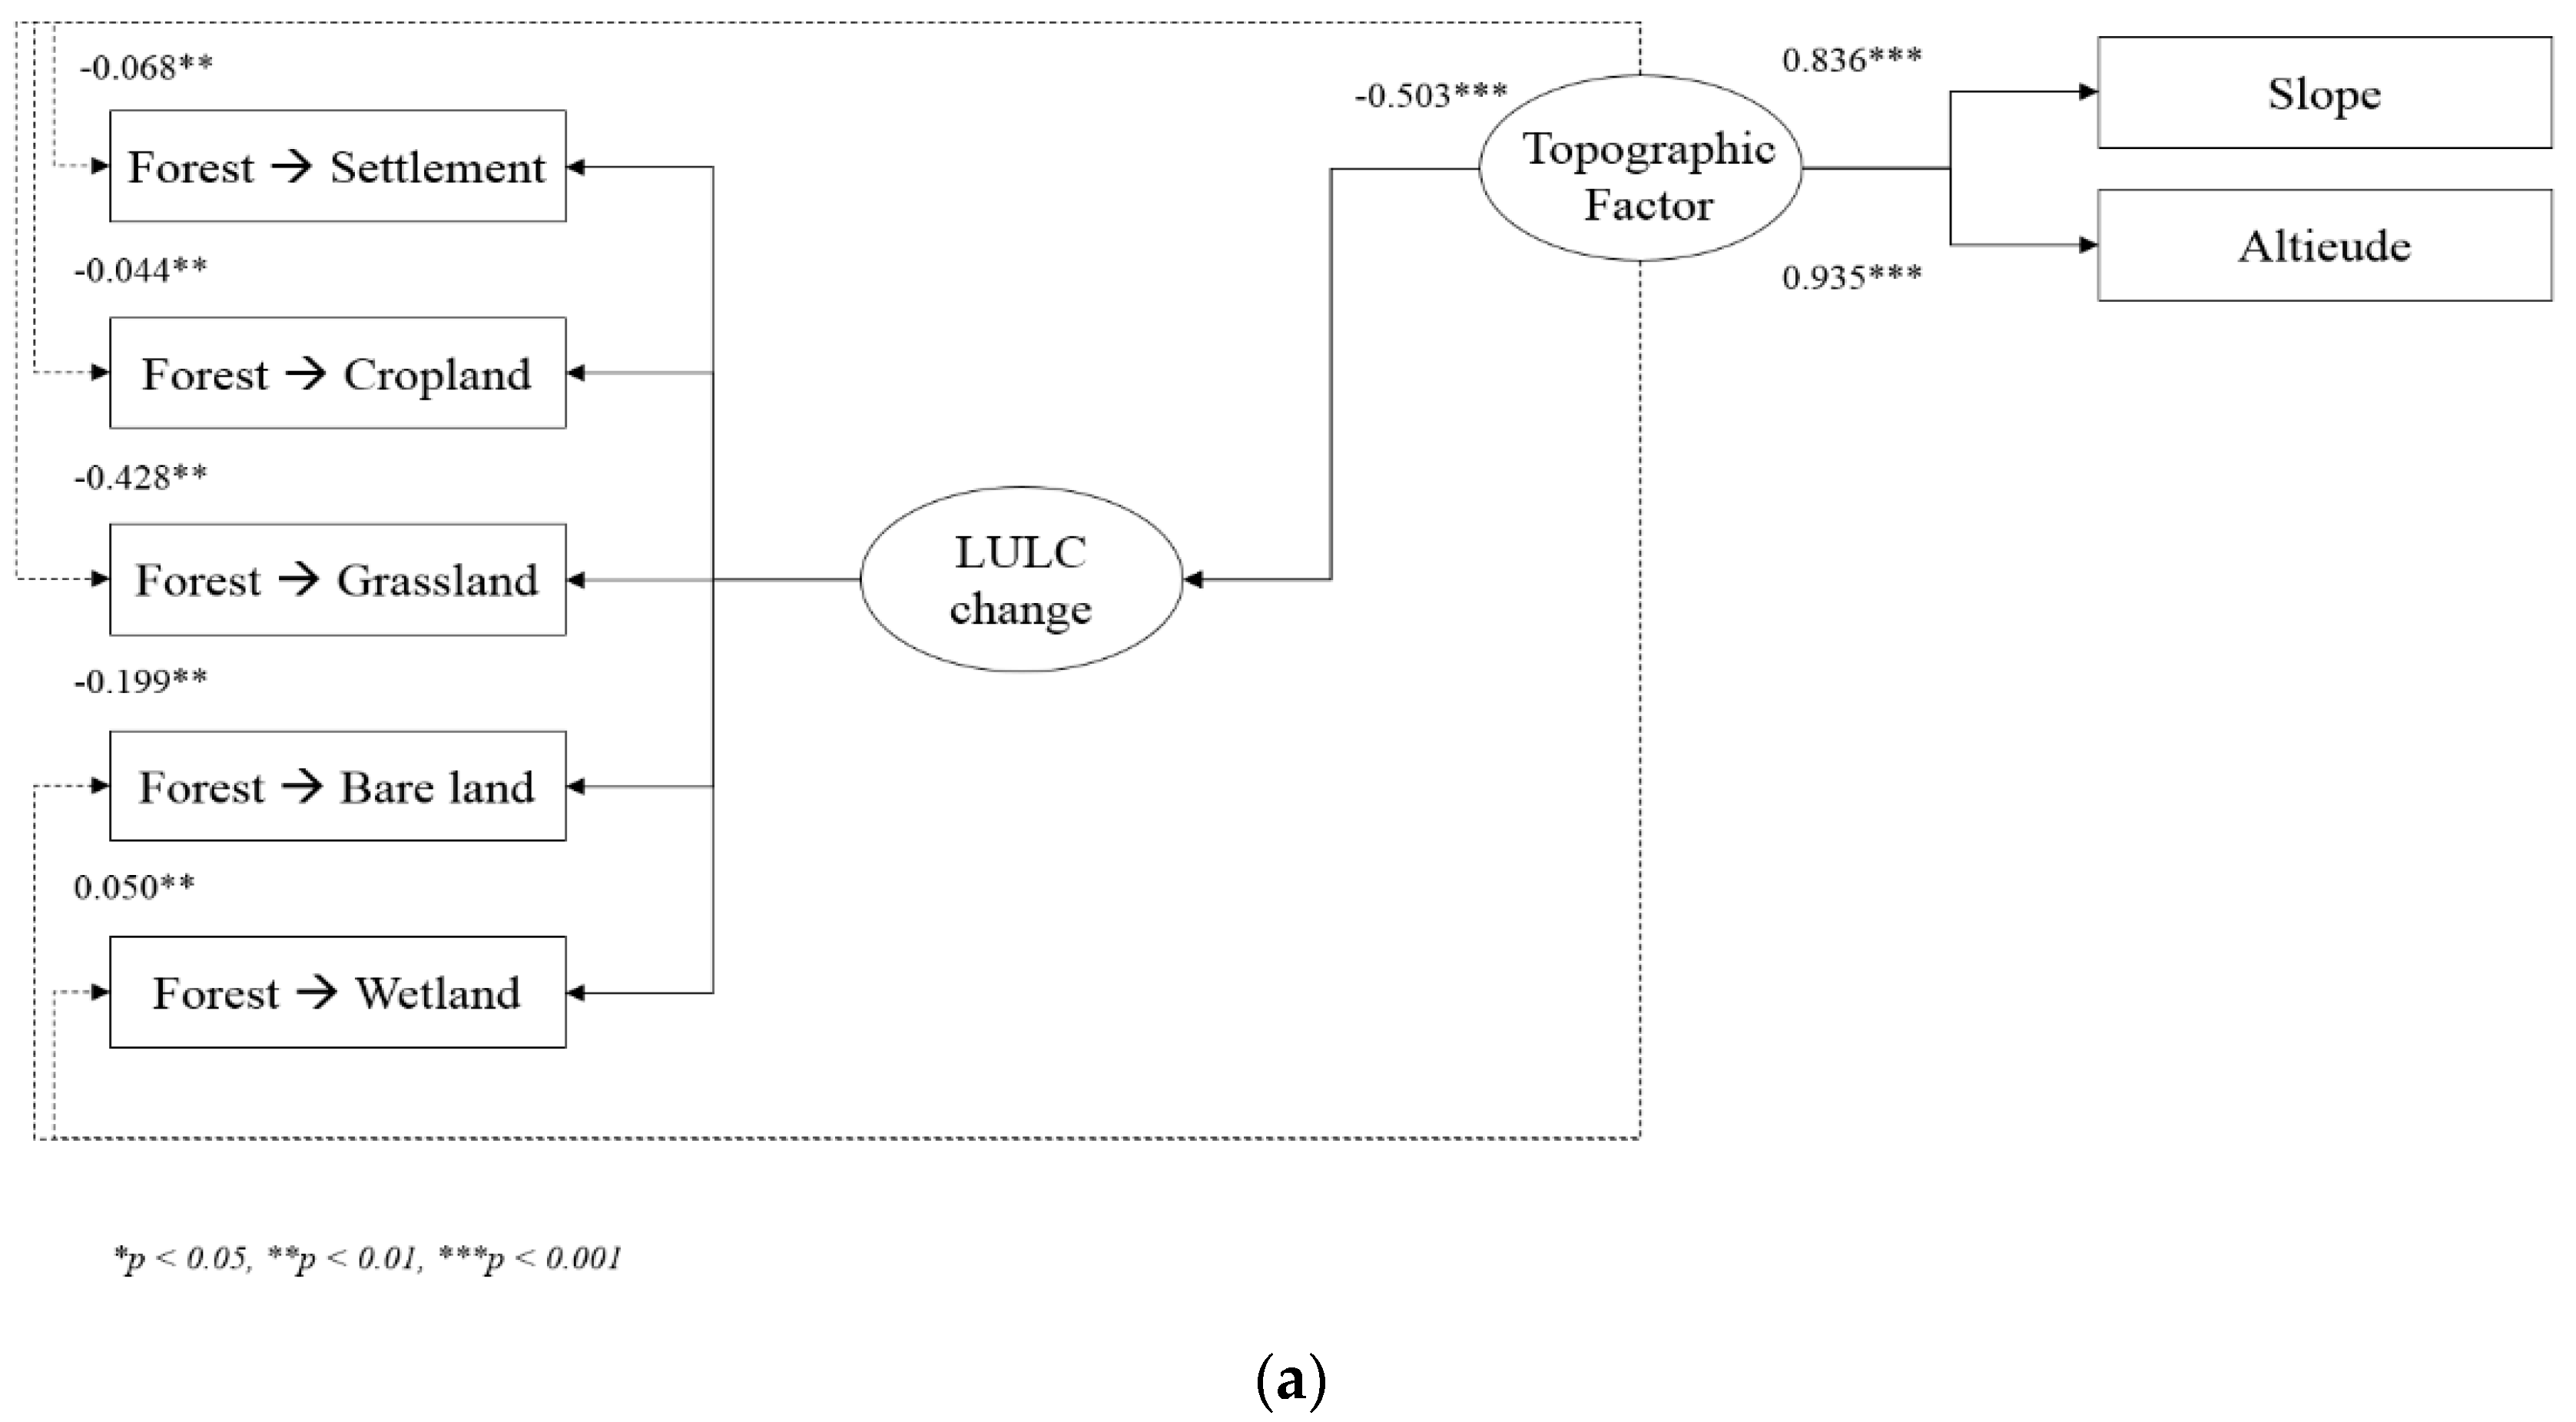
The direct effect of the topographic factor on forest area change was −0.503, implying that topography had an inversely proportional effect on the extent of forest change. The greatest indirect effect was shown in the change to grassland (−0.428). Elevation was found to have a stronger impact (0.935) than slope (Figure 5a). Unlike grassland and bare land, the indirect effects of topography on changes to settlement, cropland and water were found to be minimal. Sung et al. [29] reported that increasing agricultural activity such as Ginseng cultivation is the main cause of vegetation deterioration and increasing bare land in the CCZ. Ganghwa-gun, Paju-si and Yeoncheon-gun were reported to be particularly affected by intensive agricultural activities. This is consistent with the factor analysis result that changes to grassland and bare land were more intense in the low-slope and low- elevation regions of the western CCZ.
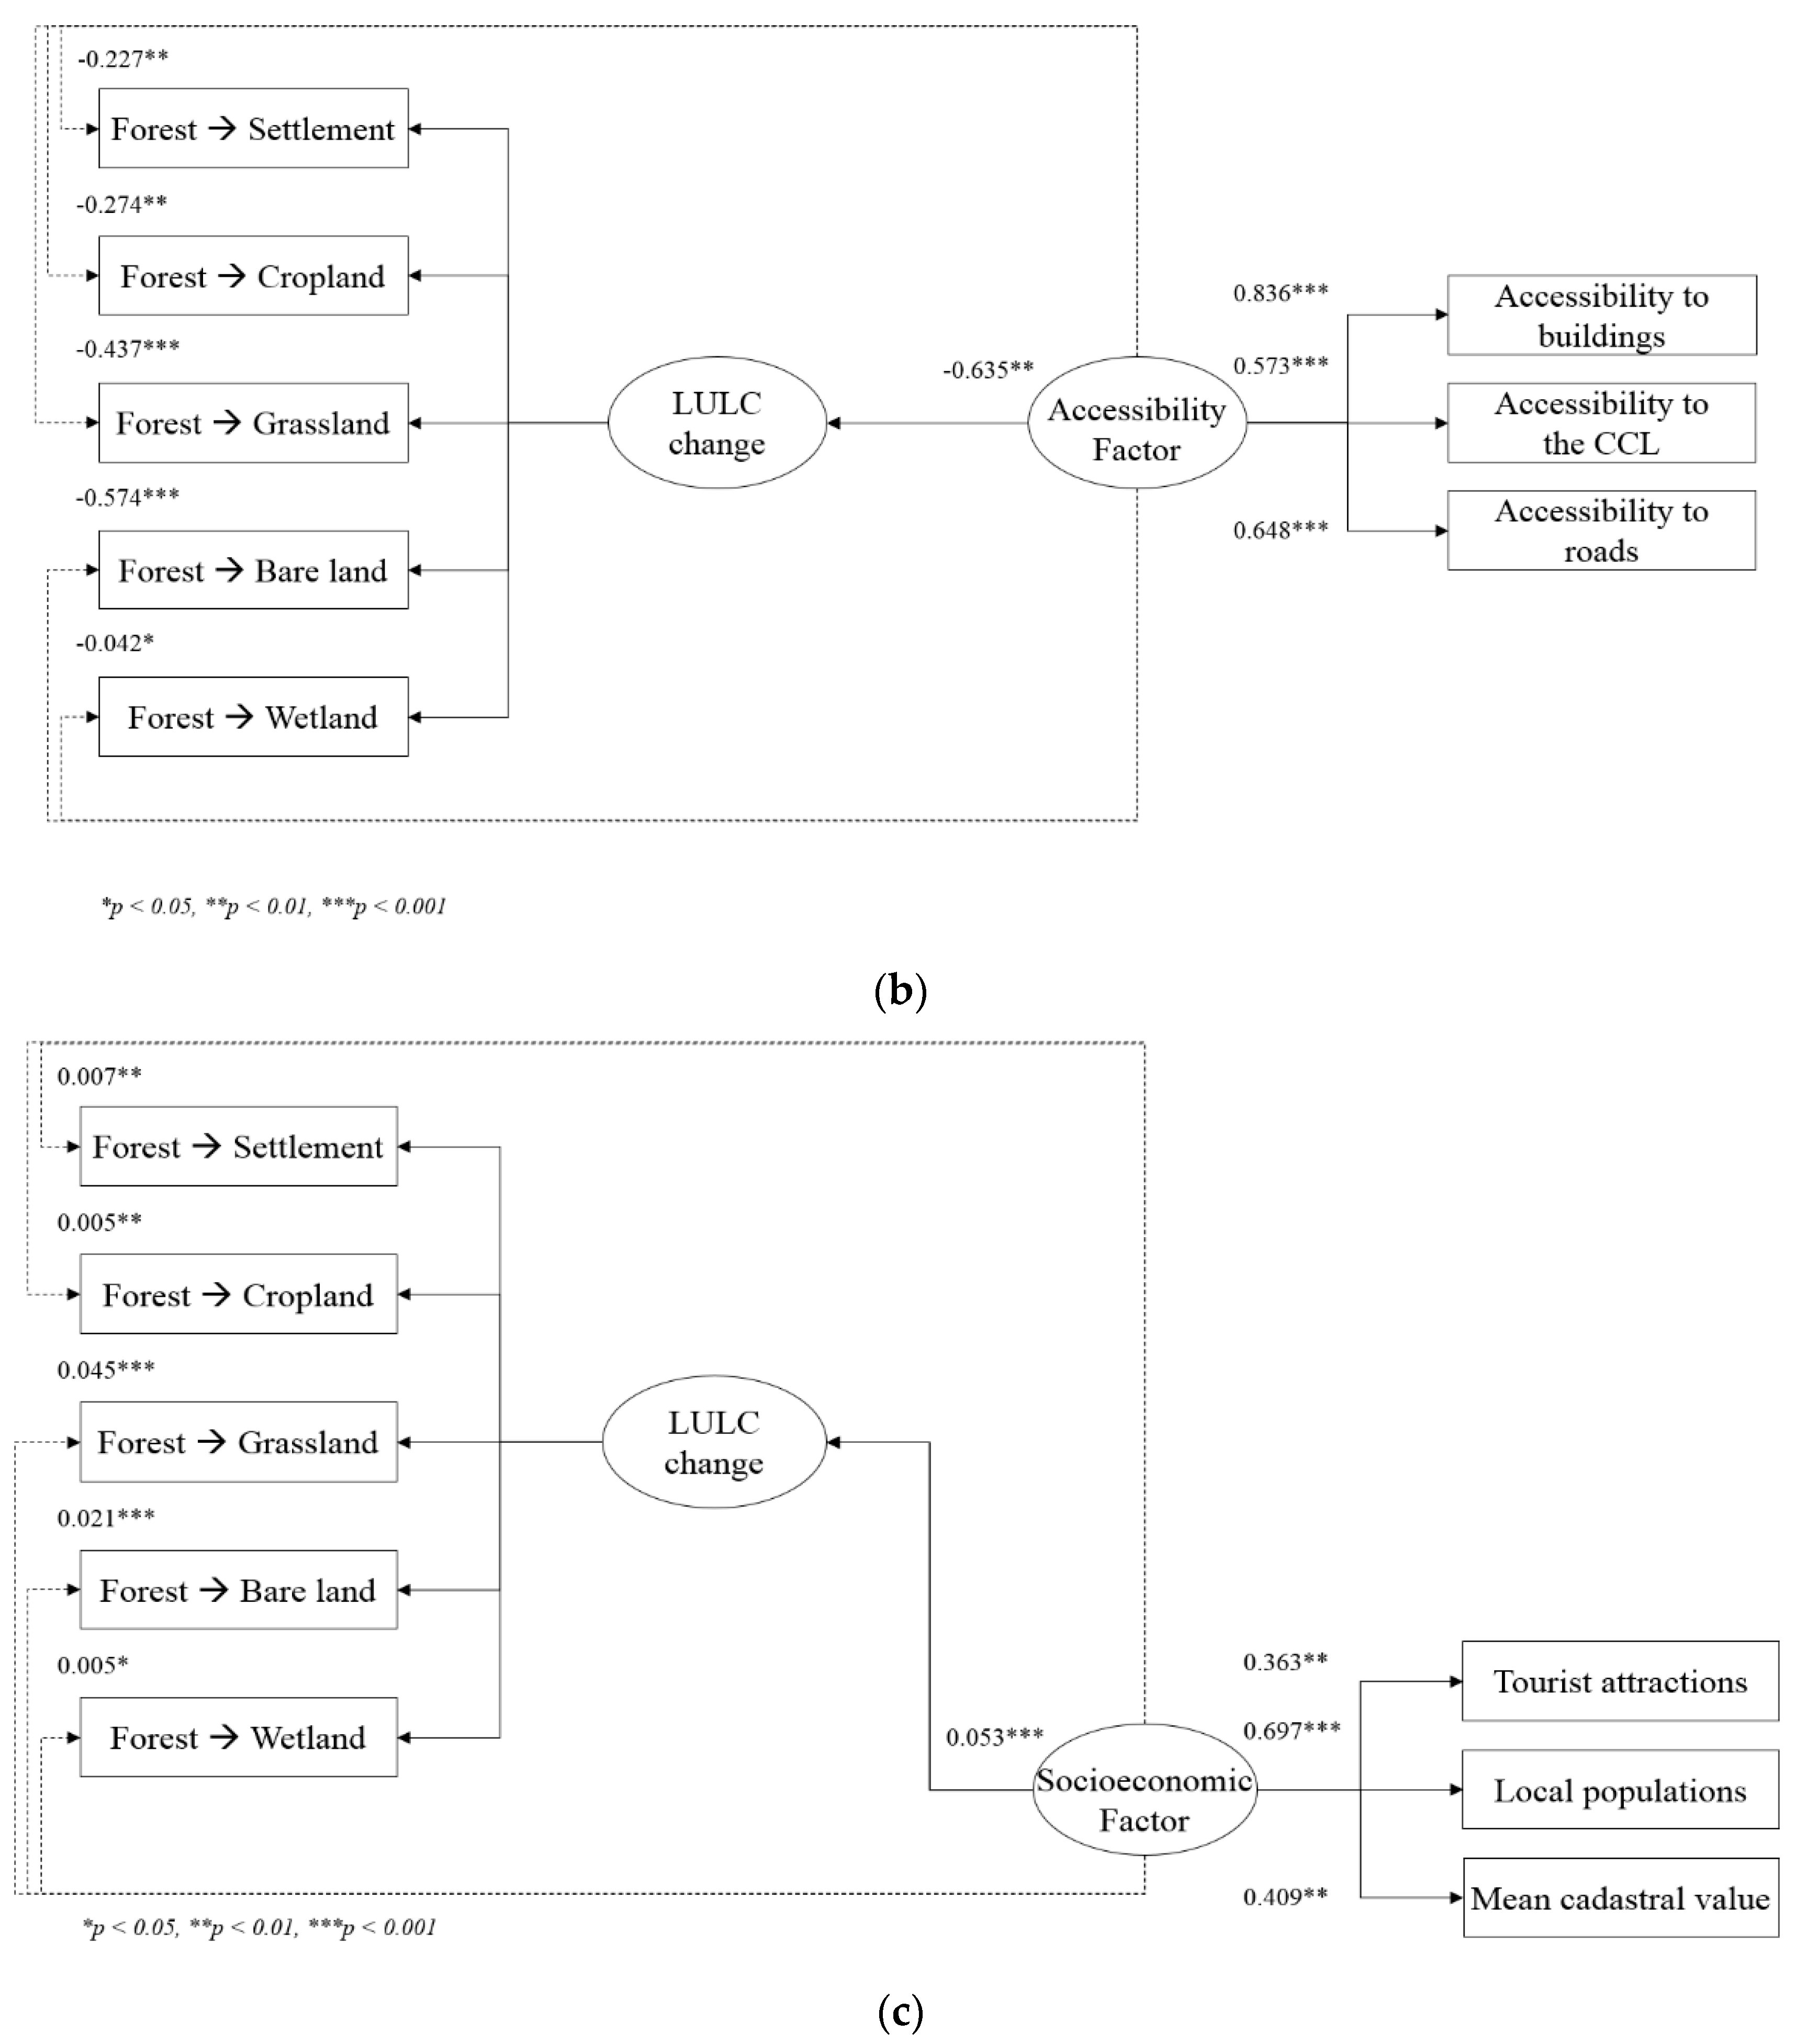
The direct effect of the accessibility factor was −0.635, higher than the other two factors (topographic and socioeconomic) (Figure 5b). Accessibility had a negative effect on forest change, implying that change from forest cover to other land use increases in proportion with proximity to roads, buildings and the CCZ. The greatest indirect effect was shown in the change to bare land (−0.574), followed by grassland and cropland. The accessibility factor showed similar characteristics to the topographic factor, with higher impact on the change to grassland and lower impact on the change to bare land. This is consistent with the findings of Sung et al. [29] that deforestation and degradation increases in proportion to the level of forest land used for military facilities, strategic roads and villages.
The direct effect of the socioeconomic factor was 0.053, with forest change increasing with increases in tourist attraction distribution, local population and cadastral value (Figure 5c). The greatest indirect effect was shown in the change to grassland but the socioeconomic factor had very low effect on forest change overall, below 0.100 in both direct and indirect effects, presumably due to the intrinsically low numbers of tourist attractions and population in the CCZ.
4. Conclusions
To achieve the UN’s SDG Goal 15 (forest management) within South Korea’s CCZ, it is essential to detect areas requiring restoration and management. Classification of remote sensing imagery showed that the predominant spatial patterns in this area’s forest LULC change were from forest to settlement, cropland, grassland and bare land.
Our Hot spot analysis enabled an intuitive analysis of these patterns and facilitated the identification of areas requiring intensive management. High distribution densities of such changes occurred in Ganghwa-gun, Gimpo-si, Paju-si and Yeoncheon-gun. The main causes of forest area change were agricultural activities (rice paddies and fields) and the development and expansion of villages. Increasing degradation at the forest edge caused by increasing proportions of cropland, grassland and bare land was directly associated with increasing deterioration of vegetation and deforestation. Due to the unique nature of the CCZ, deforestation and degradation, once done, is difficult to reverse.
Structural equation modeling determined the effects of factors associated with forest change. Of the three factors extracted (topography, accessibility and socioeconomic characteristics), the accessibility factor (proximity to buildings, roads and the CCZ) showed the strongest effect on forest change, above all on changes to bare land. The topographic factor (elevation and slope) also had great influence on forest change, above all on changes to grassland. These factors are therefore strong indicators of high degrees of deforestation and degradation.
According to previous studies, deforestation and degradation in the CCZ increases in proportion to the level of forest changes for the purposes of building military facilities, strategic roads, villages and ginseng cultivation, resulting in accelerated damage to the ecosystems in the CCZ. Such damaged areas are also problematic because they can contribute to natural disasters such as floods due to the degraded and deforested landscape. Achieving the SDGs’ forest management goals is important for both forest conservation and providing benefits such as biodiversity, carbon sinks, water purification and storage and recreation. These results provide practical data for preparing direct and indirect measures necessary for improved forest management programs in the CCZ.
Author Contributions
J.L. conceived and designed the experiments; J.P. performed the experiments and analyzed the data; J.P. and J.L. wrote the paper together. J.L. contributed to the modification. All authors have read and approved the final manuscript.
Funding
This study was carried out with the support of ‘R&D Program for Forest Science Technology (Project No. “2017045B10-1819-BB01”)’ provided by Korea Forest Service (Korea Forestry Promotion Institute).
Conflicts of Interest
The authors declare no conflict of interest.
References
- Park, S. A Study on the Millennium Development Goals and Sustainable Development Goals of UN for Enhancing the Quality of Human Life. J. Korean Soc. Qual. Manag. 2014, 42, 529–542. (In Korean) [Google Scholar] [CrossRef] [Green Version]
- Pisano, U.; Lepuschitz, K.; Berger, G. Fostering Urban Sustainable Development-Potentials and Challenges for National and European Policy. In 10th ESDN Workshop-Background and Discussion Paper; European Sustainable Development Network: Brussels, Belgium, 2014. [Google Scholar]
- United Nations. Transforming Our World: The 2030 Agenda for Sustainable Development. A/RES/70/1. Available online: https://sustainabledevelopment.un.org/post2015/transformingourworld (accessed on 22 April 2018).[Green Version]
- Forests and SDGs: Taking a Second Look. Available online: http://www.wri.org/blog/2017/09/forests-and-sdgs-taking-second-look (accessed on 24 April 2018).
- Moon, J.; Kim, N.; Song, C.; Lee, S.G.; Kim, M.; Lim, C.H.; Cha, S.E.; Kim, G.; Lee, W.K.; Son, Y.; et al. Analysis on the Linkage between SDGs Framework and Forest Policy in Korea. J. Clim. Chang. Res. 2017, 8, 425–442. (In Korean) [Google Scholar] [CrossRef]
- Jeon, S.; Lee, M.; Kang, B.; Shin, J. Study for Building Ecological Network in East-North Asia. J. Environ. Policy 2009, 8, 1–26. (In Korean) [Google Scholar]
- Seo, C.; Jeon, S. Landcover Analysis of DMZ and the Vicinity Using Remote Sensing and GIS Techniques. J. Environ. Impact Assess. 1998, 7, 11–22. (In Korean) [Google Scholar]
- Park, E.; Nam, M.; Park, M. DMZ Eco Peace Villages: Basic Survey and Development Strategies; Gyeonggi Research Institute: Suwon, Korea, 2012; pp. 4–15. (In Korean) [Google Scholar]
- You, J.H.; Jung, S.G.; Oh, J.H. Construction of System on Assessment Indicators for Conservation of Sustainable Natural Ecosystem. Korean J. Environ. Ecol. 2005, 19, 287–298. (In Korean) [Google Scholar]
- Kim, C.; Park, J.; Jang, D. A prediction of the Land-cover Change Using Multi-temporal Satellite Imagery and Land Statistical Data: Case Study for Cheonan City and Asan City, Korea. J. Korean Geomorphol. Assoc. 2011, 18, 41–56. (In Korean) [Google Scholar]
- In, C. A Study on the Systematic Management Measures of Natural Resources in the Demilitarizes Zone: Based on the Demilitarizes Zone in Gyeonggi-Do. Master’s Thesis, Dankook University, Yongin, Korea, August 2013. [Google Scholar]
- Oh, Y.; Choi, J.; Bae, S.; Yoo, S.; Lee, S. A Probability Mapping for Land Cover Change Prediction using CLUE Model. J. Korean Soc. Rural Plan. 2010, 16, 47–55. (In Korean) [Google Scholar]
- Tomao, A.; Quatrini, V.; Corona, P.; Ferrara, A.; Lafortezza, R.; Salvati, L. Resilient landscapes in Mediterranean urban areas: Understanding factors influencing forest trends. Environ. Res. 2017, 156, 1–9. [Google Scholar] [CrossRef] [PubMed]
- Zhao, C.; Jensen, J.; Zhan, B. A comparison of urban growth and their influencing factors of two border cities: Laredo in the US and Nuevo Laredo in Mexico. Appl. Geogr. 2017, 79, 223–234. [Google Scholar] [CrossRef]
- Kim, S.; Lee, J. The Effect of Spatial Scale and Resolution in the Prediction of Future Land Use using CA-Markov Technique. J. KAGIS 2007, 10, 57–69. (In Korean) [Google Scholar]
- Jeong, K.; Moon, T.; Jeong, J. Hotspot Analysis of Urban Crime Using Space-Time Scan Statistics. J. KAGIS 2010, 13, 14–28. Available online: http://www.riss.kr/link?id=A82392455 (accessed on 24 April 2018). (In Korean).
- Jeong, J.; Jun, M. Spatial Concentrations of the Elderly and Its Characteristics in the Seoul Metropolitan Area. J. Korean Reg. Sci. Assoc. 2013, 29, 3–18. (In Korean) [Google Scholar]
- Ord, J.; Getis, A. Local spatial autocorrelation statistics: distributional issues and an application. Geogr. Anal. 1995, 27, 286–306. [Google Scholar] [CrossRef]
- Brown, K.A.; Parks, K.E.; Bethell, C.A.; Johnson, S.E.; Mulligan, M. Predicting plant diversity patterns in Madagascar: Understanding the effects of climate and land cover change in a biodiversity hotspot. PLoS ONE 2015, 10, e0122721. [Google Scholar] [CrossRef] [PubMed]
- Lee, J.; Kim, S.; Han, K.; Lee, Y. Hotspot Detection for Land Cover Changes Using Spatial Statistical Methods. Korean J. Remote Sens. 2011, 27, 601–611. (In Korean) [Google Scholar] [CrossRef] [Green Version]
- Choi, J.; Park, W.; Kim, M. Relationship between land cover change and socio-economic change, and spatial query for time series data in the Saemangeum area. Geogr. J. Korea 2014, 48, 363–373. (In Korean) [Google Scholar]
- Lee, T. Development and Application of Land Use Forecasting Model for Conurbanized Regions. Ph.D. Thesis, Chungbuk University, Cheongju, Korea, February 2015. (In Korean). [Google Scholar]
- Lee, J. Satisfaction Factors Analysis of Freight Drivers Using Structural Equation Model. Master’s Thesis, Hanyang University, Seoul, Korea, August 2015. (In Korean). [Google Scholar]
- Van Acker, V.; Witlox, F.; Van Wee, B. The effects of the land use system on travel behavior: a structural equation modeling approach. Transp. Plan. Technol. 2007, 30, 331–353. [Google Scholar] [CrossRef]
- Zhou, T. Understanding online community user participation: A social influence perspective. Internet Res. 2011, 21, 67–81. [Google Scholar] [CrossRef]
- Jang, M.; Kim, T. An Analysis of Causal Relationship between the Density of Land Use Types, and Land Value Using PLS-Structural Equation Model: A Case of 25 Gu-Districts in Seoul. Korean Urban Manag. Assoc. 2012, 25, 65–87. (In Korean) [Google Scholar]
- Asadi, A.; Barati, A.A.; Kalantari, K. Analyzing and modeling the impacts of agricultural land conversion. Bus. Manag. Rev. 2014, 4, 176–184. [Google Scholar]
- Special Act on Management of Mountainous Districts North of The Civilian Control Line, Ministry of Government Legislation. Available online: http://www.law.go.kr/lsInfoP.do?lsiSeq=136901#0000 (accessed on 29 April 2018).
- Sung, H.; Kim, S.; Kang, D.; Seo, J.; Lee, S. Analysis on the Type of Damaged Land in DeMilitarized Zone (DMZ) Area and Restoration Direction. J. Korea Soc. Environ. Restor. Technol. 2016, 19, 185–193. (In Korean) [Google Scholar] [CrossRef]
- Park, E.; Jeon, S.; Nam, M.; Hong, S. Ecosystem Destroying Factors and the Mitigation of Impacts in the Civilian Control Zone; Gyeonggi Research Institute: Suwon, Korea, 2011; pp. 1–169. (In Korean) [Google Scholar]
- Na, H.; Park, J.; Choi, J.; Lee, J. A Study on Spatial Characteristic of Damaged Forest Areas by Image Interpretation-Focused on DMZ region in Hwacheon and Cheorwon. J. Assoc. Korean Photo-Geogr. 2015, 25, 63–73. (In Korean) [Google Scholar]
- Anselin, L.; Bera, A.K. Spatial dependence in linear regression models with an introduction to spatial econometrics. In Handbook of Applied Economic Statistics; Ullah, A., Ciles, D., Eds.; CRC Press: Boca Raton, FL, USA, 1998; pp. 237–290. [Google Scholar]
- Park, J. Delimiting Urban Regeneration Districts Using Spatial Analysis. Master’s Thesis, Kyungpook University, Daegu, Korea, February 2012. (In Korean). [Google Scholar]
- Bae, B. Structural Equation Modeling with Amos 19: Principles and Practice; Chungram: Seoul, Korea, 2011; pp. 254–321. (In Korean) [Google Scholar]
- Lee, H.; Lim, J. Structural Equation Modeling with AMOS 18.0/19.0; Jyphyunjae: Seoul, Korea, 2011; pp. 157–231. (In Korean) [Google Scholar]
- Kim, J. An Analysis of the Changes in the Cause-and-Effect Relationships between Socio-Economic Indicators and the Road Network of Seoul Using Structural Equation Model. J. Korean Geogr. Soc. 2009, 44, 797–812. (In Korean) [Google Scholar]
- Lee, K.; Jeong, J.; Heo, B.; Byeon, S. A Study on the Effect Analysis for the Regeneration Project for the Zones Vulnerable to Natural Disaster using Structural Equation Model. J. Korea Water Resour. Assoc. 2013, 46, 843–855. (In Korean) [Google Scholar] [CrossRef] [Green Version]
- Yu, M.; Lee, M.; Choi, B. A Study on the Sustainable Urban Development Indicator—Focused on the environment-indicators. Korean J. Hydrosci. 2008, 43, 225–236. (In Korean) [Google Scholar]
- Choi, D.; Suh, Y. Geographically Weighted Regression on the Environmental-Ecological Factors of Human Longevity. J. Korea Soc. Geospat. Inf. Sci. 2012, 20, 57–63. (In Korean) [Google Scholar] [CrossRef] [Green Version]
- Kim, J. Development and Confirmation of the Theory of Learning Flow Processes: A Sequential Mixed Method of Grounded Theory and Structural Equation Modeling. Ph.D. Thesis, Chonbuk University, Jeonju, Korea, February 2013. (In Korean). [Google Scholar]
- Kim, J. The Effects of Elderly Patients’ Dental Satisfaction on Revisit Intention with the Application of SEM. Ph.D. Thesis, Inha University, Incheon, Korea, February 2013. (In Korean). [Google Scholar]
- Lee, T. A Study on the Change of the Spatial Distribution of Villages in Civilian Control Zone by using GIS. Master’s Thesis, Kangwon University, Chuncheon, Korea, August 2012. (In Korean). [Google Scholar]
- Lee, W. Analysis of Temporal Change in Soil Erosion Potential at Haean-Myeon Watershed Due to Climate Change. Master’s Thesis, Kangwon University, Chuncheon, Korea, August 2014. (In Korean). [Google Scholar]
- Park, E.; Nam, M. Changes in Land Cover and the Cultivation Area of Ginseng in the Civilian Control Zone —Paju City and Yeoncheon County. Korean J. Environm. Ecol. 2013, 27, 507–515. (In Korean) [Google Scholar]
- Song, J.; Lim, C.; Kim, D.; Park, M.; Ham, B.; Kim, M.; Lee, C. Forest Land Use Patterns in the Northern Area of the Civilian Passage Restriction Line. J. Korea For. Recreat. Soc. Issues 2013, 4, 805–807. (In Korean) [Google Scholar]
- Korea Meteorological Administration. Monthly Weather Report (2010.6.). Available online: http://www.kma.go.kr/repositary/sfc/pdf/sfc_mon_201006.pdf (accessed on 29 April 2018).
- Korea Meteorological Administration. Monthly Weather Report (2016.5.). Available online: http://www.kma.go.kr/repositary/sfc/pdf/sfc_mon_201605.pdf (accessed on 29 April 2018).
- Song, J. SPSS/AMOS Statistical Analysis Method; 21st Century: Paju, Korea, 2009; pp. 254–278. (In Korean) [Google Scholar]
- Seong, T. Easy Statistical Analysis; Hakjisa: Seoul, Korea, 2014; pp. 311–364. (In Korean) [Google Scholar]
Figure 1.
Study Site: The Civilian Control Zone (CCZ)) south of the demilitarized zone separating North and South Korea.
Figure 1.
Study Site: The Civilian Control Zone (CCZ)) south of the demilitarized zone separating North and South Korea.
Figure 2.
Flow chart of the forest LULC pattern and change factor analyses.

Figure 3.
Framework of the SEM used in this study.

Figure 4.
Hot spot distribution maps of forest LULC change: (a) forest to settlement; (b) forest to cropland; (c) forest to grassland; (d) forest to bare land; (e) forest to wetland.
Figure 4.
Hot spot distribution maps of forest LULC change: (a) forest to settlement; (b) forest to cropland; (c) forest to grassland; (d) forest to bare land; (e) forest to wetland.


Figure 5.
Factor analysis of the forest change area using the structural model: (a) topographic factor; (b) accessibility factor; (c) socioeconomic factor.
Figure 5.
Factor analysis of the forest change area using the structural model: (a) topographic factor; (b) accessibility factor; (c) socioeconomic factor.


Table 1.
Data used for analyzing the forest LULC patterns and change factors.
| Type | Data | Remark |
|---|---|---|
| Remote sensing | Land cover maps
| Produced using supervised classification with satellite imagery |
| Geographic | Administrative boundaries map | Korea Forestry Service |
| Southern Limit Line | Gangwon Dev. Research Institute | |
| Civilian Control Zone | Ministry of Land, Infrastructure and Transport | |
| Digital topographic maps | ||
| Mean cadastral valuation (as of 2016 year) | ||
| Local population data (as of 2013 year) | ||
| Statistical | Tourist attraction | Korea Tourism Organization |
Table 2.
Fit indices and cutoff criteria used for SEM evaluation.
| Model Fit Index | Cutoff Point | |
|---|---|---|
| Absolute Fit | Χ2 (CMIN) | p < 0.05 |
| Normed Χ2 (CMIN/DF) | ≤3 | |
| Goodness of Fit Index (GFI) | ≥0.9 | |
| Standardized RMR (SRMR) | ≤0.08 | |
| Incremental Fit | Normed Fit Index (NFI) | ≥0.9 |
| Comparative Fit Index (CFI) | ≥0.9 | |
Table 3.
Similarities of the variables extracted by factor analysis.
| Variables Used for Factor Analysis | Communality | |
|---|---|---|
| Forest Area Change | Forest to settlement | 0.535 |
| Forest to cropland | 0.654 | |
| Forest to grassland | 0.569 | |
| Forest to bare land | 0.446 | |
| Forest to wetland | 0.752 | |
| Topographic Factor | Slope | 0.790 |
| Elevation | 0.800 | |
| Accessibility Factor | Accessibility to buildings | 0.769 |
| Accessibility to the CCZ | 0.731 | |
| Accessibility to roads | 0.752 | |
| Socioeconomic Factor | Tourist attractions | 0.652 |
| Local populations | 0.630 | |
| Mean cadastral value | 0.716 | |
Table 4.
Fit indices and cut-off criteria of the study model.
| Model Fit Index | Analysis Result | Cut-Off Point | Fit/Unfit |
|---|---|---|---|
| CMIN/p-value | 72.303/0.040 | p < 0.05 | Fit |
| CMIN/DF | 1.364 | ≤3 | Fit |
| GFI | 0.952 | ≥0.9 | Fit |
| SRMR | 0.061 | ≤0.08 | Fit |
| NFI | 0.905 | ≥0.9 | Fit |
| CFI | 0.972 | ≥0.9 | Fit |
© 2018 by the authors. Licensee MDPI, Basel, Switzerland. This article is an open access article distributed under the terms and conditions of the Creative Commons Attribution (CC BY) license (http://creativecommons.org/licenses/by/4.0/).
Share and Cite
MDPI and ACS Style
Park, J.; Lee, J. Spatial Pattern and Factor Analyses for Forest Sustainable Development Goals within South Korea’s Civilian Control Zone. Sustainability 2018, 10, 3500. https://doi.org/10.3390/su10103500
AMA Style
Park J, Lee J. Spatial Pattern and Factor Analyses for Forest Sustainable Development Goals within South Korea’s Civilian Control Zone. Sustainability. 2018; 10(10):3500. https://doi.org/10.3390/su10103500
Chicago/Turabian StylePark, Jinwoo, and Jungsoo Lee. 2018. "Spatial Pattern and Factor Analyses for Forest Sustainable Development Goals within South Korea’s Civilian Control Zone" Sustainability 10, no. 10: 3500. https://doi.org/10.3390/su10103500
Note that from the first issue of 2016, this journal uses article numbers instead of page numbers. See further details here.