Article

Growth, Development, Leaf Gaseous Exchange, and Grain Yield Response of Maize Cultivars to Drought and Flooding Stress

by
Robert Mangani
1,
Eyob Habte Tesfamariam
1,*,
Gianni Bellocchi
2 and
Abubeker Hassen
3
1
Department of Plant and Soil Sciences, University of Pretoria, Private Bag x20, Hatfield 0028, Pretoria 0002, South Africa
2
INRA, VetAgro Sup, UCA, UMR 0874 Écosystème Prairial (UREP), 63000 Clermont-Ferrand, France
3
Department of Animal and Wildlife Sciences, Faculty of Natural and Agricultural Sciences, University of Pretoria, Private Bag x20, Hatfield 0028, Pretoria 0002, South Africa
*
Author to whom correspondence should be addressed.
Sustainability 2018, 10(10), 3492; https://doi.org/10.3390/su10103492
Submission received: 13 August 2018 / Revised: 25 September 2018 / Accepted: 27 September 2018 / Published: 29 September 2018

Abstract

:
The prevalence of extreme drought and flooding is posing a threat to the food security of Sub-Saharan African countries. There are national and international calls for actions to investigate the level of resilience of existing crop cultivars to multiple abiotic stress conditions. A two-year study was carried out in South Africa to determine growth, development, yield, yield components, and physiological responses of two contrasting maize cultivars—PAN 413 (drought tolerant) and PAN 6Q-245 (drought intolerant) under drought and flooding. The drought effect on grain yield was more pronounced from mid-vegetative to tasselling stages, regardless of the cultivar with yields deviating from the control by 53–58% (2015/2016) and 34–42% (2016/2017). The effect of flooding on grain yield was pronounced at the early vegetative stage for both cultivars, with yield reductions ranging between 26–30% (2015/2016) and 15–21% (2016/2017). Results from the study indicated that existing maize cultivars (drought tolerant and drought intolerant) are both prone to likely extreme drought events experienced during the tasselling stage. Results also showed that both cultivars are prone to probable flooding events before the tasselling stage. It is recommended that plant breeders’ efforts be directed to developing maize cultivars with multiple stress tolerances.

1. Introduction

Maize (Zea mays L.) is ranked among the top three important staple food crops around the globe, and South Africa comes ninth in maize production globally and second in Sub-Saharan Africa [1]. Due to the dependence of agricultural production on climatic factors, crop yield (including maize yield) has been noted to be under threat because of climate change [2]. Specifically, extreme weather events such as drought and flooding can adversely affect the stability of crop yields [3]. The prevalence of extreme drought and flooding is posing a threat to the food security of Sub-Saharan African countries and in particular Southern Africa [4,5]. Consequently, there have been calls nationally and internationally for actions to investigate the level of resilience of existing crop cultivars to multiple abiotic stress conditions.
At present, South Africa is battling one of the worst droughts ever recorded that started in 2015. Records from the South African Weather Service show that year 2015 was the driest on record in South Africa, dating back to 1904 [6]. Regarding flooding, most of the regions in South Africa experienced this phenomenon in year 2011, which led to crop and infrastructural loses on a number of farms [7]. Climate projections in South Africa are indicating that under all four medium and long term climatic scenarios, a higher frequency of flooding and drought will occur [8].
Severe droughts and excessive moisture cause considerable maize yield losses worldwide [9]. The extent of damage on maize due to drought depends on the intensity and duration of stress, but also on the plant developmental stage at the time of exposure [10,11,12,13]. For instance, Atteya [10] reported yield losses ranging from 32 to 92% when maize was exposed to drought during the vegetative stage. Kamara [11] reported losses of 63–87% when the crop was exposed to drought during the reproductive stage. In a report by Monneveux [13], losses of around 79–81% were observed when maize was exposed to drought during the grain-filling period.
Pertaining to the effects of excess moisture on plants, a number of studies have been carried out at molecular, biochemical, physiological, anatomical, and morphological levels [14,15]. The extent of damage just like drought is also dependent on the stage of development, the type of cultivar and the duration of waterlogging [16,17]. Maize is especially susceptible to excess moisture from the early seedling growth to time of tasselling [17,18,19].
Tolerance to excess soil moisture has been noted in some maize genotypes having an inherent ability to produce adventitious roots and properties in root morphological adaptation like air space (aerenchyma) formation in cortical regions of adventitious roots [18]. A deeper understanding of how different cultivars respond to extreme weather events is quite crucial as it helps in advancing knowledge in support of crop modelling and breeding activities [20]. Grzesiak [16], in a study similar to the present one focusing on the morphological and anatomical root traits, concluded that genotypes that could tolerate drought were also able to tolerate excess moisture. However, some genotypes might possess one of the two characteristics being either drought tolerant or tolerant to excess moisture [9]. To date, there is a paucity of information that ascertains the agronomic and physiological performance of drought resistant genotypes under excess moisture conditions. The study by Grzesiak [16] focused on two cultivars of different drought susceptibility though they did not investigate how growth, yield, and physiological responses were affected. It is not always the case that the negative effects on roots will translate to yield changes [21]. Furthermore, the experiment resembled a pot experiment and was performed in a growth chamber. Ren et al. [19], reported that roots of plants grown in pots have restricted growth, which thus buffers the natural responses of plant growth. We conclude that pot experiments may not be truly representative of what really emerges under natural conditions.
The objective of our study is to clarify growth, development, yield, yield components, and physiological responses related to the performance of alternative maize cultivars with different drought tolerance under field drought and flooding conditions imposed at different developmental stages, with a view to ascertain if maize exhibits environmental tolerance to both drought and flooding.

2. Materials and Methods

2.1. Study Site

Field experiments were conducted at University of Pretoria Hatfield Experimental Farm, Pretoria, South Africa (25°45′ S, 28°16′ E and elevation 1327 m.a.s.l.). The soil is classified as a Hutton sandy clay loam [22] (loamy, kaolinitic, mesic, Typic Eutrustox) (Table 1). The long-term mean annual rainfall of the study site is 670 mm, mostly concentrated during the months of October–March. Biweekly temperatures and further parameters of the study site are presented in Table 2.

2.2. Field Trial and Treatments

Two commercial maize cultivars, PAN 413 (drought tolerant cultivar) and PAN 6Q-245 (drought intolerant cultivar, high yielder), were selected for this study (http://www.pannar.com/agronomy).
Two seeds were planted at a depth of 0.05 m in rows using manual planters on 15 November (2015/2016) and 22 October (2016/2017). The planting density was 59,523 plants ha−1. Plots consisted of 4 rows, spaced 0.56 m apart and an intra-row spacing of 0.30 m. The rows were 5 m in length, with 1 border row on either side. Two weeks after emergence, excess plants were thinned to the desired plant density. Before planting, the field was ploughed and disked to create a level seedbed. Weed control was performed by hand. No pests or diseases occurred during either season. An automated rainout shelter was used to cover the plots for possible precipitation events. A shelter, activated by a rain sensor, moved to cover the crop within two minutes in case of rainfall (≥2 mm). Weeding was done manually when needed. At harvest, a 4 m length of the two middle rows was used for yield determination.
The maize growth period was divided into three growth stages according to the standardized growth scale Biologische Bundesanstalt, Bundessortenamt and Chemical industry (BBCH) identification keys as follows: early vegetative (GS18), mid-vegetative to tasselling (GS51), and grain filling (GS71). The seedlings grew vigorously until the first drought and flooding treatments were imposed during the vegetative stage, which commenced immediately after the unfolding of the 8th leaf.
Each cultivar was exposed to three drought-timing and three flood-timing treatments, compared to a control (C) with well-watered plants irrigated to field capacity throughout the growing season. The drought-timing treatments included water withheld during: early-vegetative stage (DV), mid-vegetative to tasselling stage (DT), and grain-filling stage (DGf). Similarly, water was applied to the flooded plots during three stages: early-vegetative stage (EmV), mid-vegetative to tasselling stage (EmT), and grain-filling stage (EmGf). A summary of the treatments is presented in Table 3. The treatments were laid out as a randomized complete block design (RCBD) with three replications.
A drip irrigation system was used to apply water in the treatments receiving water according to crop water requirements. Crop water use was estimated from soil water content measurements conducted on a weekly basis to a depth of 1 m using a site-calibrated neutron soil water meter (Model 503 DR CPN Hydro probe; Campbell Pacific Nuclear, Concord, CA, USA). Seven drip lines with a delivery rate of 2.1 L h−1 (at a working pressure range of 120–180 kPa) were placed laterally in each irrigated plot at a distance of 0.28 m. The drip emitters were pressure compensated and were located every 0.3 m within a dripper line. During the crop establishment period (between seed germination and crop establishment), 10 mm irrigation was applied every third day. When stress was imposed to the drought-timing treatments, water was completely withheld for those specific experimental units for 21 consecutive days.
Plots exposed to flooding were zero levelled to allow even distribution of water in each plot. For flood-timing treatments, the drippers were removed, and water could flow freely to the plots, leading to ponding on the soil surface. The flooded plots were left flooded for a period of 8 consecutive days with a free water height maintained at 10 ± 2.5 cm above the ground surface. An outlet was provided in each flood experimental plots to drain excess water (above 12.5 cm high) from the plots. All plots received water according to the requirements before and after the drought and flood treatments.

2.3. Agronomic Data

Plant height was measured on eight randomly selected and marked plants on the middle rows of each plot. Measurements were taken from the ground surface to the ligule of the fully developed leaf. The measurements were taken weekly from the fourth week after emergence up to flowering and after that it was done fortnightly up to physiological maturity. Leaf area index (LAI) was calculated after measuring leaf area with an LI 3100 belt-driven leaf area meter (LI-COR, Lincoln, NE, USA). Due to the limited number of plants in each plot, only two plants per plot were used for destructive sampling. Three sampling campaigns were conducted per growing season, excluding the final harvest. The harvested plants were partitioned into stems, leaves (leaf blade), and cobs. The partitioned parts of the plant were oven dried at a temperature of 70 °C to a constant mass. At crop physiological maturity, 10 plants per plot from the two center rows were harvested for dry matter, yield and yield attributes. The cobs were then threshed to determine the seed number per pod, kernel weight (g per 1000 seeds), harvest index (HI), and seed yield. Determination of HI was done using the same plants that were used for determining yield per plot. Phenological events were determined three times per week on each plot. Dates of emergence, tasselling, and physiological maturity (black layer observed in grains of the mid-portion of the ear) were recorded when 50% of the plants reached that stage.

2.4. Photosynthesis

Photosynthesis measurements were taken three times in each season using a portable gas exchange measuring system (Li 6400, LI-COR, Lincoln, NE, USA). These measurements were taken on the last day of exposure to drought and flooding stresses. Measurements were conducted on a fully matured third leaf from the top, during a sunny day between 10:00 a.m. and 14:00 p.m. The exposure of maize to excess moisture started 12 days later, after the drought treatment had already started so that the end of drought stress could coincide with flooding stress. This was done to ensure that measurements could be done at the same time after crop exposure to the two stresses.

2.5. Statistical Analysis

Analysis of variance was conducted using Genstat 19th Edition (https://genstat.kb.vsni.co.uk/knowledge-base/new-features-genstat-19th-edition). Univariate analysis of each variable was done separately for each cultivar with a 2 × 3 factorial arrangement of treatments, plus a control structure as described by Payne et al. [23]. Multiple comparisons of means were performed using least significant difference (LSD) Tukey’s Studentized (HSD) range (p < 0.05). The data from the two seasons were analysed separately because of significant (p < 0.05) season–year interactions.

3. Results

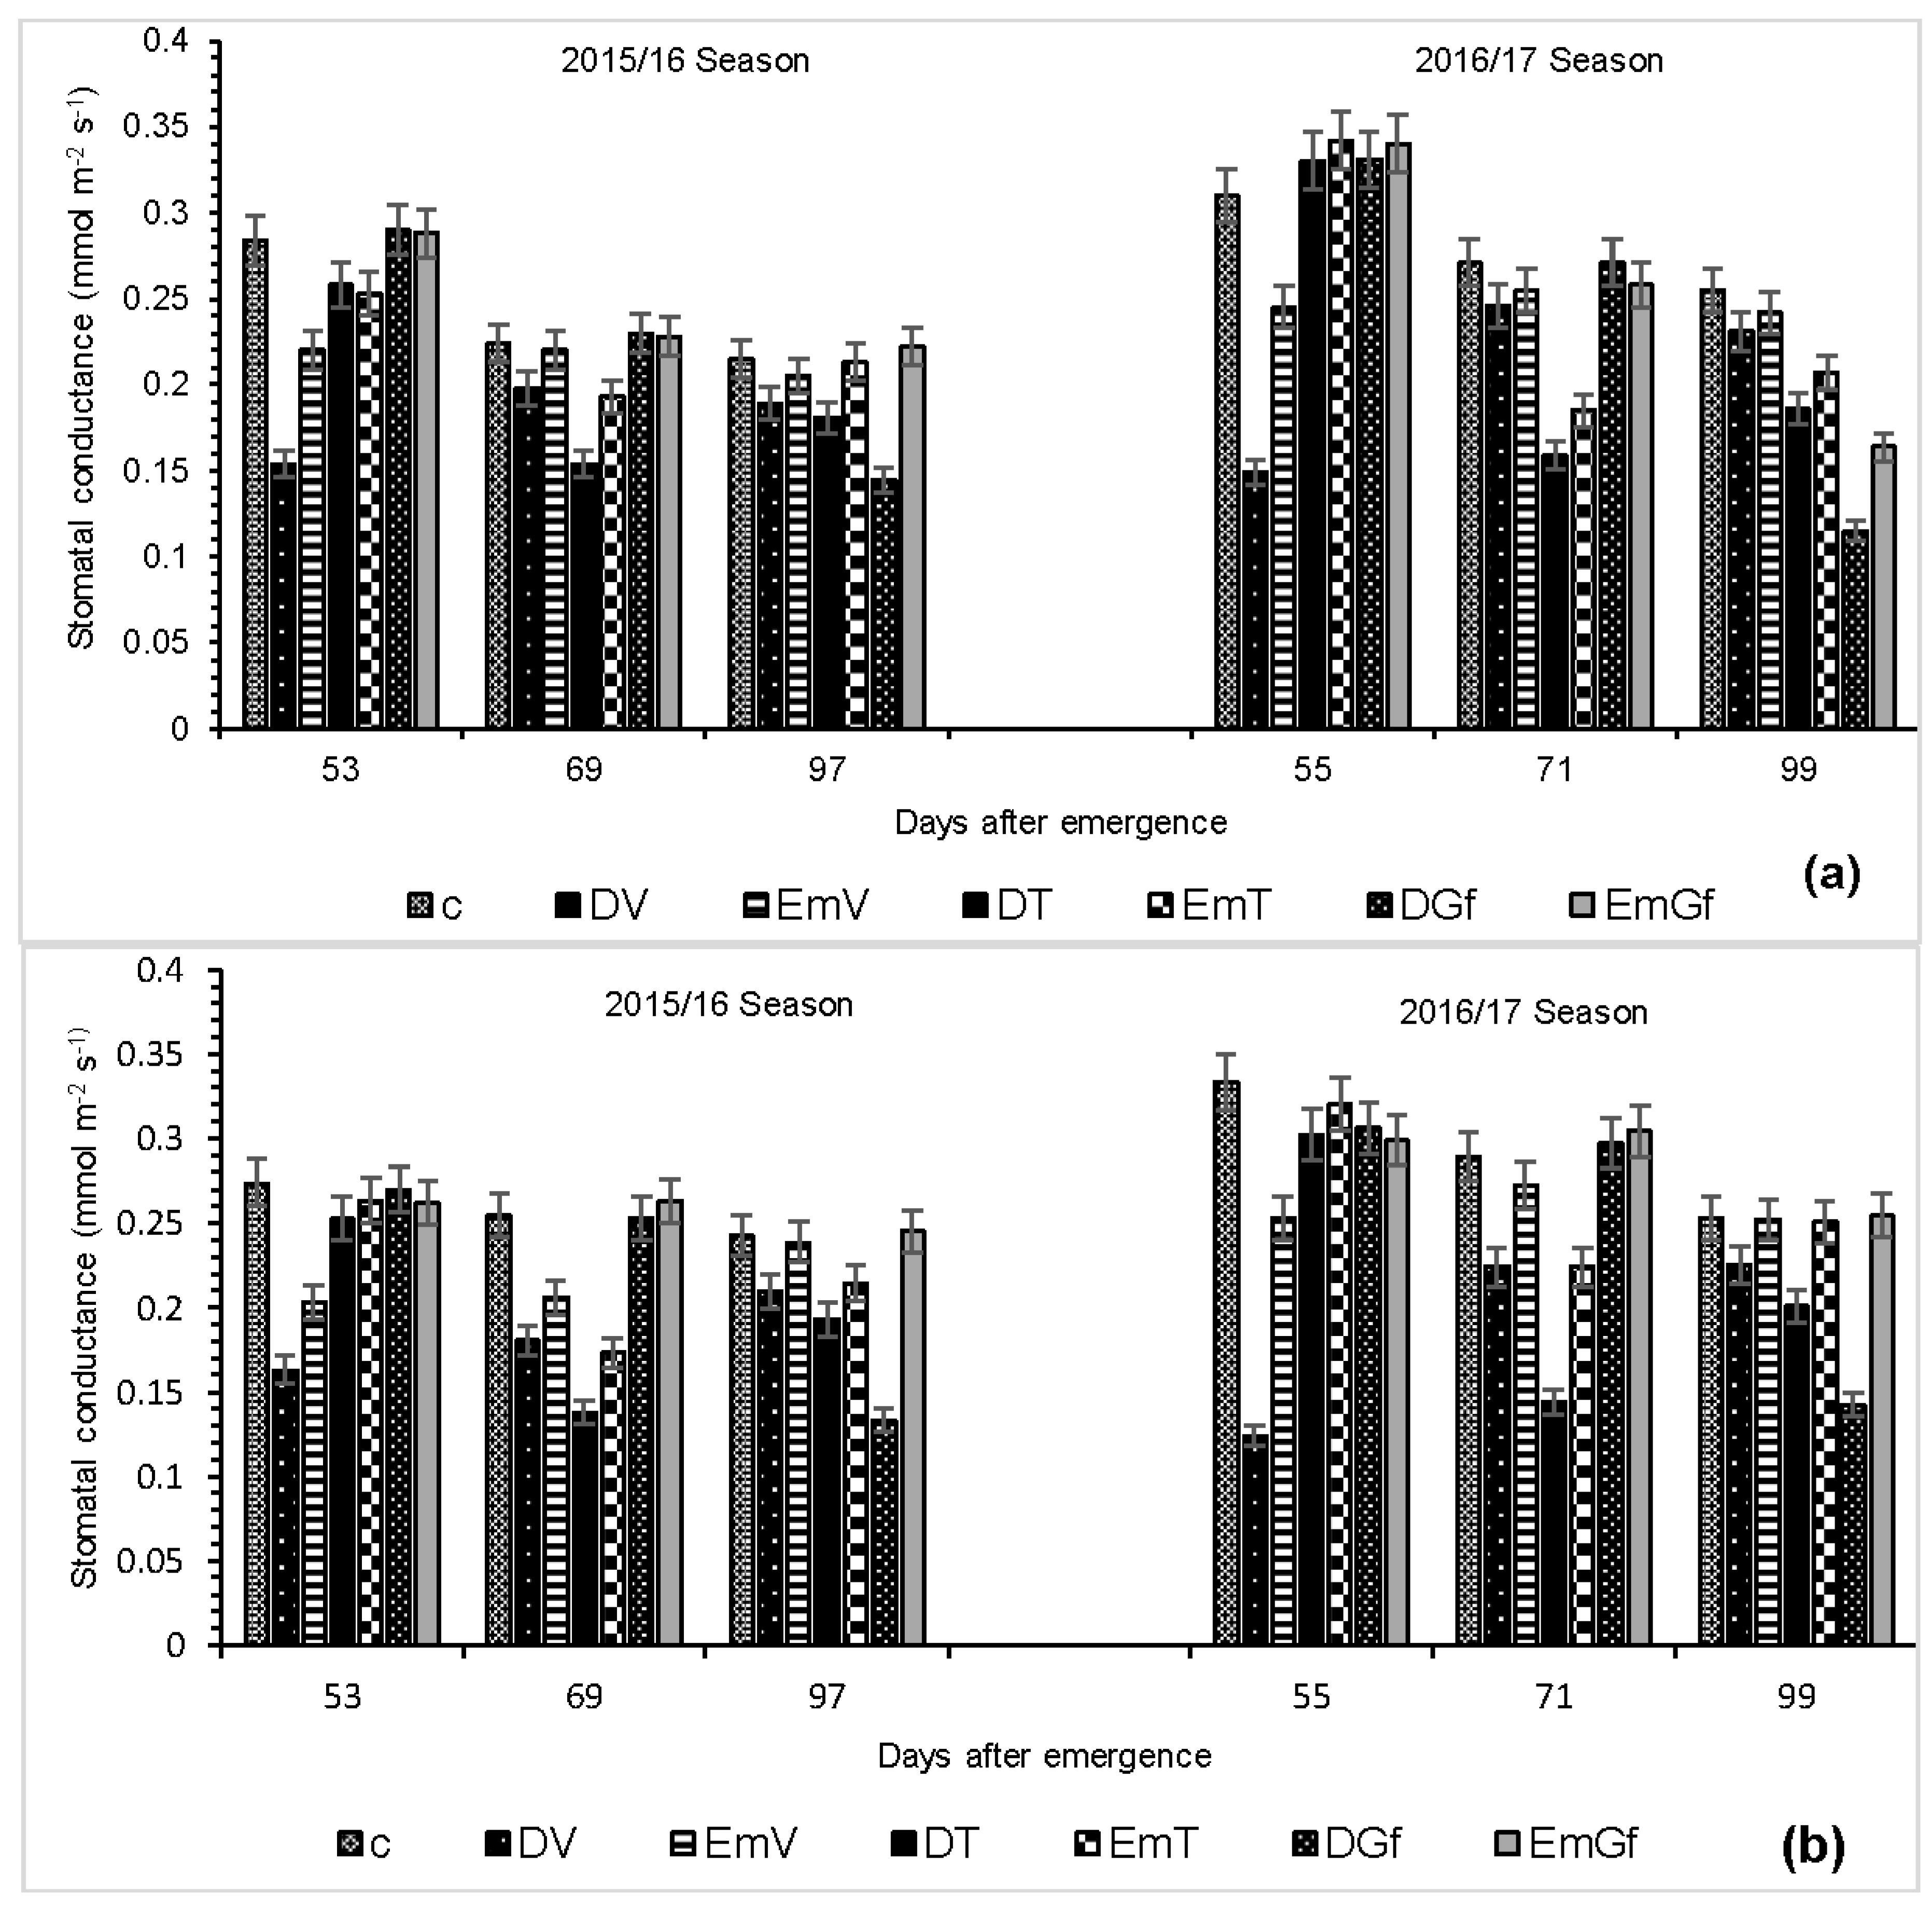
3.1. Stomatal Conductance

Overall, stomatal conductance was relatively higher in 2016/2017 than 2015/2016, mainly because the former year was warmer (Figure 1). Both drought and flooding imposed on maize at all growth stages significantly reduced (p < 0.05) stomatal conductance except for flooding during the grain filling stage.
This indicates that end-of-season flooding (grain filling) does not have any significant effect on stomatal conductance. Stomatal conductance of maize under drought treatment was significantly lower than that exposed to excess moisture at the same growth stage for all growth stages. This was true for both cultivars and both seasons.
Drought imposed during the vegetative stage resulted in a 45% reduction in the stomatal conductance of cultivar PAN 413 and 61% reduction for PAN 6Q-245 compared with the control. In contrast, excess moisture imposed during the same stage (EmV) led to a 23% reduction for the cultivar PAN 413 and 25% reduction for the cultivar PAN 6Q-245 compared with the control. Both cultivars showed similar performance when exposed to excess moisture indicating that drought tolerant cultivars do not have an edge over drought-susceptible cultivars under excess moisture. The stomatal conductance of both cultivars showed some recovery after the resumption of irrigation following the stress period. Similarly, the flood treatments also showed some recovery following the termination of flooding.

3.2. Photosynthesis

Both drought and flooding imposed to maize at all growth stages significantly reduced photosynthesis (p < 0.05) except for flooding during the grain filling stage (Table 4). This shows that flooding during the latter stage of crop growth (grain filling) does not have a significant effect on photosynthesis except for the intolerant cultivar in 2016/2017. In most of the cases, the effect of drought was significantly higher (p < 0.05), than that of flooding imposed during the same growth stage.

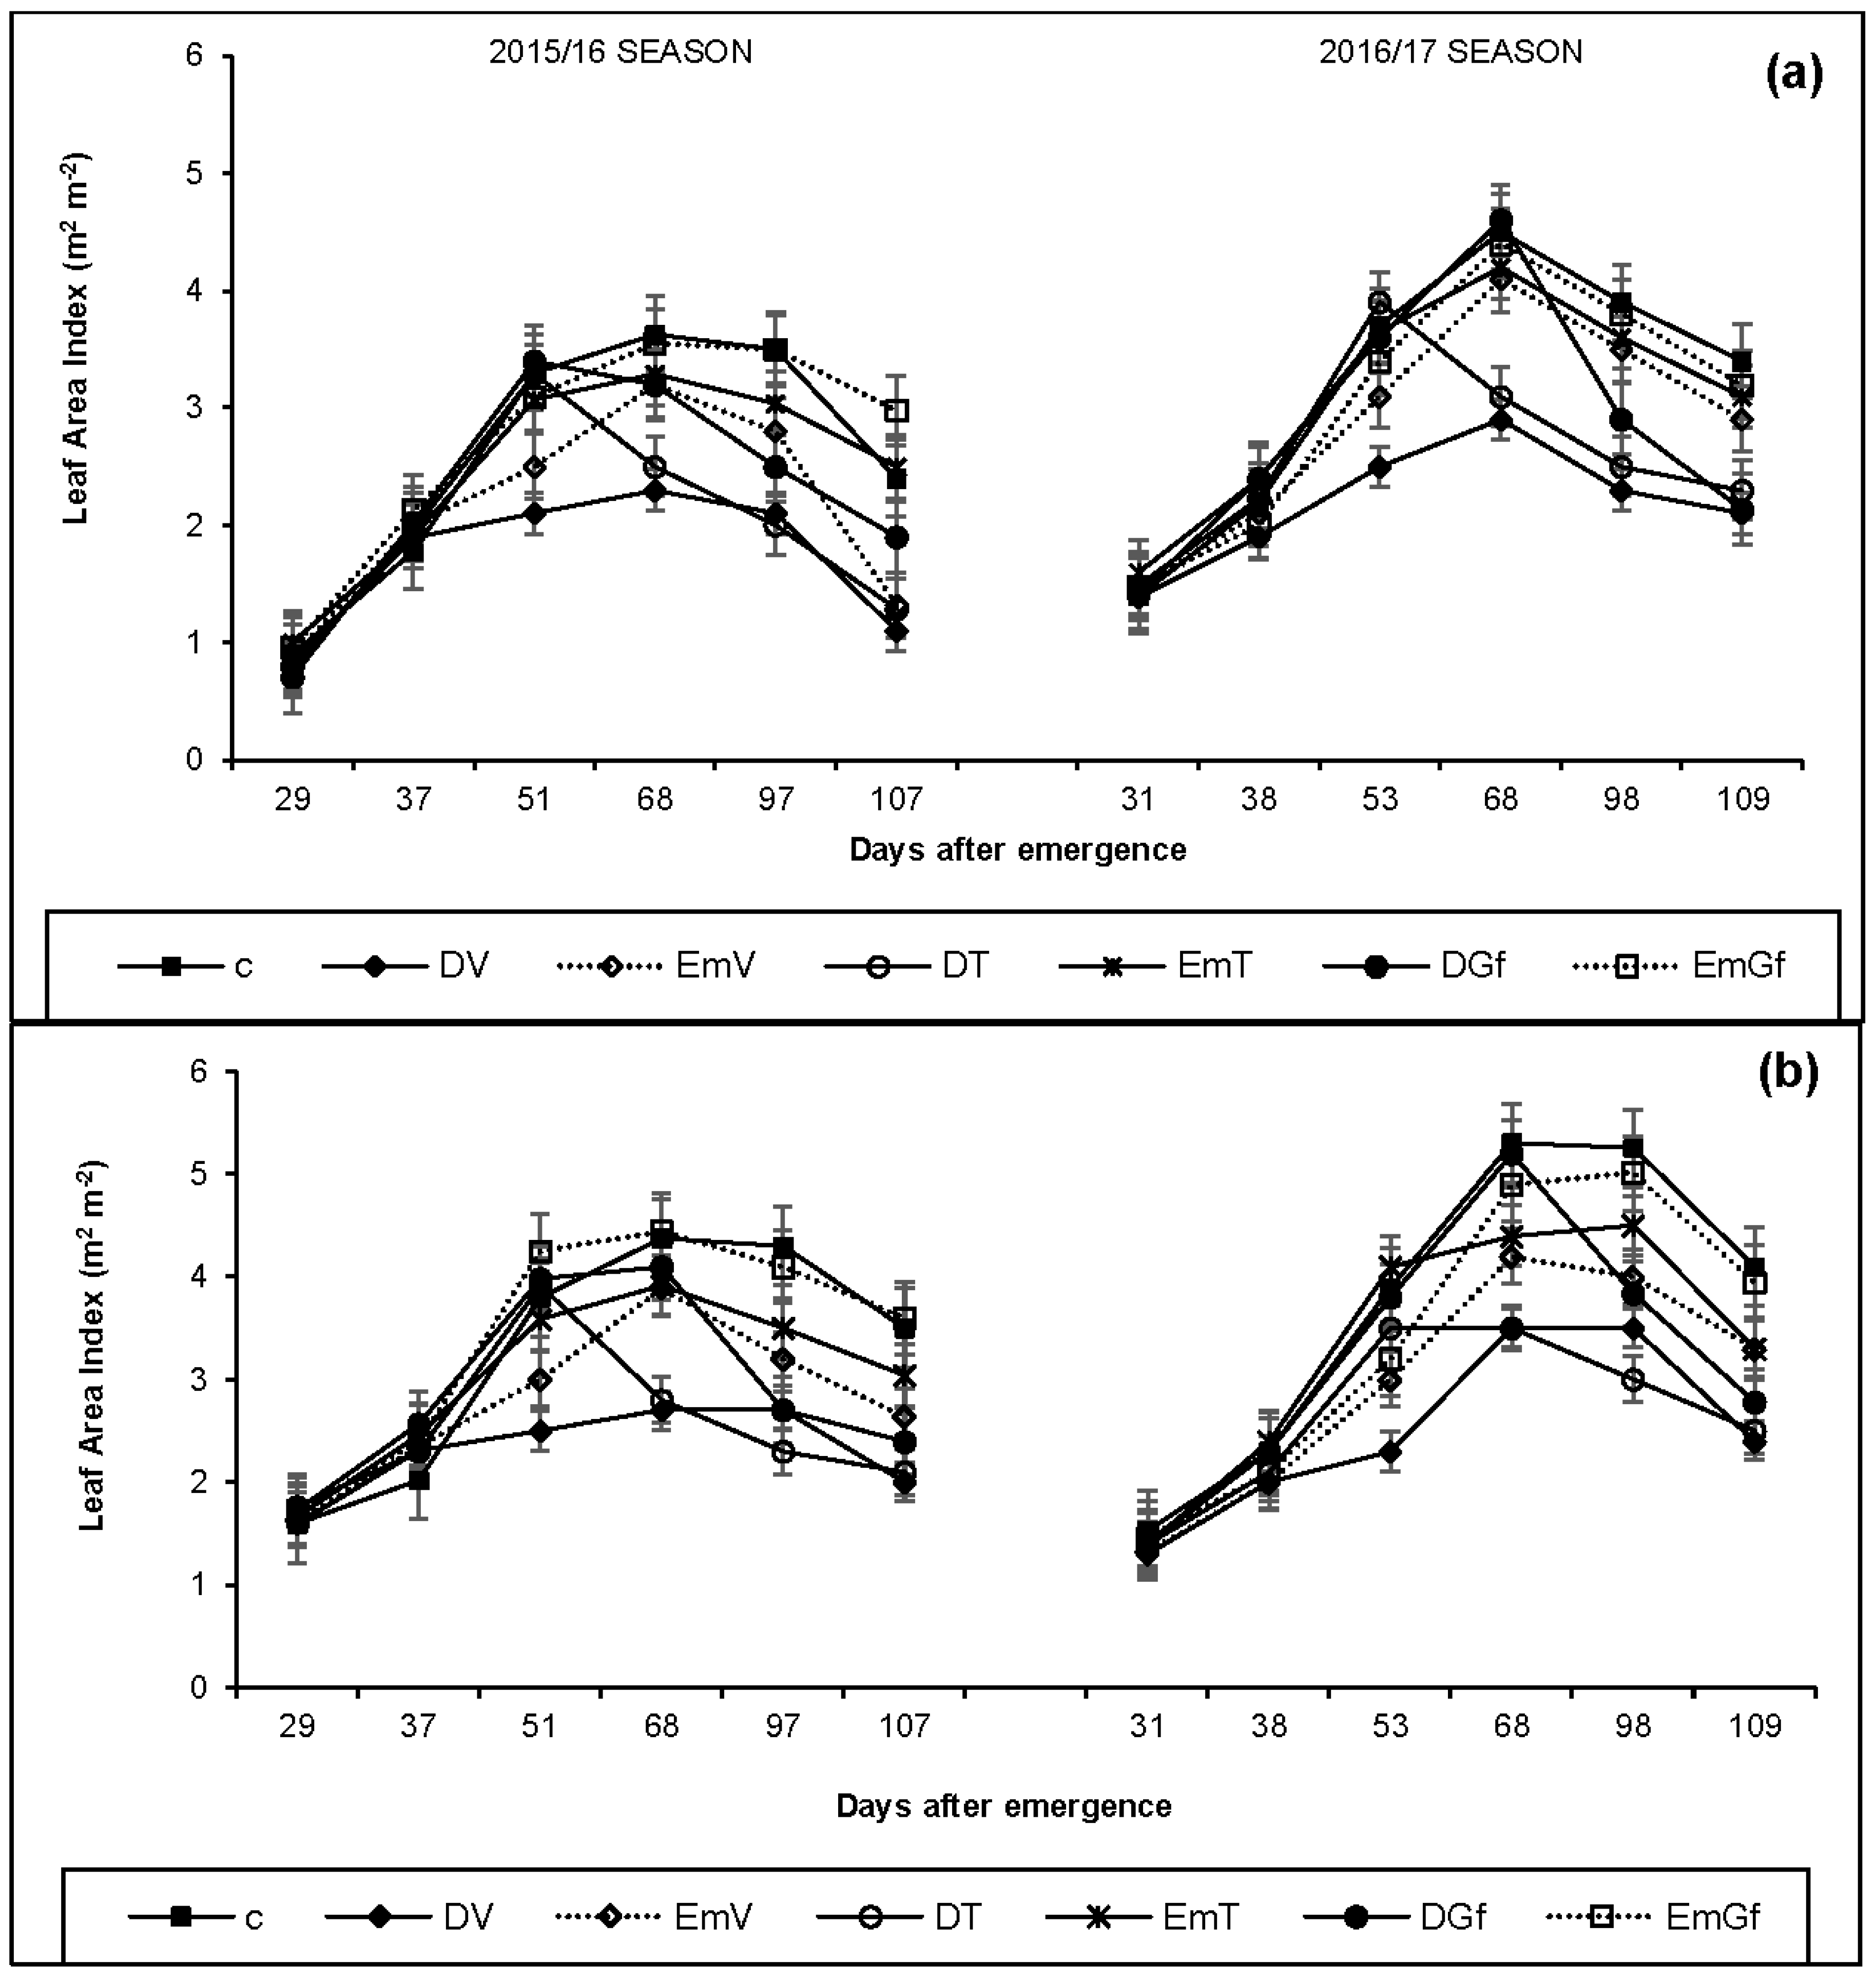
3.3. Leaf Area Index

Overall, the maximum leaf area index for the control treatment ranged between 3.55 (PAN 413) and 4.45 (PAN 6Q-245) during the 2015/2016 and 4.6 (PAN 413) and 5.3 (PAN 6Q-245) during the 2016/2017 growing seasons (Figure 2). The difference between the cultivars is mainly due to their genetic makeup. The difference between the years, however, was likely due to different weather conditions occurring (2015/2016 was warmer with lower relative humidity than 2016/2017). The temperature on some of the days during the 2015/2016 growing season exceeded the crop’s cut-off temperature (30 °C). Imposing drought and excess moisture at a given stage negatively affected leaf area index of the crop, irrespective of the physiological stage of development and cultivar. Once drought was imposed on the crop, the LAI remained lower than the other treatments even after the resumption of irrigation.
The effect of drought on maize LAI was more pronounced on the drought susceptible cultivar compared with the drought tolerant cultivar at all growth stages. For instance, drought imposed during the vegetative stage during the 2015/2016 growing season resulted a 36% reduction (51 DAE) in the LAI of the drought tolerant cultivar PAN 413 but 42% for the drought susceptible PAN 6Q-245 cultivar compared to their respective control treatments. In contrast, excess moisture applied during the same growth stage resulted in a 24% drop in LAI for PAN 413 and a 21% drop for PAN 6Q-245 compared with their respective control treatments.

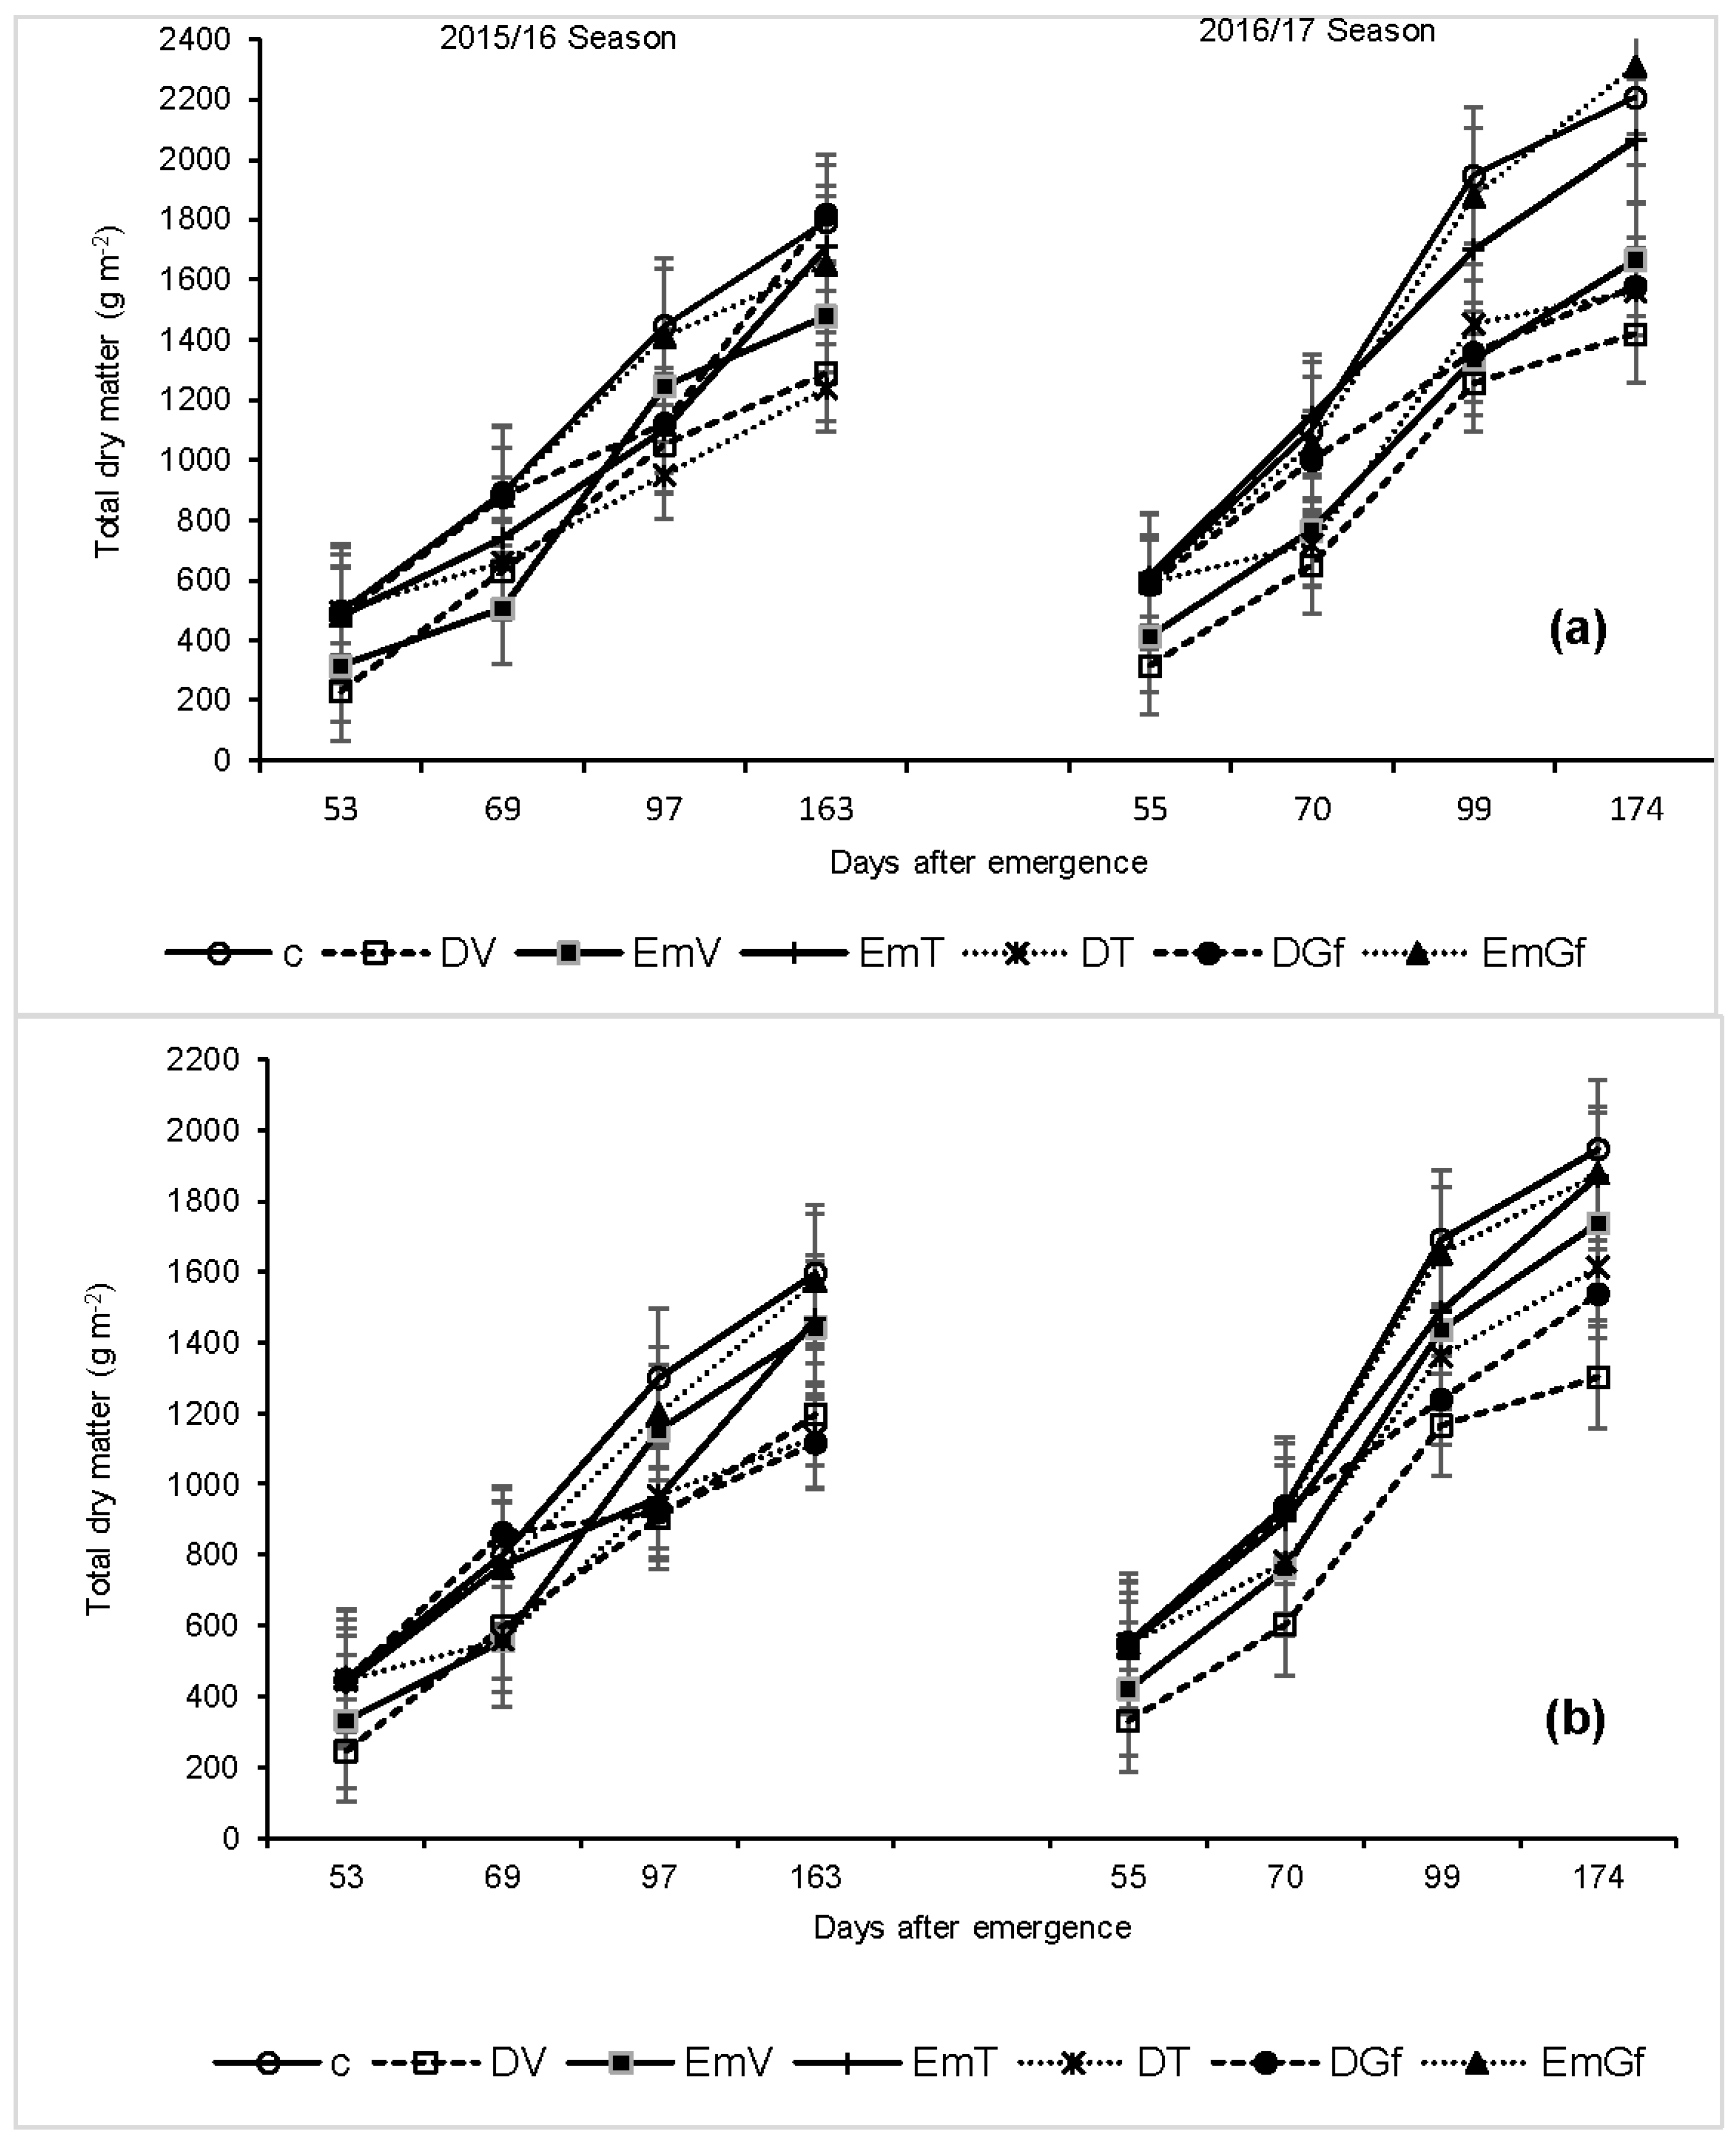
3.4. Dry Matter Accumulation

Drought and flooding imposed at all growth stages reduced dry matter accumulation significantly (p < 0.05) compared with the control treatment, except for the treatment stressed during the grain filling stage, which remained similar to the control (Figure 3). The effect of drought on dry matter accumulation during the vegetative and tasseling stages was more severe than that of flooding during the same growth stages. Besides, plants exposed to flooding during the vegetative and flowering stages showed some recovery once the flooding terminated and water application according to crop requirements resumed. In contrast, plants exposed to drought during the same growth stages did not show recovery later with the resumption of irrigation.

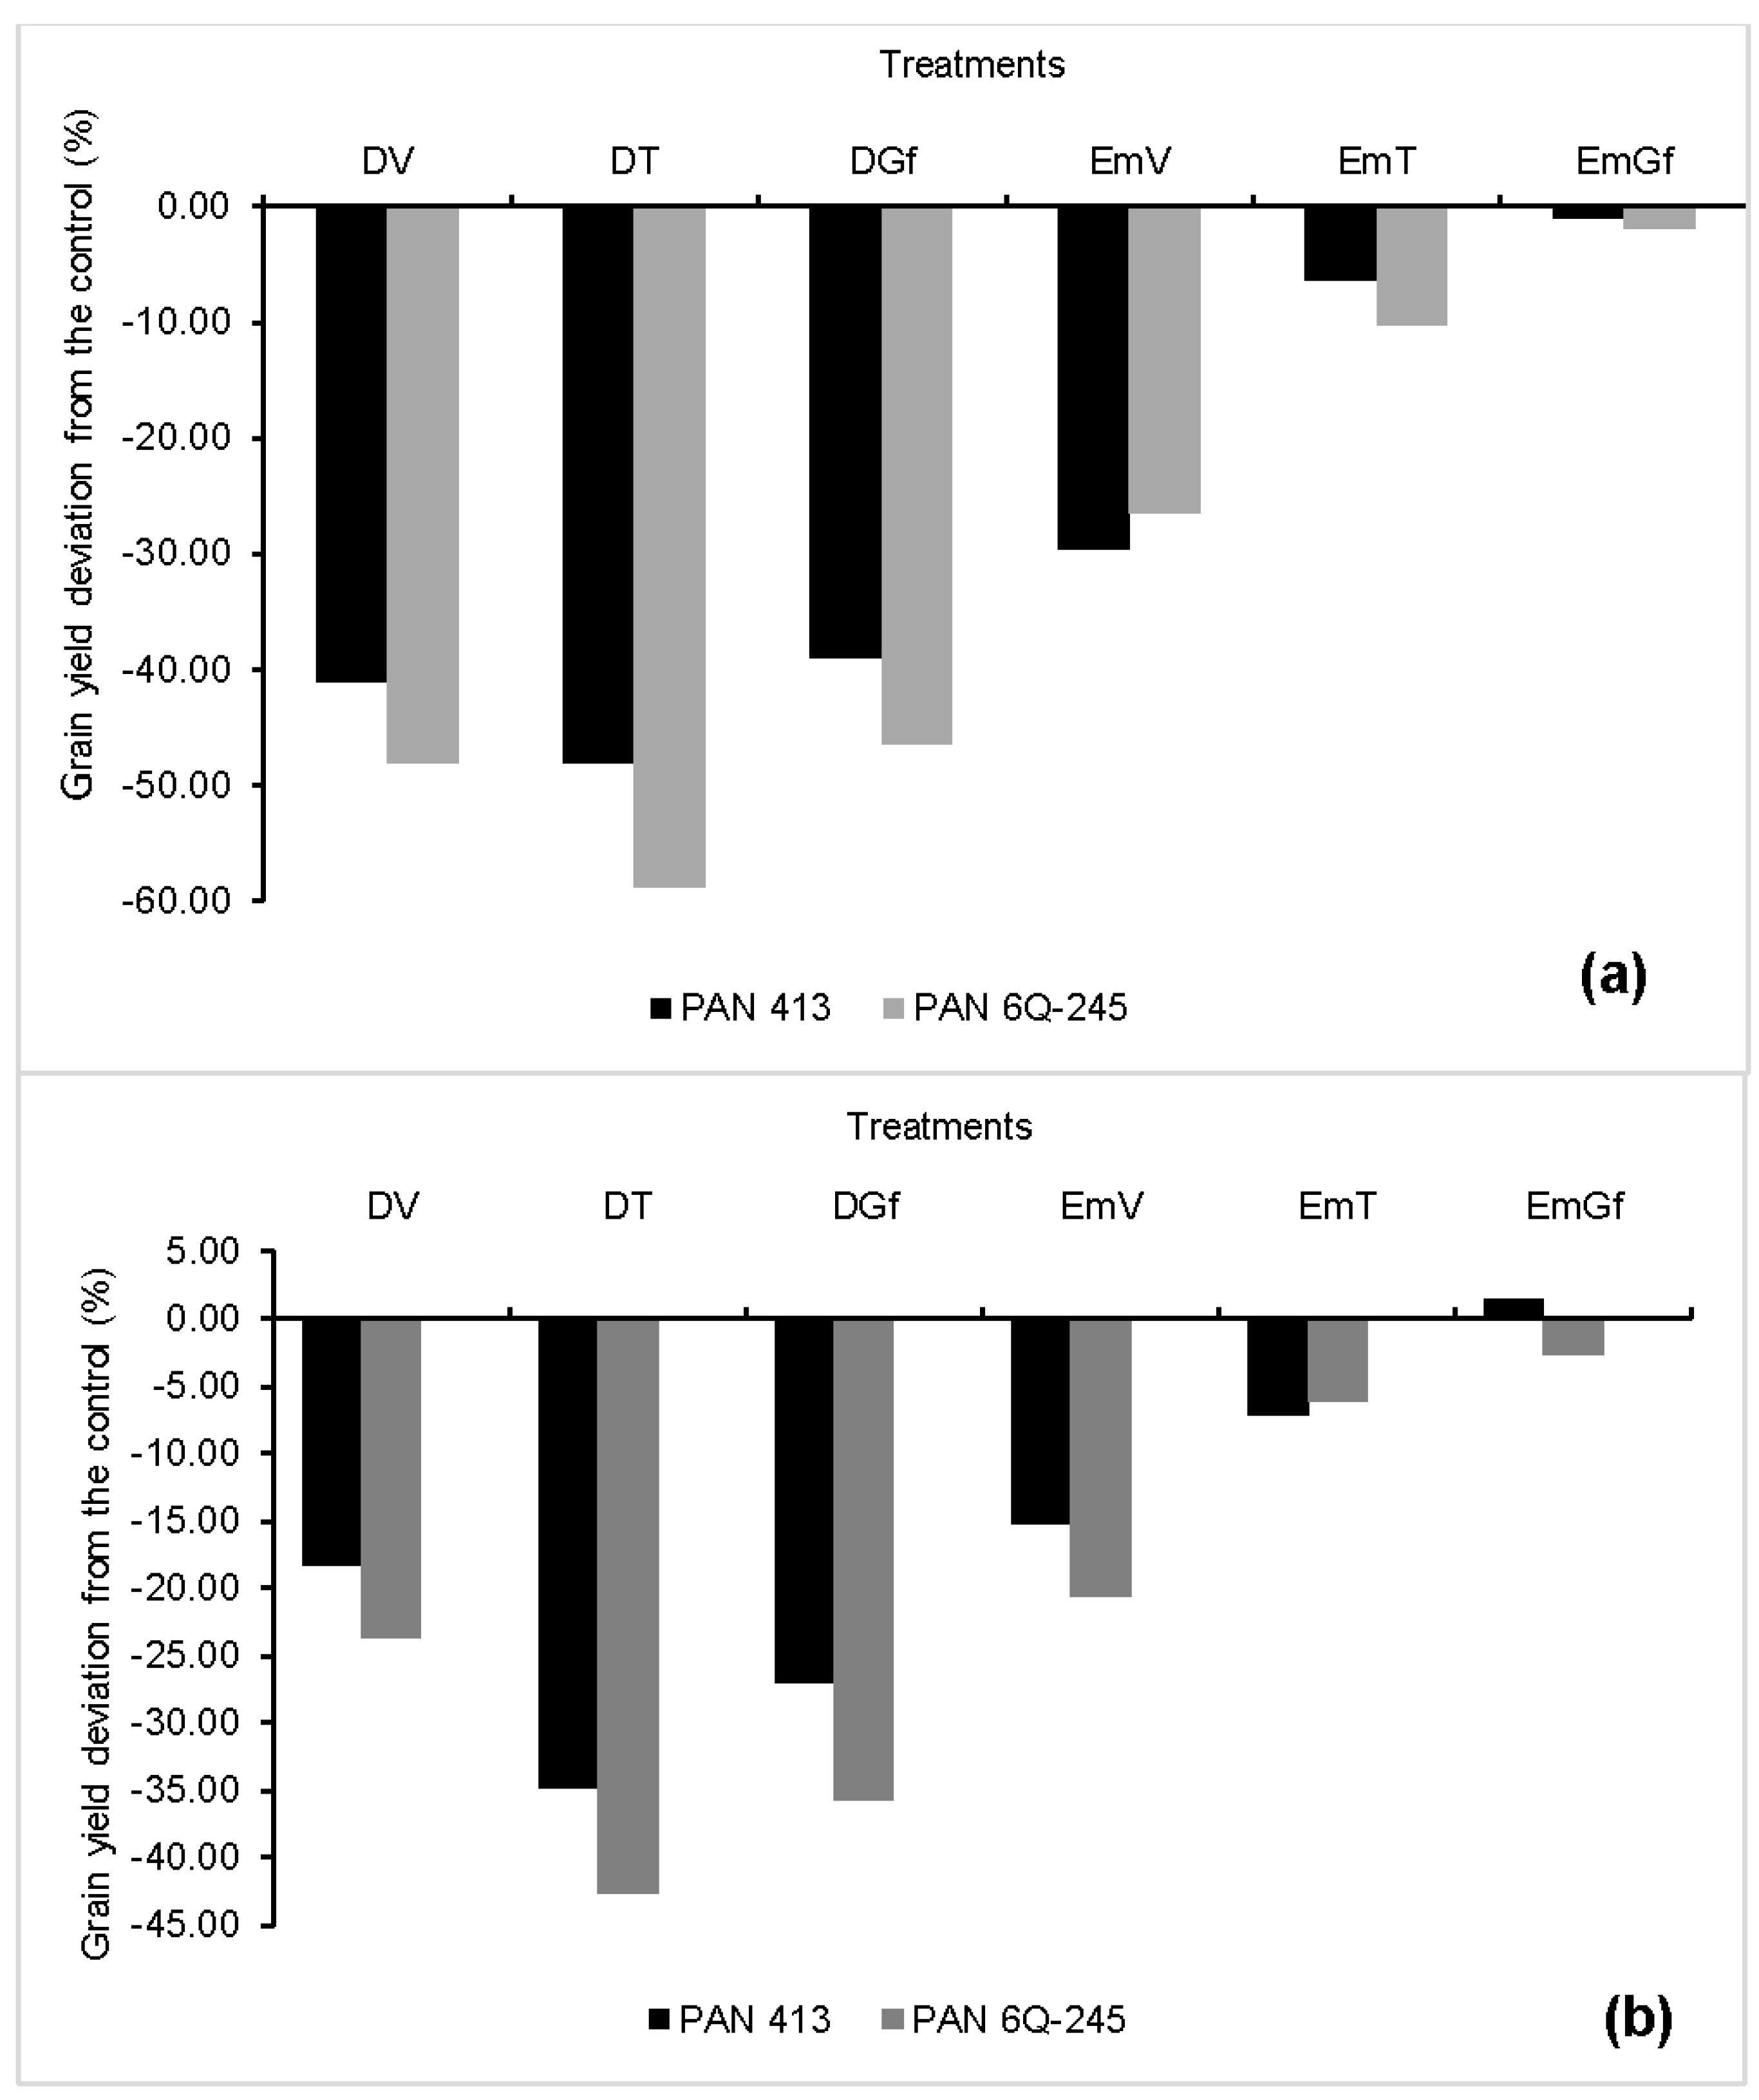
3.5. Kernel Number Per Ear, Kernel Weight, Grain Yield, and Harvest Index

When data were combined for both years, there was a significant interaction (p < 0.01) season × moisture stress × growth stage × stress type as well as interaction at most of the levels for both cultivars on kernel number per ear (Table 5). Kernel number means show similar treatment rankings for each year, which depicts that the interaction was primarily caused by magnitude kernel number per ear differences between the two experimental years (Table 6). The additive effect of drought and high temperatures that prevailed during the 2015/2016 season could have led to such differences amongst those treatments that were imposed to drought. Drought had a significant effect on kernel number at both the vegetative and mid-vegetative to tasselling stages for both cultivars with the effects being much more pronounced for drought imposed at the tasselling stages (Table 6). Applying the required amount of water to the plants resulted in the highest number of kernels being produced per ear. For PAN 413, in the 2016/2017 season, treatments DV, DT, and DGf kernel number per ear were reduced by 29, 44, and 3%, respectively, relative to the control treatment. As for PAN 6Q-245 treatments DV, DT, and DGf kernel weights were reduced by 10, 59, and 10%, respectively, relative to the control treatment. Comparisons of the effect of drought on kernel number per ear on the two cultivars shows that the effects were more pronounced on PAN 6Q-245 than on PAN 413 except for the early vegetative stage. The trends were the same for the 2015/2016 season.
When data were combined for both years, there was a significant (p < 0.01) season × moisture stress × growth stage × stress type interaction effect on kernel weight for both cultivars (Table 5). Kernel weight means show similar treatment rankings for each year, which depicts that the interaction was primarily caused by magnitude kernel weight differences between the two experimental years (Table 6). Even though irrigation was applied according to the profile deficit to field capacity, high temperatures that prevailed during the 2015/2016 season might have led to reduction in kernel weight due to reduced photosynthesis caused by reduced stomatal conductance. Comparison between the treatments showed that the least kernel weight was observed in the treatment DG, whereas the control treatment and EMV, EMT, and EMGf had the highest kernel weight. This was true for both cultivars and both seasons.
Pertaining to the effects of drought on HI, results showed that there were some significant differences (p < 0.05) among the treatments, regardless of the developmental stage at which it was imposed (Table 6). This was true for both PAN 413 and PAN 6Q-245. Treatments exposed to drought at both tasselling (DT) and grain filling (DG) stages had the least HI on both years for both cultivars. Contrastingly, flooding did not have any effect on HI for both cultivars and for both seasons.
When data were combined for both years, there was a significant (p < 0.01) season × moisture stress × growth stage × stress type interaction effect on grain yield for both cultivars (Table 5). Grain yield means interaction depicts that it was primarily caused by magnitude grain yield differences between the two experimental years (Table 6). Although irrigation was applied according to the profile deficit to field capacity to the control treatments, high temperatures that prevailed during the 2015/2016 season might have led to reduction in grain yield compared with similar treatments during the 2016/2017 growing season mainly due to reduced photosynthesis caused by reduced stomatal conductance. Generally, drought and excess moisture caused a significant (p < 0.05) negative effect on maize grain yield (Table 6). The only exception was excess moisture imposed during the grain filling stage (EmGf). As is evident, imposing drought at tasselling has the highest impact on grain yield followed by grain filling stage and, lastly, by the vegetative stage. The same responses were observed in both cultivars for both seasons. Pertaining to the effects of excess moisture on grain yield, results showed that the effects of excess moisture are more pronounced at the vegetative stages followed by tasselling stage. Percent grain yield deviation from the control treatments was more pronounced on the drought intolerant cultivar (PAN 6Q-245), compared with the drought tolerant cultivar (PAN 413) (Figure 4). The drought tolerant cultivar (PAN 413) did not show any precedence over the drought-susceptible cultivar under excess moisture (Figure 4).

4. Discussion

A reduction in photosynthesis due to drought and flooding is ascribed to stomatal and non-stomatal limitations [24]. This can either be due to the physiological control (stomata closure) of the influx of atmospheric CO2 into the mesophyll cells [25] or the perturbation of metabolic activities, such as photo-inactivation of the PSII centres [26]. There was a strong linear relationship between photosynthesis and stomatal conductance at most of the sampling dates 53 DAE (r2 = 0.87), 69 DAE (r2 = 0.83) and 91 DAE (r2 = 0.53) for PAN 413 and for PAN 6Q 245, 53 DAE (r2 = 0.89), 69 DAE (r2 = 0.43), 91 DAE (r2 = 0.71) (results not presented).
The strong relationship existing between photosynthesis and stomatal conductance implies that the reduction in photosynthesis is regulated by stomatal closure, while a weak relationship indicates that the reduction in photosynthesis is a result of regulation by non-stomatal factors [27]. The decrease in photosynthesis due to drought is in agreement with previous reports for maize by Pelleschi et al. [28] and Voronin et al. [29]. Pertaining to reduced photosynthesis due to excess moisture, similar findings have been reported by Ashraf et al. [30], Ahmed et al. [31], and Yordanova and Popova [32]. Ahmed et al. [31] attributed reduction in photosynthesis to stomatal closure, although they noted that not all the reduction was due to stomatal closure, which agrees with the current findings. The same authors highlighted that damages occurred internally correlated with photo-inhibition, one of the non-stomatal factors limiting photosynthesis. The same mechanisms reported under drought stress also occur under flooding stress, whereby there is a reduction in the stomatal apertures caused by internal water deficit. Therefore, there is a reduction in CO2 intake by the leaf, and photosynthetic carbon assimilation is decreased in favour of respiration [32].
The effect of reduced photosynthesis is two-fold: first, water is not released through the stomata to satisfy the atmospheric demand, and then the amount of assimilation is reduced because of reduced CO2 levels in the sub-stomatal cavity [30]. Accordingly, the reduced CO2 assimilation leads to reduced biomass accumulation, causing lower dry matter partitioning to the different plant organs, including leaves, consequently leading to reduced LAI. Reduced LAI translates into reduced interception of solar radiation, with reduced photosynthates production [20].
Our findings concur with the findings of Çakir [13] who reported a decrease in LAI as a result of drought. The results also agree with the notion that leaf elongation is one of the most sensitive plant processes to limited water [33]. Requirement of photosynthates and energy is reduced in leaves under drought conditions and the photosynthetic assimilates from leaves are directed toward roots for their elongation to increase the water uptake [34]. Roots act as primary sensors of water deficiency in soil and transduce signals to the aerial parts to modulate the growth and development [35]. The consequence is a decline in the leaf area and thus the crop canopy. Like drought conditions, LAI was also negatively affected under excess moisture conditions at all growth stages. However, the impact was relatively low under flooding compared with drought imposed during the same growth stage (Table 6). Similar findings on the effect of excess moisture on maize LAI has been reported by Guoping et al. [36] and Jiang et al. [37], who found out that exposing the crop to excess moisture/waterlogged conditions can result in reduced LAI.
Water deficit is one of the limiting factors for plant growth and development and has a two-fold effect on plants as it reduces the production of dry matter and causes a disorder to the partitioning of carbohydrates to grain, hence reducing HI [38]. The reported significant (p < 0.05) maize biomass accumulation reduction due to water stress and flooding imposed at the early vegetative stage compared with the non-stressed treatment is in line with previous studies [12,19]. This reduction in biomass accumulation is attributed to reduced leaf expansion and reduced stem internode elongation due to the water stress [13] or flooding [20], consequently affecting the dry matter accumulation. In contrast to our findings and those of Rene et al. [19], Guoping et al. [36], reported that excess moisture around anthesis did not have any effect on maize dry matter accumulation. The inconsistency is most probably attributed to the duration of the water logging. In our case, the plots were flooded for eight consecutive days, whereas in Guoping et al. [36], waterlogging lasted only three days. Their findings regarding the effect of flooding during the grain filling stage on maize dry matter accumulation, however, agree with ours.
Generally maize grain yield varied between the two growing seasons. This variation is mainly attributed to the variation in air temperature between the two growing seasons. The temperature on some of the days during the 2015/2016 growing season exceeded the crop’s cut-off temperature (>30 °C). Lobell et al. [39] observed a strong negative yield response to accumulation of temperatures above 30 °C (or extreme degree days). This is attributed to a higher vapor pressure demand (VPD) between the saturated leaf interior and the ambient air which forces the plants to close their stomata, despite the presence of enough water in the soil. At such high temperature, the plants will not be able to deliver the required amount of water to satisfy the atmospheric demand due to the resistance encountered as the water travels from the soil through the plant to the atmosphere at the soil–root interface, root endodermis resistance, root-xylem resistance, petiole resistance, and stomatal resistance.
Our results showed that drought imposed at any growth stage results in grain yield reductions, with the extent of damage depending on the developmental stage at which crop stress was imposed. This drop in yield is attributed to the decrease in the kernel number per plant and/or kernel weight resulting in the reduction of HI. Reduction in HI due to progressive water stress explains the fact that grain yield is much more affected than the total dry matter [40]. Water stress during the tasselling stage lowered kernel number by 44%, which was twice and higher than the effect from stress imposed during other stages. This indicates that water availability at tasselling stage is very critical for maize yield. Zinselmeier et al. [41] reported embryo formation in plants subjected to low water potential for five days around pollination, but also observed a decline in ovary starch, which consequently resulted in reduced kernel number per plant. On the other hand, the impact of water stress during the grain filling stage was more prevalent on the kernel weight, causing a 16% reduction compared with the control. This reduction is about a third of the impact caused by water stress during the tasselling stage on kernel number. The reduction in kernel weight observed in our study is most probably attributed to the presence of a weak source (leaves) that could supply the required amount of assimilates to the sink (kernels) since drought caused a drastic drop in LAI. At this stage, grain set occurred well, as can be shown by high number of grains that were formed, but the kernel weight was very low. Our findings differ from the ones that were reported by Çakir [13], who found out that the treatments under drought had higher kernel weight. He attributed this to higher grain filling rate in the presence of fewer kernels. Such differences could most probably be due to genetic factors.
Zaidi et al. [18] attributed grain yield reduction to the effects of excess moisture on various growth and biochemical parameters, impairment of anthesis, and silking, which eventually resulted in poor kernel development. The impact of flooding on kernel number and kernel weight varied among developmental stages during which flooding was imposed and was inconsistent between years. Flooding imposed at all developmental stages did not reduce the kernel number for both cultivars in both years, except for the flooding imposed during the vegetative stage for PAN 413 in 2016/2017. The impact of flooding on kernel weight was also inconsistent between years for each cultivar. During the 2015/2016 growing season, flooding didn’t cause any significant effect on the kernel weight of PAN 6Q-245. In 2016/2017, however, there was a 6.5% reduction in kernel weight for treatments flooded during the tasselling stages compared with the control. On the other hand, flooding during the vegetative and tasselling stages in the 2015/2016 growing season caused a 5% reduction in kernel weight compared with the control for PAN 413. While flooding during the 2016/2017 growing season did not cause any significant impact on kernel weight of PAN 413. The absence of significant reduction in kernel weight and kernel number from flooding treatments could be due to the adventitious roots which started to grow from the first and second nodes above the soil, which is in agreement with the studies of Klepper [42].

5. Conclusions

It was evident from this study that existing maize cultivars (drought tolerant and drought intolerant) are both prone to potential extreme (extended) drought events experienced during the tasselling stage with potential grain yield reductions of 50% and higher. The impact is particularly prevalent on drought intolerant cultivars. The study also showed that both cultivars are prone to probable flooding events, more specifically, between the early growth stages up to the tasselling stage, with maximum grain reductions of approximately 21%. This therefore poses a threat to the food security of Sub-Saharan African countries where drought and flooding conditions have become very prevalent even within a single growing season. It is recommended that plant breeders’ efforts be directed to developing maize cultivars with multiple stress tolerances.

Author Contributions

R.M. contributed with designing the experiment, data-preparation, data analysis and writing of the first draft. E.H.T. contributed to the design, supervision, data interpretation, writing, editing and review of the first and final draft. A.H. and G.B. contributed with supervision, writing and review of the final draft.

Funding

The research leading to these results has received funding from the European Community’s Seventh Framework Programme (FP7/2007-2013) under grant agreement No. 613817 (MODEXTREME—Modelling vegetation response to EXTREMe Events, http://modextreme.org). Additional funding was made available from National Research Foundation and the Department of Science and Technology, South Africa. The first author is very grateful for University of Pretoria for providing him with UP PhD bursary.

Acknowledgments

We are grateful to the farm labourers of the University of Pretoria for the invaluable support during the study. The help of the anonymous reviewers in editing of the article is also acknowledged.

Conflicts of Interest

The authors declare no conflict of interest.

References

  1. Estes, L.D.; Beukes, H.; Bethany, A.; Bradley, S.R.; Oppenheimer, M.D.; Ruan, A.C.; Schulze, R.; Tadross, M. Projected Climate Impacts to South African Maize and Wheat Production in 2055: A Comparison of Empirical and Mechanistic Modelling Approaches. Glob. Chang. Biol. 2013, 19, 3762–3774. [Google Scholar] [CrossRef] [PubMed]
  2. Abraha, M.G.; Savage, M.J. Potential Impacts of Climate Change on the Grain Yield of Maize for the Midlands of KwaZulu-Natal, South Africa. Agric. Ecosyst. Environ. 2006, 115, 150–160. [Google Scholar] [CrossRef]
  3. Powel, J.P.; Reinhard, S. Measuring the effects of extreme weather events on yields. Weather Clim. Extrem. 2016, 2, 69–79. [Google Scholar] [CrossRef]
  4. Kruger, A.C.; Sekele, S.S. Trends in extreme temperature indices in South Africa, 1962–2009. Int. J. Climatol. 2012, 33, 661–676. [Google Scholar] [CrossRef]
  5. Donat, M.; Alexander, L.V.; Yang, H.; Durre, I.; Vose, R.; Dunn, R.J.; Hewitson, B. Updated analyses of temperature and precipitation extreme indices since the beginning of the twentieth century: The HadEX2 dataset. J. Geophys. Res. 2013, 118, 2098–2118. [Google Scholar] [Green Version]
  6. National Department of Agriculture. Impact of Drought on Crop Production and the Food Value Chain; National Department of Agriculture: Pretoria, South Africa, 2016.
  7. Musyoki, A.; Thifhulufhelwi, R.; Murungweni, F.M. The impact of and responses to flooding in Thulamela Municipality, Limpopo Province, South Africa. J. Disaster Risk Stud. 2016, 8, 166. [Google Scholar] [CrossRef] [PubMed]
  8. Mavhura, E.; Manatsa, D.; Mushore, T. Adaptation to drought in arid and semi-arid environments: Case of the Zambezi Valley, Zimbabwe. J. Disaster Risk Stud. 2015, 7, 1–7. [Google Scholar] [CrossRef] [PubMed]
  9. Zaidi, P.H.; Yadav, M.; Singh, D.K.; Singh, R.P. Relationship between Drought and Excess Moisture Tolerance in Tropical Maize (Zea mays L.). Aust. J. Crop Sci. 2008, 1, 78–96. [Google Scholar]
  10. Atteya, A.M. Alteration of Water Relations and Yield of Corn Genotypes in Response to Drought Stress. Bulg. J. Plant Physiol. 2003, 29, 63–76. [Google Scholar]
  11. Kamara, A.Y.A.; Menkir, B.B.; Ibikun, l.O. The Influence of Drought Stress on Growth, Yield and Yield Components of Selected Maize Genotypes. J. Agric. Sci. 2003, 141, 43–50. [Google Scholar] [CrossRef]
  12. Çakir, R. Effect of Water Stress at Different Development Stages on Vegetative and Reproductive Growth of Corn. Field Crops Res. 2004, 89, 1–16. [Google Scholar] [CrossRef]
  13. Monneveux, P.; Sanchez, C.; Beck, D.; Edmeades, G.O. Drought Tolerance Improvement in Tropical Maize Source Populations. Crop Sci. 2006, 46, 180–191. [Google Scholar] [CrossRef]
  14. Ricard, B.; Couée, I.; Raymond, P.; Saglio, P.H.; Saint-Ges, V.; Pradet, A. Plant Metabolism under Hypoxia and Anoxia. Plant Physiol. Biochem. 1994, 32, 1–10. [Google Scholar]
  15. Bansal, R.; Srivastava, J. Effect of Waterlogging on Photosynthetic and Biochemical Parameters in Pigeon pea. Russ. J. Plant Physiol. 2015, 62, 322–327. [Google Scholar] [CrossRef]
  16. Grzesiak, S.; Hura, T.; Grzesiak, M.T.; Pieńkowski, S. The Impact of Limited Soil Moisture and Waterlogging Stress Conditions on Morphological and Anatomical Root Traits in Maize (Zea mays L.) Hybrids of Different Drought Tolerance. Acta Physiol. Plant. 1999, 21, 305–315. [Google Scholar] [CrossRef]
  17. Zaidi, P.H.; Rafique, S.; Singh, N.N. Response of Maize (Zea mays L.) Genotypes to Excess Soil Moisture Stress: Morpho-Physiological Effects and Basis of Tolerance. Eur. J. Agron. 2003, 19, 383–399. [Google Scholar] [CrossRef]
  18. Zaidi, P.H.; Rafique, S.; Rai, P.K.; Singh, N.N.; Srinivasan, G. Tolerance to Excess Moisture in Maize (Zea mays L.): Susceptible Crop Stages and Identification of Tolerant Genotypes. Field Crops Res. 2004, 90, 189–202. [Google Scholar] [CrossRef]
  19. Ren, B.; Zhang, J.; Li, X.; Fan, X.; Dong, S.; Liu, P.; Zhao, B. Effects of Waterlogging on the Yield and Growth of Summer Maize under Field Conditions. Can. J. Plant. Sci. 2014, 94, 23–31. [Google Scholar]
  20. Hatfield, J.L.; Prueger, J.H. Temperature extremes: Effect on plant growth and development. Weather Clim. Extrem. 2015, 10, 4–10. [Google Scholar] [CrossRef]
  21. Zaidi, P.H.; Maniselvan, P.; Yadav, P.; Singh, A.K.; Sultana, R.; Dureja, P.; Singh, R.P.; Srinivasan, G. Stress-adaptive changes in tropical maize (Zea mays L.) under excessive soil moisture stress. Maydica 2007, 52, 159–171. [Google Scholar]
  22. Soil Classification Working Group. Soil Classification: A Taxonomic System for South Africa; Department of Agriculture Development: Pretoria, South Africa, 1991. [Google Scholar]
  23. Payne, R.W. GenStat. WIREs Comput. Stat. 2009, 1, 255–258. [Google Scholar] [CrossRef]
  24. Shangguan, Z.; Shao, M.; Dyckmans, J. Interaction of osmotic adjustment and photosynthesis in winter wheat under soil drought. J. Plant Physiol. 1999, 154, 753–758. [Google Scholar] [CrossRef]
  25. Chaves, M.M. Effects of Water Deficits on Carbon Assimilation. J. Exp. Bot. 1991, 42, 1–16. [Google Scholar] [CrossRef]
  26. Farquhar, G.D.; Hubick, K.T.; Condon, A.G.; Richards, R.A. Carbon Isotope Fractionation and Plant Water-Use Efficiency. In Stable Isotopes in Ecological Research; Springer: Berlin, Germany, 2017; pp. 21–40. Available online: http://link.springer.com/chapter/10.1007/978-1-4612-3498-2_2 (accessed on 21 March 2017).
  27. Siddique, M.R.B.; Hamid, A.; Islam, M.S. Drought Stress Effects on Photosynthetic Rate and Leaf Gas Exchange of Wheat. Botanical Bulletin of Academia Sinica 40. Available online: https://ejournal.sinica.edu.tw/bbas/content/1999/2/bot402-06.html (accessed on 20 January 2016).
  28. Pelleschi, S.; Rocher, J.P.; Prioul, J.L. Effect of Water Restriction on Carbohydrate Metabolism and Photosynthesis in Mature Maize Leaves. Plant Cell Environ. 1997, 20, 493–503. [Google Scholar] [CrossRef]
  29. Voronin, P.Y.; Rakhmankulova, Z.F.; Maevskaya, S.N.; Nikolaeva, M.K.; Shuiskaya, E.V. Changes in Photosynthesis Caused by Adaptation of Maize Seedlings to Short-Term Drought. Russ. J. Plant Physiol. 2014, 61, 131–135. [Google Scholar] [CrossRef]
  30. Ashraf, M.; Athar, H. Interactive Effects of Nitrate and Long-Term Waterlogging on Growth, Water Relations, and Gaseous Exchange Properties of Maize (Zea mays L.). Plant Sci. 1999, 144, 35–43. [Google Scholar] [CrossRef]
  31. Ahmed, S.E.; Nawata, M.; Hosokawa, Y.; Domae, S.T. Alterations in Photosynthesis and Some Antioxidant Enzymatic Activities of Mungbean Subjected to Waterlogging. Plant Sci. 2002, 163, 117–123. [Google Scholar] [CrossRef]
  32. Yordanova, R.Y.; Popova, L.P. Flooding-Induced Changes in Photosynthesis and Oxidative Status in Maize Plants. Acta Physiol. Plant. 2007, 29, 535–541. [Google Scholar] [CrossRef]
  33. Hsiao, T.C. Plant Responses to Water Stress. Annu. Rev. Plant Physiol. 1973, 24, 519–570. [Google Scholar] [CrossRef]
  34. Taiz, L.; Zeiger, E. Plant Physiology, 4th ed.; Sinauer Associate: Sunderland, MA, USA, 2006. [Google Scholar]
  35. Aslam, M.; Muhammad, A.M.; Cengiz, R. Effects of Drought on Maize. In Drought Stress in Maize (Zea Mays L.); Springer: Berlin, Germany, 2016; pp. 5–17. Available online: http://link.springer.com/chapter/10.1007/978-3-319-25442-5_2 (accessed on 25 September 2016).
  36. Guoping, C.; Shixiao, Z.; Zhiwen, L. Studies on Waterlogging of Corn and Protection Measures II. Response of Corn to Waterlogging in Various Growing Stages. Acta Agric. Bor. Sin. 1989, 4, 16–22. [Google Scholar]
  37. Jiang, D.Q.T.; Zhang, Z. Effect of Waterlogging on Senescence of Flag Leaf and Root of Wheat Yangmai. Ying Yong Sheng Tai Xue Bao. J. Appl. Ecol. 2002, 13, 1519–1521. [Google Scholar]
  38. Setter, T.L. Transport/harvest index: Photosynthate partitioning in stressed plants. Plant Biol. In Stress Response in Plants: Adaption and Acclimation Mechanisms; Cumming, J.R., Ed.; Wiley-Liss, Inc.: New York, NY, USA, 1990; pp. 17–36. [Google Scholar]
  39. Lobell, D.B.; Hammer, G.L.; McLean, G.; Messina, C.; Roberts, M.J.; Schlenker, W. The critical role of extreme heat for maize production in the United States. Nat. Clim. Chang. 2013, 3, 497–501. [Google Scholar] [CrossRef]
  40. Rafiee, M.; Shakarami, G. Water Use Efficiency of Corn as Affected by Every Other Furrow Irrigation and Planting Density. World Appl. Sci. J. 2010, 11, 826–829. [Google Scholar]
  41. Zinselmeier, C.; Jeong, B.; Boyer, J.S. Starch and the control of kernel number in maize at low water potentials. Plant Physiol. 1999, 121, 25–36. [Google Scholar] [CrossRef] [PubMed]
  42. Klepper, B. Origin, Branching and Distribution of Root Systems. In Root Development and Function; Gregory, P.J., Lake, J.V., Rose, D.A., Eds.; Cambridge University Press: Cambridge, UK, 1987; pp. 103–124. Available online: https://books.google.co.za/books?hl=en&lr=&id=OyQ9AAAAIAAJ&oi=fnd&pg=PR6&dq=Root+Development+and+Function%2B1987&ots=PTxhysw_3M&sig=yB5lm61qkKe0IbabM8J6px3WLM#v=onepage&q=Root%20Development%20and%20Function%2B1987&f=false (accessed on 25 July 2017).
Figure 1. Stomatal conductance (mmol m−2 s−1) of (a) PAN 413 and (b) PAN 6Q-245 maize cultivars under drought imposed at, vegetative stage (DV), mid-vegetative to tasselling stage (DT), grain filling stage (DGf), and flooding imposed at early to mid-vegetative stage (EmV), mid-vegetative to tasselling stage (EmT), and grain filling stage (EmGf), and control (c). Error bars indicate the 95% confidence interval of each mean value.
Sustainability 10 03492 g001
Figure 2. Leaf area index of (a) PAN 413 and (b) PAN 6Q-245 maize cultivars over time under drought imposed at vegetative stage (DV), mid-vegetative to tasselling stage (DT), or the grain filling stage (DGf) and flooding imposed at early to mid-vegetative stage (EmV), mid-vegetative to tasselling stage (EmT), and grain filling stage (EmGf), and control (c). Error bars represent ± standard error.
Sustainability 10 03492 g002
Figure 3. Dry matter accumulation of (a) PAN 413 and (b) PAN 6Q-245 maize cultivars over time under drought imposed at vegetative stage (DV), mid-vegetative to tasselling stage (DT), or the grain filling stage (DGf) and flooding imposed at, early to mid-vegetative stage (EmV), mid-vegetative to tasselling stage (EmT), and grain filling stage (EmGf), and control (c). Error bars represent ± standard error.
Sustainability 10 03492 g003
Figure 4. Percentage grain yield deviations of two maize cultivars during the seasons (a) 2015/2016 and (b) 2016/2017 under drought imposed at vegetative stage (DV), mid-vegetative to tasselling stage (DT), grain filling stage (DGf) and flooding imposed at early to mid-vegetative stage (EmV), mid-vegetative to tasselling stage (EmT), and grain filling stage (EmGf), and control (c). Error bars represent ± standard error.
Sustainability 10 03492 g004
Table 1. Selected soil physical and chemical properties of the study site.
PropertiesSoil Layer (cm)
0–2020–4040–6060–8080–100
Clay%31.6936.5036.7134.7933.01
Silt%5.6611.067.427.405.56
Sand%62.6552.4455.8757.8161.42
Organic matter%3.621.961.951.751.36
pH (H2O)6.496.566.346.326.24
Electrical conductivity (μS m−1)22.18.318.8310.9710.14
Field capacity (m3 m−3)0.270.330.300.320.27
Bulk density (Mg m−3)1.511.461.361.461.39
Table 2. Two-weekly mean maximum, minimum, and average temperatures (Tmax, Tmin, Tave, respectively), mean reference evapotranspiration (ET0), and mean maximum, and minimum relative humidity (RHmax and RHmin) for the 2015/2016 and 2016/2017 growing seasons at University of Pretoria Hatfield Experimental Farm, Pretoria, South Africa.
SeasonParameterOctoberNovemberDecemberJanuaryFebruaryMarchApril
Weeks
3–41–23–41–23–41–23–41–23–41–23–41–23–4
2015/2016Tmax, °C31.5432.1229.6232.6033.0631.5629.2032.3731.8330.1128.2827.1428.43
Tmin, °C14.7515.4513.7417.9218.5117.8917.2517.3818.6517.1515.0412.9913.37
Tave, °C23.1423.7921.6825.2625.7924.7323.2324.8825.2423.6321.6620.0720.9
ET0 (mm day−1)6.246.896.266.016.315.665.055.835.024.343.513.773.42
RHmax (%)59.6338.3663.7765.4360.1762.1069.6661.8669.3565.5668.6368.0167.27
RHmin (%)9.513.4811.7214.1611.7419.3222.7915.2420.2722.2820.9720.9416.51
2016/2017Tmax29.729.128.430.2429.2627.830.0430.0425.7428.8329.3228.1724.93
Tmin16.115.715.516.717.1117.0815.117.8616.7914.5214.2114.539.73
Tave22.922.421.9523.4723.1922.4422.5723.9521.2621.6621.7721.3517.33
ET0 (mm day−1)5.645.525.635.814.984.565.974.603.794.714.433.373.04
RHmax (%)60.2667.9570.567.570.7573.4367.5368.7273.5370.5969.4072.8466.26
RHmin (%)14.7120.4622.3522.7324.4632.5819.1723.6637.5117.6516.2922.0016.43
Table 3. A summary of treatments used for the study. X, irrigated to field capacity at a given growth stage; D, drought applied at a given growth stage; Em, excess moisture applied at a given growth stage; C1, cultivar 1 namely PAN 413; C2, cultivar 2 namely PAN 6Q-245; c, control treatment.
Treatment NumberExperimental TreatmentsGrowth Stages/Periods
Early Vegetative (V)Mid Vegetative-Tasselling (T)Grain Filling (Gf)
1C1-cXXX
2C2-cXXX
3C1DVDXX
4C2DVDXX
5C1DTXDX
6C2DTXDX
7C1DGfXXD
8C2DGfXXD
9C1EmVEmXX
10C2EmVEmXX
11C1EmTXEmX
12C2EmTXEmX
13C1EmGfXXEm
14C2EmGfXXEm
Table 4. Effect of drought and flooding stress exposed to two maize cultivars at different growth stages on photosynthesis (Pn) measured in μmol m−2 s−1. Drought was imposed at vegetative stage (DV), mid-vegetative to tasselling stage (DT), grain-filling stage (DGf), and flooding imposed at, early to mid-vegetative stage (EmV), mid-vegetative to tasselling stage (EmT), and grain filling stage (EmGf) and control.
SeasonTreatmentPhotosynthesis for PAN 413Photosynthesis for PAN 6Q-245
2015/201653 DAE69 DAE97 DAE53 DAE69 DAE97 DAE
Control23.34 c21 c,d19 d25.57 c23.33 d21 c
DV13.01 a18.33 b,c17 c12.37 a18.33 b21 c
DT22.98 c11.33 a19.33 d24.67 c11.33 a17.33 b
DGf23.76 c21 c,d10.7 a24.41 c21.33 c13.33 a
EmV17.33 b19 b,c,d19.37 d17.4 b22 c,d22 c
EmT22.67 c16.33 b16.67 c23.7 c16.33 b20.67 c
EmGf23 c23.33 d19.33 d23.6 c21.33 c21.67 c
CV6.512.75.56.35.85.3
LSD2.374.1991.6242.4102.0111.765
2016/2017Treatment55DAE71 DAE99 DAE56 DAE71 DAE99 DAE
Control27 b16.33 c17.01 c,d29.33 c20 d22.33 e
DV14 a12.67 b15.23 b,c8 a13 b16.67 c
DT25.33 b7.67 a14 b28 c6.9 a13 b
DGf28 b16 c6.01 a28.67 c18.67 c,d8.33 a
EmV17.33 a13 b15.67 b,c,d17.33 b17.67 c21 d
EmT27.33 b12.34 b14.33 b,c28 c13.67 c16 c
EmGf24.67 b18 c18.33 d27.67 c18.33 c,d20 d
CV8.411.510.77.76.53.8
LSD3.4612.8262.7403.2751.7991.121
Means followed by the same letter within a column do not significantly differ at p < 0.05 according to Tukey’s Multiple Range Test.
Table 5. Degrees of freedom, mean squares, F probabilities for combined seasons (2015/2016 and 2016/2017) analysis of variance for kernel number per ear, kernel weight, grain yield, and harvest index of the two cultivars under drought and flooding.
Source of VariationdfMean Square errors
Kernel Number per earKernel WeightGrain YieldHarvest Index
Pan 413PAN 6Q 245Pan 413PAN 6Q 245Pan 413PAN 6Q 245Pan 413PAN 6Q 245
Season124,868.7 **1500 **6814 *594.4 *41,104,169 **11,653,575 **0.0002881 *0.00115238 *
Error (a)44561012.5202621179,799478,6980.000319050.00035238
Moisture stress154,384.1 **25,581.4 **3101 **4366 **22,802,655 **5,345,0475 **0.02892857 **0.02062857 **
Season × Moisture stress13920.8 **64 ns89 ns6 ns286,414 **1,428,549 **0.00057302 *0.00015873 *
Moisture stress × Growth stage296,420.1 **46,892.4 **1117 **371 ns2,287,182 **4,259,168 **0.002025 **0.00003333 *
Moisture stress × Stress Type1168,100 **218,244.7 **12,100 **2288 **43,302,256 **132,033,046 *0.1369 **0.16267778 **
Season × Moisture stress × Growth stage27880.5 **10,483.9 **403 *664 *285,520 **890,321 **0.00038611 ns0.00007778 ns
Season × Moisture stress × Stress type15088.4 **12.2 ns32 ns600 *967,754 **1,422,851 *0.00001111 ns0.00027778 ns
Moisture stress × Growth stage × Stress type278,059.3 **67,737 **4561 **3807 **9,426,347 **25,150,025 **0.004975 **0.00387778 **
Season × Moisture stress × Growth stage × Stress type27541.4 **8176 **577 **689 *666,425 **112,644 **0.00013611 *0.00014444 *
Error (b)24213.1194.49012928,34946,0110.000085710.0000996
* Significance at the 0.05 level of probability; ** Significance at the 0.01 level of probability; ns non-significant at the 0.05 level of probability; df, degrees of freedom; Error (a) included season only; Error (b) included the rest except season.
Table 6. Effect of excess moisture and drought on kernel weight, yield, and harvest index of two different maize cultivars with drought imposed at vegetative stage (DV), mid-vegetative to tasselling stage (DT), grain filling stage (DGf) and flooding imposed at early to mid-vegetative stage (EmV), mid-vegetative to tasselling stage (EmT), and grain filling stage (EmGf), and control (c).
CultivarTreatmentKernel Number/PlantKernel Weight (g/1000)Grain Yield (kg ha−1)Harvest Index
2015/20162016/20172015/20162016/20172015/20162016/20172015/20162016/2017
PAN 413Control584 c680 c320 d337 d8930 e10,504 e0.56 c0.54 c,d
DV413.3 b476.7 b290.7 b315.7 b,c6339 c8586 c0.44 b0.45 b
DT280 a343.3 a300.3 b305.7 b4196 a6847 a0.41 a0.40 a
DG592.3 c659.3 c225 a280.3 a5447 b7672 b0.42 a,b0.41 a
EmV572.7 c472.7 b304 b,c333.3 c,d6340 c8898 c0.55 c0.53 c
EmT594.7 c667 c303.7 b,c328 c,d8368 d9446 d0.57 c0.56 d,e
EmGf599.7 c678.3 c324 d344.7 d8839 d,e10357 e0.573 c0.57 e
CV, %2.91.92.94.24.75.41.71.7
LSD0.0526.6319.4215.3217.841363020.0170.015
PAN 6Q-245Control597 c601 c342 c347.7 d12278 f12428 e0.5533 c,d,e0.5633 c
DV421.7 b536.3 b324.7 b,c324b c7601 c9946 c0.445 b0.44 b
TD332.7 a241 a316.3b315.7 b5063 a6627 a0.4083 a0.4133 a
GD582.7 c537.8 c282.7 a283 a6576 b7472 b0.415 a0.42 a,b
VEm584 c580.7 c339.4 c333.3 b,c,d8641 d9879 c0.5383 e0.5467 c
TEm623.3 d600.7 c327 b,c325 b,c11,027 e11,674 d0.5683 e0.5533 c
GEm593 c590 c337.3 c336.7 c,d12,255 f12,790 e0.565 d,e0.5734 c
CV, %22.3622.23.53.36.35.12.62.8
LSD0.052.42.319.4318.833194350.0150.025
Values of the same cultivar in the same column followed by the same letter were not significantly different at p < 0.05 according to Tukey’s Multiple Range Test.

