Article

Landscape Change and the Sustainable Development Strategy of Different Types of Ethnic Villages Driven by the Grain for Green Program

1
College of Life and Environmental Sciences, Minzu University of China, Beijing 100081, China
2
International Doctoral Innovation Centre, Research Group of Natural Resources and Environment, Department of Chemical and Environmental Engineering, University of Nottingham Ningbo China, Ningbo 315100, China
3
Lancaster University College at Beijing Jiaotong University, Weihai 264401, China
4
School of Geographical Sciences, Research Group of Natural Resources and Environment, University of Nottingham Ningbo China, Ningbo 315100, China
*
Author to whom correspondence should be addressed.
Sustainability 2018, 10(10), 3485; https://doi.org/10.3390/su10103485
Submission received: 30 August 2018 / Revised: 26 September 2018 / Accepted: 26 September 2018 / Published: 29 September 2018

Abstract

:
The Grain for Green Program (GGP) is an important ecological project in China that was implemented to tackle serious soil erosion and forest loss for sustainable development. Investigating landscape change is an efficient way to monitor and assess the implementation of GGP. In this paper, 180 ethnic villages, including 36 Miao and Dong (MD) villages with combined populations of Miao people and Dong people, 65 Dong villages, and 79 Miao villages in Qiandongnan Prefecture were selected to investigate the influence of GGP on ethnic villages by evaluating the landscape changes before and after the implementation of the GGP within 1-km and 2-km distance buffers around ethnic villages. The results show that the GGP has more significant positive impacts on reforestation around Miao villages than Dong villages and MD villages because Miao villages are mostly located in higher and steeper areas, which are the focus of the GGP. Based on the analysis, a continuation of the GGP in Qiandongnan Prefecture is recommended, as it can incentivize the recovery of forest cover in steeper slopes. More attention should now be paid to the Dong villages and MD villages, which were not previously a focus of the GGP.

1. Introduction

Environmental degradation is one of the most important obstacles to sustainable development, and as such, has drawn increasing attention from both government and academia [1,2]. Among the many manifestations of environmental degradation, soil erosion has gained attention throughout the world [3,4]. Soil erosion is considered as a serious environmental problem because of its adverse effects both onsite and further downstream, such as loss of soil fertility, siltation of water channels, sedimentation of reservoirs, eutrophication, and reduction of water quality [5,6]. Afforestation is regarded as an effective measure for controlling soil erosion [7,8], and also has additional ecological benefits such as enhancing soil carbon accumulation and further mitigating climate change, improving water quality, and restoring ecosystem services [9,10].
To control serious soil erosion for sustainability needs, the Grain for Green Program (GGP) was launched by the Chinese government in 1999 and implemented in 25 provinces in 2002. This program aims to increase vegetation coverage on steep slopes by planting trees on former cropland or uncultivated barren land. Farmers were encouraged to return their cropland on steep slopes (normally over 25°) for trees, in return for financial compensation [11,12]. The government has continuously invested in this program during the past 17 years, with a total investment of 450 billion RMB (65.5 billion USD) [13]. A total of 29.8 million hectares of steep-slope cropland and barren land were afforested between 1999 and 2014 [13].
Methodologies and indices from landscape ecology are often used for assessing the GGP [14,15]. However, previous assessments were conducted at broad spatial scales, i.e., the regional scale [16], provincial scale [17], prefecture scale [18], or county scale [19]; meanwhile, landscape change driven by the GGP at the village level is poorly understood. Villages and towns are the main types of human settlement and the centre and basis of human activities to alter the environment in the mountainous regions which are the key areas of implementation of the GGP [20,21]. Managing such alterations is usually the objective of environmental regulation/policy and sustainable development strategies. Thus, investigating the landscape change around villages in mountainous regions could offer reliable information to decision-makers to aid planning and policy-making.
Many traditional ethnic villages have important natural and cultural heritage located in the key areas of the GGP. For instance, traditional Miao and Dong villages in Qiandongnan Prefecture place a high value on the protection of the cultural and natural heritage of these two ethnic groups. Many of these villages are settled in high mountains with steep slopes, where some croplands have been returned to forest. The implementation of the GGP has also changed the production mode and income structure of farmers in these traditional villages, by causing local residents to shift from farming to other activities and paying them an annual living allowance and grain/cash subsidies [22,23,24]. For example, 3.1 million farmers in Guizhou Province migrated to cities for nonagricultural employment in 2005 [25]. Furthermore, the land use behaviors of farmers have been influenced by GGP policy, thus further affecting land use change [26]. These varied among communities and were influenced by local environmental factors [26]. Studying the landscape change after the implementation of the GGP in these ethnic villages could provide information on the planning of sustainable development, as well as protecting the local natural and cultural heritage. The main purposes of the present study are to present the influence of the GGP on landscape change around ethnic villages in Qiandongnan Prefecture, as well as the varying responses of different types of ethnic villages, in order to provide some meaningful insights into the nature of landscape changes at the village scale, which can be used to aid decision- and policy-making for vegetation conservation and sustainable development in the prefecture.

2. Materials and Methods
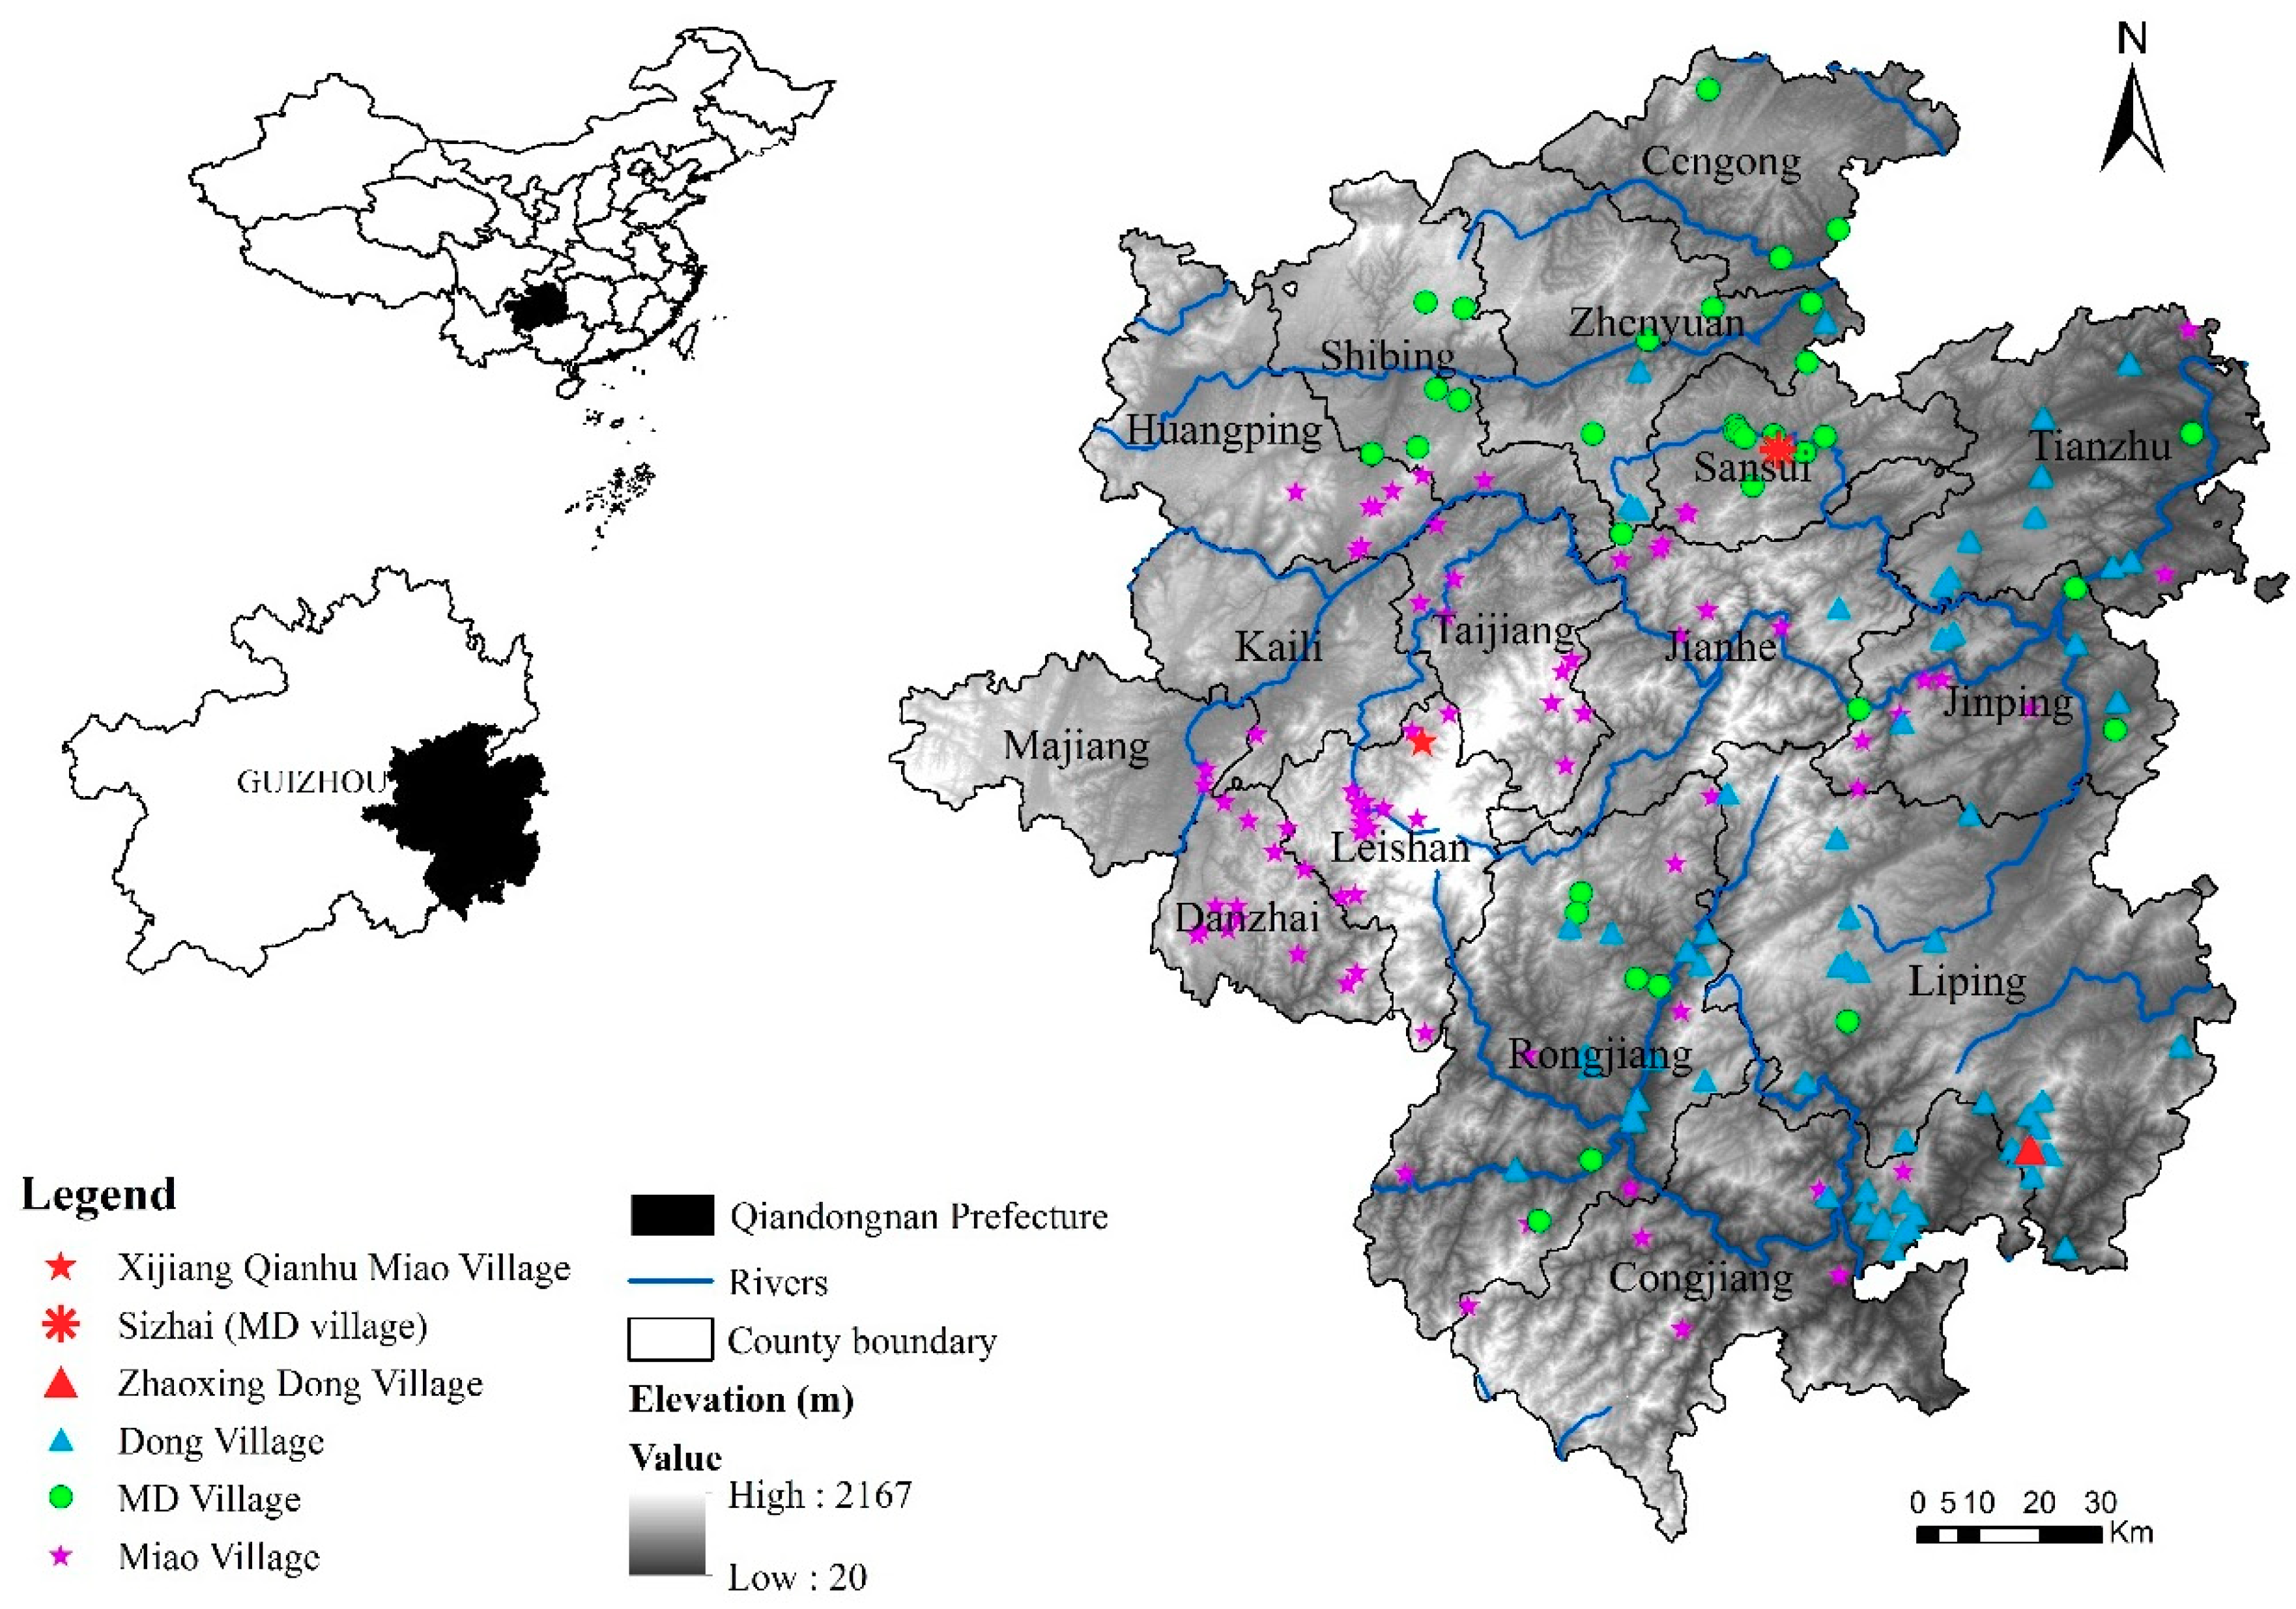
2.1. Study Area

Qiandongnan Prefecture plays a vital role in soil and water conservation in the upper Yangtze River watershed, being a key area for the implementation of the GGP. The GGP was launched in Liping County in 2000 and implemented throughout the prefecture in 2002. The GGP mainly concentrated on the northern, northeastern, and central parts of Qiandongnan Prefecture [27]. By 2010, trees had been planted over a total area of 116,021.73 hectares, including 37,233.33 hectares of returned cropland [27]. As compensation, the central government provided 2250 kg of food and 300 yuan in cash to subsidize every hectare of converted cropland at the beginning of the implementation of the GGP [22]. After 2004, food subsidies were removed from the compensation system and the cash subsidy was improved to 3600 yuan per hectare. The duration of the subsidies is between 5 and 8 years, depending on the types of trees planted [22].
Qiandongnan Prefecture is located in the southeast of Guizhou Province, China, in an area measuring 30,337.1 km2 (Figure 1). This prefecture contains 16 counties, with a population of 4.58 million, covering 33 ethnic minorities and two unrecognized ethnic minorities. The Miao and the Dong peoples are the most populous ethnic groups, constituting 42.22% and 29.75% of the total population, respectively [28]. The altitude of the prefecture varies between 20 and 2167 m above sea level, with an average slope of approximately 22° (Figure 1). It has a northern subtropical monsoon climate with an annual average temperature ranging from 14 °C to 18 °C and an average annual precipitation of between 1000 mm and 1500 mm. Rainfall shows high seasonal variability, with approximately 70% falling in the rainy season, and the relative humidity ranges between 78% and 84%. This area is one of the most significant forested areas in China. It is also one of the regions with the richest biodiversity in China, hosting 56 species of mammals, 40 species of amphibians, 36 species of reptiles, 162 species of birds, 62 species of fishes, and 2009 species of plant. Over 60 species are classified as endangered under the national protection level, and 24 plant species are endemic to China, such as Tetracentron sinense [28].
The Miao people migrated into and settled in Guizhou 2000 years ago [29], and Guizhou is now the main distribution area of Miao people in China [30]. The majority of the Miao people live with their own people in independent Miao villages [30].
The Dong people are recognized as the native ethnic people in Guizhou Province, with a long history dating back to the early Qin Dynasty, much earlier than the Miao people. Qiandongnan Prefecture is the largest settlement area of Dong people in China, constituting 40% of the national Dong population [31].
The main economic activity of both the Miao and Dong ethnic groups in Qiandongnan Prefecture is agricultural production. The main crop is rice, with a great variety of cultivars. These two ethnic groups cultivated a unique terraced landscape on the local terrain. A rice–duck–fish symbiotic agroecosystem had been established there and has been inherited for over a thousand years [32]. This agroecosystem has been designated as a Globally Important Agricultural Heritage System by the Food and Agriculture Organization since 2002, and certified as a China Nationally Important Agricultural Heritage System by the Ministry of Agriculture of China since 2012, due to its sustainable features [33,34]. It plays an important role in biodiversity conservation, food security, and environmental protection [33,34].
Both the Miao and Dong peoples believe in a forest god, and always reserve small pieces of forest near to or within their villages as so-called sacred forest. This custom plays an important role in maintaining harmony and stability within local communities, protecting traditional culture, promoting the rational exploitation and utilization of land resources, and promoting the sustainable use and protection of biological resources, especially forest resources.

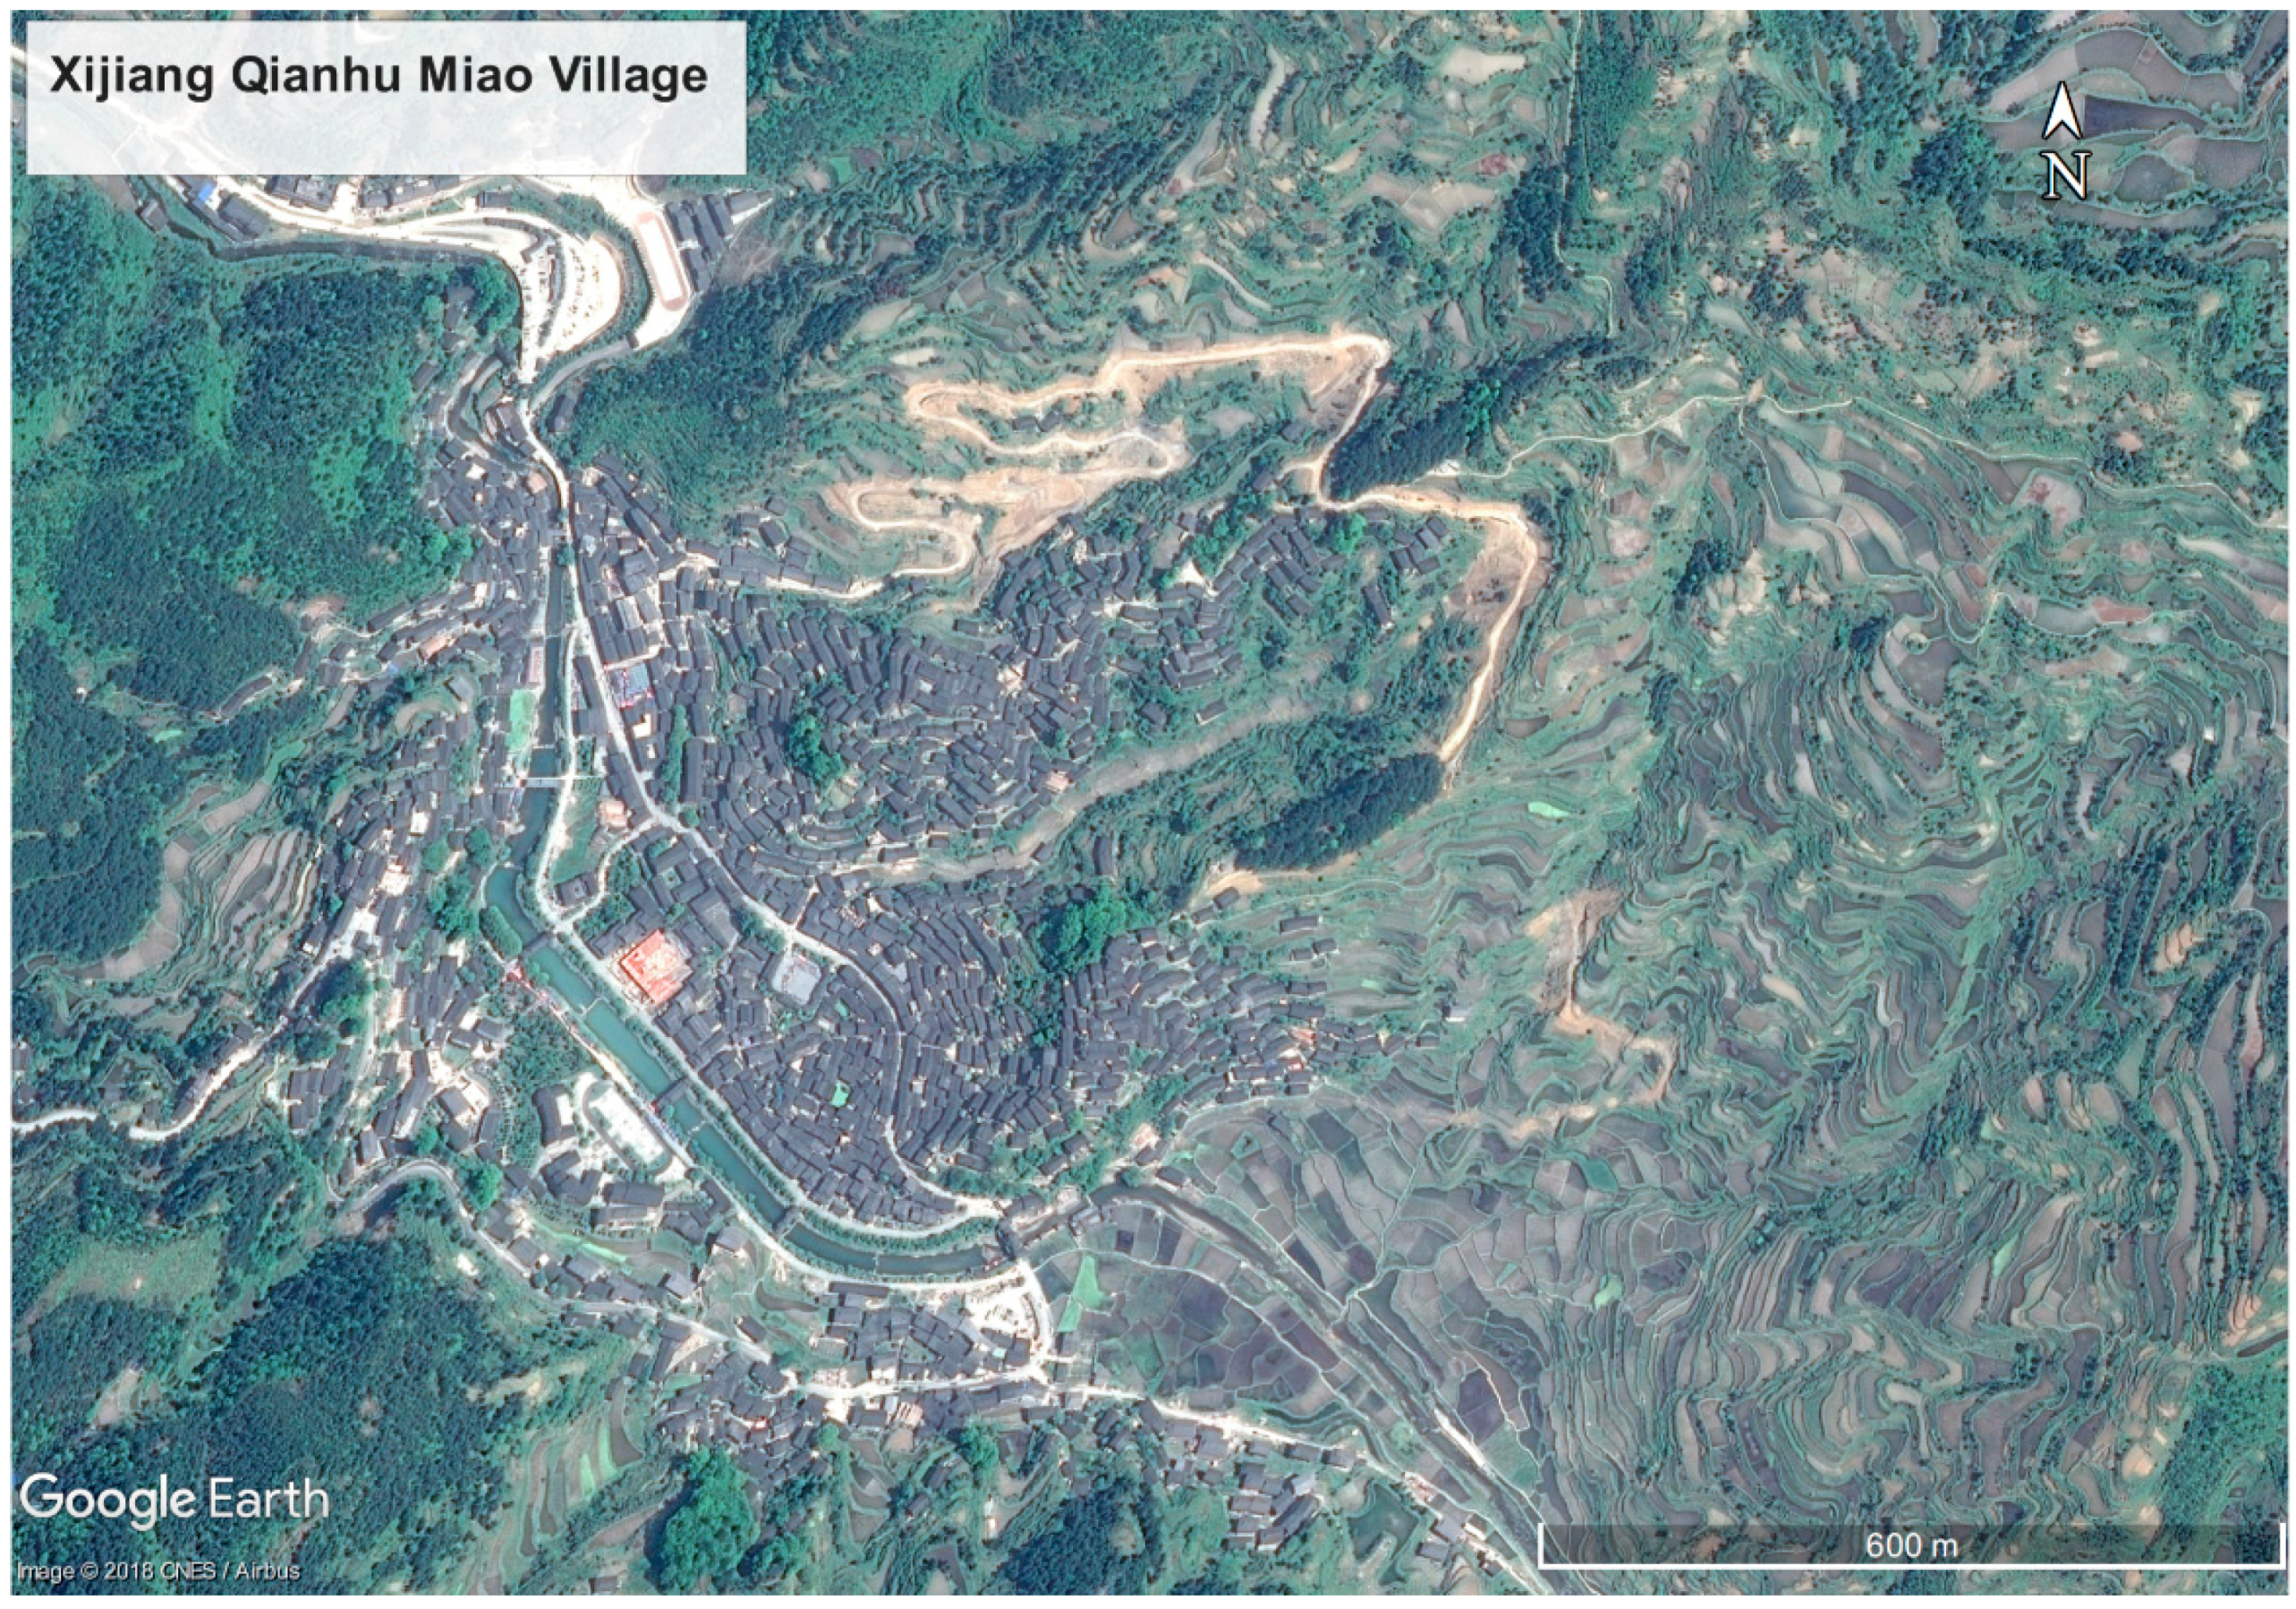
2.2. Selection and Positioning of Ethnic Villages

On 26 December 2005, a list of one hundred traditional ethnic villages (towns) in Qiandongnan Prefecture was published. The majority of these villages are occupied by Miao and Dong people. Therefore, three types of villages, namely Miao villages, Dong villages, and mixed (MD) villages which are occupied by both Miao and Dong peoples, were chosen as targets. The selection of target villages was initially based on the aforementioned 2005 announcement. The identification of the ethnic properties of each village was made using census data from the Thousands of Towns and Villages Project of Guizhou Province [35]. Subsequently, information for more than 3300 other villages in the prefecture was checked. Several additional villages not included in the announcement were added to the dataset. Unfortunately, detailed information about ethnic composition is not available for all villages. In total, 180 ethnic villages identified as either Miao, Dong, or MD villages were finally selected to represent a sample of all ethnic villages in Qiandongnan Prefecture. The dataset includes 65 Dong villages, 79 Miao villages, and 36 MD villages.
Two methods were used for determining the location and extracting the areas of ethnic villages. The locations of 70 ethnic villages, comprising 36 Miao villages and 34 Dong villages from the announcement, were first located using GPS devices during fieldwork. Subsequently, the location data obtained from fieldwork was imported into Google Earth for locating and extracting the areas of the villages. Ethnic villages selected from the Thousands of Towns and Villages Project were counted and grouped into the towns they belong to. Additionally, a coordinated town-level district map, which was purchased from the local government, was imported to Google Earth for defining the boundaries of towns. Then, ethnic villages were identified based on their name within the town boundaries. After being identified, the areas of villages were manually extracted by drawing polygons based on the area of villages in remote sensing images from Google Earth. Manually extracting village areas was achievable because the buildings in the villages could be easily distinguished from remote sensing images at a high resolution of 0.4 m (Figure 2). Subsequently, area data obtained from Google Earth was imported into ArcMap 10.3 (ESRI, Redlands, CA, USA) for further processing.

2.3. Field Survey

The locations of villages were positioned during a three-week field survey in November 2011. The field survey showed that cropland is typically distributed around villages within about 1 km and that sacred forest is located up to 0.5 km from the villages or within the village boundaries.
During the period from May to September 2014, questionnaires (Supplementary Materials Sections S1 and S2) concerning the implementation and influence of the GGP were collected from ethnic villages to identify the attitude and concerns of local residents to the GGP. Additionally, village managers from ethnic villages representing the three types of ethnic villages were interviewed.

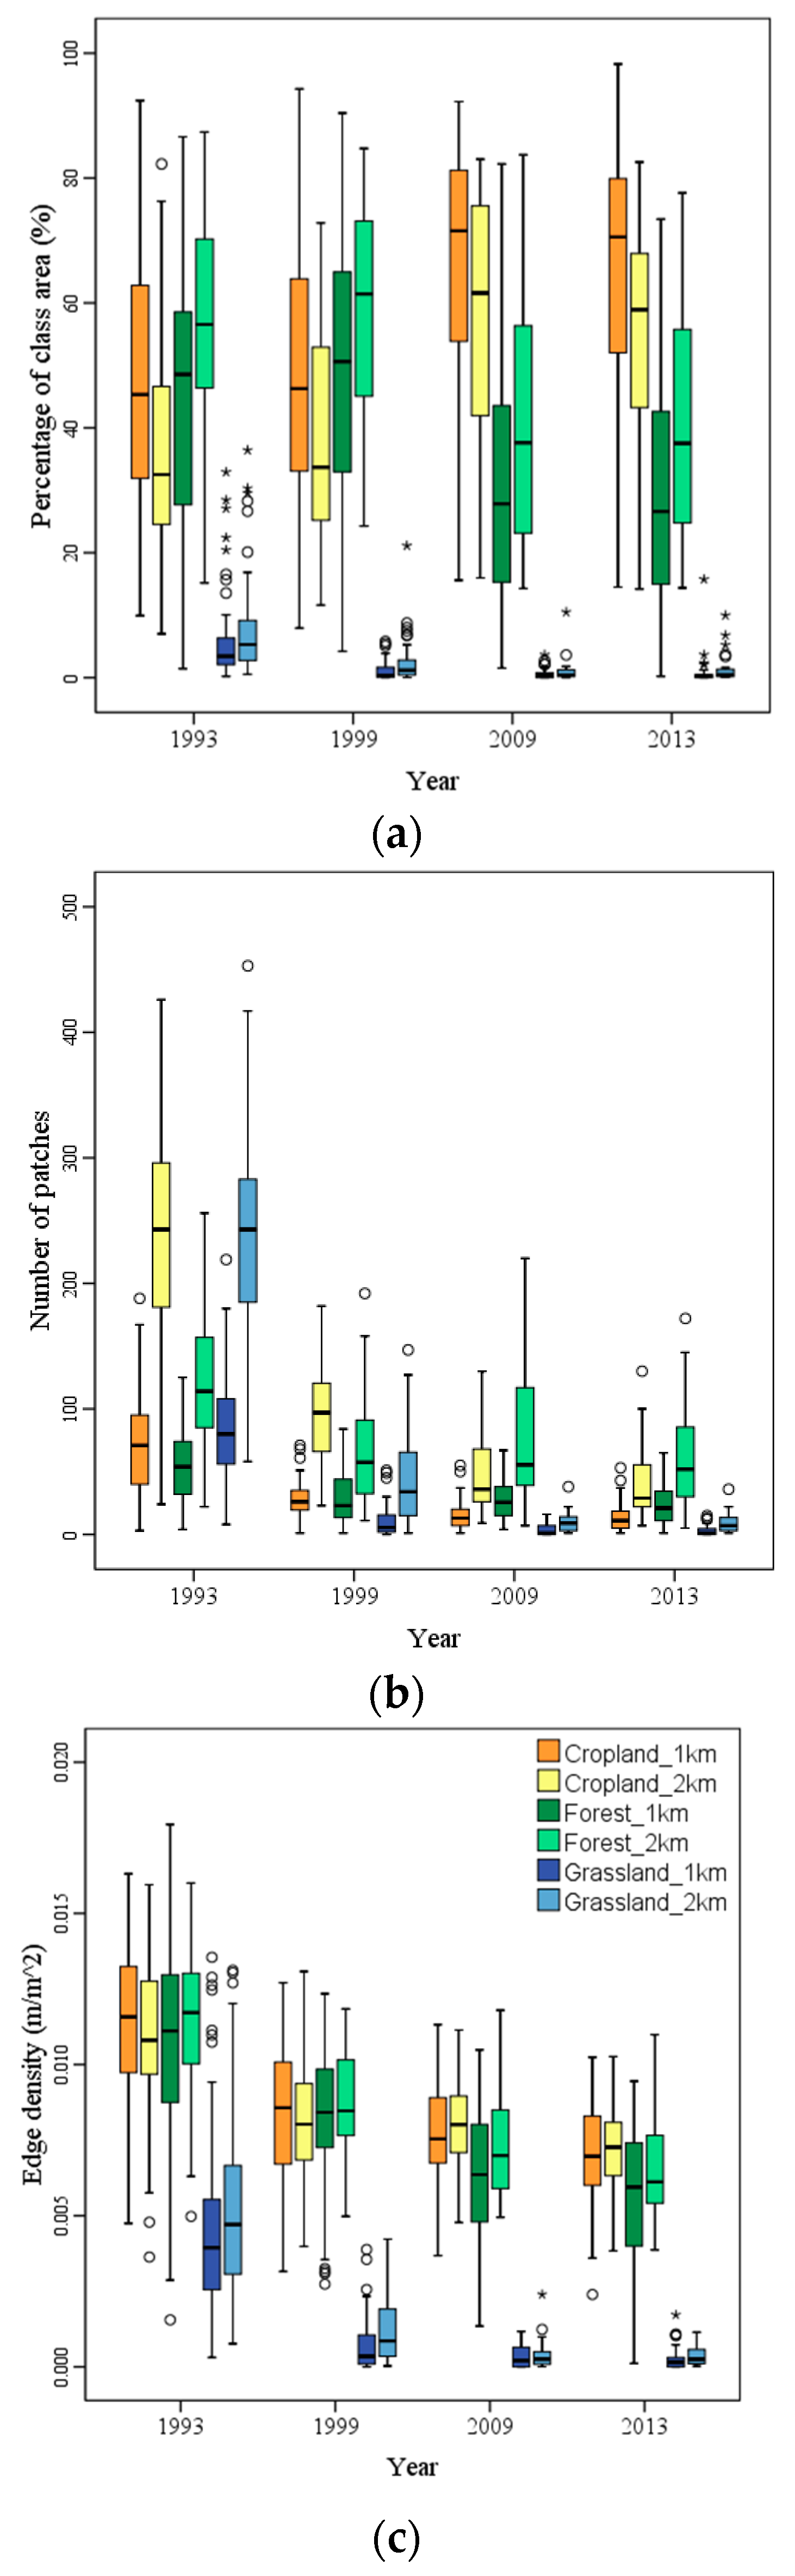
2.4. Landscape Change Analysis

Four historical land use maps covering Qiandongnan Prefecture, spanning the years 1993, 1999, 2009, and 2013, respectively, were used to analyze the landscape changes around the ethnic villages before and after the implementation of the GGP. The land use maps were extracted from Landsat TM/+ETM and Landsat 8 remote sensing images (https://www.usgs.gov/) with a resolution of 30 m using the ERDAS 9.2 software (Hexagon Geospatial, Madison, AL, USA). A 1:50,000 digital elevation model (DEM) with a resolution of 30 m, purchased from the Chinese Ministry of Land and Resources, was used to assist land use/cover classification and analyze the topographic condition around the ethnic villages. Land use/cover was classified into five categories including cropland, forest, grassland, residential area, and water body, with overall accuracies (generated from a confusion matrix) of 88.37%, 88.70%, 88.03%, and 86.65% and kappa coefficients of 0.85, 0.85, 0.84, and 0.83 for the years 1993, 1999, 2009, and 2013, respectively.
Landscape metrics are important indicators for evaluating the land use/cover change, habitat functions, landscape-regulating functions, and information functions [36]. They can effectively reflect landscape structure, spatial allocation, and the influence of landscape change on ecosystem services. Quantitative analysis of the landscape pattern and landscape dynamics through indices is one of the core methods of landscape ecology [37]. Buffer belts situated 1 km and 2 km from the centre of the villages were created to investigate the landscape change around the ethnic villages. The investigation focused on the change in forest, cropland, and grassland. Residential and water areas were not evaluated in this study as they account for very small proportions and are stable. The Patch Analyst Program extension in ArcGIS 10.3 was used to quantify landscape structure at the class level. Three landscape indices were chosen to describe the landscape pattern: class area (CA), expressed as the percentage of the total area at the class level; number of patches (NP); and edge density (ED) at the class level [38]. These three landscape indices are commonly used in landscape research and are the foundation for calculating other landscape indices [39]. CA can be used to identify the predominant landscape type that further defines the biodiversity, dominant species, and abundance of species habituated in this type of landscape, while NP and ED are usually used to describe the heterogeneity and fragmentation of landscapes, which can further indicate the intensity of human activities [40].
One-way analysis of variance (ANOVA) was performed to investigate the significance of landscape change before and after the implementation of the GGP and the variance of landscape patterns among ethnic village types. The variables exhibiting differences among villages and years were tested at the significant level of 0.05 (p < 0.05). LSD post-hoc tests were additionally conducted to investigate the patterns of the differences.
Geographical factors such as slope and elevation are the factors which influence the distribution of ethnic villages, agricultural activities, and political enforcement of the GGP [12,18,41,42]. The correlation between geographical factors and landscape index were calculated to investigate the significance of the influence of the GGP on the landscape around the different types of ethnic villages. The average and range of elevation and slope within the buffers extracted from the DEM were used for analysis.

3. Results

3.1. Spatial Distribution of the Ethnic Villages

Miao villages are mainly located in the central and western parts of Qiandongnan Prefecture, in the region of Leigong Mountain with complex topography (Figure 1). In contrast, Dong villages are predominately distributed in eastern and southern areas, where the topography is relatively lower and flatter (Figure 1). The MD villages are mainly located in the northern part of Qiandongnan Prefecture (Figure 1). The spatial distribution of the ethnic villages along with their altitudes and slopes is shown in Figure 3a. Generally, Miao villages are more likely to be distributed in higher and steeper areas than Dong villages and MD villages. Additionally, topographic changes around Miao villages are more dramatic than those around Dong villages and MD villages (Figure 3b). There are more Miao villages located in areas where the altitude change is greater than 100 m and/or the slope change is greater than 20° (Figure 3b).
Miao villages are located within the altitude range 400–1260 m, with an average altitude of 776 m, and mainly being in the range of 800–999 m. Dong villages are distributed within the altitude range from 181–914 m, with an average altitude of 550 m, and are mainly at altitudes lower than 800 m. MD villages are located at altitudes of 282–975 m, with an average of 626 m, and are mainly in the rage of 400–800 m (Figure 3a). The slope in Miao villages ranges from 2.3° to 35.5°, with an average value of 12.35°, and is mainly in the range of 7°–15°. Dong villages are located in areas with a slope of between 2.6° and 17.6°, with an average value of 8.65°, and mainly in the range of 0°–15°. MD villages are distributed within the slope range from 2.7° to 20.8°, with an average slope of 8.64° (Figure 3a).

3.2. Landscape Change around the Ethnic Villages

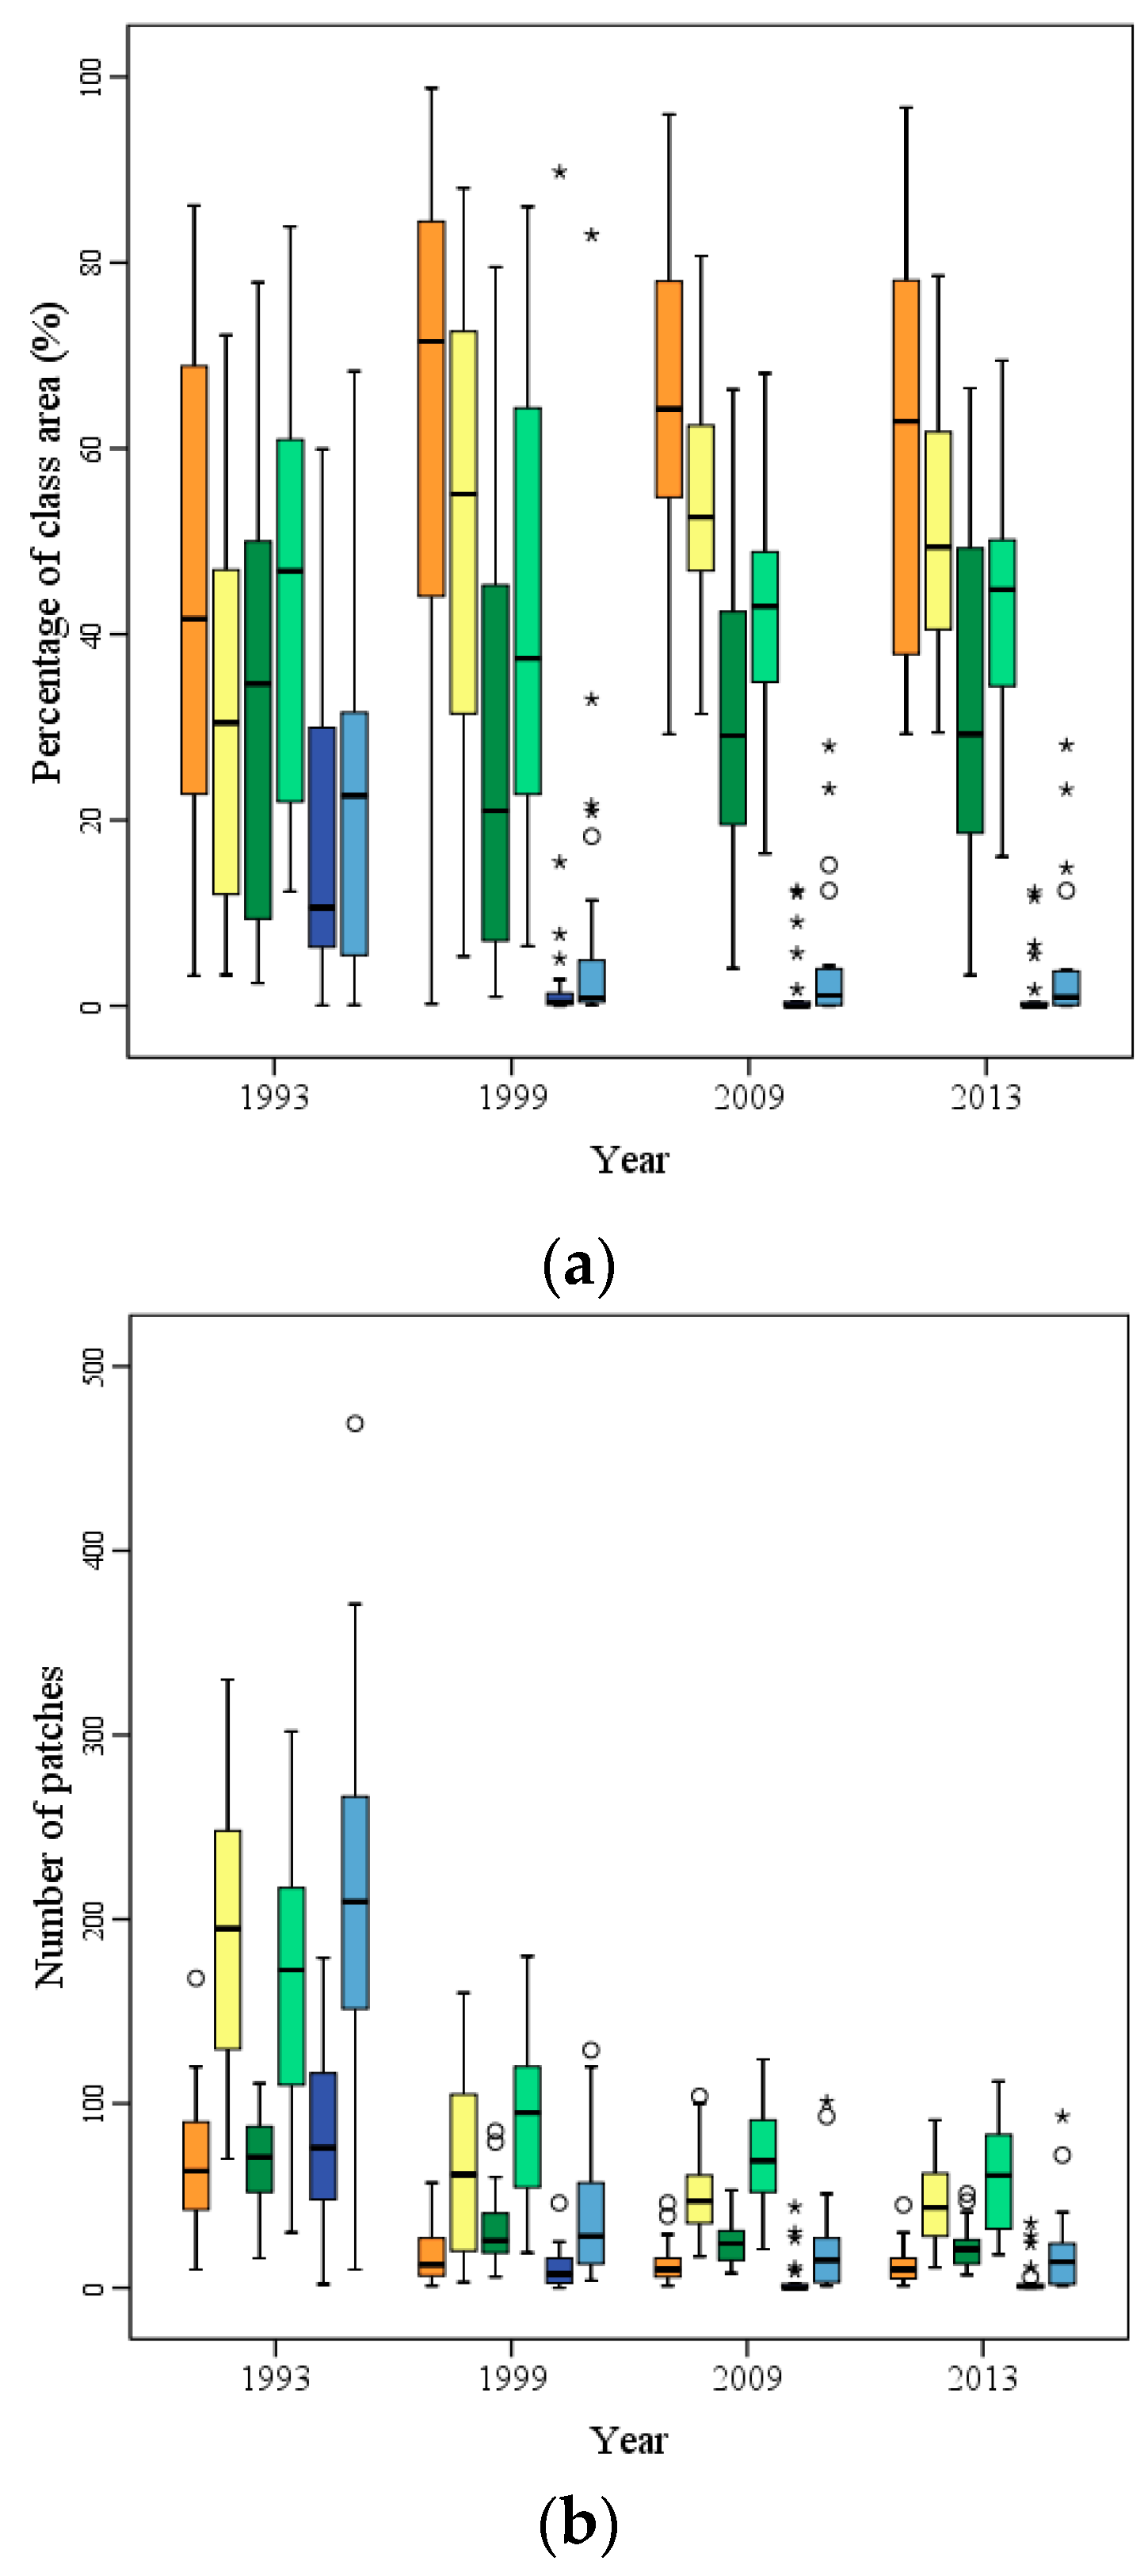
3.2.1. Landscape Change around Dong Villages

Before the implementation of the GGP, forest was the predominant land cover and was continuously distributed as big patches around the majority of the Dong villages; however, cropland became the dominant land cover after the implementation of the GGP, even within the 2 km buffer belts (Figure 4a). Grassland only accounted for a very small proportion of the land cover around the Dong villages and experienced a continuous decline during the study period (Figure 4a). During the study period, the NP and ED of all land cover types declined significantly (Figure 4a,b).
The values of CA, NP, and ED for all types of land cover within all buffers changed significantly before and after the implementation of the GGP, as determined by one-way ANOVA. During the period from 1993 to 1999, the CA of cropland and forest was stable within all buffers; however, the CA of grassland reduced significantly and effectively disappeared around some villages (p < 0.001). The NP and ED of all types of land cover also decreased significantly within all buffers (p < 0.001). After the GGP was implemented, the CA of cropland within the 1-km buffer (68.59 ± 5.36%, p < 0.001) and 2-km buffer (59.89 ± 5.20%, p < 0.001) in 2009 statistically significantly increased compared to the CA of cropland in 1999 (1-km buffer: 49.43 ± 5.36%; 2-km buffer: 37.43 ± 4.09%). In the meantime, the NP and ED of cropland within all buffers statistically significantly declined (p < 0.001). On the contrary, the CA of forest declined notably during the period from 1999 (1 km: 47.96 ± 5.45%; 2 km: 59.46 ± 4.10%) to 2009 (1 km: 29.27 ± 5.02%, p < 0.001; 2 km: 38.93 ± 5.25%, p < 0.001). The NP of the forest declined, although not to a statistically significant degree (p = 0.131 within the 1-km buffer and p = 0.923 within the 2-km buffer), and its ED decreased to a statistically significant degree (p < 0.001). At the same time, the CA, NP, and ED of grassland reduced significantly. Grassland disappeared around the majority of Dong villages within the 1-km buffer and disappeared around several villages within the 2-km buffer. During the period from 2009 to 2013, land cover around Dong villages had remained stable, as determined by the results of LSD post-hoc tests (p > 0.05).

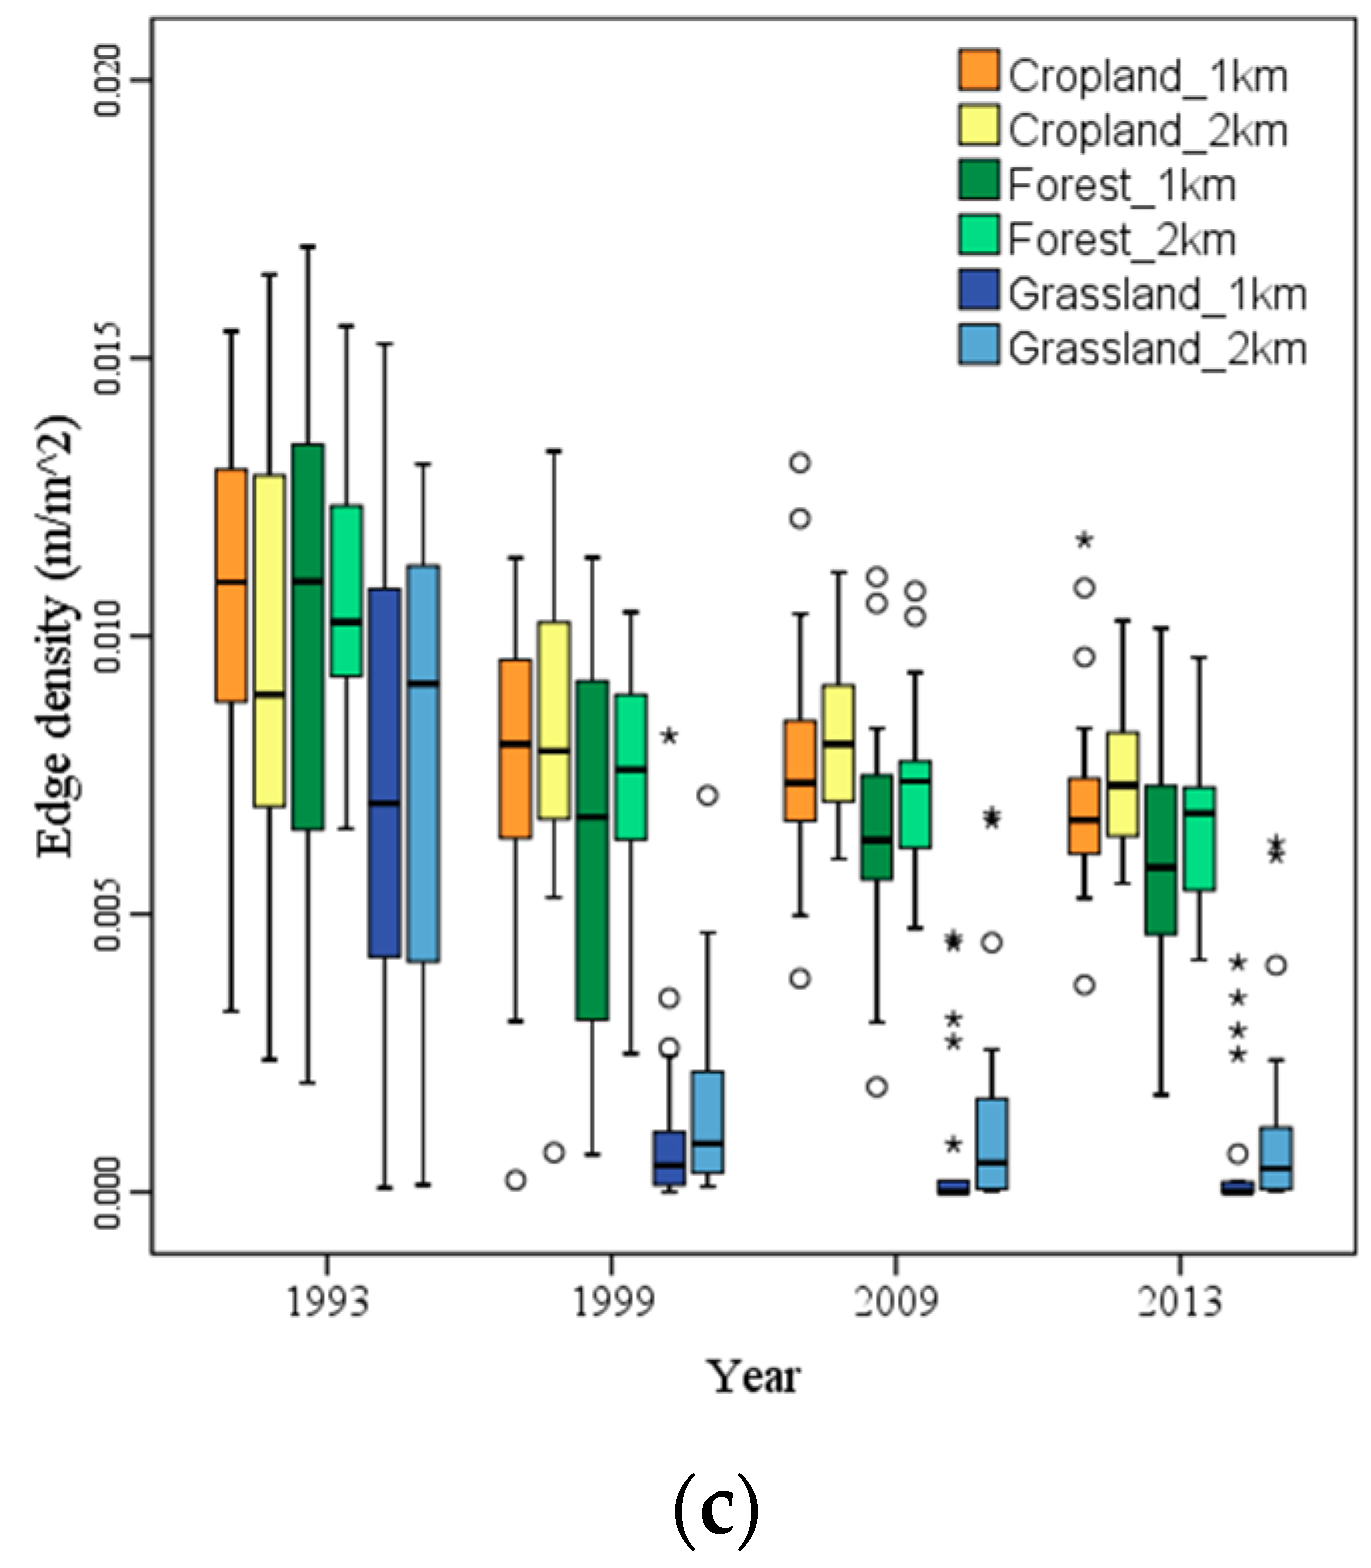
3.2.2. Landscape Change around MD Villages

Cropland was the major land cover around most MD villages throughout the whole study period. With the increase in the buffer distance, the coverage of cropland declined, but it still played a dominant role after 1999 (Figure 5a).
Before the implementation of the GGP, cropland increased significantly around MD villages (p < 0.001) (Figure 5a). Reclamation was undertaken to a significant degree, which made the scattered cropland more expanded and connected. The expansion of cropland erased small patches of grassland from the surrounding areas of MD villages, making the NP and ED decrease significantly (Figure 6b,c). Consequently, the CA, NP, and ED of grassland declined significantly (p < 0.001), with grassland even disappearing completely in some villages. After the implementation of the GGP, the CA of cropland increased, although not to a statistically significant degree, within both the 1-km buffer (1999: 64.33 ± 8.45%; 2009: 65.30 ± 5.63%, p = 0.853) and the 2-km buffer (1999: 52.11 ± 8.05%; 2009: 55.71 ± 4.92%, p = 0.415). The NP and ED of cropland remained stable around MD villages. Similarly, the CA, NP, and ED of grassland also remained stable after the implementation of the GGP. Unlike the change of forest around Dong villages, the coverage of forest around MD villages remained stable during the study period, although the NP and ED of forest decreased.

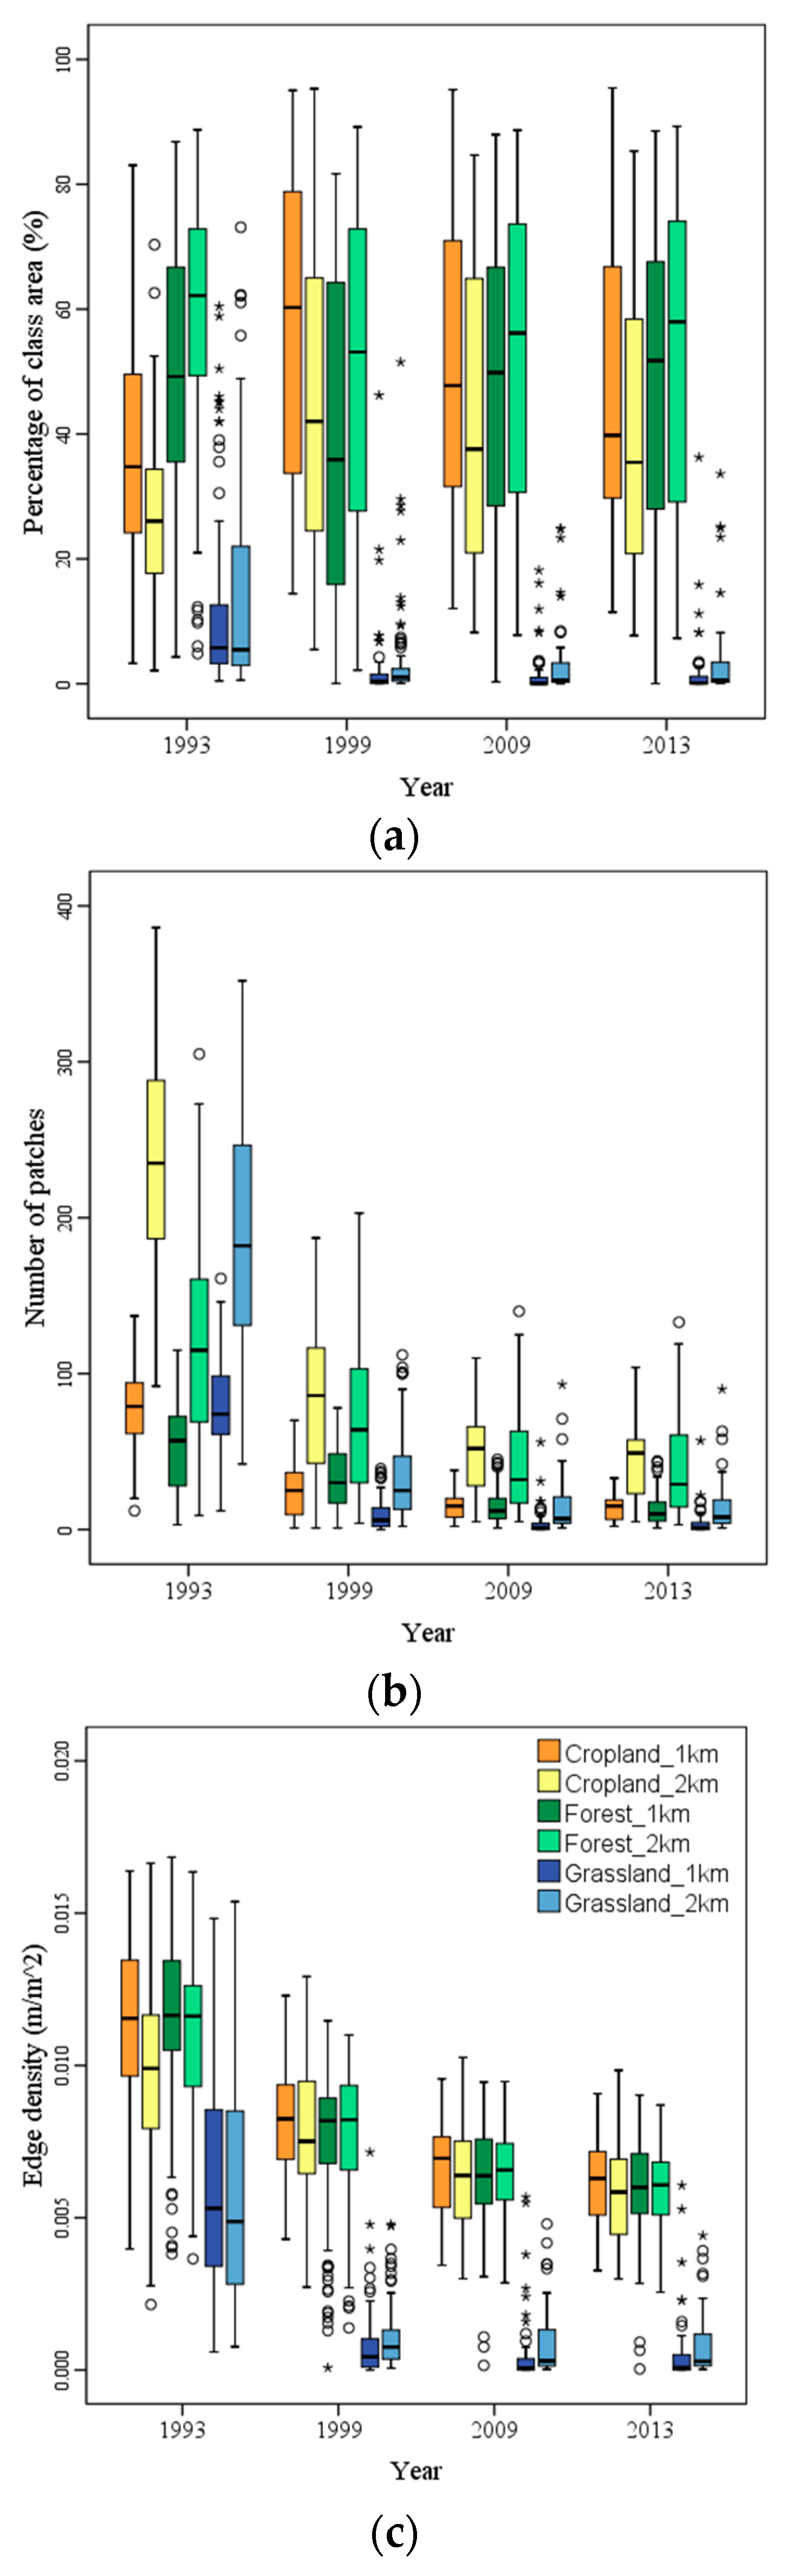
3.2.3. Landscape Change around Miao Villages

Unlike the landscape pattern around Dong villages and MD villages, forest was the major land cover around Miao villages within the 1-km buffer (49.11 ± 5.07%) in 1993 and the major land cover within the 2-km buffer throughout the study period (Figure 6a). Grassland only occupied a small proportion. Before the implementation of the GGP, the coverage of cropland within all buffers increased significantly (p < 0.001). On the contrary, the coverage of forest and grassland declined significantly (p < 0.05). The NP and ED of all land cover types declined significantly (p < 0.001) (Figure 6b,c). Due to the implementation of the GGP, the coverage of cropland in 2009 (1 km: 53.48 ± 5.08%, p = 0.329; 2 km: 44.89 ± 5.10%, p = 0.812) increased compared to that in 1999 (1 km: 56.88 ± 5.60%; 2 km: 45.68 ± 5.41%), but not to a statistically significant degree. As a result, the coverage of forest increased, although not to a statistically significant degree (1 km: p = 0.266; 2 km: p = 0.500), as did the coverage of grassland (1 km: p = 0.445; 2 km: p = 0.274). After the implementation of the GGP, the NP and ED of all types of land cover reduced significantly (Figure 6b,c). During the period from 2009 to 2013, a significant change in the landscape around Miao villages was not observed.

3.3. Distinct Influences of the GGP on Different Types of Ethnic Villages

3.3.1. The Variance of Landscape Pattern around the Ethnic Villages

The observed landscape patterns around the different types of ethnic villages were different, and the implementation of the GGP enlarged the difference. In 1993, Dong villages had the greatest coverage of cropland, i.e., statistically significantly greater coverage than the coverage of cropland around Miao villages within both the 1-km buffer and 2-km buffers. Before the implementation of the GGP, reclamation was intensively undertaken around Miao villages and MD villages. Consequently, the coverage of cropland around those two types of villages greatly increased and was significantly higher than that around Dong villages. After the implementation of the GGP, the reclamation around Miao villages was controlled. However, reclamation was still undertaken around MD villages and intensively undertaken around Dong villages. Therefore, the coverage of cropland around Dong villages and MD villages was significantly higher than that around Miao villages.
Before the implementation of the GGP, cropland within the 2-km buffer around MD villages was more continuous than that around the other two types of ethnic villages, as indicated by the presence of fewer cropland patches and smaller cropland ED. After the implementation of the GGP, there was no significant difference in the NP and ED of cropland among the ethnic villages.
Forest was the major land cover around Miao villages, and the coverage of forest around Miao villages was significantly higher than that around Dong villages and MD villages throughout the study period. In 1993, Dong villages had similar forest coverage to Miao villages and higher forest coverage than MD villages. During the period from 1993 to 1999, forest coverage around Miao villages and MD villages reduced and was significantly lower than that around Dong villages. After the implementation of the GGP, the coverage of forest around Dong villages reduced and was significantly lower than that around Miao villages.
In 1993, MD villages had the highest grassland coverage and Dong villages had the lowest grassland coverage. Subsequently, grassland continually decreased and disappeared around many ethnic villages. There was no significant difference in grassland coverage, NP, or ED within the 1-km buffer among the ethnic villages after the implementation of the GGP; however, the grassland coverage around Miao villages and Dong villages was higher than that around Dong villages within the 2-km buffer.

3.3.2. Comparison among Representative Ethnic Villages

Three villages representing the three types of villages were studied as representative cases. Xijiang Qianhu Miao Village (Figure 1) and Zhaoxing Dong Village (Figure 1) are two of the most famous ethnic villages in Guizhou Province and two of the largest ethnic villages in Qiandongnan Prefecture. For comparison, an MD village named Sizhai (Figure 1), which has the largest built-up area among the MD villages, was also selected. Among the three villages, Xijiang Qianhu Miao Village has the most severe geographical location, with the highest altitude, the steepest slope, and the most dramatically changing topography. Sizhai is located at a higher altitude than Zhaoxing Dong Village, yet the topography is flatter.
From Table 1, it can clearly be seen that opposite change trends of cropland coverage and forest coverage occurred around the Miao villages and Dong villages before and after the GGP implementation. From 1993 to 1999, the forest coverage around Xijiang Qianhu Miao Village decreased with increased cropland coverage, and the forest coverage subsequently increased after the implementation of the GGP, while the land use change around Zhaoxing Dong Village shows an opposing trend. Conversely, the coverage of forest around Sizhai continually increased throughout the study period. Grassland coverage around all villages showed a decreasing trend, especially around Zhaoxing Dong Village and Sizhai, where grassland disappeared after 2009.
With the buffer outreach, cropland around Xijiang Qianhu Miao Village and Sizhai shows a decreasing trend, while it increases around Zhaoxing Dong Village after 2009. The built-up area within the 1-km buffer of Zhaoxing Dong Village increased significantly during the study period. A significant increase in the built-up area within the 2-km buffer of Xijiang Qianhu Miao Village from 2009–2013 was also observed, as new buildings and car parks outside the village were built to meet the increasing needs of a growing number of tourists and agricultural development.

3.4. Impact of the GGP on Sustainable Development in the Ethnic Villages

A total of 124, 107, and 115 questionnaires were collected from the Miao villages, Dong villages, and MD villages, respectively, to investigate the attitude of the residents towards the implementation of the GGP and the impact of the GGP on sustainable development. The results of the investigation indicate that the proportion of residents who have participated in the GGP in Miao villages (60%) is higher than that for Dong villages (50%) and MD villages (40%). Furthermore, more croplands were returned to forest in Miao villages (0.13–0.40 hectares/household) than in Dong villages (0.13–0.27 hectares /household) or MD villages (0.07–0.20 hectares /household). However, the GGP was not well understood by residents, especially residents of Miao villages. Over 80% of interviewed people were concerned by the local environmental protection and believed that environmental quality was improved after the implementation of the GGP. The majority of ethnic people believed that the GGP has had a positive influence on local life and environment, with a higher proportion of residents holding this opinion in Miao villages than that in Dong villages and MD villages. Residents benefit from the GGP due to the subsidies from governments and additional income from nonagricultural activities, and the majority of interviewed people believed that the GGP had improved their income. Additionally, over 60% of residents excluded in the previous GGP plan were willing to participate. A total of 45 interviewed village managers also confirmed the significant social and economic influence of the GGP on the ethnic villages.

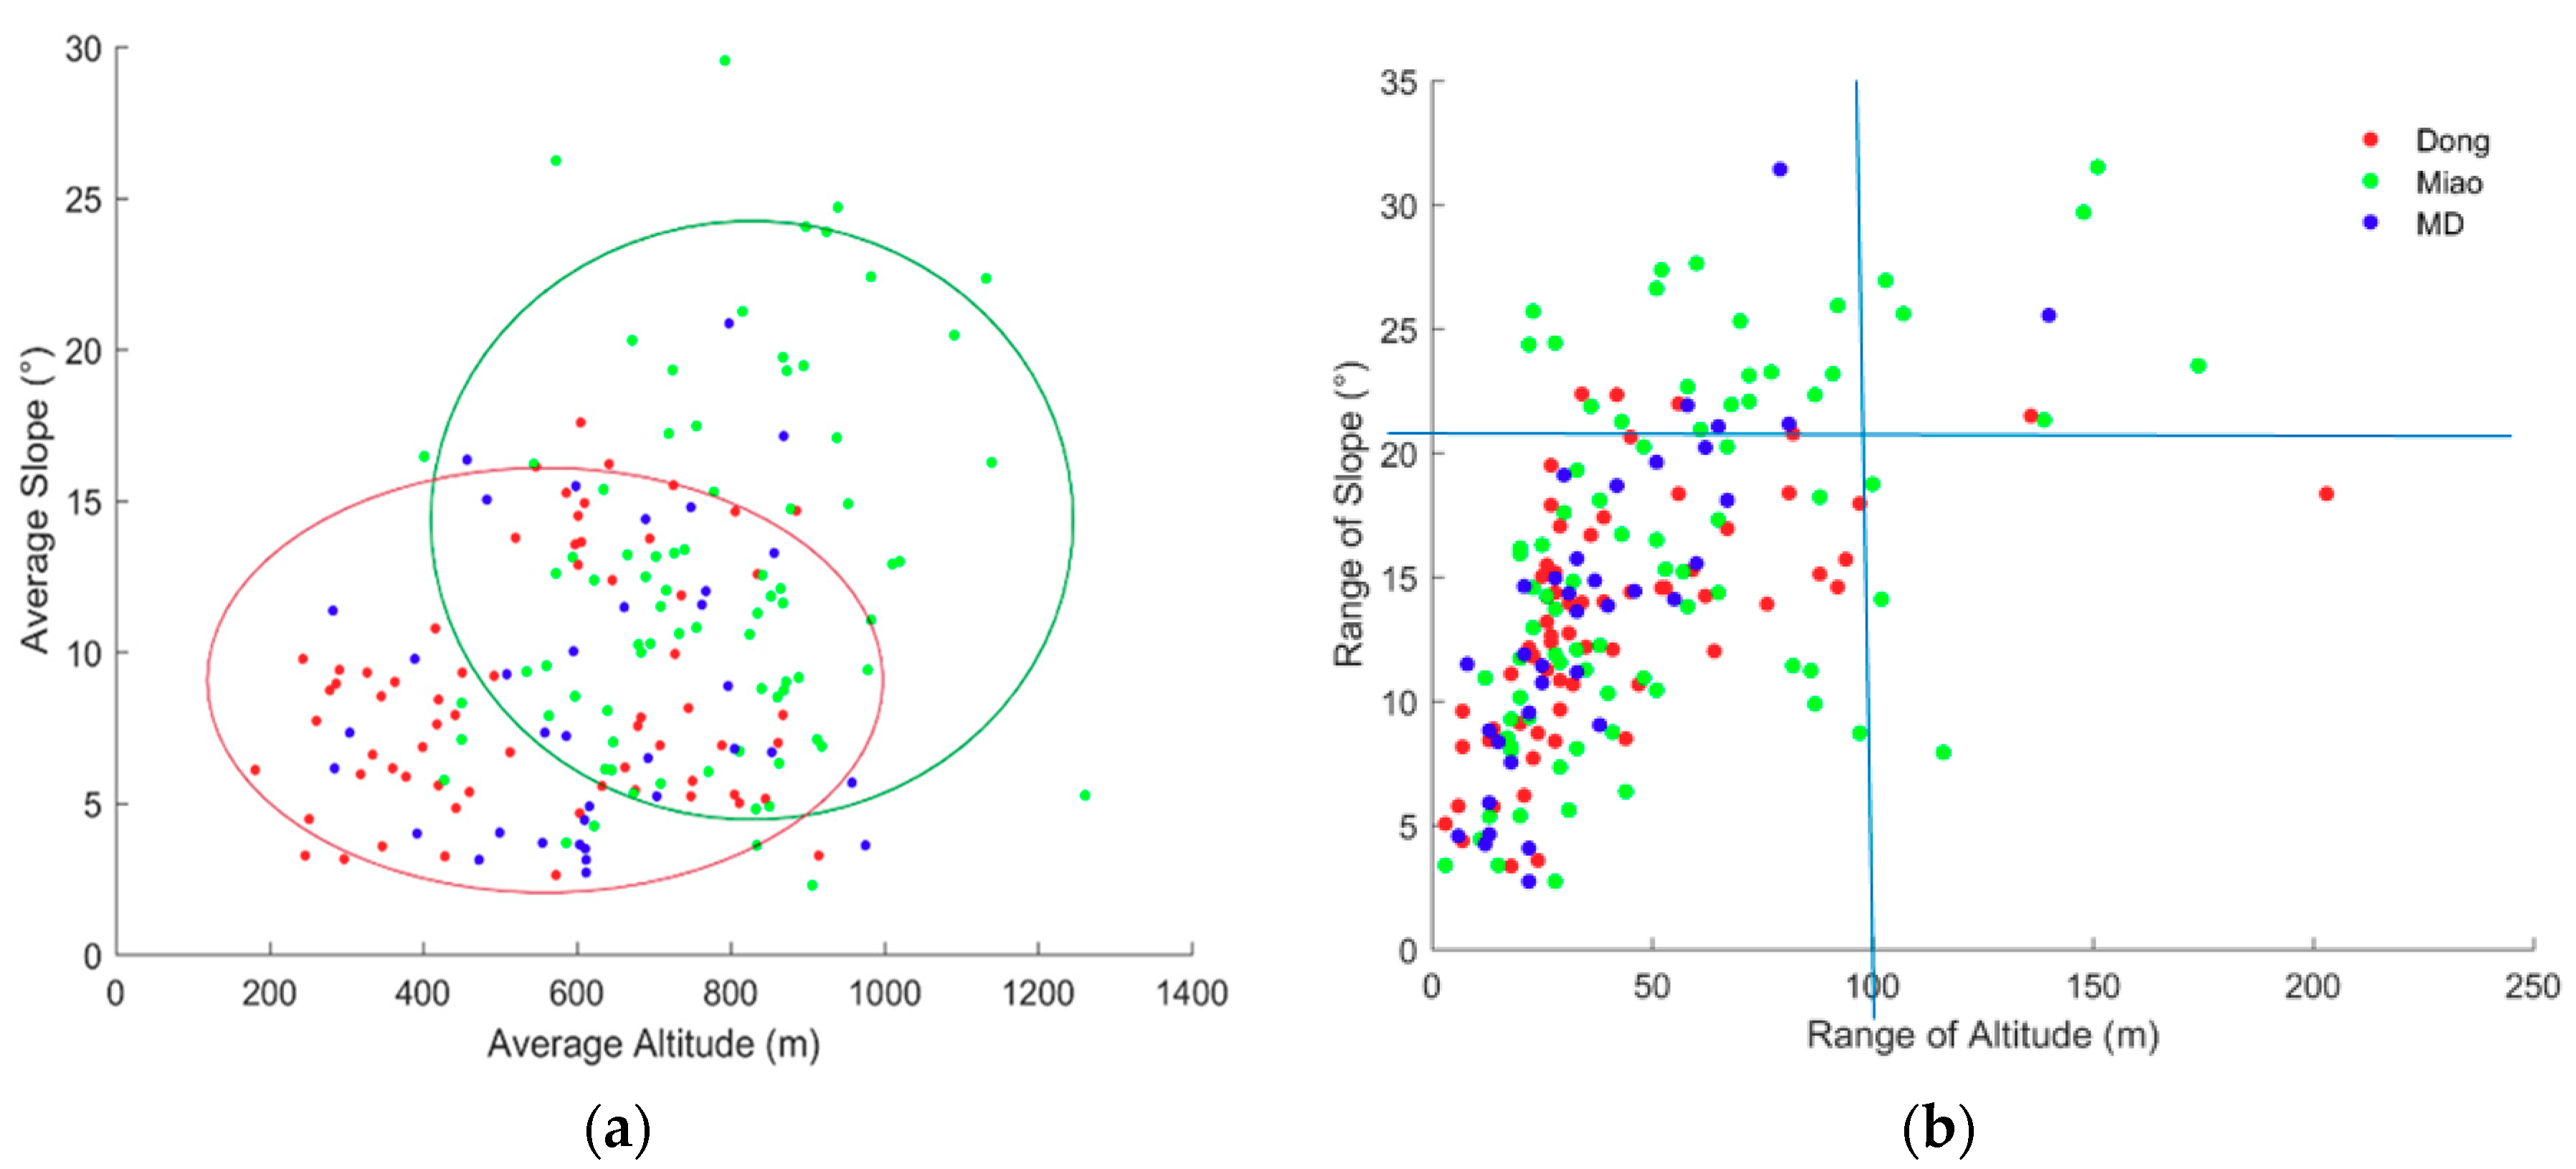
3.5. The Relationship between Landscape Pattern Indices and Topographic Factors

The correlations between topographic factors (slope and elevation) and landscape indices, including the coverage of three land cover types, NP, and ED at the landscape level, are reported in Table 2. The results indicate that the distribution of cropland and forest is significantly influenced by topographic factors. Both slope and elevation have a strong influence on the distribution of cropland. In contrast, the coverage of forest was positively related to an increase in slope and elevation. However, the correlation between the coverage of cropland and forest and geographic factors became weaker during the study period. A negative correlation between ED and slope, and a positive correlation between NP and slope, were also observed before the implementation of the GGP.

4. Discussion

4.1. The Topography around Ethnic Villages Leads to the Distinct Influence of the GGP

Topography, especially slope gradient, plays an important role in causing soil erosion and is an important factor in the planning of the GGP. When the slope is greater than 25°, soil erosion will increase significantly with increasing slope, especially without the dense protective cover of vegetation [43]. Serious soil erosion reduces the fertility and moisture conservation ability of soil, meaning that it will not be suitable for farming and will reduce the yield of crops [44]. Before the implementation of the GGP, deforestation for agriculture and timber was intensively undertaken in Qiandongnan—even in areas with slopes steeper than 25°—to ensure the yield of crops, and caused more serious soil erosion [45,46]. During 1993–1999, over 414,000 hectares with slopes of over 25° were converted to cropland [40]. Miao villages were normally located in areas with a steep slope gradient, and these areas suffered from serious soil erosion and became the key areas for the GGP. The subsidies of the GGP and expectation of environmental protection stimulated the residents’ willingness to participate in the GGP [22]. Therefore, the GGP has a significant positive influence on the environmental protection and control of soil erosion around Miao villages.
Unlike Miao villages, Dong villages and MD villages are located in relatively flatter places where soil erosion was less likely to happen and which are suitable for agricultural production. Therefore, agricultural production around Dong villages was more intensive than that around Miao villages, and the coverage of cropland was stable before the implementation of the GGP. After the implementation of the GGP, the centre of agricultural production moved to and was concentrated in flatter areas where Dong villages and MD villages are located. Consequently, natural forest and grassland around these villages were reclaimed to cropland, even far from the village centre. A significant increase of cropland in the 2-km buffer around Dong villages was identified after 1999.
With increasing buffer radius, the coverage of cropland decreases with correspondingly increasing forest coverage. This indicates that agricultural activities might be restricted by distance, because of the relatively poor accessibility imposed by the topographic conditions. However, this restriction became weaker due to the improvement of technologies, facilities, and equipment adopted in agricultural activities, as indicated by the gradually weakened correlation between the coverage of forest and cropland and the slope. According to the statistical report by the Qiandongnan government, the number of facilities used for irrigation in 2012 were five times greater than that were in 2003, and the number of tractors and lorries used for agricultural transportation quadrupled from 2003–2012 (http://www.qdn.gov.cn/).

4.2. Opportunities, Challenges, and Recommendations

The GGP provides opportunities to diversify the economic structure and improve the social mobility in ethnic villages. After cropland on steep slopes was returned, less labour and time were needed for cultivation and agricultural production. As a result, surplus workers who used to be engaged in agricultural production were able to look for other economic opportunities in other sectors. After the implementation of the GGP, the number of migrant workers increased significantly [22]. Tourism was rapidly developed and became the mainstay industry in some ethnic villages, such as Qianhu Miao village and Zhaoxing Dong village. The cultivation of mushrooms was also developed in many Miao villages after the implementation of the GGP, which promoted the combination of forestry and agricultural cultivation. The increase in social mobility, development of tourism, and diversification of livelihoods required the improvement of and investment in transportation and living facilities, which provide job opportunities to ethnic people. Additionally, an increased number of workers engaged in forestry activities solves the problem of the surplus labour caused by the reduction of land area. The number of workers engaged in forestry cultivation and protection also increased for grass cultivation and conservation under the forest, in order to control the soil erosion in a three-dimensional and comprehensive way.
Ethnic villages in Qiandongnan Prefecture reflect the living conditions, cultural features, and interaction between ethnic people and the environment, as well as the historical process of the formation and evolution of ethnic settlements in different periods, different regions, and different cultural types. The experience of landscape planning on how harmonious interactions with the local surrounding natural environment have accumulated during the long practice and production history of ethnic minorities, and this experience could offer a valuable reference for planning, designing, and operating our modern cities. The three-dimensional spatial structure, which is the integration of forest, cropland, and buildings within the ethnic villages inspired by the practice of worshiping in sacred forests, coincides with the concept of modern urban ecological architecture. Although forest coverage decreased before or after the implementation of the GGP around villages, there were certain pieces of forest reserved within or close to villages. In MD villages, architectures with different ethnic characters were well distributed and planned. Two cultures were nicely united there, similar to modern cities, where different cultures are mixed. We believe that the design and planning of mixed villages might offer inspiration for modern city design.
On the other hand, the GGP also brought new challenges to environmental protection and sustainable development. Improved income and diversified livelihood stimulate local residents to rebuild their houses or build new ones which are mainly wood-based. Building new houses increases the need for timber and this brings new challenges to forest protection. Additionally, the crop biodiversity was also reduced in Qiandongan; for example, the number of kam sweet rice types reduced from over 40 before the implementation of the GGP to over 10 in 2013 in Liping County [47]. After the implementation, the increased number of migrant workers reduced the need for crop variety [47]. Additionally, local farmers are more willing to grow cash crops or crops having a higher yield rather than traditional crops with lower yield to compensate for the reduction of income and yield due to converted cropland. From 2003 to 2012, the area of cropland for the economic crops, fruit, tobacco, and medicinal herbs dramatically increased year by year [28]. As a result, the biodiversity of crops reduced.
A series of accomplishments have been led by the GGP. However, the planned duration of subsidies (5–8 years) is too short both for forest recovery and for trees to grow large enough to allow sufficient harvest to offset the losses from converted cropland [25]. Additionally, the GGP was poorly understood by ethnic people, which might have reduced the awareness of public of the importance of continuing the GGP after the subsidies stopped. Studies have indicated that some converted forest and grassland would possibly be converted back to cropland and that natural forest would be logged again if the subsidies ended [48]. Reduced forest coverage around Dong villages after the implementation of the GGP also demonstrated that the natural forest was logged and converted to cropland for compensating the converted cropland on steep slopes. Additionally, grassland was significantly reduced during the study period. Grassland in relatively flat places was reclaimed to compromise the converted cropland.
These findings show that protecting natural forest and converted forest needs to be put on the list of concerns after the implementation of the GGP. At the same time, promoting the GGP in areas which have not been focused on previously and improving the awareness of the public about environmental protection and understanding of the GGP are urgent for implementing sustainable development strategy.

5. Conclusions

The application of the GGP has, to some extent, resulted in some modest gains in forest conservation around ethnic villages in Qiandongnan Prefecture, especially around the Miao villages with steeper topography, where the ecological benefits of the GGP are the greatest. In these areas, a reduction in the number of patches and edge density implies a more continuous forest cover, which has some benefits for wildlife. The faith in the sacred forest also plays an important role in forest preservation in this region. However, reclamation is still intensive around ethnic villages, especially in Dong villages. It is also noted that after the end of the first phase of the GGP, there was some reversion of forest back to cropland. Therefore, we propose that the GGP continues to be applied in Qiandongnan Prefecture to encourage forest conservation. Additionally, more attention should be paid to the southern and eastern areas of the prefecture, where there was previously limited implementation of the GGP. At the same time, conserving the biodiversity of crops is also important for sustainable development in Qiandongnan Prefecture.

Supplementary Materials

The following are available online at https://www.mdpi.com/2071-1050/10/10/3485/s1, Table S1. Confusion matrix of the land use classification in 1993. The values in the table are the number of the pixels. Table S2. Confusion matrix of the land use classification in 1999. The values in the table are the number of the pixels. Table S3. Confusion matrix of the land use classification in 2009. The values in the table are the number of the pixels. Table S4. Confusion matrix of the land use classification in 2013. The values in the table are the number of the pixels.

Author Contributions

Conceptualization, D.W. and L.G.; Methodology, D.W. and D.H.; Software, D.W., Y.-T.T. and J.H.; Validation, D.W., Y.-T.T. and L.G.; Formal Analysis, D.W.; Investigation, L.G.; Resources, D.W. and L.G.; Data Curation, L.G.; Writing—Original Draft Preparation, D.W.; Writing—Review & Editing, D.H., Y.-T.T., L.G. and J.H.; Visualization, D.W.; Supervision, L.G. and Y.-T.T.; Project Administration, L.G.; Funding Acquisition, L.G.

Funding

The research was funded by the National Natural Science Foundation of China (No. 30970506), the 111Project (B08044), and UK Engineering and Physical Sciences Research Council (EP/L015463/1).

Acknowledgments

This work was carried out at the International Doctoral Innovation Center (IDIC). The authors acknowledge the financial support from the International Doctoral Innovation Center, Ningbo Education Bureau, Ningbo Science and Technology Bureau, and the University of Nottingham. We also acknowledge the support of data processing by Dongsheng Zhao from the IDIC.

Conflicts of Interest

No conflict of interest exists in this manuscript, and the manuscript has been approved by all authors for publication. The authors declare that the work described was original research that has not been published previously and is not under consideration for publication elsewhere, in whole or in part.

References

  1. Dai, Z. Intensive agropastoralism: Dryland degradation, the Grain-to-Green Program and islands of sustainability in the Mu Us Sandy Land of China. Agric. Ecosyst. Environ. 2010, 138, 249–256. [Google Scholar] [CrossRef]
  2. Cao, S.; Chen, L.; Liu, Z. An investigation of Chinese attitudes toward the environment: Case study using the Grain for Green Project. AMBIO 2009, 38, 55–64. [Google Scholar] [CrossRef] [PubMed]
  3. Reynolds, J.F.; Smith, D.M.S.; Lambin, E.F.; Turner, B.; Mortimore, M.; Batterbury, S.P.; Downing, T.E.; Dowlatabadi, H.; Fernández, R.J.; Herrick, J.E. Global desertification: Building a science for dryland development. Science 2007, 316, 847–851. [Google Scholar] [CrossRef] [PubMed]
  4. Pimentel, D. Soil erosion: A food and environmental threat. Environ. Dev. Sustain. 2006, 8, 119–137. [Google Scholar] [CrossRef]
  5. Zhou, Z.; Gan, Z.; Shangguan, Z.; Dong, Z. China’s Grain for Green Program has reduced soil erosion in the upper reaches of the Yangtze River and the middle reaches of the Yellow River. Int. J. Sustain. Dev. World Ecol. 2009, 16, 234–239. [Google Scholar] [CrossRef]
  6. Lei, D.; Shangguan, Z.-P.; Rui, L. Effects of the grain-for-green program on soil erosion in China. Int. J. Sediment Res. 2012, 27, 120–127. [Google Scholar]
  7. Masera, O.R.; Garza-Caligaris, J.; Kanninen, M.; Karjalainen, T.; Liski, J.; Nabuurs, G.; Pussinen, A.; de Jong, B.H.; Mohren, G. Modeling carbon sequestration in afforestation, agroforestry and forest management projects: The CO2FIX V. 2 approach. Ecol. Model. 2003, 164, 177–199. [Google Scholar] [CrossRef]
  8. Zomer, R.J.; Trabucco, A.; Bossio, D.A.; Verchot, L.V. Climate change mitigation: A spatial analysis of global land suitability for clean development mechanism afforestation and reforestation. Agric. Ecosyst. Environ. 2008, 126, 67–80. [Google Scholar] [CrossRef]
  9. Song, X.; Peng, C.; Zhou, G.; Jiang, H.; Wang, W. Chinese Grain for Green Program led to highly increased soil organic carbon levels: A meta-analysis. Sci. Rep. 2014, 4, 4460. [Google Scholar] [CrossRef] [PubMed] [Green Version]
  10. Sun, G.; Zhou, G.; Zhang, Z.; Wei, X.; McNulty, S.G.; Vose, J.M. Potential water yield reduction due to forestation across China. J. Hydrol. 2006, 328, 548–558. [Google Scholar] [CrossRef]
  11. Zhou, H.; Van Rompaey, A. Detecting the impact of the “Grain for Green” program on the mean annual vegetation cover in the Shaanxi province, China using SPOT-VGT NDVI data. Land Use Policy 2009, 26, 954–960. [Google Scholar] [CrossRef]
  12. Gao, F.; Zhang, B.; Wang, Z.; Kaishan, S.; Ren, C.; Lei, G.; Song, G.; Ning, J. Study on soil and water erosion changes before and after returning farmland to forest project in Mudanjiang City based on GIS and USLE. Res. Agric. Mod. 2010, 31, 612–616. [Google Scholar]
  13. 450 Billion Yuan Was Invested in the Grain for Green Program during the Last 17 Year for Trading Green Mountains and Clean Wasters. Available online: http://www.cet.com.cn/wzsy/rd/1882190.shtml (accessed on 21 February 2017).
  14. Zhou, D.; Zhao, S.; Zhu, C. The Grain for Green Project induced land cover change in the Loess Plateau: A case study with Ansai County, Shanxi Province, China. Ecol. Indic. 2012, 23, 88–94. [Google Scholar] [CrossRef]
  15. Wang, P.; Li, X.W.; Zhao, A.J.; Huang, C.D.; Fan, C.; Lai, J.M. Effects of vegetation restoration on landscape pattern of Hongya County in recent 15 years. Acta Ecol. Sin. 2013, 33, 6721–6729. [Google Scholar] [CrossRef]
  16. Cao, S.; Chen, L.; Yu, X. Impact of China’s Grain for Green Project on the landscape of vulnerable arid and semi-arid agricultural regions: A case study in northern Shaanxi Province. J. Appl. Ecol. 2009, 46, 536–543. [Google Scholar] [CrossRef]
  17. Chen, H.; Marter-Kenyon, J.; López-Carr, D.; Liang, X.-Y. Land cover and landscape changes in Shaanxi Province during China’s Grain for Green Program (2000–2010). Environ. Monit. Assess. 2015, 187, 644. [Google Scholar] [CrossRef] [PubMed]
  18. Wang, D.; Guo, L.; Zhao, S.; Lv, L. Influences of the Project of Returning Cropland to Forest on Vegetation Covering Changing in Qiandongnan Mointain region. J. Mt. Res. 2015, 33, 208–217. [Google Scholar]
  19. Fu, B.-J.; Hu, C.-X.; Chen, L.-D.; Honnay, O.; Gulinck, H. Evaluating change in agricultural landscape pattern between 1980 and 2000 in the Loess hilly region of Ansai County, China. Agric. Ecosyst. Environ. 2006, 114, 387–396. [Google Scholar] [CrossRef] [Green Version]
  20. Zhou, H.; Miu, J. Study on phase evaluation of program of returning farmland to forest in Guizhou. Guizhou For. Sci. Technol. 2003, 31, 46–50. [Google Scholar]
  21. Zhou, H.; Zhou, J.; Zhang, X.; Miu, J. A phase evaluation on the social and economic benefits of Returning Farmland to Forest Project in Guizhou Province. Guizhou For. Sci. Technol. 2007, 35, 1–6. [Google Scholar]
  22. Xu, W.; Yin, Y.; Zhou, S. Social and economic impacts of carbon sequestration and land use change on peasant households in rural China: A case study of Liping, Guizhou Province. J. Environ. Manag. 2007, 85, 736–745. [Google Scholar] [CrossRef] [PubMed]
  23. Zhou, S.; Yin, Y.; Xu, W.; Ji, Z.; Caldwell, I.; Ren, J. The costs and benefits of reforestation in Liping County, Guizhou Province, China. J. Environ. Manag. 2007, 85, 722–735. [Google Scholar] [CrossRef] [PubMed]
  24. Rodríguez, L.G.; Hogarth, N.; Zhou, W.; Putzel, L.; Xie, C.; Zhang, K. Socioeconomic and environmental effects of China’s Conversion of Cropland to Forest Program after 15 years: A systematic review protocol. Environ. Evid. 2015, 4. [Google Scholar] [CrossRef]
  25. Liu, J.; Li, S.; Ouyang, Z.; Tam, C.; Chen, X. Ecological and socioeconomic effects of China’s policies for ecosystem services. Proc. Natl. Acad. Sci. USA 2008, 105, 9477–9482. [Google Scholar] [CrossRef] [PubMed]
  26. Chen, H.; López-Carr, D.; Tan, Y.; Xi, J.; Liang, X. China’s Grain for Green policy and farm dynamics: simulating household land-use responses. Reg. Environ. Chang. 2016, 16, 1147–1159. [Google Scholar] [CrossRef]
  27. Forestry Administration of Qiandongnan Prefecture. Forestry Annals of Qiandongnan Prefecture from 1988 to 2010; China Forestry Publishing House: Beijing, China, 2012. [Google Scholar]
  28. Qiandongnan Yearbook Committee. The Yearbook of Qiandongnan Prefecture 2012; Arts Publishing House of Yunnan: Kunming, China, 2012. [Google Scholar]
  29. Shi, C.J. The Moving History of Miao in the World; Guizhou People’s Press: Guiyang, China, 2006. [Google Scholar]
  30. SEAC. Miao People. Available online: http://seac.gov.cn/col/col259/index.html (accessed on 26 March 2017).
  31. SEAC. Dong People. Available online: http://seac.gov.cn/col/col385/index.html (accessed on 26 March 2017).
  32. Zhang, L.; Li, F.; Cui, H. Role of traditional agricultural ecosystem on prevention-and-cure agricultural non-point source pollution: A case study of rice-fish-duck symbiotic model in Congjiang County, Guizhou Province. Ecol. Econ. 2014, 30, 131–134. [Google Scholar]
  33. Lu, J.; Li, X. Review of rice–fish-farming systems in China—One of the globally important ingenious agricultural heritage systems (GIAHS). Aquaculture 2006, 260, 106–113. [Google Scholar] [CrossRef]
  34. Xie, J.; Hu, L.; Tang, J.; Wu, X.; Li, N.; Yuan, Y.; Yang, H.; Zhang, J.; Luo, S.; Chen, X. Ecological mechanisms underlying the sustainability of the agricultural heritage rice–fish coculture system. Proc. Natl. Acad. Sci. USA 2011, 108, E1381–E1387. [Google Scholar] [CrossRef] [PubMed]
  35. Thousands of Towns and Villages Project of Guizhou Province. Available online: http://www.gzdjw.com/wcqx/ (accessed on 1 November 2013).
  36. Uuemaa, E.; Mander, Ü.; Marja, R. Trends in the use of landscape spatial metrics as landscape indicators: A review. Ecol. Indic. 2013, 28, 100–106. [Google Scholar] [CrossRef]
  37. Lee, Y.-C.; Ahern, J.; Yeh, C.-T. Ecosystem services in peri-urban landscapes: The effects of agricultural landscape change on ecosystem services in Taiwan’s western coastal plain. Landsc. Urban Plan. 2015, 139, 137–148. [Google Scholar] [CrossRef]
  38. Xiao, D.N. Principle, Method and Application of Landscape Ecology; Forestry Press: Beijing, China, 1991; pp. 186–195. [Google Scholar]
  39. Bu, R.-C.; Hu, Y.-M.; Chang, Y.; Li, X.-Z.; Hong, S.H. A correlation analysis on landscape metrics. Acta Ecol. Sin. 2005, 25, 2764–2775. [Google Scholar]
  40. Liu, Y.; Lv, Y.; Fu, B. Implication and limitation of landscape metrics in delineating relationship between landscape pattern and soil erosion. Acta Ecol. Sin. 2011, 31, 267–275. [Google Scholar]
  41. Wang, D.; Guo, L.; Xia, J.; Zhao, S.; Lv, L. Analysis of Effects of Grain for Green Project in Qiandongnan Based on RS and GIS Technologies. J. Basic Sci. Eng. 2015, 23, 30–40. [Google Scholar]
  42. Wang, D.; Guo, L.; Wu, B.; Lv, L. Spatial distribution of ethnic villages in Qiandongnan mountainous region. In Proceedings of the 2014 International Conference on Environmental Engineering and Computer Application (ICEECA 2014), Hong Kong, China, 25–26 December 2014; CRC Press: Boca Raton, FL, USA, 2015. [Google Scholar]
  43. Koulouri, M.; Giourga, C. Land abandonment and slope gradient as key factors of soil erosion in Mediterranean terraced lands. Catena 2007, 69, 274–281. [Google Scholar] [CrossRef]
  44. Zhou, W. Impact of land nature slope and sea level elevation on the economic development in the Three Gorges’ area. Resour. Eviron. Yangtze Basin 2001, 10, 15–21. [Google Scholar]
  45. Wu, Z.-J. Soil erosion and water losses situation and it cause of formation and control stategy in Qiandongnan Prefecture. For. Invent. Plan. 2001, 26, 60–62. [Google Scholar]
  46. Zhou, Z.; An, Y. Remote sensing investigating soli erosion present conditions and analyzing of spatial changeable in guizhou province. Bull. Soil Water Conserv. 2000, 20, 23–25. [Google Scholar]
  47. Wang, Y.; Wang, Y.; Jiao, A.; Caiji, Z.; Yang, J.; Ruan, R.; Xue, D. Influence of national tranditional culture on crop genetic diversity—Take an example of kam sweet rice in Liping County of Guizhou Province. J. Nat. Resour. 2015, 30, 617–628. [Google Scholar]
  48. Hu, C.-X.; Fu, B.-J.; Chen, L.-D.; Gulinck, H. Farmer’s attitudes towards the Grain-for-Green programme in the Loess hilly area, China: A case study in two small catchments. Int. J. Sustain. Dev. World Ecol. 2006, 13, 211–220. [Google Scholar] [CrossRef]
Figure 1. The location of ethnic villages and administrative districts, overlain over a topographic map, in Qiandongnan Prefecture, Guizhou Province, China. MD village represents the mixed villages occupied by both Miao and Dong peoples.
Sustainability 10 03485 g001
Figure 2. The remote sensing image of Xijiang Qianhu Miao Village at a resolution of 0.4 m.
Sustainability 10 03485 g002
Figure 3. The distribution of the ethnic villages in terms of altitude and slope: (a) the average altitude and slope within the ethnic villages; (b) the range of altitude and slope within the ethnic villages. The circles in (a) indicate the clustered distribution of the ethnic villages in terms of slope and elevation. The blue line in (b) distinguishes the changing range of geographical factors around the ethnic villages.
Sustainability 10 03485 g003
Figure 4. Change of the landscape around the Dong villages within the buffer belts of 1 km and 2 km. (a) Percentage of class area; (b) number of patches; (c) edge density. Outliers were identified and marked as circles and extreme values were identified and marked as asterisks.
Sustainability 10 03485 g004
Figure 5. Change of the landscape around MD villages within the 1-km and 2-km buffers. (a) Percentage of class area; (b) number of patches; (c) edge density. Outliers were identified and marked as circles and extreme values were identified and marked as asterisks.
Sustainability 10 03485 g005aSustainability 10 03485 g005b
Figure 6. The change in the landscape around the Miao villages within the 1-km and 2-km buffers. (a) Percentage of class area; (b) number of patches; (c) edge density. Outliers were identified and marked as circles and extreme values were identified and marked as asterisks.
Sustainability 10 03485 g006
Table 1. The land use change around representative ethnic villages from 1993 to 2013 (unit: %).
VillageLand Cover1 km2 km
19931999200920131993199920092013
Xijiang Qianhu Miao VillageCropland48.2568.9346.3246.1646.1865.6731.7228.07
Forest38.6321.9444.7244.9551.2433.8767.1166.01
Grassland4.280.470.570.512.580.460.760.67
Built-up8.848.668.398.380.000.010.415.24
Zhaoxing Dong VillageCropland79.8063.2393.1093.2272.3358.5893.9494.51
Forest14.3432.181.401.2624.9140.396.055.48
Grassland2.470.780.000.002.771.030.000.00
Built-up3.393.815.505.520.000.000.010.01
Sizhai MD villageCropland59.1977.0559.5759.5736.3964.9654.1854.30
Forest10.3722.6039.8139.6932.1633.7245.1944.95
Grassland30.210.070.000.0031.421.250.000.00
Built-up0.240.280.620.740.030.070.620.75
Table 2. The correlation coefficient between topographic factors (slope and elevation) and landscape indicators (coverage, NP, and ED) (n = 180).
Year1 km2 km
SlopeElevationSlopeElevation
Cropland1993−0.47 **−0.29 **−0.41 **−0.26 **
1999−0.59 **−0.05−0.57 **−0.09
2009−0.43 **−0.54 **−0.41 **−0.56 **
2013−0.30 **−0.46 **−0.35 **−0.52 **
Forest19930.64 **0.15 *0.64 **0.03
19990.62 **0.060.59 **0.04
20090.46 **0.54 **0.41 **0.51 **
20130.47 **0.53 **0.40 **0.49 **
Grassland1993−0.28 **0.29 **−0.39 **0.25 **
1999−0.010.08−0.100.14
20090.040.25 **0.000.28 **
20130.040.20 **0.000.26 **
ED1993−0.22 **−0.01−0.27 **−0.15
19990.03−0.15 *−0.12−0.14
2009−0.14−0.01−0.16 *−0.11
2013−0.16 *−0.01−0.19 *−0.11
NP1993−0.010.27 **−0.07−0.03
19990.29 **0.060.22 **0.09
20090.02−0.040.07−0.05
20130.02−0.030.06−0.01
*: Correlation is significant at the 0.05 level (2-tailed); **: Correlation is significant at the 0.01 level (2-tailed).

