The Missing Variable in Big Data for Social Sciences: The Decision-Maker


Department of Management, Economics and Industrial Engineering, Politecnico di Milano, 20156 Milano, Italy
Sustainability 2018, 10(10), 3415; https://doi.org/10.3390/su10103415
Submission received: 23 August 2018
/
Revised: 18 September 2018
/
Accepted: 19 September 2018
/
Published: 25 September 2018
(This article belongs to the Special Issue Big Data Research for Social Sciences and Social Impact)
Abstract
:The value of big data for social sciences and social impact is professed to be high. This potential value is related, however, to the capacity of using extracted information in decision-making. In all of this, one important point has been overlooked: when “humans” retain a role in the decision-making process, the value of information is no longer an objective feature but depends on the knowledge and mindset of end users. A new big data cycle has been proposed in this paper, where the decision-maker is placed at the centre of the process. The proposed cycle is tested through two cases and, as a result of the suggested approach, two operations—filtering and framing—which are routinely carried out independently by scientists and end users in an unconscious manner, become clear and transparent. The result is a new cycle where four dimensions guide the interactions for creating value.
1. Introduction
Big Data (BD) has gained wide attention since the first introduction of the definitional statement in which they were described as “high-volume, high-velocity and high-variety information assets that demand cost-effective, innovative forms of information processing for enhanced insight and decision making” [1]. This seminal definition gave BD its signature “V”, originally the three Vs of Volume, to indicate the vast amount of data in play, Velocity, to indicate the rate of data generation and possible successive processing and Variety, to indicate the many data types and sources. Further “Vs” have been since be added: Veracity, to spell out the need for carefully scrutinizing the reliability of data, and Value, which can be seen as the ultimate goal when BD are used in social science [2,3,4]. Value is understood as the capability of BD to generate insights that can benefit decision-makers, organizations, policy-makers and other end users [2,3,4].
To date, an enormous number of studies have been carried out on BD [2,5], but their interest for social science is more recent [4]. The available studies offer, on the one hand, experimentations in the use of BD [6], social media, in particular, to generate Value, without involving decision-makers [7]. On the other hand, several previous works of research have pointed out that BD has the potential to generate Value for business and also to tackle societal challenges [8,9,10]. Further to this, an issue that has been overlooked in previous studies is that this generation of Value is linked to the way BD is used by people working inside organizations and governments. When decisions continue to be made by “humans”, the value and use of the information is dependent on the characteristics and knowledge of the decision-maker [11]. This problem is not new or specifically pertinent to BD (see, for example, [12]), hence it is surprising that it has been neglected so far.
The path towards generating knowledge for decision-makers and then Value is clearly more complex in the BD arena. Many scientists from different disciplines are involved in elaborating BD in order to acquire, analyze, model and visualize data. These scientists often make arbitrary decisions [4], for example about what material to select from the entire world of social media [6] or how to model the information [13]. Without the involvement of decision-makers—who, it must be remembered, are the final users of the data—there is the high risk of creating a mismatch between the needs of the users and the information provided by the data scientists. What happens is that “obscure” areas in BD processing are created and, as a consequence, two contradictory situations can arise. In the first case, “slave” decision-makers blindly follow the indications proposed by algorithms without mastering the numbers, while in the second case, “reluctant” decision-makers [14] ignore the information extrapolated from BD entirely. Both situations are problematic and can result in sub-optimal decisions being made.
In this paper, the author argues that a new BD cycle is urgently needed to achieve social impact and, at its centre, is the true missing variable for pursuing Value: the decision-maker. When “humans” retain a role in the decision-making process, the value of information is, accordingly, no longer objective but is influenced by the end users’ own knowledge and mental outlook. More specifically the research question addressed in this paper is how decision-makers can be put at the centre of the BD cycle and become the point of reference for knowledge generation? To pursue this goal, two processes that are usually carried out implicitly by data scientists—filtering and framing—become clear-cut and explicit. The new approach was tested out in two cases of wider social interest: City and Art. In the City case, the key actor (CityEx) wanted to have new insight from BD, to stimulate the public debate during the mayor election campaign. In the Art case, a cultural foundation wanted to explore its network and its role in the local scene. Both cases are located in the same major city in northern Italy.
To describe these arguments, the paper is articulated as follows: the next section sets out the methodology; section three outlines the results. The discussion is lastly presented and conclusions are drawn.
2. Methodology
This section covers the methodology employed in the study, first introducing the conceptual perspective and introducing the decision-maker centric approach and then, in the following sub-section, describing the empirical strategy.
2.1. Conceptual Perspective
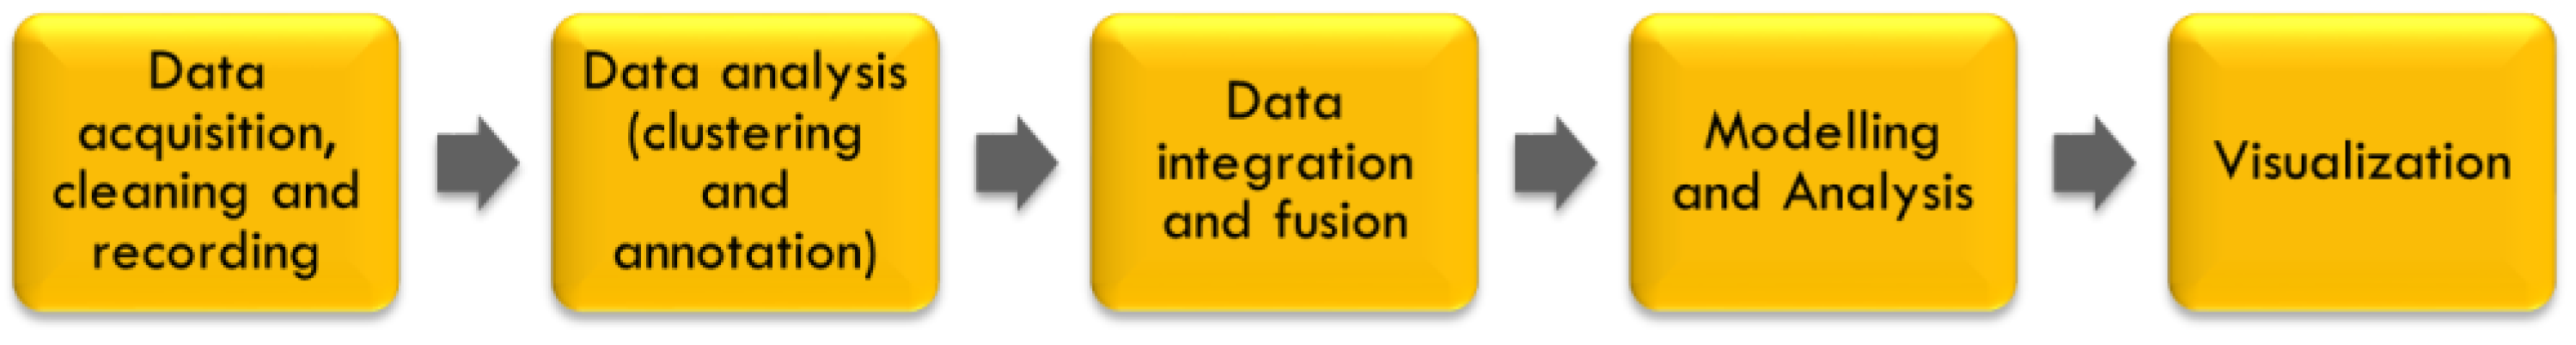
Decision-makers in this paper are considered as private or public actors who make decisions and act within their social and institutional roles. This definition excludes the individual sphere of decision-making, such as purchasing items for personal needs. The relationship between the value of information and user knowledge was recognized before BD arrived on the scene (e.g., [12]). The common starting point, which remains the same as in the past, is that knowledge is subjective and the same information can be easily understood differently by two distinct decision-makers on the basis of their personal background and experience [13]. Having set out the above, attention is drawn to two processes that have acquired particular importance in the era of BD and can influence the way new knowledge is used, learnt and generated, although the decision-makers are often only involved in the initial and/or final stages. These two processes are filtering and framing, and they flow through in all phases of the BD chain (see Figure 1).
The first process, filtering, involves the selection of data and the relative attributes and features ingrained within the mechanisms for transforming data first into information and then into knowledge that can be used by decision-makers. From the stage of data acquisition to that of data visualization, data scientists make decisions that will reduce the mass of data processed and ensure that the data selected can be easily managed and understood. One of the most obvious—and most discussed—cases of filtering concerns the collecting and analyzing of data from social media [15,16,17]. Whether this information is to be used for sentiment analysis or network analysis, subjective decisions come into play that impact on the type of data acquired and the kind of attributes gathered. For instance, collecting data through key words implies including or excluding a certain number of social media posts, and therefore shaping the space for decision-making in different ways. While filtering is less visible, it is nonetheless present, and not only in the data collection process. When integrating and merging data, data scientists must make decisions that affect the way temporal and spatial references are aligned [18,19]. For example, when data have a different geographical granularity, data scientists must decide either to aggregate fine-grained data or to disaggregate higher-level data. Algorithms may very well be highly sophisticated, but there will always be choices that affect the final results.
The second process, framing, is the strategy used to contextualize and communicate data so that they can be understood, trusted and enacted upon. This second process is rooted in the awareness that data do not exist “per se” and do not have an objective meaning. As highlighted by Gitelman ([11], p. 3), “data need to be imagined as data to exist and function as such, and the imagination of data entails an interpretive base”. Within the broader phase of framing, visualization is the process that has been studied the most widely, starting with the seminal contribution by Frankel and Reid [20], who claimed that the role of designers is to stimulate novel thinking patterns. Since then, other studies have highlighted how different visual frames can influence the understanding of experts and businesses (e.g., [21,22]. Framing comes into action from the data collection phase onwards, to decide which data and attributes enable better decision-making and present the best annotation [23].
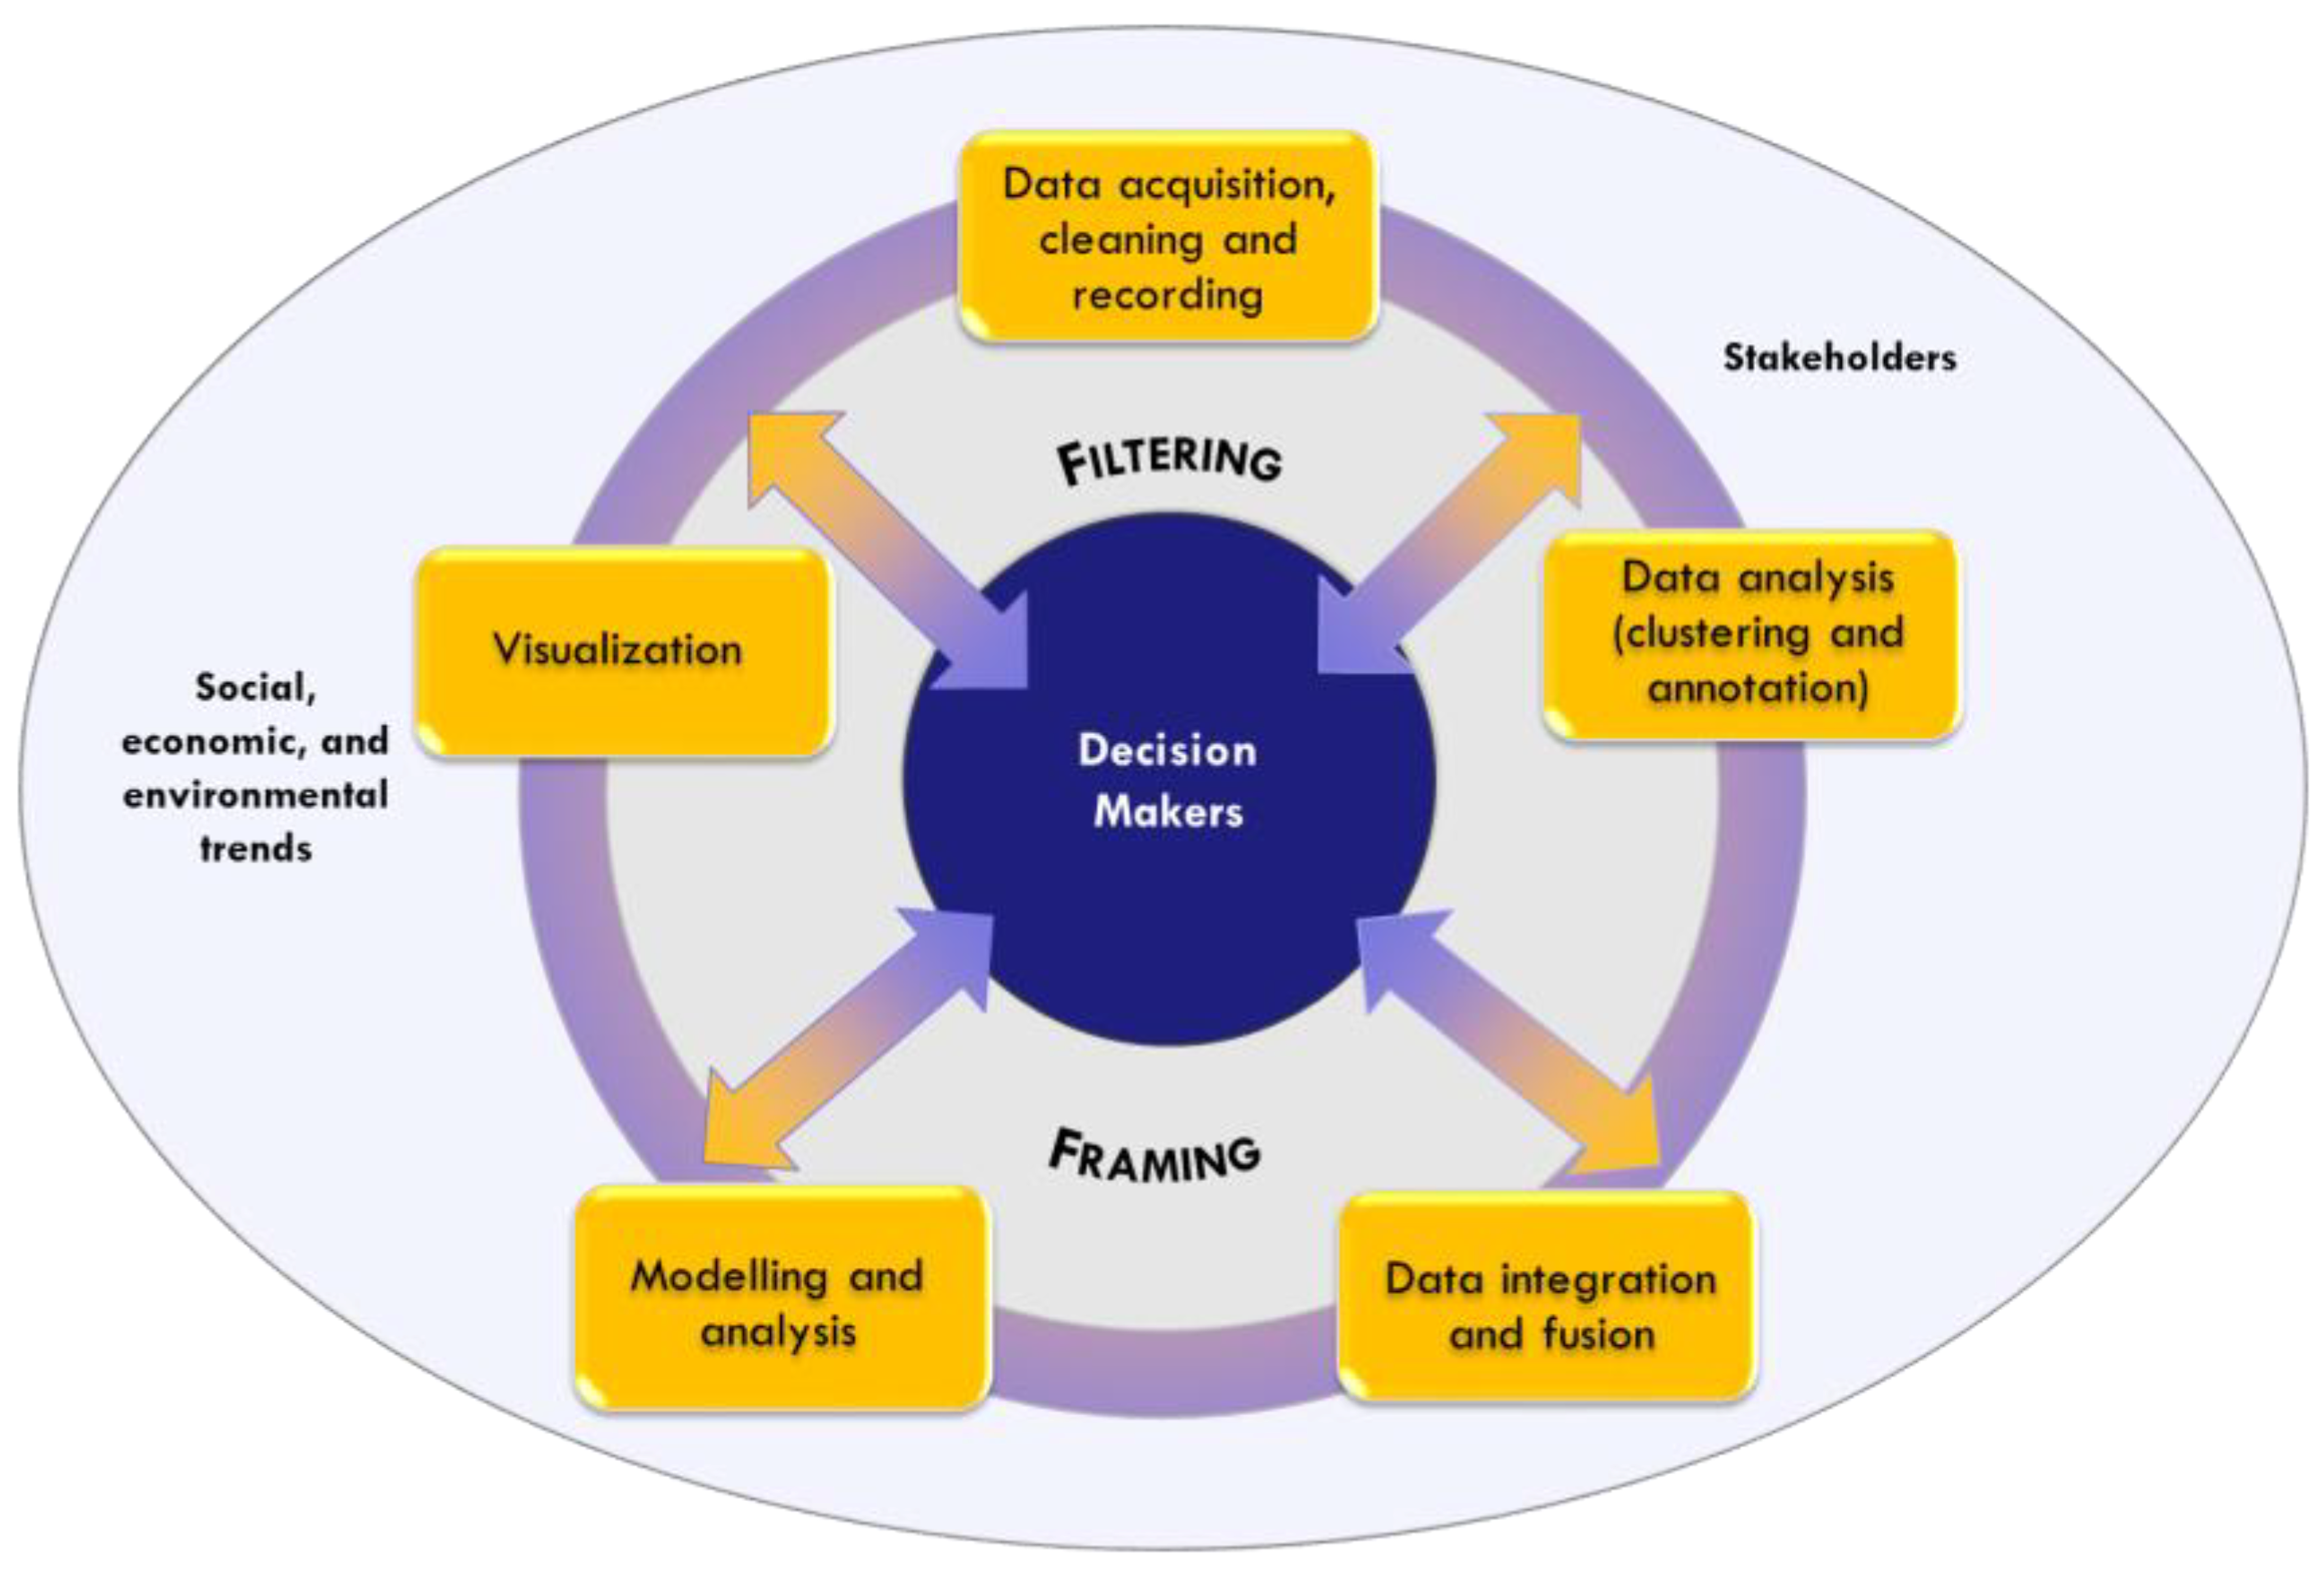
With the final aim of enhancing the value of BD for users, this study is proposing and evaluating a BD cycle centred on the decision-makers, where the two processes, filtering and framing, are investigated and explained clearly. Following the scheme set out in Figure 2, decision-makers are placed at the centre of the proposition and become the yardstick for the entire BD process. This, in turn, consists of five phases. The first three phases are connected to data management, and involve the operations for acquiring, storing and setting data that will be used in subsequent analyses. This modelling and analysis phase is the cornerstone of analytics, and underpins the process of presenting the data so that they can be understood and used effectively by the people making decisions.
According to this innovative approach, where decision-makers play a central role, the new cycle is placed within a wider context, one in which social, economic and environmental trends all need to be taken into consideration together with the relevant stakeholders.
2.2. Empirical Strategy
At the empirical level, the BD cycle introduced in the previous section was tested out in two cases through action research methodology [24,25,26]. The distinctive feature of this approach is that it relies on researchers and the decision-makers defining a joint work and research framework to address both practical concerns and academic problems. After conducting a preliminary screening of the possibilities and presenting an initial proposal to five decision-makers, two cases—City and Art —were chosen and, more specifically, two expert decision-makers, CityEx and ArtEx. The selection was based on a series of parameters: whether the decision-makers were available and ready to dedicate the necessary time to the interactive cycle; whether it was possible to test the new data within their sphere of decisions/actions; and their initial attitude towards BD. Both experts were willing to test (big) data, meaning that they were not “reluctant”; they did not put blind faith in the process, however, in part because of their long-time experience in making decisions on the basis of data and analytics, meaning that they had the critical mindset needed to test the cycle.
The City case deals with the construction of a new digital monitoring system with the very specific aim of studying Milan’s own brand of internationalism, “In what way is Milan international?” (i.e., how does it express its inner international self); CityEx belongs to a non-profit association that works towards creating value for the city of Milan. CityEx came from a background in public management with expertise in accounting; he had just begun to approach BD at the time when the project started. Although he was a novice in the field of BD, he was incredibly curious and ready to read practitioner and academic material in order to gain a better understanding of the potential of BD and social media. CityEx wished to use data to stimulate public debate, but also to gain insights that could be applied to projects under discussion in specific areas of Milan. The City case ran between February 2014 and July 2016.
The second case, Art, is a performing arts organization and is considered one of the most important cultural institutions in Italy, boasting a superb reputation worldwide. ArtEx is the Head of Marketing and Communications at Art and he started by asking about Art’s followers on social media and whether there are particular patterns or characteristics in their online behaviour. ArtEx’s background is in economics and he has always worked in marketing for cultural organizations. He fully believed in digitalization and even before taking part in this project was very keen to promote it both in Art and in his previous organizations. He was particularly interested in social media, seeing them as the means to reach Art’s audience when it was not actually present in the performance venue.
The overall project started in April 2016 and concluded in November 2017. The author of this paper was involved in both cases as a researcher and the coordinator of an interdisciplinary group with skills in statistics, science computing, design and management. More specifically, the City project team consisted of two science computing experts, two statisticians, two designers and two management researchers, with a total of eight people working on the project. The Art project team consisted of one science computing expert, one statistician, two management researchers and one designer, with a total of five people working on the project.
The same protocol was adopted in both cases, following action research methodology [24,25,26]. The cyclical process undertaken was articulated into three stages: diagnosis and planning, action taking, and evaluation and learning outcomes. The diagnosis and planning process was based upon two types of empirical methods. After initially defining the problem with the relevant expert, the formal interviews were carried out in order to learn more about the environment and context in which the expert operated. Secondary sources were then collected in order to triangulate the data collected through the formal interviews. The planning phase was carried out by the project coordinator in both cases and shared first with the data scientist team and then with the relevant expert. The action taking process was the central part of both cases and consisted of three types of interaction: (1) plenary meetings involving the decision-makers and the entire research group; (2) restricted meetings between the project coordinator and the decision-makers; (3) internal research group meetings. Overall, more than forty meetings were held for both projects to complete the BD cycle and ten meetings to revise the cycle after using the information. The final step of the action research cycle is evaluation and learning. During this step the project coordinator summarized the findings at both theoretical and managerial level. The summary took the form of presentations and reports that were first discussed with the scientist team, then revised and finally presented to the expert in each case. This cycle was reiterated several times, although the first cycle was the lengthiest in both cases.
3. Results and Analysis
This section illustrates the results of testing the new scheme in City and Art, the two cases presented in the methodology. The findings are presented according to the phases of the scheme. Please note that as the two experts involved, CityEx and ArtEx, are both men, for the sake of simplicity it was decided to refer to them using the pronouns he/him.
3.1. The City Case
The first case was set around the main theme, that is, to study in what way Milan is international. The goal of CityEx was to analyze this topic in an innovative way through digital sources. CityEx’s expectations were that BD would provide more data about Milan and more quickly. After an initial meeting to share problems and objectives, the research team started on the process of acquiring data. The results were classified according to the different phases, but the decision was taken to focus selectively on the areas where filtering and framing were more visible.
3.1.1. Data Acquisition
Data were acquired from three main sources: data from social media (Twitter, Foursquare and Instagram), mobile phone data and traditional data (census data and open certified data from official sources). The decision to choose such data was aligned with CityEx’s desire to pursue the three “Vs” —Volume, Velocity and Variety—with respect to the data. Filtering was evident in this first phase, especially when relating to the rules applied to acquire social media data. Focusing on Twitter initially, two types of search were carried out, in both cases using the public API (application programming interface) provided by Twitter. The first search was based on key words, searching very broadly for “Milano/Milan” in the Twitter content. The second search examined geo-tagged tweets within the boundaries of the city of Milan. The entire payload of each tweet was downloaded, including the main body of the text and a large set of metadata, consisting of geographical data, tags, user mentions, images, links, time of tweet and language.
The tweets retrieved went through an initial cleaning process to exclude inappropriate tweets, and the data were then presented to CityEx together with a basic quantitative and content analysis. This first interaction was crucial to activate a discussion about the boundaries of the search and the meaning of the question of “in what way is Milan international”. It was soon evident that the question had a two-fold meaning, which had not been considered at the start. In one sense, the question is observed from a local perspective, one that is visible through the geo-tagged tweets of Milan, in the another, it is seen from a global viewpoint, where key words are used more openly to carry out searches. The data, although very raw, helped the decision-maker to realize that his organization was more interested in the digital layer embedded in the physical city, hence, in the tweets geo-tagged within the boundaries of the city of Milan. The same rule applied to Instagram and Foursquare.
The process of framing started also to be a matter of discussion at this early point, in terms of how data were initially visualized. At this stage, the visualization of data followed the two strategies for data acquisition: words and geography. CityEx did not feel that the first view, based on words, provided enough information. The geographical view was, instead, considered of value but not clear enough. In the first visualization, data (social media and mobile phone data) were located with reference to the precise longitude and latitude available for each tweet. Despite the pure amount of data, CityEx was unable to come up with any original or constructive ideas and, during a subsequent meeting, it became clear that a less detailed unit of analysis was needed to anchor the data. CityEx suggested that the various districts of Milan could provide a good reference unit. This unit was considered relevant by city managers, as it was already the reference for several traditional sets of data, and was also coherent with the need for greater detail while being aggregated enough to take decisions. From this point on, the district was framed as the main unit of analysis, guiding the other phases.
3.1.2. Data Clustering, Annotation and Merging
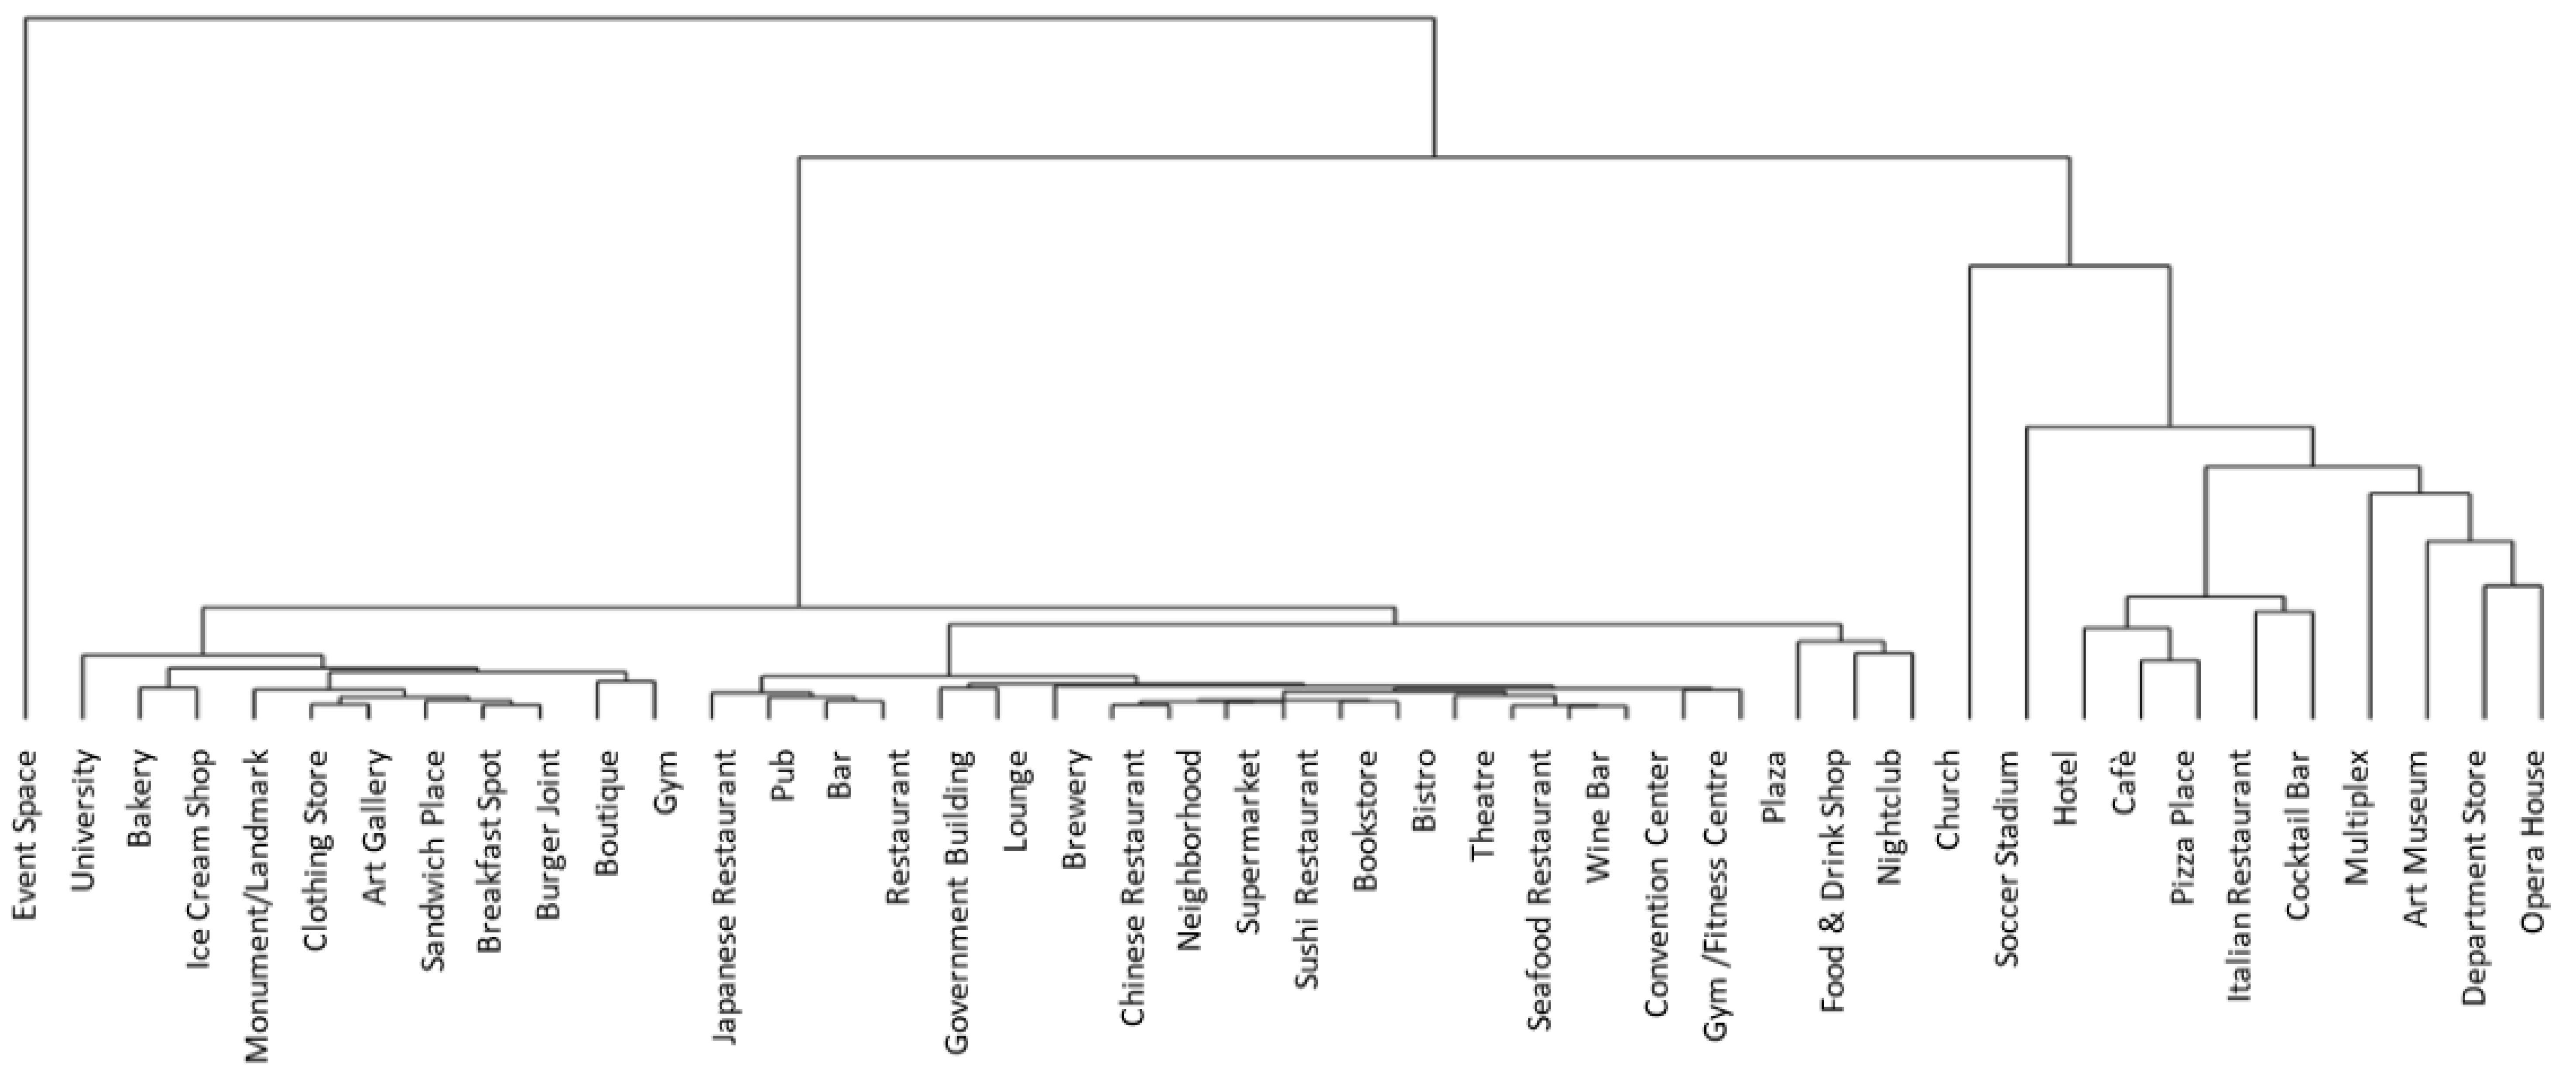
Starting from the main filter that had been selected (data referring to the physical city) and main framing (Milan districts), CityEx requested the research team to cluster data in such a way as to extract innovative insights and ideas. An example of this process was the analysis of Foursquare data. Foursquare is a social networking app employed by users to recommend particular venues (arts and commercial events, etc.), sharing their location with friends, via the app’s “check in” function. Users select venues from a list that can be updated. The venues are all classified by group. The basic unit of analysis was represented by the downloaded “check-ins” geo-tagged within the city of Milan. The dataset downloaded for the initial cluster analysis consisted of 301,770 rows or observations featuring four variables: venue_name, the name of the venue proposed by Foursquare; category_name, the name of the venue category proposed by Foursquare; month, the month taken in the analysis as ranging from the first day of the month to the last; check-ins, the number of check-ins concerning the venue and the month; nil_name, the name chosen by the city of Milan to identify the district. The first three variables were downloaded directly from the Foursquare API, while the fourth, constructed to identify the Milan districts, was based upon the tweet’s geo-tag. The dataset was pre-processed and transferred to a matrix structure, where the rows correspond to different districts and the columns correspond to the single categories. After a detailed analysis, the data scientists decided to apply a hierarchical algorithm involving Euclidean’s distance and Ward’s method. The output of this procedure was a dendrogram (see Figure 3), with the specific goal of reducing the 234 existing Foursquare categories.
When this first analysis was presented to CityEx, he was not convinced about the results since some of the clusters were too dense, combining categories that he wanted to see displayed separately, while other clusters contained too narrow a spectrum of categories. The final system of classification came out of discussions between analysts and experts, and CityEx proposed combining or separating clusters according to the categories typically used by city managers. The analysis of the clusters and granular data about the users gave rise to another problem, that of privacy. Individual data and messages were visible when small clusters were analyzed. Although such data are in the public domain, this situation led to some serious considerations about the ethical boundaries of the analysis, and the final decision was to exclude several categories containing too little highly-detailed data.
3.1.3. Modelling and Analysis
The modelling phases started during the clustering process, where the research group and CityEx started to rack their brains about how the data was to be used. Once placed within an appropriate visualization frame, the acquired data and clustering provide good support in terms of monitoring the phenomenon. However, the elements of Volume, Velocity and Variety of data left several of CityEx’s questions about decision-making variables unanswered. A good example on this point is the density, within the various districts, of the language used in the tweets. CityEx was interested in analyzing whether there were any districts where the prevailing language was other than Italian or English. His interest derived from the assumption that the languages used on Twitter reflect the users’ countries of origin, and one consequence of this is that the digital layer can provide a “weak signal” about the density of non-native Italians within a given district in a timely and evolving manner.
Starting from this initial framing, the analysts had to address an issue with implications for the entire decision-making cycle, that of the temporal framing of the data. The analysts made several considerations about the data’s statistical significance. Fisher’s exact test was applied to assess the stochastic independence between the districts and the language for each time unit candidate (i.e., months, two-month periods, quarters...). In this first analysis, each tweet was considered as an instance of two categorical random variables, the district and the language of the tweet. The iterative procedure clearly indicated that a unit equivalent to a quarter of a year was the optimal aggregation rate. In addition, the data had to be framed from a temporal viewpoint, meaning that a further filter had to be applied during the modelling process in order for it to attain statistical significance. In particular, several districts were excluded when the sample size was too small to draw statistically significant conclusions.
When this analysis was proposed, CityEx was surprisingly delighted by the quarterly temporal resolution, explaining that he sees very little need for data of this ilk to undertake action in real time, but that the data are useful for carrying out periodical analyses of the city’s evolution. A resolution over the time span of a quarter of a year was considered sufficiently accurate to analyze this variable. CityEx was, however, more disappointed about the exclusion of some districts, as this affected the completeness of data compared to the overall frame (the geography of Milan), but no better solutions were found.
3.1.4. Visualization
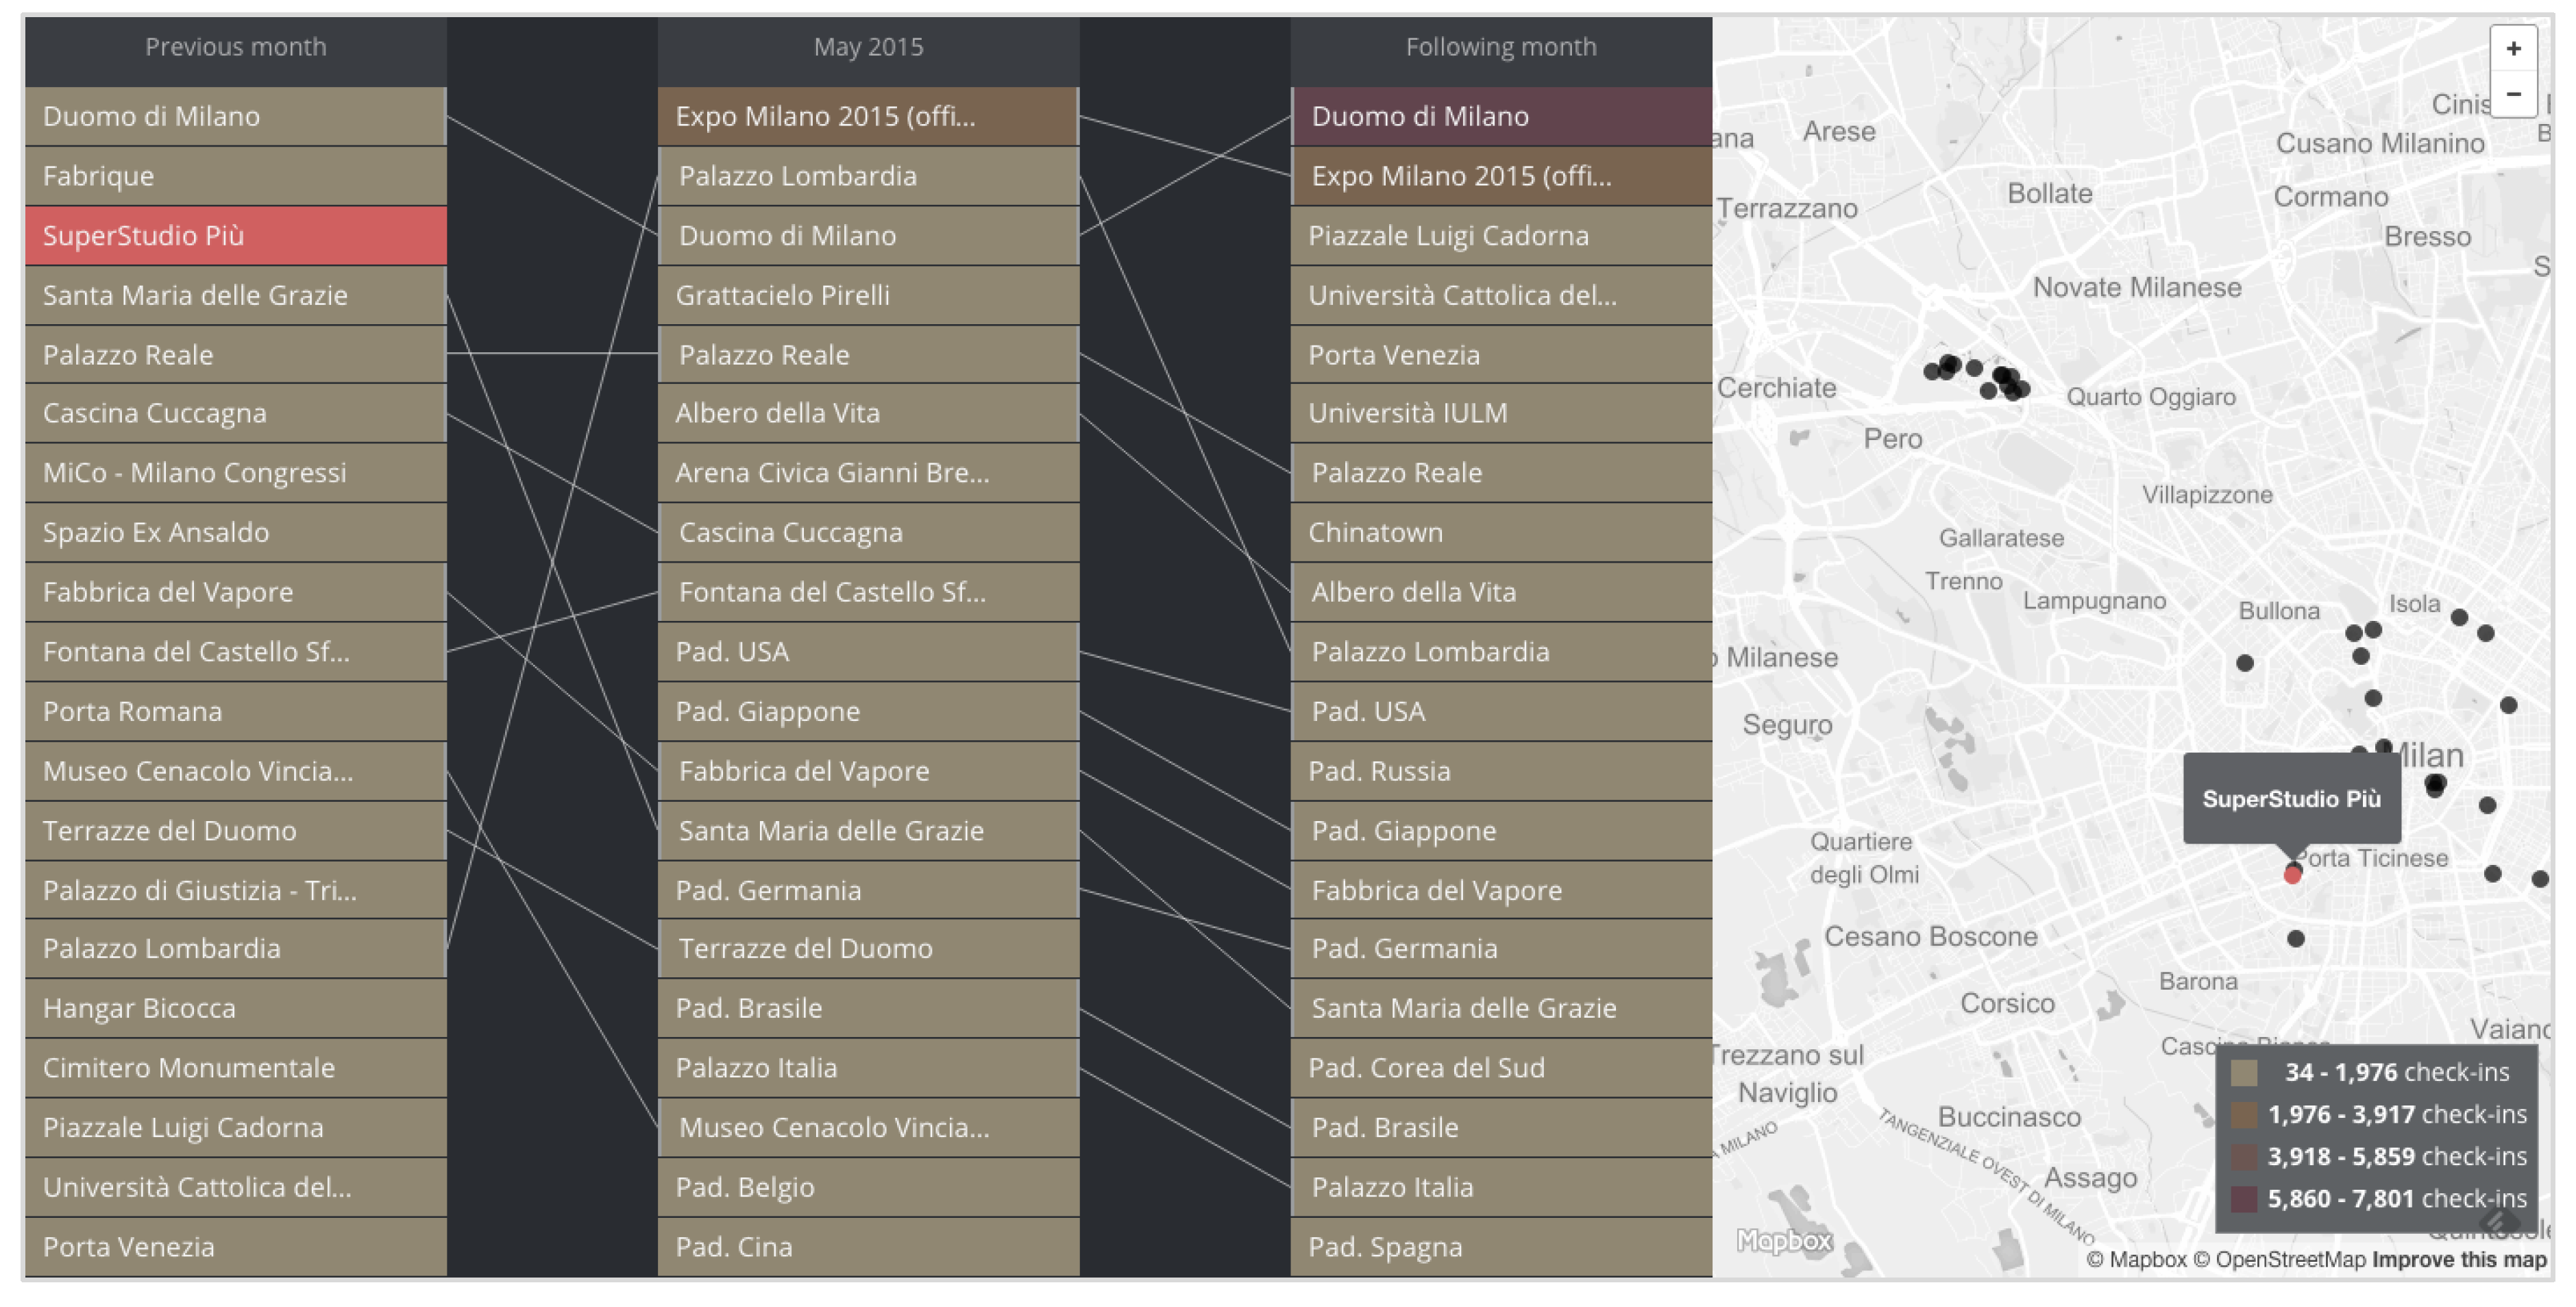
In the decision-maker centric approach, the phases of the cycle overlap. This is clearly visible in the visualization of data. The author’s close and frequent interaction with CityEx meant that it was possible to progressively identify his interests and his preferences about how data was visualized. For example, when analyzing the Foursquare data, discussions with CityEx brought up two different business interests. The first was to rank popular venues in Milan with the aim of observing the trends in attractiveness and visitor numbers for each category identified, these being monuments, hotels and such like (see Figure 3). The geographical framing was retained, on the right-hand side, but the central view was placed in a table format to show how the ranking of venues changes (see, for example, Duomo di Milano in Figure 4).
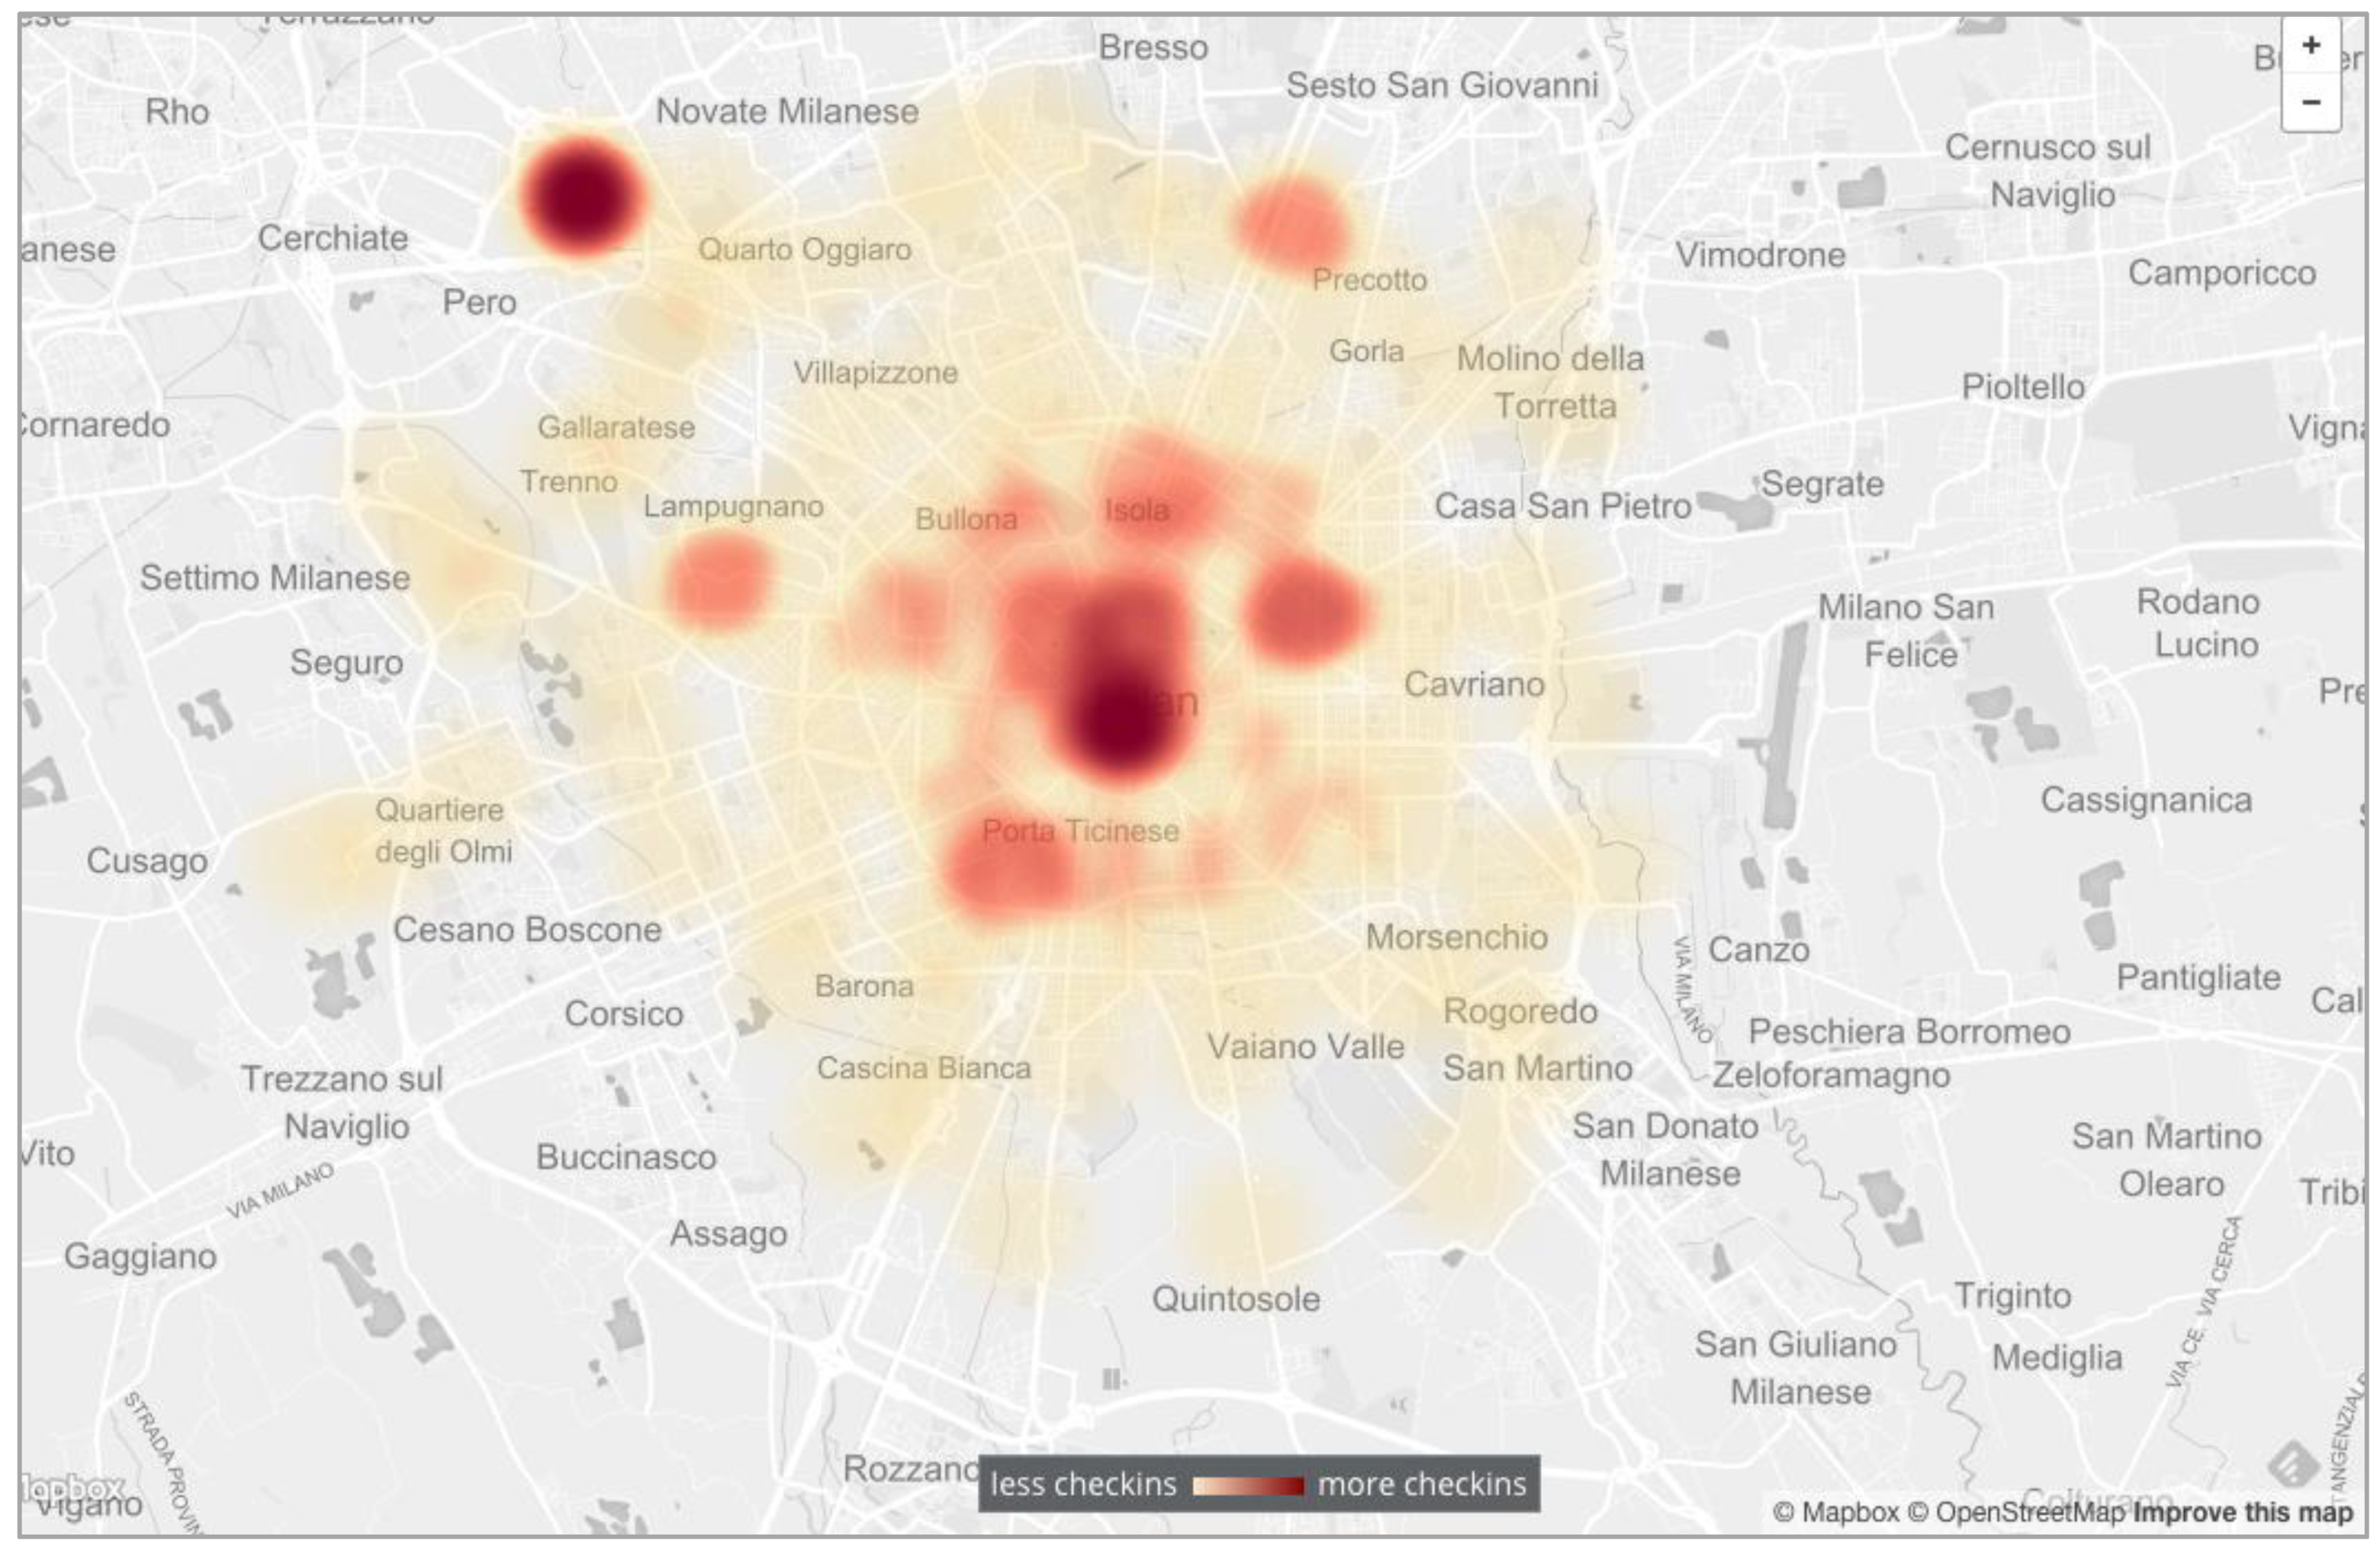
The second point of interest was the “density” and variability of interest around the city. This was constructed through a heat map linked to geographical position, and it highlighted the “hot” venues for different periods. Figure 5 shows a dark-red dot in the top-left-hand corner of the map, which came up in 2015, when Expo 2015 was running. This dot then disappeared almost totally after the Expo closed in November 2015.
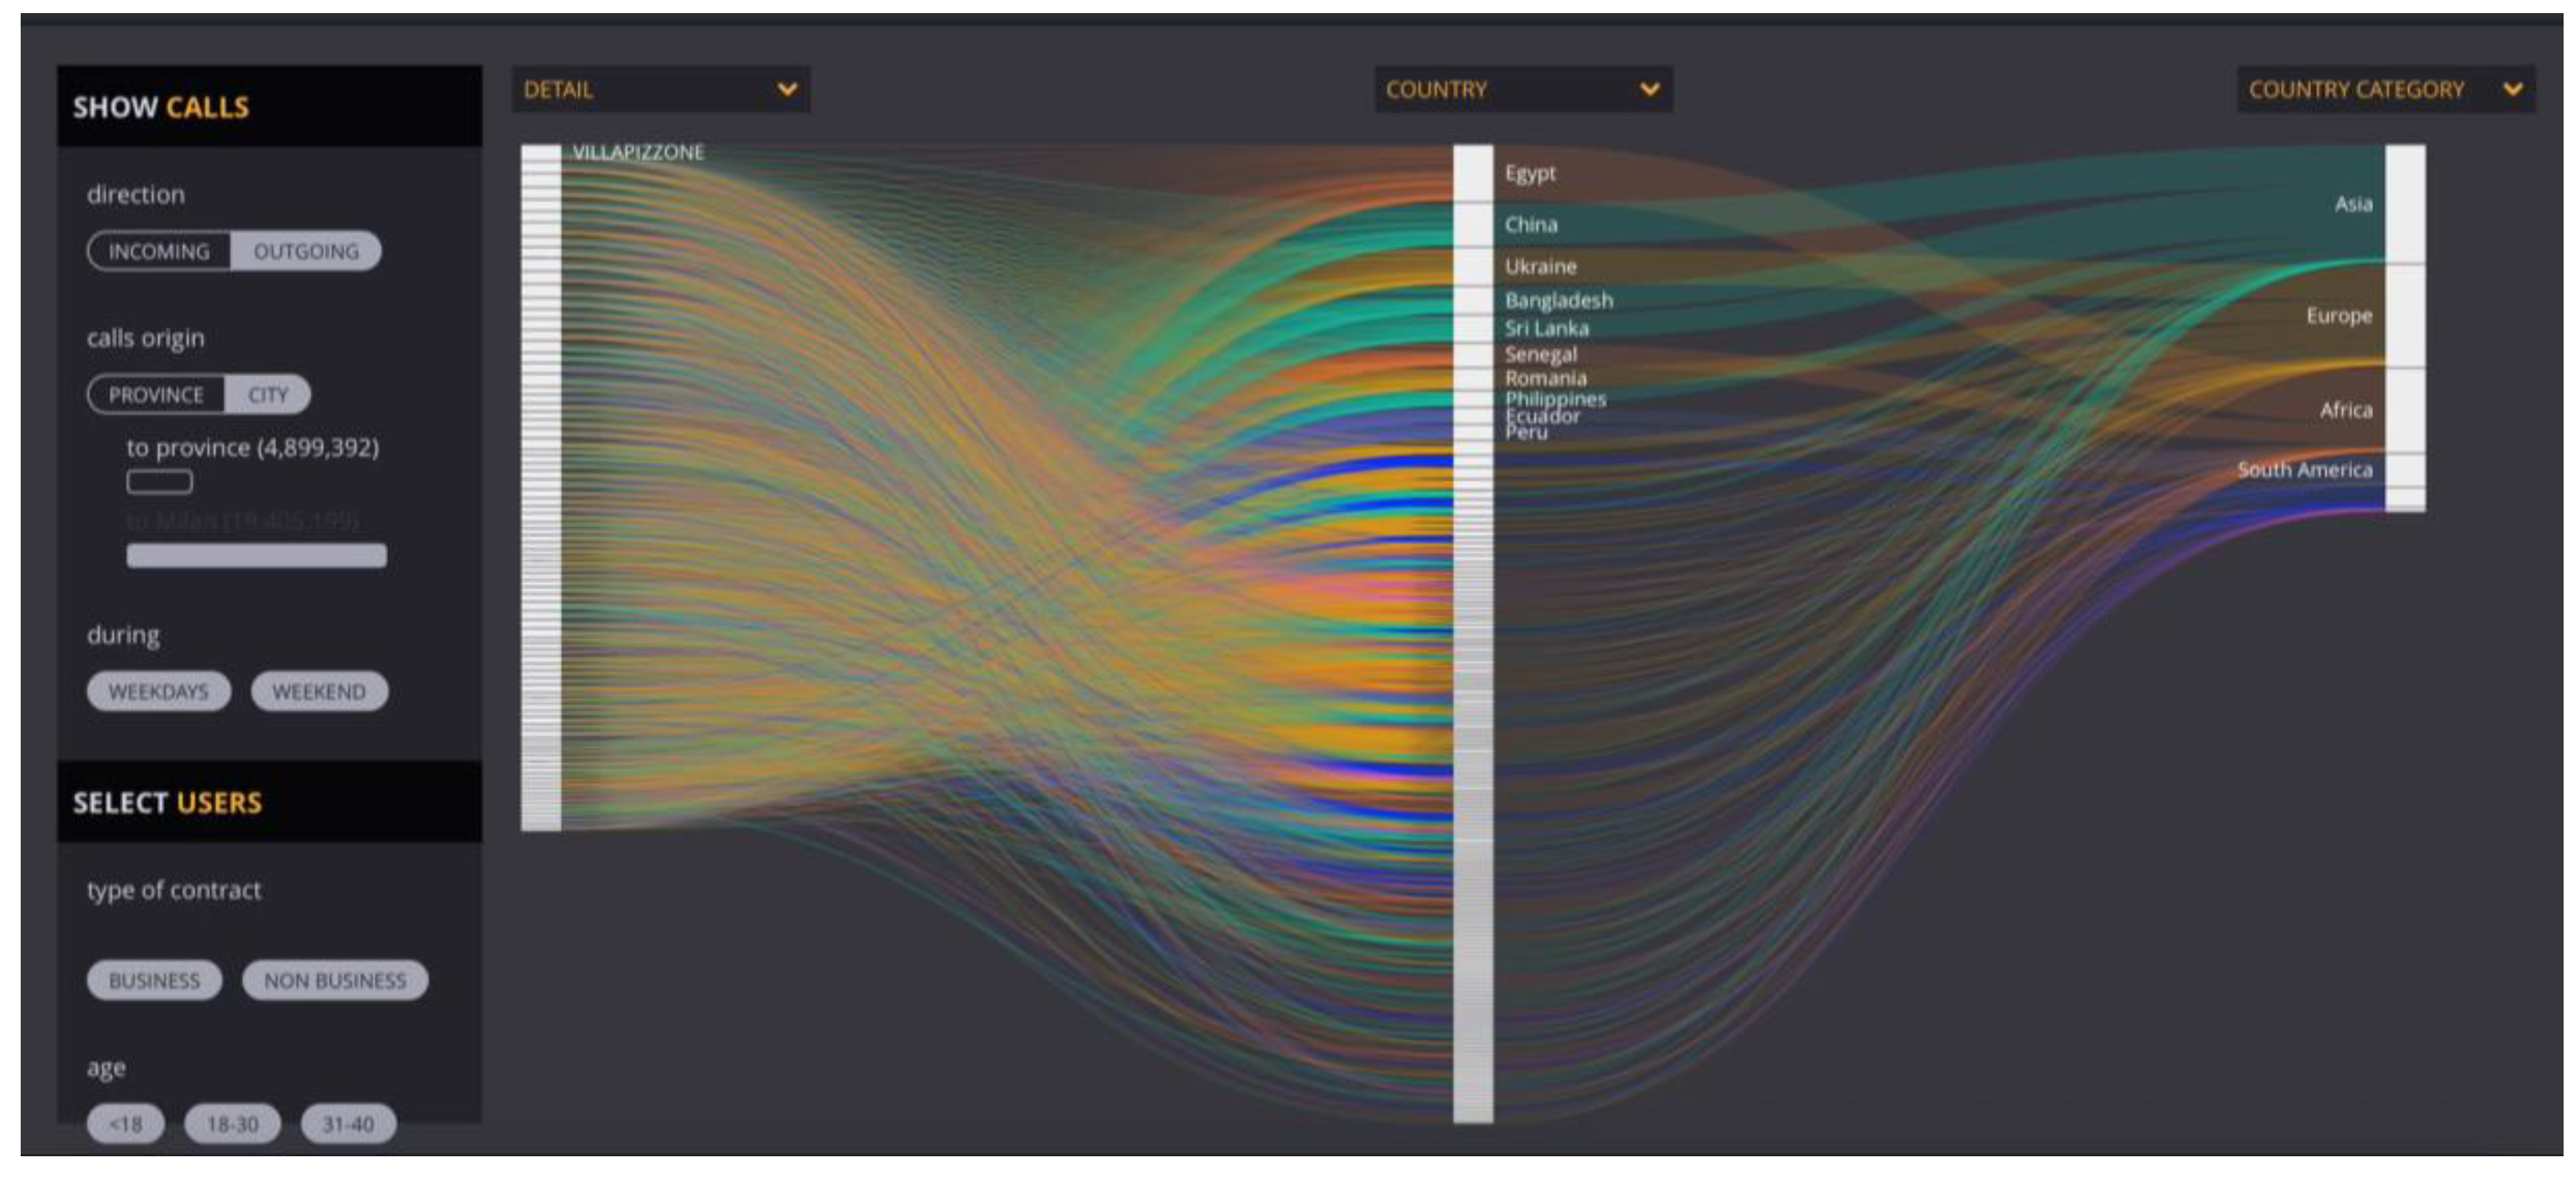
The filtering and framing for these visualizations are mostly rooted in the unit of analysis and the variables previously identified. A single issue was by and large addressed here: the functions that the decision-maker wanted to apply in order to surf through the data. An example of this is the visualization of telephone calls, where CityEx asked for filters on gender, geographical area—for economic aggregation purposes—and individual nationalities (Figure 6). This was considered important for the purpose of monitoring data according to different parameters, without losing the wider picture.
The research group also suggested that they should develop several predictive functions, but the main interest of CityEx lay in the monitoring and communication data.
3.2. The Art Case
Our second case to investigate how decision-makers affect the BD cycle emerged, from a more specific question, in the form of “who are the followers of Art on social media and are there particular patterns in their digital traces?”. Following the same procedure for City, the results for Art are set out according to the same phases, but here the decision was taken to focus selectively on issues where the filtering and framing were more visible.
3.2.1. Data Acquisition
At the beginning, ArtEx wanted to focus on their social media accounts (Twitter, Facebook and Instagram), searching for patterns and relationships with their “physical” network of ticket holders. After the first basic analysis of their social media accounts, ArtEx became aware of the potential and scope of the digital layer, going beyond the boundaries linked to their main geographical target, the north of Italy. The presence of international followers in particular, stimulated ArtEx to search for a numerical benchmark in other comparable international theatres, pointing out a recent trend that initially had been omitted: people can move physically within Europe over a weekend simply to go to the theatre and enjoy an unforgettable experience. With this new international framing, the research group suggested extending the social media analysis from proprietary (Art’s own social media pages) to non-proprietary (accounts other than Art’s own) social media (as before, examining Twitter, Facebook and Instagram). The operations to filter the key words required further framing because of the emergence of two, interconnected, phenomena that were considered of sufficient importance to be analyzed as if they were independent: the theatre’s international reputation and the debate on specific operas. The monitoring of the theatre’s reputation was based on keywords containing the name of the theatre, plus triangulating blogs and social media posts with more traditional sources (official press). The international benchmarking in this area was carried out against five major international theatres. Only one European theatre was selected for the working benchmark. Three operas from the 2016 season were selected for each of the two theatres (Art and the European benchmark). In order to monitor the six operas, the data had to be filtered according to a different methodology, developed following discussions held with ArtEx: many posts did not include the name of the opera or the theatre, but they did contain the names of singers, directors and musicians. Several iterations were needed to come up with the most appropriate boundary for the data. For example, just putting the names of important singers would have mixed the impact of the opera with the singer’s reputation. Both paths were possible and meaningful at the business level, but the way they were interpreted changed. ArtEx decided, in the end, that it was always best to have a good relationship between the data and the phenomena they wanted to trace (operas), and so an association between the artists and the opera performed at Art had always to be retained.
In a final step, the data acquired was completed and integrated through the joint analysis of the network, a point that Art reached indirectly through the mentions of its social media followers. This analysis was only carried out on Twitter. More specifically, the network was built by assigning a “node” position to each social media user, as well as to other users cited in a post, while the message sent represents the interaction (i.e., the connection between two nodes). Taking the following tweet as an example: “@NewYorkTimes: outstanding Vivaldi performance @teatroArt yesterday”, written by “JohnDoe”, this gives rise to three nodes (@JohnDoe, @NewYorkTimes and @teatroArt) and two interactions, the one between @JohnDoe and @NewYorkTimes and the other one between @JohnDoe and @teatroArt. Following this approach for all the posts, the outcome was a weighted network where the nodes were represented by the users’ posts or their mentions in other posts, and the interactions are given by the messages exchanged between users. The network structure was tested over a limited period (March–May 2016), with 3080 social media users and 13,318 interactions being counted over that period.
3.2.2. Data Clustering, Annotation and Merging
The data were collected within the revised decision-making boundaries for monitoring and managing the international (digital) network. The network was taken as the reference unit of analysis, but a number of different networks were constructed to satisfy the various business needs, that is, proprietary social media networks, the networks based on key words and the “Twitter potential network” based on mentions.
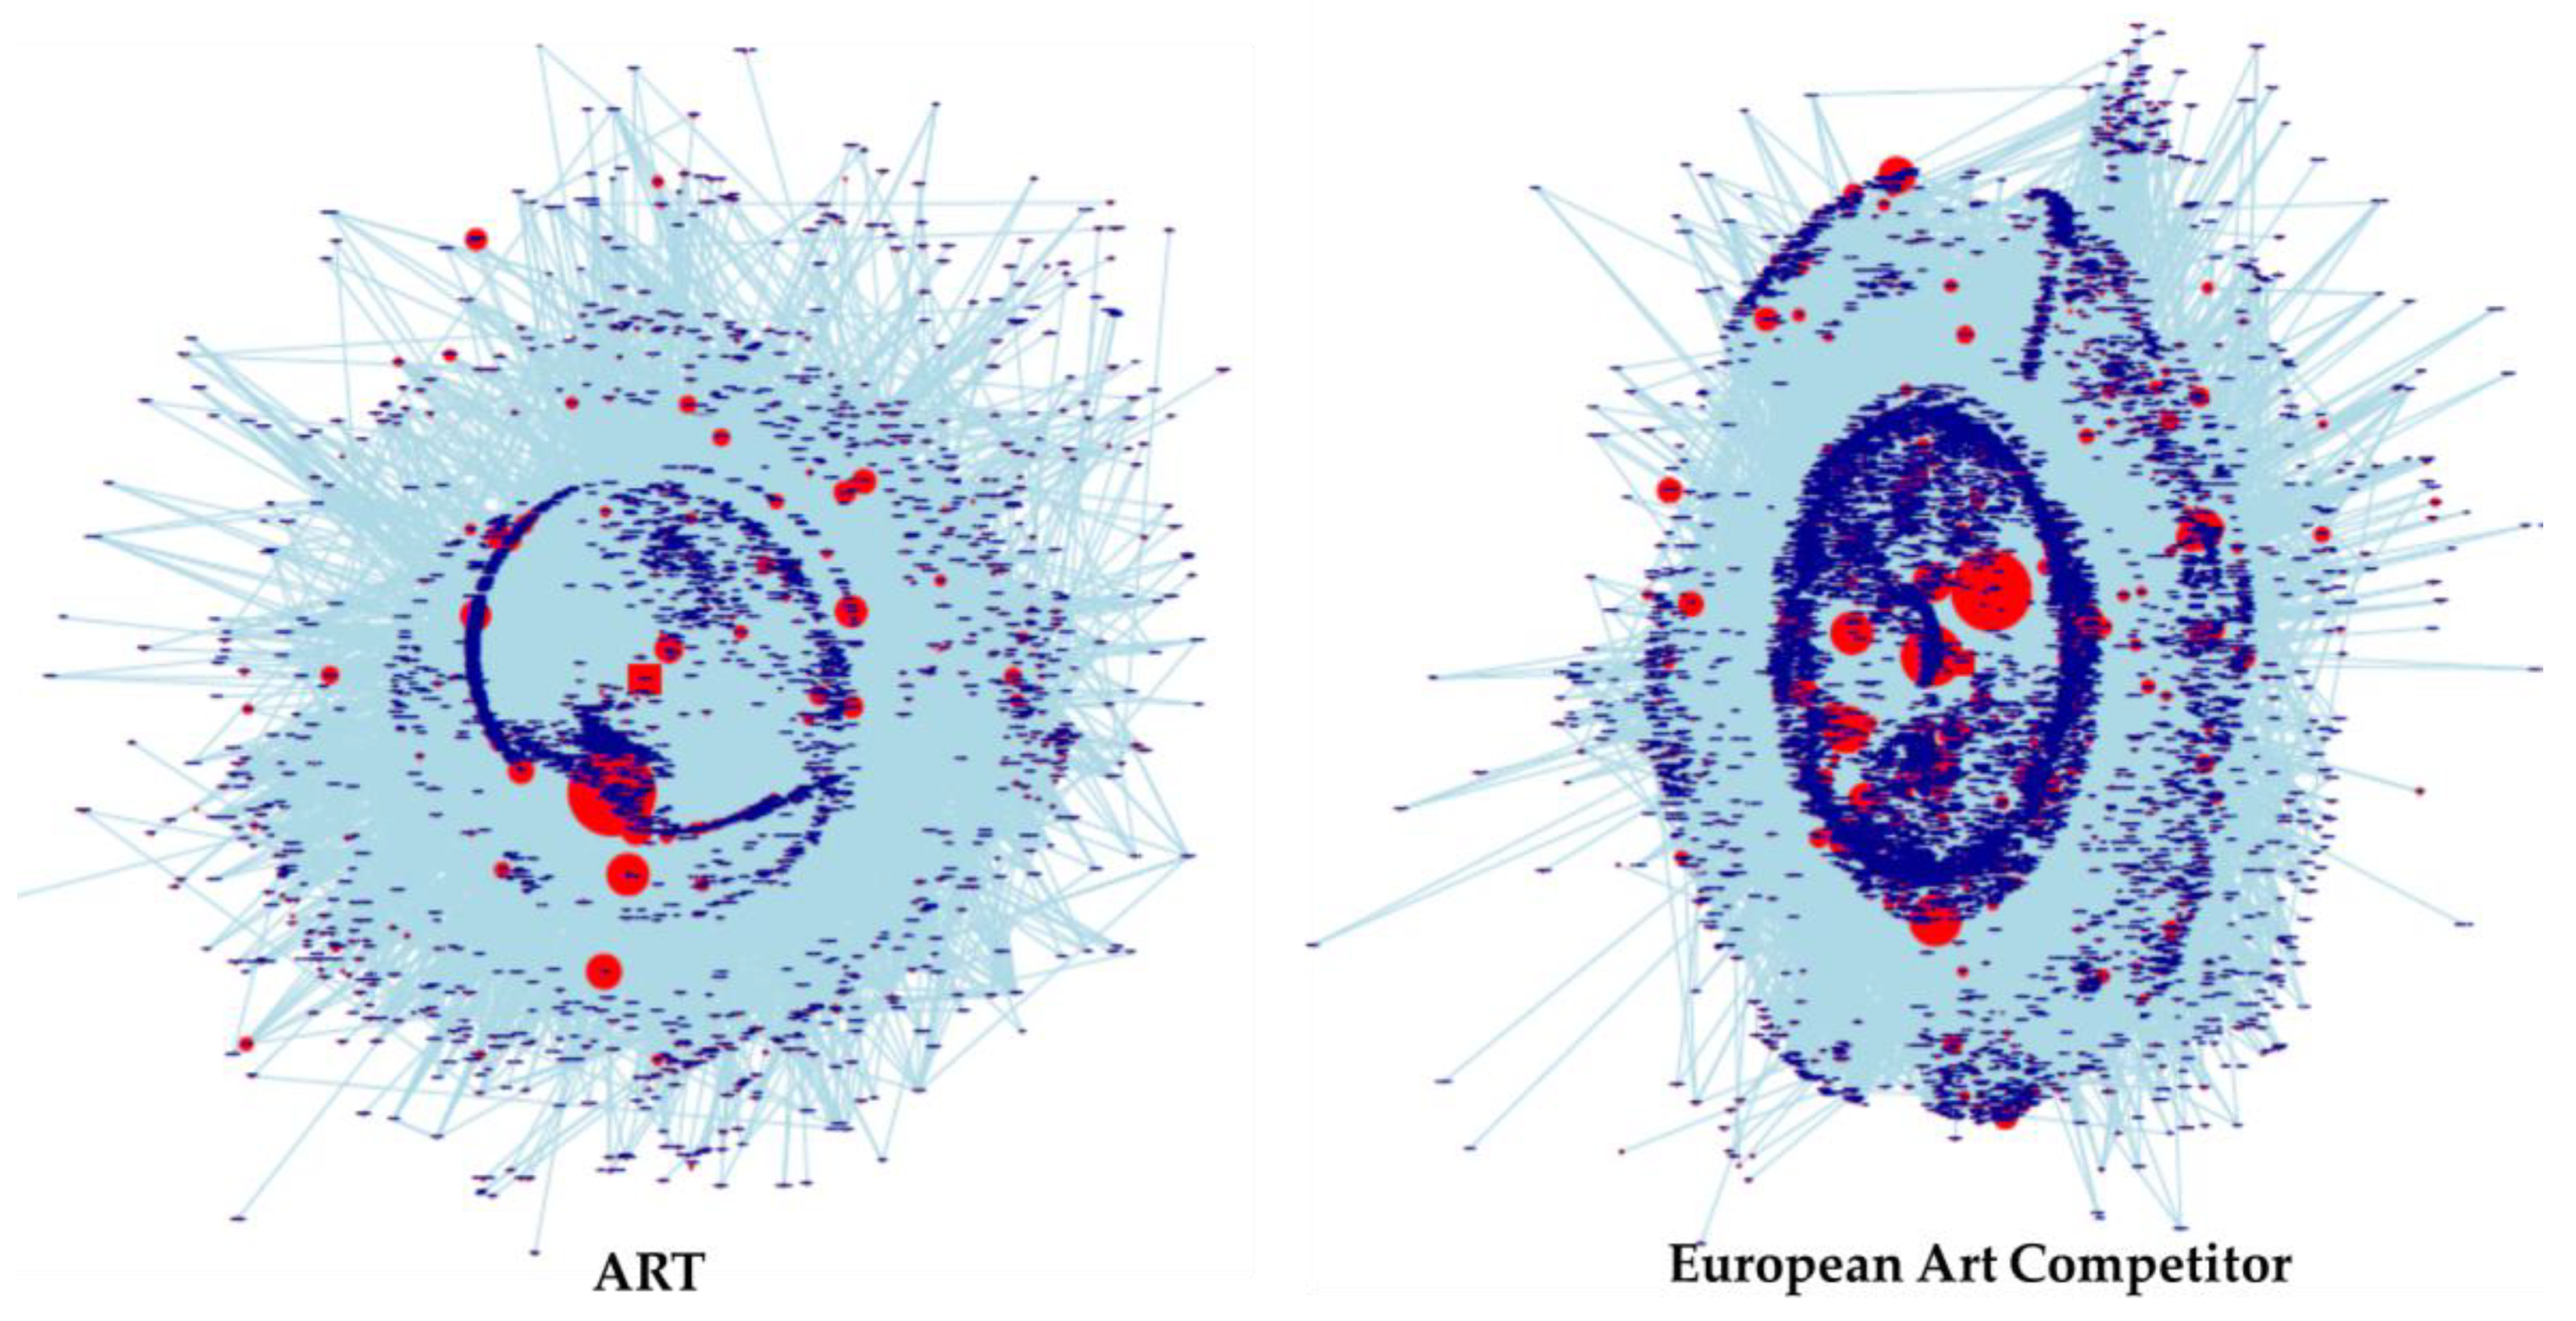
Exemplary of the interaction is the annotation of the Twitter potential network, with one European theatre chosen as the benchmark. Starting from the business need of monitoring the network and examining how information was spread, types of nodes were initially identified by the scientists, based on a social network technique called the K-core decomposition algorithm [27]. This technique was proposed as it is widely adopted to investigate the diffusion of given phenomena [28]. The idea was welcomed by ArtEx, as the research group framed this choice as offering the potential of investigating the dissemination of information emanating from Art. The assumption behind the method is that network nodes positioned in core layers can spread messages more extensively than nodes located in peripheral layers. Hence, the nodes positioned close to the centre (where the focal organization is positioned) influence the network and can easily spread messages throughout the grid. Operationally, the K-shell decomposition algorithm iteratively assigns a K-shell layer value to each node in the network: “nodes are assigned a k shell according to their remaining degree, which is obtained by successive pruning on nodes with degree smaller than the Ks value of the current layer. After removing all the nodes with K = 1, some nodes may be left with one link, so the system is continuously pruned iteratively until there is no node left with K = 1 in the network” [29]. The technique was performed iteratively for Art until K = 3, where saturation was reached. This analysis was presented to ArtEx, showing a graphical representation of Art’s network and selected competitors (see Figure 7). Despite being fascinated by the outcome, ArtEx had difficulty in understanding how this information could be used in his business operations.
During the discussions, he started to ask questions about the methods and data, in order to reframe the data into schemes that he had mastered and used. The network always remained in the background, but “old” units of analysis emerged, linked to a higher-order characterization of the single nodes: influencers, active and passive users, and foreign users. These units of analysis relating to nodes were deemed to have a greater basis for being acted upon than the network overall, although the relationships were considered valuable. The final decision was to retain the network, but in addition, to carry out several analyses to build indicators (i.e., the specific metric of a phenomenon) that could be more easily understood by decision-makers. The next section illustrates this point.
3.2.3. Modelling and Analysis
The phase of analysis was simple in statistical terms, but complex in terms of filtering and framing. The research group had the task of filtering and simplifying the information about the network, without losing the benefits of the network itself. The solution proposed was to build network indicators that were to be inserted in Art’s daily and monthly reports, enriching the toolkit of their key performance indicators (KPI). All the indicators defined were discussed with ArtEx to find the best business fit, in the form of an indicator that could highlight lags or lead actions. Higher interactions emerged when identifying indicators for the potential Twitter network. In the end, five indicators were defined by merging previous studies on the networks and ArtEx’s needs: followers, active relationships, hubness, authority and centrality. The first three indicators are quite simple, but can be applied to all the networks monitored (proprietary, keyword, potential) and actionable. An active relationship identifies pairs of users that maintain an active relationship over time in terms of posting. Hubness analyzes users on the basis of the total number of messages sent. ArtEx considered this simple metric to be crucial for monitoring the vitality of each single network (proprietary, keyword, potential), their evolution in time and against other theatres. Operationally, it is computed as the eigenvector of a transformation AAT (The adjacent matrix of the network is generically called A and it is a NxN matrix where N are the number of nodes of the network. Each entry of the matrix A(i,J) accounts for the number of links between the node i and the node j. AT is the transposed matrix of A; AAT is equal to A multiplied by AT.) of the adjacent matrix of the network A. The values obtained ranged from zero to one (i.e., the lowest and highest level of hubness, respectively). Authority measures users on the basis of the number of messages they receive from within the network. Users with a high level of authority have numerous connections inside the Art network. This indicator is computed as the eigenvector of the transformation ATA (ATA is the transposed matrix of A (AT) multiplied by the matrix A.) of the adjacent matrix A associated to the network. Similarly, to hubness, authority ranged from zero to one. A high level of authority corresponded to values close to one, which detected what has been called “authority” in this context. Finally, the research group proposed the centrality indicators to translate the K-shell network in ArtEx’s mental frame. More specifically, a first indicator was the distribution of types of users with reference to the layers (K = 1, 2 and 3); the central layer was labelled as “in-core”, rather than K = 1, as this was easier to understand; for each layer user, the number of followers and their vitality (in and out) was then presented. As the project unfolded, a successful framing process emerged when presenting the indicators to ArtEx, which were benchmarked over time and with other theatres. Comparisons between all the indicators implied filtering the data further, but the information being presented became more immediate and meaningful for ArtEx. For example, ArtEx was surprised to see that the “in-core” network of Art’s main competitor was larger (133 users against 15 for Art), although the users had similar characteristics.
3.2.4. Visualization
As in the City case, the visualization of Art data started very early on in the project, because of the high interaction between researchers and experts. However, ArtEx followed a different approach to CityEx in how the visualization structure was defined and the data reported. ArtEx was less intrigued by new ways of visualizing data, and preferred simple reports, as mentioned in the previous section. He strongly wanted to carry out particular actions on social media and also work on its current sponsors. In order to pursue this strategy, he needed plain numbers to convince people within and outside Art. For example, on analyzing the “in-core” network, it was clear that Art’s main competitor was better able to exploit their relationships with institution sponsors: ArtEx wanted to propose agreements to Art’s sponsors, but this required internal consensus. Another example that emerged during the process of mentoring data was that some types of communication based on backstage videos of the artists were particularly successful across the network. To push this strategy further, the CEO needed a budget and legal support. Again, they favoured short reports with few indicators over complex representations.
Regarding digital interaction and functions, while ArtEx was willing to consider real time monitoring and interaction through the web, another key issue emerged, with it becoming clear that there was the need to integrate the new methods of gathering and analyzing data into Art’s existing systems. Art had already put in place three different systems to control the marketing area: an internal control system, a ticketing monitoring tool and a social media–web monitoring application. He asked the research group to use these three systems, as they were considered satisfactory despite not being integrated. This request implied limiting the research group’s aspirations regarding visual creativity and, instead, study the current reporting structure. As it turned out, exploring the traditional reporting proceeding proved beneficial, as it allowed the author to reframe some information in terms of time. For example, information on operas and artists initially included in the monthly reports was actually important enough to be included in the daily monitoring proceeding, as is currently the case for the traditional press. At this stage, ArtEx involved other organizational actors in order to come up with the most suitable reporting portfolio, and this was brought into the organizational infrastructure.
4. Discussion
As explained initially, this paper is concerned with examining how decision-makers play an important role in establishing what information is to be extrapolated from large quantities of BD and how it is to be used, and to analyze the way in which the BD cycle is affected. The previous section, dealt with how the decision-maker centric approach was applied. The study started from the hypothesis that there are two processes, framing and filtering. These are carried out by scientists translating data into knowledge. However, these processes are also traditionally carried out by decision-makers using information to take action, and they are at the basis of their understanding, trust in data and, more importantly, awareness about their use, which is an essential step for creating Value [30]. The cases presented here are experimental and test an interactive approach involving decision-makers, where the filtering and framing procedures were made transparent, and the final aim was to highlight the key elements in the decision-maker-centric approach.
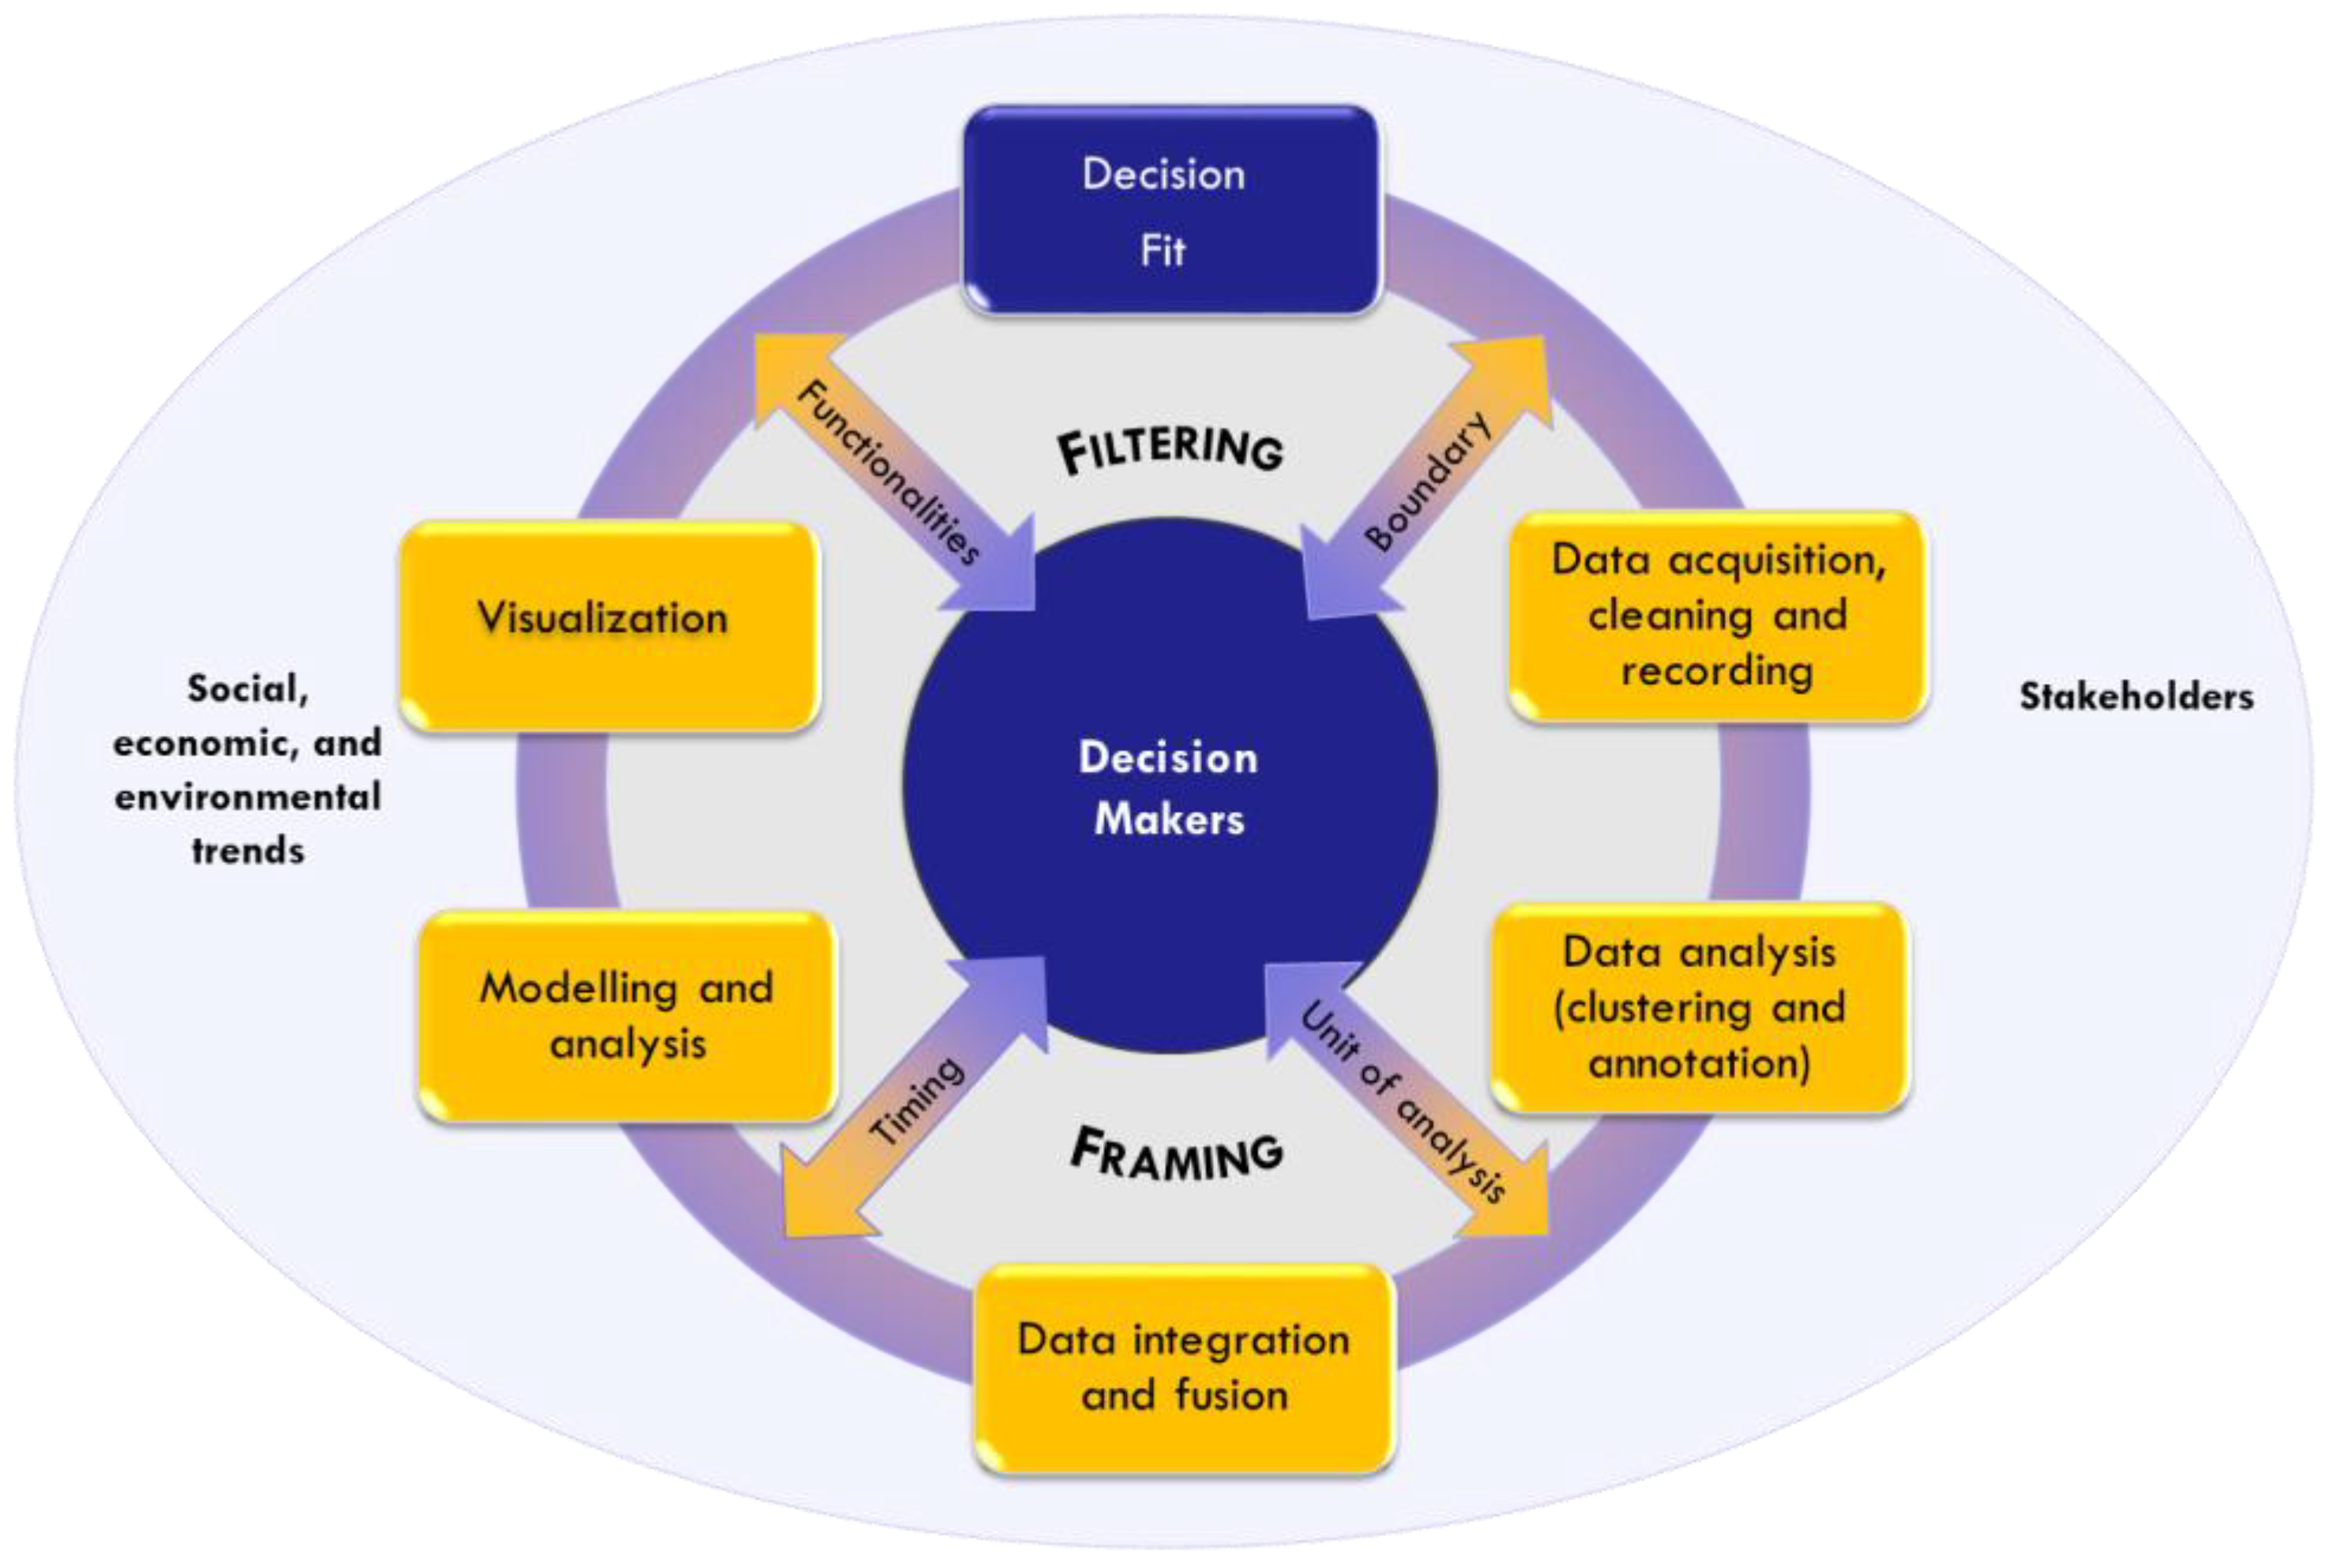
This application lead to the revision of the initial scheme. More specifically: (1) four spokes were introduced to the graphic scheme, as they were seen as pivotal to the filtering and framing proceedings, and, as a consequence, also to the interaction between decision-makers and scientists; these spokes were the boundary, unit of analysis, timing, and functionalities; (2) a new phase was inserted, described as the “Decision Fit” (Figure 8).
The first element is the boundary, indicating the abstract outer limit of information and decisional space. When approaching BD, despite the scope of their questions being different, both managers set no limits to the type of data to be collected to analyze their initial questions, which, to remind ourselves, were: “in what way is Milan international?”, for CityEx; and “who are the followers of Art on social media and are there particular patterns in their digital traces?”, for ArtEx. Since the data acquisition phase, the interactive approach led to reshaping the decision-makers’ boundaries through filtering and framing. The link between filtering and boundary was more visible in City, within the key word search on social media. The data acquisition process gave rise to a two-fold perspective: global, looking at “Milan” and its reputation; and local, collecting data geo-referenced within the city itself. This first set of information, interesting though it was for its insights into Milan’s reputation, was considered beyond the scope of CityEx’s action boundary and so abandoned. The interaction led the author to focus instead on detailed information at district level, which had initially been overlooked.
The case of Art is interesting, as it shows how a boundary is shaped by framing. Due to the basic need of having a numerical benchmark for data on social media followers, ArtEx and the research group started by positioning the theatre among its international competition. This framing process affected the way in which data was acquired as well as the filtering process, and it also changed the type of the search being carried out, from a proprietary network to a “key word” search on social media.
The boundary is also reflected in the ethical sphere. Public data collected from APIs are subject to rules that are interpreted differently by researchers and scientists, often propounding a tradeoff between the completeness of data and ethical behaviour [31]. The problem was highlighted by CityEx and there was the general consensus about respecting rules and privacy, even if this meant reducing the volume and granularity of the data collected. This is an issue often overlooked in practice and in academic studies, but one that needs serious consideration in the decision-maker-centric approach.
The second element is the unit of analysis for decisions (and action). With traditional data, decision-makers use reference schemes where the unit of analysis is the organization or its nested sub-units (processes, organizational units, people). With BD, the starting point is a given problem and the unit of analysis is often undefined and different from common references. Filtering and framing were seen to be powerful processes where both sides (scientists and decision-makers) needed to clarify what the unit to be “controlled” actually was. This issue emerged more clearly during the process of clustering data, when trying to build the relevant categories to be operated on and managed. In the case of City, the focus on the local dimension of internationalization led to filtering the districts within the city of Milan, which became the main unit of analysis. Data then needed to be re-framed in relation to this main unit, through guided clustering. At the practical level, data were easily anchored to districts, but social media data, in particular, needed to be structured into sub-units of analysis that were meaningful in terms of analyzing one district on its own and making comparisons with other districts. In the case of Art, the main unit of analysis was the international network, which was compared over time and against other theatres of reference. After this filtering process, in this case, other variables also had to be re-framed and related to the network. Content clustering and analysis became relevant to trace the content and/or actors that activate the network; the network users were clustered in order to monitor and reshape the communication strategy, revealing “hubs” and “authorities”. In both cases, the interaction on the unit of analysis uncovered a hybrid approach where qualitative choices (driven by decision-makers) are mixed with quantitative–statistical indications in the common objective of fitting data to the decision needs.
The third element is timing, indicating the appropriate temporal resolution of data in relation to the decision-makers’ needs. The decision-maker centric approach implies understanding not only which data are more suited to the process, but also when and how frequently they are needed. A first choice that entered the interactive approach was the reference period of the algorithm. Starting from the decision-makers’ initial desire to have data in real time, the analysts proposed techniques to frame the various frequencies of the data (ranging from yearly to real time). In practice, different algorithms were proposed to divide greater periods into sub-intervals, based on historical paths and trends. From discussions with the decision-makers, it became clear that this division of original data was considered to be “fake”, even when refined division methods were proposed. The failure of this statistical approach of dividing time into periods meant that data was aggregated into longer periods, and one point that emerged was that the high frequency of some data was just an over-ambitious yearning thrown up by the potential of actual real time data. The two cases show how this approach can present a wide range of possibilities. Some data about events were retained with real time frequency: leading venues from Foursquare, for CityEx; and audience monitoring for operas, for ArtEx. Other data were aggregated on a quarterly base: language diversity among districts based on Twitter, for CityEx; and monthly reports on reputation, for ArtEx, where various sets of data are evaluated against the chosen benchmark theatre.
The final element of interaction consists of the functionalities needed by the decision-makers. This last element, although present throughout the BD cycle, finds its full expression in the visualization choices. In the case of CityEx, external communications were considered as crucial to promote awareness of the city’s dynamics, leading to an intriguing and innovative interface being developed. Careful attention was placed on the type of interaction that users could come up with at every layer, in full coherence with the decisions taken on the first three spokes. In the case of Art, interactions regarding functionalities brought up another important factor of the need to integrate new reporting procedures within the existing system and, crucially, with the mindset and time-frame that the managers were used to working with.
The second proposed revision of the new BD cycle is to bring in the new phase of decision fit, where scientists and decision-makers assess the benefit and costs of BD in the context of use. This assessment emerged naturally as a need when the data started to be used. Decision fit is carried out on a mix of technical and business parameters such as completeness, precision and cost. Completeness is the value added when capturing the critical success factors within the boundaries of the decision. In both the cases, the data added new knowledge to traditional data. For example, the variety of language among the districts, for CityEx; and the drivers of international expansion, for ArtEx. Precision is instead determined by the relevance and correlation of specific data for the decision-makers’ goals. For instance, the cross-over effect of City’s events on various sectors (hotels, entertainment, etc.); and monitoring and using “hubs” and “authorities” as promotional vehicles in Art’s network. Lastly, the term cost refers to the cost needed to process data on a routine basis.
During the concluding phase of the test, the work on the two cases confirmed the benefits of the approach, but it is also important to highlight the limitations of this study. A first such limitation is linked to the decision-making sphere. In both cases, the experiment was carried out in arenas where the decision-maker had the power to use the data with only marginal involvement of other actors. In complex decisions, it is often the case that many actors are closely involved and rational choices are mixed up by political inputs, even down to the choice of the data to be used. These contexts are typically public–private domains, such as transport and health care, where BD can heighten awareness of the impact that various policies can have. The new cycle should be tested from a shared viewpoint to observe both the interaction between scientists and decision-makers and, especially, between the decision-makers themselves.
A second limitation is linked to the actual type of decision-makers included in the tests. The two experts were chosen on purpose for their mid-way outlook towards BD: they were open to BD but remained wary. Referring to the two opposing attitudes towards BD, blind faith and reluctance, they were in a half-way house situation and ready to challenge themselves and the team. Further studies are needed to test the approach derived at when decision-makers lean more towards one side of the argument or the other, but it also opens a new question: “what manner of training do decision-makers and scientists need?”. In order to interact along the spokes of the scheme, at least initially, both parties must be able to share their language and toolkit to a certain degree.
5. Conclusions
This paper has addressed an issue that had only been studied marginally in BD research: the need and manner to involve decision-makers in the data processing to avoid any misalignment between information provided by data scientists and the decision-makers’ needs. This is particularly relevant in the field of social science, where BD are seen as a panacea to provide Value when addressing business and social challenges. To tackle this problem, a new BD cycle centred around the decision-maker has been proposed and applied using action research methodology in two cases.
The findings enhance previous studies in BD for social sciences at two levels. The first results show that the interaction between scientists and decision-makers when preparing BD is a reciprocal process of knowledge, which, in turn, meant that it was possible to avoid two opposing and risky behaviours: blind faith, where decision-makers overestimate the benefits of BD; and reluctance, where decision-makers treat all data they do not fully understand with suspicion. In pursuing the path of further knowledge, two operations embedded in the information processing system must be made transparent: filtering and framing. Second, the study provides evidence of the value of a quali-quantitative approach to BD for social science; the final cycle provided the dimensions of interaction, in the form of boundary, unit of analysis, timing and functionalities, which confer rigor to the whole process. These dimensions are the grey area between scientists and decision-makers. When explicitly addressed during the information preparation stage, they enable the transfer of skills necessary to make technical choices and in the business context. While the study was conducted with the involvement of only two experts, which could be seen as a major limitation, in both cases, the experts were highly engaged and positive about BD and they had sufficient backing from their organization to carry out the study and interact with the team.
To conclude, this study places the missing variable of decision-making at the centre of the process, reinforcing previous studies on information processing in the BD age and opening the way for future research in social sciences. A first area of development is to apply the cycle to more complex contexts where the decision-making power is distributed among many actors who could be reluctant to work with BD. Further areas for future research include monitoring decision-makers over a longer period of time, examining how information that originated from BD is used and, lastly, studying the impact of BD, and the knowledge that it brings about, on organizations and societal challenges.
Funding
This research received no external funding.
Acknowledgments
The author acknowledges the contribution of the two experts who took part in the study, agreeing to open collaboration, sharing their ideas and granting access to their organizations. Furthermore, the author acknowledges the contribution of the data scientists of the Urbanscope Lab involved in testing the cycle; they played a fundamental role in carrying out the various phases and were always ready to hold a critical discussion about the outcomes, in terms of learning and evaluation, provided by the author. Finally, a special acknowledgement is due to Piercersare Secchi, who encouraged me to consolidate and disseminate my work on this cycle.
Conflicts of Interest
The author declares no conflict of interest.
References
- Gartner IT Glossary. Available online: http://www.gartner.com/it-glossary/big-data/ (accessed on 10 September 2018).
- Wamba, S.F.; Akter, S.; Edwards, A.; Chopin, G.; Gnanzou, D. How ‘big data’ can make big impact: Findings from a systematic review and a longitudinal case study. Int. J. Prod. Econ. 2015, 165, 234–246. [Google Scholar] [CrossRef]
- Sivarajah, U.; Kamal, M.M.; Irani, Z.; Weerakkody, V. Critical analysis of Big Data challenges and analytical methods. J. Bus. Res. 2017, 70, 263–286. [Google Scholar] [CrossRef]
- Arnaboldi, M.; Busco, C.; Cuganesan, S. Accounting, accountability, social media and big data: Revolution or hype. Account. Audit. Account. J. 2017, 30, 762–776. [Google Scholar] [CrossRef]
- Mikalef, P.; Pappas, I.O.; Krogstie, J.; Giannakos, M. Big data analytics capabilities: A systematic literature review and research agenda. Inf. Syst. E-Bus. Manag. 2017, 16, 1–32. [Google Scholar] [CrossRef]
- Visvizi, A.; Mazzucelli, C.; Lytras, M. Irregular migratory flows: Towards an ICTs’ enabled integrated framework for resilient urban systems. J. Sci. Technol. Policy Manag. 2017, 8, 227–242. [Google Scholar] [CrossRef]
- Agostino, D.; Sidorova, Y. How social media reshapes action on distant customers: Some empirical evidence. Account. Audit. Account. J. 2017, 4, 777–794. [Google Scholar] [CrossRef]
- De Pablos, P.O.; Lytras, M. Knowledge management, innovation and big data: Implications for sustainability, policy making and competitiveness. Sustainability 2018, 10, 2073. [Google Scholar] [CrossRef]
- Fu, H.; Li, Z.; Liu, Z.; Wang, Z. Research on big data digging of hot topics about recycled water Use on micro-blog based on particle swarm optimization. Sustainability 2018, 10, 2488. [Google Scholar] [CrossRef]
- Kim, K.; Lee, S. How can big data complement expert analysis? A value chain case study. Sustainability 2018, 10, 709. [Google Scholar] [CrossRef]
- Gitelman, L. (Ed.) Raw Data Is an Oxymoron; MIT Press: Cambridge, MA, USA, 2013. [Google Scholar]
- Hinton, C.M.; Kaye, G.R. The hidden investments in information technology: The role of organisational context and system dependency. Int. J. Inf. Manag. 1996, 16, 413–427. [Google Scholar] [CrossRef]
- Bhimani, A.; Willcocks, L. Digitisation, ‘Big Data’ and the transformation of accounting information. Account. Bus. Res. 2014, 44, 469–490. [Google Scholar] [CrossRef]
- Quattrone, P. Management accounting goes digital: Will the move make it wiser? Manag. Account. Res. 2016, 31, 118–122. [Google Scholar] [CrossRef] [Green Version]
- Yang, M.; Kiang, M.; Shang, W. Filtering big data from social media–Building an early warning system for adverse drug reactions. J. Biomed. Inform. 2015, 54, 230–240. [Google Scholar] [CrossRef] [PubMed]
- McCormick, T.H.; Lee, H.; Cesare, N.; Shojaie, A.; Spiro, E.S. Using Twitter for demographic and social science research: Tools for data collection and processing. Sociol. Methods Res. 2017, 46, 390–421. [Google Scholar] [CrossRef] [PubMed]
- Zhang, Y.; Lu, H.; Luo, S.; Sun, Z.; Qu, W. Human-Scale sustainability assessment of urban intersections based upon multi-source big data. Sustainability 2017, 97, 1148. [Google Scholar] [CrossRef]
- Chui, K.T.; Alhalabi, W.; Pang, S.S.H.; Pablos, P.O.D.; Liu, R.W.; Zhao, M. Disease diagnosis in smart healthcare: Innovation, technologies and applications. Sustainability 2017, 9, 2309. [Google Scholar] [CrossRef]
- Dalla Valle, L.; Kenett, R. Social media big data integration: A new approach based on calibration. Expert Syst. Appl. 2017, 111, 76–90. [Google Scholar] [CrossRef]
- Frankel, F.; Reid, R. Big data: Distilling meaning from data. Nature 2008, 455, 30. [Google Scholar] [CrossRef]
- Killen, C.P. Managing portfolio interdependencies: The effects of visual data representations on project portfolio decision making. Int. J. Manag. Proj. Bus. 2017, 10, 856–879. [Google Scholar] [CrossRef]
- Didimo, W.; Giamminonni, L.; Liotta, G.; Montecchiani, F.; Pagliuca, D. A visual analytics system to support tax evasion discovery. Decis. Support. Syst. 2018, 110, 71–83. [Google Scholar] [CrossRef]
- Gandomi, A.; Haider, M. Beyond the hype: Big data concepts, methods, and analytics. Int. J. Inf. Manag. 2015, 35, 137–144. [Google Scholar] [CrossRef]
- Argyris, C.; Putnam, R.; Smith, D. Action Science: Concepts, Methods and Skills for Research and Intervention; Jossey-Bass: San Francisco, CA, USA, 1985. [Google Scholar]
- Baskerville, R.; Pries-Heje, J. Grounded action research: A method for understanding IT in practice. Account. Manag. Inf. Technol. 1999, 9, 1–23. [Google Scholar] [CrossRef]
- Cassell, C.; Johnson, P. Action research: Explaining the diversity. Hum. Relat. 2016, 59, 783–814. [Google Scholar] [CrossRef]
- Seidman, S.B. Network structure and minimum degree. Soc. Netw. 1983, 5, 269–287. [Google Scholar] [CrossRef]
- Pastor-Satorras, R.; Vespignani, A. Epidemic spreading in scale-free networks. Phys. Rev. lett. 2001, 86, 3200. [Google Scholar] [CrossRef] [PubMed]
- Kitsak, M.; Riccaboni, M.; Havlin, S.; Pammolli, F.; Stanley, H.E. Scale-free models for the structure of business firm networks. Phys. Rev. 2010, 81, 036117. [Google Scholar] [CrossRef] [PubMed]
- Lytras, M.D.; Raghavan, V.; Damiani, E. Big data and data analytics research: From metaphors to value space for collective wisdom in human decision making and smart machines. Int. J. Semant. Web Inf. Syst. 2017, 13, 1–10. [Google Scholar] [CrossRef]
- Williams, M.L.; Burnap, P.; Sloan, L. Towards an ethical framework for publishing Twitter data in social research: Taking into account users’ views, online context and algorithmic estimation. Sociology 2017, 51, 1149–1168. [Google Scholar] [CrossRef] [PubMed]
Figure 1.
Phases of the BD chain.

Figure 2.
The new BD process: decision-makers at the centre.

Figure 3.
The dendrogram derived from the clustering.

Figure 4.
The visualization of leading venues from Foursquare data.

Figure 5.
Heat map and Expo 2015.

Figure 6.
Filtering telephone calls: visualization.

Figure 7.
Networks’ initial representations. Note: The red color highlighted the most popular nodes in terms of followers.
Figure 7.
Networks’ initial representations. Note: The red color highlighted the most popular nodes in terms of followers.

Figure 8.
The revised BD cycle.

© 2018 by the author. Licensee MDPI, Basel, Switzerland. This article is an open access article distributed under the terms and conditions of the Creative Commons Attribution (CC BY) license (http://creativecommons.org/licenses/by/4.0/).
Share and Cite
MDPI and ACS Style
Arnaboldi, M. The Missing Variable in Big Data for Social Sciences: The Decision-Maker. Sustainability 2018, 10, 3415. https://doi.org/10.3390/su10103415
AMA Style
Arnaboldi M. The Missing Variable in Big Data for Social Sciences: The Decision-Maker. Sustainability. 2018; 10(10):3415. https://doi.org/10.3390/su10103415
Chicago/Turabian StyleArnaboldi, Michela. 2018. "The Missing Variable in Big Data for Social Sciences: The Decision-Maker" Sustainability 10, no. 10: 3415. https://doi.org/10.3390/su10103415
Note that from the first issue of 2016, this journal uses article numbers instead of page numbers. See further details here.