Impacts of Climate Change and Human Activities on the Surface Runoff in the Wuhua River Basin
by
 , ,
, ,
Zhengdong Zhang
1,*, 
Luwen Wan
2,
Caiwen Dong
3,
Yichun Xie
4,
Chuanxun Yang
5,
Ji Yang
5 and
Yong Li
5 1
School of Geography Sciences, South China Normal University, Guangzhou 510631, China
2
Department of Earth and Environmental Sciences, Michigan State University, East Lansing, MI 48823, USA
3
The Bureau of Land and Resources Huangshi, Huangshi 435000, China
4
Institute for Geospatial Research and Education, Eastern Michigan University, Ypsilanti, MI 48197, USA
5
Guangzhou Institute of Geography, Guangzhou 510070, China
*
Author to whom correspondence should be addressed.
Sustainability 2018, 10(10), 3405; https://doi.org/10.3390/su10103405
Submission received: 19 July 2018
/
Revised: 9 September 2018
/
Accepted: 18 September 2018
/
Published: 25 September 2018
(This article belongs to the Special Issue Data Analytics on Sustainable, Resilient and Just Communities)
Abstract
:The impacts of climate change and human activities on the surface runoff in the Wuhua River Basin (hereinafter referred to as the river basin) are explored using the Mann–Kendall trend test, wavelet analysis, and double-mass curve. In this study, all the temperature and precipitation data from two meteorological stations, namely, Wuhua and Longchuan, the measured monthly runoff data in Hezikou Hydrological Station from 1961 to 2013, and the land-cover type data in 1990 and 2013 are used. This study yields valuable results. First, over the past 53 years, the temperature in the river basin rose substantially, without obvious changes in the average annual precipitation. From 1981 to 2013, the annual runoff fluctuated and declined, and this result is essentially in agreement with the time-series characteristics of precipitation. Second, both temperature and precipitation had evidently regular changes on the 28a scale, and the annual runoff changed on the 19a scale. Third, forestland was the predominant land use type in the Wuhua river basin, followed by cultivated land. Major transitions mainly occurred in both land-use types, which were partially transformed into grassland and construction land. From 1990 to 2013, cultivated land was the most active land-use type in the transitions, and construction land was the most stable type. Finally, human activities had always been a decisive factor on the runoff reduction in the river basin, accounting for 85.8%. The runoff in the river basin suffered most heavily from human activities in the 1980s and 1990s, but thereafter, the impact of these activities diminished to a certain extent. This may be because of the implementation of water loss and soil erosion control policies.
1. Introduction
Climate change and human activity are two important factors of the changes in stream runoff [1]. In recent years, stream runoff reductions in different regions under the impacts of climate changes and human activities exhibit varying degrees; however, the contributions of these factors to the runoff reduction in a specific time period moderately differ [2]. Climate changes have impacted the ecosystem and hydrological cycle significantly and irreversibly [3]. In the mid-latitudes, climate changes induced by temperature and precipitation lead to water resource reduction. For nearly a decade, the greenhouse effects on hydrological variables have been extensively investigated in the world [4,5,6,7,8,9]. The results of existing studies show that the impacts of precipitation on runoff far outweigh those of temperature. With constant precipitation, the impacts of temperature on runoff also increase with rising temperature, and with the temperature unchanged, precipitation exerts a remarkable impact on runoff [10,11]. Most studies on the impacts of climate changes on runoff and sediment have been conducted along the middle and upper reaches of the Yellow River [12,13], and these studies show that both reduced precipitation and increased temperature contribute considerably to runoff reduction [14,15,16,17]. Land cover under the impacts of land use and human activities also cause changes in runoff. With the technological and social development, human intervention in nature is gradually increasing, causing significant changes in river basin complex [18,19]. Different human activities can produce various hydrological effects. Many studies have been conducted by Chinese and foreign scholars on topics such as the impacts of hydrological process on conservation of water and soil, farmland irrigation, deforestation, urbanization, land-use/cover, and the impacts of human life water on runoff [20,21,22,23], and indicate that human activities are important driving factors for significant changes in runoff in the basin due to human interventions especially soil and water conservation measures.
In the past 50 years, global climate changes and human activities have had profound impacts on global hydrology and water resources. In the basin scale, the research methods that can quantitatively distinguish the hydrological effects of climate changes and human activities are mainly hydrological model simulation methods [24,25,26] and quantitative evaluation methods [27,28,29,30], such as the climate coefficient method, sensitivity analysis method, and the precipitation-runoff double accumulation curve method [31]. The former has a good physical basis, but the parameter sensitivity has certain uncertainty. Runoff is affected by climate change and human activities. Therefore, it is necessary to combine the two to study the impact on water resources. However, most of the research only focuses on one of the drivers of climate change and human activities. There are fewer studies on the effects of the two driving factors on runoff and how to distinguish the effects of the two on it. Also, the hydrological impacts of climate changes and human activities have been mainly investigated on a large scale, but those on a river basin complex have been rarely studied on a mesoscale, probably due to the difficulty of data acquisition. The Wuhua River Basin is mainly located in Wuhua County, which has the largest area of barren hills and the most serious soil erosion in Guangdong Province, located in Southeast of China. For the past decades, the impacts of climate changes and human activities in the river have intensified, changing the underlying surface of the river basin. Under the same precipitation condition, the runoff in the river basin is declining, and the sediment decreases substantially. It has brought great constraints to agricultural production and people’s lives. Here we analyze the impacts of climate changes and human activities on the surface runoff in the river basin by using the Mann–Kendall (M–K) trend test, and wavelet analysis to analyze the change trends and separate the influences that arose from these two driving factors on runoff with a double-mass curve (DMC). The results can provide theories and methods for further research on the hydrological impacts of climate changes and human activities and decision support for local ecological construction, especially mesoscale watersheds in hot and humid areas.
2. Materials and Methods
2.1. Study Area
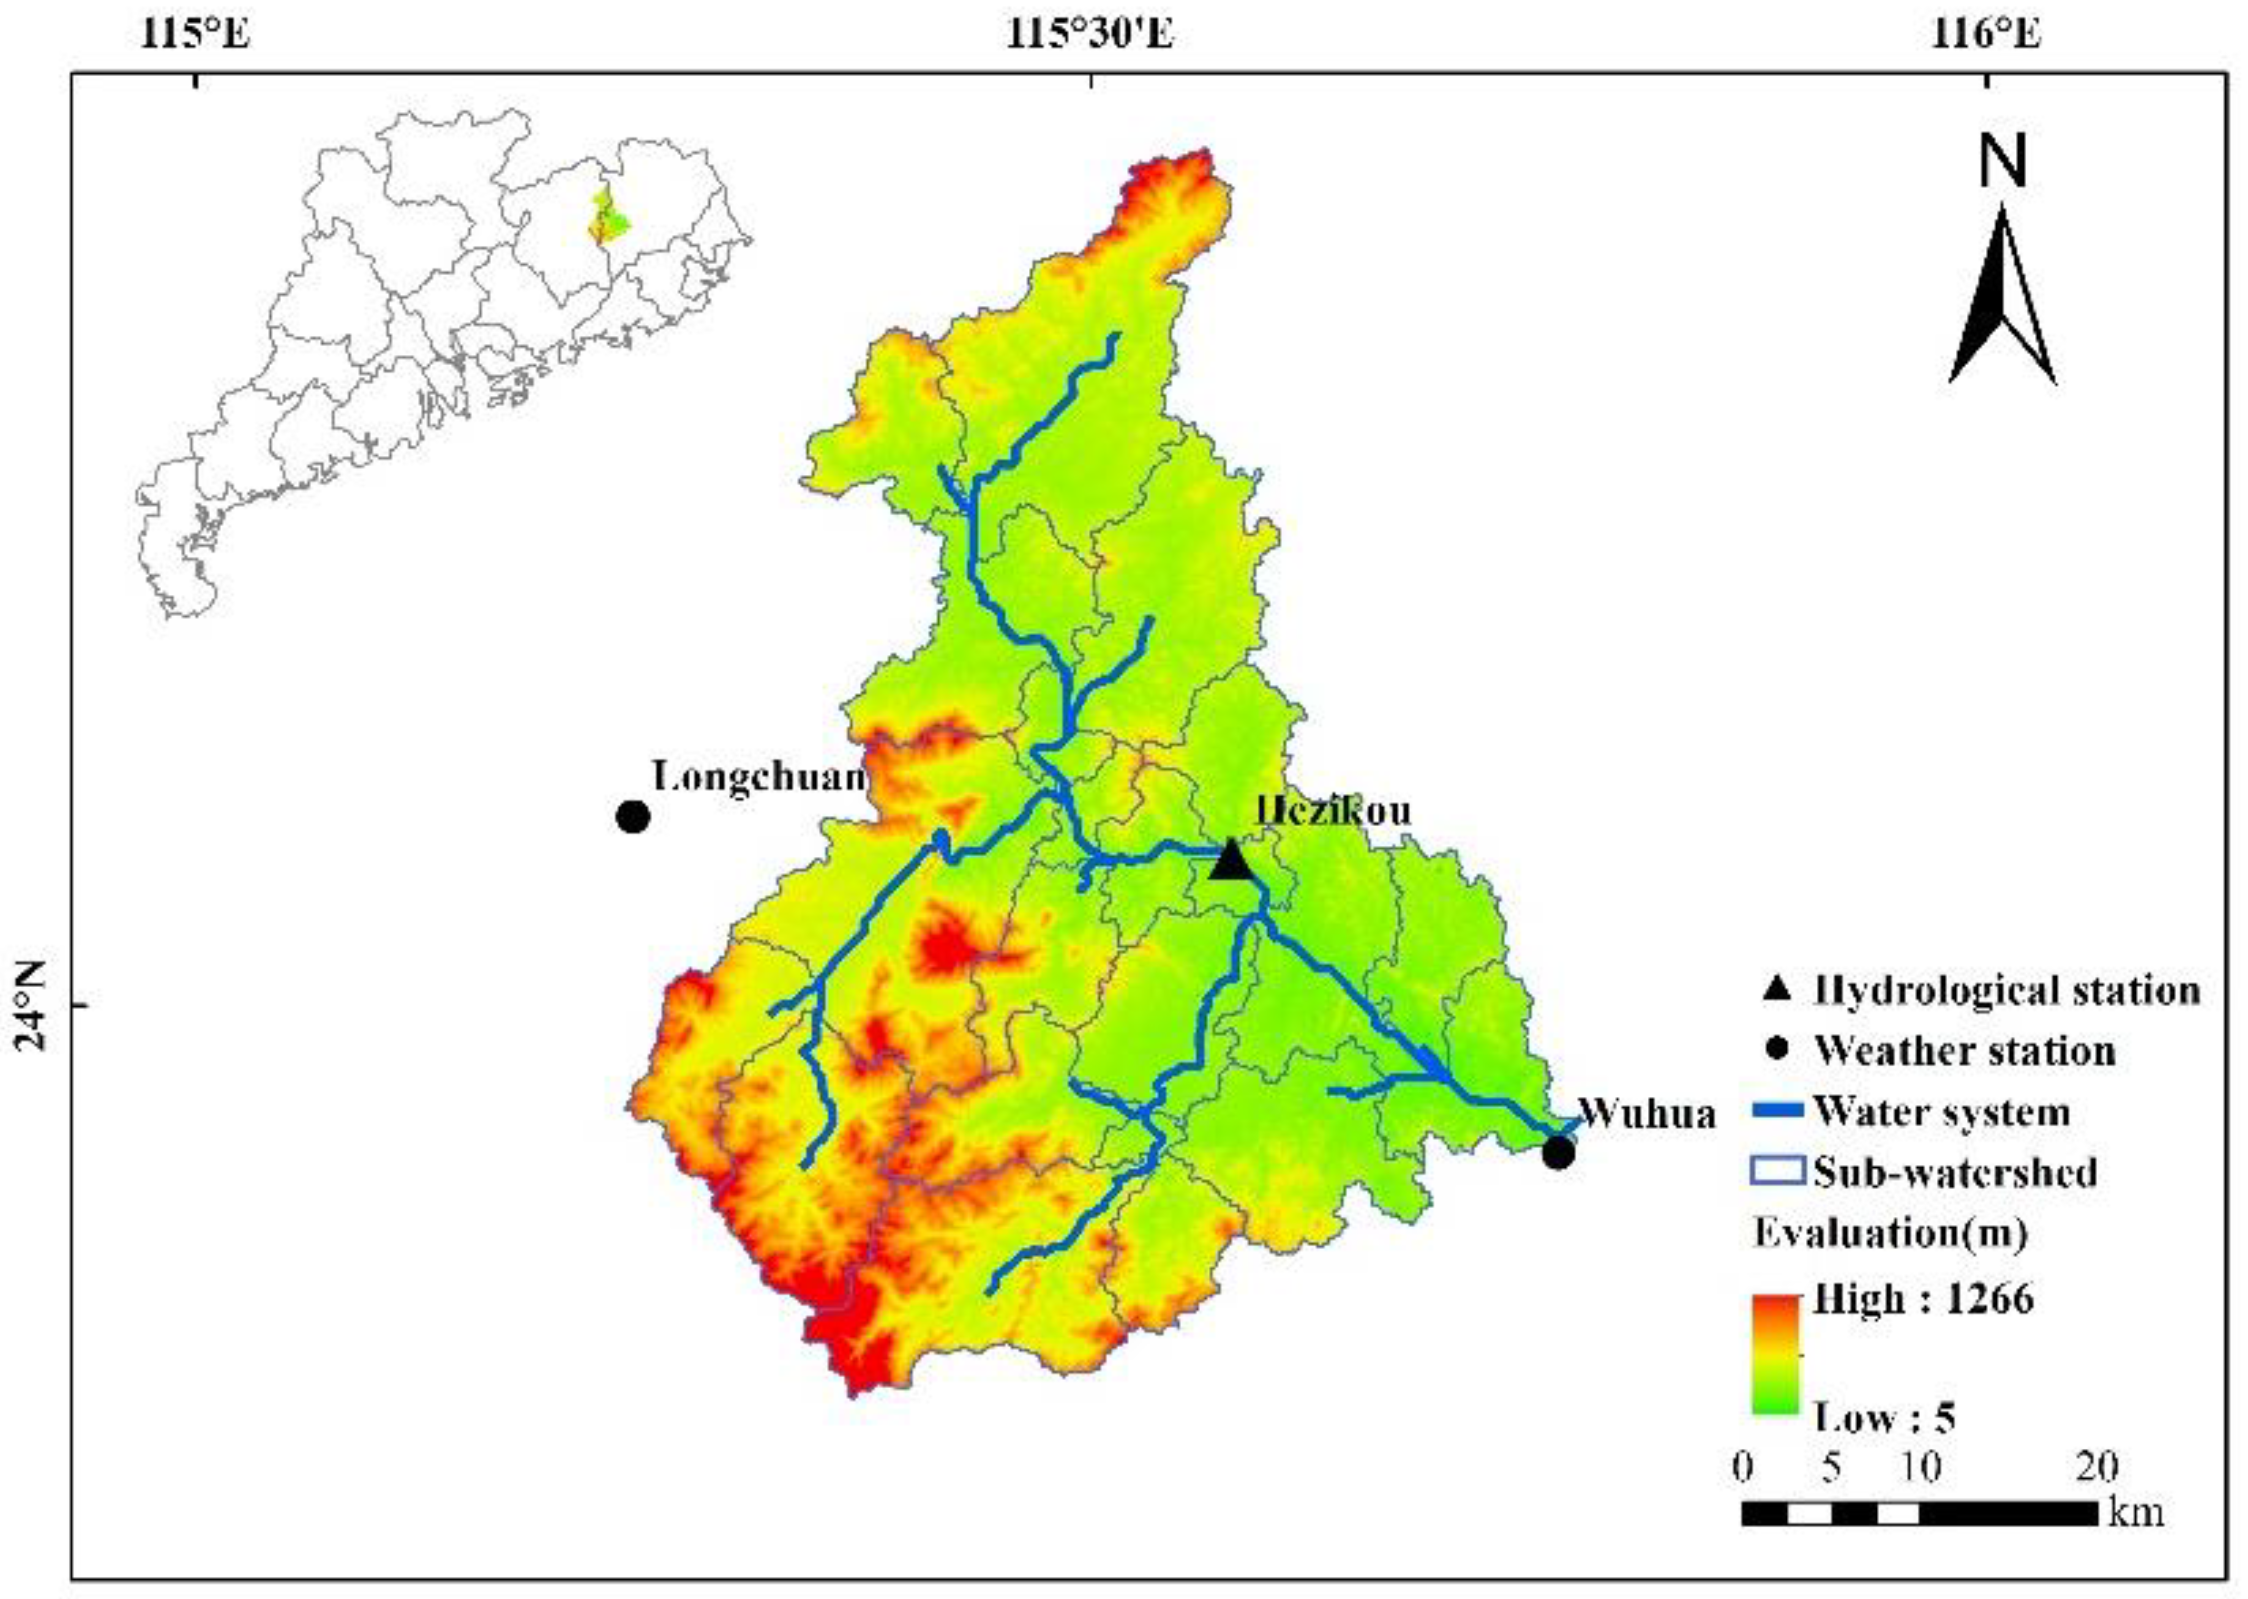
The Wuhua River is the primary tributary of the Mei River in the upper reaches of the Han River. It is located in northeastern Guangdong Province, and it rises at Yajizhai in the northeast of Huilong Town, Longchuan County, Guangdong Province. Its main recharge source is precipitation. In the upper reaches, it runs from north to south; it flows into Wuhua County after brooks join in Longchuan County, mingles in the Mei River in Shuizhai. Its total length is 105 km, and the drainage basin area is 1832 km2. The slope of its riverbed is 0.99%. With a catchment area of 1031 km2, Hezikou Hydrological Station is the most important control station in the river basin. To the south of the Wuling Mountains, the river basin is affected by warm–humid ocean currents, and it belongs to a typical humid subtropical monsoon climate zone. It has an average annual precipitation of 1518 mm mainly concentrated in the period from March to September, accounting for approximately 82.5% of the annual precipitation, and its average annual temperature is 21.1 °C. The river basin is a typical mesoscale watershed in South China, having an undulating terrain tipped toward the east. The land cover types in this area include mountains (32%), hilly areas (40%), terraces and small plains (28%). The vegetation type in the river basin is South Asian tropical monsoon evergreen broad-leaved forest; it is dominated by artificial forests followed by primary bushes and undergrowth. The location map of the river basin is presented in Figure 1.
2.2. Data Sources
Spatial data: Digital Elevation Model (DEM) of the River Basin are sourced from the International Scientific Data Service Platform of the Chinese Academy of Sciences, and they have a spatial resolution of 30 m. Landsat TM images in 1990 and 2013 are initially corrected and processed with ENVI 5.1 and subsequently visually interpreted by supervised classification using well-established visual interpretation symbols and standards. Field survey and sampling are conducted in the River Basin to improve interpretation precision. The kappa coefficient after interpretation is 0.86, indicating improved classification accuracy. On the basis of the national land classification and the local conditions, the main land-use types in the River Basin are as follows: forestland, grassland, cultivated land, and construction land.
Hydrometeorological data: The hydrometeorological data for this study are obtained from the national meteorological stations and the Hydrology Yearbook of Guangdong Province. The meteorological data of the River Basin from two meteorological stations, namely, Wuhua and Longchuan, from 1961 to 2013 include the monthly and annually average temperature and precipitation. The monthly runoff data in Hezikou hydrological station from 1981 to 2013 was also obtained.
2.3. Research Methods
2.3.1. Mann–Kendall Test
The M–K test [32] is commonly used in the fields of meteorology and climatology to determine the change trends of the hydrological variables as well as test and identify the climate jump points. This method has been used by many scholars to analyze climate changes [33,34,35,36,37], with the detailed principle and calculation method given in a previous study [38]. For a time series , we determine the magnitude of and first, then given to S, the statistics of trend test are as Equations (1) and (2). The test statistics only depends on the ranks of the observations, not their actual values, resulting in a distribution-free test statistics. The variance of S could be calculated by Equation (2), where n is the number of observations. UF and UB are the statistical characteristic values of the sequence and reverse sequence of data for mutation test, respectively.
2.3.2. Wavelet Analysis
Morlet wavelet is a complex-valued wavelet commonly used to analyze the hydrological changes in a long time series [39]. It has the special advantages of signal processing to the time-frequency analysis because it gives the scale of sequence variation, also show the time position of variation. In the current study, the Morlet wavelet is used to analyze the runoff, precipitation, and temperature periodicities in the River Basin and their jump points due to the mean value of this function is 0 and it has good symmetry in time-frequency. The coefficient of variation of the Morlet wavelet function is as follows (3):
where Wf(a,b) represents the wavelet transform coefficient, a represents the scaling factor, which indicates the period length of the wavelet, b represents the time shift factor, t represents the time variables, and c is set to 6. The squared value of the wavelet coefficient is integrated in Domain b to obtain the wavelet variance as follows:
The change in the wavelet variance with the scale α is described by a wavelet variogram, which reveals the energy distribution of signal fluctuation with scale α [40]. The wavelet variogram can be used to determine the relative signal disturbance intensity of each time scale and the main existing time scale, that is, the primary period.
2.3.3. Double-Mass Curve
DMC is widely used in hydrological research. A regression analysis of the correlation between two variables is conducted using a rectangular coordinate system; thus, the relationship curve between these two variables is plotted. In the analysis of the DMC of precipitation–runoff, the cumulative precipitation is taken as the reference variable. The precipitation naturally changes within a limited period of time. The precipitation is affected less by human activities, while runoff is under the combined impacts of precipitation and human activities. Therefore, the impact of human activities can be distinguished using this method [41]. The specific procedure is as follows:
- (1)
- Precipitation sequences and runoff sequences are cumulatively calculated. The cumulative curve of precipitation ∑P–runoff ∑Q is plotted to determine the year in which human activities began to affect the runoff. The curve can be divided into two periods, namely, the reference period and the change period, and the dividing time point is the cutoff point.
- (2)
- The ∑P and ∑Q data for the change period are analyzed based on the corresponding data for the reference period by using LR. Consequently, the fitting equation for the cumulative precipitation and the runoff in the period, where a is the slope and b is the ∑Q-intercept:
- (3)
- ∑P in the change period is substituted into the Equation (3) to obtain the simulated cumulative runoff depth ∑Q′ in the change period. If ∑Q′ is assumed to be the same as the underlying surface conditions in the reference period, then the runoff is unaffected by human activities.
- (4)
- The calculation is inversed based on the superposition principle of cumulative values. With the simulated value ∑Q′, the simulated runoff depth Q′ is calculated inversely, and the difference between the measured runoff in the change period and the averaged value indicates the impact of human activities on the runoff in the River Basin.
3. Results
3.1. Analysis on the Trends, Discontinuities, and Periodicities of the Temperature, Precipitation, and Runoff
3.1.1. Analysis on the Change Trends of Temperature, Precipitation, and Runoff in 1961–2013
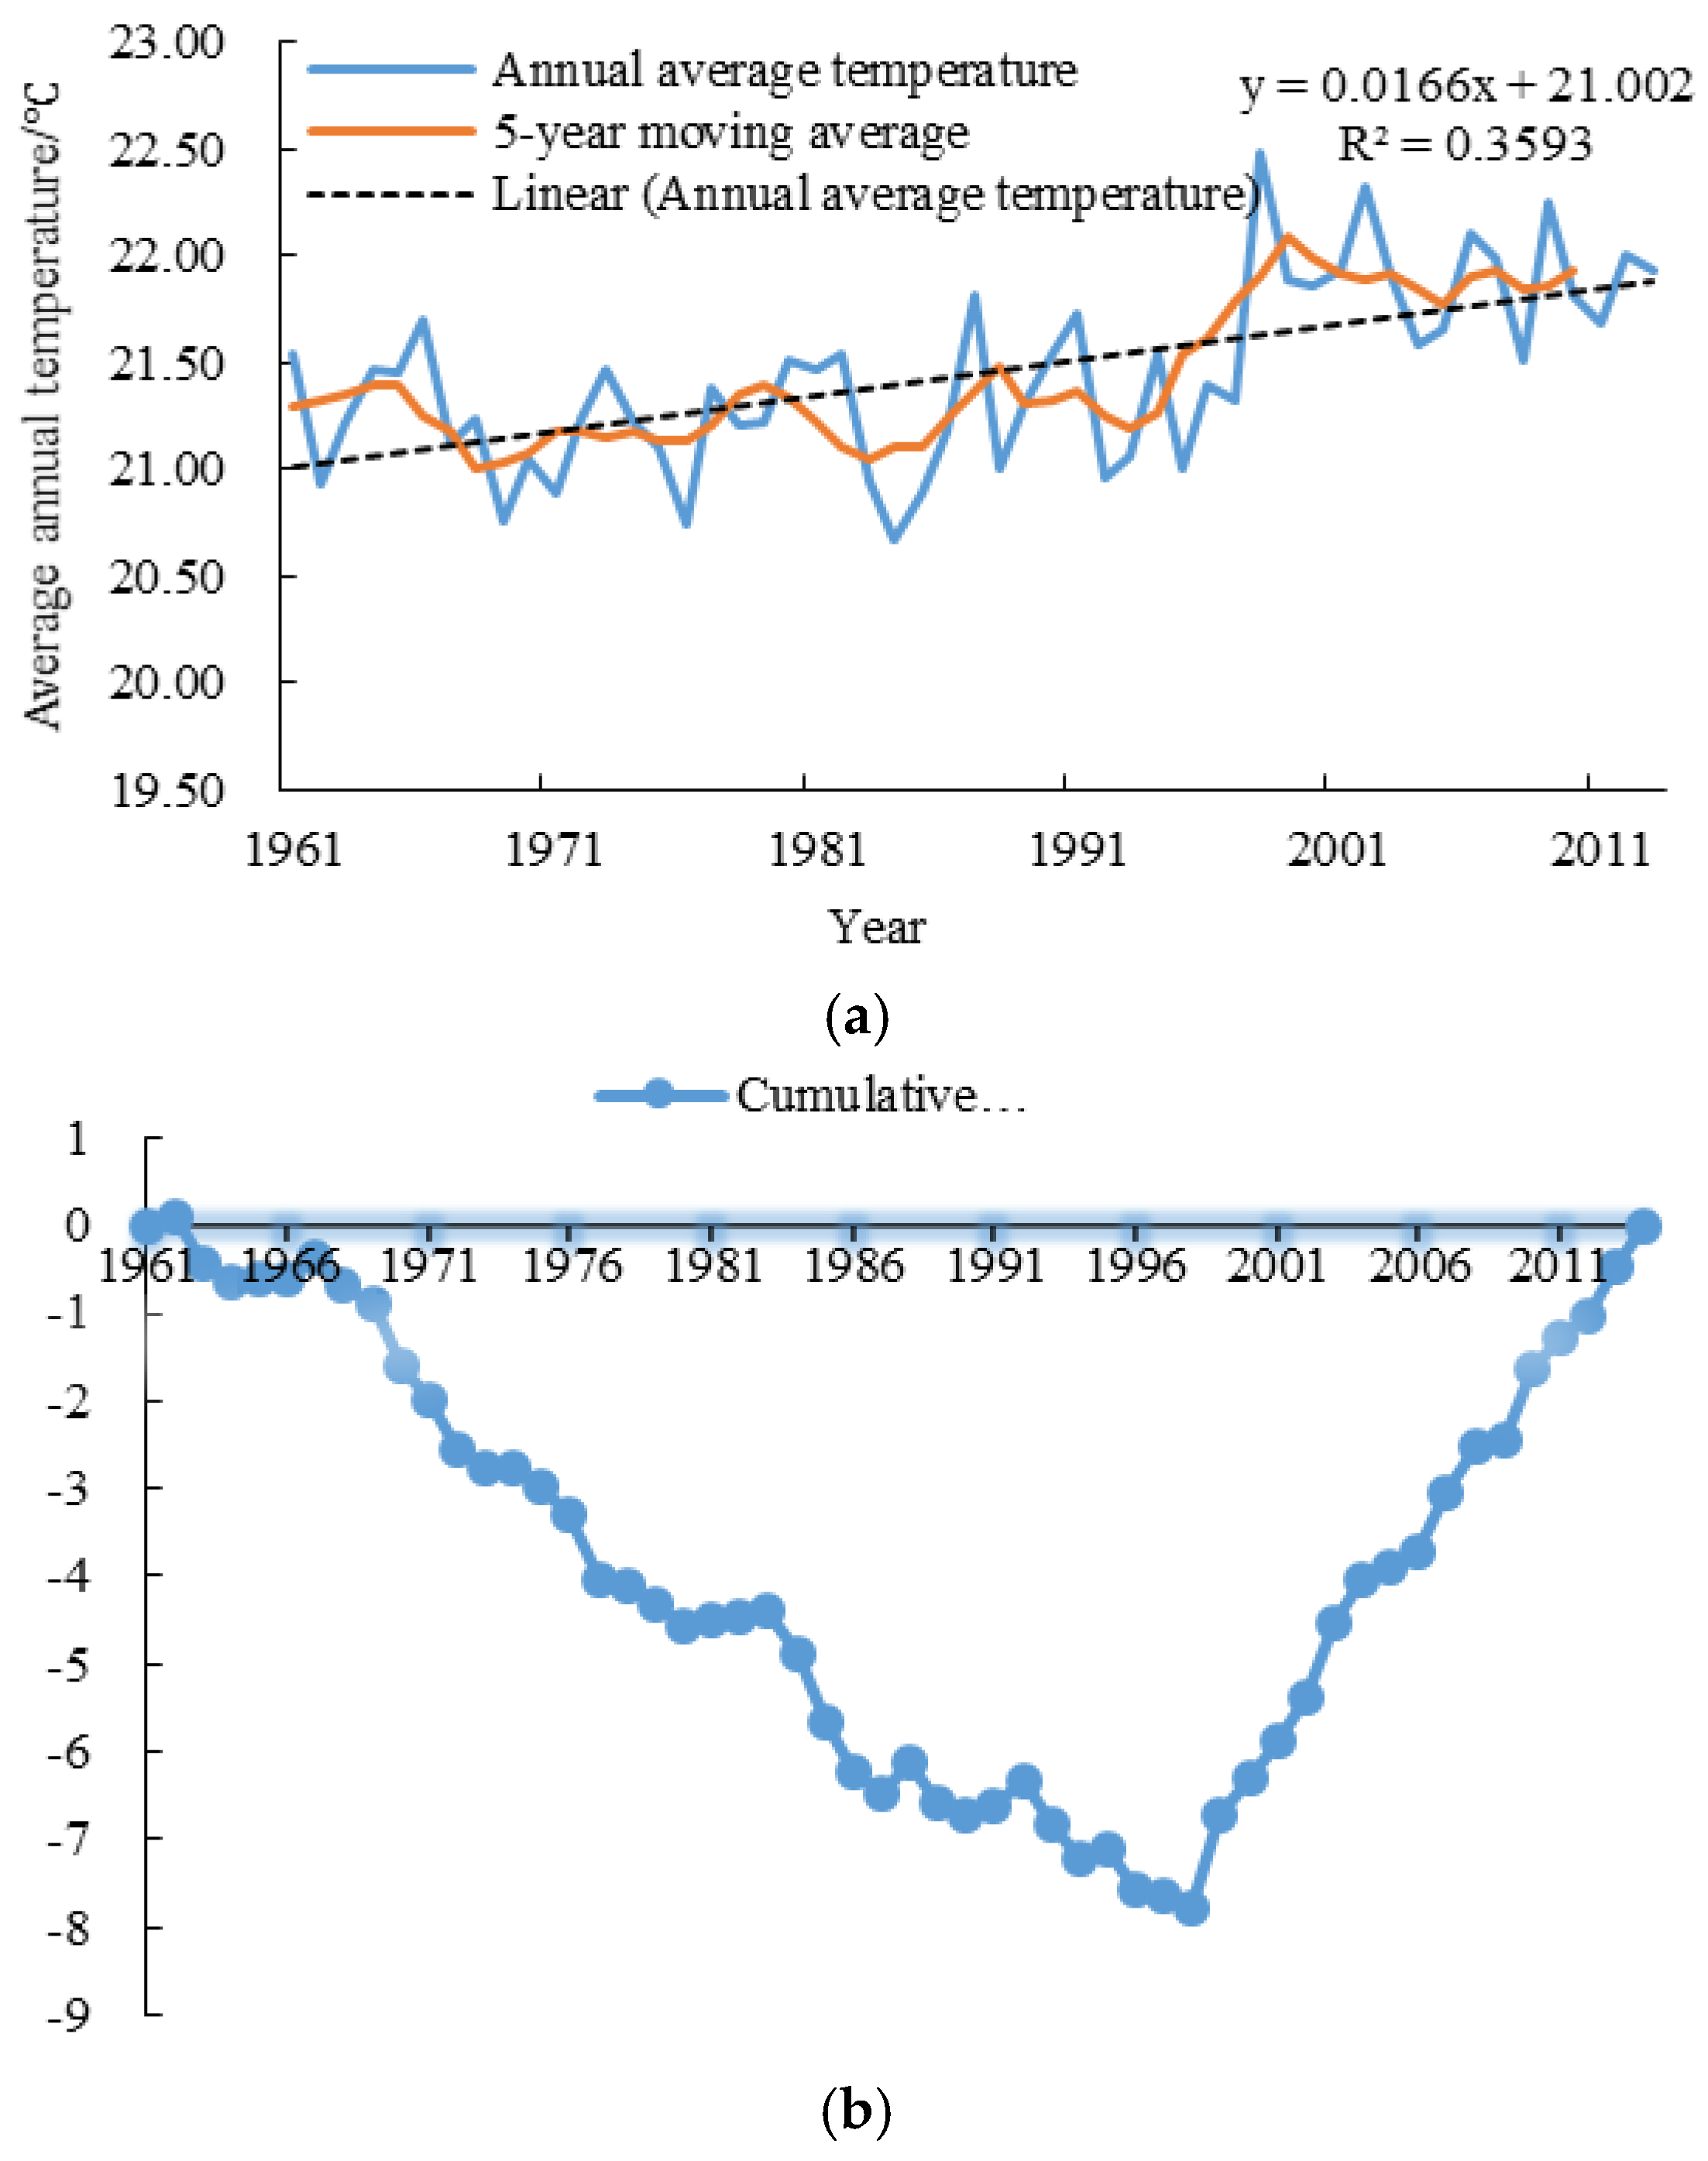
The average annual temperature in the River Basin is evidently increasing from 1961 to 2013 (Figure 2), and the interannual rate of change is 0.166 °C/10a. The maximum value of the average annual temperature (22.48 °C) is recorded in 1998, and the minimum value (20.67 °C) is recorded in 1984. An analysis of the five-year moving average curve shows that the average annual temperature from 1998 to 2002 is the highest, reaching up to 22.1 °C, whereas that from 1967 to 1971 is the lowest, reaching only 21.01 °C. The cumulative departure curve of the average annual temperature apparently changes. The changes in the average annual temperature from 1961 to 2013 experiences can be divided into two stages: stable fluctuation and rapid increase. The average annual temperature from 1961 to 1998 is on the low side, whereas that from 1998 to 2013 is on the high side. Evident from the interdecadal variations of the annual temperature, the average temperature in the 1970s is lowest. The average temperature in the 1960s is roughly equivalent to that in the 1980s, but the temperature rises slowly in the 1980s. Since the 1990s, the temperature has rapidly increased. The temperature rise has accelerated in the 21st century, increasing by 0.76 °C on average compared with the 1960s.
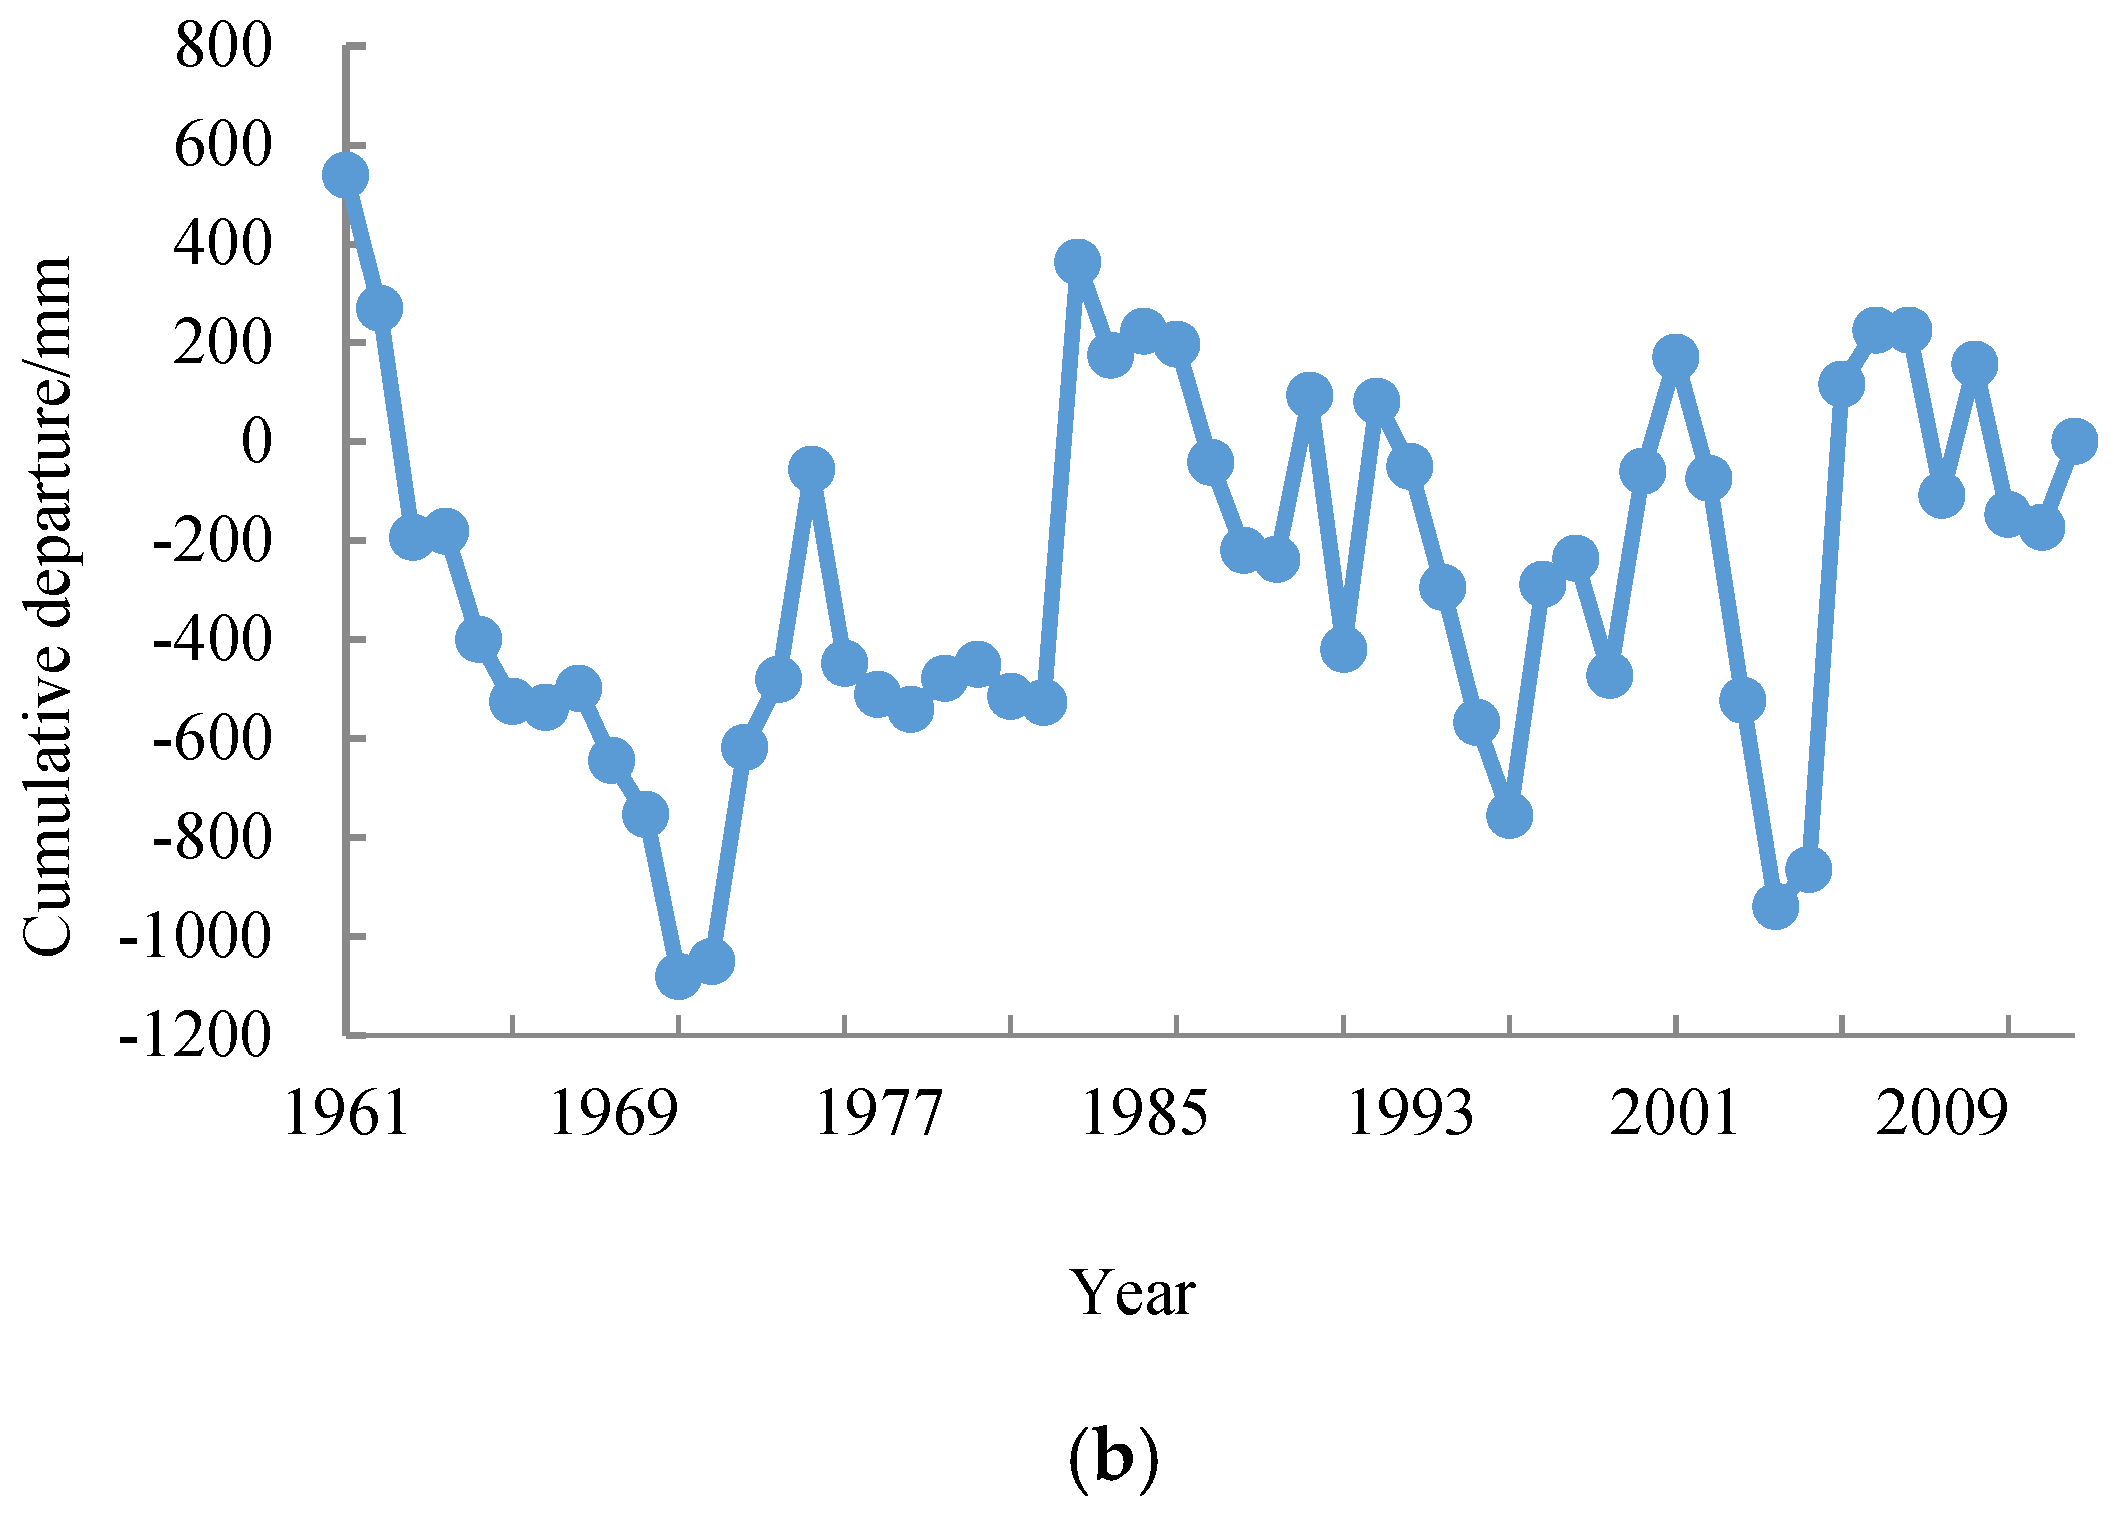
The average annual precipitation in the river basin is 1451 mm. As shown in the linear trend of the annual precipitation (Figure 3), the precipitation in the River Basin from 1961 to 2013 shows a slowly rising tendency. The interannual rate of change is 11.4 mm/10a. The maximum value of the annual precipitation in 53 years appears in 2006, reaching up to 2431 mm. The minimum value is 938 mm, which is recorded in 1991. The ratio of these extreme values is 2.59. As shown in the five-year moving average curve, the average annual precipitation within five years reaches the maximum value of 1655 mm from 2006 to 2010 and the minimum value of 1238 mm from 1962 to 1966. As shown in the cumulative departure histogram (Figure 3), the changes in the annual precipitation roughly follow the pattern “down–up–down–up–down–up,” exhibiting relatively apparent phase change characteristics. The cumulative departure curve of the annual precipitation shows a declining trend from 1961 to 1971, from 1984 to 1996, and from 2002 to 2005, and the annual precipitation is generally low in these periods. The cumulative departure curve shows a fluctuating upward trend from 1972 to 1983, from 1997 to 2001, and from 2006 to 2009, and the precipitation is mainly increasing in these periods. However, the changes in the annual precipitation from 2010 to 2013 are not significant. The interdecadal variation trend of the precipitation is as follows: the precipitation is on the low side in the 1960s, but it is on the high side in the 1970s. Subsequently, it continues to increase in the 1980s, it drops in the 1990s, and it is on the high side again in 2000.
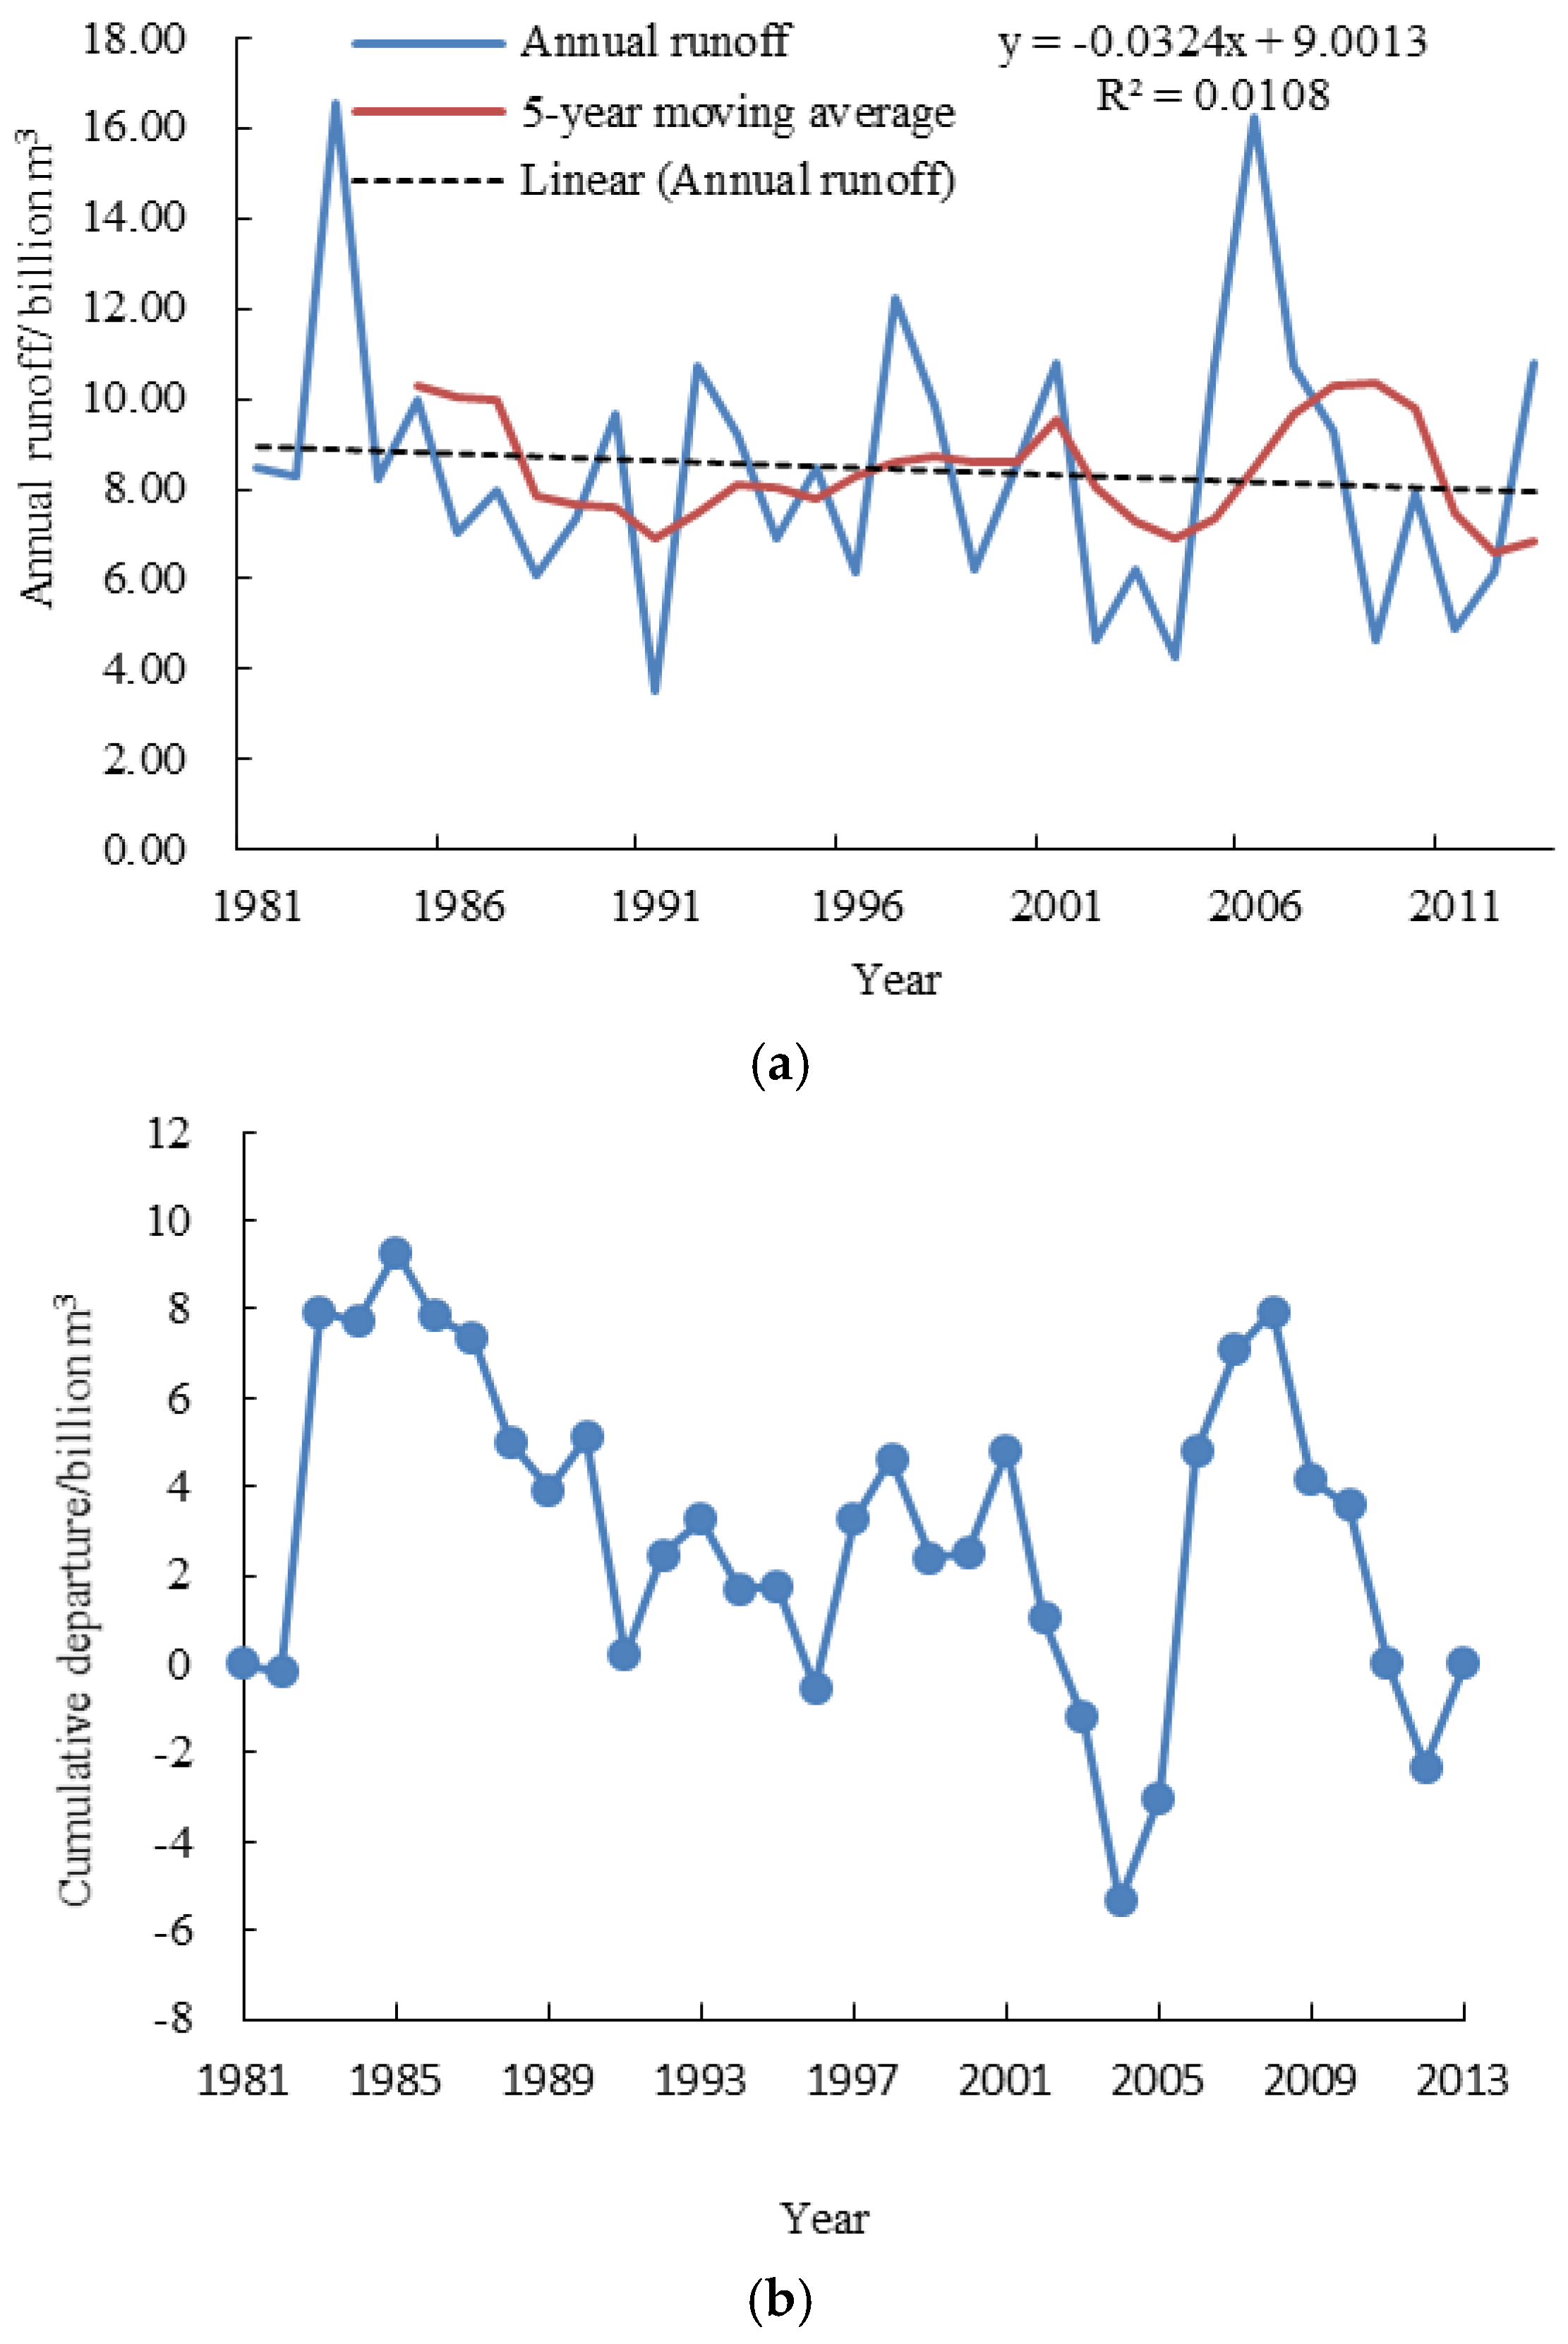
As shown in the linear trend of the annual runoff (Figure 4), the runoff in the River Basin is more volatile. Overall, it is mainly significantly reducing. The rate of change is −0.324 billion m3/10a. The maximum value of the annual runoff is recorded in 1983, reaching up to 1.655 billion m3, whereas the minimum value of 0.355 billion m3 is reached in 1991. An analysis of the five-year moving average curve shows that the maximum average annual runoff appears from 2005 to 2009, reaching up to 10.35 billion m3, whereas the minimum is 0.657 billion m3 from 2008 to 2012. As shown in the cumulative departure curve, during the nearly 33 years, the annual runoff in the river basin has roughly experienced an “up–down–up–down–up–down” trend. This trend can be divided into six phases: (1) from 1981 to 1985, the annual runoff was on the high side; (2) from 1986 to 1996, the annual runoff was on the low side; (3) from 1997 to 2001, the annual runoff was on the high side; (4) from 2002 to 2004, the annual runoff was on the low side; (5) from 2005 to 2008, the annual runoff was on the high side; and (6) since 2009, the annual runoff has been on the low side. An analysis of the results by the decade (Figure 4) shows that the highest annual runoff was in the 1980s, whereas the lowest was in the 2010s. The annual runoff in the 2000s was on the high side, whereas that in the 1990s was on the low side.
3.1.2. Discontinuities in Temperature, Precipitation, and Runoff
The M–K test discontinuity results for the temperature sequences in the river basin (Figure 5a) show that most of the UF statistics of the M–K test curve from 1961 to 1996 are negative, and during that period, the annual temperature exhibits a downward trend. However, the UF statistics do not exceed the threshold (Y = −1.96) at a significance level 0.05; thus, the downward trend is indistinct. The UF statistics from 1997 to 2013 are positive, and exceeds the threshold (Y = 1.96) at a significance level 0.05, thus, the temperature in the River Basin has exhibited an obvious upward trend in recent years and a jump point in 1997.
The M–K test discontinuity results of the annual precipitation in the River Basin (Figure 5b) show that the precipitation generally fluctuates, and the UF and UB curves have several crossing points within the confidence interval, which are particularly concentrated in the 1990s and the 2000s. Within the 53 years, the precipitation has not shown any distinct discontinuity, but the precipitation in the 1990s and that in the 2000s are extremely volatile.
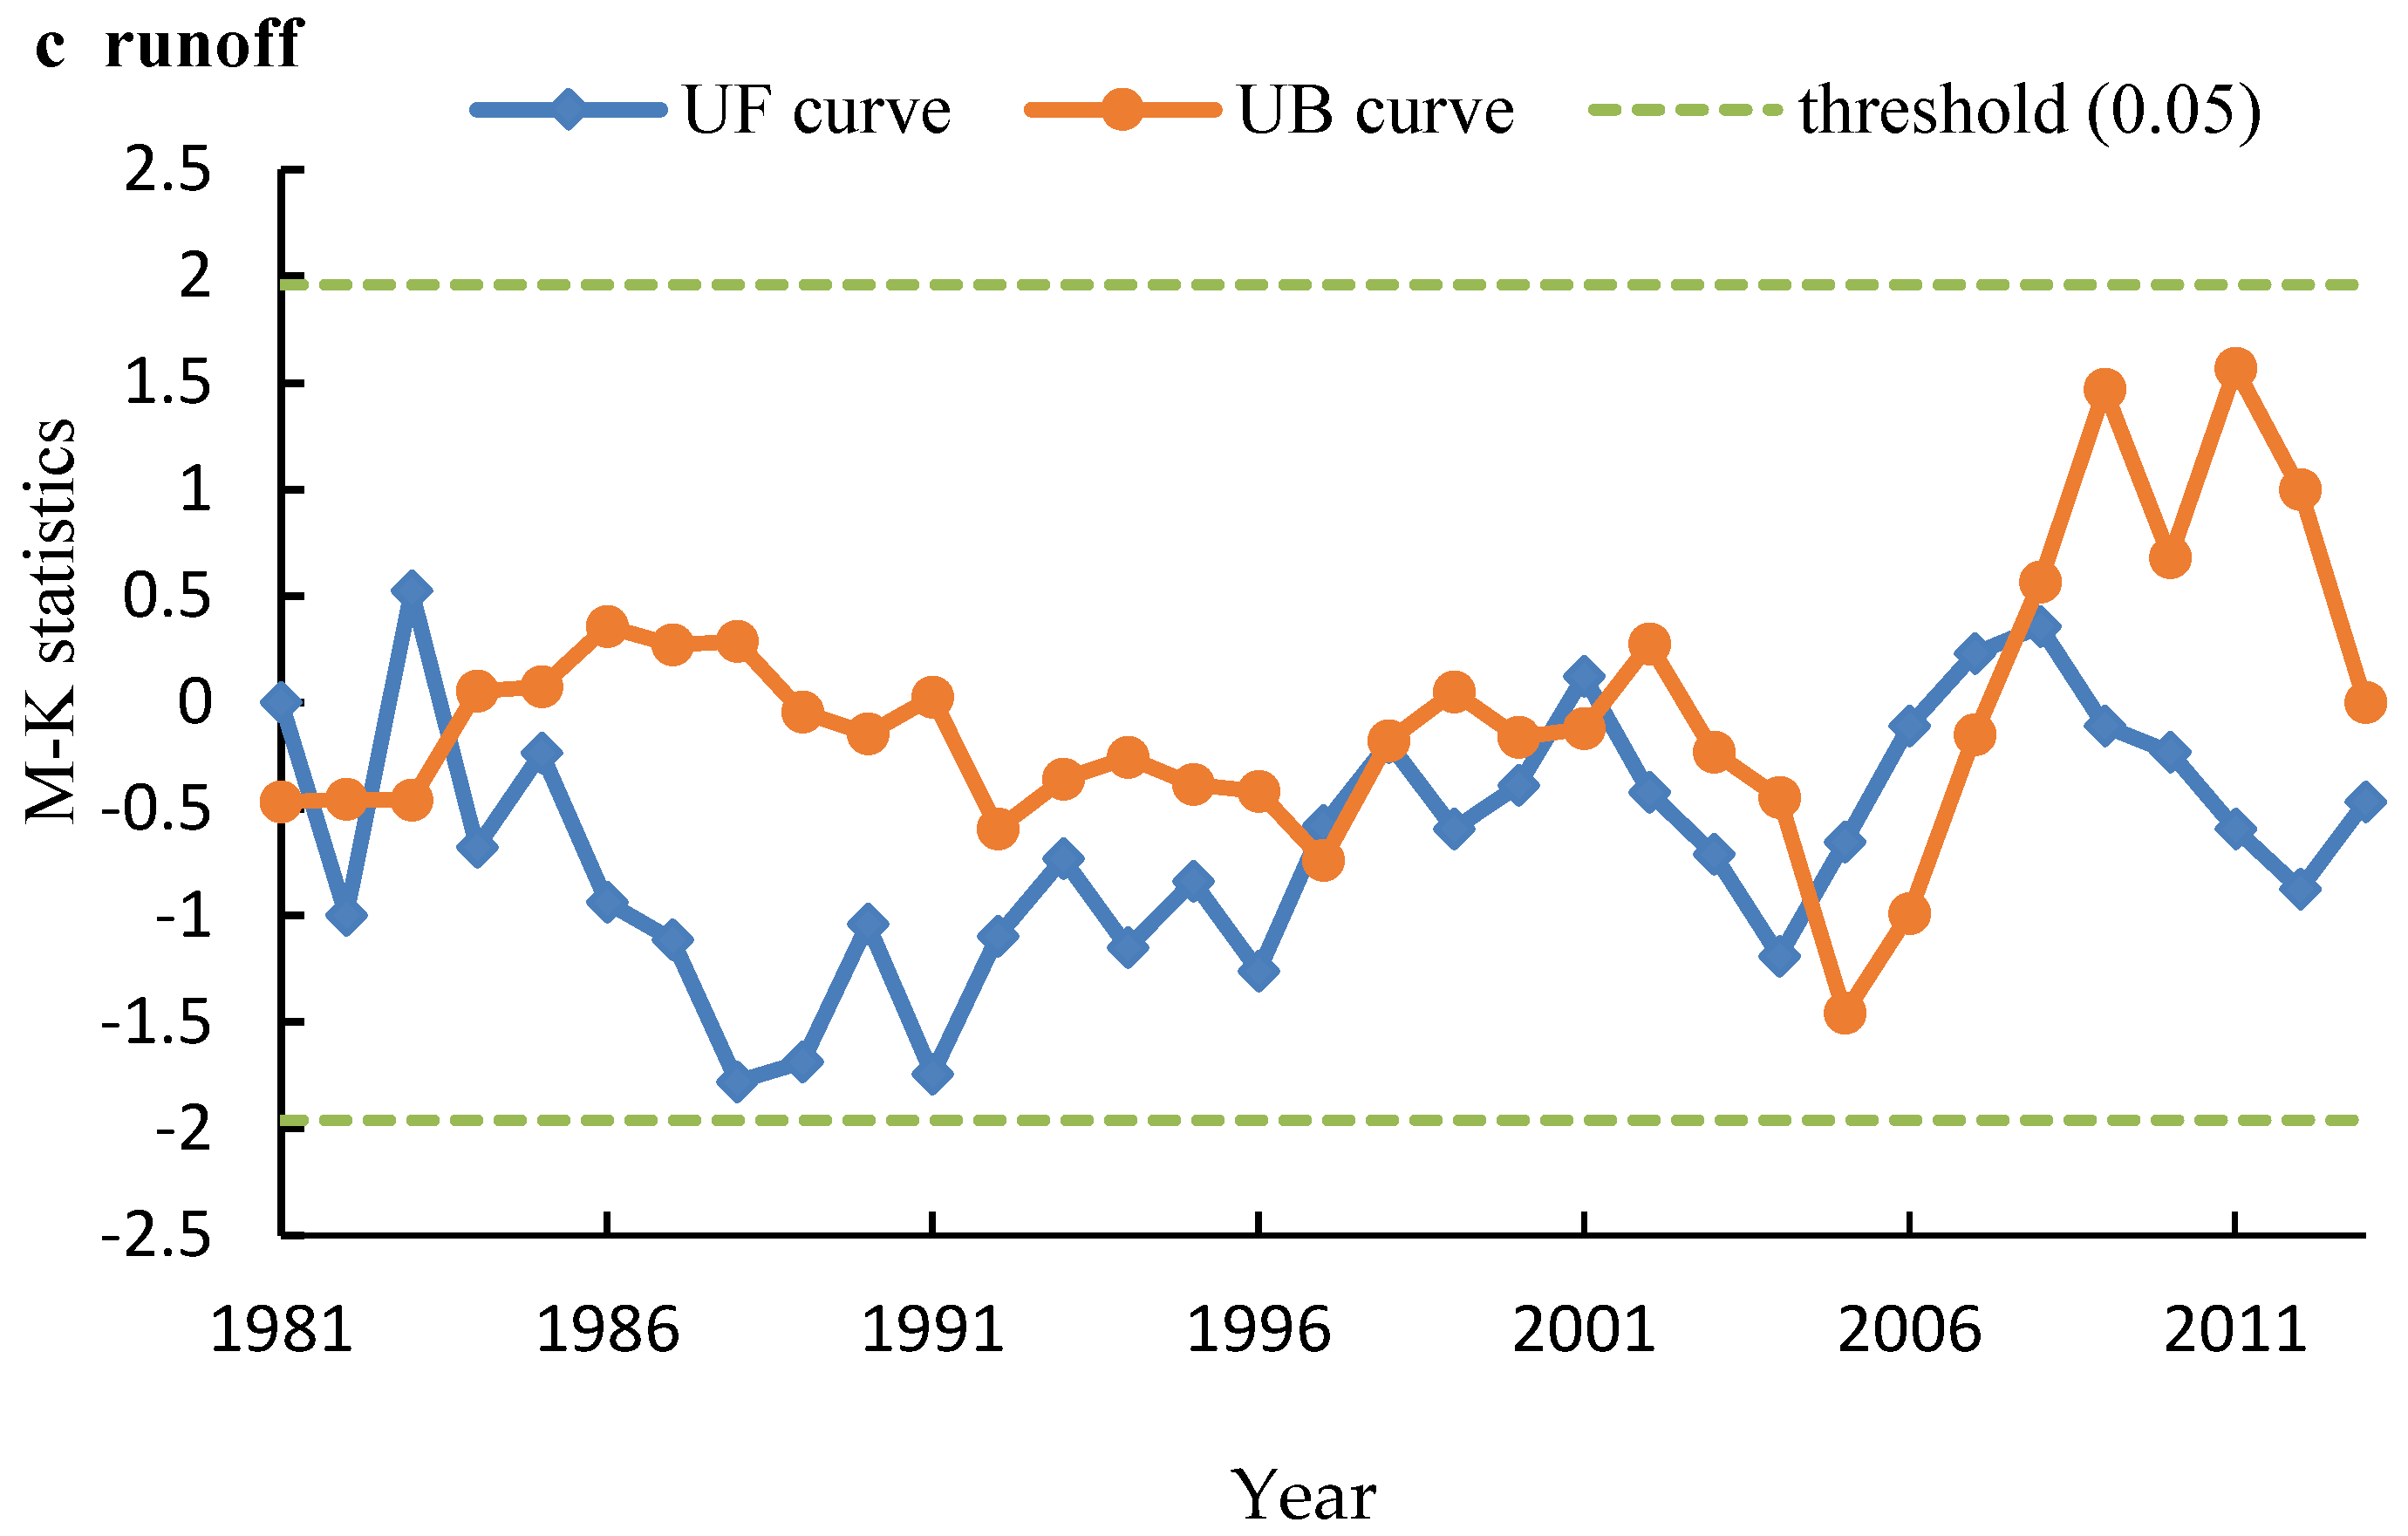
The M–K test discontinuity results of the annual runoff in the river basin (Figure 5c) show that the runoff is volatile in general. The UF and UB curves have several crossing points within the confidence interval, and these points are concentrated in the periods from 1981 to 1985 and from 1996 to 2008. Thus, within the 53 years, the runoff does not have any significant discontinuity, but the runoff from 1981 to 1985 and that from 1996 to 2008 fluctuate considerably.
3.1.3. Periodicities of the Changes in Temperature, Precipitation, and Runoff
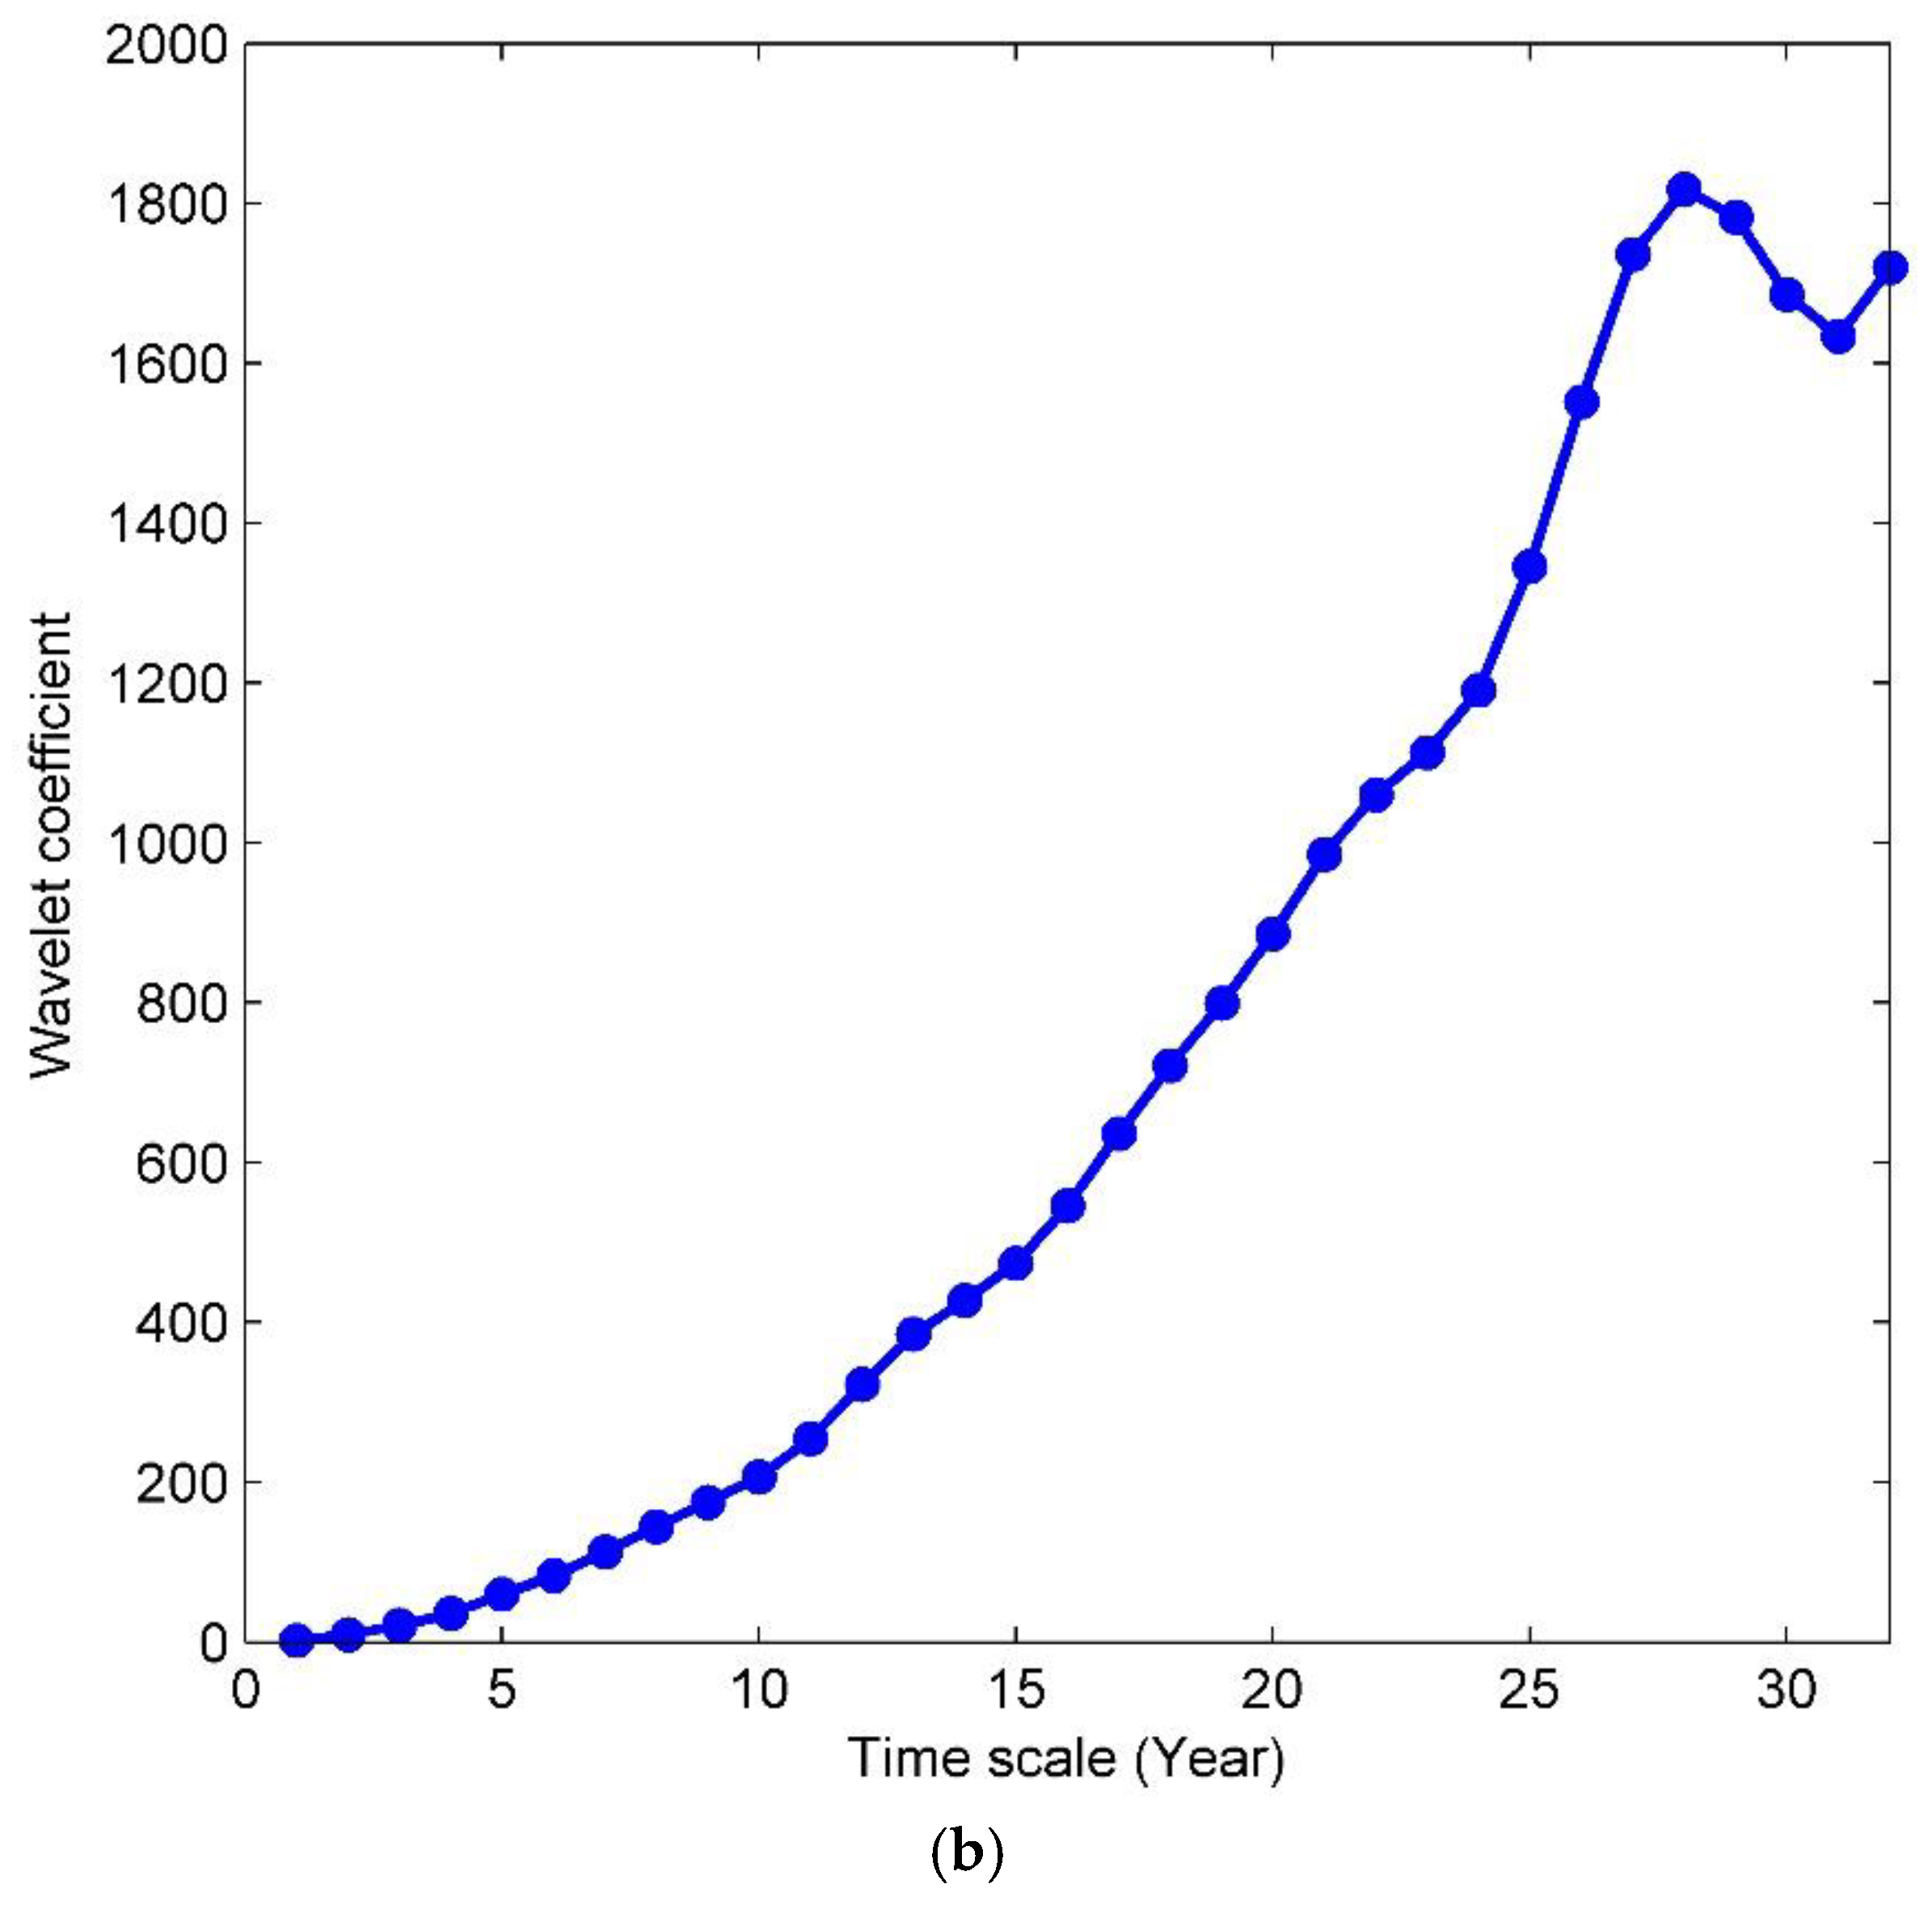
The wavelet variance change curve of the time series (Figure 6) shows that the average annual temperature has a distinct peak on the 28a scale, indicating that the strongest periodical oscillation of the average annual temperature is on the 28a scale, which is the first primary period of the average annual temperature curve.
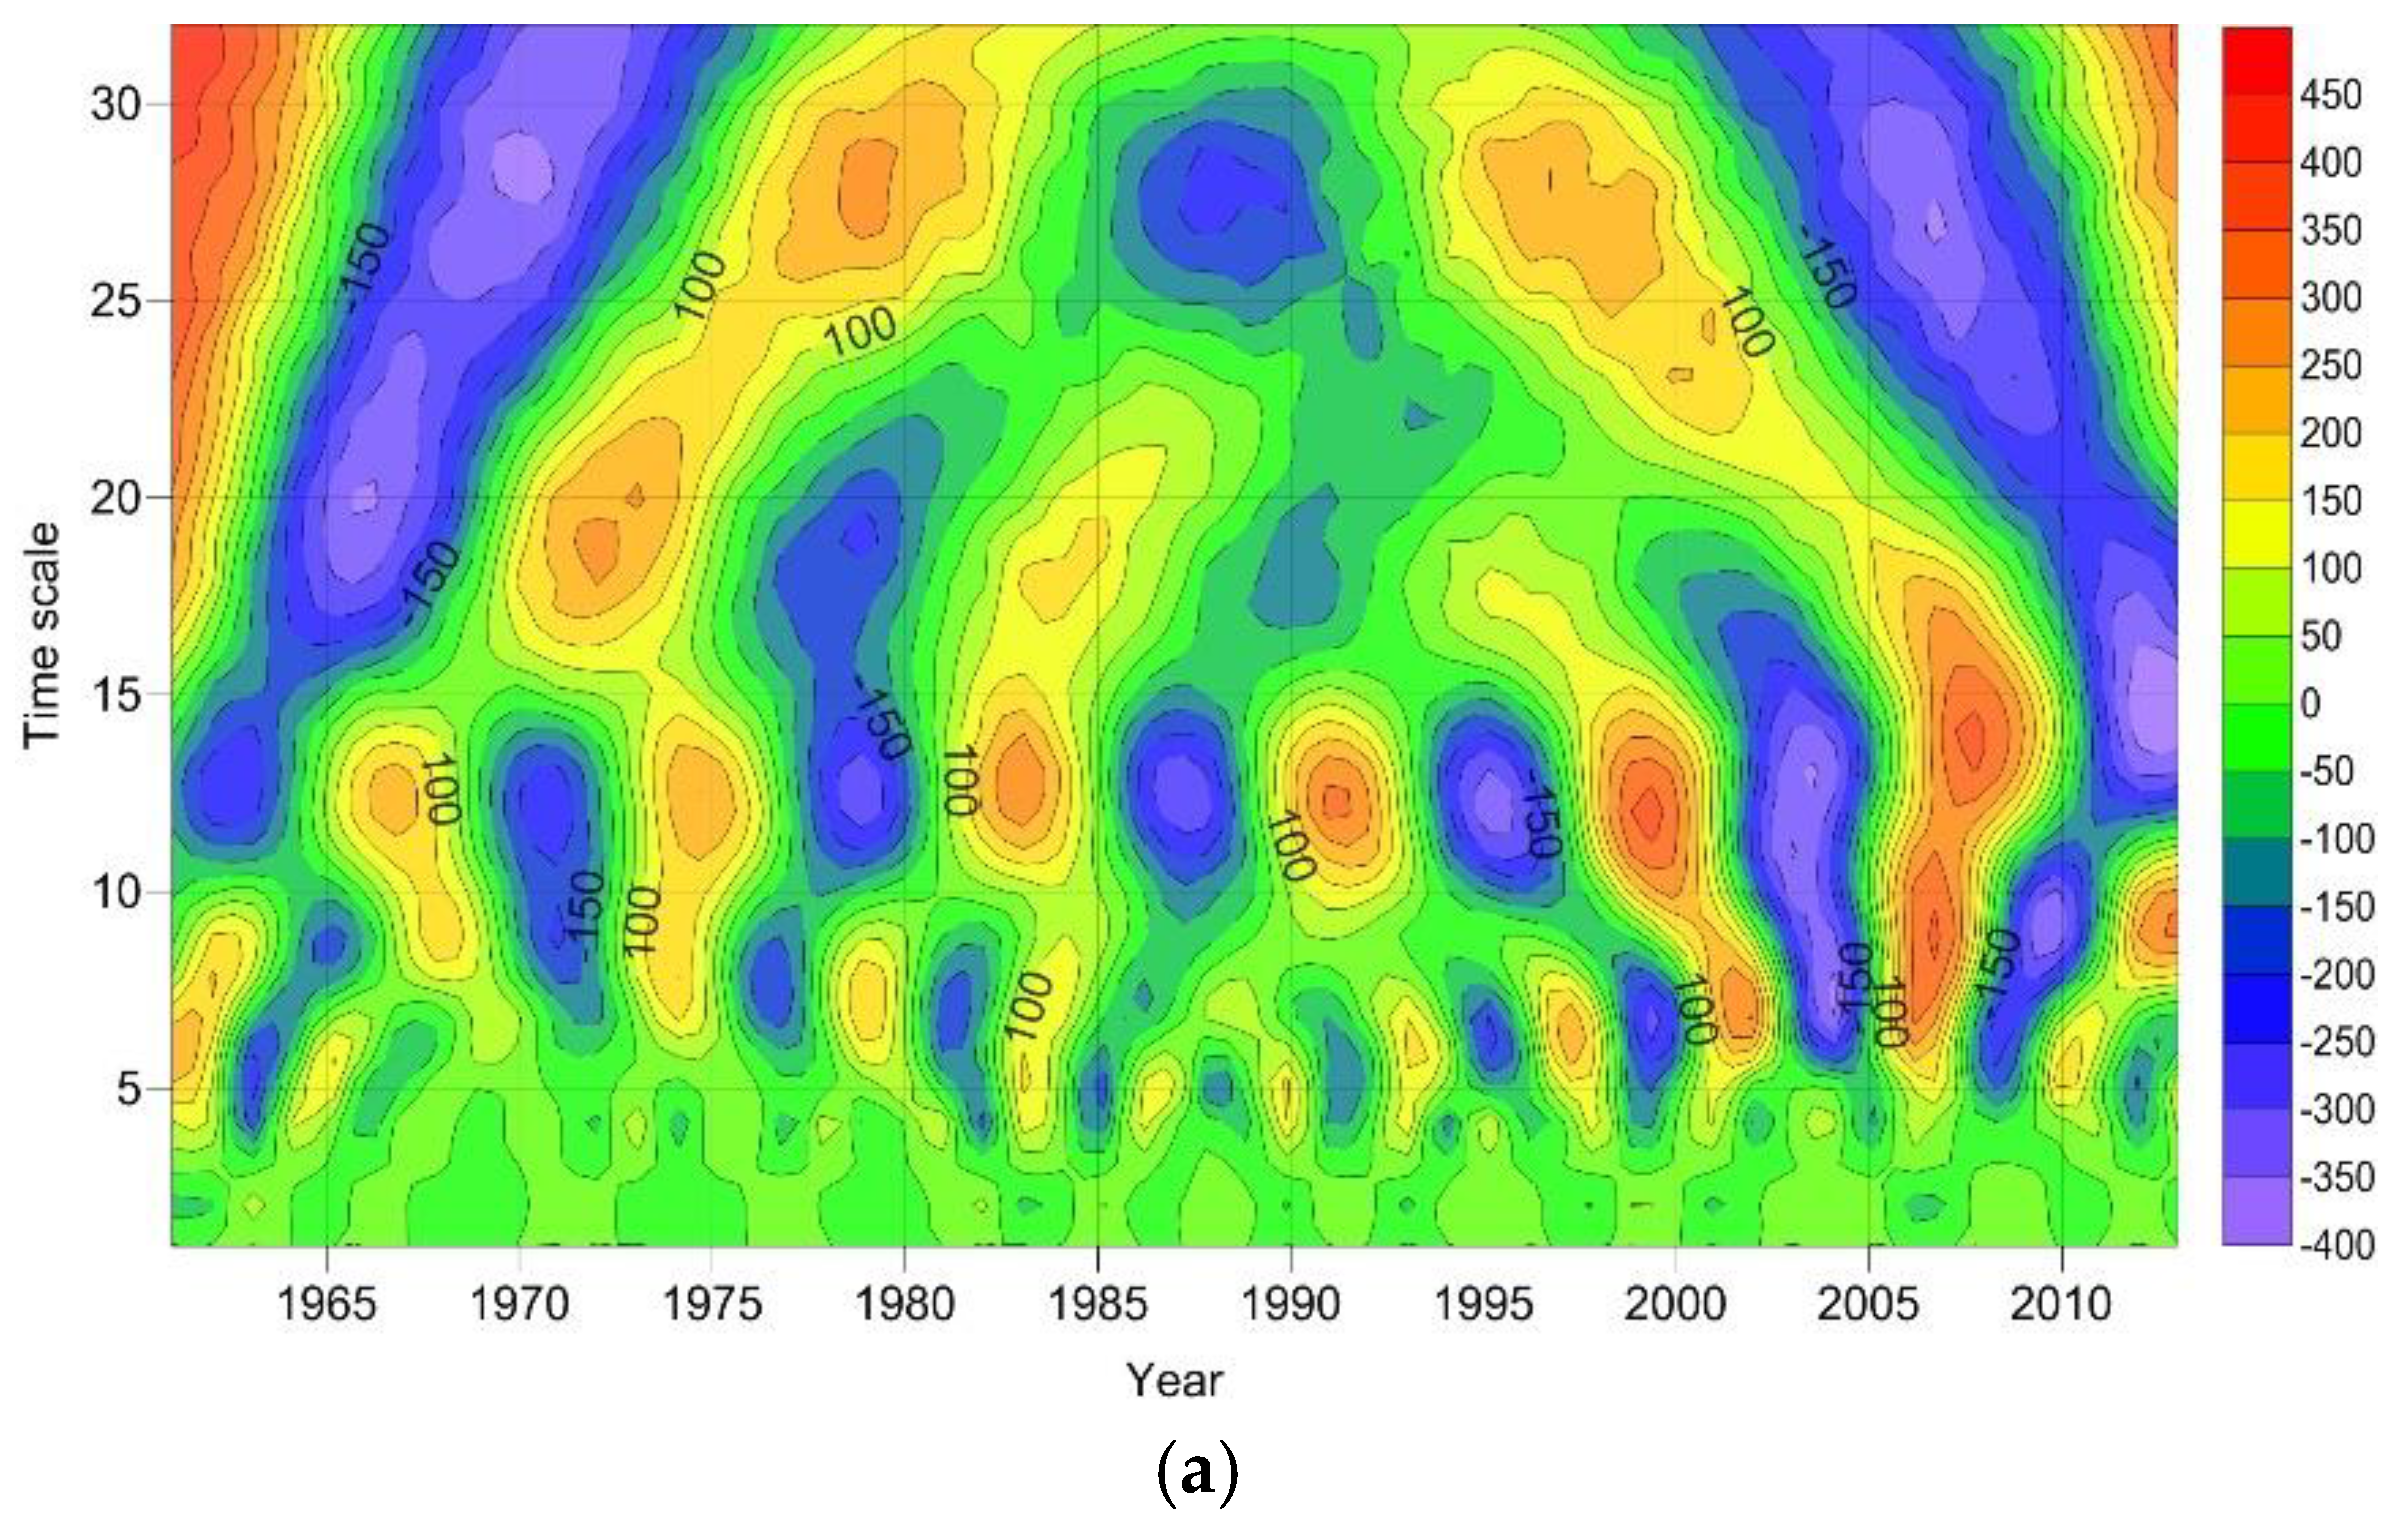
As shown in the 2D isogram of the wavelet coefficient (Figure 6), the strength of the signal is expressed by the wavelet coefficient. In the isogram, the positive values are enclosed by solid lines, and they indicate the temperatures on the high side. By contrast, the negative values are enclosed by dashed lines, and they indicate the temperatures on the low side. The isogram shows that the phase structure corresponding to the average annual temperature on the 28a scale has a strong periodicity, and the positive/negative phase fluctuates on this scale. On this scale, the temperature has three quasi-periodic oscillations (QPOs) with alternating high and low values at the positive phase of each of the periods from 1961 to 1963, from 1974 to 1984, from 1993 to 2002, and from 2009 to 2013. In these periods, the temperatures were on the high side, whereas the temperatures in the remaining years were on the low side.
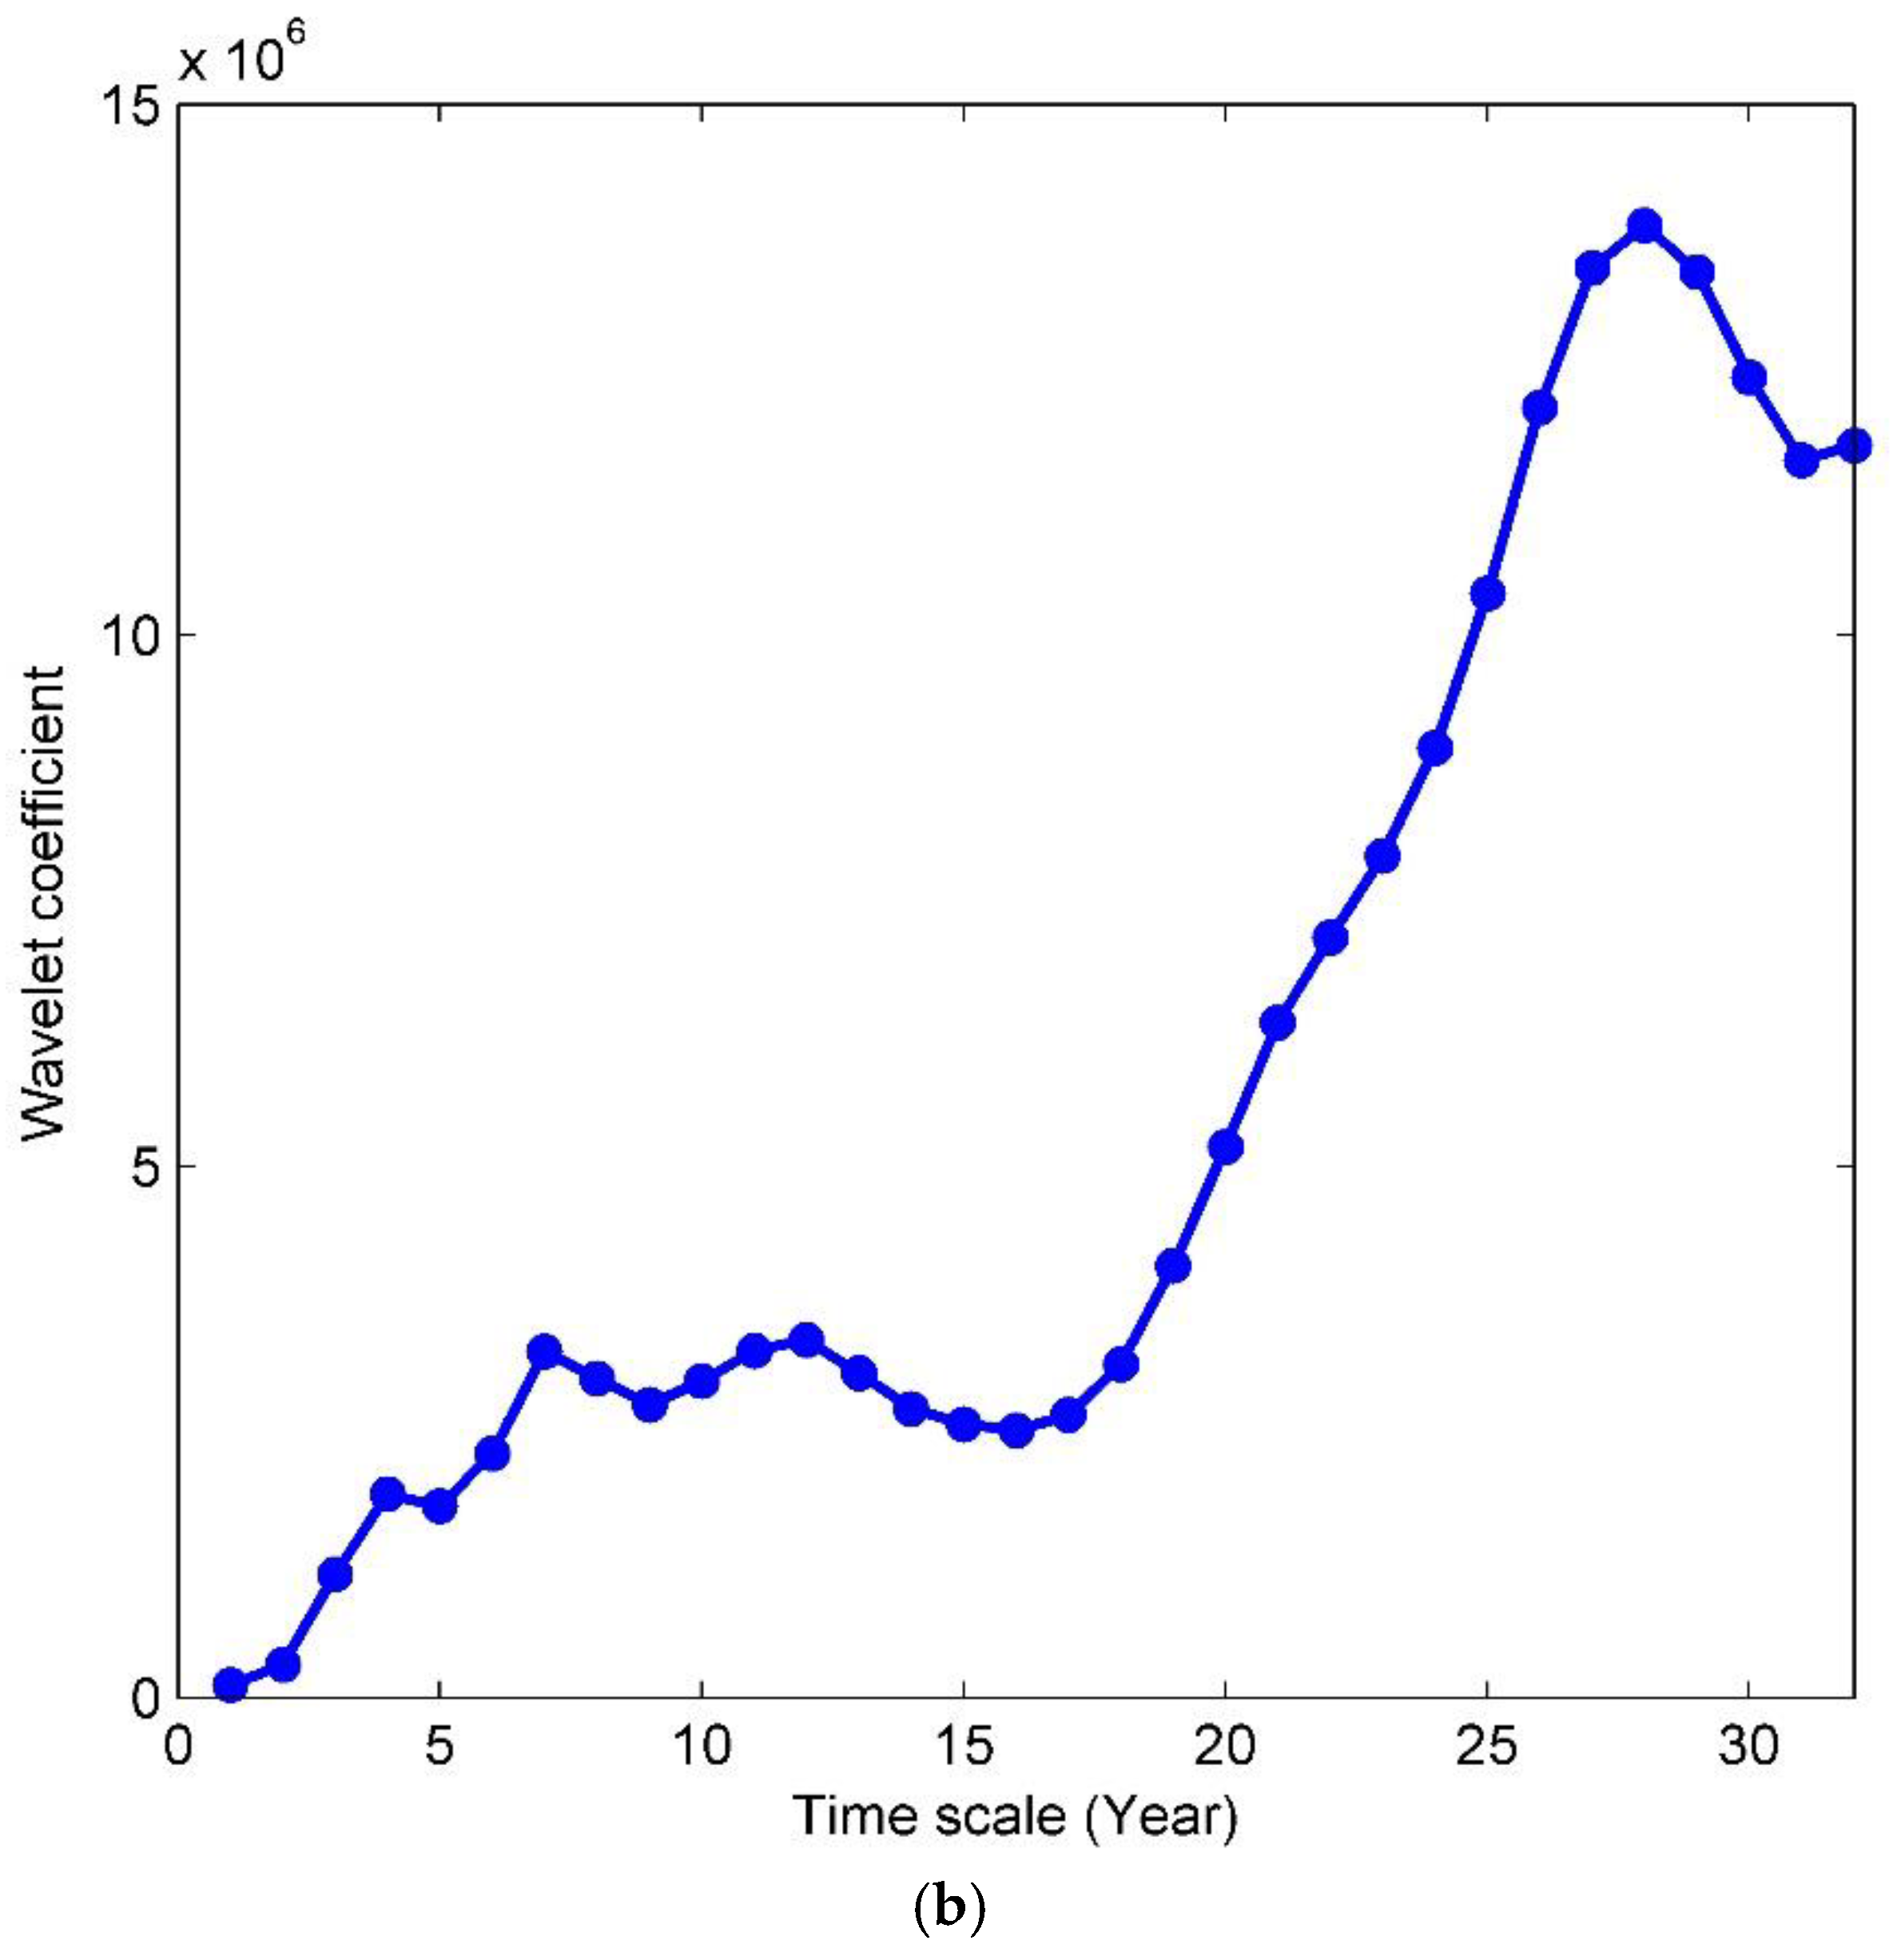
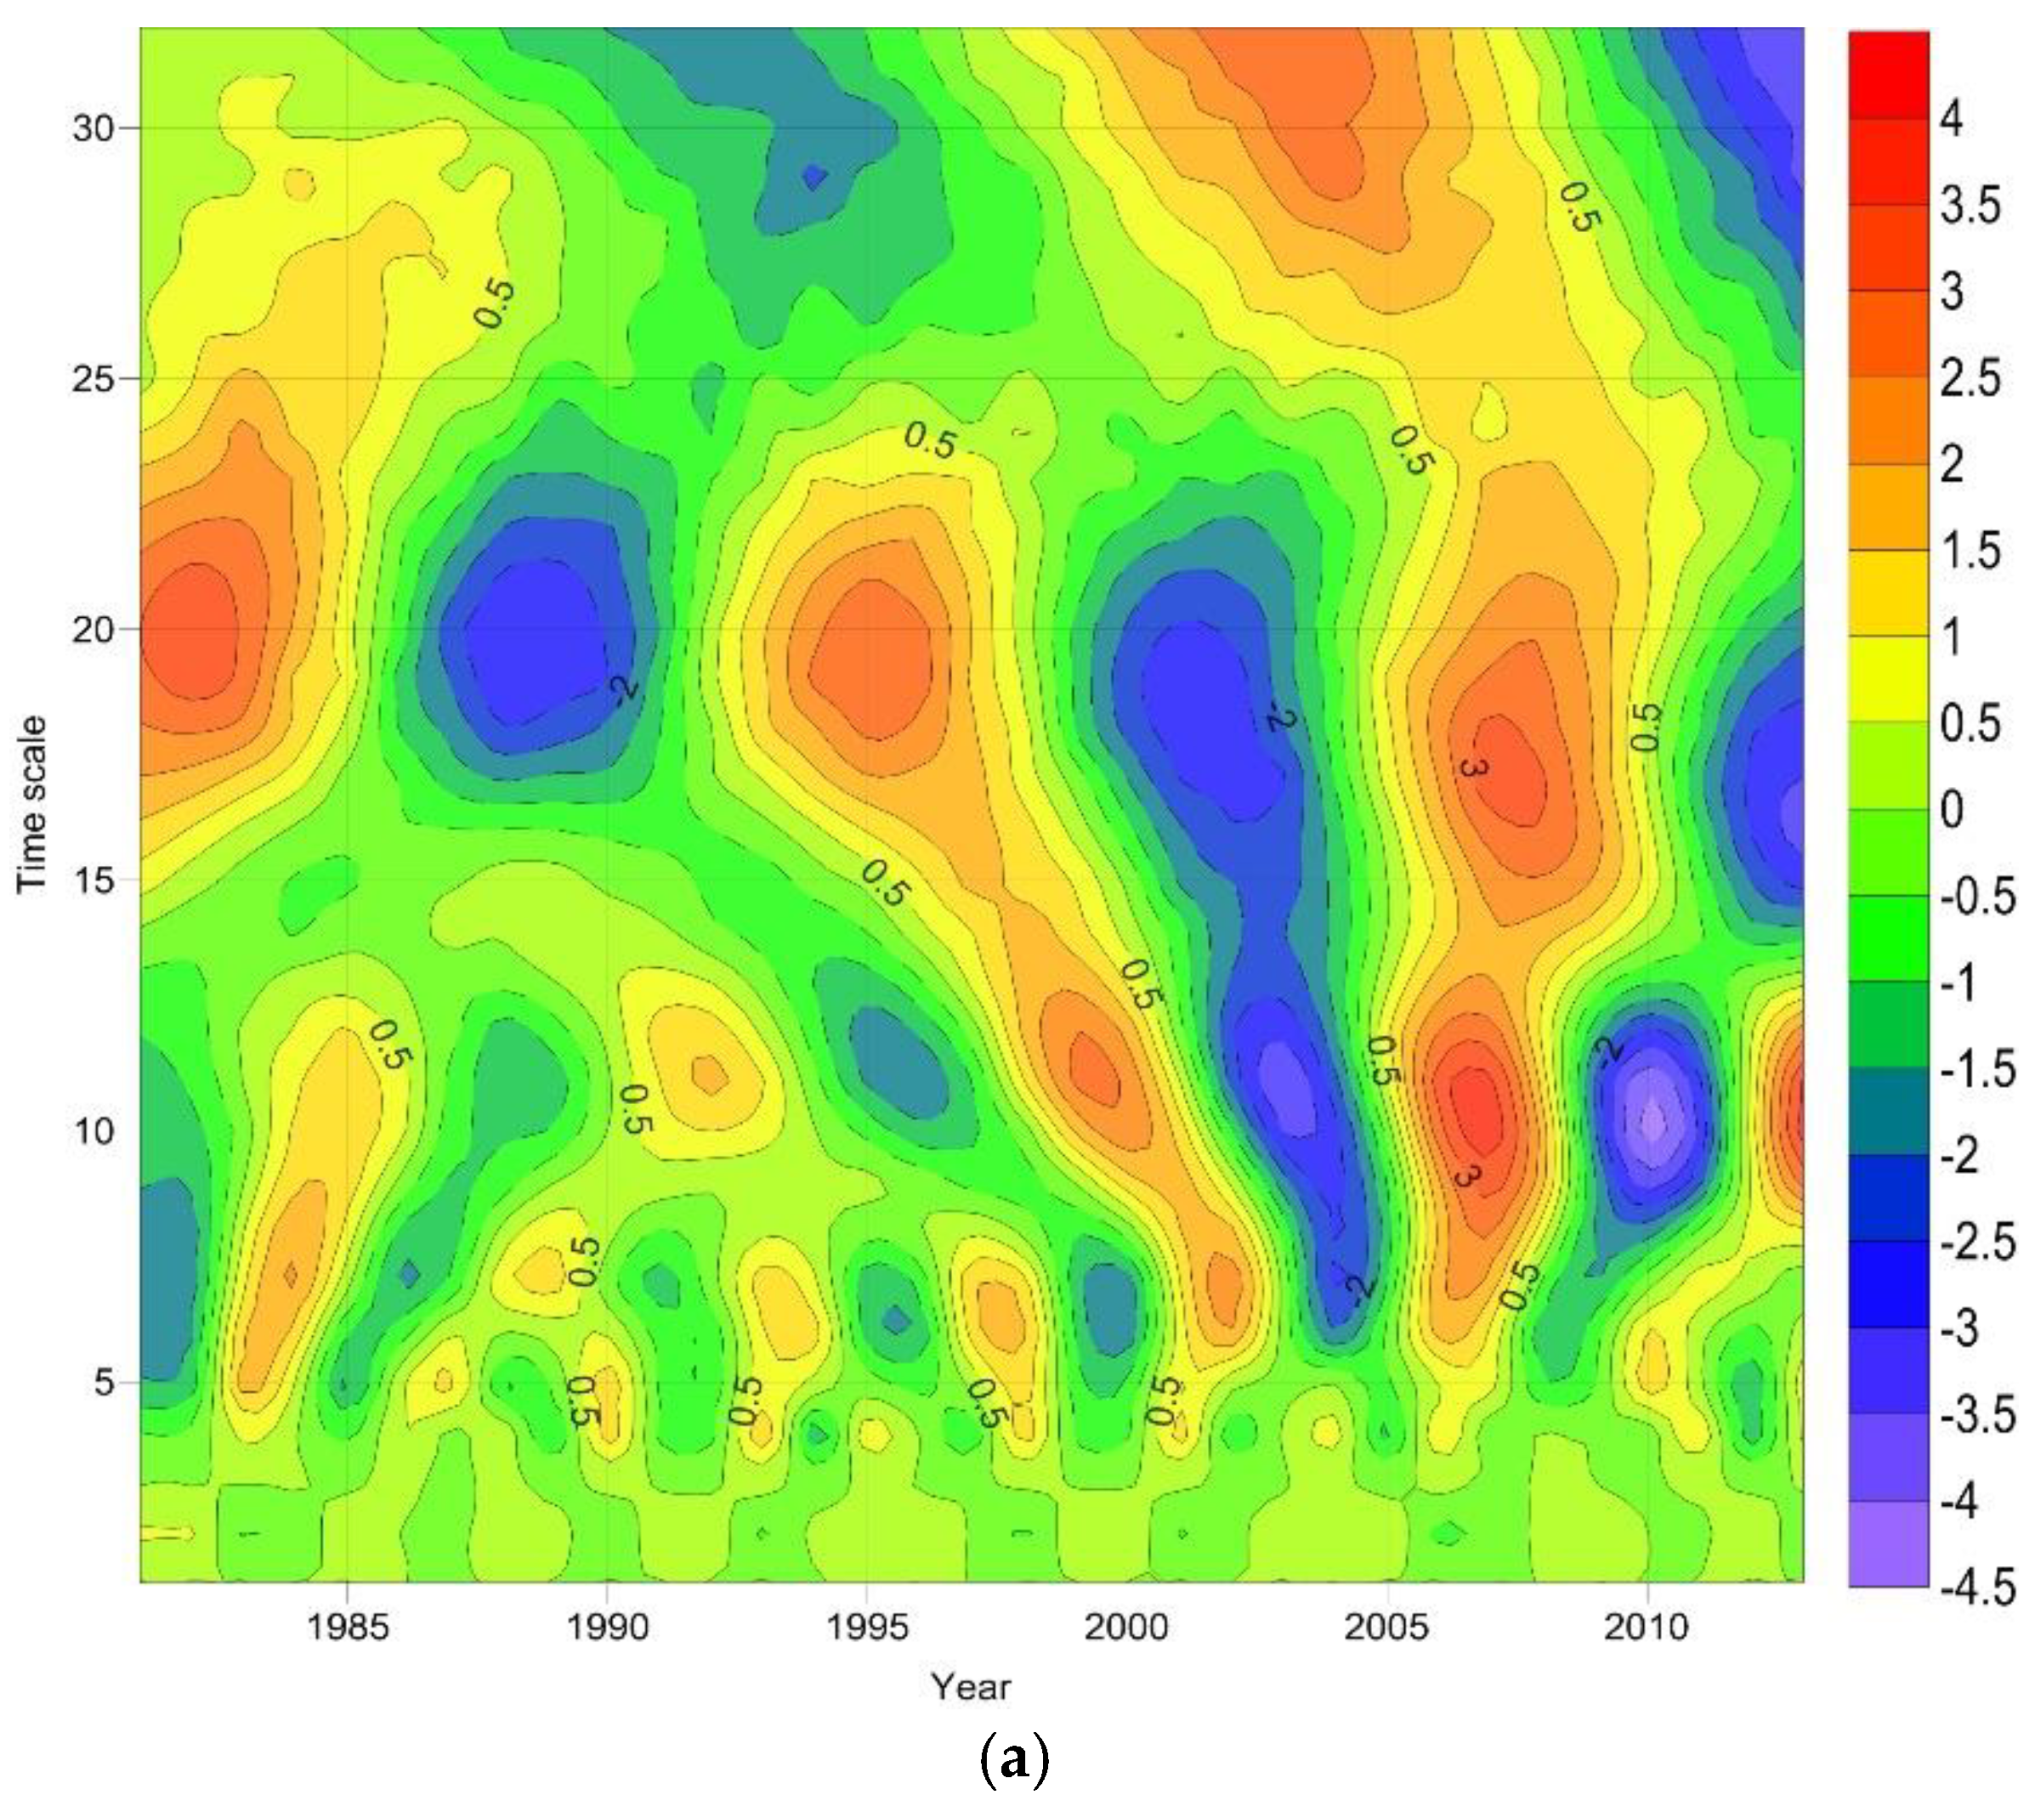
The wavelet variance change curve of the time series (Figure 7) shows that the annual precipitation is apparently periodic. The primary periods of the annual precipitation include 7a, 9a, 13a, and 28a, among which 28a is the first (primary) period. As shown in Figure 7, the positive/negative phase time oscillation on the 28a scale is the most evident, and 28a is the center of oscillation. On this scale, the precipitation has three QPOs with alternating dry and wet seasons at each of the positive phases appearing from 1961 to 1965, from 1975 to 1984, and from 1994 to 2001. The precipitation was on the high side in these periods but exhibit negative phases from 1966 to 1974, from 1985 to 1993, and from 2002 to 2011.
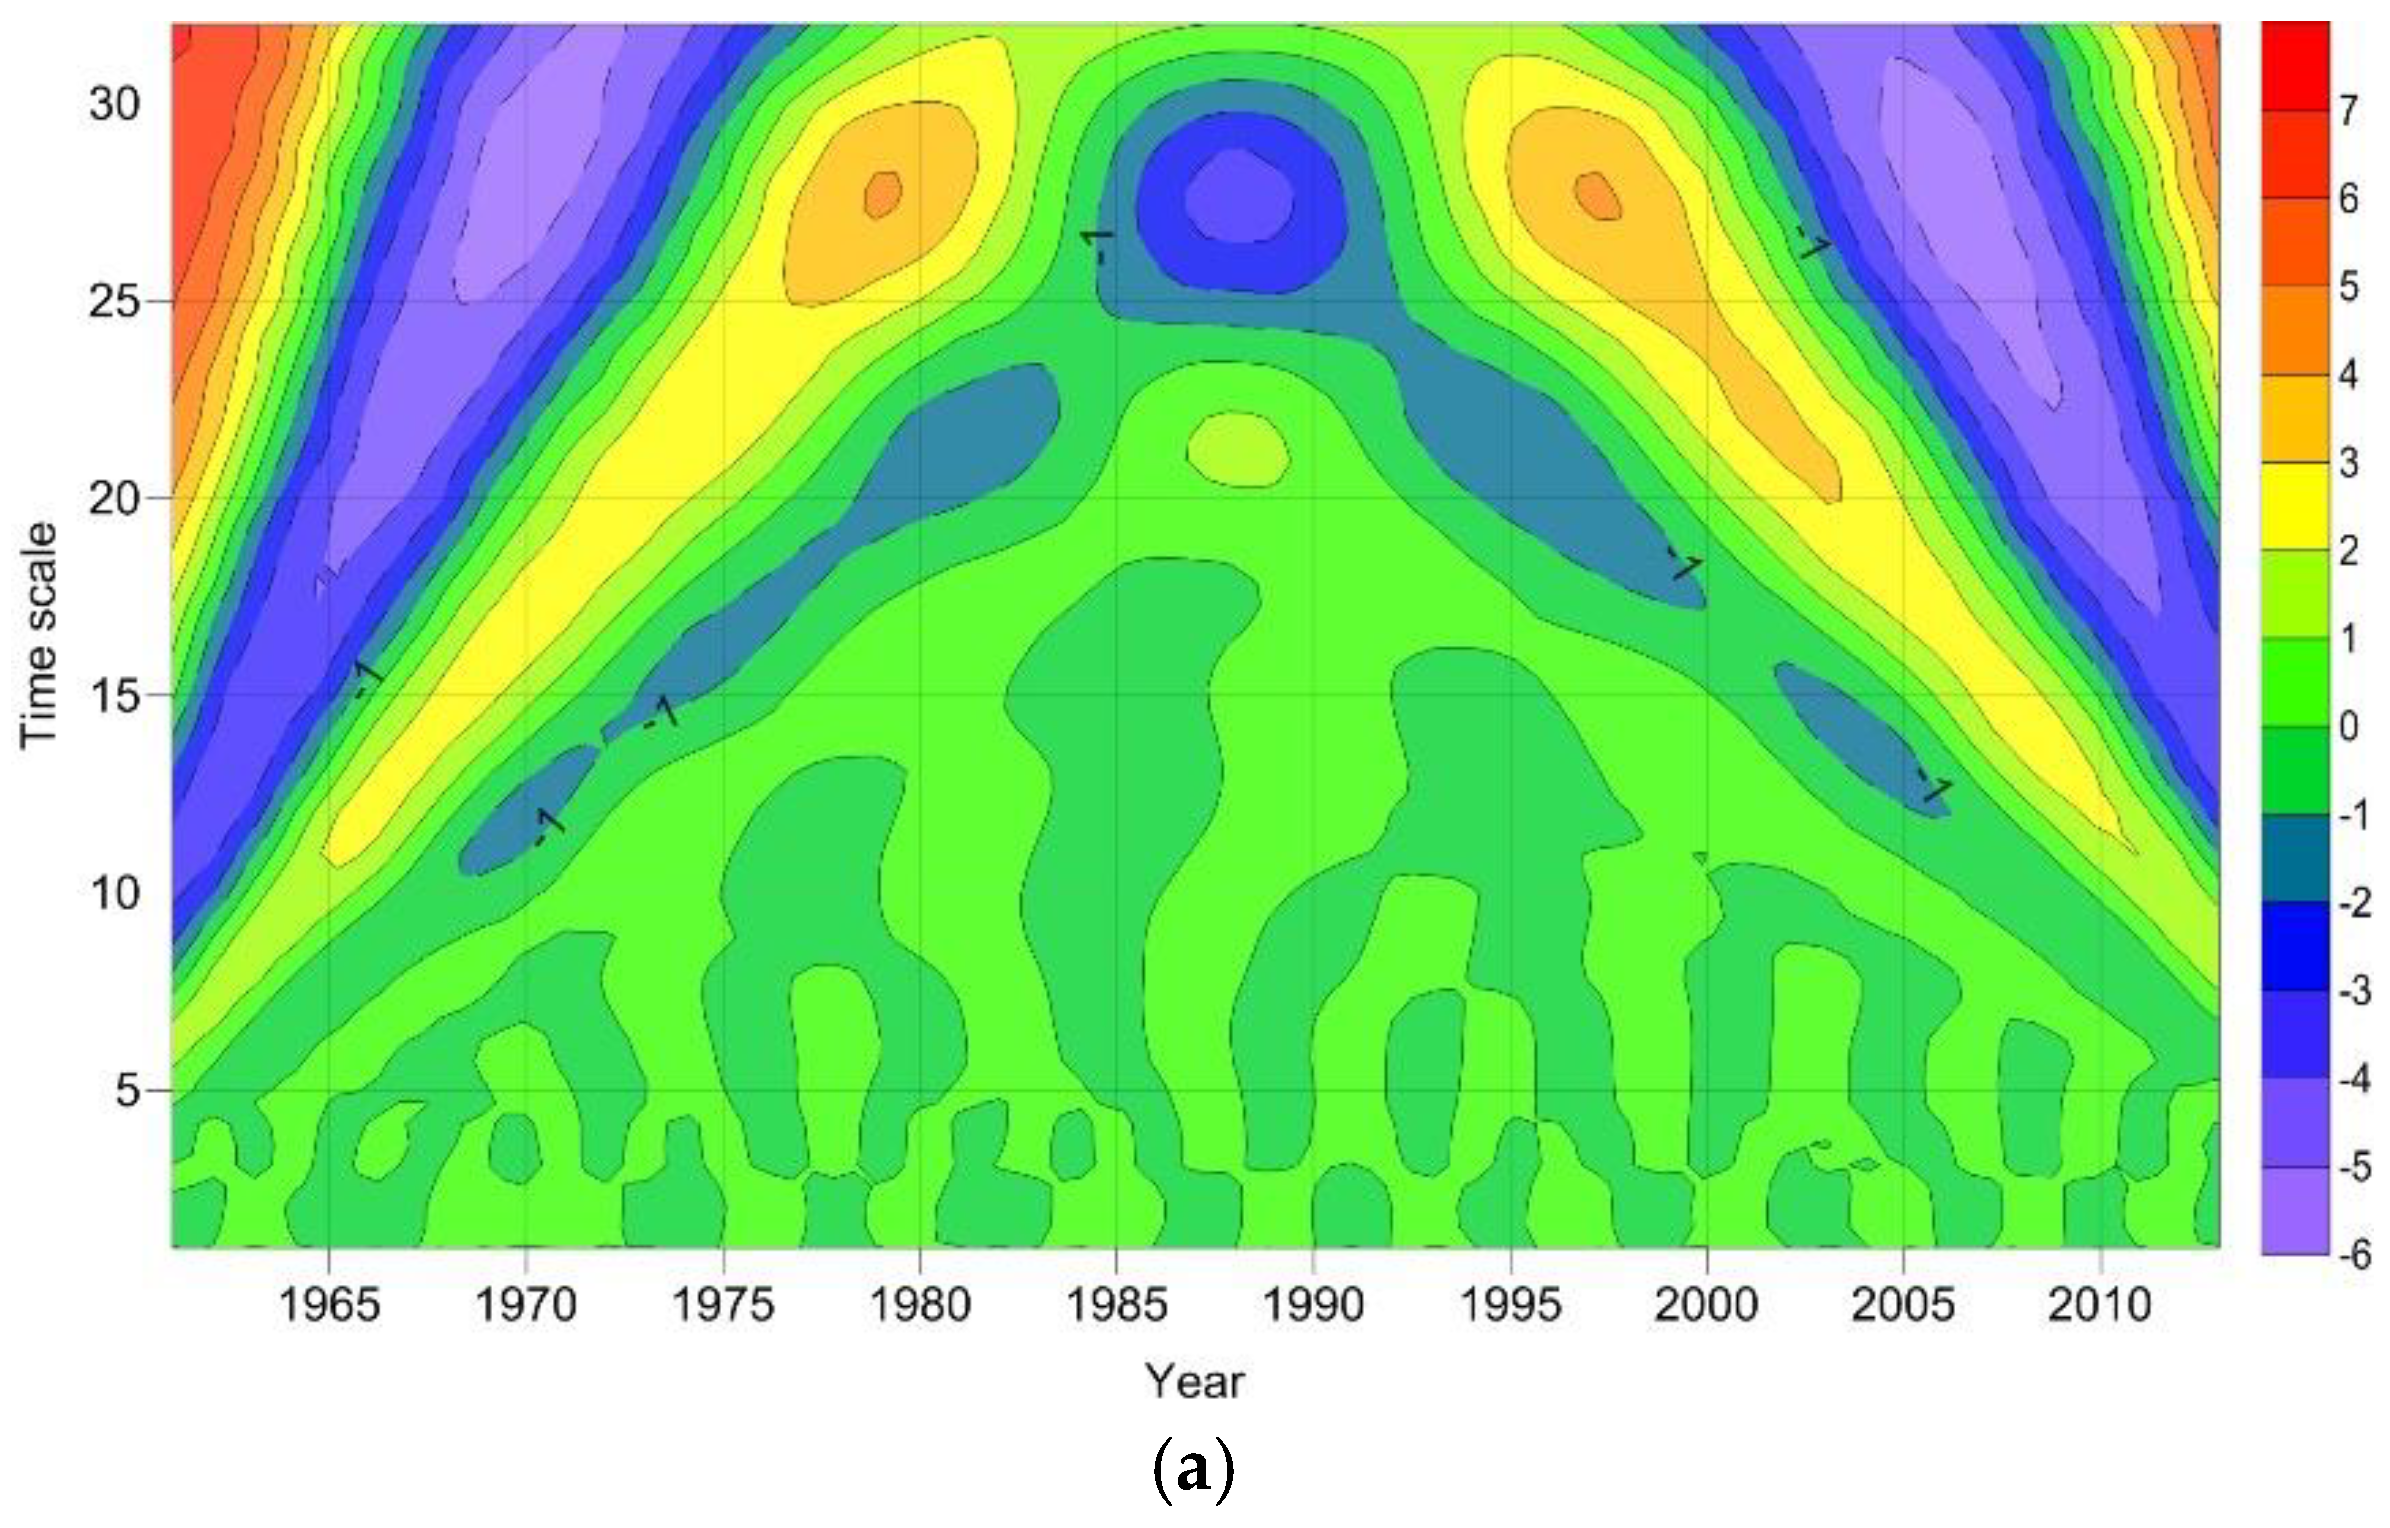
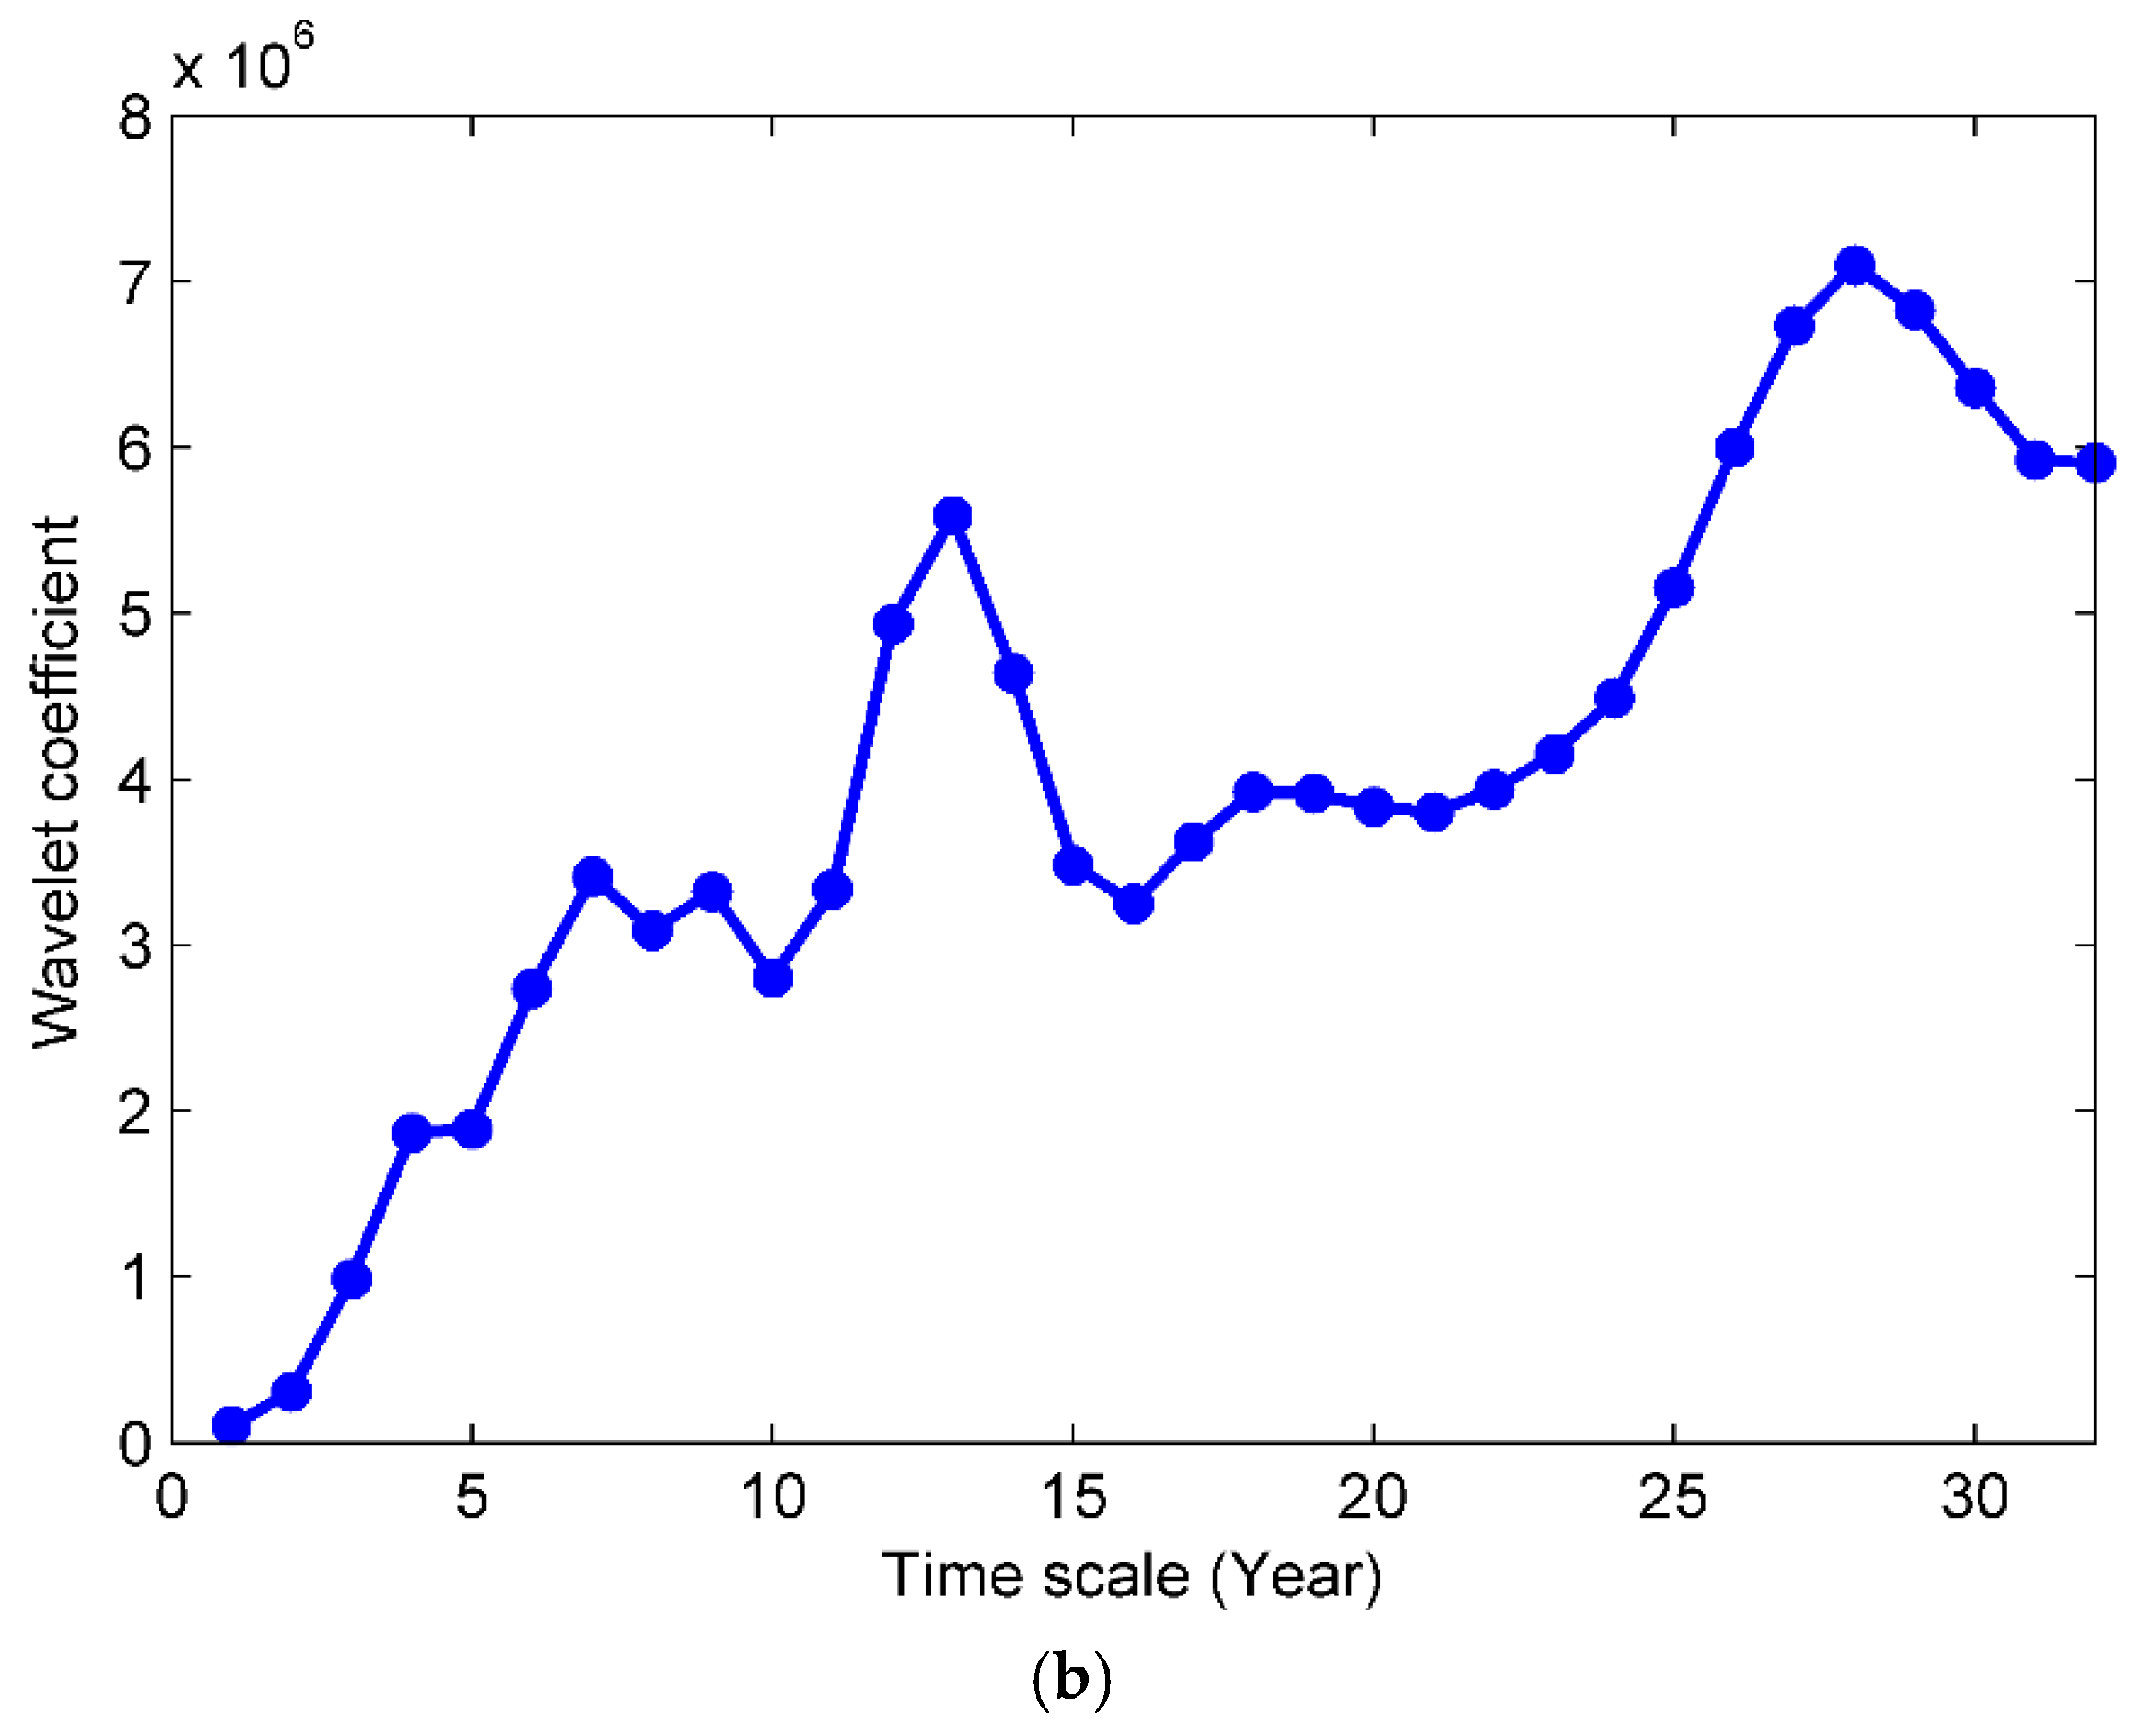
As shown in Figure 7, the precipitation is on the low side. Furthermore, within the 53 years, relatively strong time oscillations occur on the 13a scale. On this scale, the precipitation has six QPOs alternating dry and wet seasons. The wavelet variance change curve of the time series (Figure 8) shows that the annual runoff is prominently periodic. The runoff in the river basin exhibits primary periods of 7a, 11a, and 19a, among which 19a represents the first primary period.
As shown in Figure 8, the positive/negative phase time oscillation on the 11a scale is the most obvious, and 11a is the center of oscillation. On this scale, the runoff has four QPOs with alternating wet and dry seasons. The positive phases appear from 1983 to 1986, from 1991 to 1993, from 1998 to 2002, and from 2006 to 2008, indicating that the runoff is on the high side during these periods. By contrast, the negative phases appear from 1987 to 1990, from 1994 to 1997, from 2003 to 2005, and from 2009 to 2012, indicating that the runoff is on the low side during these periods. Furthermore, a relatively strong time oscillation is evident in 19a, in which the runoff exhibits three QPOs with alternating wet and dry seasons.
3.2. Relationship Between Land Use and Runoff
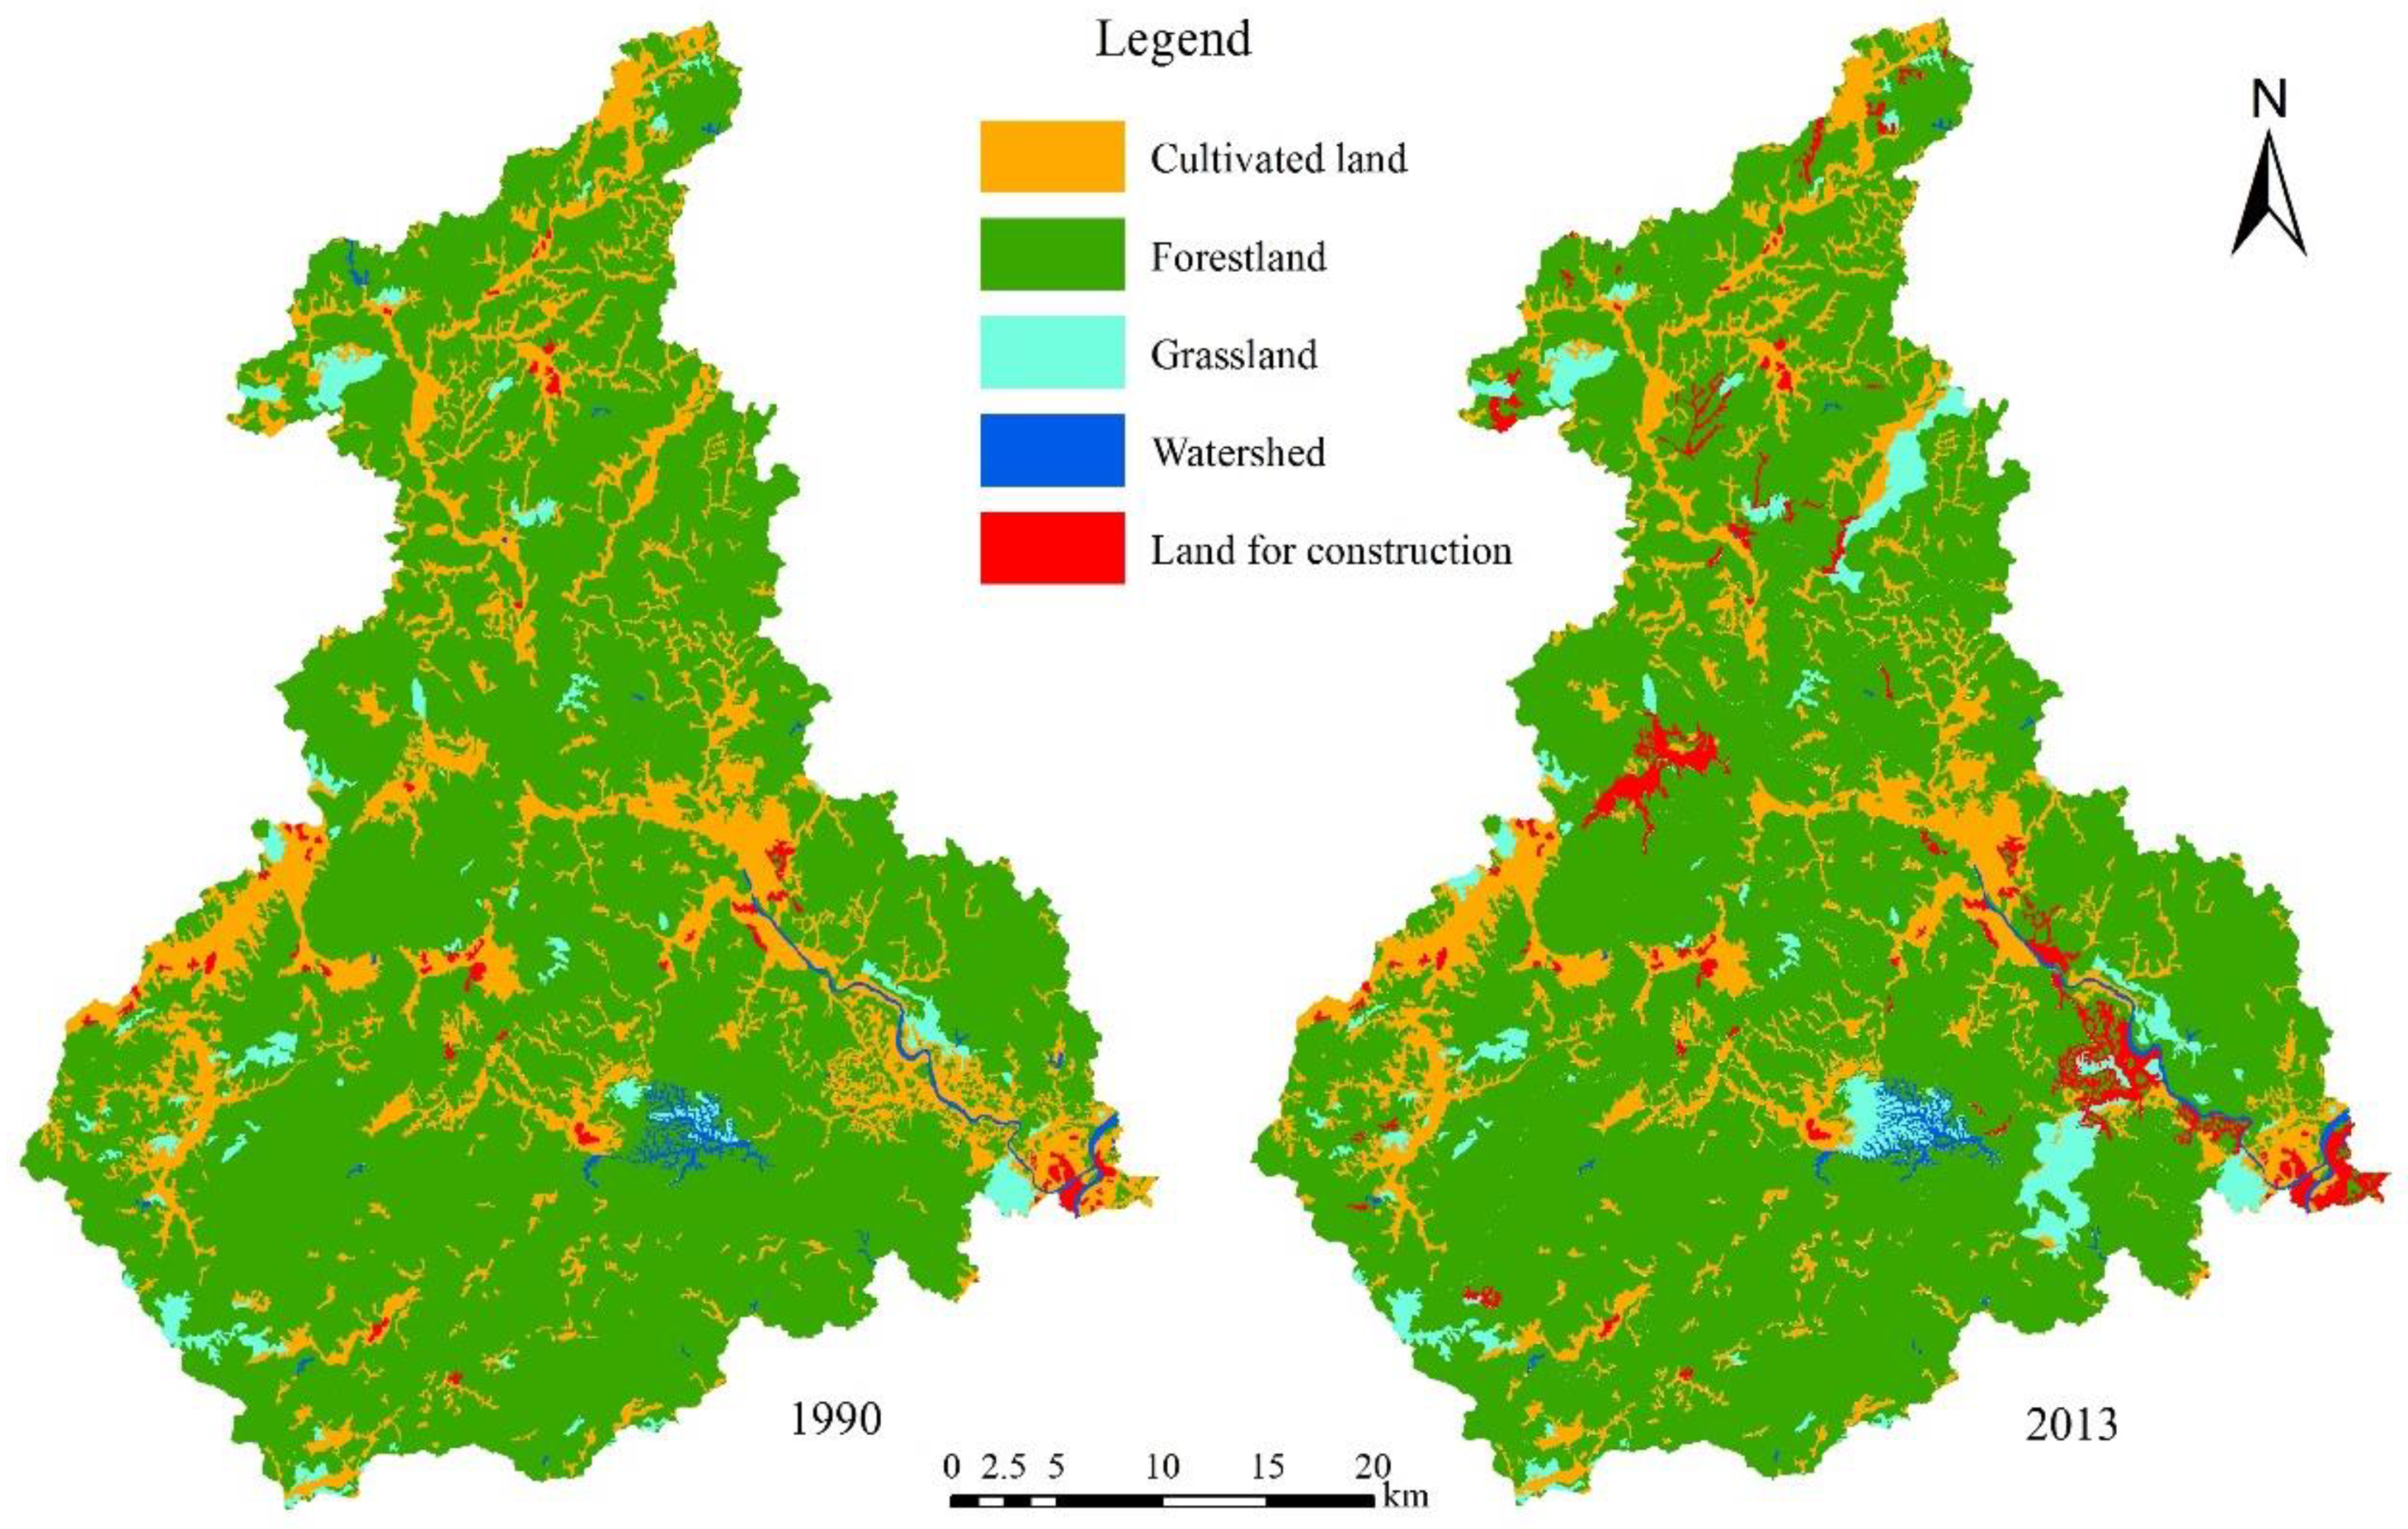
The accuracy of the land-use classification (Table 1) based on the statistical results of the Landsat TM images of the river basin in 1990 and 2013 (Figure 9) exceeds 85%. Based on Table 1, forestland is the predominant land use type in the study area, respectively accounting for 77.32% and 72.18 % of the total land area of the river basin in 1990 and 2013, followed by cultivated land. However, their proportions are declining over time. The proportions of the grassland areas in the two periods are 2.33% and 7.57%, respectively, and they expand more rapidly. Compared with the grassland area in 1990, that in 2013 increases by 224.5%. The proportions of the land areas for construction in 1990 and 2013 account for 2.32% and 9.18%, respectively. From 1990 to 2013, the land area for construction increases by 295.46% and exhibits the highest interannual dynamic change. By contrast, the cultivated land area decreases by 40% within the 23 years and exhibits a discernible downward trend. Both the forestland and watershed areas are reduced, albeit not significantly. The forestland area decreases by 6.67%, and the watershed area decreases by 12.44%. Therefore, the grain-for-green policies have played an active role in regaining forests and grasslands. However, owing to these policies and urbanization, the cultivated land is reduced substantially, whereas the construction land exhibits a remarkable upward trend. The changes in the land use in the river basin show that both the areas of grassland and the construction land have increased, whereas the areas of cultivated land, forestland, and watershed have decreased.
The transition matrices in Table 2 and Table 3 show the probabilities of transitions between different land-use types. These matrices are designed to characterize the changes in the structure and characteristics of the different land-use types and the directions of land-use transitions to distinguish the changing primary and secondary land types clearly and to analyze and explain the reasons for the land-use transitions. As shown in Table 2 and Table 3, the land-use transitions in the river basin are as follows: forestland to cultivated land, cultivated land to forestland, cultivated land to grassland, forestland to grassland, cultivated land to construction land, and forestland to construction land.
The matrix of land-use transition from 1990 to 2013 in Table 2 shows that the increase in the area of cultivated land is mainly contributed by the forestland. The reduced part of cultivated land involved a total area of 210 km2 and mainly transfer to the forestland, construction land, and grassland. The 106.85 km2 increase in the area of forestland mainly comes from cultivated land. The reduced part of forestland mainly transferred to cultivated land, grassland, and construction land. An increase of 124.77 km2 in the area of grassland is from cultivated land and forestland, and the reduced part of grassland mainly transferred to the forest land. The increase in the area of the watershed is primarily from the forestland and the cultivated land.
The increase in the area of the construction land is primarily contributed by the cultivated land and the forestland. On the 23a scale, the cultivated land and forestland each have a large coverage; thus, they are more actively transformed into other land-use types to a large extent.
3.3. Impacts of Climate Changes and Human Activities on Runoff
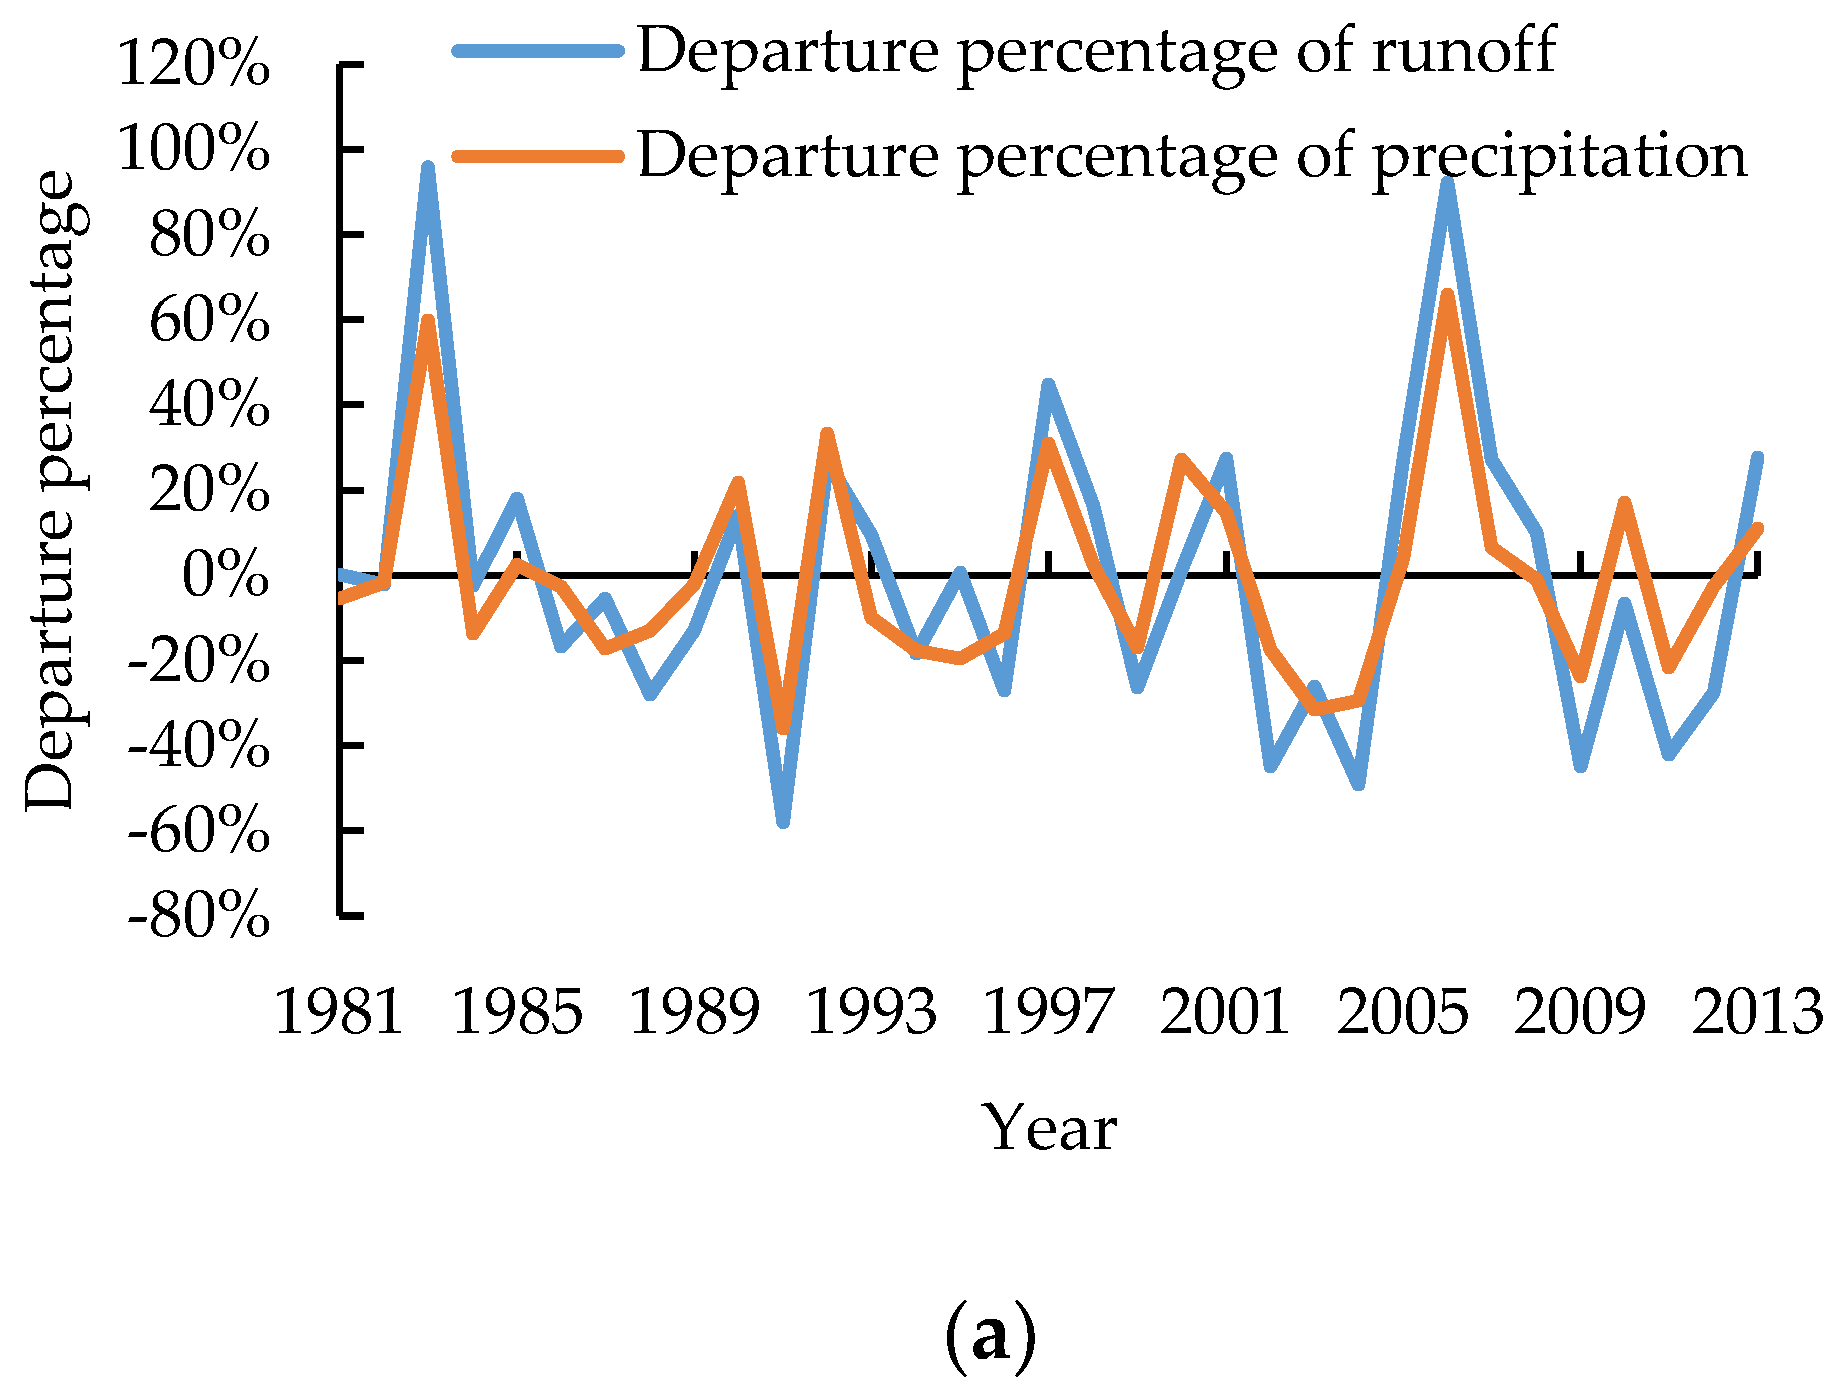
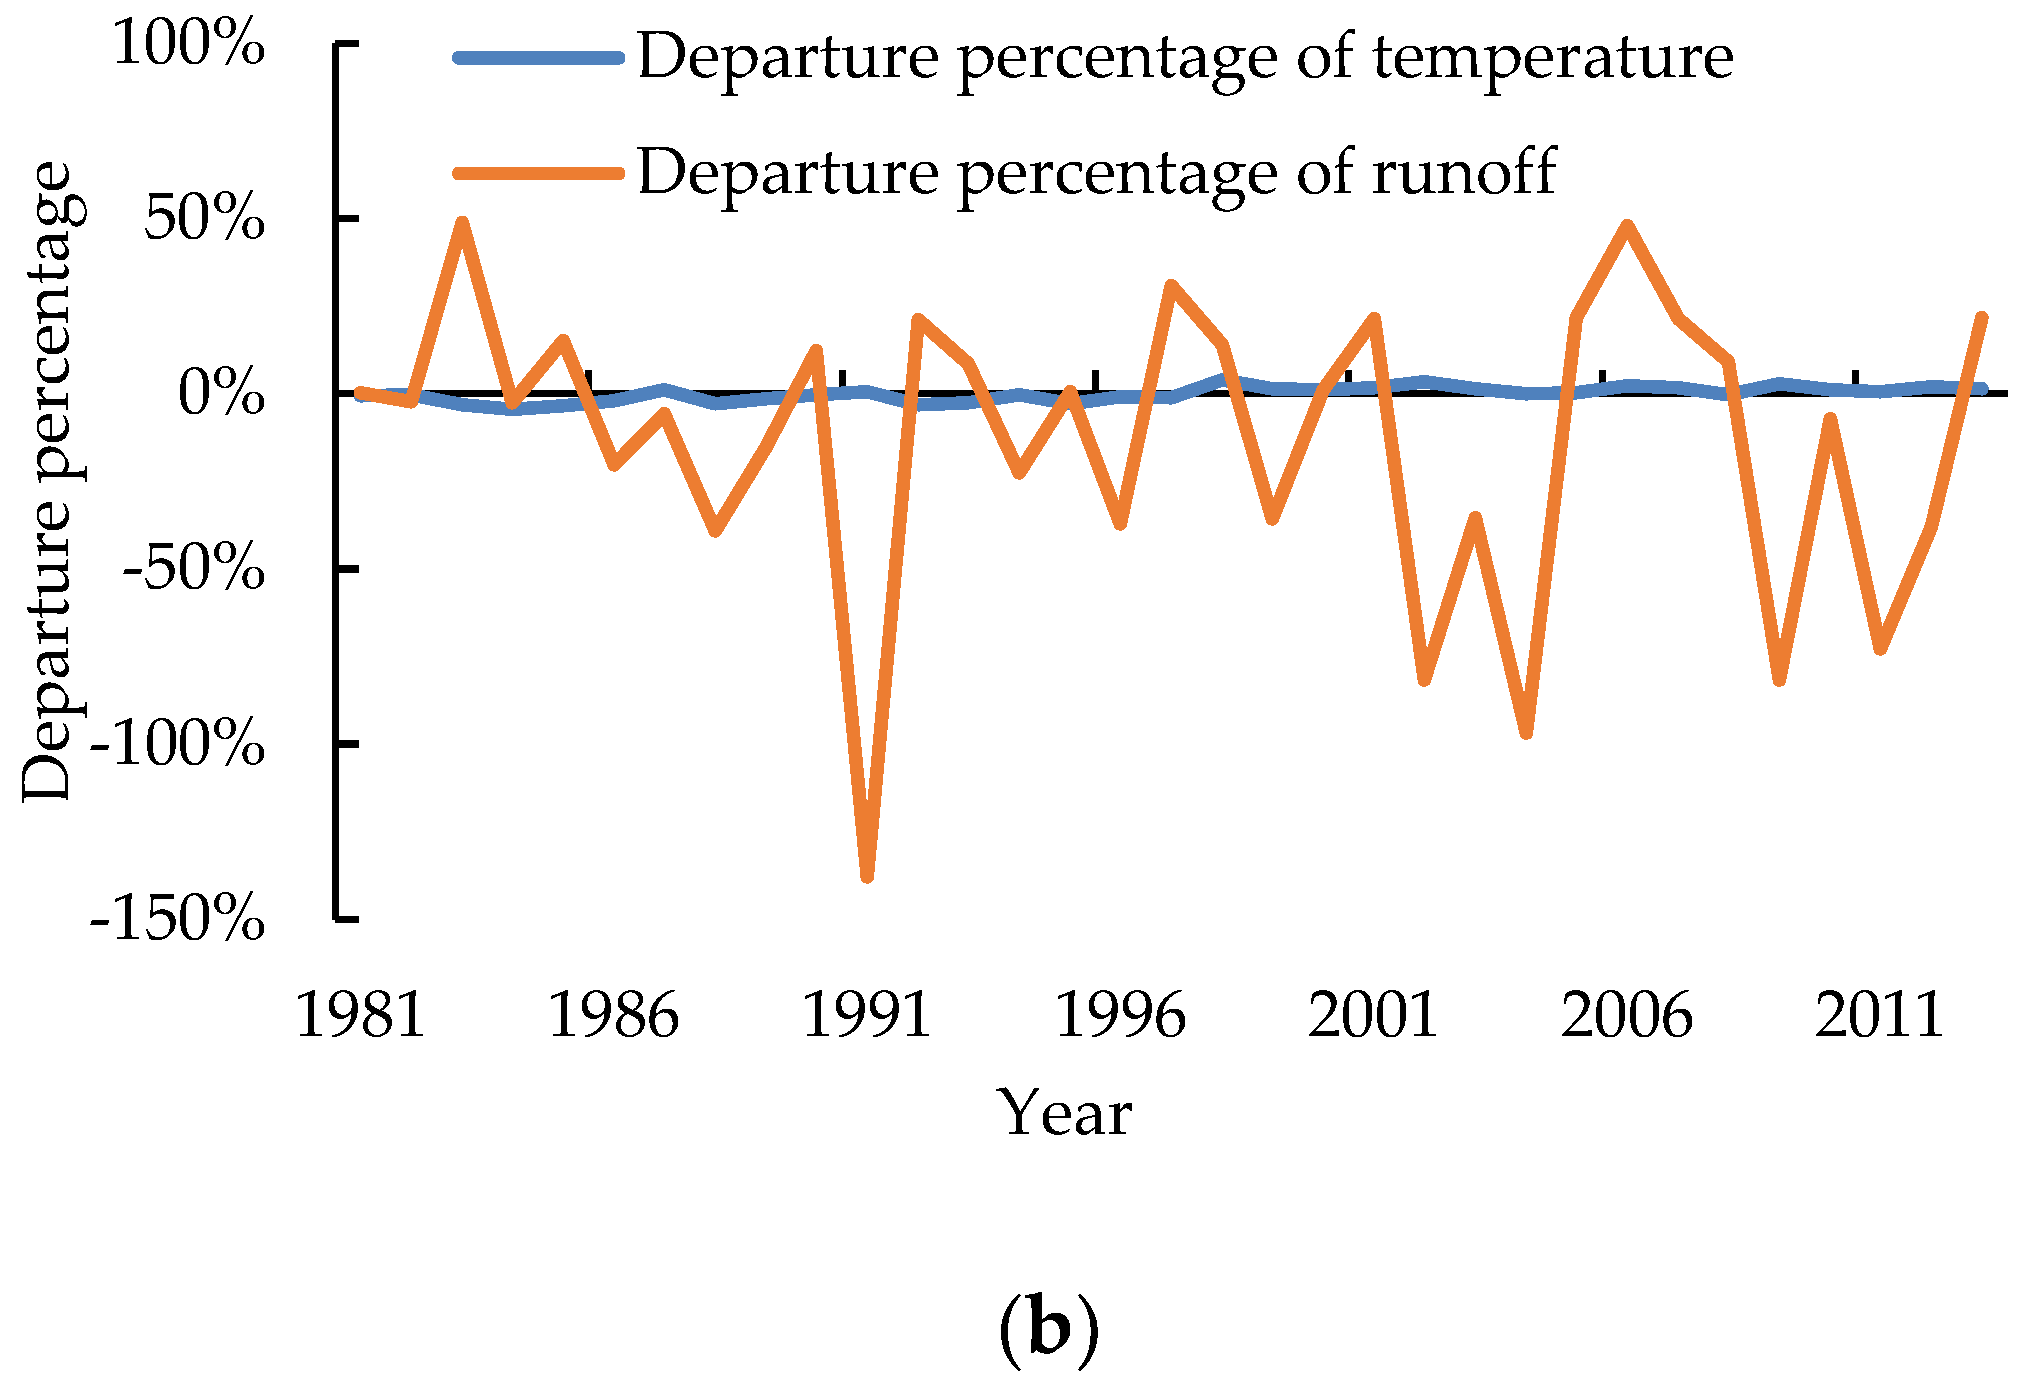
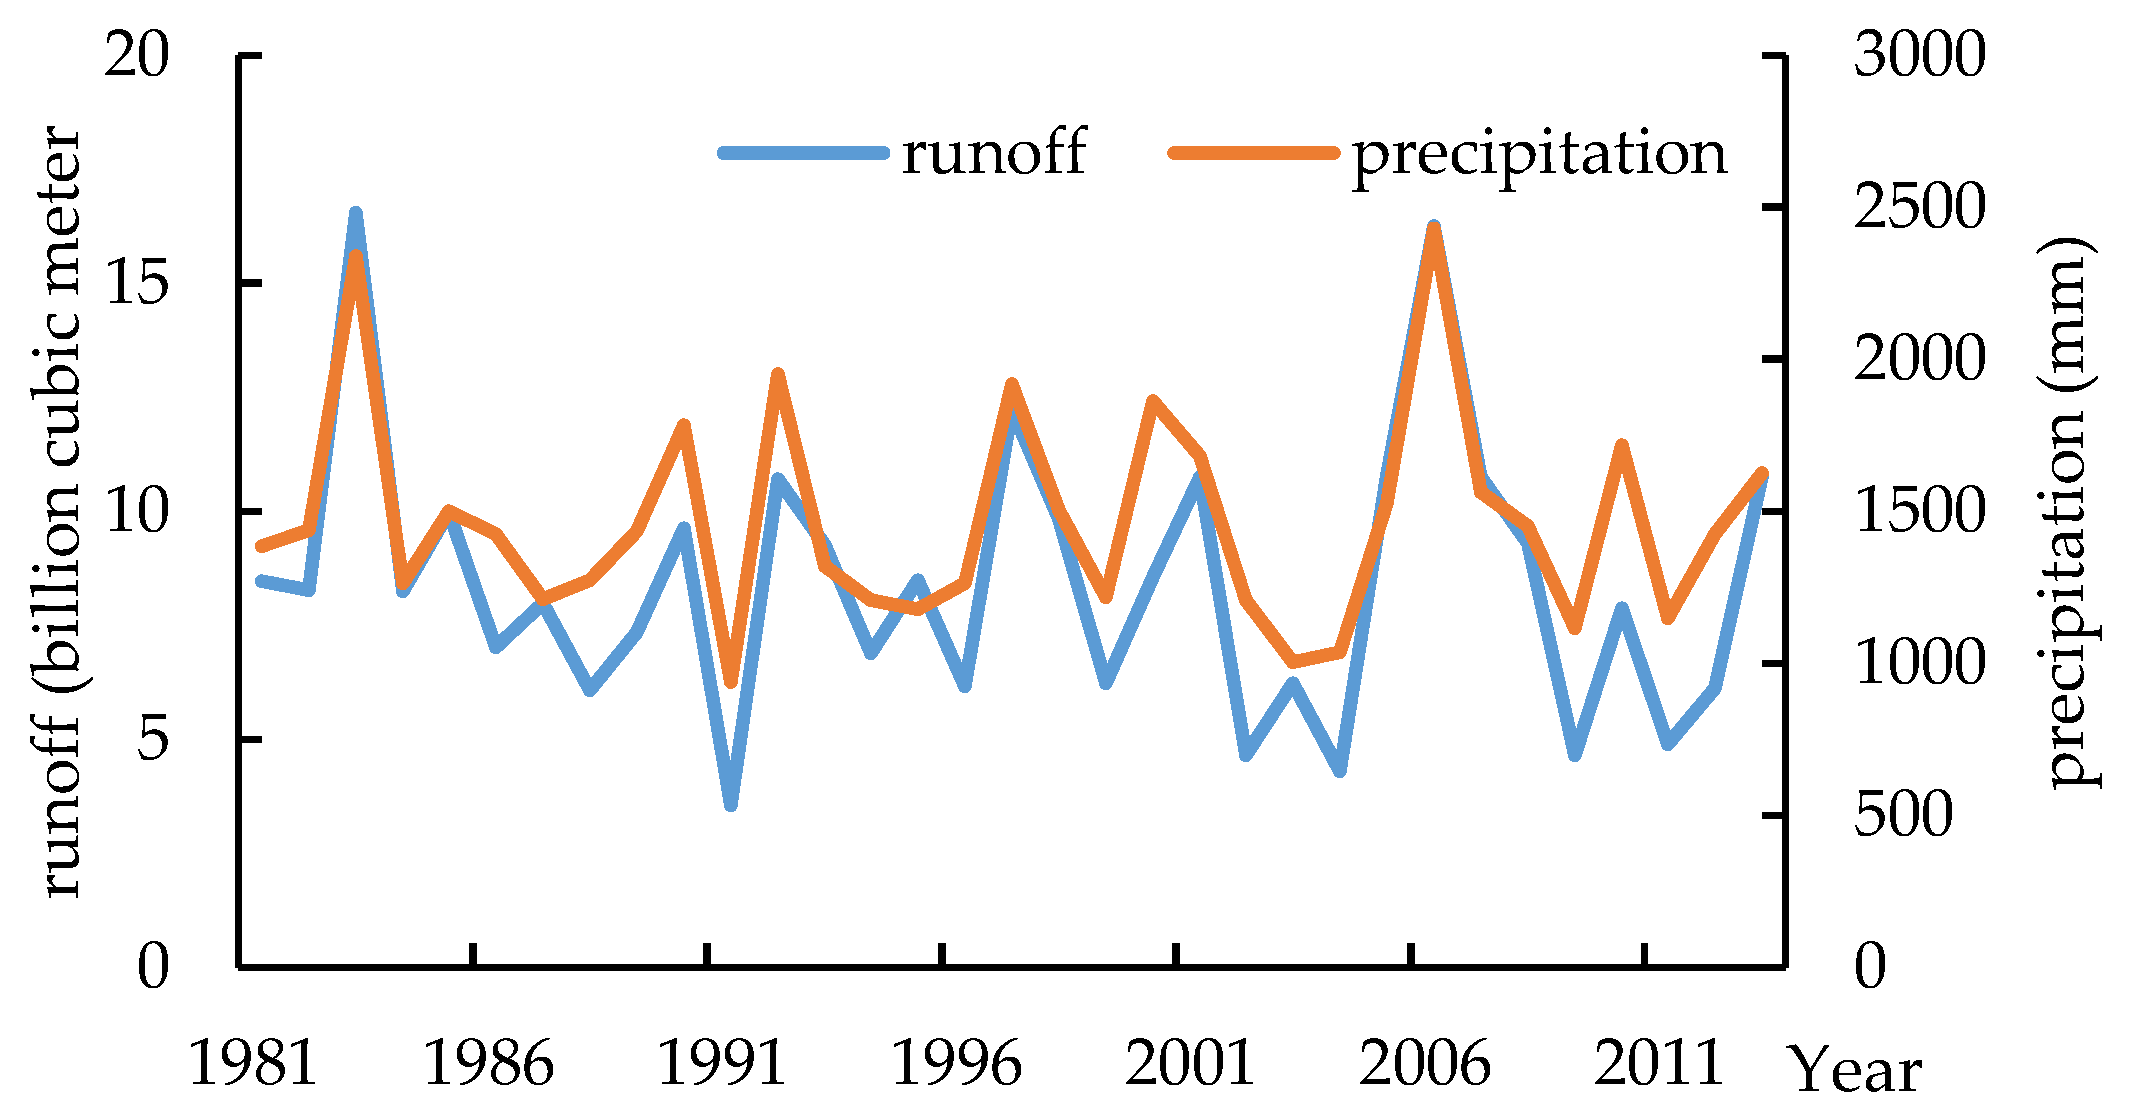
The runoff, temperature, and precipitation curves are plotted based on their departure percentages to examine the relationships between the climate changes and the runoff in the River Basin. As shown in Figure 10, the precipitation in the river basin fluctuates more violently than temperature. From 1981 to 2013, both precipitation and runoff exhibit alternating positive and negative departures, their overall change trends have good correspondence remarkable consistency, and their departure percentages barely change. By contrast, the change trends of temperature and runoff have poor correspondence. Thus, compared with temperature, precipitation determines the runoff.
The runoff in the river basin is under the direct and significant impacts of climatic factors, and it is also affected by human activities. The trend analysis can only qualitatively explain the impacts of climatic factors and human activities (changes in land-use/cover type) on the runoff. Thus, in this section, the LR equation is used to estimate the impacts of precipitation and human activities on the runoff.
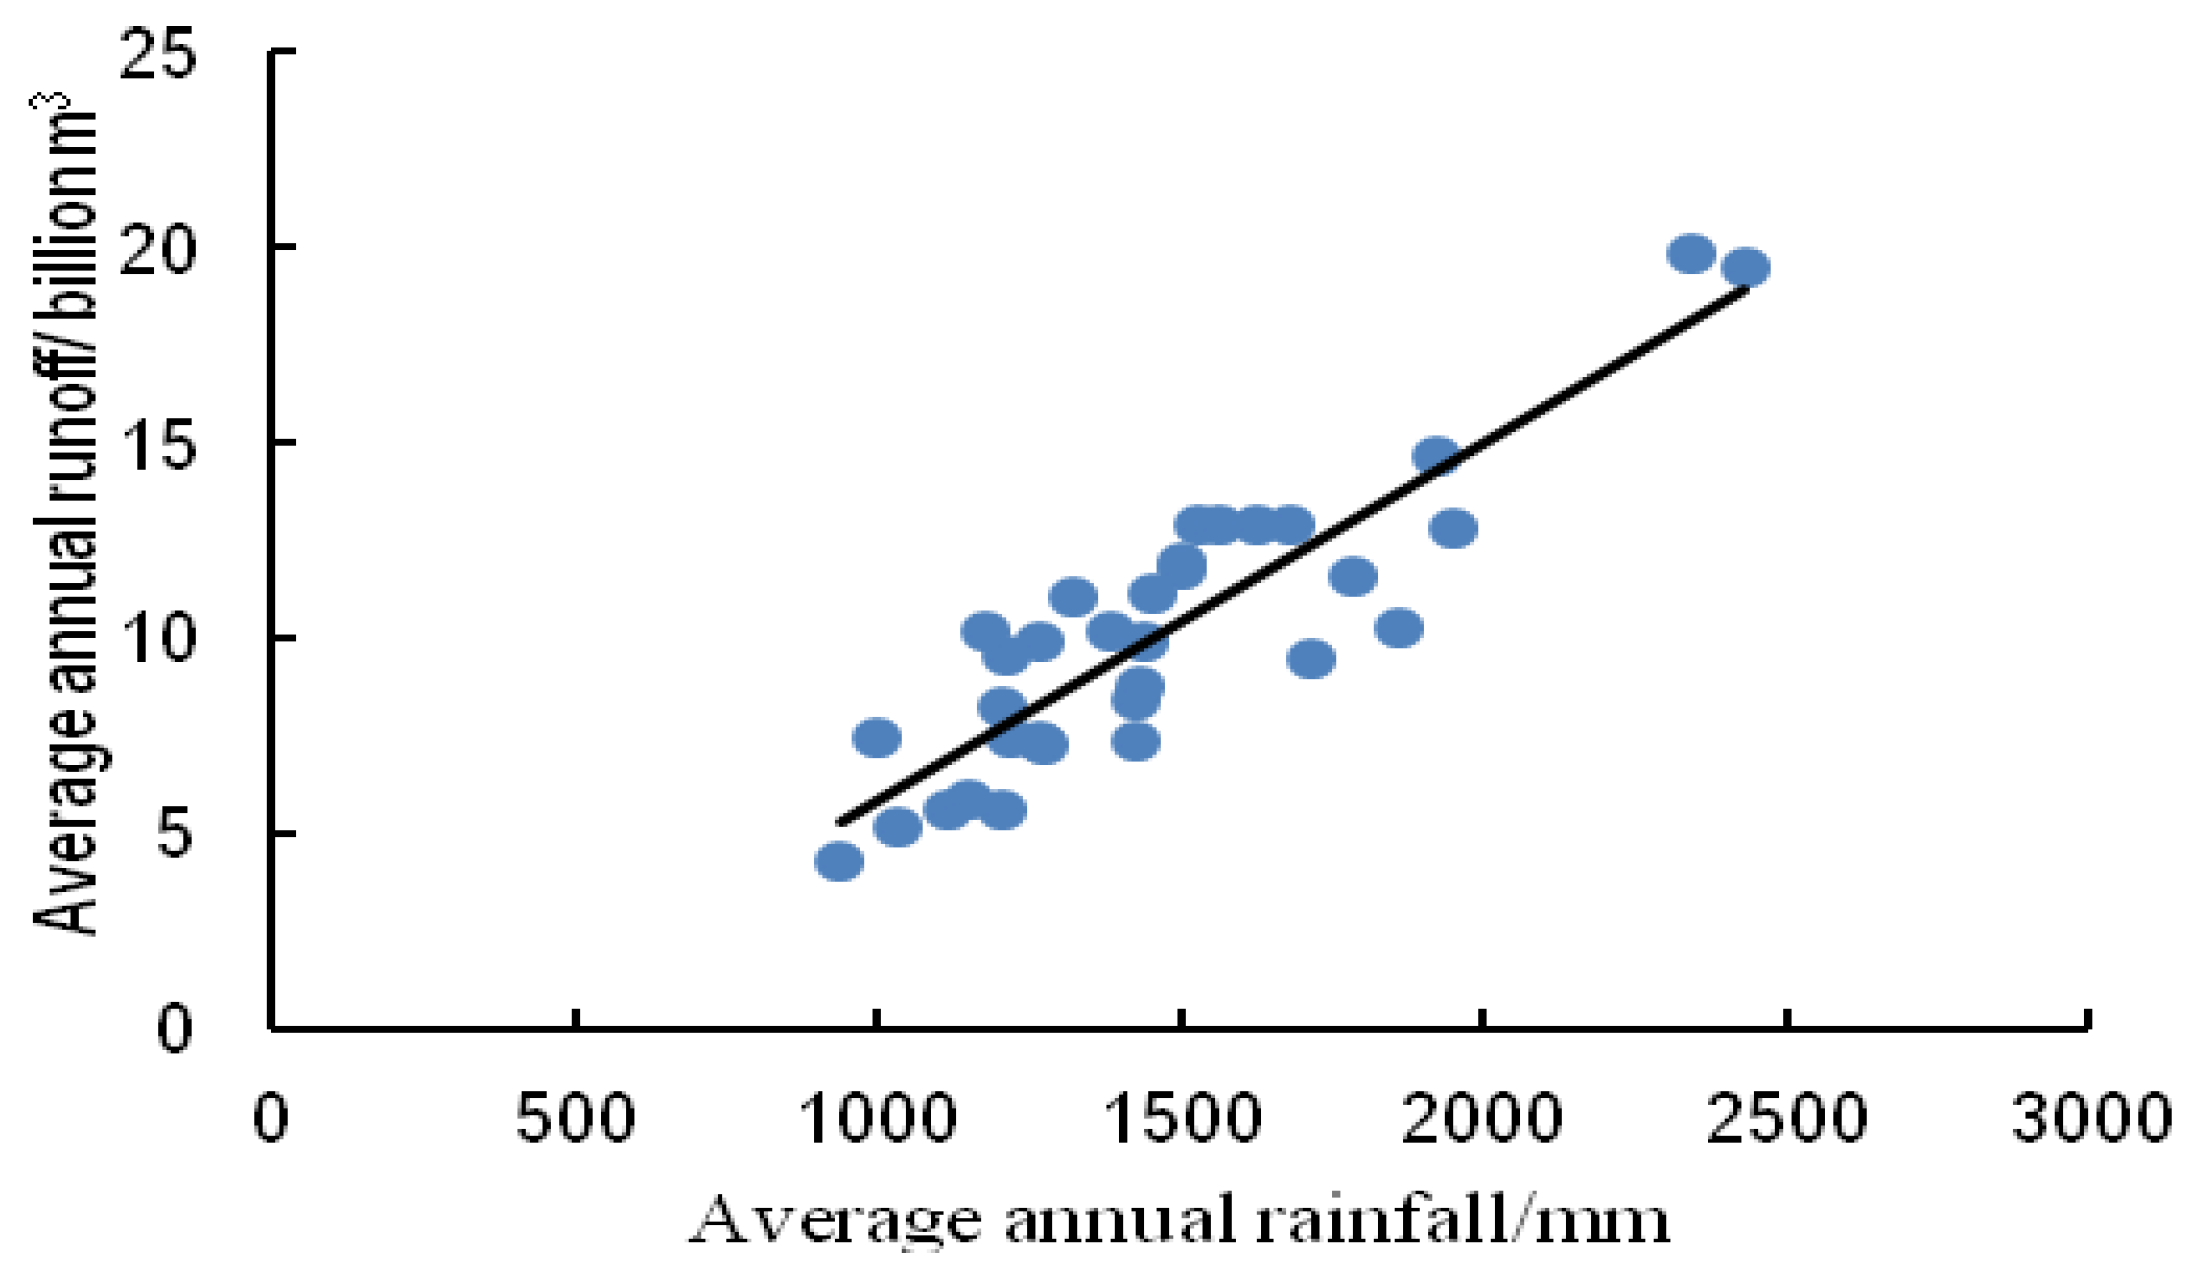
The interannual changes in the 33a precipitation and runoff in the river basin are compared in Figure 11. The annual precipitation is positively associated with the annual runoff, and the runoff confirms that the precipitation is positively associated with the runoff, demonstrating a correlation coefficient of r = 0.885 (Figure 12).
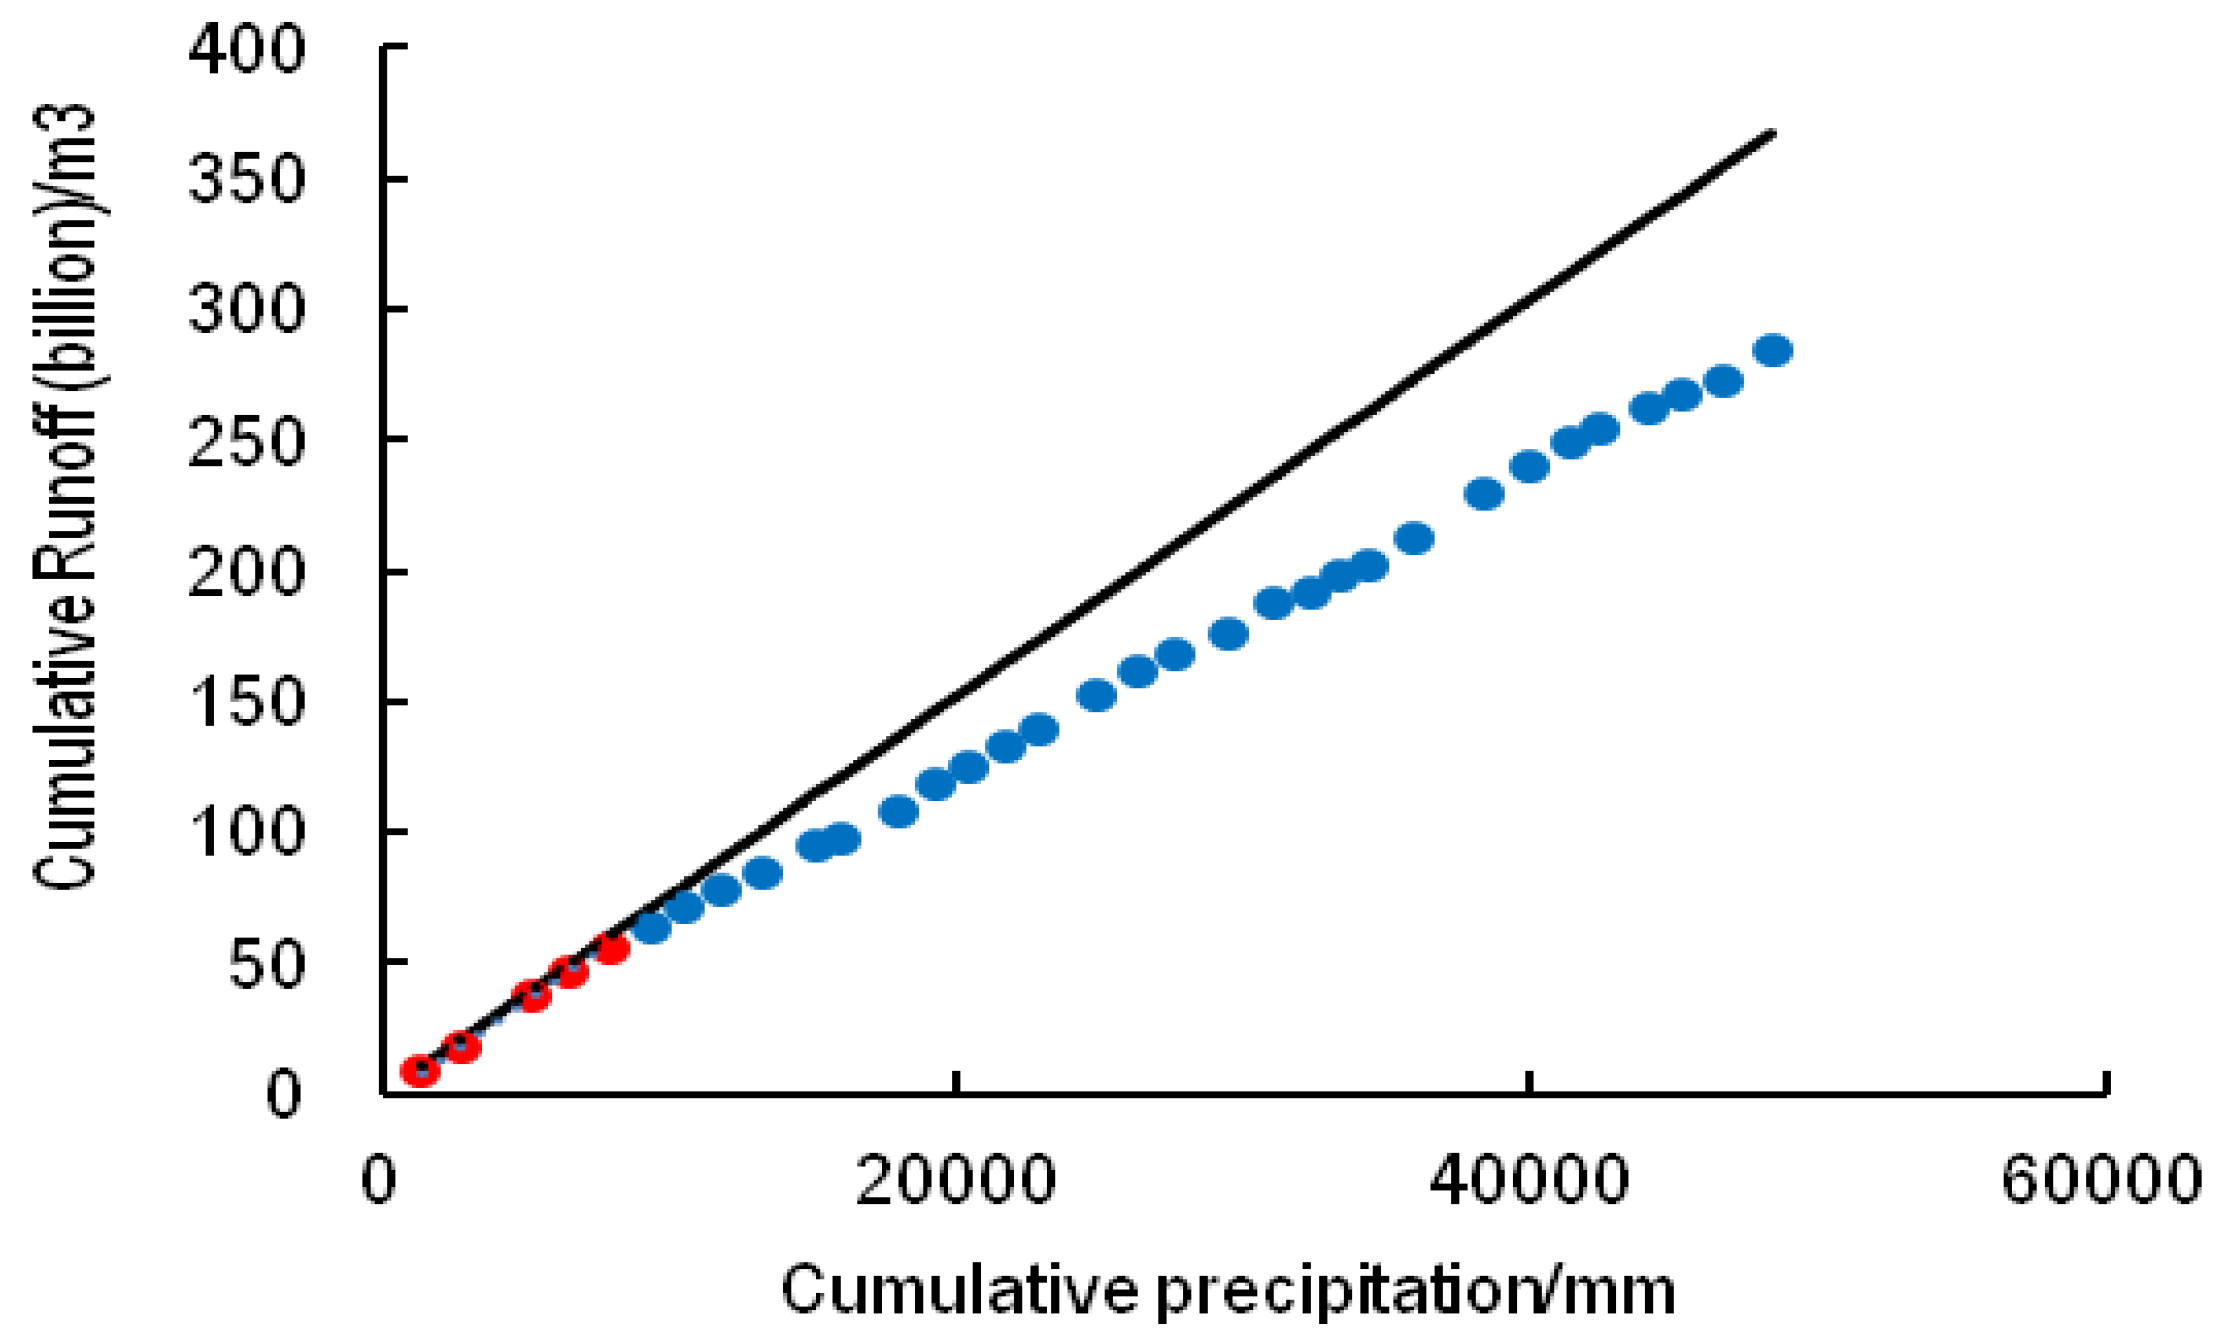
The points in the plotted precipitation–runoff DMC are observed, and the curve is divided into the reference period and the change period by the cutoff point. Subsequently, the impacts of precipitation and human activities on the runoff in the River Basin are analyzed. As shown in Figure 13, the precipitation–runoff DMC initially deviated from its trajectory in 1986. Therefore, the reference period is determined to be the period from 1981 to 1985. Based on the annual precipitation and runoff from 1981 to 1985, the following expression is established by regression analysis where P is cumulative sequences and R is cumulative runoff sequences:
By plotting the precipitation–runoff curve in the reference period, a linear correlation equation is obtained by regression analysis to predict the natural runoff in the change period. The total change in the runoff is obtained by subtracting the measured average runoff in the change period from that in the reference period, and this change includes the impact of human activities and the consequent precipitation changes. The precipitation changes are obtained by subtracting the calculated value of the change period from the measured value of the same period, and the impact of human activities refer to the runoff changes in the change period after the precipitation changes are deducted. As shown in Table 4, within the change period, the impact of human activities on runoff reduction is the most notable, accounting for approximately 85.8% of the reduction. Under the combined impacts of precipitation and human activities, the average annual runoff reductions in the River Basin in the late 1980s, 1990s, 2000s, and from 2010 to 2013 are 0.315, 0.198, 0.165, and 0.285 billion m3, respectively. The percentages of human activities in each of these periods are 85.7%, 81.3%, 63%, and 75.8%, respectively. Under the combined impacts of precipitation and human activities, the average annual runoff reduction in the River Basin within the change period is 0.183 billion m3, of which precipitation accounts for 14.2% and human activities contribute 85.8%.
4. Discussion
There are several important characteristics in the climate change, and the spatiotemporal variation characteristics of land use and their contributions to runoff reduction in Wuhua River Basin.
We found that the distribution of precipitation in the Wuhua River Basin is uneven during the year, mainly concentrated in April to September, accounting for about 75% of the total annual precipitation. The monthly precipitation mainly occurs in May and June. This might be because the Wuhua River is located in the south of the Wuling Mountains, which is affected by the warm and humid air currents of the ocean and it belongs to the typical subtropical monsoon humid climate, also is the transition zone between the southern subtropical zone and the mid-subtropical climate zone.
The results of land use analysis show that significant land use changes have occurred in the Wuhua River Basin, mainly represented by the two-way conversion of other land types and forest land and cultivated land. Changes in land use and cover are influenced by natural factors and human activities, and population is one of the most dynamic drivers of land use change. In the past 60 years, the population of the Wuhua River Basin has experienced rapid changes. The total population has increased from 450,000 in 1949 to 1.33 million in 2015, with a net increase of 880,000 over 60 years. On the one hand, the demand for agricultural products indirectly affects the changes in the spatial distribution of land use, and on the other hand, the growth in demand for residential land and infrastructure land affects the land use pattern.
The effects of human activities is the main factor leading to the reduction of runoff, consistent with the results of Luanhe River [42], Baiyangdian Lake [2] and Chaobai River [25],which are located in Northern China. Also, like most of rivers in China, the impacts of human activities is mainly to reduce annual runoff [43]. However, previous studies have also suggested that the influences of human activities and climate change on runoff are basically equal [28,29], or the synthetica effects of climatic factors is the root cause of runoff change [11]. So, there are significant regional differences in the contribution rate of climate change and human activities to the change of surface runoff between different basins, and in the analysis of river basin water resources, the respective effects of climate change and human activities should be taken into account and considered comprehensively, in order to propose sustainable river basins countermeasures for the coordinated development of water resources.
The analysis and interpretation of the study would have been more useful if more climatic and hydrolic monitoring stations had been available, which would allow for the visualization of long-term change trends in temperature, precipitation and runoff over time. Furthermore, empirical statistical methods have lower requirements on parameters and the results have certain credibility while hydrological model has more requirements on data, and its results are more scientific. How to couple the two methods to improve the accuracy of the contributions of climate change and human activities to the change of surface runoff is the focus of future research.
5. Conclusions
In this study, we analyzed the change trends, discontinuities and periodicities of the temperature, precipitation and runoff in the river basin, also discriminated the impacts of climate change and human activities on surface runoff by using a variety of mathematical statistics methods. The conclusions drawn are as follows:
Firstly, the average annual temperature in the River Basin from 1961 to 2013 shows a noticeable rising trend, with a jump point appearing in 1997 and average annual precipitation shows a slowly rising tendency within the 53 years, while the runoff within the survey period exhibits a pronounced downward trend, and the discontinuity in the runoff begins to reduce from 1986. Secondly, the temperature and precipitation in the river basin has a clear 28a change period while annual runoff changes is on the 19a primary period. The runoff in the river basin is positively correlated with precipitation but negatively correlated with average annual temperature. The runoff has high temporal consistency with precipitation, both of them are mainly concentrated in the period from April to September. Thirdly, the main land-use types in the river basin are forestland, which cumulatively account for about 80% of the total area. The areas of grassland and construction land increase sharply by 224.5% and 295.5%, respectively. Lastly, the quantitative analysis shows that the River Basin is under the combined impacts of precipitation and human activities, human activities contribute to the runoff by 85.8%, and the contribution factor is significantly greater than that of precipitation, indicating human activities are driving factors for the runoff reduction in the river basin. Compared with the 57.8% reduction of sediment transport caused by human activities [44], it suggests the conservation of water and soil in the river basin plays an important role in the prevention and control of water loss and soil erosion.
Author Contributions
Z.Z. and C.D. came up with the idea and designed the study; C.D. performed some analyses and wrote the draft with L.W., L.W. and C.Y. collected the data and partial analyses, Y.X., Y.L. and J.Y. gave some comments and helped in polishing the paper.
Funding
This research was supported by the National Natural Science Foundation of China (Grant No. 41471147), Natural Science Foundation of Guangdong Province (Grant No. 2015A030313811), GDAS’ Special Project of Science and Technology Development (2017GDASCX-0101), Guangdong Innovative and Entrepreneurial Research Team Program (2016ZT06D336), Guangdong Innovative and Entrepreneurial Research Team Program (2016ZT06D336) and GDAS’ Special Project of Science and Technology Development (No. 2017GDASCX-0101, No. 2017GDASCX-0601, 2018GDASCX-0403). We are grateful to International Scientific Data Service Platform of the Chinese Academy of Sciences, Guangdong Hydrological Bureau and China Meteorological Data Sharing Service System for their help in providing data.
Conflicts of Interest
The authors declare no conflicts of interest.
References
- Liu, C.M.; Zhang, X.C. Causal analysis on actual water flow reduction in the mainstream of the Yellow River. Acta Geogr. Sin. 2004, 59, 323–330. [Google Scholar]
- Hu, S.; Liu, C.; Zheng, H.; Wang, Z.; Yu, J. Assessing the impacts of climate variability and human activities on streamflow in the water source area of Baiyangdian Lake. J. Geogr. Sci. 2012, 22, 895–905. [Google Scholar] [CrossRef]
- Arnell, N. Climate change and drought. Drought Management: Scientific and Technological Innovations, Options. Méditerranéennes Série A. Séminaires Méditerranéens 2008, 80, 13–19. [Google Scholar]
- Arnell, N.W.; Gosling, S.N. The impacts of climate change on river flow regimes at the global scale. J. Hydrol. 2013, 486, 351–364. [Google Scholar] [CrossRef]
- Hlavčová, K.; Štefunková, Z.; Valent, P.; Kohnová, S.; Výleta, R.; Szolgay, J. Modelling the Climate Change Impact On Monthly Runoff in Central Slovakia. Procedia Eng. 2016, 161, 2127–2132. [Google Scholar] [CrossRef]
- Banasik, K.; Hejduk, L.; Hejduk, A.; Kaznowska, E.; Banasik, J.; Byczkowski, A. Long-term variability of runoff from a small catchment in the region of the Kozienice Forest. Sylwan 2013, 157, 578–586. [Google Scholar]
- Banasik, K.; Hejduk, L. Long-term Changes in Runoff from a Small Agricultural Catchment. Soil Water Res. 2012, 7. [Google Scholar] [CrossRef]
- Zuo, D.; Xu, Z.; Zhao, J.; Abbaspour, K.C.; Yang, H. Response of runoff to climate change in the Wei River basin, China. Hydrol. Sci. J. 2015, 60, 508–522. [Google Scholar] [CrossRef]
- Piao, S.; Ciais, P.; Huang, Y.; Shen, Z.; Peng, S.; Li, J.; Zhou, L.; Liu, H.; Ma, Y.; Ding, Y. The impacts of climate change on water resources and agriculture in China. Nature 2010, 467, 43. [Google Scholar] [CrossRef] [PubMed]
- Duan, K.; Sun, G.; McNulty, S.G.; Caldwell, P.V.; Cohen, E.C.; Sun, S.; Aldridge, H.D.; Zhou, D.; Zhang, L.; Zhang, Y. Future shift of the relative roles of precipitation and temperature in controlling annual runoff in the conterminous United States. Hydrol. Earth Syst. Sci. 2017, 21, 5517–5529. [Google Scholar] [CrossRef] [Green Version]
- Wang, Z.; Chen, X.; Yang, T. Runoff variation and its impacting factors in the Dongjiang River basin during 1956–2005. J. Nat. Resour. 2010, 25, 1365–1374. [Google Scholar]
- Fu, G.; Chen, S.; Liu, C.; Shepard, D. Hydro-climatic trends of the Yellow River basin for the last 50 years. Clim. Change 2004, 65, 149–178. [Google Scholar] [CrossRef]
- Wang, H.; Yang, Z.; Saito, Y.; Liu, J.P.; Sun, X.; Wang, Y. Stepwise decreases of the Huanghe (Yellow River) sediment load (1950–2005): Impacts of climate change and human activities. Glob. Planet. Change 2007, 57, 331–354. [Google Scholar] [CrossRef]
- Zhang, J.Y.; Wang, G.Q.; He, R.M.; Liu, C.S. Variation trends of runoffs in the Middle Yellow River basin and its response to climate change. Adv. Water Sci. 2009, 20, 153–158. [Google Scholar]
- Ruimin, H.E.; Jianyun, Z.; Zhenxin, B.A.O.; Xiaolin, Y.A.N.; Guoqing, W.; Cuishan, L.I.U. Response of runoff to climate change in the Haihe River basin. Adv. Water Sci. 2015, 26, 1–9. [Google Scholar]
- Zhang, J.; Zhang, Z.; Wan, L.; Yang, C.; Ye, C. The Contributions of Climate Change and Human Activities on Runoff of the Tingjiang River. J. South China Norm. Univ. (Natural Sci. Ed.) 2017, 6, 15. [Google Scholar]
- Yang, C.; Zhang, Z.; Ruxiong, Z.; Wan, L.; Chen, Y.; Zhang, J. Response of Runoff to Climate Change and Human Activities in the River Basin of Southern Humid Area—A Case Study Of Ning Jiang. Res. Soil Water Conserv. 2017, 24, 113–119. [Google Scholar]
- Thorne, C.; Hey, R.; Newson, M. Applied fluvial geomorphology for river engineering and management; John Wiley and Sons Ltd: Hoboken, NJ, USA, 2005; ISBN 0471978523. [Google Scholar]
- Xing, Z.Q.; Yan, D.H.; Lu, F. Advances in the study of anthropogenic effects on the drought and flood events. J Nat Resour 2013, 28, 1070–1082. [Google Scholar]
- Hu, G.-W.; Mao, D.-H.; Li, Z.-Z.; Zeng, Y.; Feng, C. Characteristics and driving factors of runoff and sediment changes fluxes into the Dongting Lake from three outlets in Jingjiang River during past 60 years. J. Nat. Resour. 2014, 29, 129–141. [Google Scholar]
- Zhang, L.; Miao, L.P.; Wen, Z.M. Estimating the Effect of Vegetation and Precipitation on Runoff and Sediment Using the MMF Model:A Case Study in the Yanhe River Basin. J. Nat. Resour. 2015, 30, 446–458. [Google Scholar]
- Zhu, L.; Zhang, W. Responses of Water Resources to Climatic Changes in the Upper Stream of the Hanjiang River Basin Based on Rainfall-Runoff Simulations. Resour. Sci. 2005, 27, 16–22. [Google Scholar]
- Zhang, J.; Hu, Q.; Wang, S.; Ai, M. Variation Trend Analysis of Runoff and Sediment Time Series Based on the R/S Analysis of Simulated Loess Tilled Slopes in the Loess Plateau, China. Sustainability 2017, 10, 32. [Google Scholar] [CrossRef]
- Zhang, A.; Zhang, C.; Fu, G.; Wang, B.; Bao, Z.; Zheng, H. Assessments of impacts of climate change and human activities on runoff with SWAT for the Huifa River Basin, Northeast China. Water Resour. Manag. 2012, 26, 2199–2217. [Google Scholar] [CrossRef]
- Wang, G.; Xia, J.; Chen, J. Quantification of effects of climate variations and human activities on runoff by a monthly water balance model: A case study of the Chaobai River basin in northern China. Water Resour. Res. 2009, 45. [Google Scholar] [CrossRef] [Green Version]
- Yin, Z.; Feng, Q.; Yang, L.; Wen, X.; Si, J.; Zou, S. Long Term Quantification of Climate and Land Cover Change Impacts on Streamflow in an Alpine River Catchment, Northwestern China. Sustainability 2017, 9, 1278. [Google Scholar] [CrossRef]
- Wang, Y.-Q.; Qi, S.; Sun, G.; McNulty, S.G. Impacts of climate and land-use change on water resources in a watershed: A case study on the Trent River basin in North Carolina, USA. Adv. water Sci. 2011, 22, 51–58. [Google Scholar]
- Lin, K.-R.; He, Y.-H.; Chen, X.-H. Identifying the quantitative effect of climate change and human activity on runoff in the Dongjiang River basin. Shuili Xuebao (J. Hydraul. Eng.) 2012, 43, 1312–1321. [Google Scholar]
- Liu, D.; Chen, X.; Lian, Y.; Lou, Z. Impacts of climate change and human activities on surface runoff in the Dongjiang River basin of China. Hydrol. Process. An Int. J. 2010, 24, 1487–1495. [Google Scholar] [CrossRef]
- Hao, X.; Chen, Y.; Xu, C.; Li, W. Impacts of climate change and human activities on the surface runoff in the Tarim River Basin over the last fifty years. Water Resour. Manag. 2008, 22, 1159–1171. [Google Scholar] [CrossRef]
- Huang, B.; Hao, C.; Ruonan, L.; Zheng, H. Research Progress on the Quantitative Methods of Calculating Contribution Rates of Climate Change and Human Activities to Surface Runoff Changes. J. Nat. Resour. 2018, 33, 899–910. [Google Scholar]
- Mann, H.B. Nonparametric tests against trend. Econom. J. Econom. Soc. 1945, 245–259. [Google Scholar] [CrossRef]
- Fan, H.; He, D. Regional climate and its change in the Nujiang River basin. Acta Geogr. Sin. 2012, 67, 621–630. [Google Scholar]
- Wan, L.; Zhang, Z.; Dong, C.; Yang, C.; Zhang, Q. The Study on Influence Factors of Reference Crop Evapotranspiration in Hanjiang River Basin and Its Spatio-Temporal Change. J. South China Norm. Univ. (Nat. Sci. Ed.) 2017, 4, 14. [Google Scholar]
- Li, P.; Sun, X.; Zhao, X. Analysis of precipitation and potential evapotranspiration in arid and semi arid area of China in recent 50 years. J. Arid L. Resour. Environ. 2012, 7, 11. [Google Scholar]
- Ruizhi, C.; Yanfang, S.; Zhonggen, W.; Zongli, L.I. Variability of precipitation in the Yongjiang River Basin during 1956-2010. Prog. Geogr. 2012, 31, 1149–1156. [Google Scholar]
- Zhang, Q.; Xu, C.Y.; Zhang, Z.; Chen, Y.D.; Liu, C.L. Spatial and temporal variability of precipitation over China, 1951-2005. Theor. Appl. Climatol. 2009, 95, 53–68. [Google Scholar] [CrossRef]
- Wei, F. Modern Climate Diagnostic and Statistical Forecasting Techniques; China Meteorological Press: Beijing, China, 2007. [Google Scholar]
- Wang, W.; Ding, J.; Xiang, H. Application and prospect of wavelet analysis in hydrology. Adv. water Sci. 2002, 13, 515–520. [Google Scholar]
- Wang, W.; Ding, J.; Heng, T.; Xiang, L. Wavelet Based Modeling of Periodicity and Jumps in Hydrological Time Series. Geotech. Invest. Surv. 2003, 2003, 32–35. [Google Scholar]
- Yu, Z.; Xingmin, M.U.; Yi, H.E. Relationship between runoff and sediment discharge in the main channel of Yellow River from 1950 to 2011. J. Sediment Res. 2014, 4, 32–38. [Google Scholar]
- Shi, C.; Yuan, S.; Shi, C.; Zhao, T. Effects of Climate Change and Human Activities on Runoff in Luanhe Basin. J. Soil Water Conserv. 2018, 32, 264–269. [Google Scholar]
- Liu, J.; Zhang, Q.; Chen, X.; Gu, X. Quantitative evaluations of human-and climate-induced impacts on hydrological processes of China. Acta. Geogr. Sin 2016, 11, 1875–1885. [Google Scholar]
- Caiwen, D. The Influence Study of Climate change and human activities on the runoff and sediment in wuhua river basin. Master’s thesis, South China Normal University, 2016. [Google Scholar]
Figure 1.
Location map of the river basin.

Figure 2.
(a) Interannual change and (b) Cumulative departure curves of the average temperature in the river basin from 1961 to 2013.
Figure 2.
(a) Interannual change and (b) Cumulative departure curves of the average temperature in the river basin from 1961 to 2013.

Figure 3.
(a) Interannual change and (b) Cumulative departure curves of the average precipitation in the river basin from 1961 to 2013.
Figure 3.
(a) Interannual change and (b) Cumulative departure curves of the average precipitation in the river basin from 1961 to 2013.
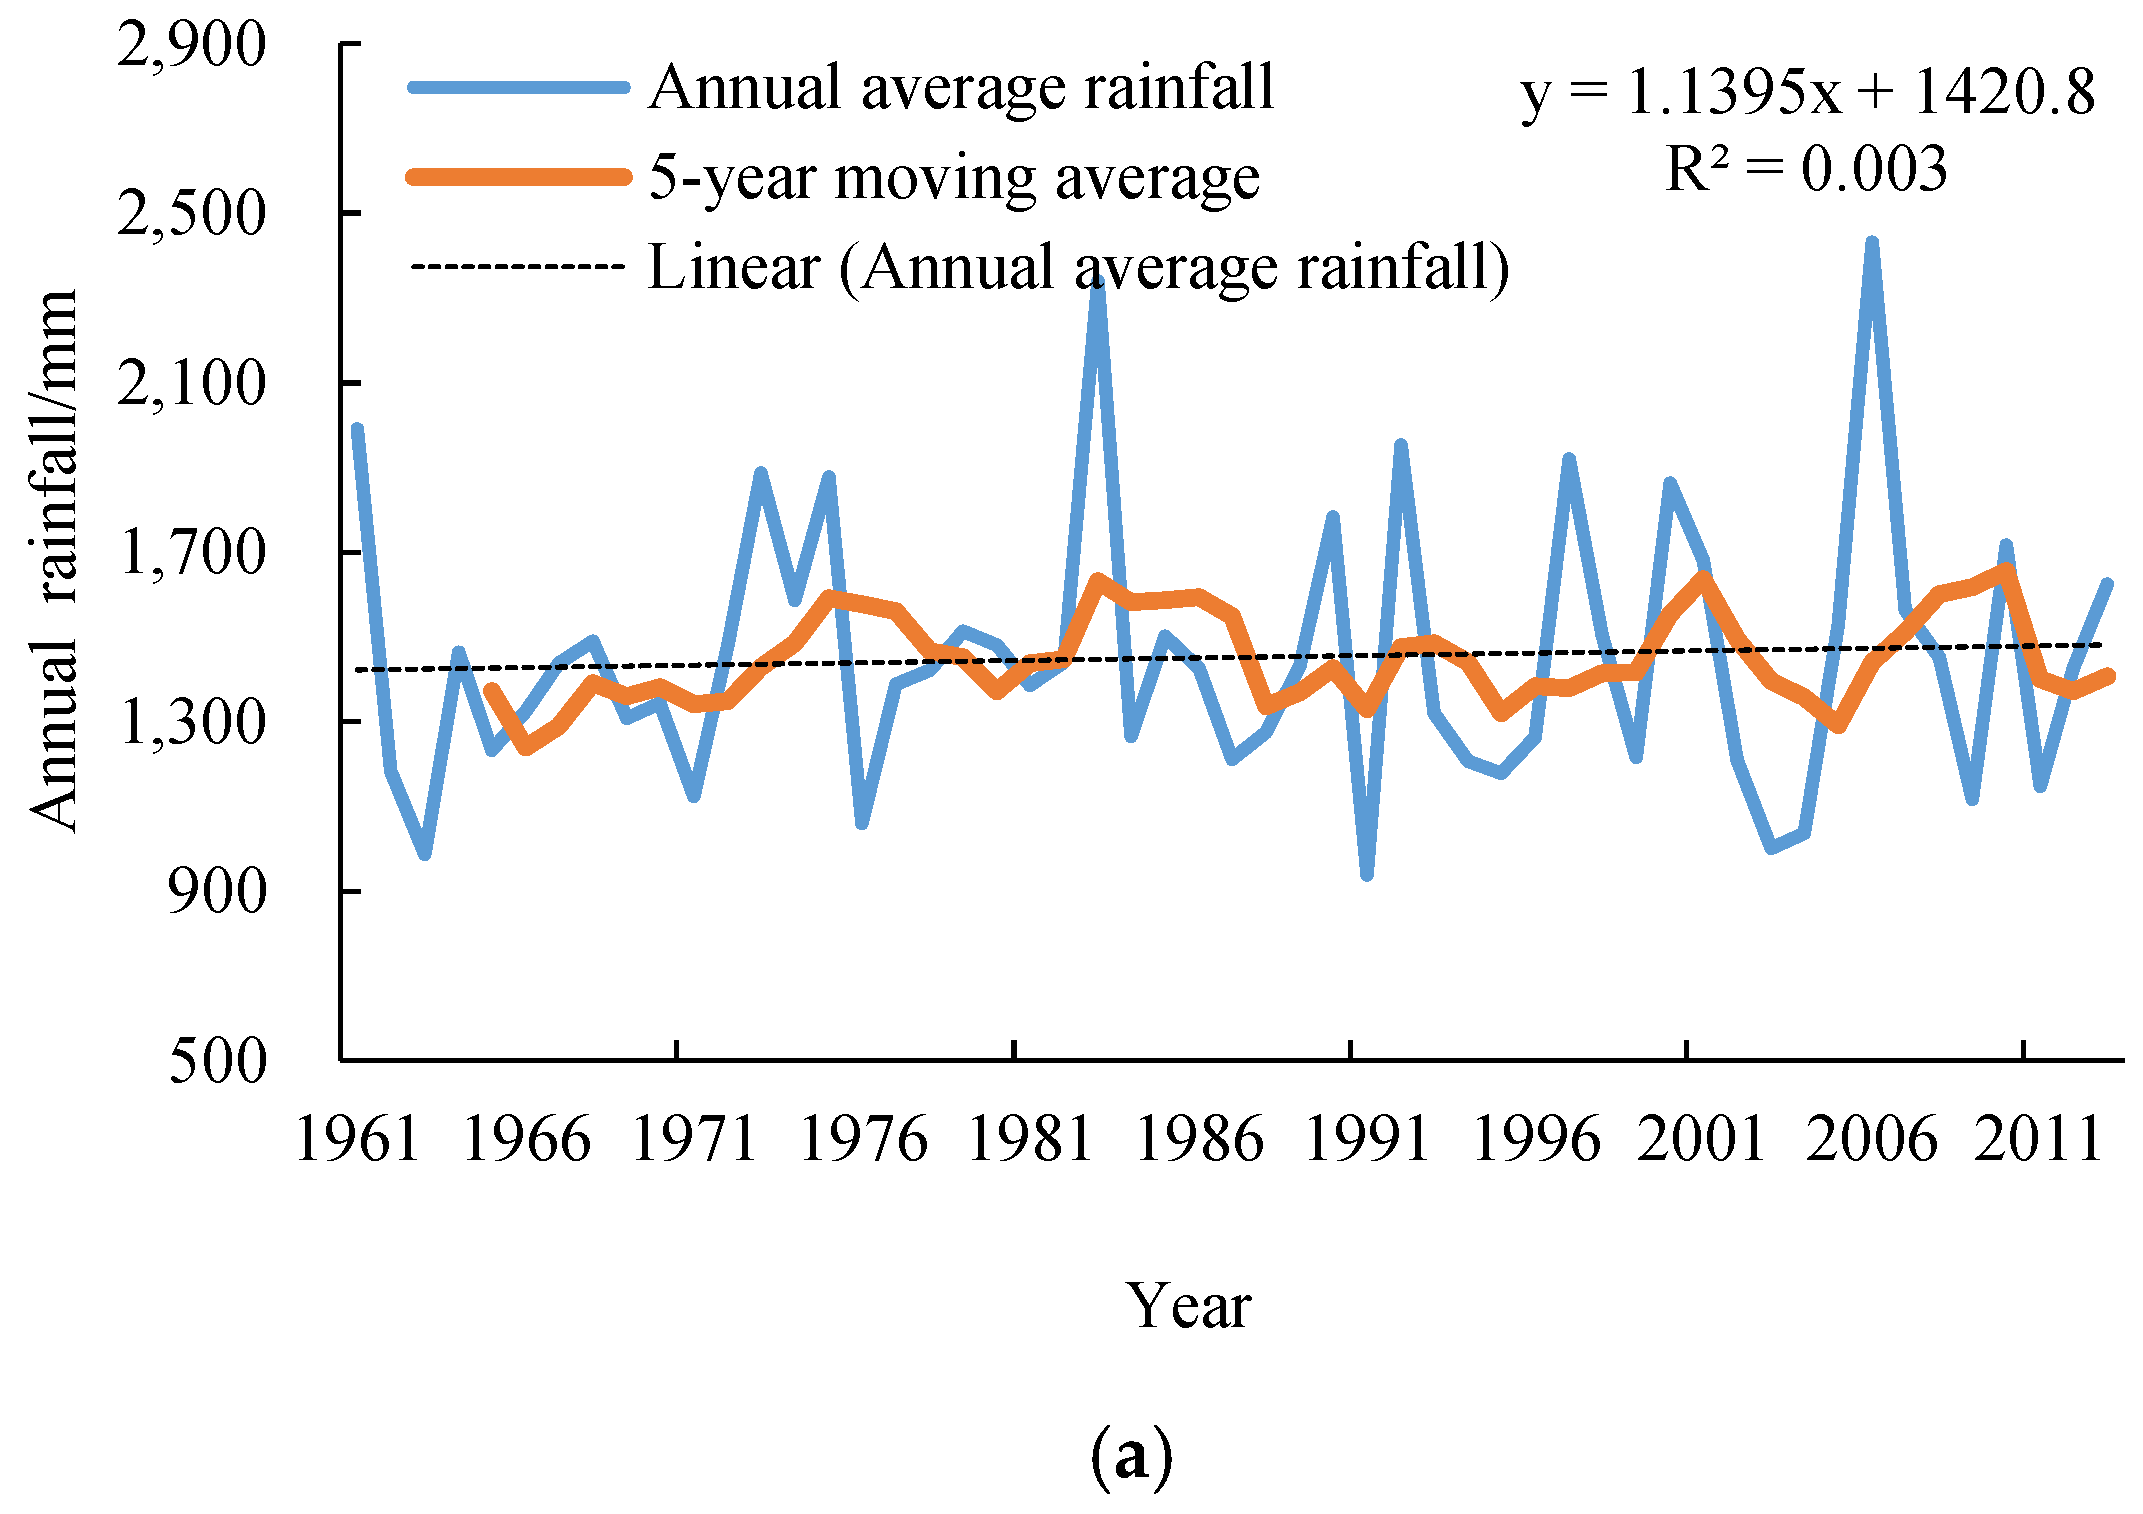

Figure 4.
(a) Interannual change and (b) Cumulative departure curves of the runoff.

Figure 5.
Mann–Kendall (M–K) curves of the temperature, precipitation, and runoff in the river basin.
Figure 5.
Mann–Kendall (M–K) curves of the temperature, precipitation, and runoff in the river basin.
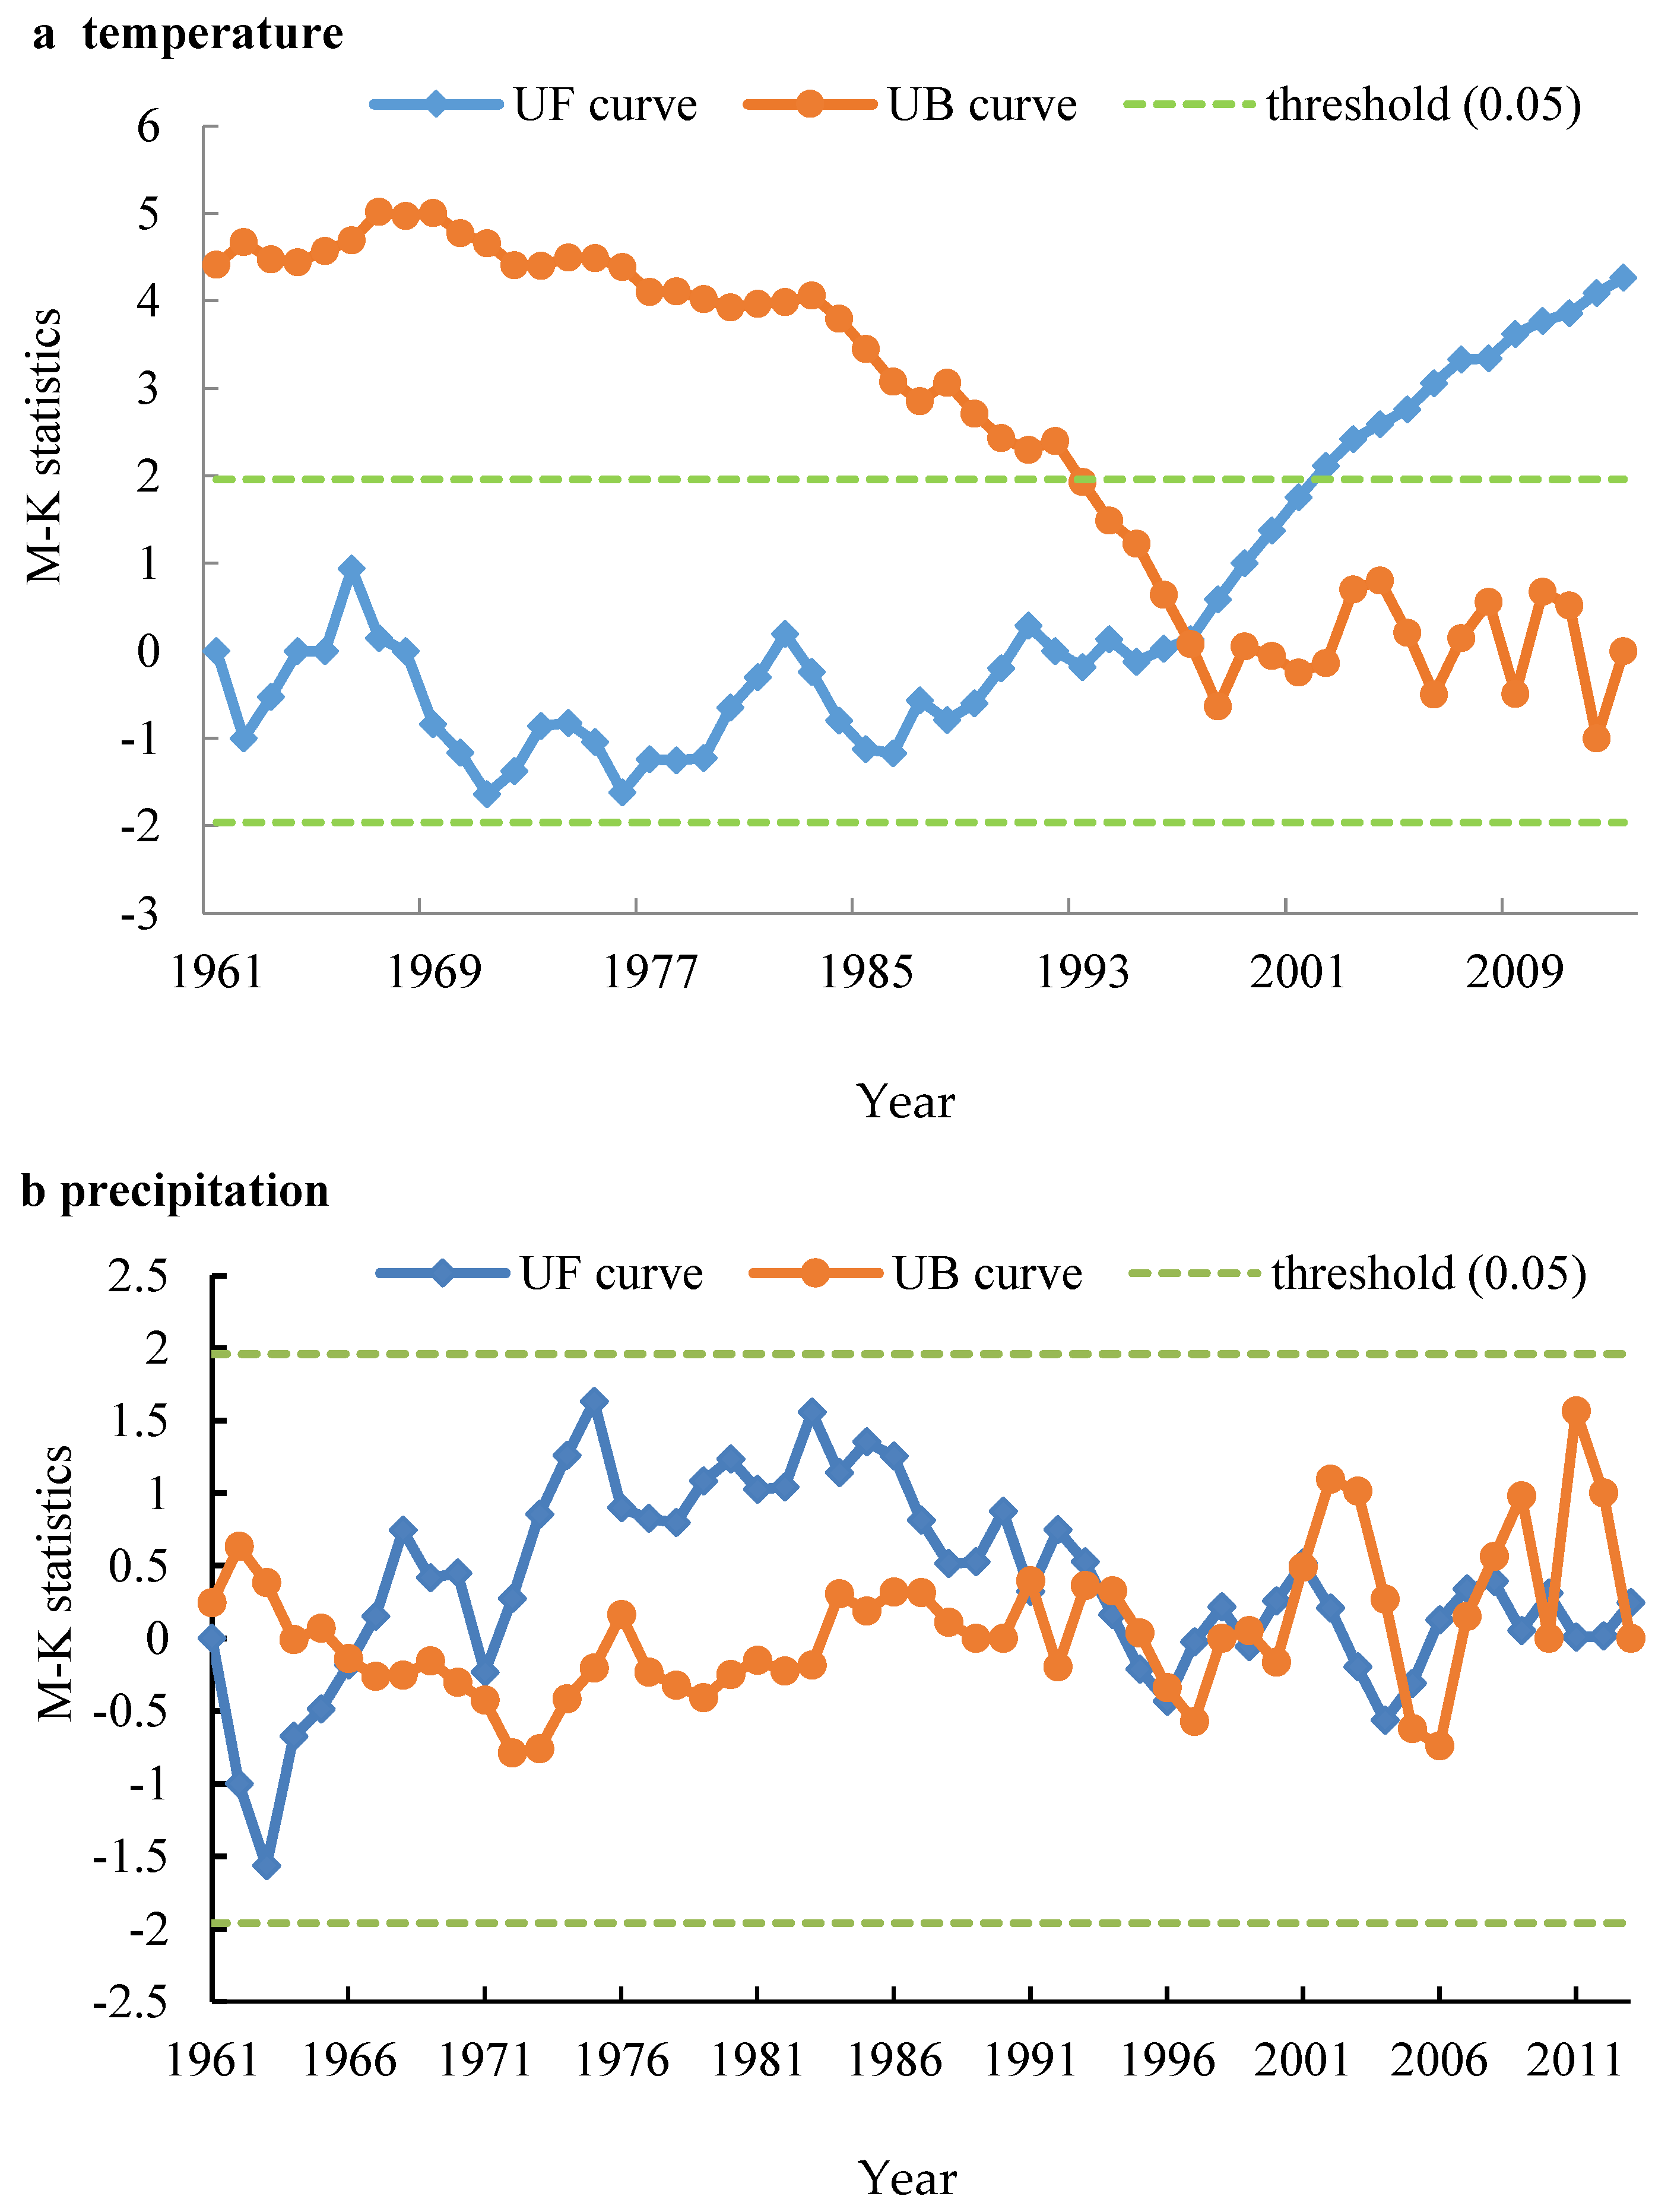

Figure 6.
(a) Time–frequency distribution of the real part of the wavelet coefficient and (b) Wavelet variance change curve of temperature.
Figure 6.
(a) Time–frequency distribution of the real part of the wavelet coefficient and (b) Wavelet variance change curve of temperature.


Figure 7.
(a) Time–frequency distribution of the real part of the wavelet coefficient and (b) the wavelet variance change curve of precipitation.
Figure 7.
(a) Time–frequency distribution of the real part of the wavelet coefficient and (b) the wavelet variance change curve of precipitation.


Figure 8.
(a) Time–frequency distribution of the real part of the wavelet coefficient and (b) The wavelet variance change curve of runoff.
Figure 8.
(a) Time–frequency distribution of the real part of the wavelet coefficient and (b) The wavelet variance change curve of runoff.


Figure 9.
Land use types in the Wuhua River Basin in 1990 and 2013.

Figure 10.
Departure curves of (a) annual runoff and precipitation and (b) annual runoff and temperature.
Figure 10.
Departure curves of (a) annual runoff and precipitation and (b) annual runoff and temperature.


Figure 11.
Interannual runoff and precipitation changes in the river basin.

Figure 12.
Regression analysis on the average annual runoff with respect to precipitation.

Figure 13.
Precipitation-runoff double accumulation curve.


Table 1.
Land-use structure in the river basin from 1990 to 2013 and its change trend.
| Year | Cultivated Land | Forestland | Grassland | Watershed | Construction Land | |
|---|---|---|---|---|---|---|
| Area/km2 | 1990 | 313.19 | 1417.2 | 42.73 | 17.2 | 42.51 |
| 2013 | 187.9 | 1322.62 | 138.66 | 15.06 | 168.11 | |
| Rate of change in the area/% | From 1990 to 2013 | −40 | −6.67 | 224.5 | −12.44 | 295.46 |
Table 2.
Matrix of the land-use transition in the river basin from 1990 to 2013 (1) (unit: km2).
| From 1990 to 2013 | Grassland | Cultivated Land | Construction Land | Forestland | Watershed | Total in 2013 |
|---|---|---|---|---|---|---|
| Cultivated land | 4.13 | 94.85 | 9.90 | 81.09 | 2.68 | 185.44 |
| Forestland | 21.82 | 106.85 | 1.96 | 1145.84 | 1.58 | 1315.66 |
| Grassland | 9.80 | 41.21 | 5.04 | 83.56 | 2.42 | 138.03 |
| Watershed | 0.79 | 2.47 | 0.68 | 4.21 | 8.29 | 15.94 |
| Construction land | 4.66 | 68.31 | 24.73 | 83.77 | 2.11 | 167.87 |
| Total in 1990 | 42.73 | 313.19 | 41.51 | 1416.46 | 17.2 | 1832 |
Table 3.
Matrix of the land-use transition in the river basin from 1990 to 2013 (2) (unit: %).
| From 1990 to 2013 | Grassland | Cultivated Land | Construction Land | Forestland | Watershed |
|---|---|---|---|---|---|
| Cultivated land | 2.22 | 51.15 | 1.56 | 43.73 | 1.34 |
| Forestland | 1.99 | 9.39 | 0.12 | 88.29 | 0.2 |
| Grassland | 4.2 | 31.31 | 0.75 | 60.55 | 3.2 |
| Watershed | 4.94 | 15.5 | 1.13 | 26.41 | 52 |
| Construction land | 2.62 | 45.15 | 3.78 | 47.06 | 1.35 |
Table 4.
Impacts of precipitation and human activities on the runoff in the river basin.
| Year | Precipitation | Runoff Per Ten Thousand Tons | Impact of Precipitation | Impact of Human Activities | ||||
|---|---|---|---|---|---|---|---|---|
| (mm) | Actual Value | Calculated Value | Total Reduction | Quantity Affected/Hundred Million m3 | Contribution Factor | Quantity Affected/ Hundred Million m3 | Contribution Factor | |
| 1981–1985 | 1586.3 | 10.29 | ||||||
| 1986–1989 | 1336.1 | 7.14 | 7.59 | 3.15 | 0.45 | 14.3% | 2.7 | 85.7% |
| 1990–1999 | 1428.2 | 8.31 | 8.68 | 1.98 | 0.37 | 18.7% | 1.61 | 81.3% |
| 2000–2009 | 1487.8 | 8.64 | 9.25 | 1.65 | 0.61 | 37% | 1.04 | 63% |
| 2010–2013 | 1478.9 | 7.44 | 8.13 | 2.85 | 0.69 | 24.2% | 2.16 | 75.8% |
| 1986–2013 | 1443.6 | 8.46 | 8.72 | 1.83 | 0.26 | 14.2% | 1.57 | 85.8% |
© 2018 by the authors. Licensee MDPI, Basel, Switzerland. This article is an open access article distributed under the terms and conditions of the Creative Commons Attribution (CC BY) license (http://creativecommons.org/licenses/by/4.0/).
Share and Cite
MDPI and ACS Style
Zhang, Z.; Wan, L.; Dong, C.; Xie, Y.; Yang, C.; Yang, J.; Li, Y. Impacts of Climate Change and Human Activities on the Surface Runoff in the Wuhua River Basin. Sustainability 2018, 10, 3405. https://doi.org/10.3390/su10103405
AMA Style
Zhang Z, Wan L, Dong C, Xie Y, Yang C, Yang J, Li Y. Impacts of Climate Change and Human Activities on the Surface Runoff in the Wuhua River Basin. Sustainability. 2018; 10(10):3405. https://doi.org/10.3390/su10103405
Chicago/Turabian StyleZhang, Zhengdong, Luwen Wan, Caiwen Dong, Yichun Xie, Chuanxun Yang, Ji Yang, and Yong Li. 2018. "Impacts of Climate Change and Human Activities on the Surface Runoff in the Wuhua River Basin" Sustainability 10, no. 10: 3405. https://doi.org/10.3390/su10103405
Note that from the first issue of 2016, this journal uses article numbers instead of page numbers. See further details here.