1. Introduction
According to China’s Ministry of Industry and Information Technology (MIIT, 2014), China has surpassed the United States to become the world’s largest electronic waste producer in 2013, China’s major electronic products scrap is more than 200 million units per year, weighing more than 5 million tons. The recycling and reuse of electronic waste (e-waste) is attracted more concern from both the ecological and economical points of view.
The Global E-waste Monitor 2017 shows that the development of information and communication technology (ICT) and the shortening the replacing cycle are exacerbating the growth of e-waste, the total number of e-waste generated by countries around the world reached 44.7 million cubic tones that is equivalent to 6.1 kg per inhabitant (kg/inh) in 2016, which increased from 5.8 kg/inh in 2014. In 2016, 44.7 million tons of e-waste were produced in the world, only 20% of them had been recycled through appropriate channels. It was estimated that the total value of raw materials contained in e-waste worth about 55 billion euros in 2016 that is higher than the year’s gross domestic product of most countries [
1]. The value of the secondary raw materials obtained after waste management is only the value of its components or the price of used equipment. Countries need to adopt a circular economy mode to compensate for material loopholes through better design, recycling and reuse of components.
Electronic products are moving towards personalization, diversification and rapid pace of renewal. On the one hand, the complex composition of electronic products, containing heavy metals, halogen chemicals and other toxic and harmful substances cannot be decomposed by themselves, directly discarded or disposed of arbitrarily not only will cause great damage to the environment, but also may even endanger the health of the surrounding residents. On the other hand, because the characteristics of e-waste determine is different from the general urban garbage. It is a highly valuable renewable resource and is known as “urban mine”. For example, a ton of randomly collected electronic card plates can separate 129.73 kg copper, 29.48 kg aluminum, 0.45 kg gold, 19.96 kg nickel, 40.82 kg magnesium, 9.98 kg antimony and other metal elements. The benefits of the large amount of non-ferrous metals, rare metals and precious metals generated in e-waste are much higher than the metal resources available in mining ore, and the consumption of resources and costs are much lower than the latter.
The recycling and re-manufacturing of e-waste can bring great economic benefits to the related enterprises. Enterprises can greatly reduce the operating cost of enterprises by recycling e-waste through a series of reverse logistics activities to turn them into abundant and usable resources, then directly into the second-hand market and re-sell as raw materials into the enterprise’s production process.
The “Extended Producer Responsibility (EPR)” concept was proposed in Europe which was based on the principle of “The polluter is responsible for pollution” and “reduce hazardous substance” in 1993. Producers are required to bear the responsibility in the whole life cycle of their products (the circle including the production, recycling, reprocessing) to reduce the environmental pollution. It is a system that uses modern environment management concept to achieve the virtuous recycling of products. With the introduction of the EPR concept, countries around the world have responded and incorporated it into the new laws and regulations. China has passed the Recovery and Disposal of Waste Electrical and Electronic Products (WEEE) policy in the 23rd meeting of the State Council on 20 August 2008, which formally implemented on 1 January 2011. The regulations clearly stipulate matters concerning the recycling and recycling of e-waste and electronic products.
In summary, with the emergence of a large number of e-waste and electronic products, the implementation of EPR has become a national consensus. Whether it is to comply with national environmental laws and policies or based on the great profit-driven recycling and reuse, e-waste recycling is inevitable.
The first part of the paper is introduction of e-waste research. The second part is literature of e-waste research and CLSC research, and discusses the difference between these papers and our paper. The third part describes dual chains competition structure. The fourth part is the research method of our paper. The fifth part is the simulation results of our model and some discussion has been done about the results. The last part is the conclusion drawn from the fourth part.
2. Literature Review
Fleischmann et al. [
2] and Guide et al. [
3] has made a comprehensive elaboration on the reverse logistics management of re-manufacturing under the current research on re-manufacturing closed-loop supply chain management. Subramanian et al. [
4] explains the problem of the manufacturer’s reverse supply chain coordination under the EPR. Sehultmann et al. [
5] and Krikke [
6] analyze the operation of reverse logistics from the perspectives of automation industry and network design respectively and propose a centralized supply chain by a decision-maker responsible for planning to achieve closed-loop supply chain overall profit maximization is optimal. Savaskan et al. [
7] proposes three recycling methods based on this theory, these are recycling by manufacturers, recycling by retailers and recycling by third parties. The recycling by retailers is proved to be optimal under its hypothetical condition. Nie [
8] mainly studies the influence of four channel structures on closed-loop supply chain with recycling by third parties. Wang and Da [
9] identify the effects of the reward and punishment mechanism on the decision of re-manufacturing. Nie [
10] explore the effects of the reward and punishment mechanism on the decision of re-manufacturing closed-loop supply chain. However, the above studies mainly focus on the perspective of decentralized decision-making to optimize the benefits of participants in the supply chain, neglected the importance to improve the operation efficiency. Li et al. [
11] put forward a partnership maintaining method to improve supply chain operational efficiency at the perspective of trust. To improve the performance of the decentralized decision-making, many scholars have deepened the research on the reverse supply chain by designing the contract. He and Khouja [
12] studies the Pareto model of supply chain contract under the goal satisfaction, and analyzes the factors influencing the contract in the supply chain. Xue et al. [
13] compares the re-manufacturing system of decentralized decision model with centralized decision model, and four types of incentive contracts are designed to improve supply chain operation efficiency. Based on the revenue-sharing coordination mechanism, Chen and Gao [
14] design revenue sharing contracts, and the model of Multi-Stage Supply Chain Coordination is established. Based on the contract theory, Kong and Luo [
15] study the pricing strategy of reverse supply chain. In the case of asymmetric information of cost and demand, Lei et al. [
16] coordinates the operation of supply chain participants through contract. Qiao et al. [
17] design supply chain sharing contracts based on the characteristics of the product service system. The above papers analyze the effect of contracts in supply chain management on supply chain and its participants. From the view of asymmetric information, Bao and Pu [
18] adopt Principal-agent framework to study the profit game between manufacturers and retailers under the contract.
In condensation of closed-loop supply chain study on competition, Heese [
19] studies the effect of re-manufacturing on the competitive advantage of duopoly manufacturers, identify that the manufacturer who implement recycling and re-manufacturing will not only be able to earn more profits but also increase sales. Ferguson and Toktay [
20] discusses the influence of competition on recycling strategy by comparing the re-manufacturing decision of absolute monopolized manufacturer with oligopoly manufacturer. Parlar and Weng [
21] use game theory to study the coordination method between yield and price in the case of price competition. Ferrer [
22] raises the problem of managing new manufacturing and re-manufacturing products by manufacturers, using the optimization method to make decisions for manufacturers. Ferrer [
23] discusses manufacturer’s production decisions in the case of the new manufacturing and re-manufacturing products of market segments. In the duopoly competition of manufacturer and re-manufacturer, Webster and Mitra [
24] compare the changes in the interests of manufacturers, re-manufacturers, governments and consumers between control and no control on recycling products by manufacturers. After that, Atasu et al. [
25] studies the influence factors of re-manufacturing and explore the profitability of the manufacturer’s re-manufacturing in the case of absolute monopolized and competition. Chinese scholars have also conducted relevant research in this field. Zhou and Liang et al. [
26], Cao and Xiong et al. [
27], respectively, discuss the product substitution and the competition between manufacturer and re-manufacturer. Yi [
28,
29,
30] constructs three game models of re-manufacturing closed-loop supply chain, such as Stackelberg game led by the manufacturer, Stackelberg game led by the retailer and Nash Equilibrium game about manufacturer and retailer. Meanwhile the influences of different market structures on recycling rate, wholesale, retail price, channel members profit and channel gross profit are analyzed. Han and Xue [
31] apply evolutionary game theory to analyze the influence on recycling channels by the degree of competition between producers, re-manufacturing cost savings and the degree of difficulty in recycling. Han and Dong [
32] construct the decision-making model of recycling channel of bilateral competition closed-loop supply chain for two competing manufacturers and two competing retailers, finding that the selection of recycling channel is affected by the competition between retailers and manufacturers.
From the perspective of the manufacturer, Xie et al. [
33] treat the quality of products as an endogenous variable to discuss the manufacturer’s optimal manufacturing and re-manufacturing strategies in oligarch, duopoly non-cooperation and duopoly cooperation market. Zheng and Li [
34] studies the influence of market competition on recycling channel selection, when the market competition is small, manufacturers choose their own recycling channels whist when the market competition is fierce, manufacturers choose retailers’ recycling channels.
There are numerous research on recycling mode, Savaskan [
35] compares the system efficiency of recycling by manufacturers and recycling by retailers in the competition between two retailers, revealing that the competition between retailers significantly affect the choice of optimal recycling mode. Yi [
36] constructed three hybrid recycling models of product remanufacturing closed-loop supply chain by using game theory under the premium and penalty mechanism. In different hybrid recycling modes, the profits of return rate, retail price, node enterprises and supply chain were compared and analyzed, and the selection problem of optimal hybrid recycling mode was researched. McGuire [
37] first proposes the research framework of the competition between chains which discusses the dominant vertical structure of two manufacturers and two alternative retailers and identify that the decentralized structure can alleviate the severe price competition to some extent. In recent years, it has been gradually extended to the comparison between the recycling mode of competitive closed-loop supply chain dominated by retailers and channel structure. For two competitive supply chains (one is traditional supply chain with no re-manufacturing and other one is closed-loop supply chain with recycling by manufacturer). Wei [
38] studies system pricing and re-manufacturing strategies in the situation of centralized and four decentralized channel structures, based on domination by manufacturers or retailers. In the context of competition between a traditional forward supply chain and a closed-loop supply chain with recycling by manufacturers, Zheng [
39] compares variable equilibrium solutions and profit allocation results of centralized channel structure (both chains are centralized decision-making), distributed channel structure (both chains are decentralized decision-making by manufacturer) and hybrid channel structure(one is centralized decision-making, the other one is decentralized decision-making by manufacturer). Song et al. [
40] studies channel structure selection of two competition closed-loop supply chains with recycling by third party. Li [
41] studies sales model selection of two competing decentralized closed-loop supply chains with recycling by manufacturer. Li [
42] compares the member profits and environment performances in closed-loop supply chain with recycling by manufacturer, retailer and third party, recognizing the optimal recycling mode with the combination of different competitive intensity and recycling compensation price parameters. Yoon and Jeong [
43] propose four competition strategies to explore the advertisement costs, trade-in allowance of retailers and the difference in the avenue.
In summary, the existing closed-loop supply chain management literature concentrate on the supply chain’s decision structure, recycling channel selection and recycling price, but lacks the research on the dual chains dominated by retailers competing contracts by SD methods. The research on closed-loop supply chain competition is mostly based on two hypotheses: one is to assume that market demand is certain; the other one is to assume that information is symmetrical, in other words, the information fully shared among members in the closed-loop supply chain. Such models are less representative in the context of market demand fluctuation and the difficulty of information sharing.
In the past research, the system dynamics (SD) method is less used to study the closed-loop supply chain competition, which is dominated by retailers. In the comparison of system dynamics method with other social science research methods, such as econometric model and input-output analysis, each of them has its advantages and disadvantages. All of research objects have own appropriate method, and it is impossible for one method to completely replace the other.
However, based on the features and principles of system dynamics, our research adopts SD method due to some advantages of modeling as the follow discussion. Firstly, SD is good at dealing with cyclical problems. Secondly, SD is good at dealing with long-term problems; Thirdly, SD is good at dealing with problems in the condition of lack of data; Fourthly, SD is good at dealing with problems of non-linear and high-order time change; Finally, SD can emphasis on conditional forecasting.
Therefore, SD is used to construct two closed-loop chains with recycling by retailers in the context of information asymmetric in this paper. To match the actual situation, the market demand is set to random. Two supply chains are competing in the same market, which forms a competition environment. To gain more profit in the competition, manufacturers use contract to strengthen the cooperation with the retailer. Contracts can enhance the retailers recycling enthusiasm and increase the amount of recycling.
Two supply chains use different contracts. The contract of supply chain 1 is designed according to MS. The contract of supply chain 2 is designed according to the proportion of reuse inventory (REI) in retailers recycling inventory (RRI).
By adjusting the influence coefficient of the model and the recovery coefficient of e-waste, the total revenue of supply chain, market share, the change of market competitiveness and its influence on competitors are observed, and the related parties are provided with a scientific decision-making basis.
4. Materials and Methods
4.1. System Dynamic Method
SD is a subject of analyzing and studying information feedback system, and it is also a cross-discipline subject to recognize and solve system problem. SD is a branch of system science and management science, and it is also a horizontal discipline linking the fields of natural science and social science. In terms of system methodology, SD is a method to unify structural method, functional method and historical method. SD considers that the behavior patterns and characteristics of the system are mainly determined by its internal dynamic structure and feedback mechanism. The system refers to the complex of interactive units, the feedback refers to the relationship between the output and input of the same unit or its sub-block in the system. For the whole system, feedback refers to the relationship between the system output and the input from the external environment. It can be directly associated with the corresponding input from the output of a unit, sub-block, and system and can be implemented through media (other units, sub-block, and other systems). Since Forrester, SD has been applied to various business and strategy problems. Krikke et al. developed a model applied to a CLSC of refrigerators [
44]. The model aims to minimize the costs, energy use and waste of supply chain operations. Georgiadis and Besiou developed a SD model to realize the long-term system behavior under multiple environmental events, which directly contributed to ecological motivation and impact of the policy on technological innovation [
45].
4.2. System Dynamics Modeling
This model makes the following assumptions for research. Suppliers, retailers and manufacturers use a typical inventory replenishment strategy for order or production. There is no difference in quality between re-manufactured products and new products. Manufacturers prefer to use recycling for production.
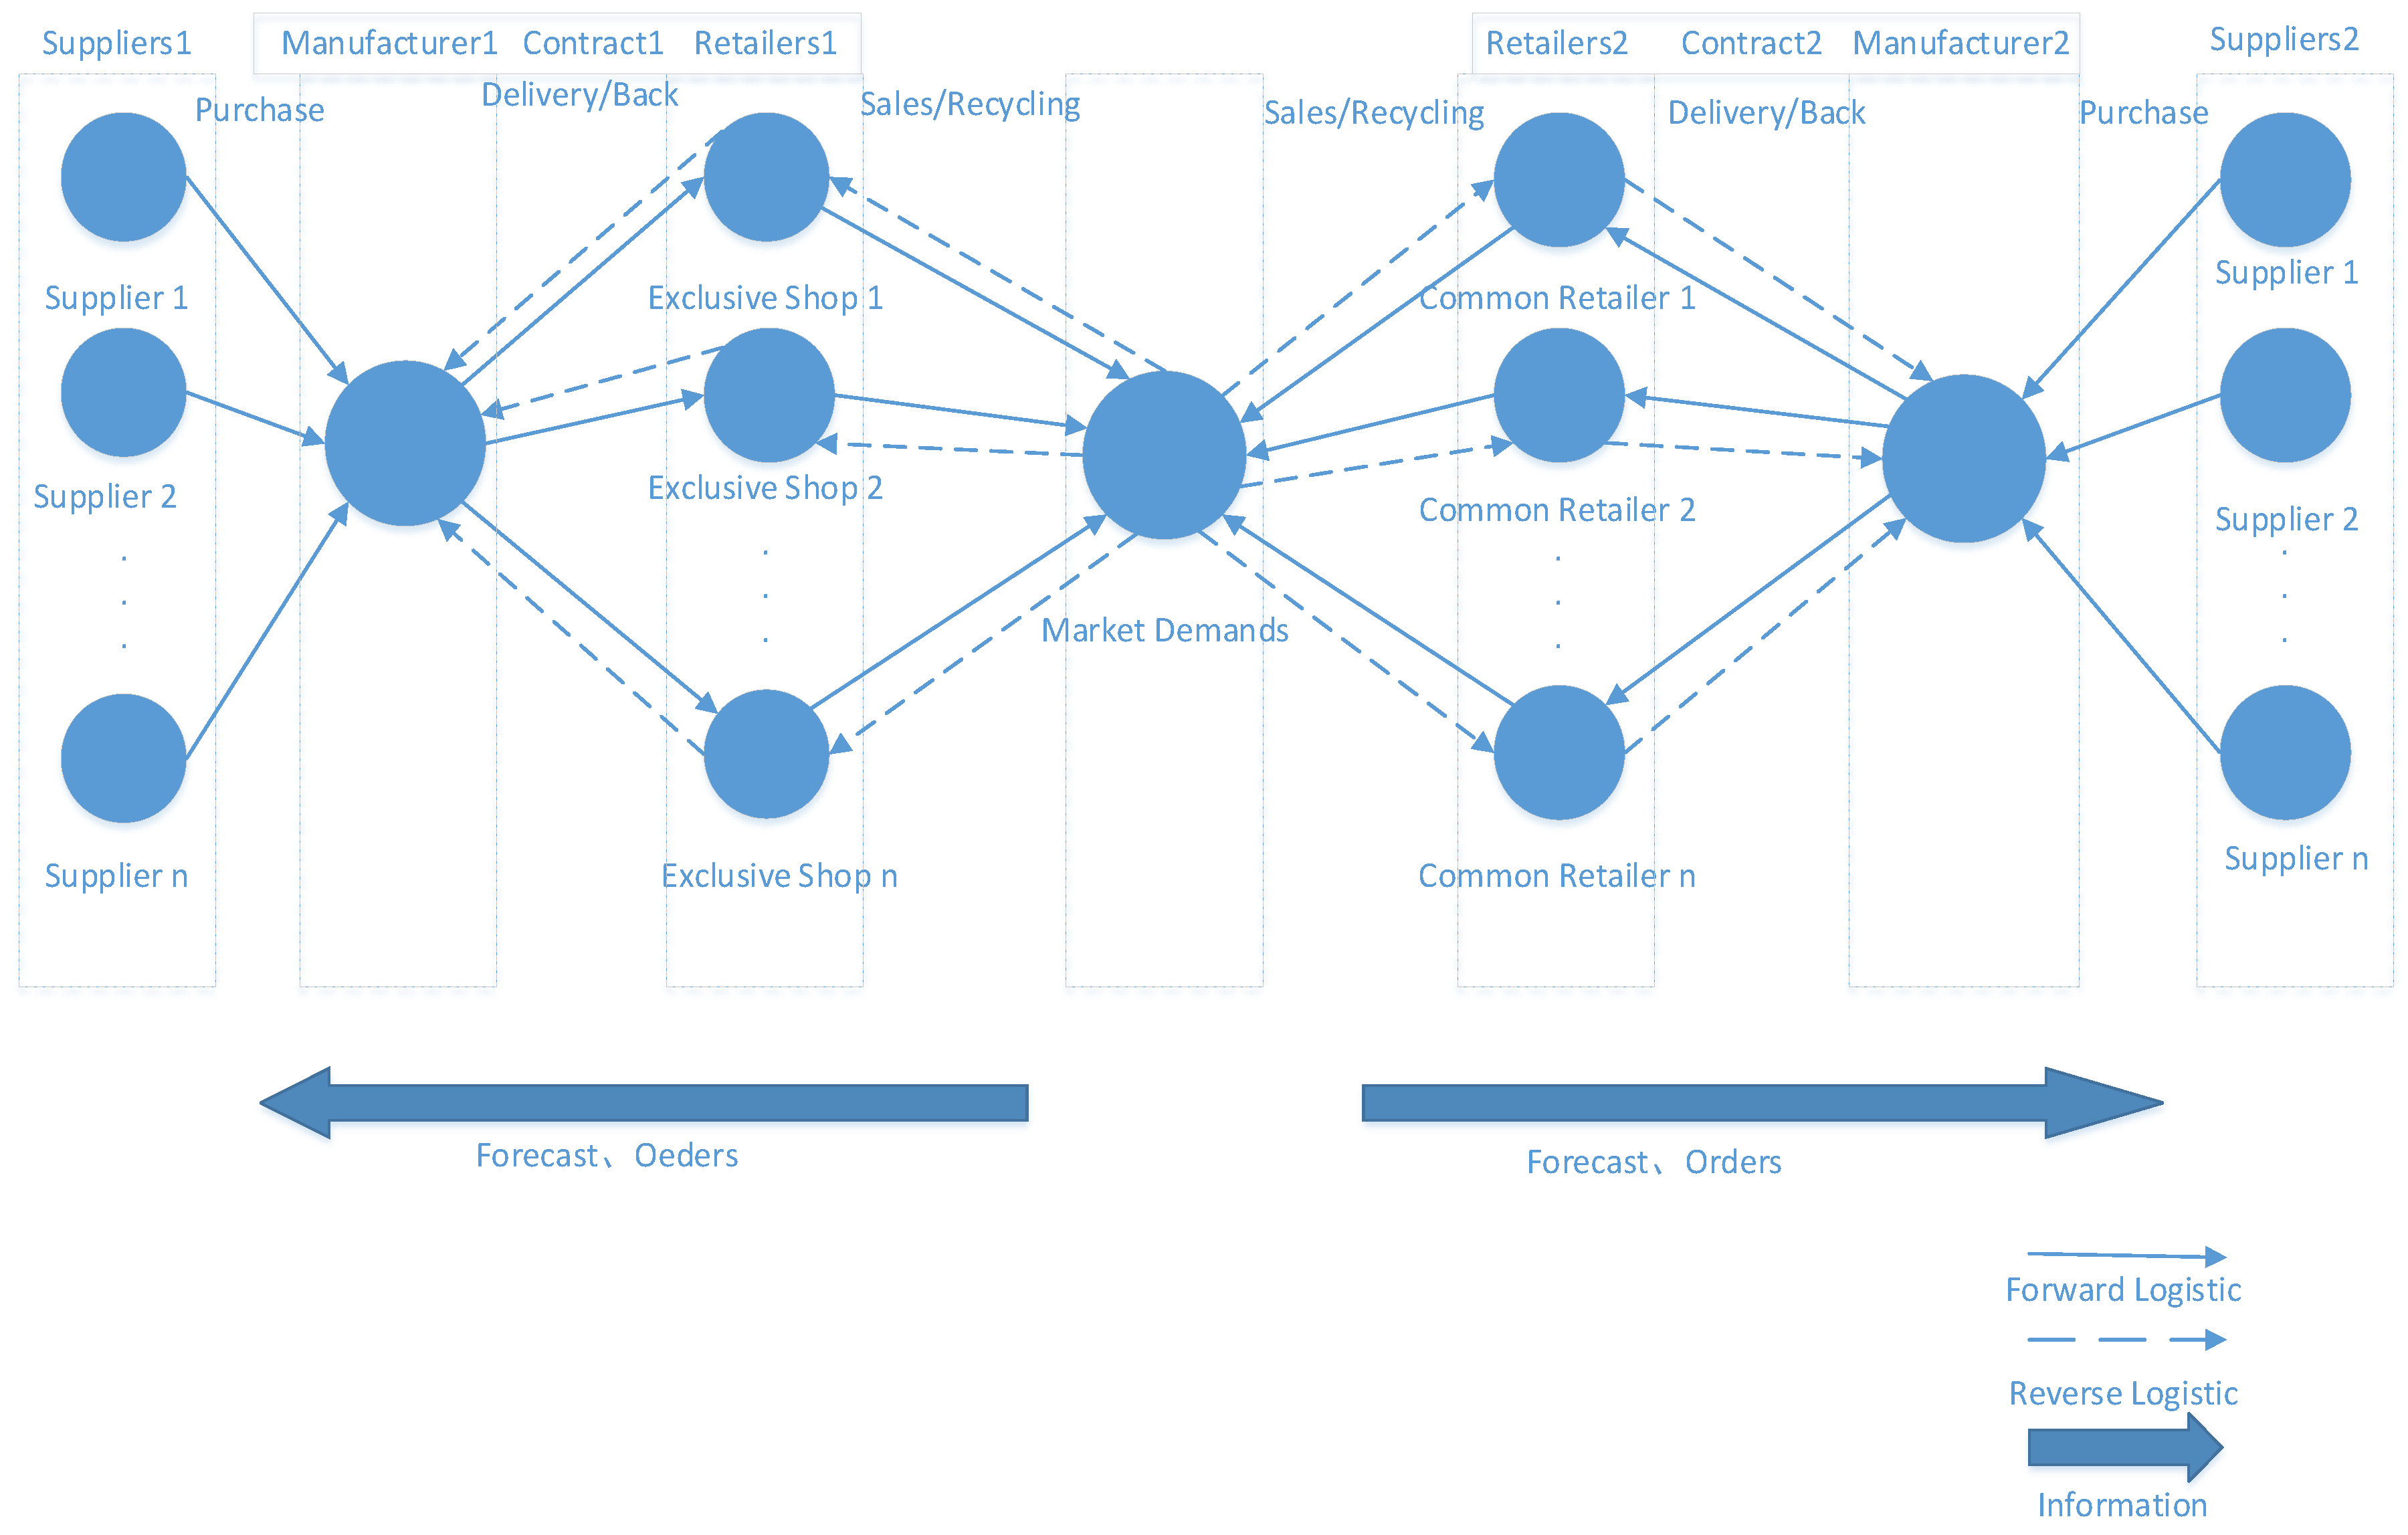
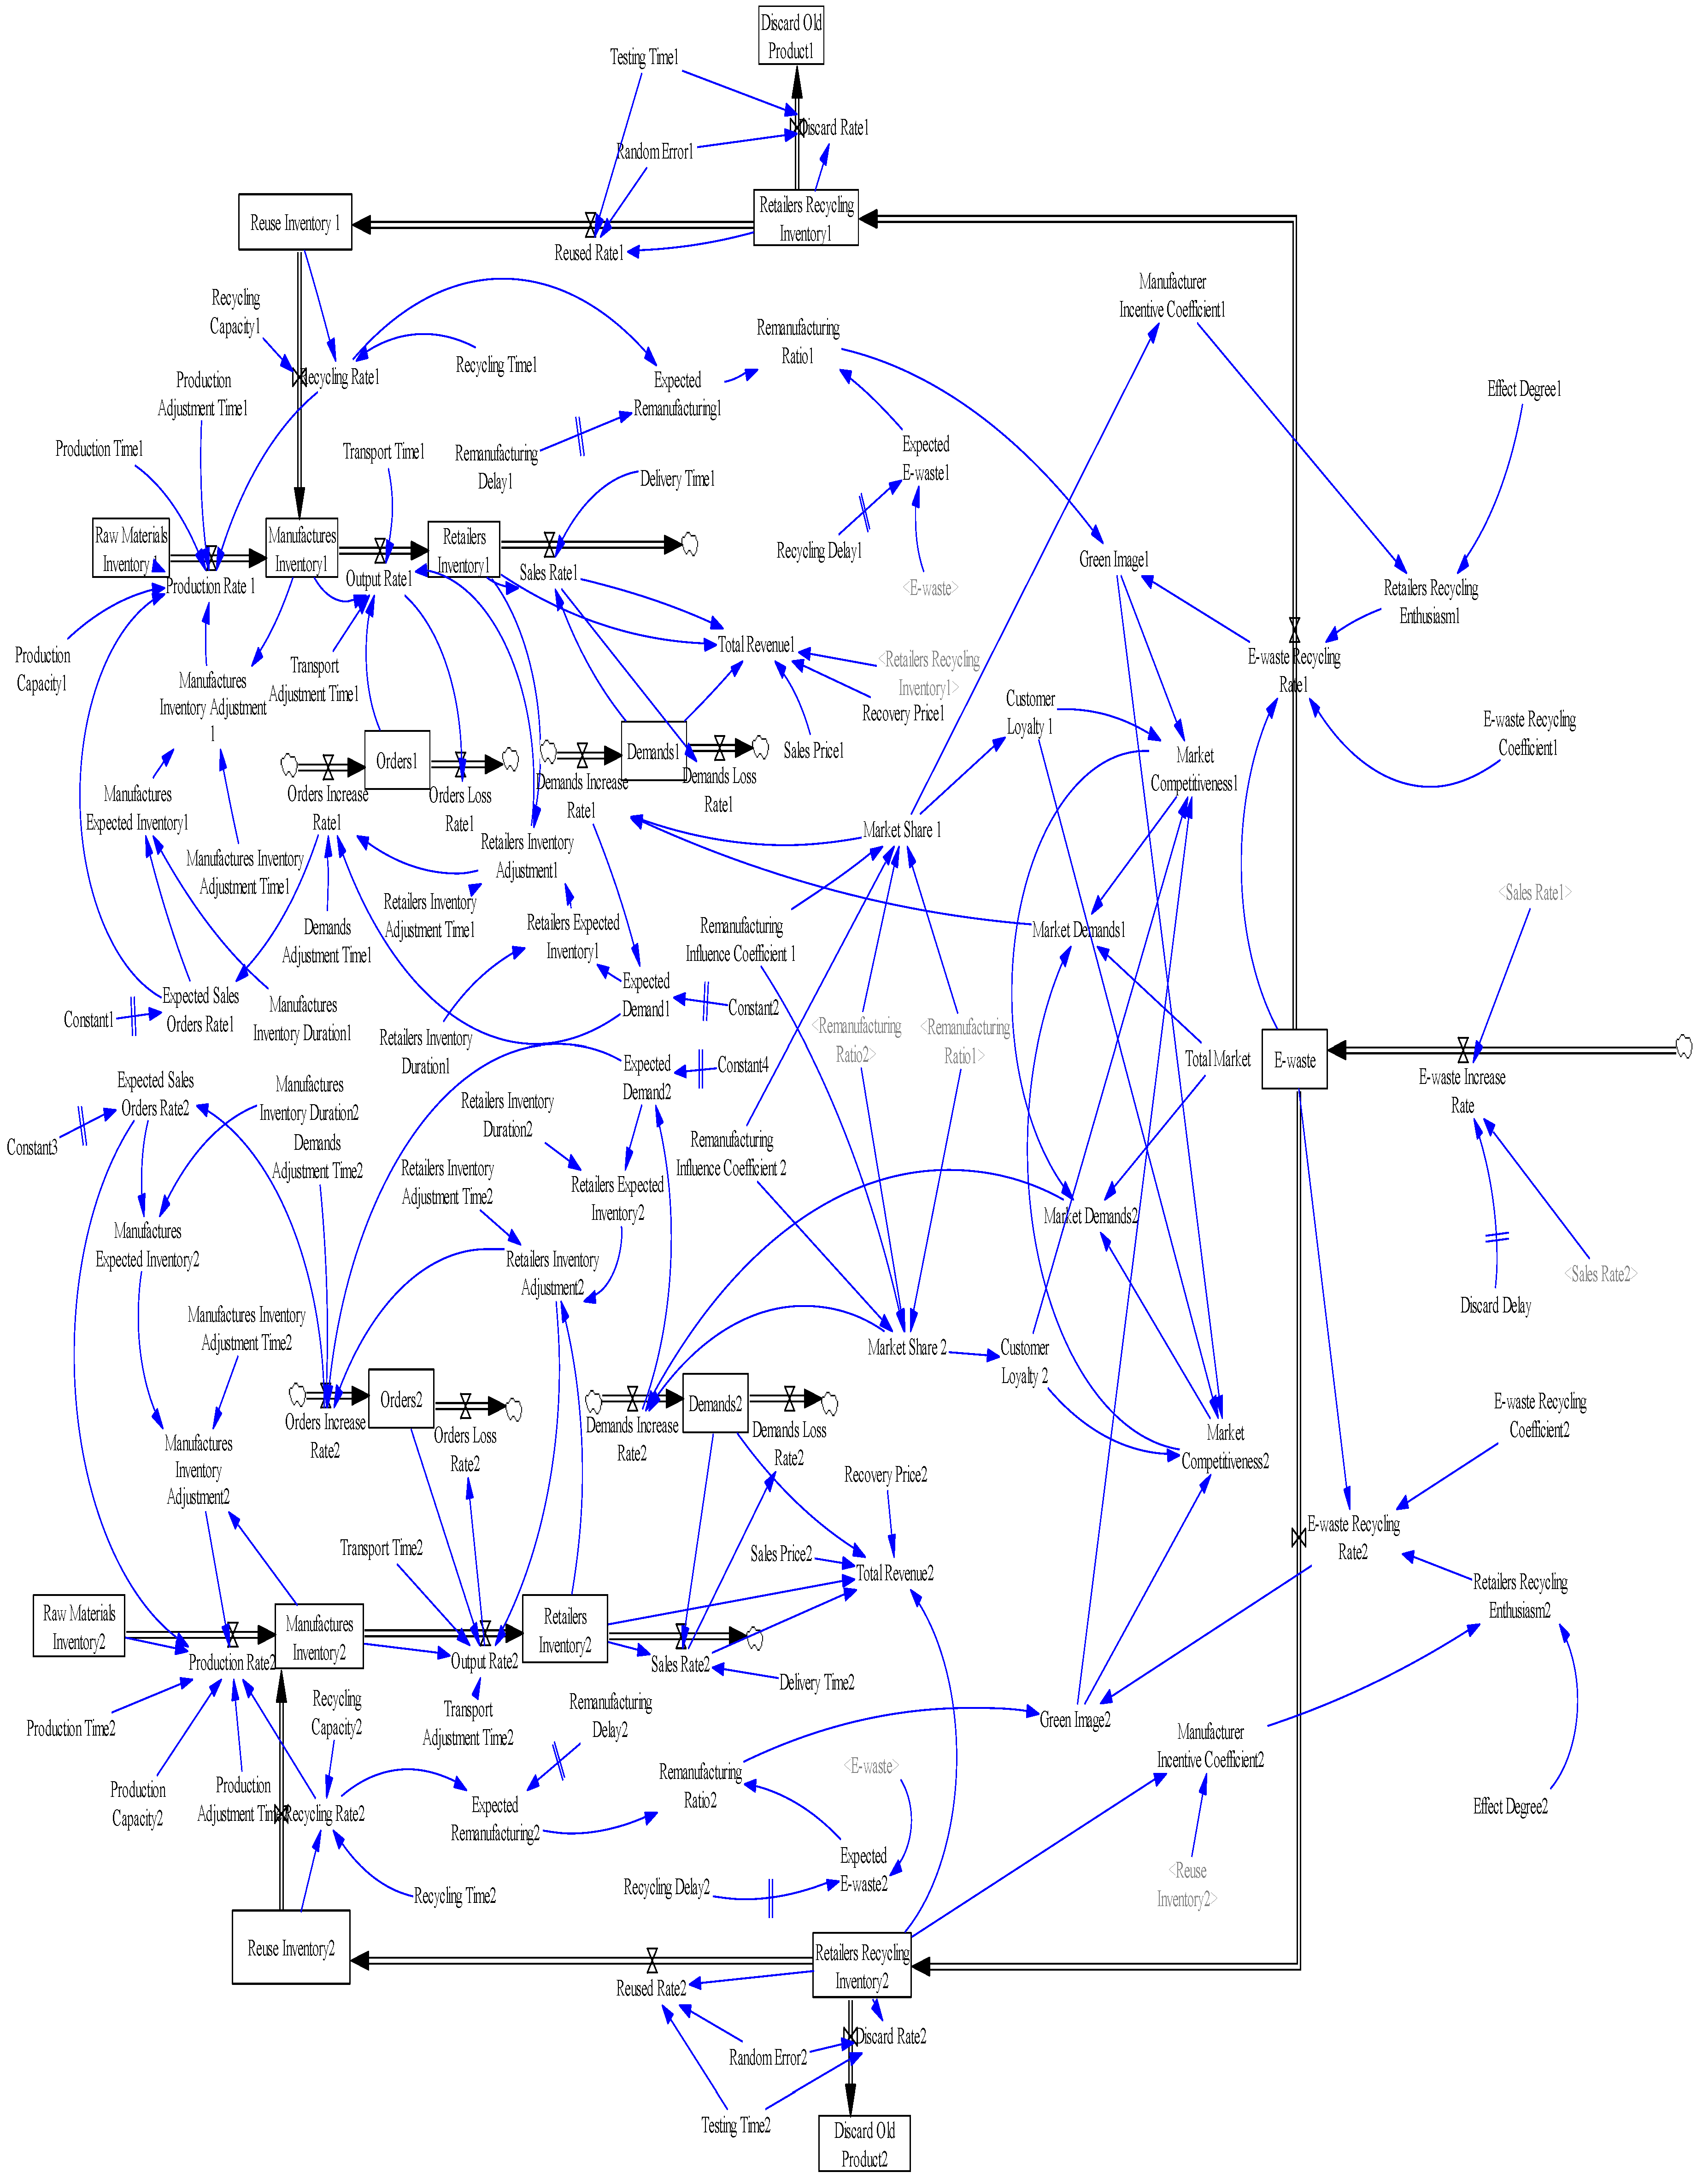
According to the structure diagram shown in
Figure 1, the SD model is constructed, as shown in
Figure 2. The supply chain 1 contains contract 1 that is the incentive strategy made by manufacturers based on MS, and the retailer is exclusive shop mode. Manufacturers can improve incentive of contract 1 to retailer through employee, the effect on the supply chain 1 can be improved. The mechanism of contract 1 is shown in
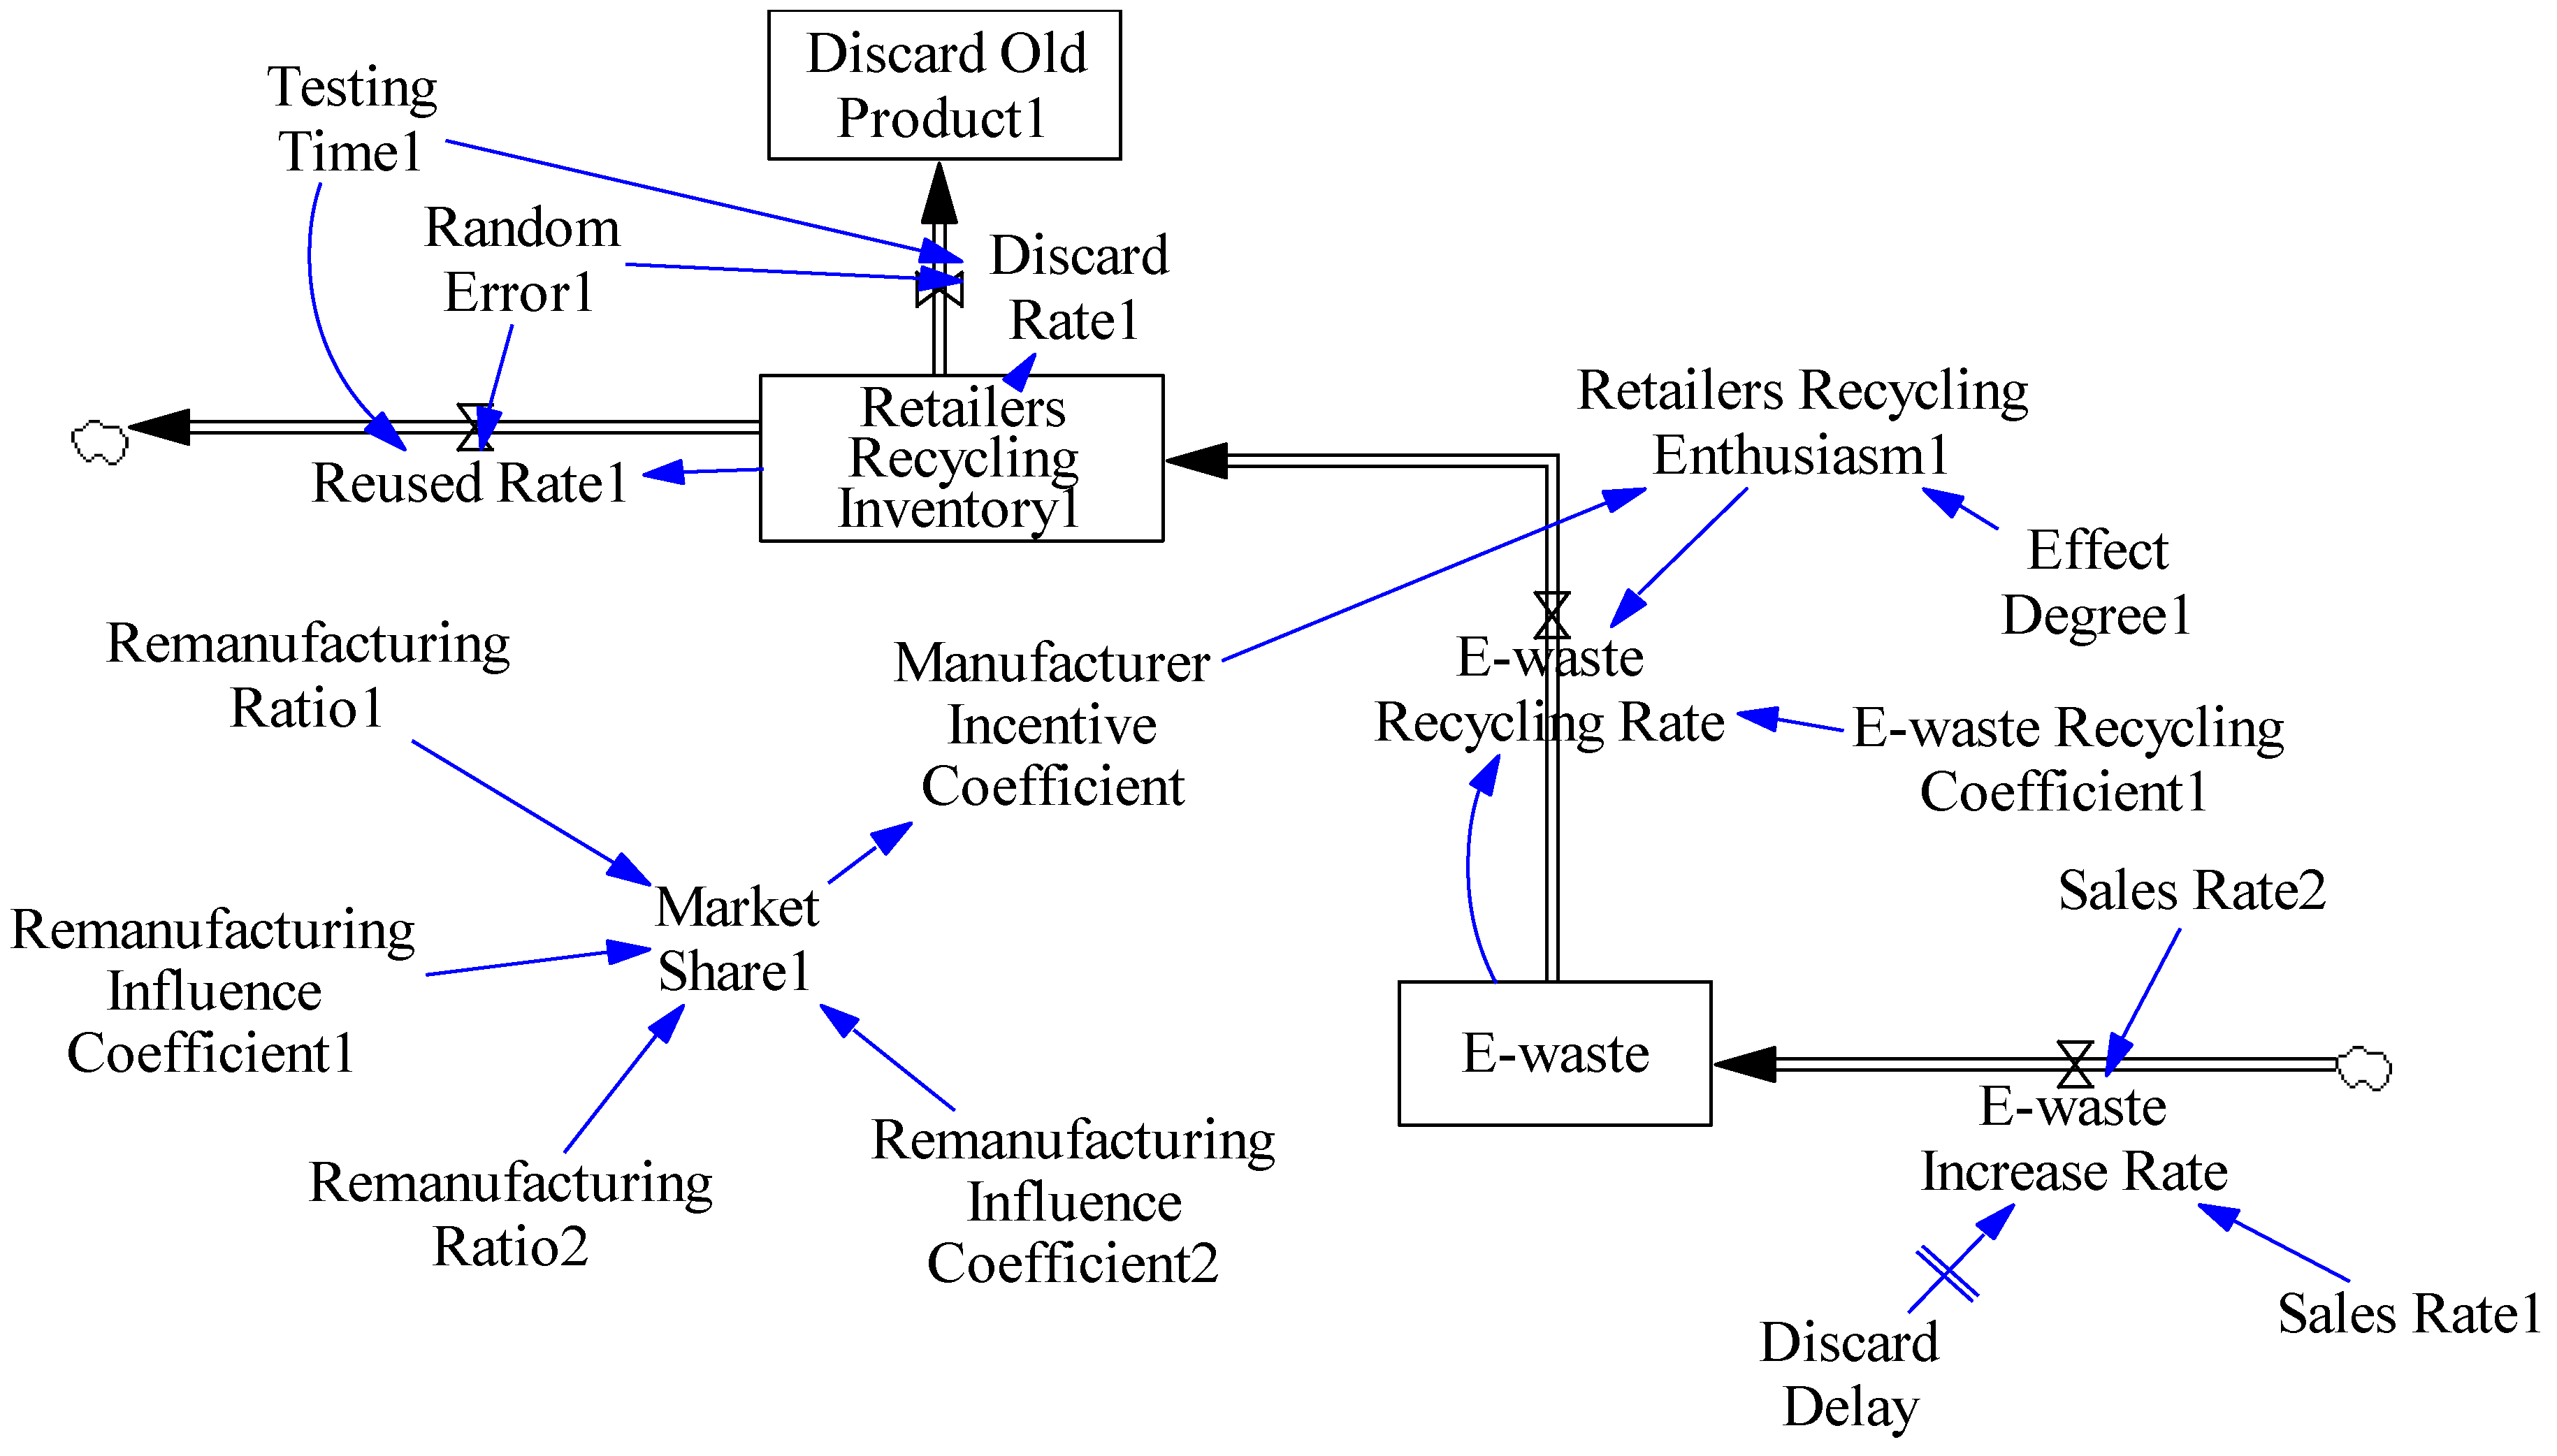
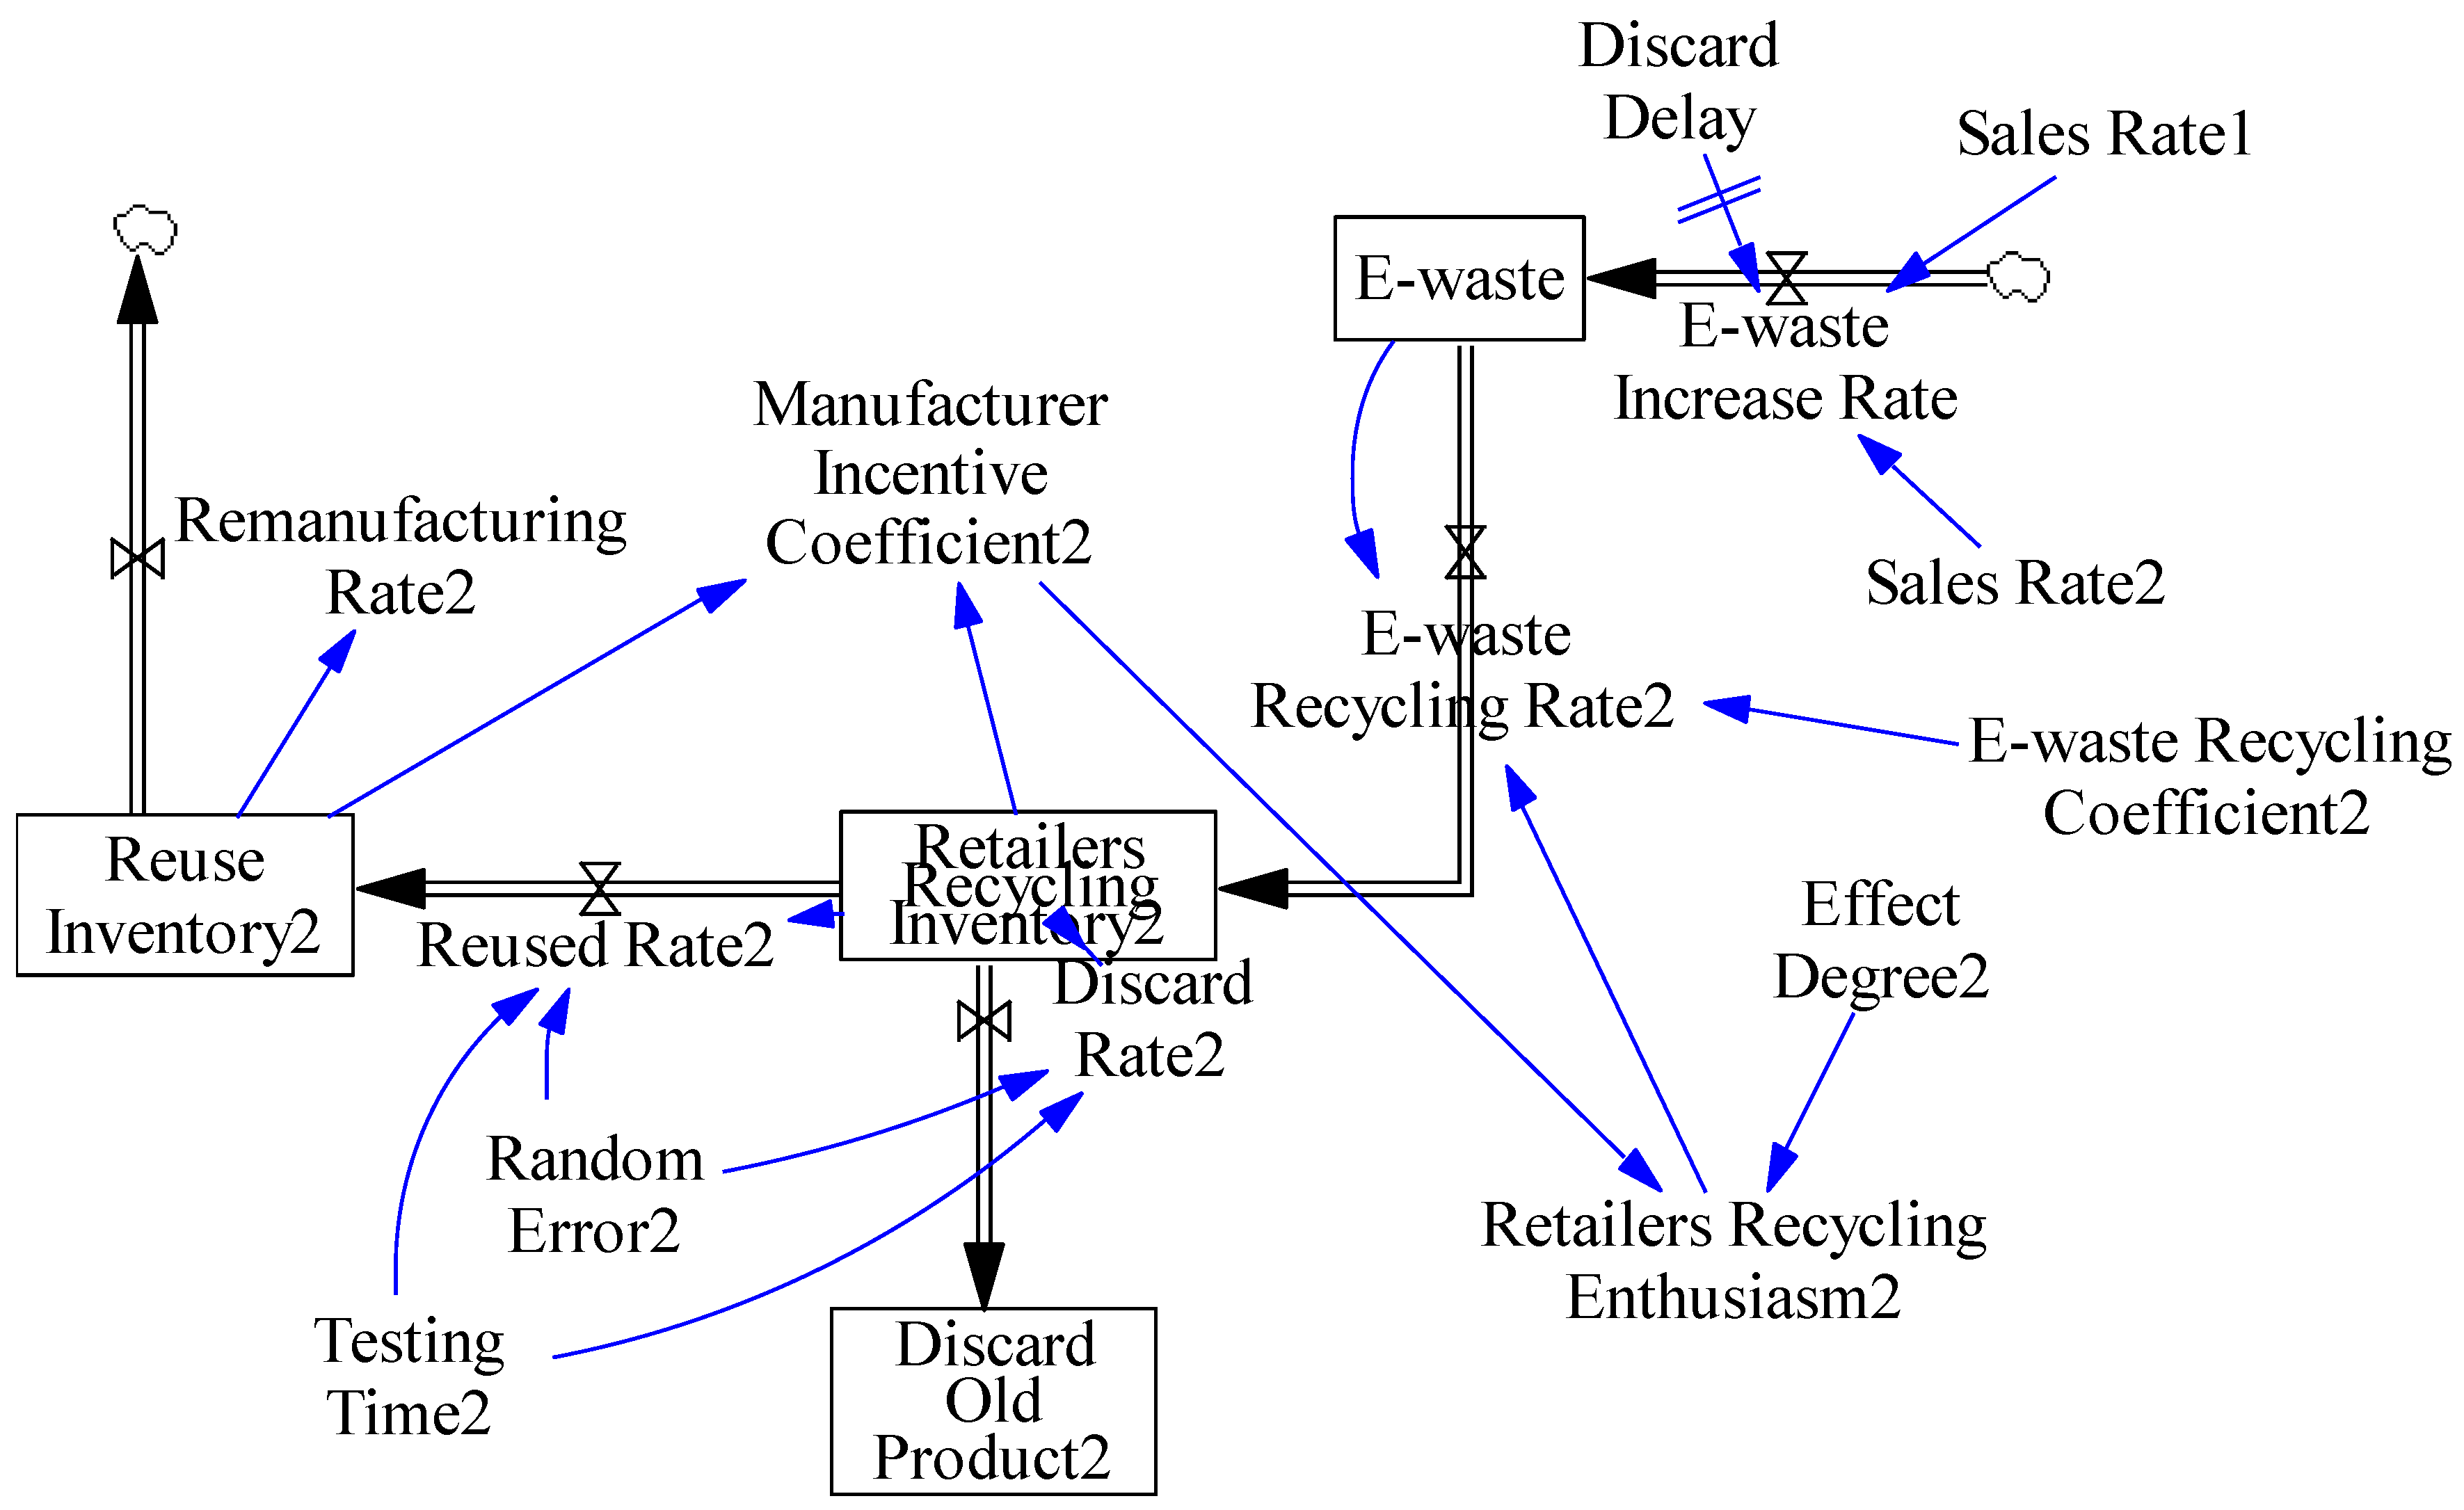
Figure 3. The supply chain 2 contains contract 2 that is the incentive strategy made by manufacturers based on the proportion of REI in RRI. Since the retailer in the supply chain 2 is common retailer that sales multiple manufacturers’ products, the retailers recycling enthusiasm is influenced by multiple manufacturers, which causes the incentive of contract 2 to retailers is stable, that the effect in the supply chain 2 stays at the same level. The mechanism of contract 2 is shown in
Figure 4.
MS reflects the proportion of a company’s sales in similar products of the market. A high MS indicates the good sales in the same product market. In the case of good sales, manufacturers have the responsibility of recycling and need more recycling as raw materials, which can save more cost. Therefore, the manufacturer makes contract 1 based on MS.
The specify rules of contract 1 are as follows:
Manufacturer incentive coefficient = IF THEN ELSE (MS ≤ 0.8, IF THEN ELSE (MS ≤ 0.6, IF THEN ELSE (MS ≤ 0.4, IF THEN ELSE (MS ≤ 0.2, 0.2, 0.5), 0.6), 0.7), 0.8).
When the MS is less than or equal to 0.2, the manufacturer incentive coefficient is 0.2.
When the MS is greater than 0.2 and less than 0.4, the manufacturer incentive coefficient is 0.5.
When the MS is greater than 0.4 and less than 0.6, the manufacturer incentive coefficient is 0.6.
When the MS is greater than 0.6 and less than 0.8, the manufacturer incentive coefficient is 0.7.
When the MS is greater than 0.8, the manufacturer incentive coefficient is 0.8.
When the proportion of REI in RRI is large, the amount of recycling used for re-manufacturing will increase. Meanwhile, the manufacturer needs to replenish the quantity of recycling in time for maintaining the reuse inventory. To gain more profit in the competition, the manufacturer makes the contract 2 based on the proportion of REI in RRI.
The specify rules of contract 2 are as follows:
IF THEN ELSE (RI ≤ (0.6 × RRI), IF THEN ELSE (RI ≤ (0.4 × RRI), IF THEN ELSE (RI ≤ (0.2 × RRI), 0.1, 0.2), 0.4), 0.6).
When RI is less than 0.2 times RRI, the manufacturer incentive coefficient is 0.1.
When RI is greater than 0.2 times RRI and less than 0.4 times RRI, manufacturer incentive coefficient is 0.2.
When RI is greater than 0.4 times RRI and less than 0.6 times RRI, manufacturer incentive coefficient is 0.4.
When RI is greater than 0.6 times RRI, the manufacturer incentive coefficient is 0.6.
In the above two contracts, retailers recycling enthusiasm is equal to manufacturer incentive coefficient times effect degree.
4.3. Equation of the Model
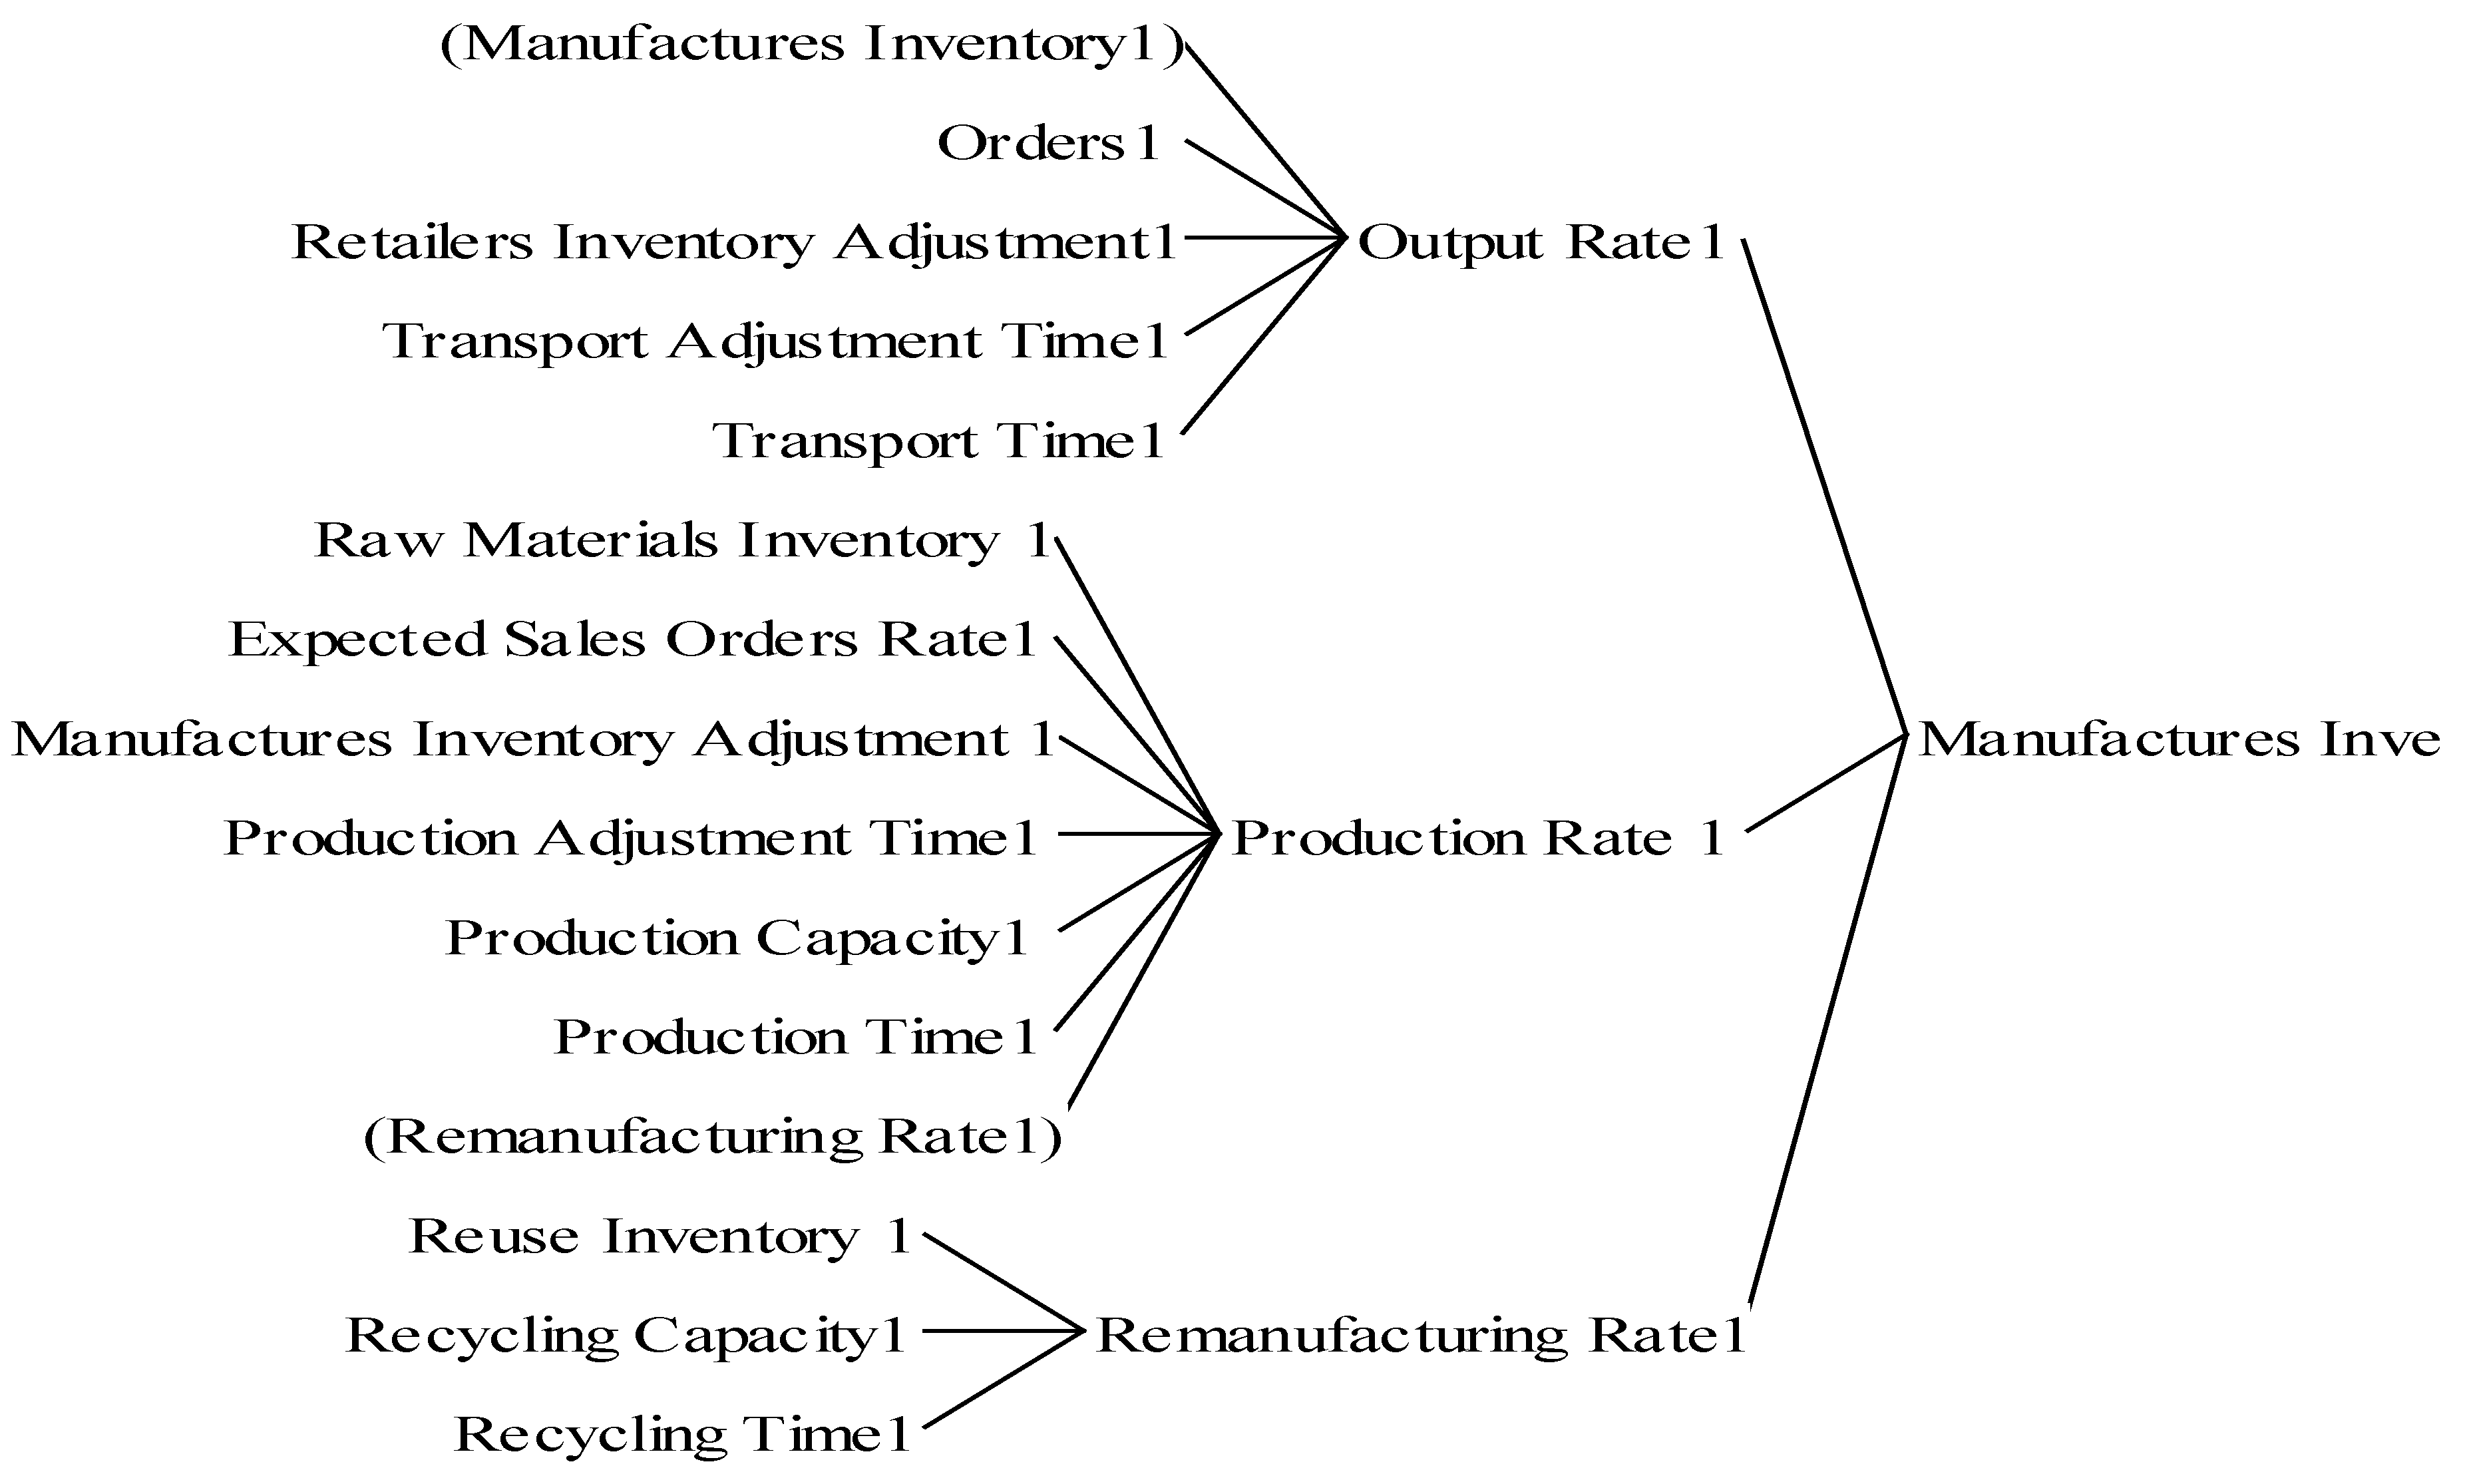
Figure 5 is the causes tree of Manufacturers Inventory 1. Manufacturers Inventory (MI) is the stock. The change in inventory value is effected by production rate (PR), re-manufacturing rate (RER) and output rate (OR), which is the integration of PR plus the RER minus the OR. Increase of PR and RER will increase MI. The output rate can reduce MI.
The PR is influenced by production capacity (PC), raw materials inventory (RMI), production time (PT), excepted sales orders rate (ESOR), RER, manufacturers inventory adjustment (MIA) and production adjustment time (PAT). RER is limited by reuse inventory (REI) and re-manufacturing capacity (REC), which is REI times REC divided by re-manufacturing time (RET).
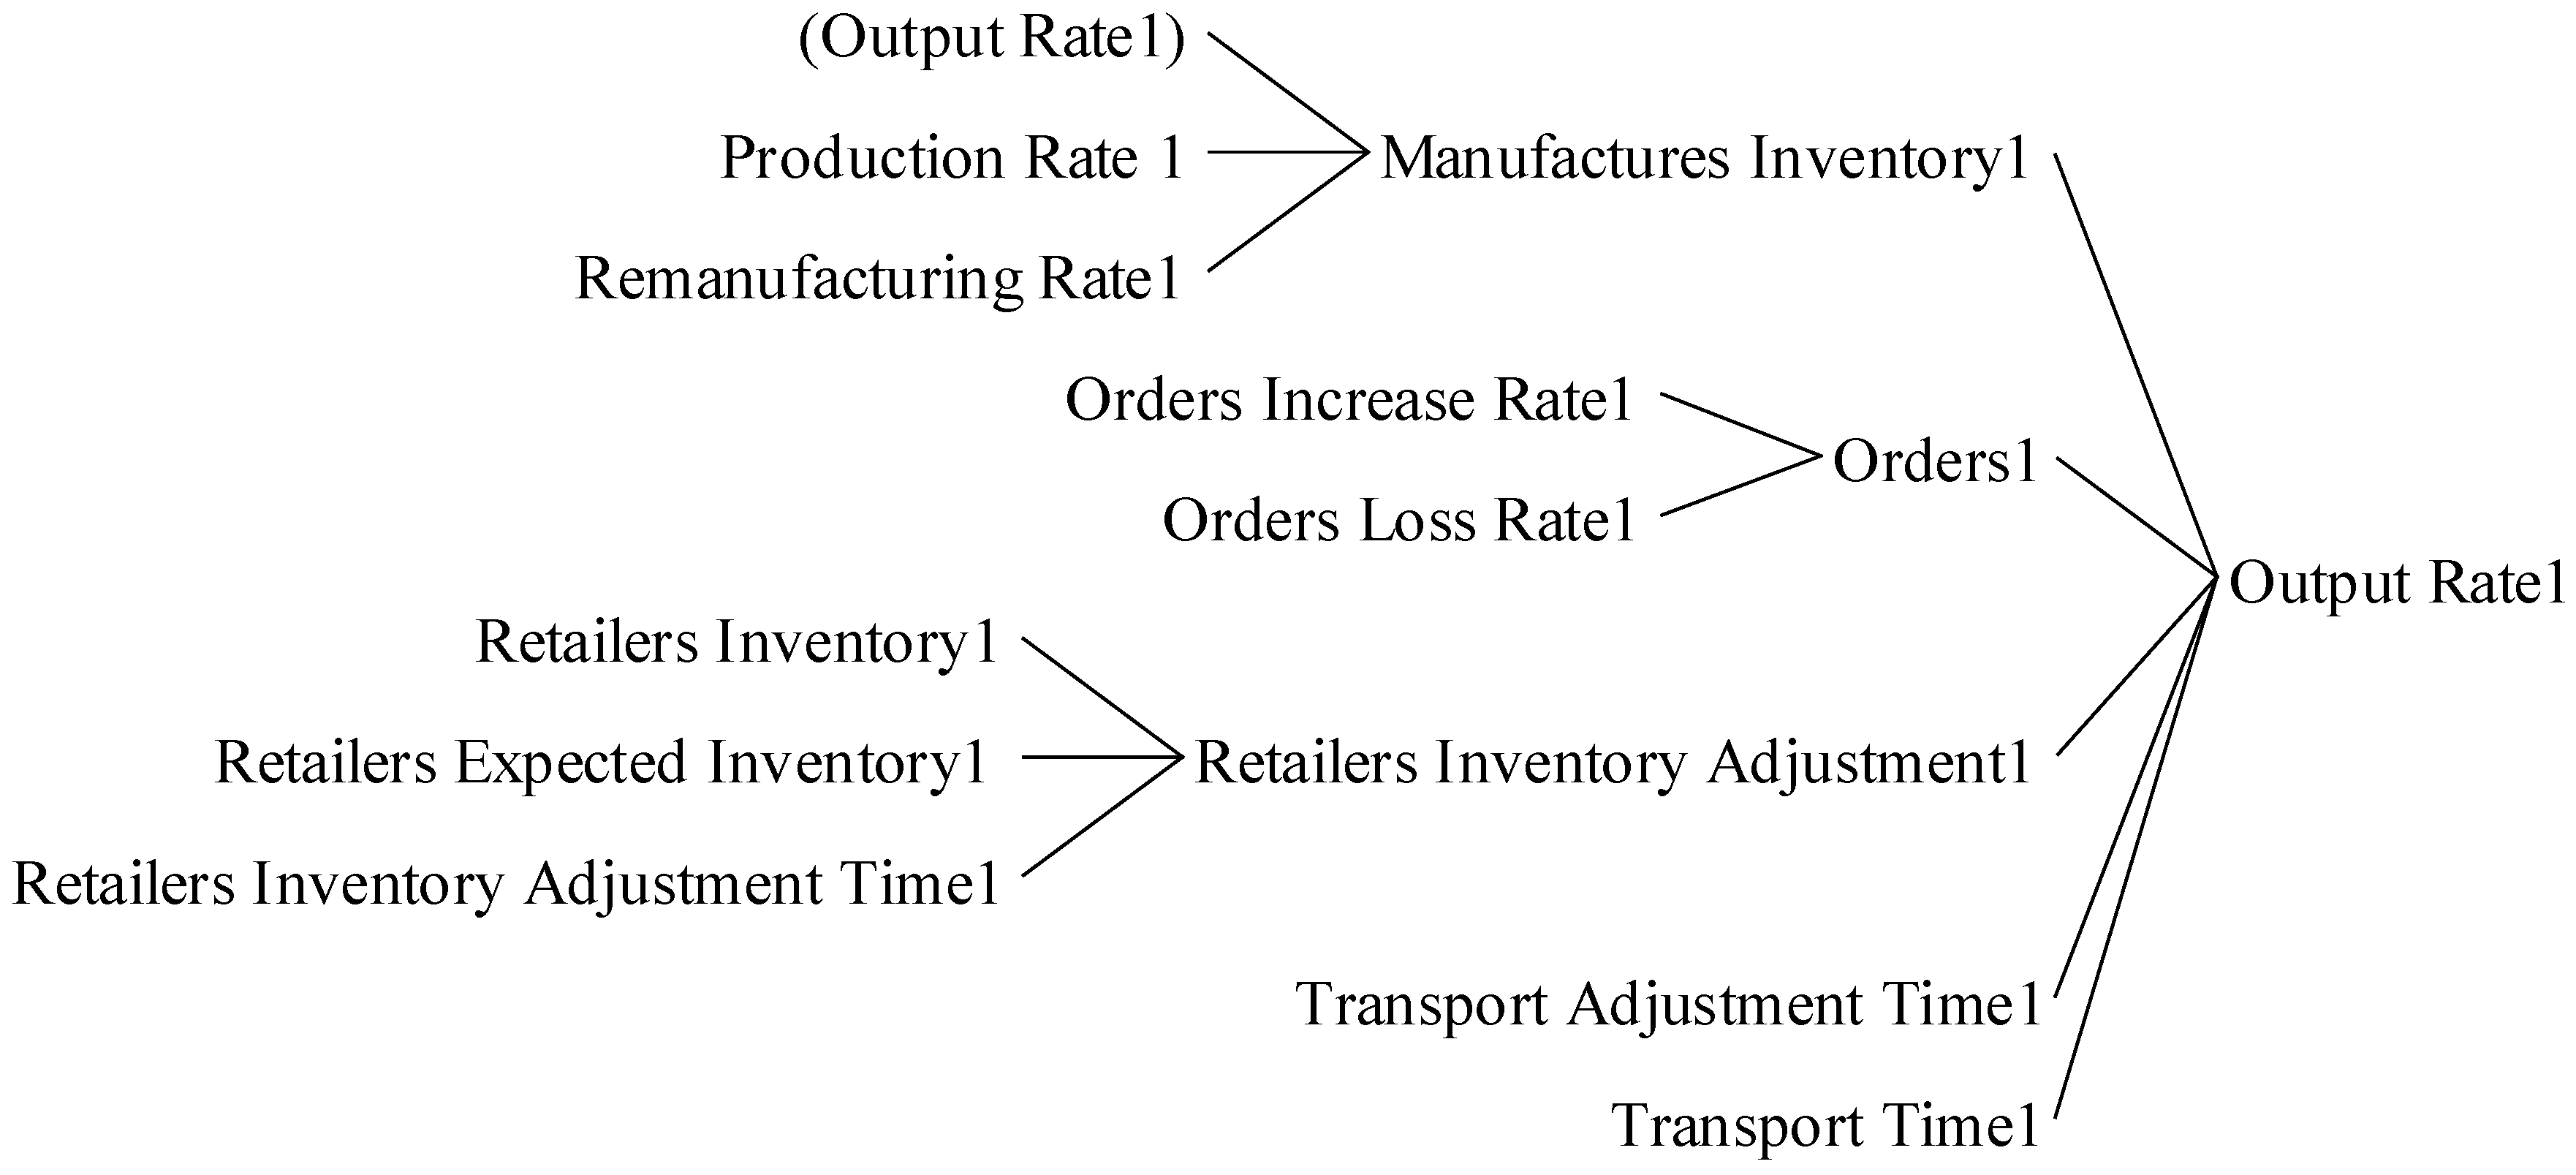
Figure 6 is the causes tree of Output Rate 1. Comparison MI with orders, the smaller one divided by transport time (TT) is compared with inventory adjustment (RIA) divided by transport adjustment time (TAT), and the smaller one is OR, which is more in line with the real world. The RIA is the difference between retailers expected inventory (REI) and retailers inventory (RI) divided by retailers inventory adjustment time (RIAT).
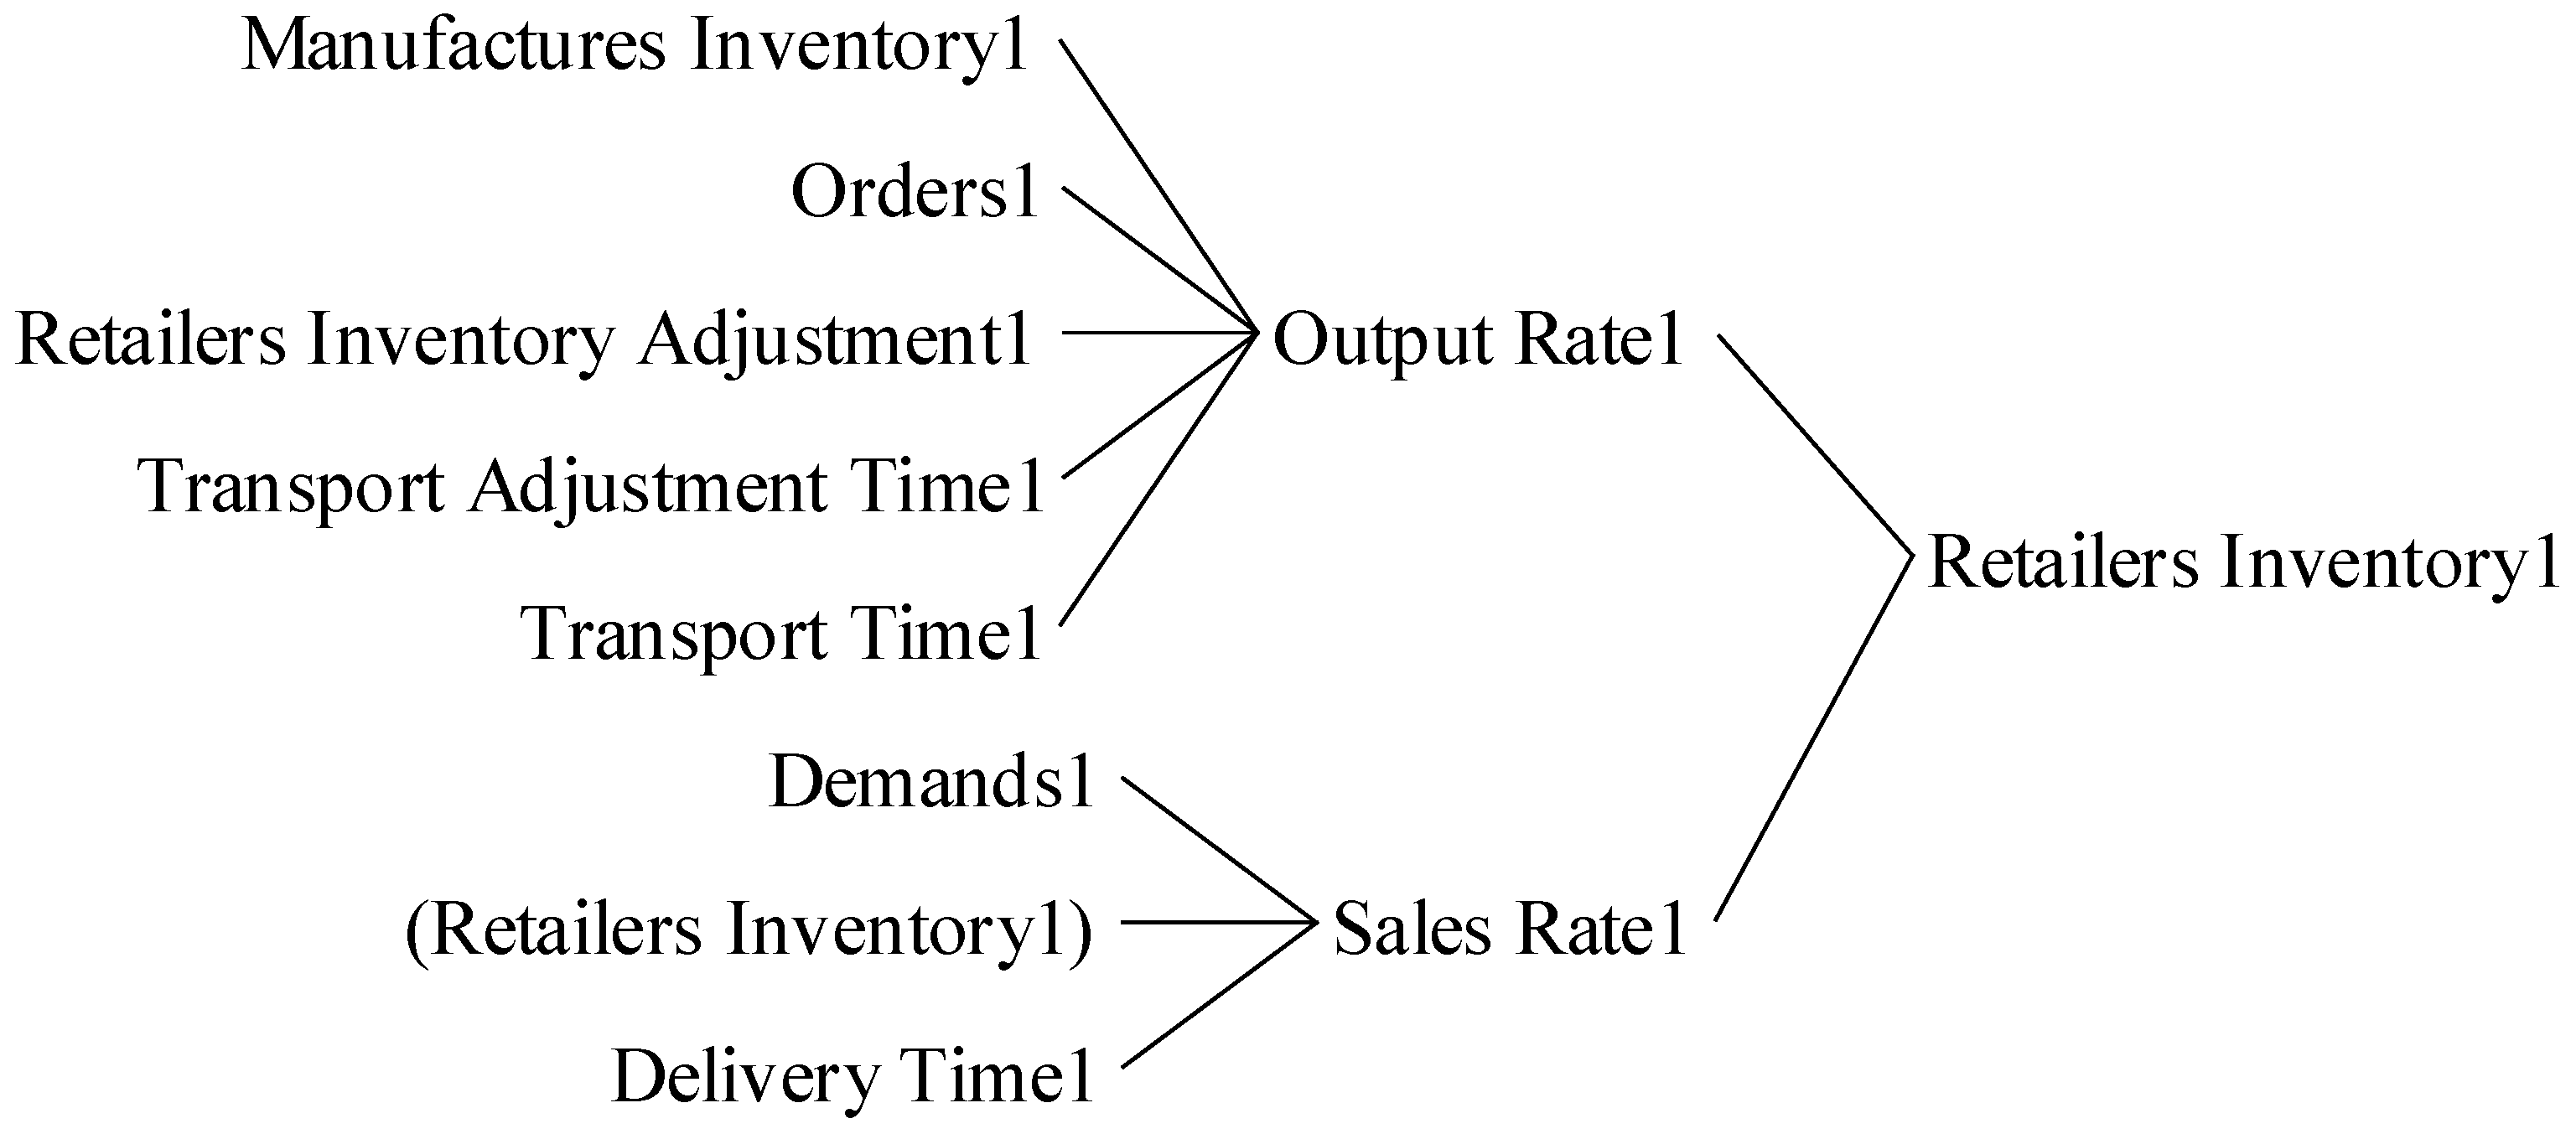
Figure 7 is the causes tree of Retailers Inventory 1. The RI is a state variable that represents the stock. The change of RI is influenced by OR and sales rate (SR), it is the integration of OR minus SR. The OR is the increasing rate of RI, and the SR is the decrease of RI. Comparison of the orders with the RI, the smaller variable divided by sales time (ST) is the SR, which is more in line with the real world.
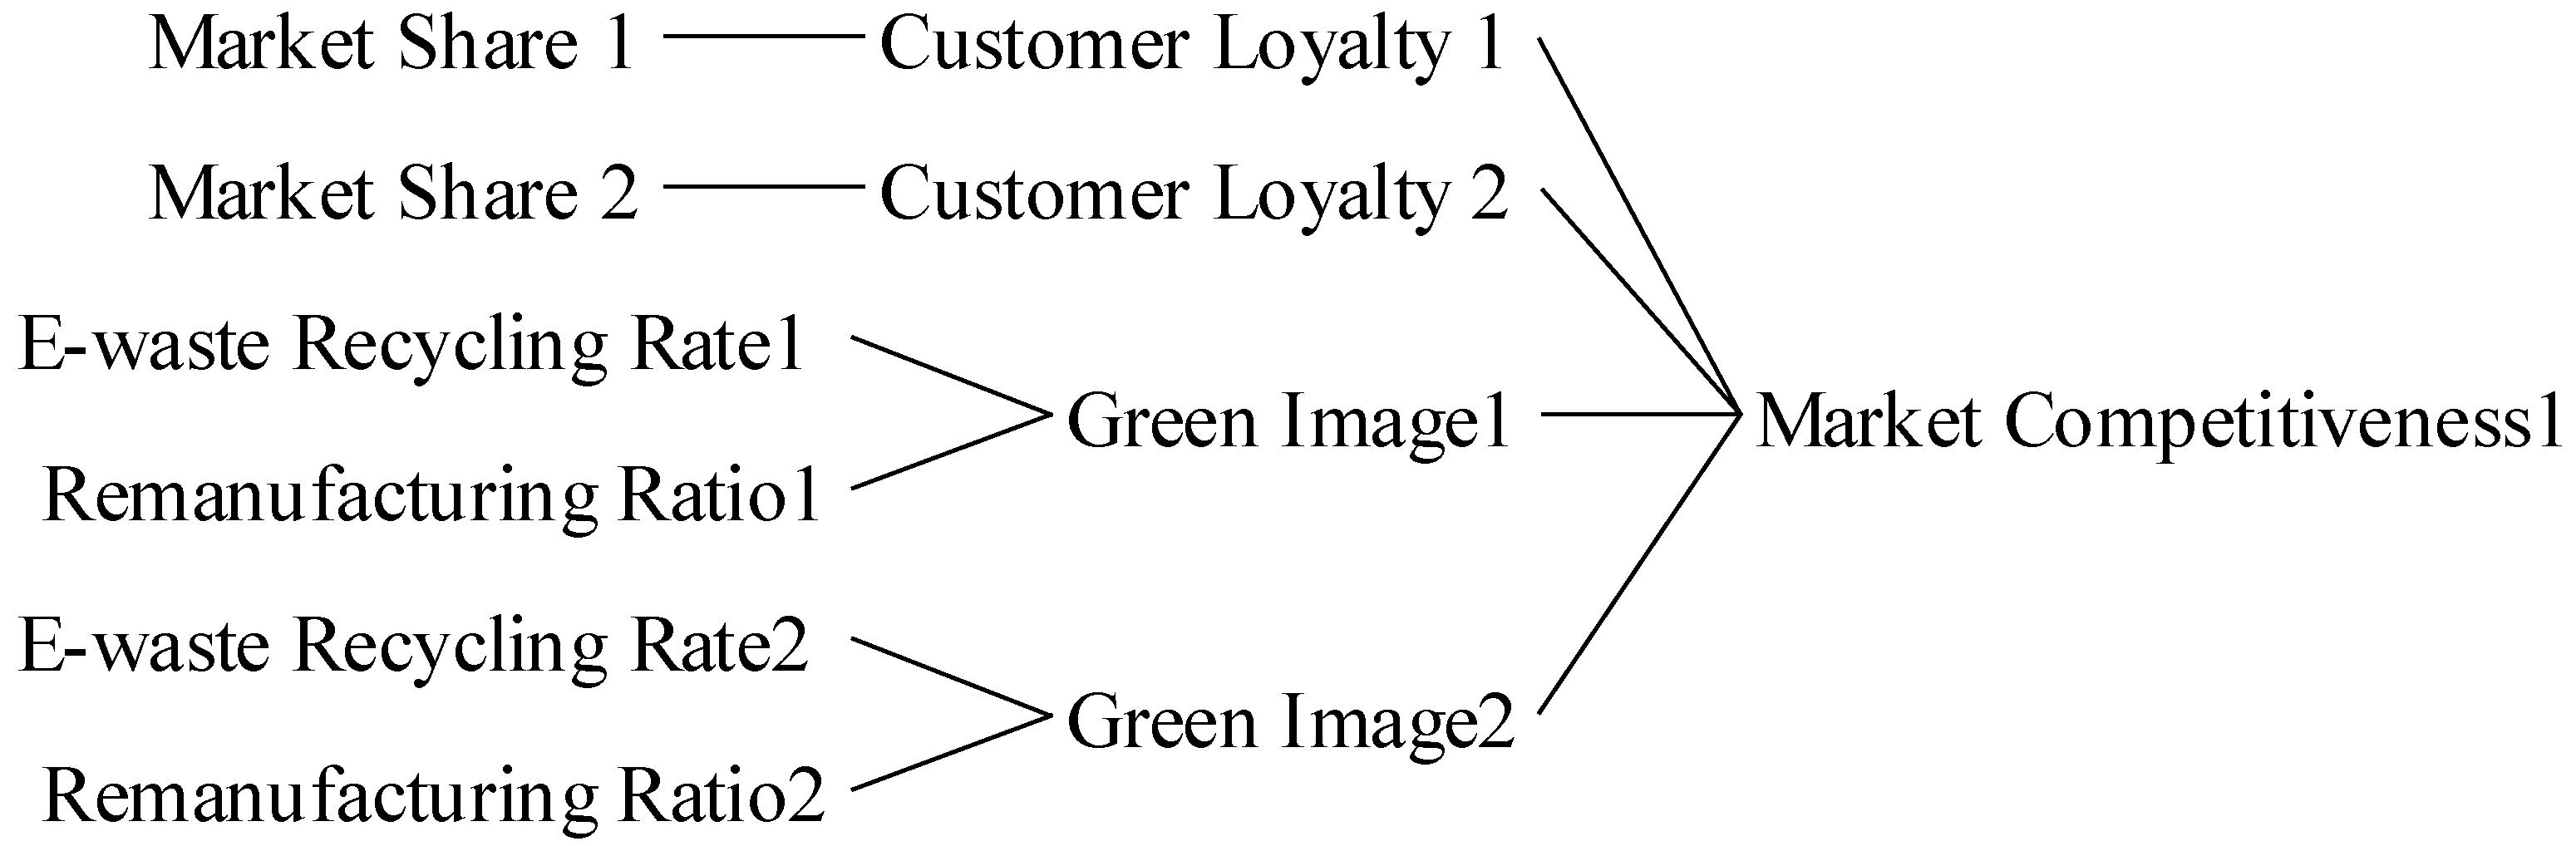
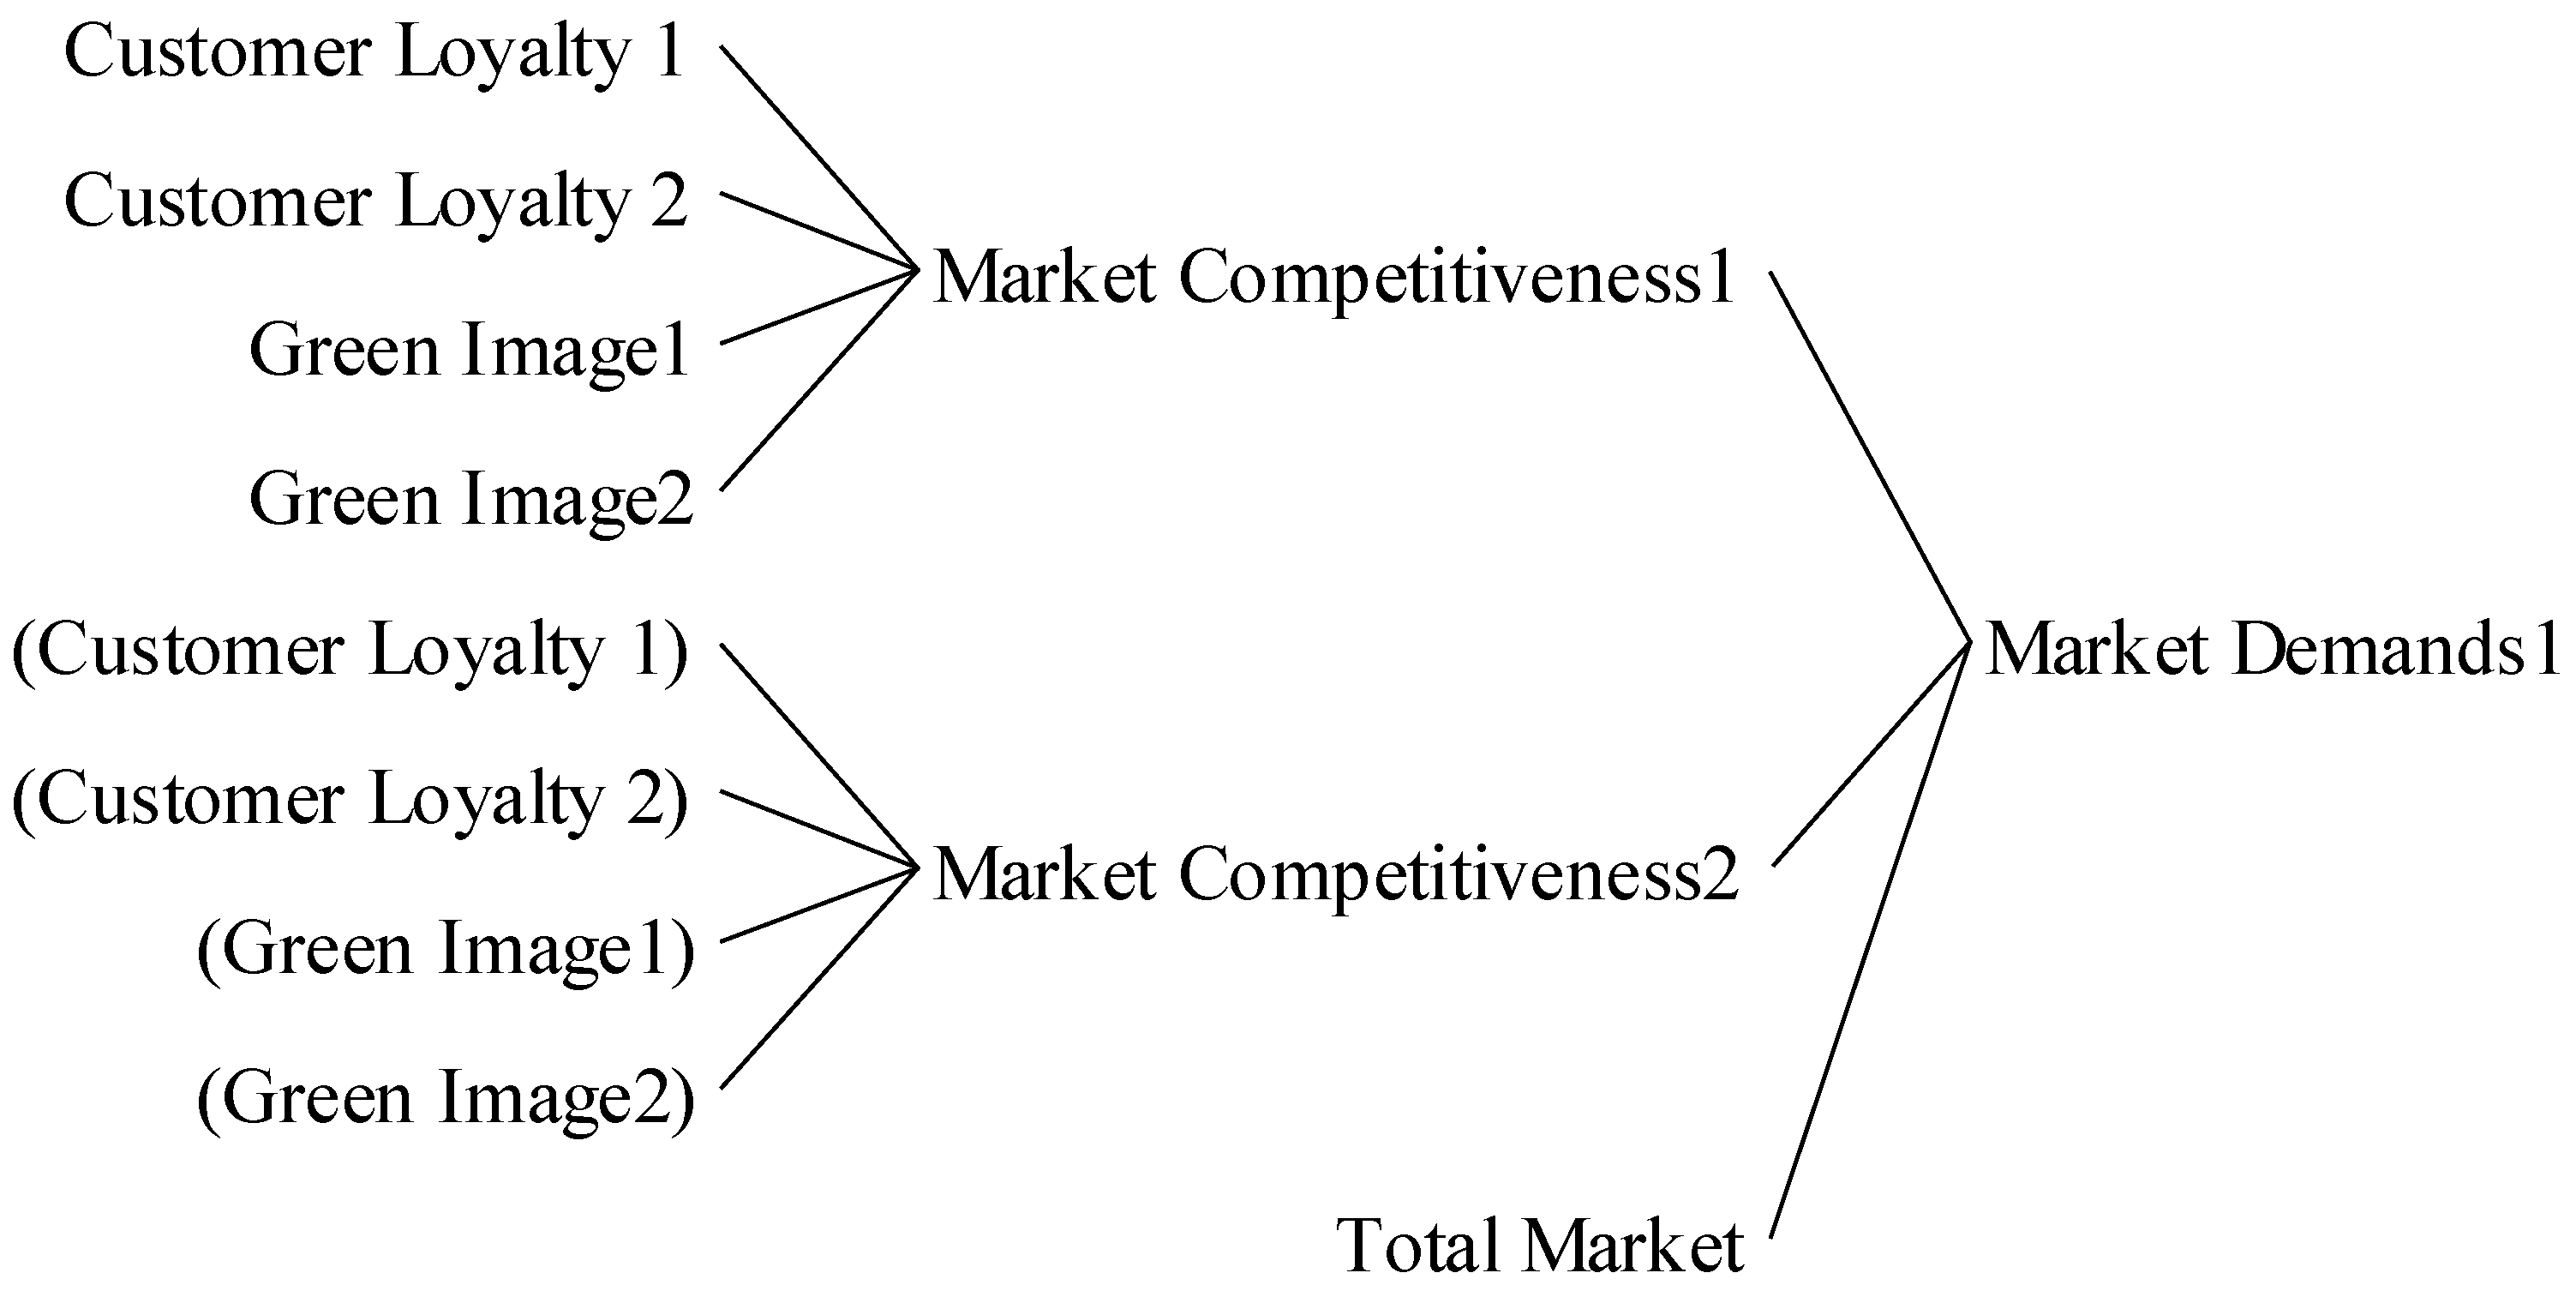
Figure 8 is the causes tree of Market Competitiveness 1. MC1 is the customer loyalty (CL) 1 times green image (GI) 1 divided by the sum of the CL times GI in two chains. The GI 1 is E-waste recycling rate (ERR) 1 times re-manufacturing ratio (RER) 1. The relationship between CL and MS is the direct ratio.
Figure 9 is the causes tree of Market Demands 1. Two chains compete for the total demands (TD) of the same market, and the ratio of MC 1 to the sum of MC in two chains is the ratio of TD. Market Demands (MD)1 is TD times the ratio.
5. Simulation and Discussion
To match the simulation results with the reality, the constant value in the system dynamics model is set as shown in
Table 1 according to actual business operation research.
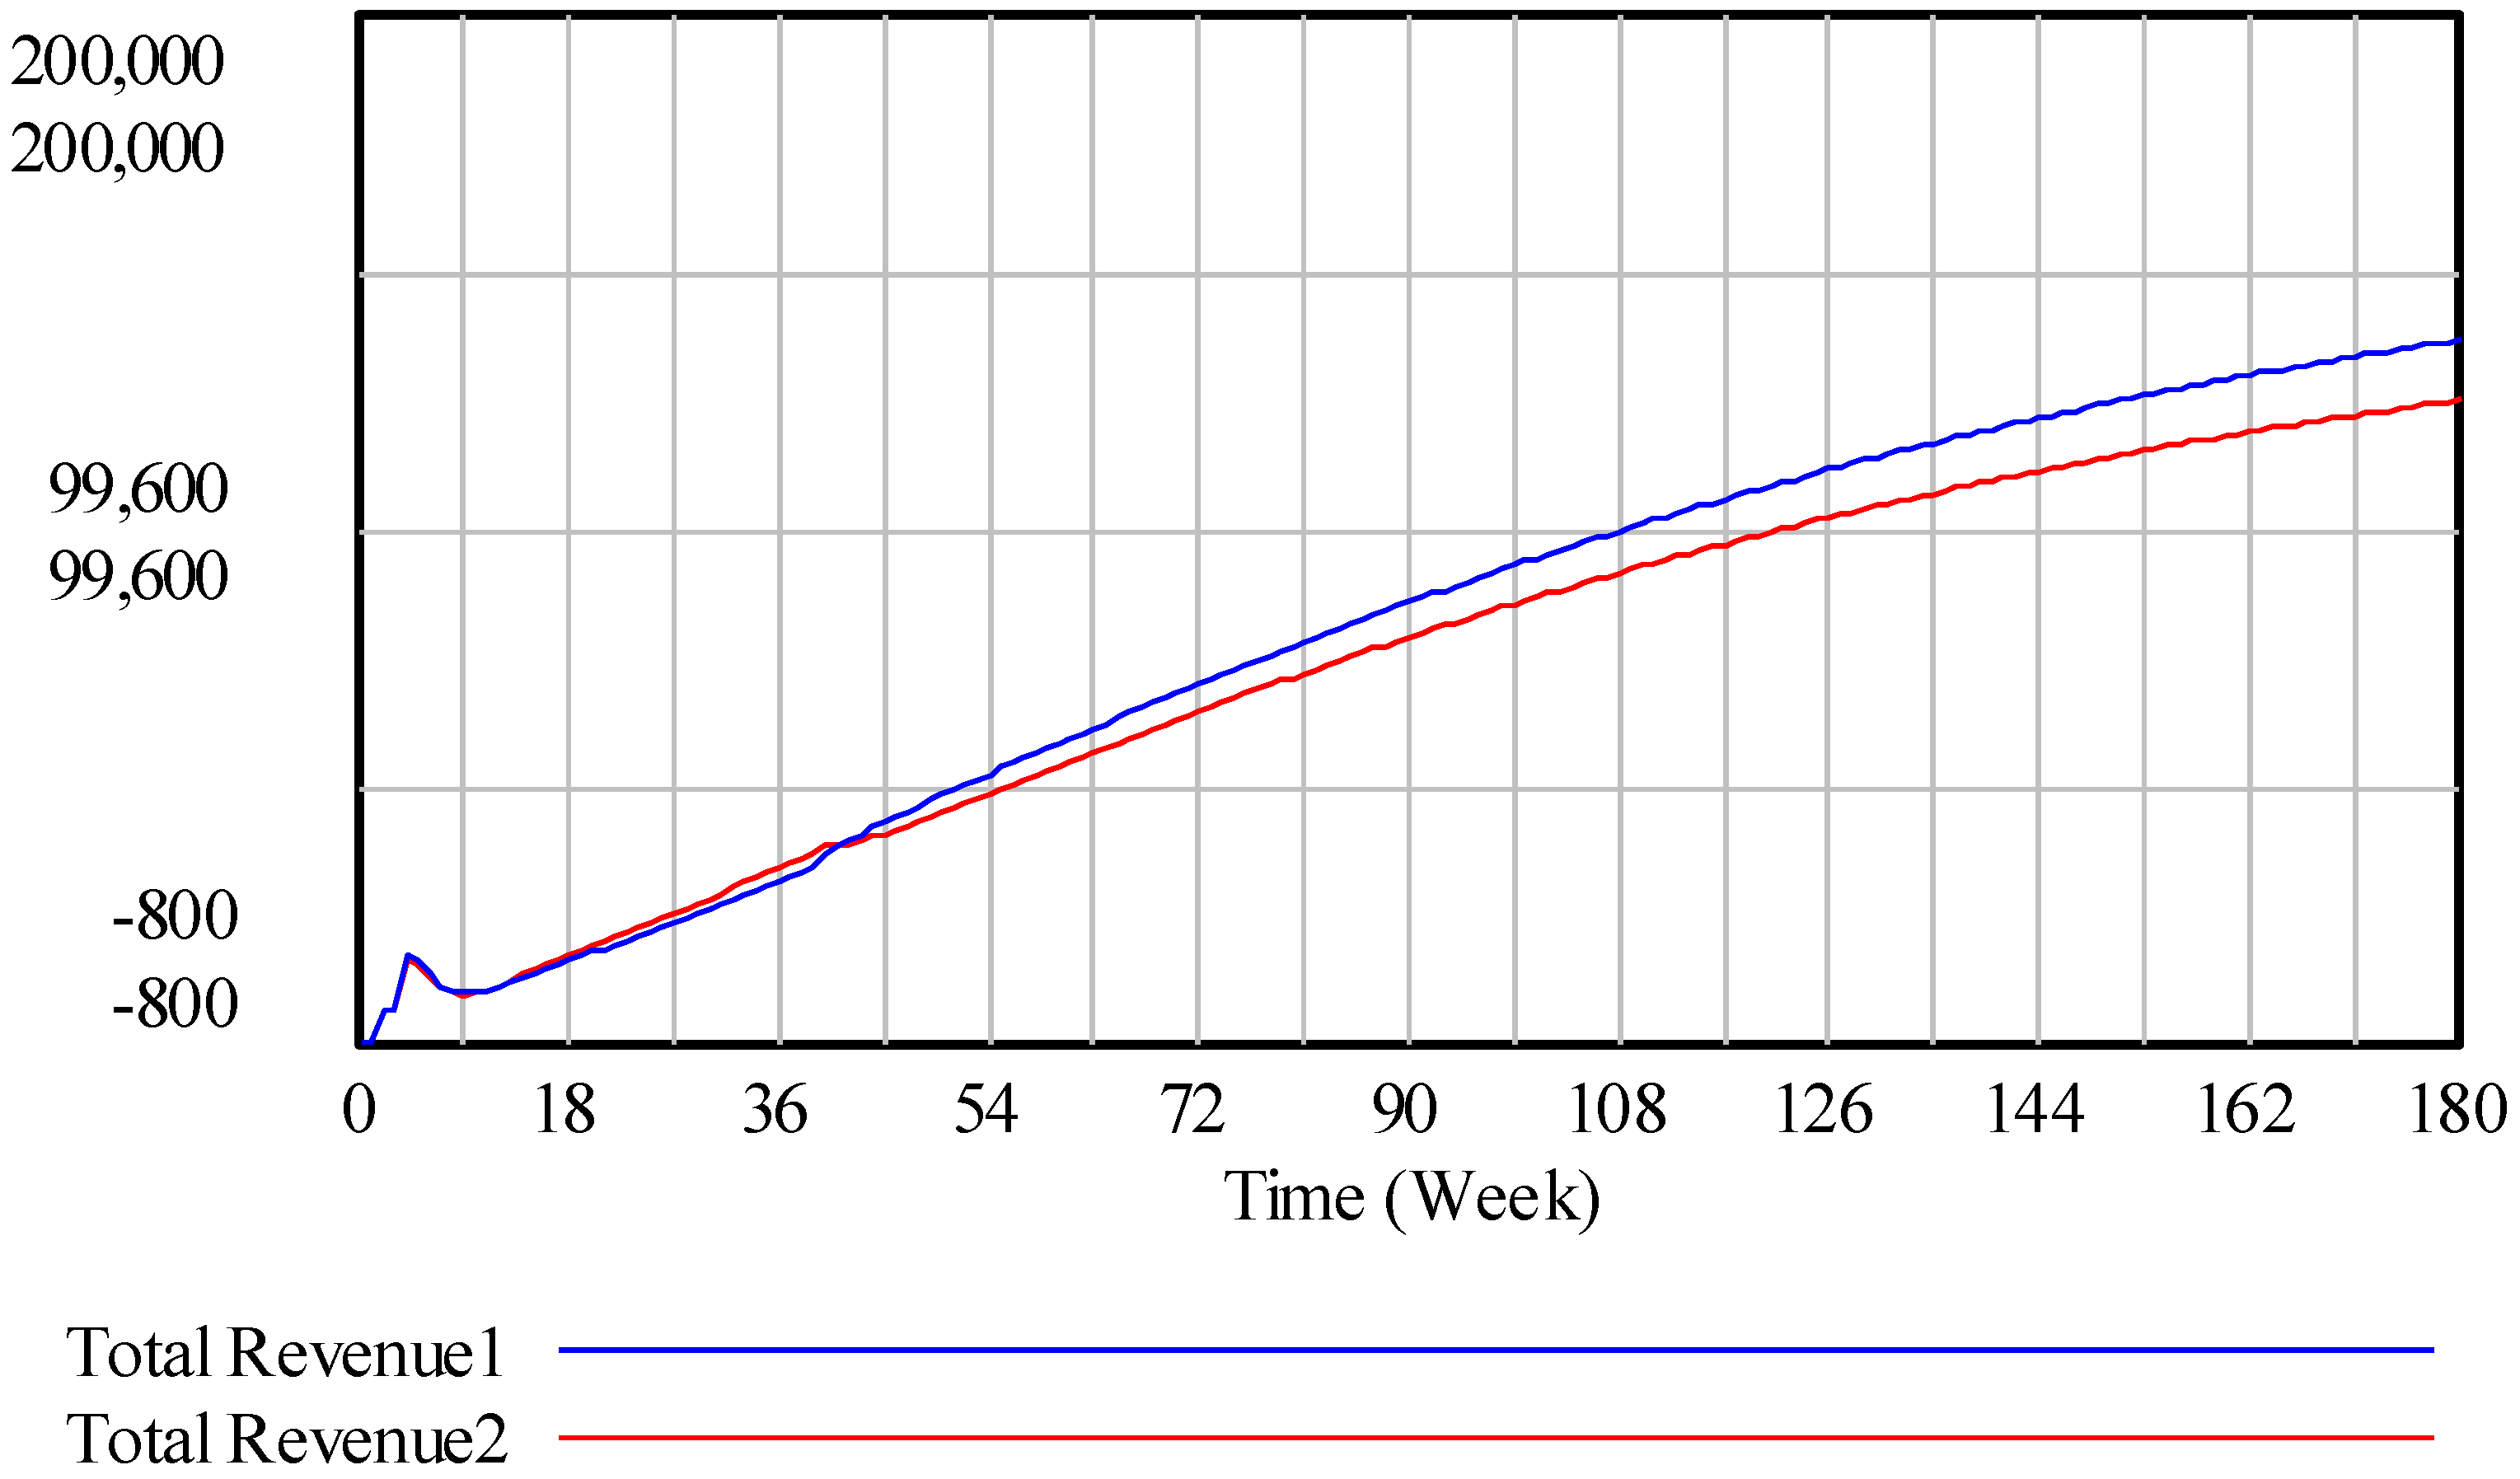
In the early stage of competition, the effect degree and the e-waste recycling coefficient (ERC) are respectively 0.3 and 0.36, and the total revenues obtained from the simulation are shown in
Figure 10.
It is found from
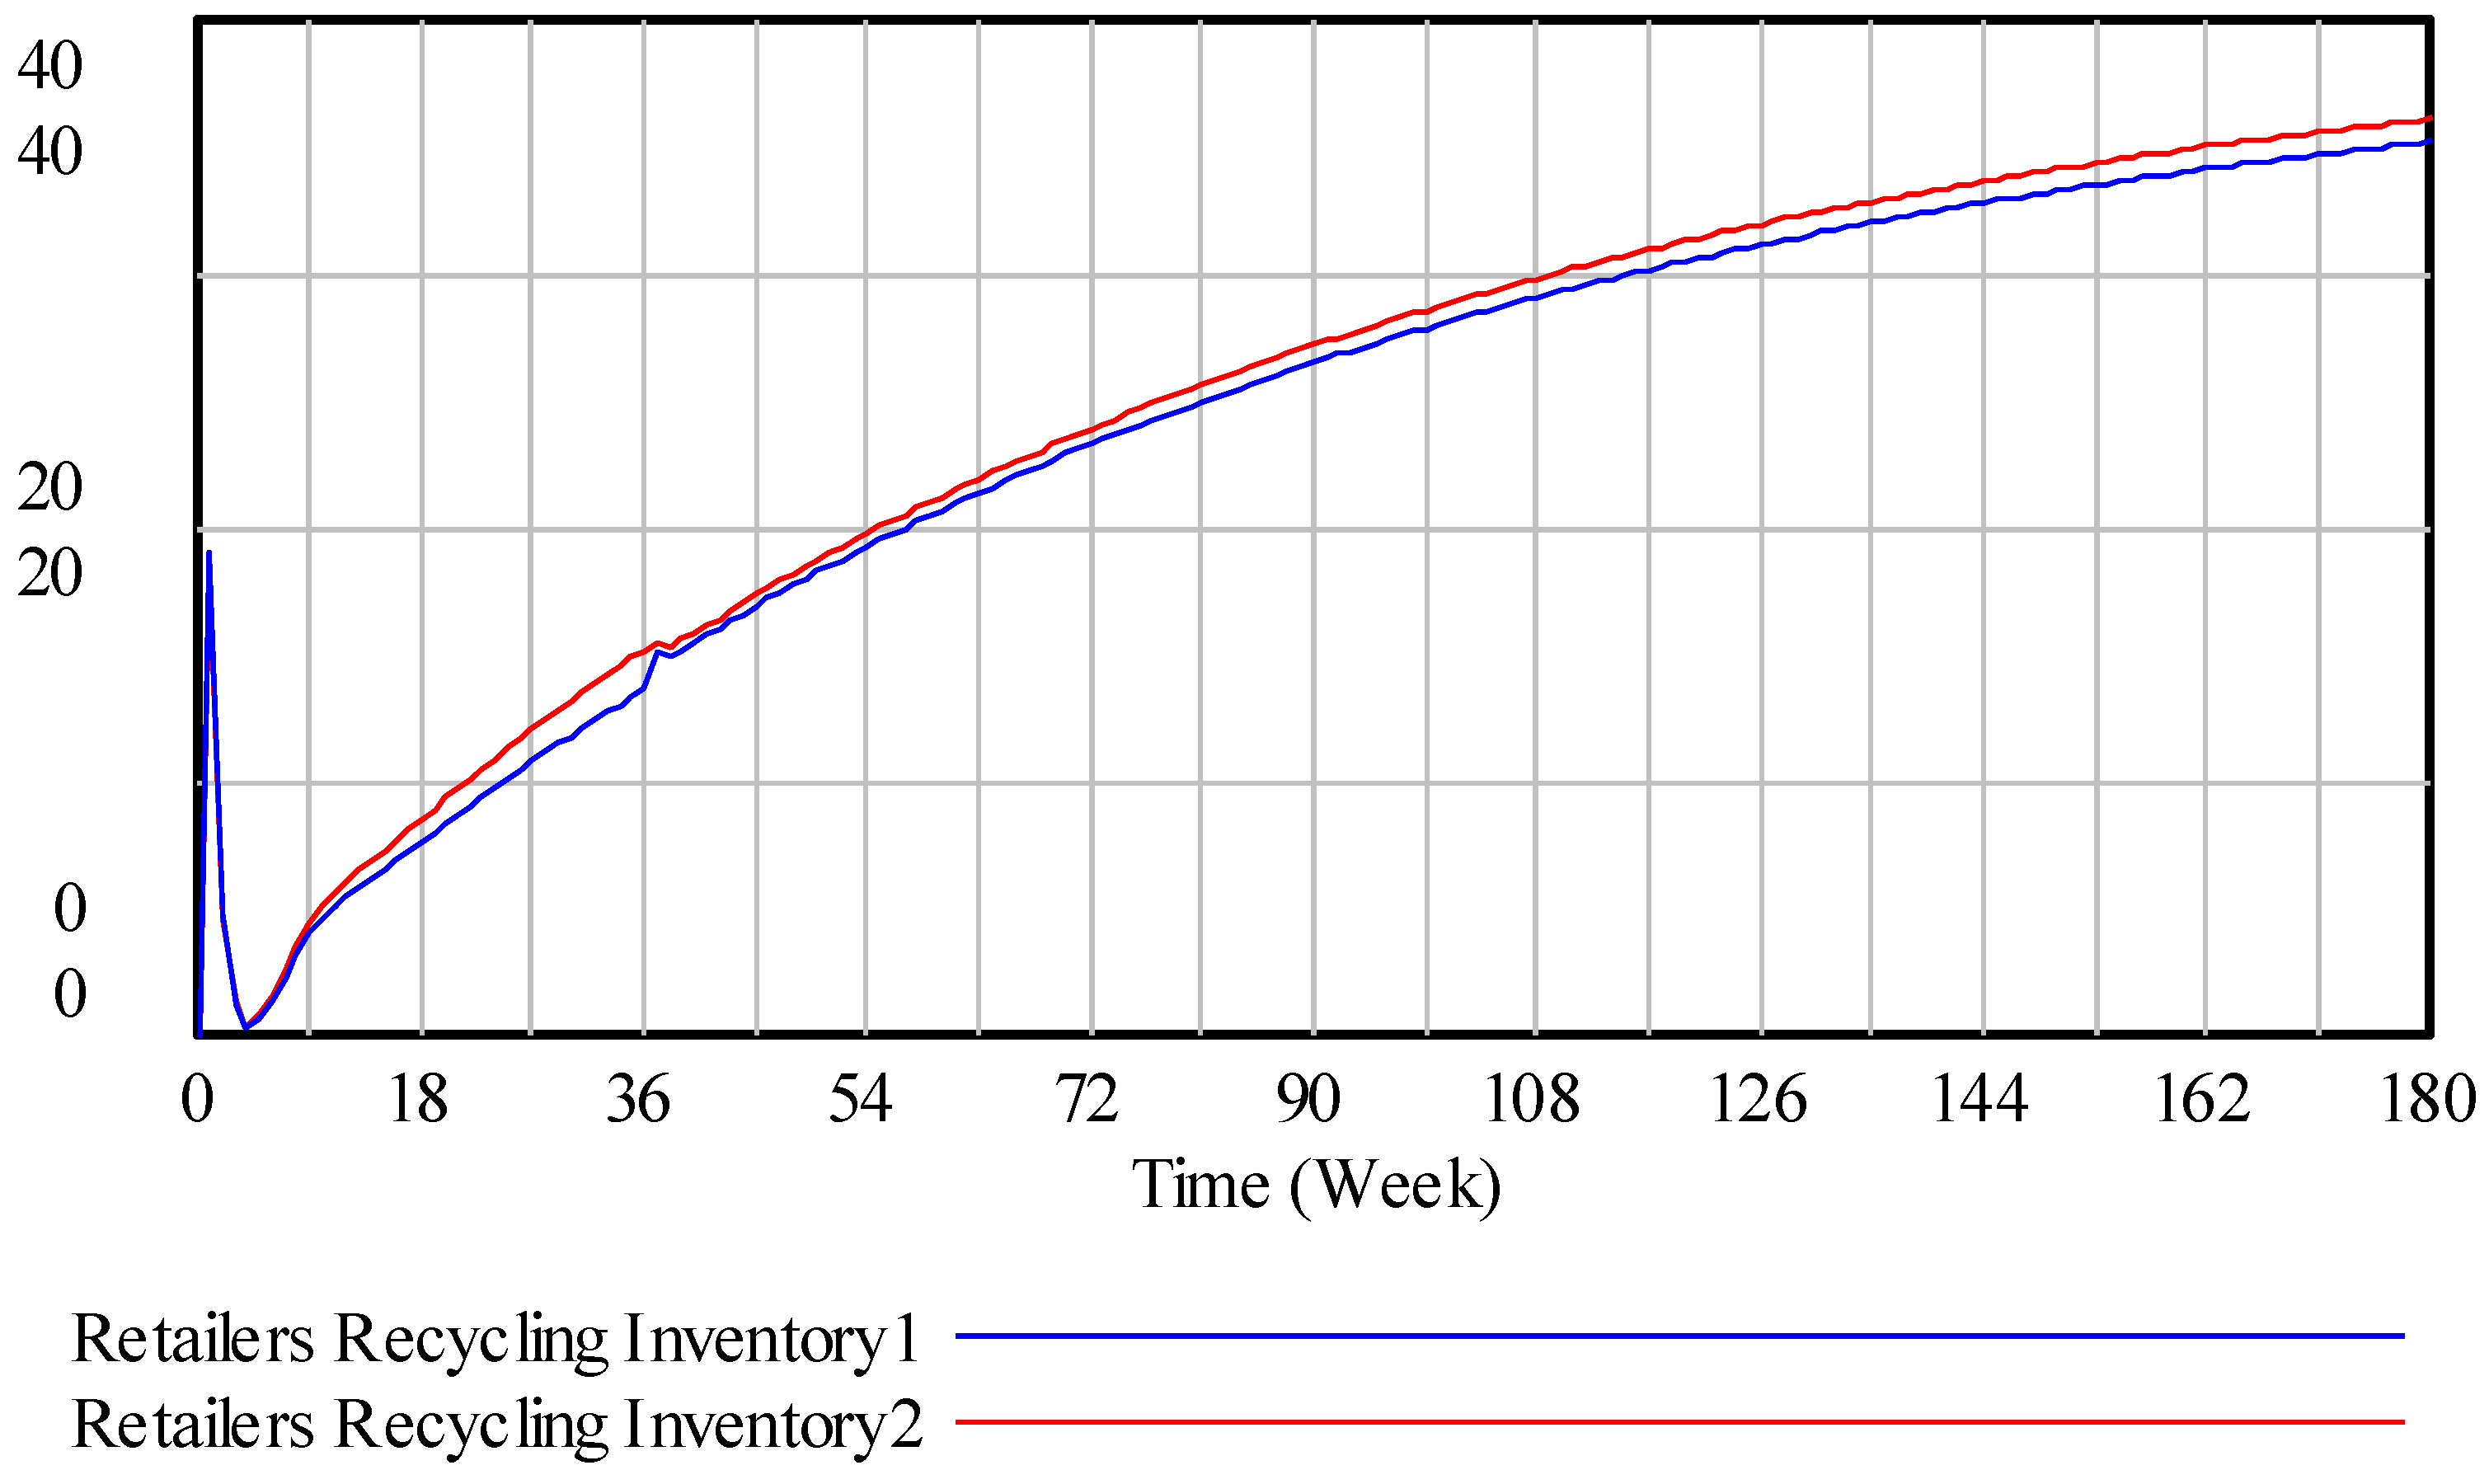
Figure 10 that the total revenues of the two chains are little difference, and supply chain 2 has a slight edge. Initially, the product recycling by retailers is increasing rapidly with the incentive of contract, and the recycling cost is greater than sales revenue due to no products into the market. Thus, total revenue is negative in the beginning. Without new products to the market, retailers recycling inventory (RRI) has a peak at the second week shown in
Figure 11 as retailers continue to recycle used products. Therefore total revenue has a peak at the fifth week through re-manufacturing, transportation and sales. From the 9th week, the trends of total revenues rise clearly.
To improve the total revenue, supply chain 1 strengthens the influence of contract1 on retailers by training the store staff. The effect degree 1 is adjusted to 0.5.
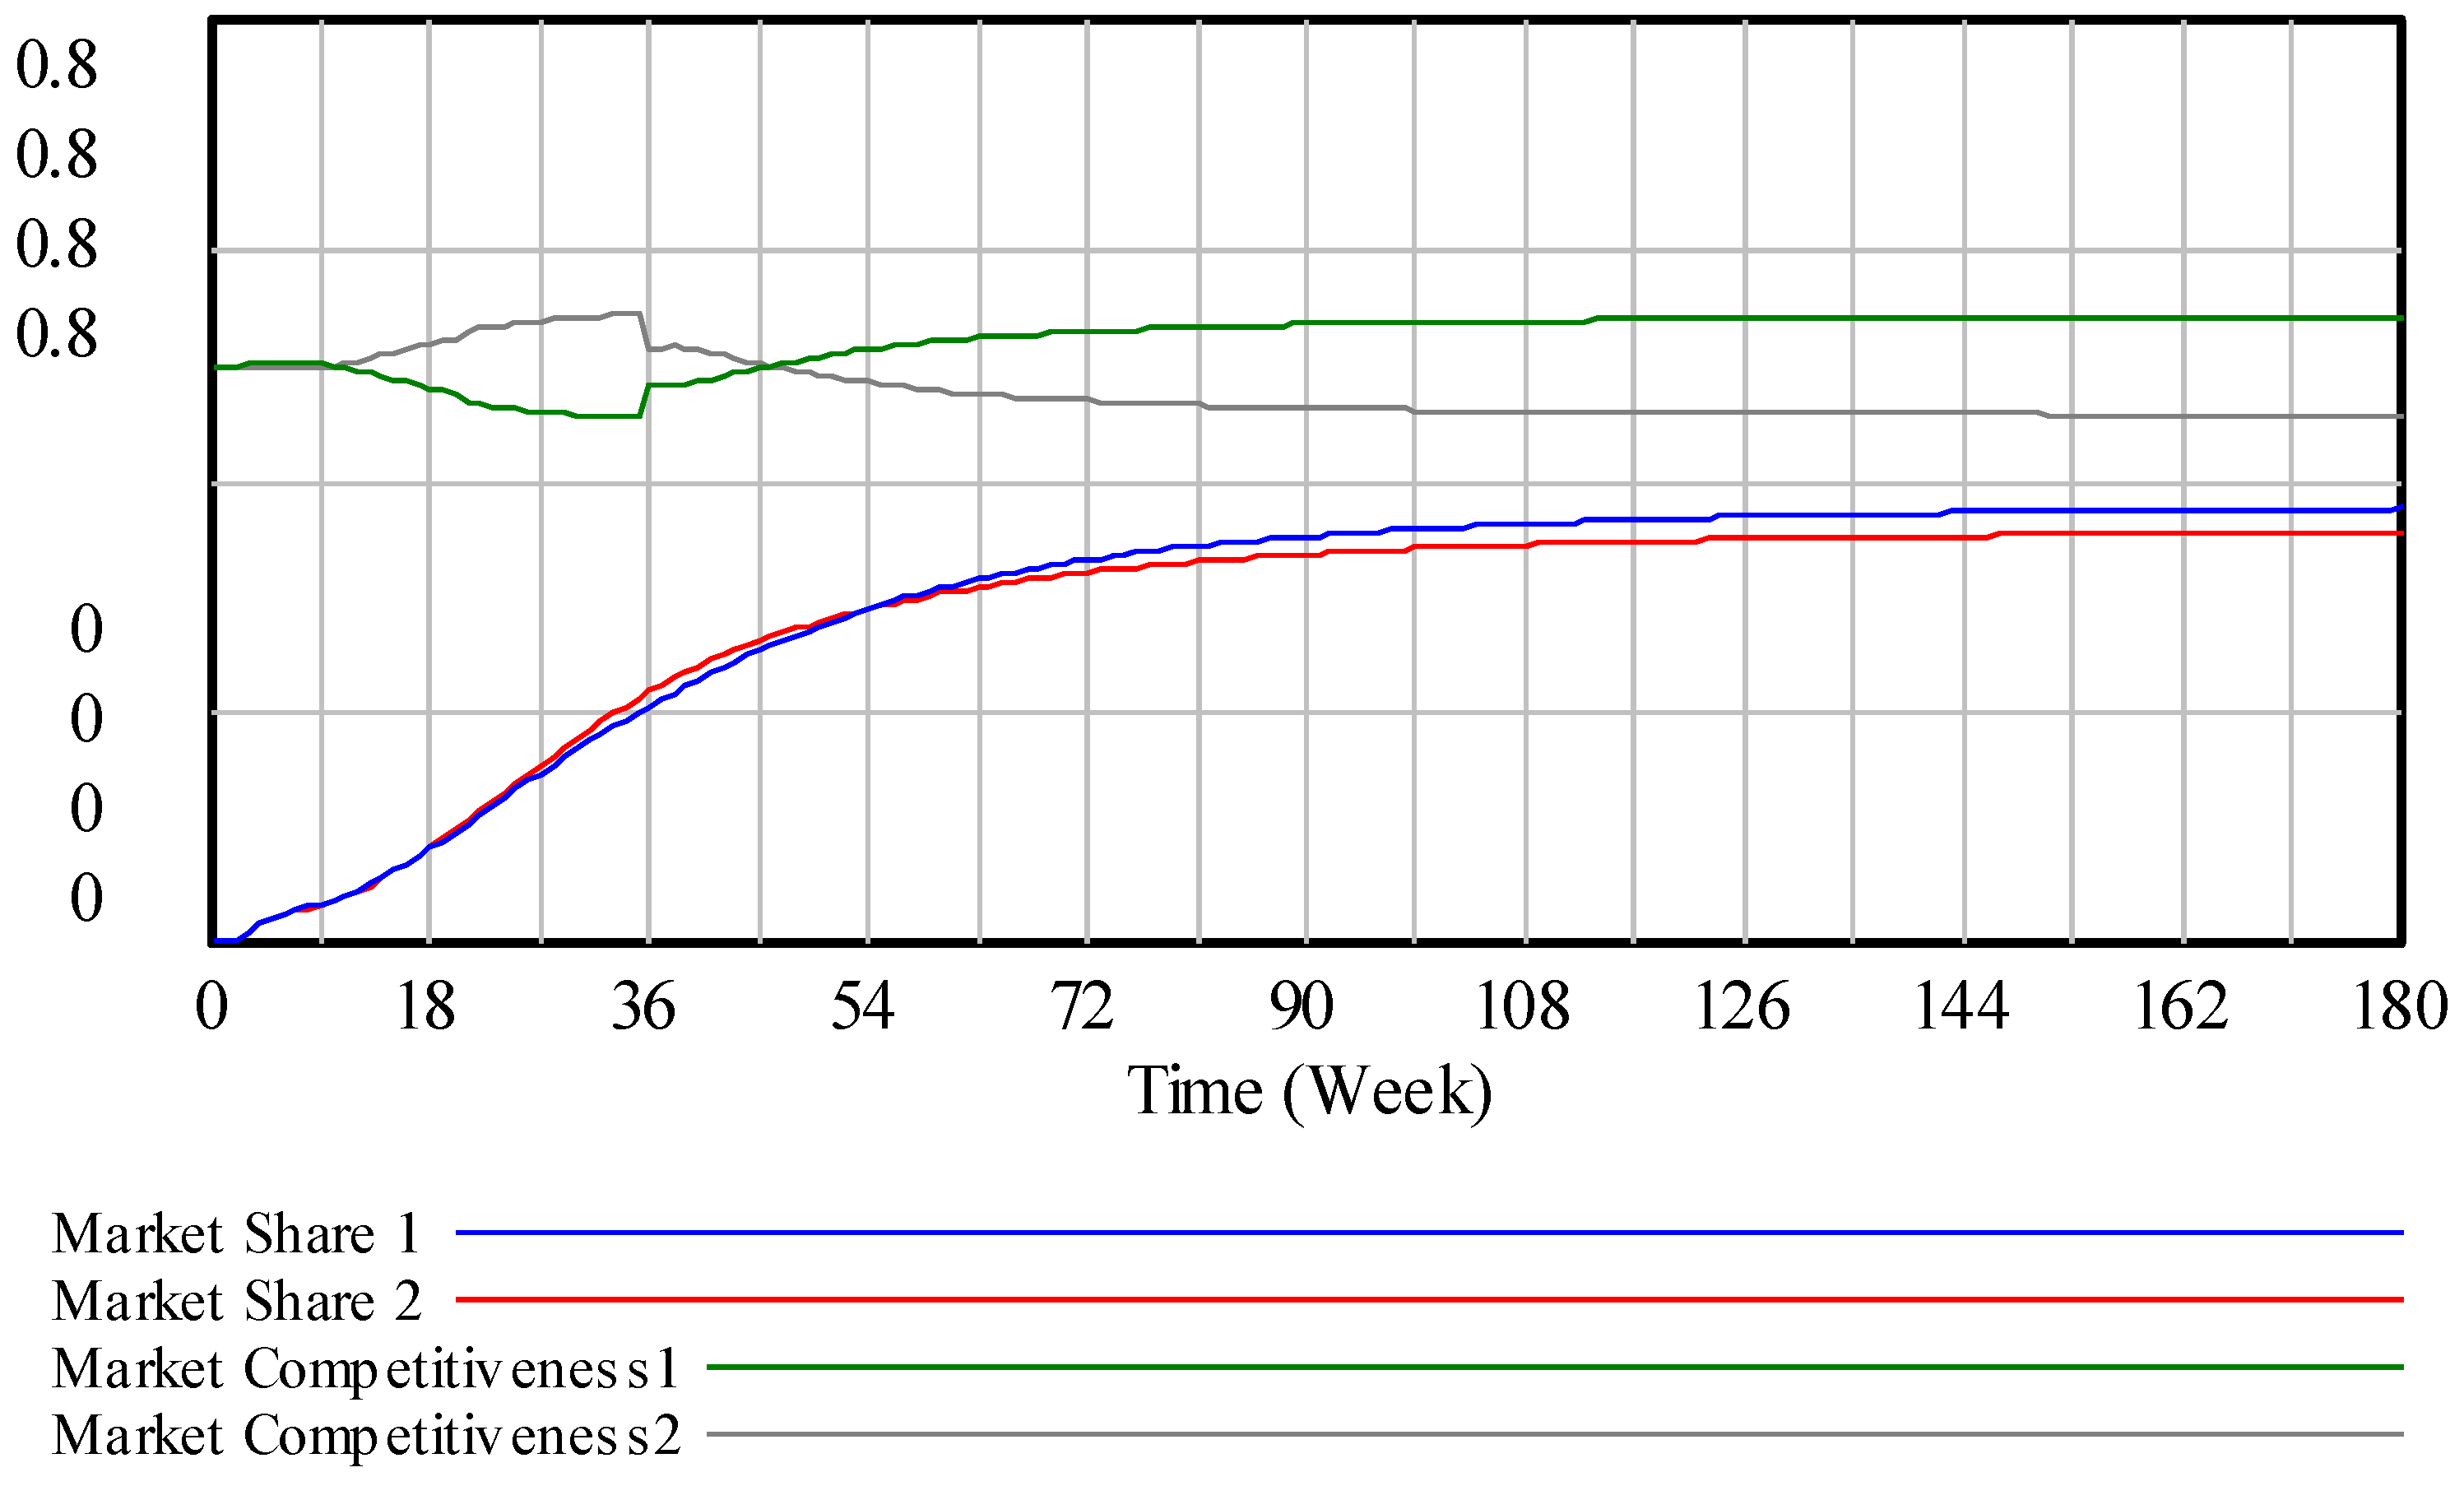
Figure 12 shows that the market share (MS) of supply chain 1 exceeded supply chain 2 after 54th week. Because MS can reflect the customer loyalty (CL), the CL of supply chain 1 is higher than that of supply chain 2. In addition, the green image (GI) of supply chain 1 is improved due to recycling more products by retailers. As a result, the Market Competitiveness (MC) of supply chain 1 is enhanced even exceed the supply chain 2 after 36th week, causing supply chain 1 gets more demands. Therefore the total revenue of supply chain 1 increased and even exceeded the total revenue of supply chain 2 at 40th weeks as shown in
Figure 13.
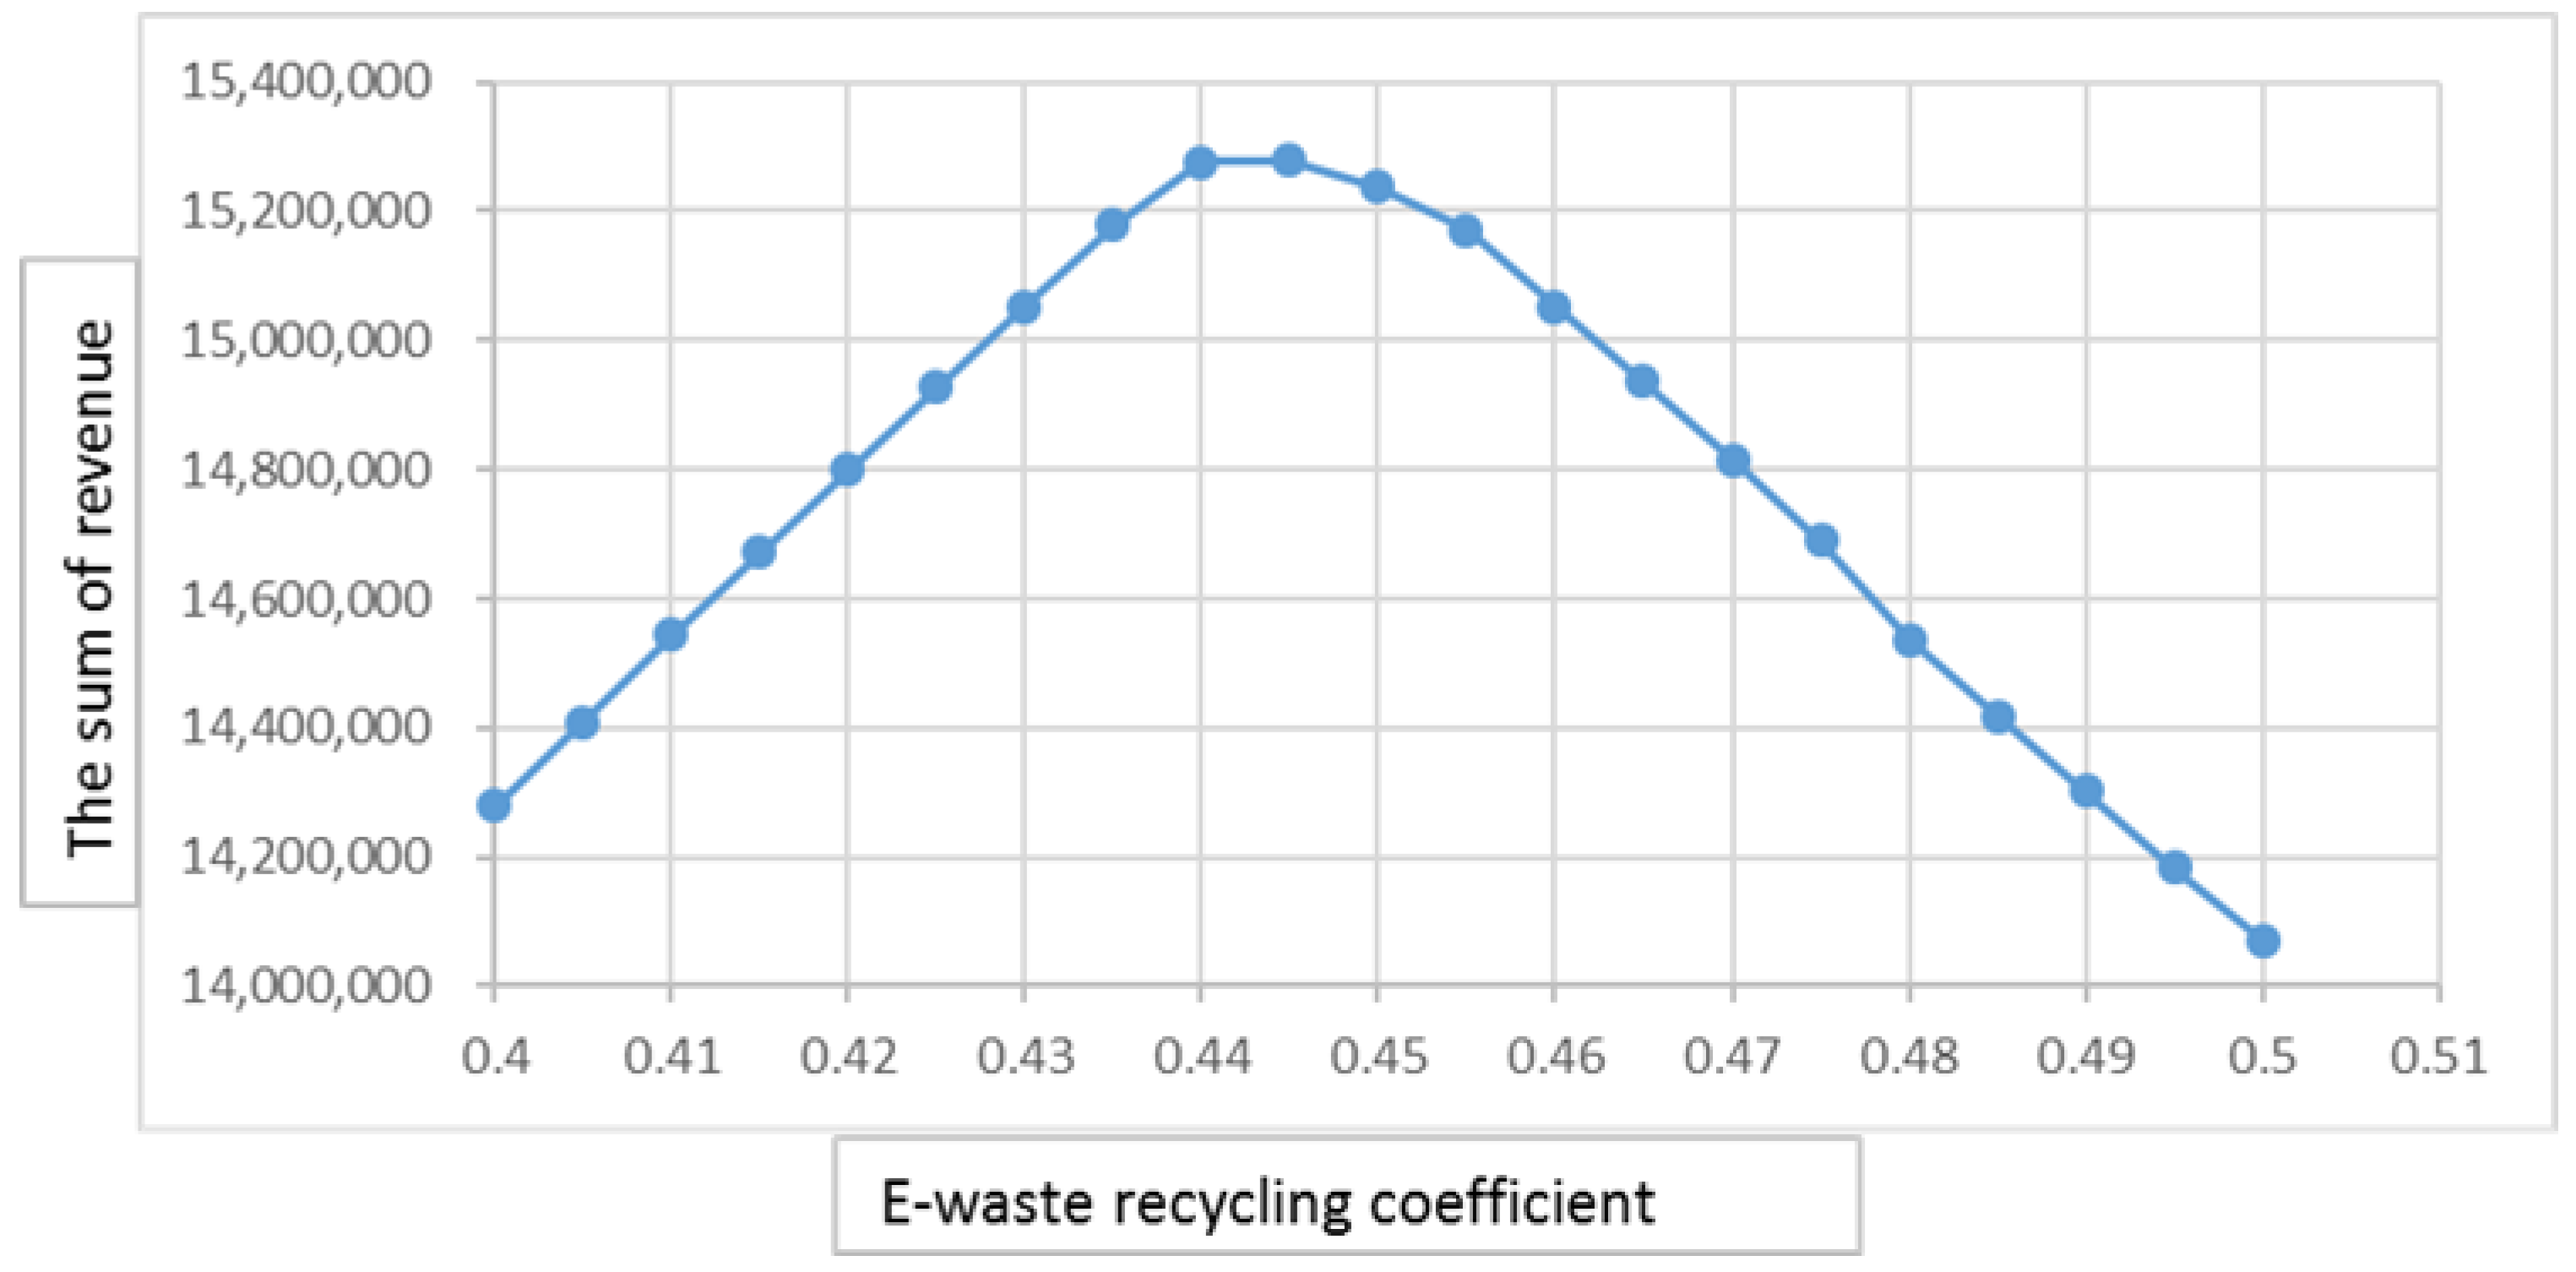
To turn around the bad situation, supply chain 2 decided to start a series of measures, such as strengthening environmental publicity, improving customers’ environmental awareness and enhancing the popularity of enterprises. According to the observation of the relationship between the ERC 2 and total revenue 2, there exists equilibrium relationship between the ERC 2 and total revenue 2. Extracting data from the model such as
Table 2, they were fitted with matlab. The fitting curve is shown in
Figure 14. Finally, when the ERC 2 reaches 0.443, the total revenue of the supply chain 2 reaches the optimal. The reason for existing the equilibrium relationship between the ERC 2 and total revenue 2 is analyzed, because the manufacturer’s re-manufacturing capacity (REC) will limit the quantity of recycling to be used, so the recycling that not used in new product can only be deposited in the warehouse. If the recycling is not controlled, it will cause inventory accumulation, so the enterprise needs funds for inventory management. The accumulation of recycling increase the recycling cost, and they cannot generate profits for the enterprise. If the quantity of the recycling is too large, the total revenue of the enterprise will decrease. Therefore enterprises should determine the amount of the recycling based on their own production capacity (PC) and REC to optimize the benefits of enterprises.
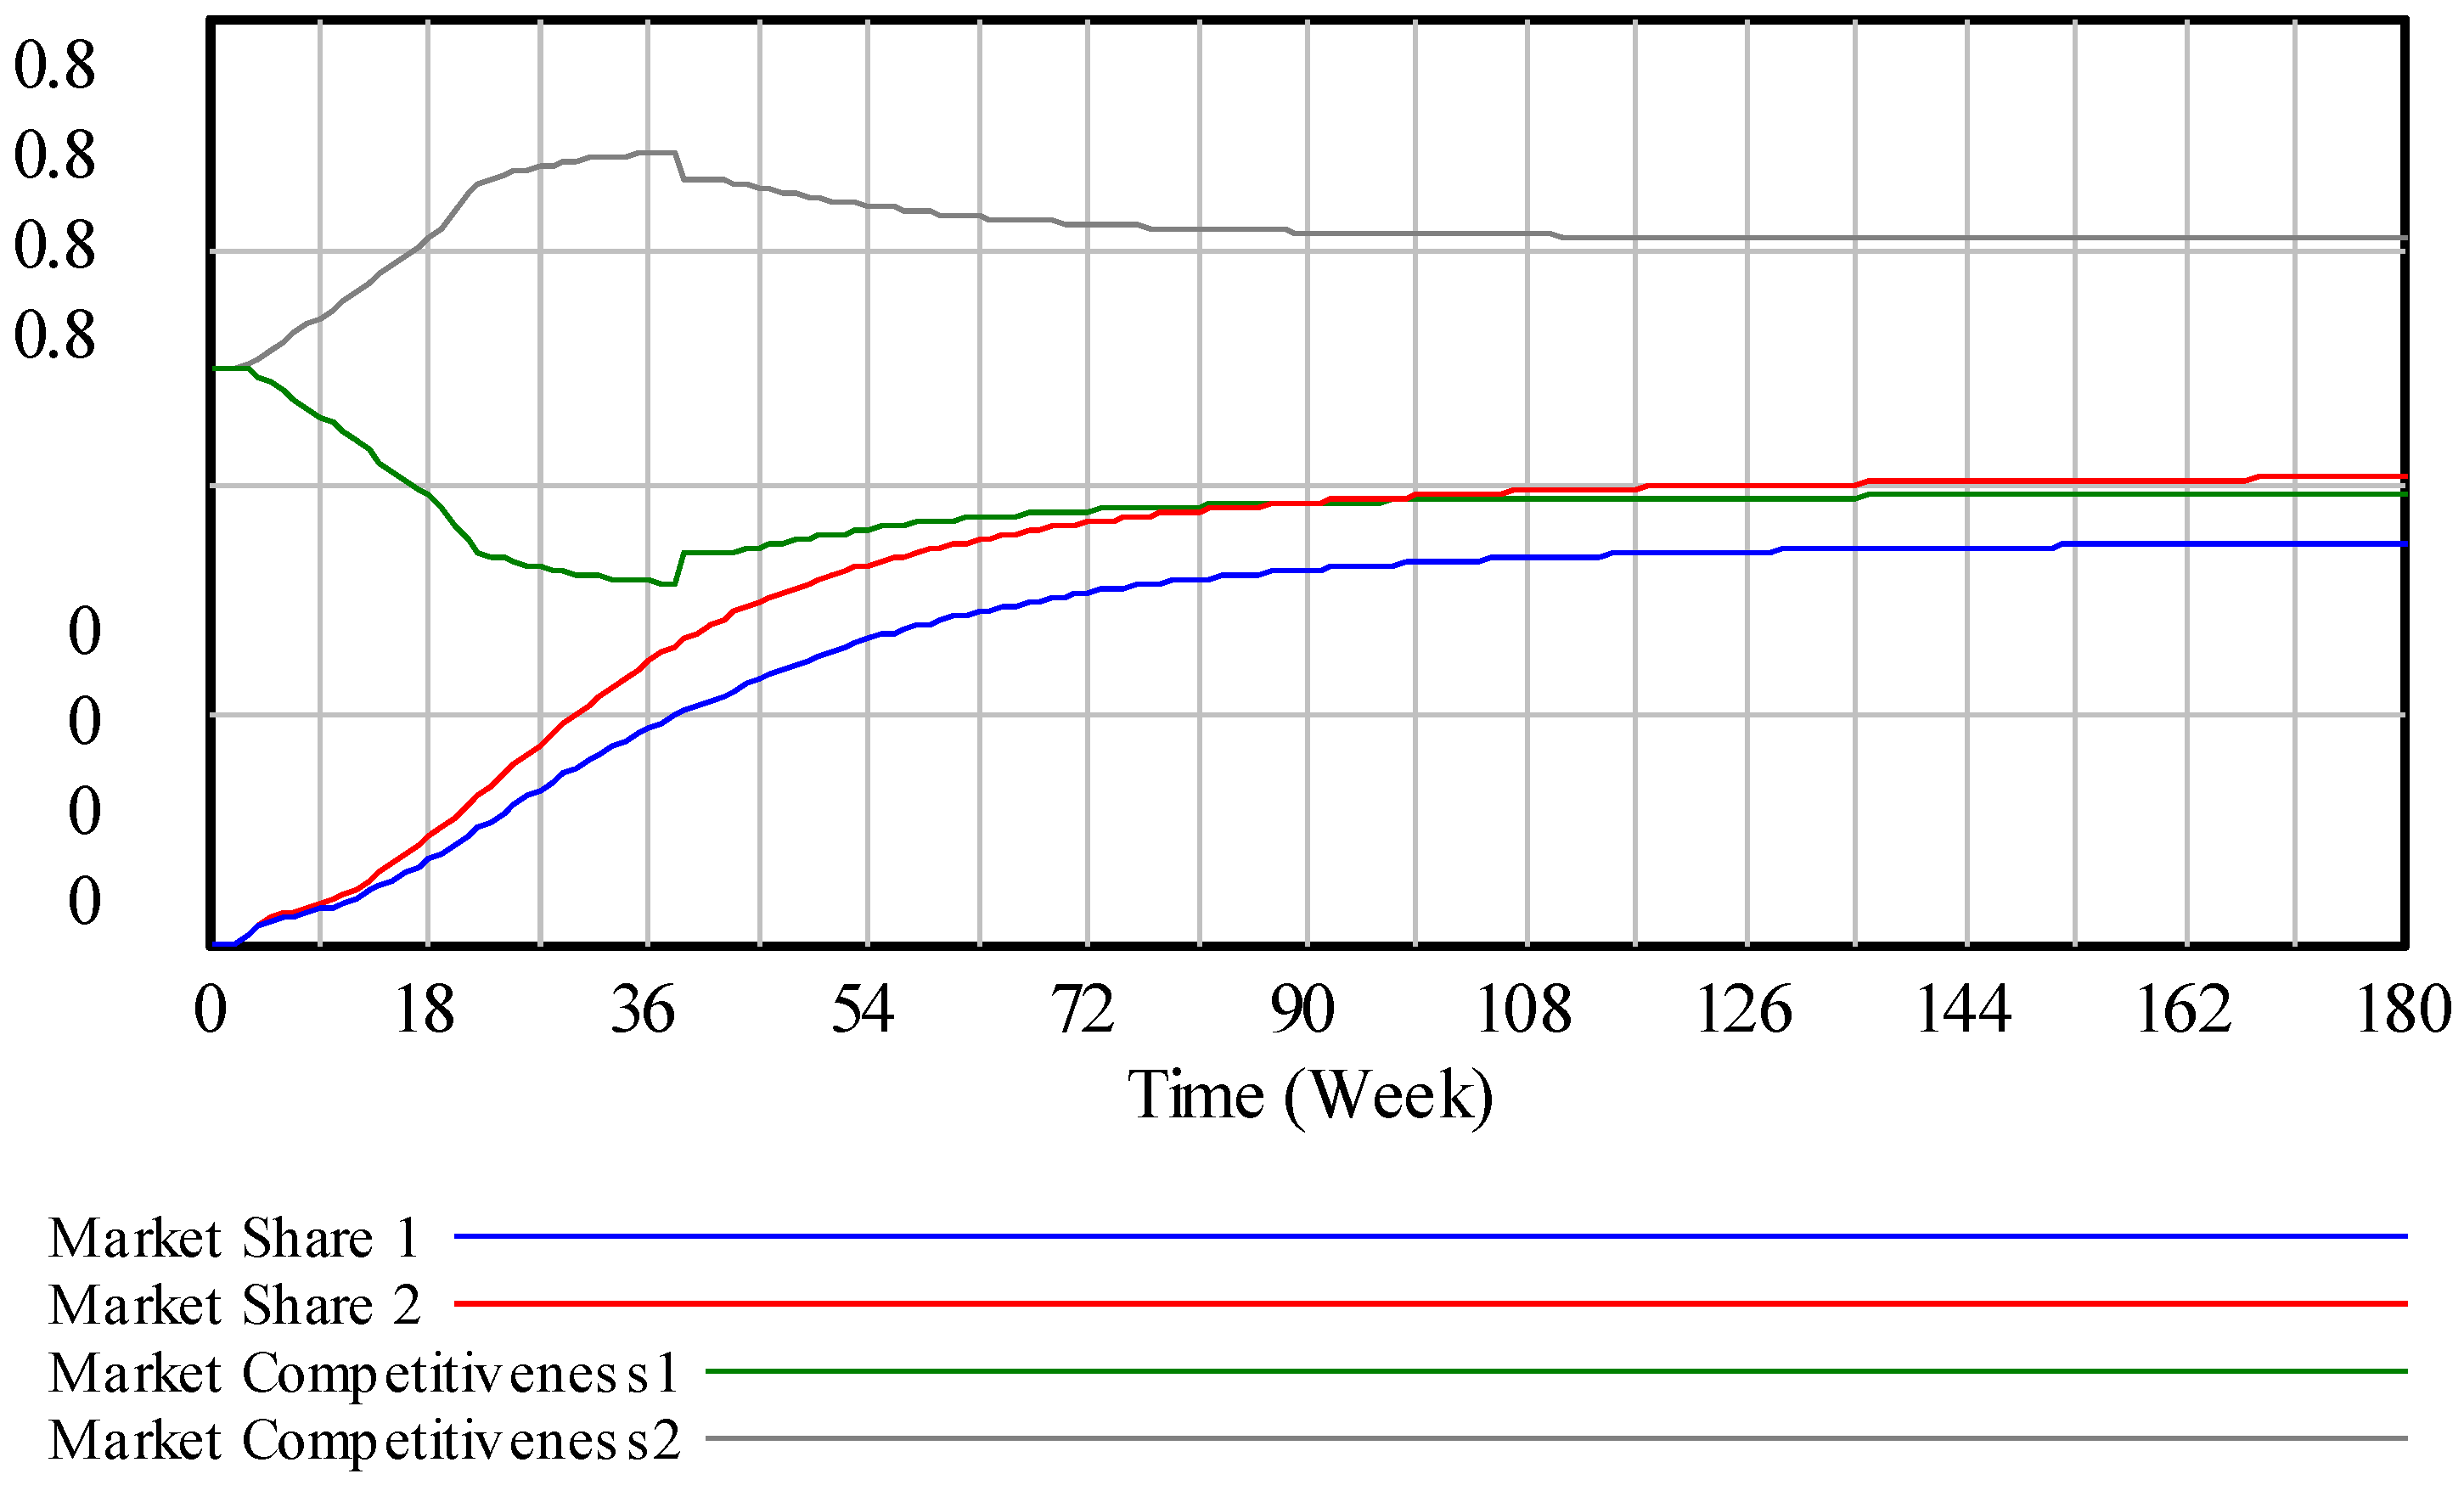
To achieve optimal revenue, supply chain 2 decides to increase the ERC 2 to 0.443 by analyzing the PC 2 and REC 2. As shown in
Figure 15, the total revenue of supply chain 2 exceeds supply chain 1 after 9th week, and the supply chain 1 generates shocks.
Figure 16 shows that the MS and MC of supply chain 2 outstrip supply chain 1 with absolute advantage, that causes the market demands of supply chain 1 will be dramatically decrease. The forecast information such as the excepted Demand 1 and excepted sales orders rate 1 will be dramatically reduced along with the market demands 1, which leads to reduce retailers expected inventory (REI) 1, inventory adjustment (RIA) 1, manufacturers expected inventory 1 and MIA 1, and with the random demands. So there will be uncertainty about production rate (PR) 1, output rate (OR) 1 and sales rate (SR) 1, and they effect the Manufacturers Inventory (MI) 1 and retailers inventory (RI) 1. The total revenue 1 is related to SR 1 and RI 1, so the total revenue of supply chain 1 will be shock.


