1. Introduction
Earthquake disasters have very strong destructive power, a widespread range, and pose a severe threat to human life safety [
1,
2]. Iran has one of the highest seismic activity rates in the world, and has experienced many destructive earthquakes in the past. It is one the most vulnerable countries to major earthquake disasters [
3]. The Iranian plateau is situated amongst the continental junction of the Arabian and Eurasian plates in the center point of the Alpine–Himalayan seismic belt [
4]. According to the earthquakes database, more than 1,000,000 fatalities have been recorded in the past 105 years (since 1900) in Iran, which is one of the worst recorded vulnerability index cases in the world [
3,
5]. These earthquakes have resulted in the death of thousands of people and the destruction of many villages and cities in the country. For example, the Bam earthquake, which occurred in 2003 (Mw = 6.6) killed over 30,000 people, injured over 10,000, made 100,000 people homeless, and destroyed over 80% of the houses [
3]. Based on the statistics of the Iranian plateau, the last century has witnessed 14 major earthquakes of the magnitude of 7 (on the Richter scale) and 51 earthquakes with the magnitude of 6 to 7. However, the earthquakes in Buin-Zahra (1962, Ms = 7.3), Dashte Bayaz (1968, Ms = 7.3), Tabas (1978, Ms = 7.8), Sirch (1981, Ms = 7.3), and Manjil (1990, Ms = 7.7) are other examples [
3,
6].
It is very difficult to predict earthquakes accurately with the currently available technologies. Vulnerability reduction is a core element of managing or reducing disaster risk, and has been identified as the most significant prerequisite for resilience under degrees of exposure to disasters. Therefore, to reduce the damage caused by earthquake disasters, it is particularly important to study the assessment of social vulnerability to earthquake disasters. Timely and effective disaster risk management strategies not only rely on an adequate understanding of the disaster itself, but should also explore the sense of exposure and vulnerability in the society [
7]. The probability of a natural disaster having effects that are more devastating in one place than in another deeply depends on the local vulnerability components of the affected society, such as its sociocultural and economic environment. Indeed, there is an important correlation between the potential risk and the social resistance and resilience of a specific place. Social vulnerability analyses aim to understand which population groups may be the most vulnerable to the impacts of natural hazards and identify the key factors that affect social vulnerability [
8]. The results of social vulnerability study can be used in the future for risk management decisions, including risk reduction, prevention, and mitigation [
9]. Social vulnerability describes the characteristics of a person or group and their situation that influence their capacity to anticipate, cope with, resist, and recover from the impact of a natural hazard. Socially vulnerable groups are victims who tend to be treated as groups with special needs; these people experience higher social vulnerability, which means that they are more at risk than others are [
10].
The concept of social vulnerability within the disaster management context was introduced in the 1970s when researchers recognized that vulnerability also involves socioeconomic factors that affect community resilience [
11,
12,
13,
14]. Based on the engineering-based paradigm, research on disasters emphasizes the exposure, risk, and assessment of vulnerability to biophysical threats [
15,
16,
17,
18]. However, over the years, a growing number of studies have opposed this viewpoint, but instead considered disasters as social constructs [
19,
20,
21,
22,
23,
24,
25]. In the study, the hazards resulting in social vulnerability result in low ability, based on social attributes and contexts, of a group of persons who are exposed to a larger likelihood. For these groups of people, the impact of a disaster presents more difficulties in recuperating from a disaster. The common understanding of vulnerability and its measurability are a means of addressing disasters by setting targets and managing the consequences [
26,
27,
28,
29,
30]. Due to its complexity, scholars currently have different definitions for the concept of social vulnerability. Koks et al. [
31] considered social vulnerability as the ability to deal with disasters. Chen et al. [
32] indicated that social vulnerability influences people’s ability to make full pre-disaster preparations under the pre-existing conditions, and to recover from post-disaster reconstruction. Clark et al. [
33] discussed social vulnerability in reference to the extent of damage caused by a disaster suffered by specific social groups, organizations, or countries [
33]. Bankoff et al. [
34] noted that vulnerability is the key to understanding risk in attempts to break away from the attitudes that have characterized the relationships between human societies and their environment. Understanding vulnerability requires more than a simple understanding of societies and their environment; social vulnerability is also about people, their perceptions, and knowledge. However, vulnerability is not a property of social groups or individuals, but rather is embedded in complex social relations and processes. Several other definitions can also be found in the literature. For example, Burton et al. [
35] emphasized that social vulnerability is related to all kinds of changes, including natural, social, and individual changes, which expose people to the risk of disaster.
Recently, Rygel et al. [
36] developed a method for aggregating vulnerability indicators to obtain a composite social vulnerability index. They identified the indicators of social vulnerability to storm surges associated with hurricanes by reviewing the vulnerability assessment literature. Collins et al. [
37] studied the environmental hazards vulnerability in the Ciudad Juarez (Mexico) and El Paso (USA) metropolis. They used the method proposed by Cutter et al. [
38] to obtain a social vulnerability index. Wood et al. [
39] deciphered community variations in social vulnerability to Cascadia-related tsunamis in the United States (US) Pacific Northwest, by adapting the social vulnerability index (SoVI) at the census-block level [
40]. Bjarnadottir et al. [
41] developed a coastal community social vulnerability index (CCSVI) for hurricane-prone areas and applied it to Miami-Dade County, Florida, as a case study. Zhang et al. [
42] applied a rough set to construct an evaluation model of social vulnerability based on catastrophe progression. Following in-depth literature research, an assessment model of social vulnerability to the earthquake disaster in Sichuan Province, China, based on the catastrophe progression method was established. A rough set attribute reduction method was adopted to eliminate irrelevant social vulnerability indicators and optimize the proposed model. Finally, a catastrophe progression method for social vulnerability to earthquake disaster is developed to overcome the subjectivity of the index weight assignment of social vulnerability indicators in the currently used social vulnerability assessment method. Thiri [
43] analyzed the relationship between the environmental migration and social vulnerability of 30 municipalities affected by the 2011 Great East Japan Earthquake Disaster in Miyagi Prefecture. Firstly, the impact of the disaster on migration is estimated using an interrupted time series analysis. Subsequently, migration estimates are regressed using municipality-level data on the impact of the disaster and social vulnerability indicators. In addition, three counterfactuals were created where migration in the absence of the disaster was estimated using different forecasting methods. Cerchiello et al. [
44] addressed the assessment of the social vulnerability and resilience level of the city of Nablus, Palestine, which is a region affected by seismic events and political conflicts. The method employed is the scorecard approach (SA), which is a self-assessment and participatory tool that measures resilience with qualitatively derived information at two different urban levels, including population and local administration.
Disaster planning research and management in Iran has focused on the physical aspects of vulnerability and the estimated economic losses due to damaged buildings and infrastructure [
3,
45,
46,
47,
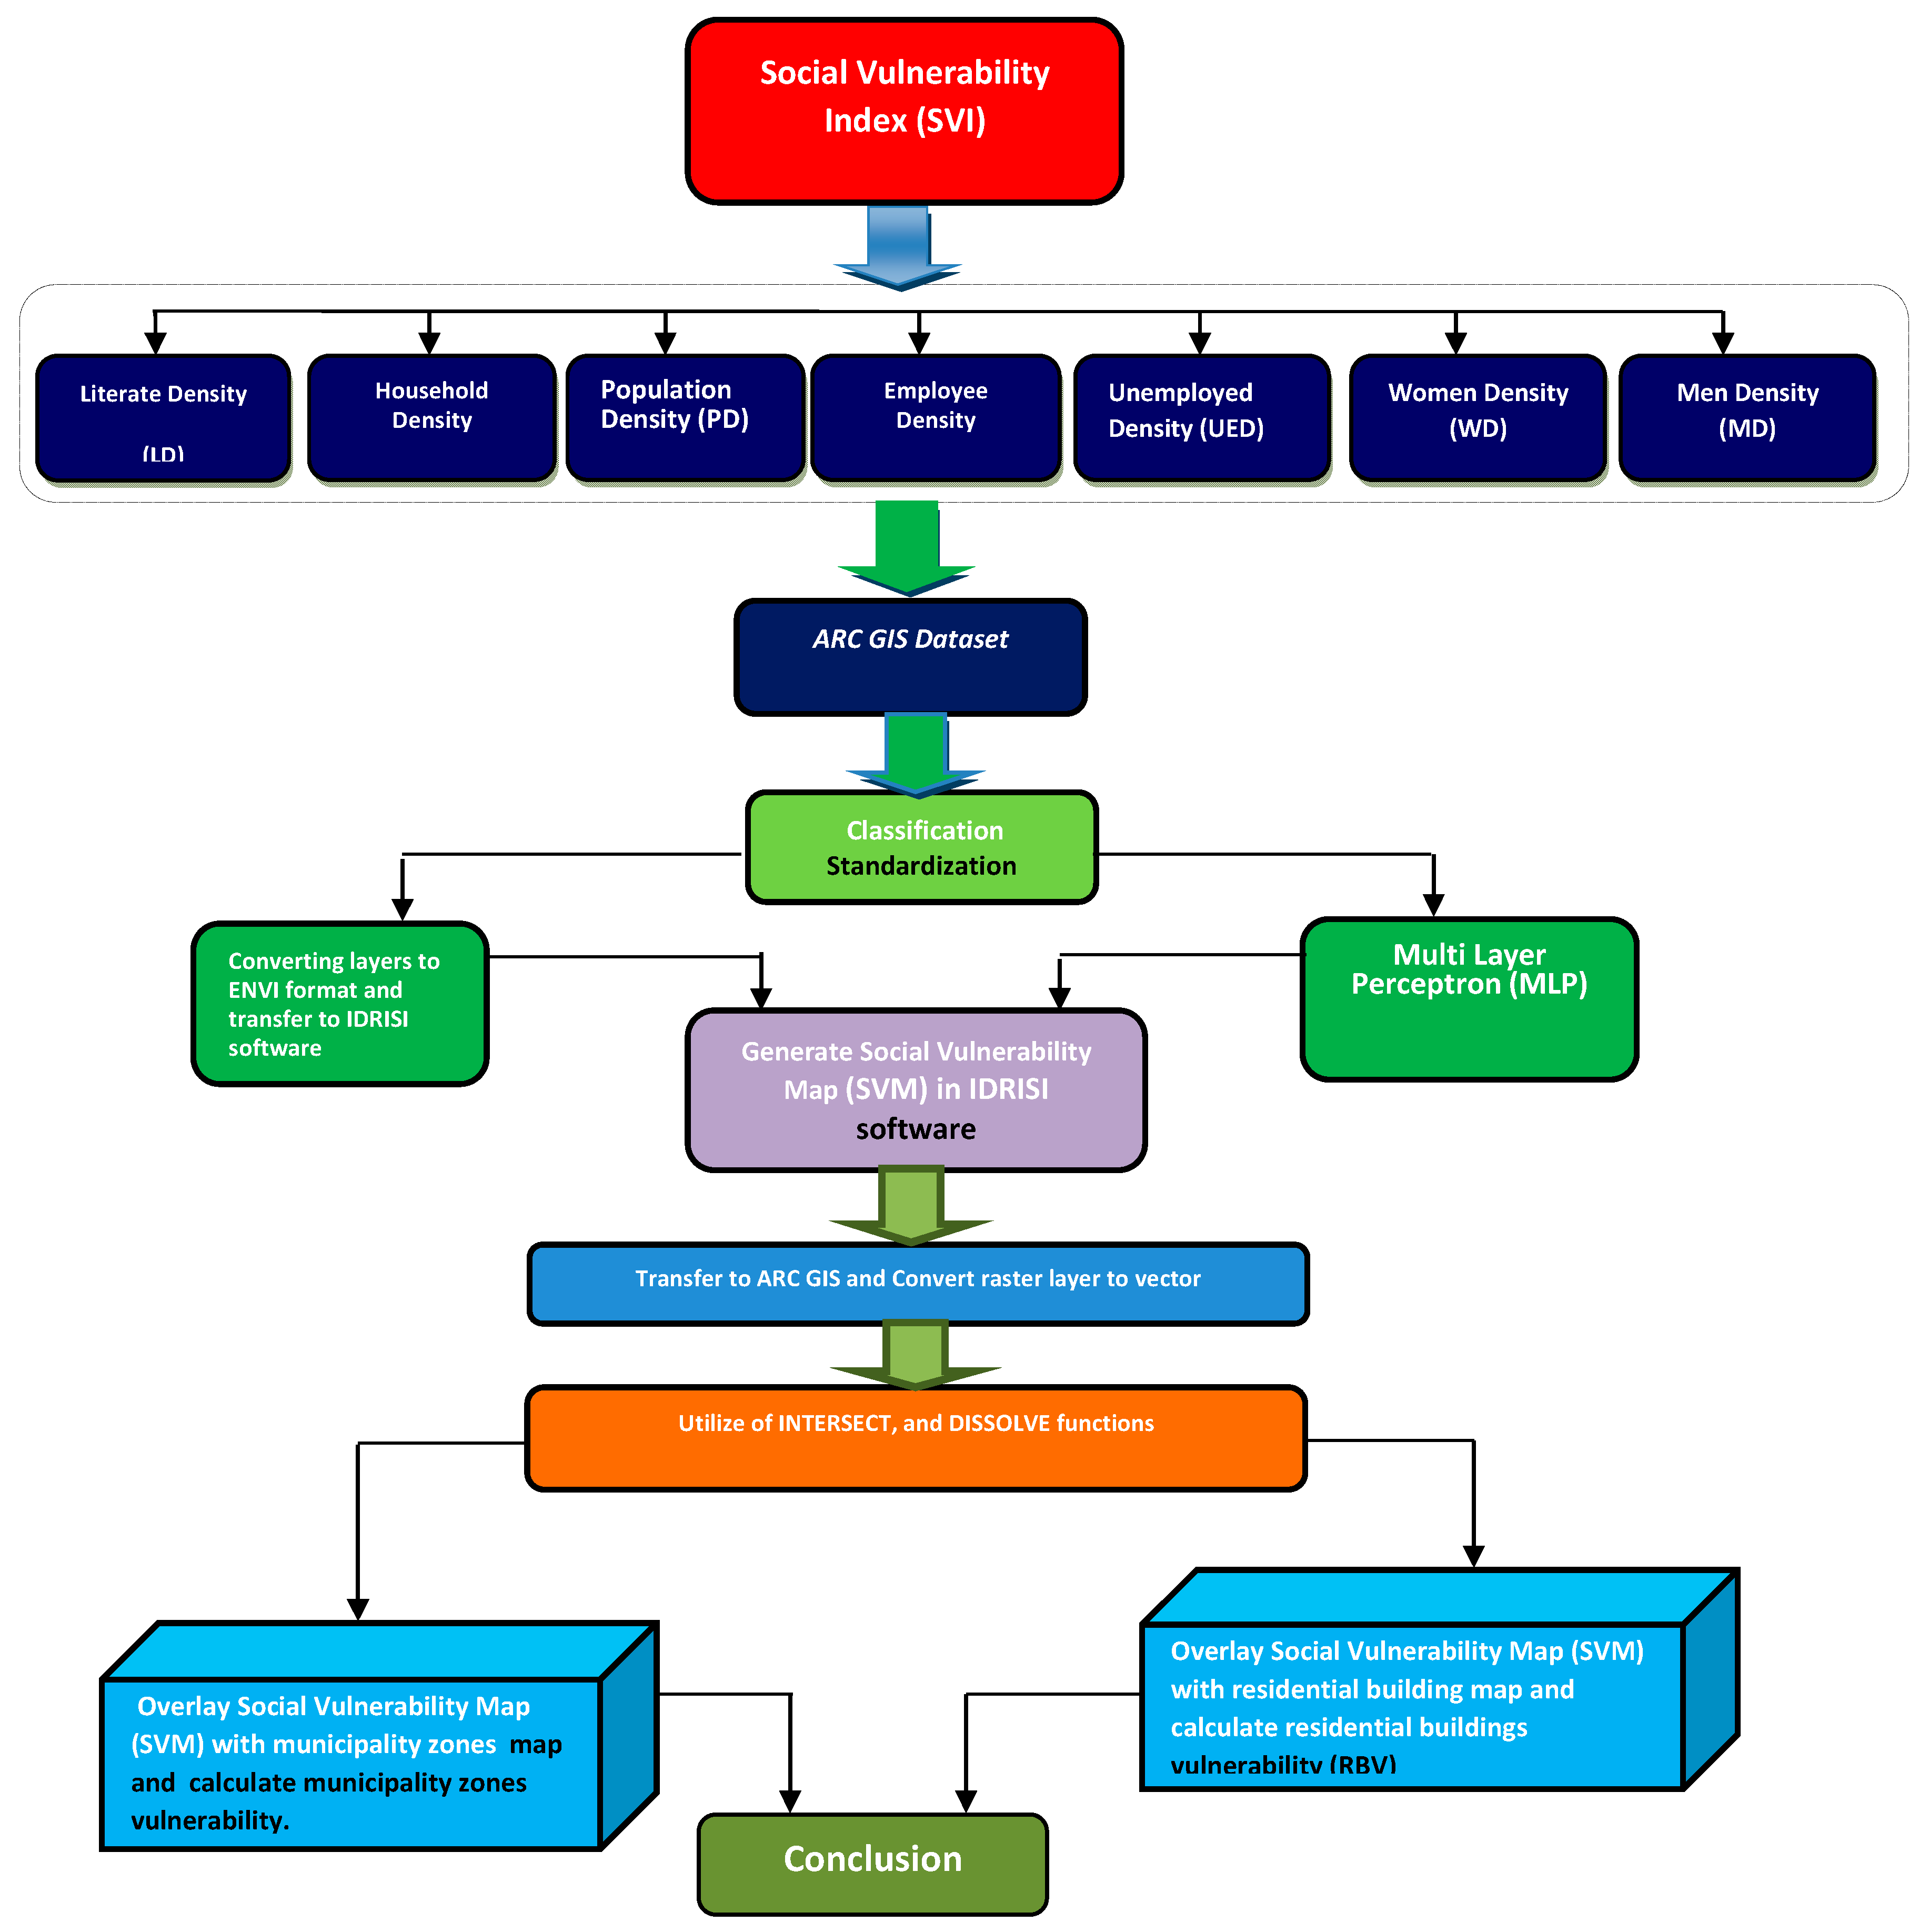
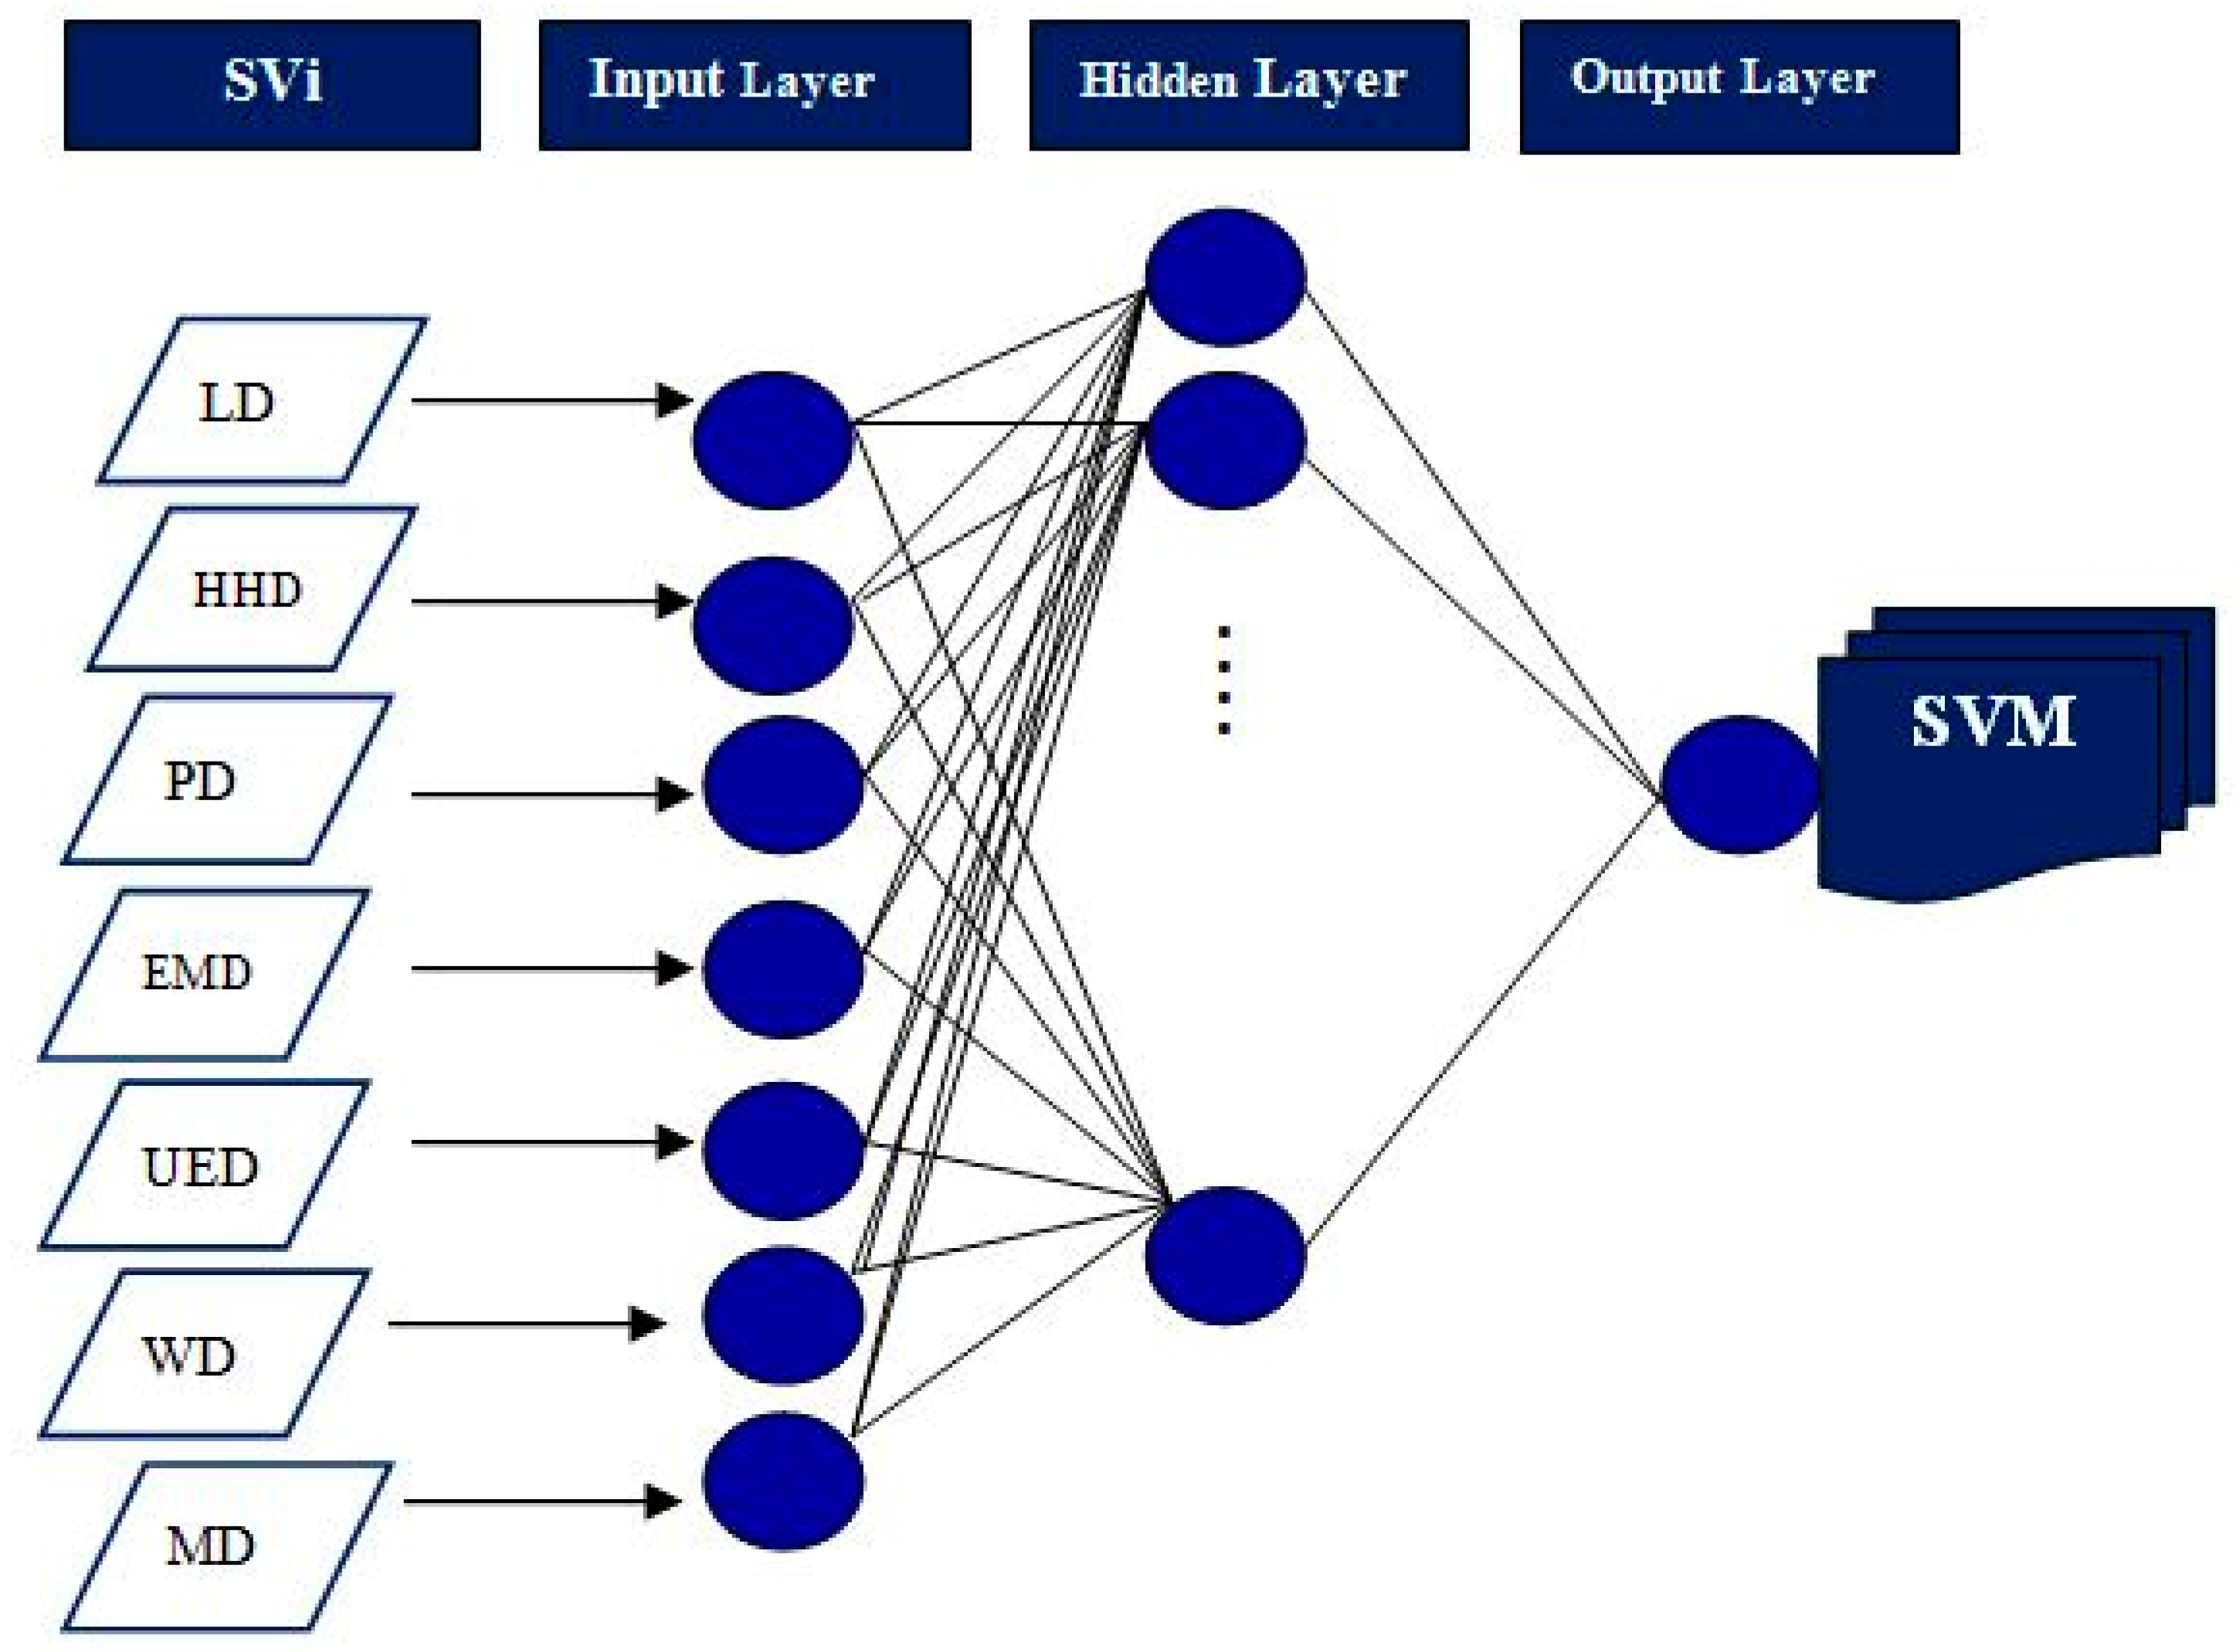
48], thus neglecting the socioeconomic vulnerability component. This study aims to investigate this problem by assessing the social aspect of vulnerability to earthquake hazard using an artificial neural network (ANN). The innovation of this paper addresses three points. First, earthquake disaster occurred frequently in East Azarbaijan Province, but the government and the public’s disaster prevention and mitigation response measures were not perfect. Few scholars have chosen to research this region; however, this study chose East Azarbaijan Province as a new research area to provide the basis for disaster risk management departments’ decision-making. Second, the determination of the index weights is a difficult problem in the current social vulnerability research literature. The subjectivity of the weighting methods, such as analytic hierarchy process (AHP) or technique for order of preference by similarity to ideal solution (TOPSIS), (AHP) or TOPSIS, has a significant effect on the evaluation results. To solve the problem of weighting, this paper applies the analytical hierarchy process. Third, the ANN-based method here presented meets the requirements demanded for earthquake prediction. This is because current approaches for vulnerability assessment are difficult to implement in a country such as Iran. The computational models derived from artificial neural networks (ANN) [
49,
50] can help evaluate earthquake vulnerability despite the inherent and ambiguous nature of earthquakes. The ANN systems can sequentially process information from interconnected units, which reply to inputted variables. These variables include weights, threshold, and transferable mathematical functions. In theory, each unit processes inputs from added units before transferring the signals to another unit in the link. This enhances the capability of the ANN to address complex problems with large data sets and intricate nonlinear relations that comprise numerous diverse alternatives [
51]. Furthermore, ANN can recognize complex patterns in data sets that conventional computational procedures are incapable of solving [
52,
53]. In addition, it delivers consistent predictions, even through uncertain or noisy data [
42,
54,
55,
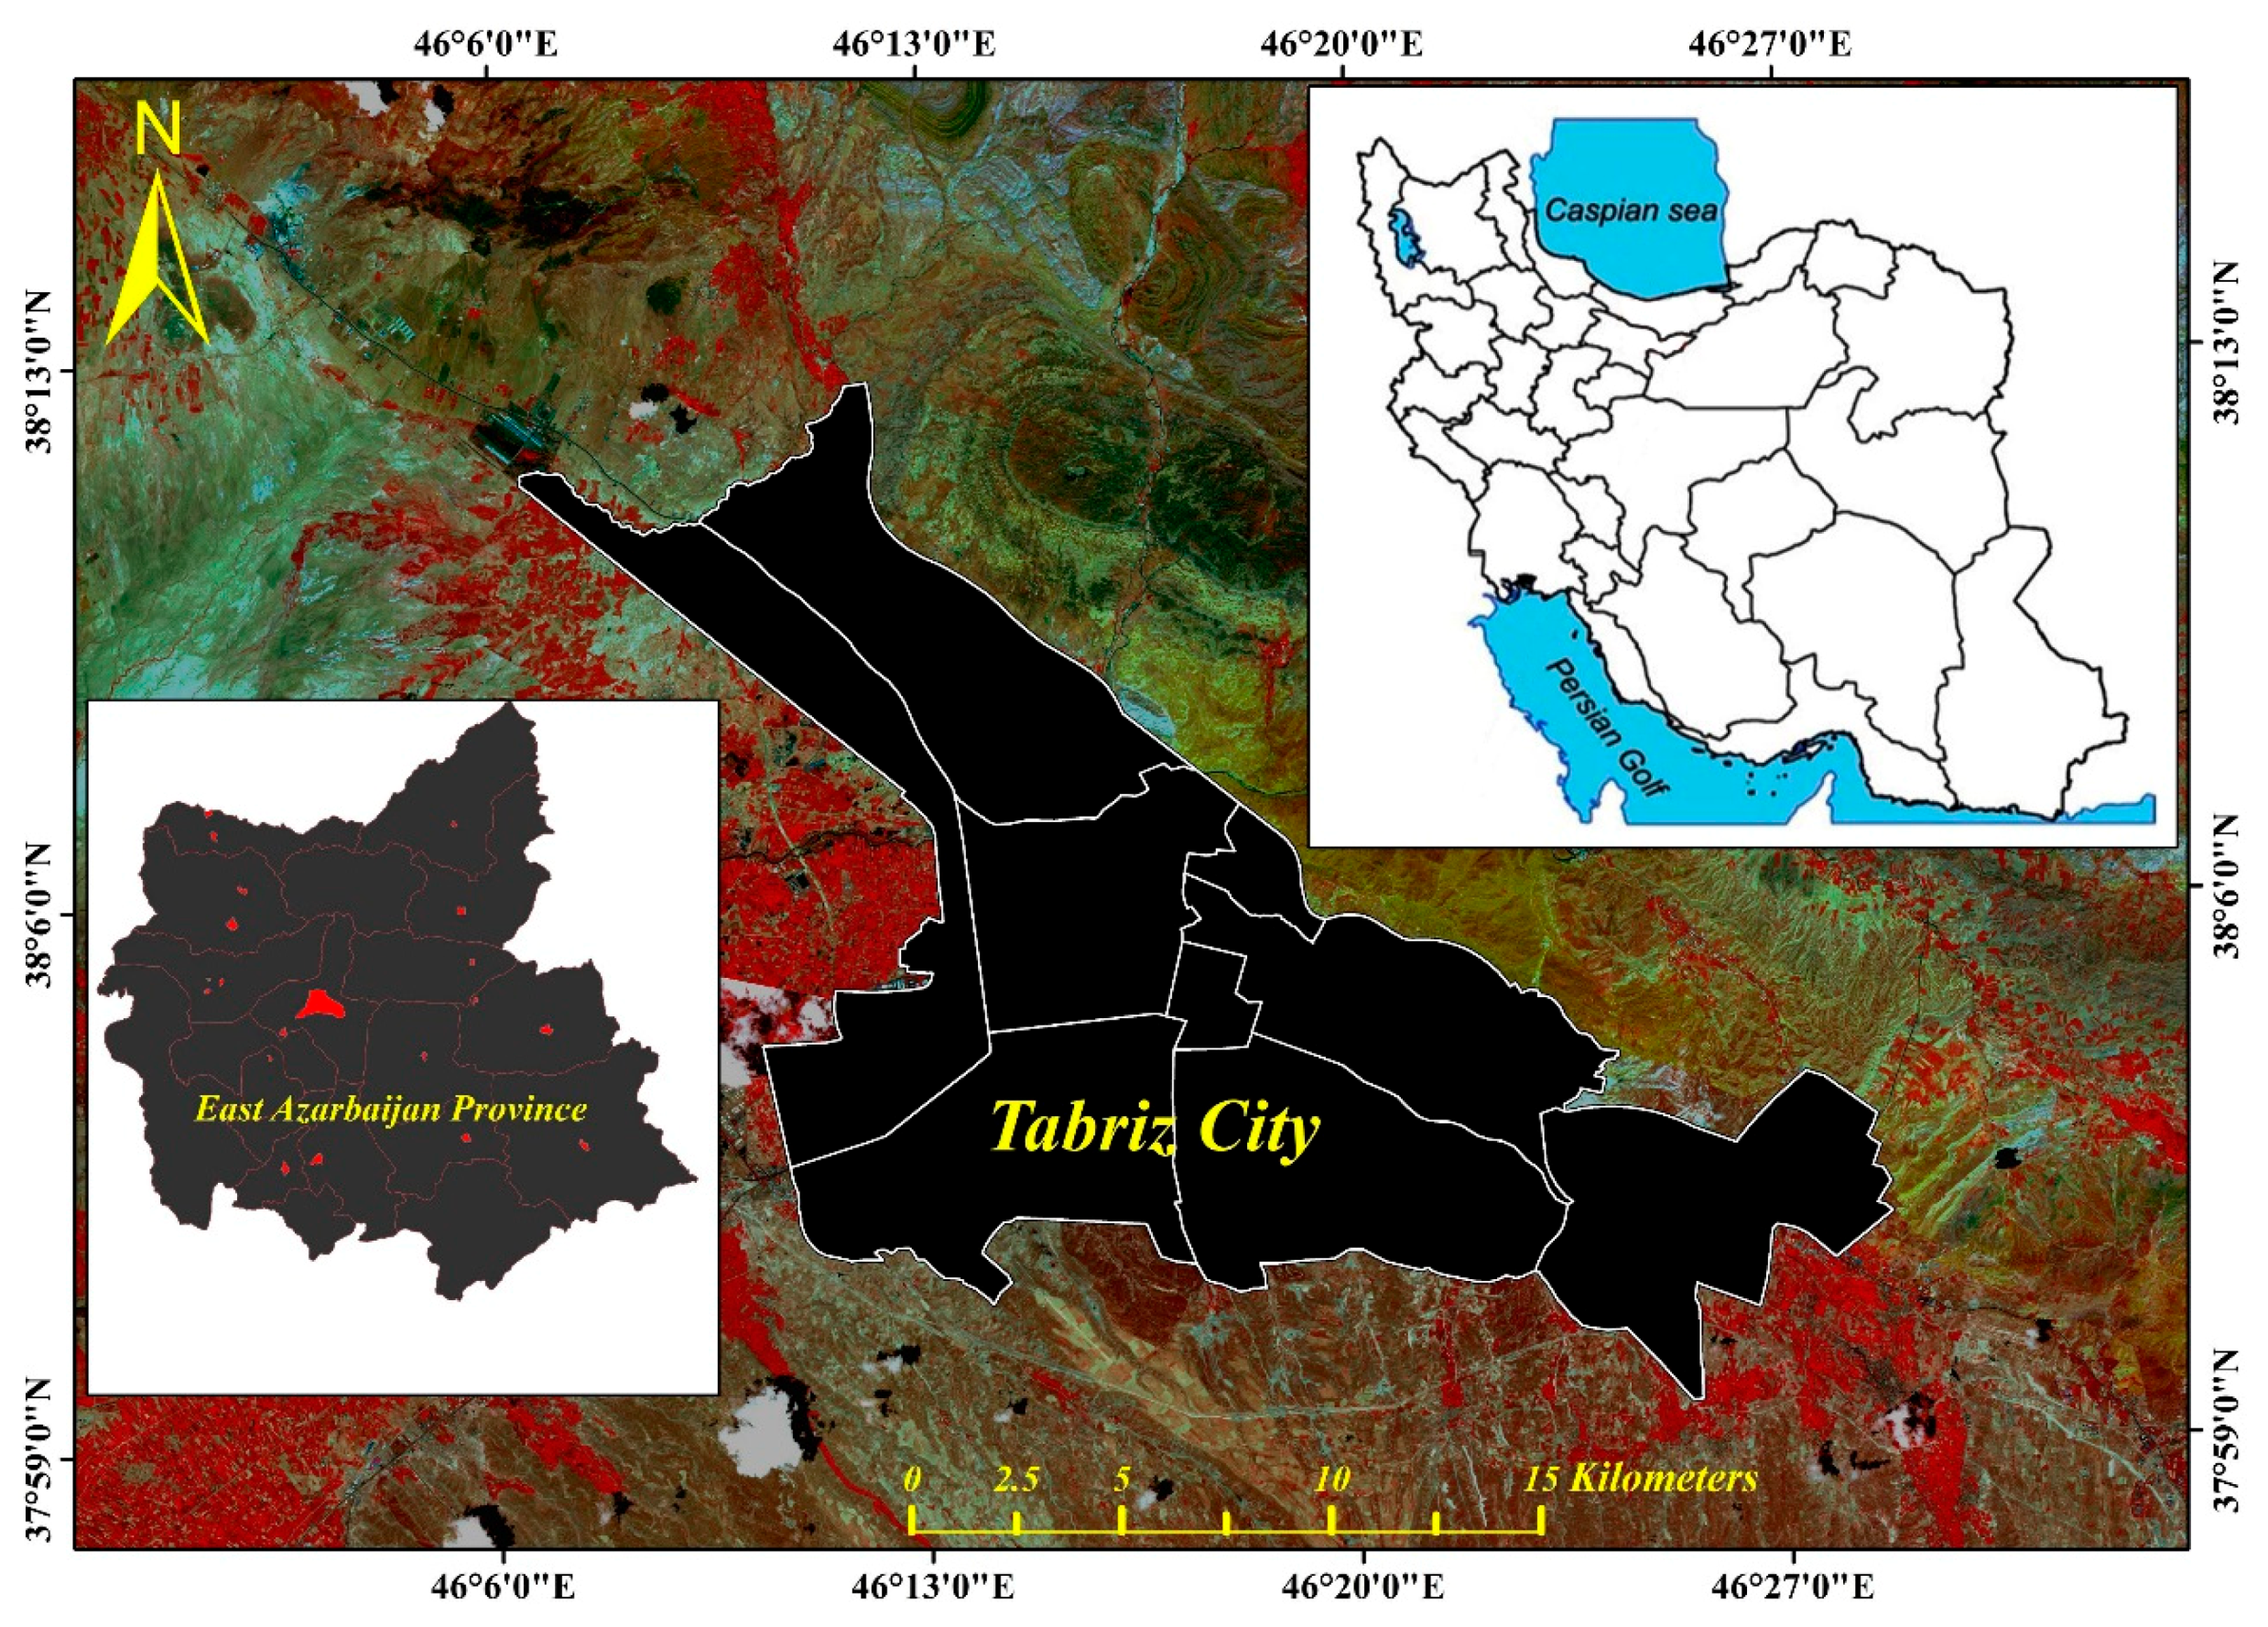
56]. Consequently, the ANN can effectively generate classified vulnerability maps that originate from complex interactions compared to other classic models, including regression. Moreover, this investigation aims to expose the social vulnerability of Tabriz to an earthquake and discover the statistical findings of a spatial approach. Correspondingly, we wish to introduce a less-known geographical region to broad readerships, and in this way expand the empirical proof of vulnerability assessment. A new research framework was developed to assess the issues of urban social vulnerability by taking Tabriz as a case city and earthquakes as a hazard. This study is helpful in identifying the most and least vulnerable zones in the Tabriz city, and eventually promotes the development of mitigation policies that anticipate the difficulties that accompany urbanization processes and regional demographic shifts.
3. Results
This study has been concerned exclusively with the construction of a set of composite indicators for social vulnerability assessment (SVA) in the context of earthquake hazards, which was proposed and implemented on real data of statistical units of municipality zones in Tabriz city. After computing the scores for the seven social indicators, the next step is first visualizing the obtained results for a better understanding of earthquake vulnerability for the nine municipality zones in Tabriz, and then validating the results. The constructed composite indicators in this study are expressed via the ArcGIS software. Visualization of the results represents a better understanding of the variation of the resilience level. The results clearly illustrate the difference between the north and south of the city.
Results indicate that Tabriz city is largely categorized into five (5) vulnerable zones. These include very high, high, moderate, low and very low, which are based on the seismic hazards related to the future occurrence of earthquakes. It is noteworthy to state that the five (5) categories were applied to highlight that specific regions are more vulnerable than others. After computing the scores for the social vulnerability index and the five (5) indicators for social vulnerability, the synthetic social vulnerability scores were subsequently displayed as a five-category map through ArcGIS (10.3). As shown in
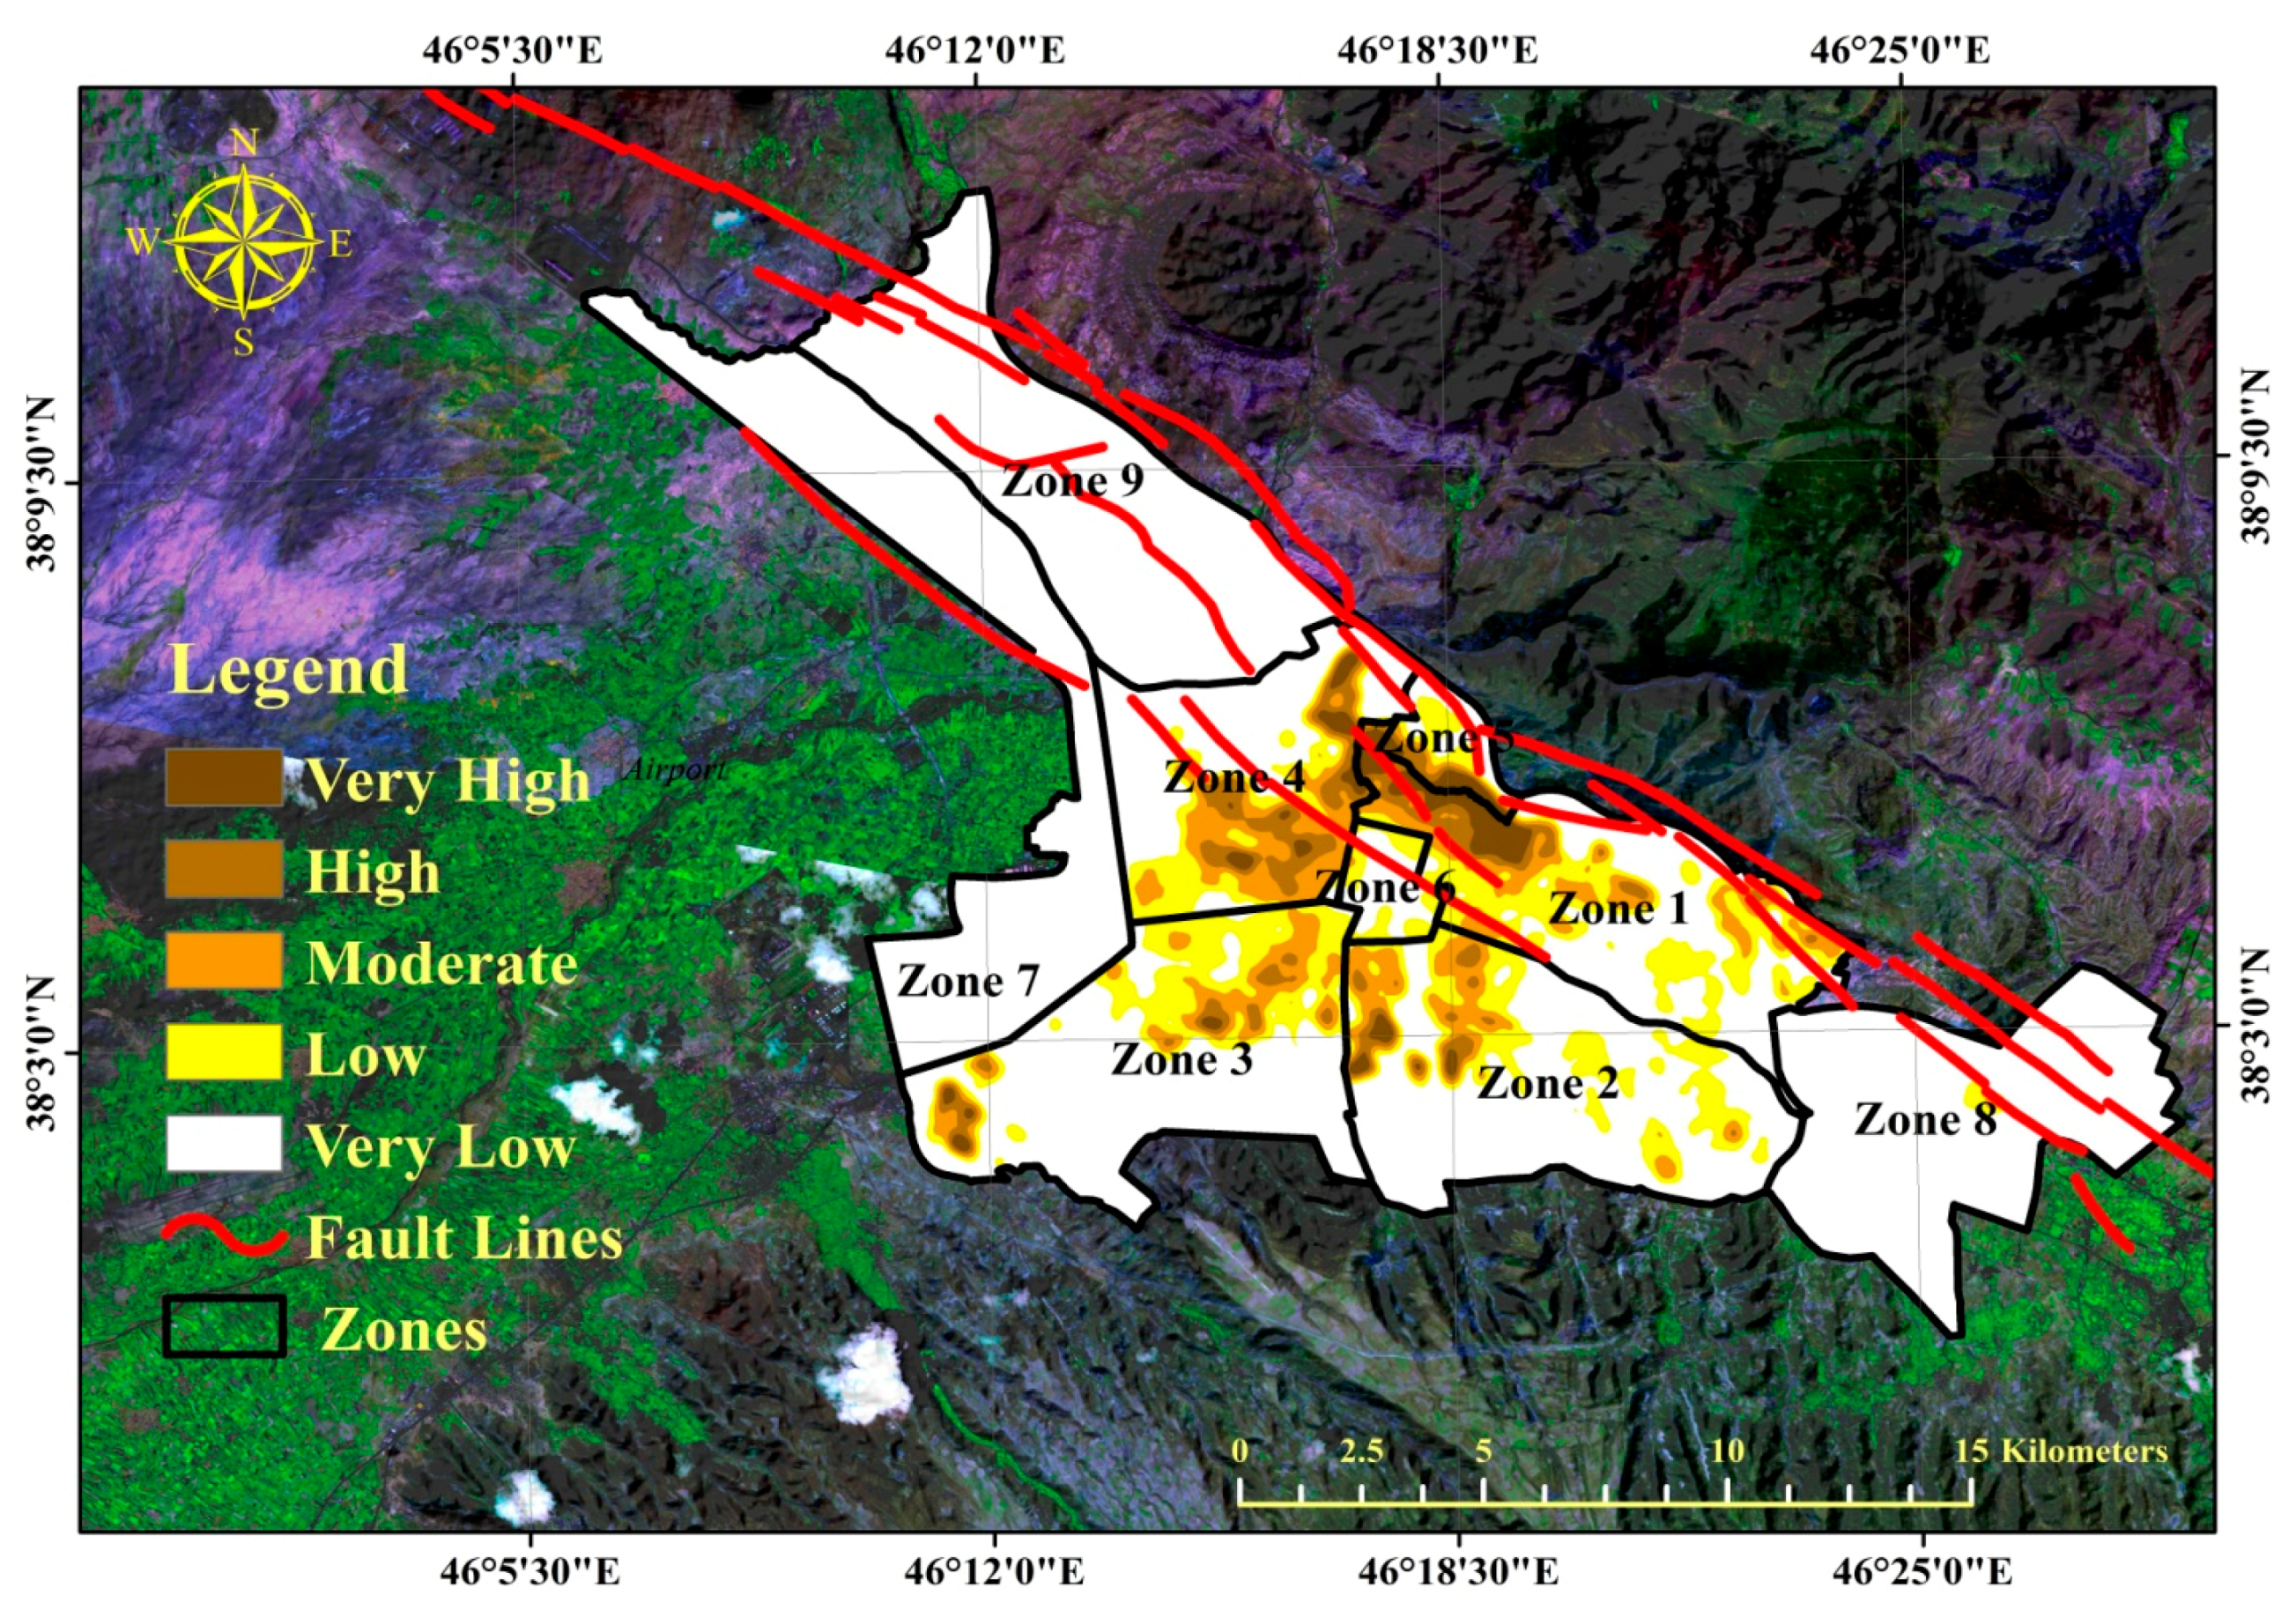
Table 2, the differences in the vulnerability levels are observable within the study area. The findings demonstrate that of the total area, 0.77% can be described as highly vulnerable. Therefore, the vulnerable zones that are described as high, moderate, and low signify 2.11%, 4.04%, and 16.77% of the area, respectively. The low vulnerability study area accounted for 76.31% of the total. Taking into account the municipal zones map and SVM of Tabriz, the vulnerability levels of the numerous zones are presented in
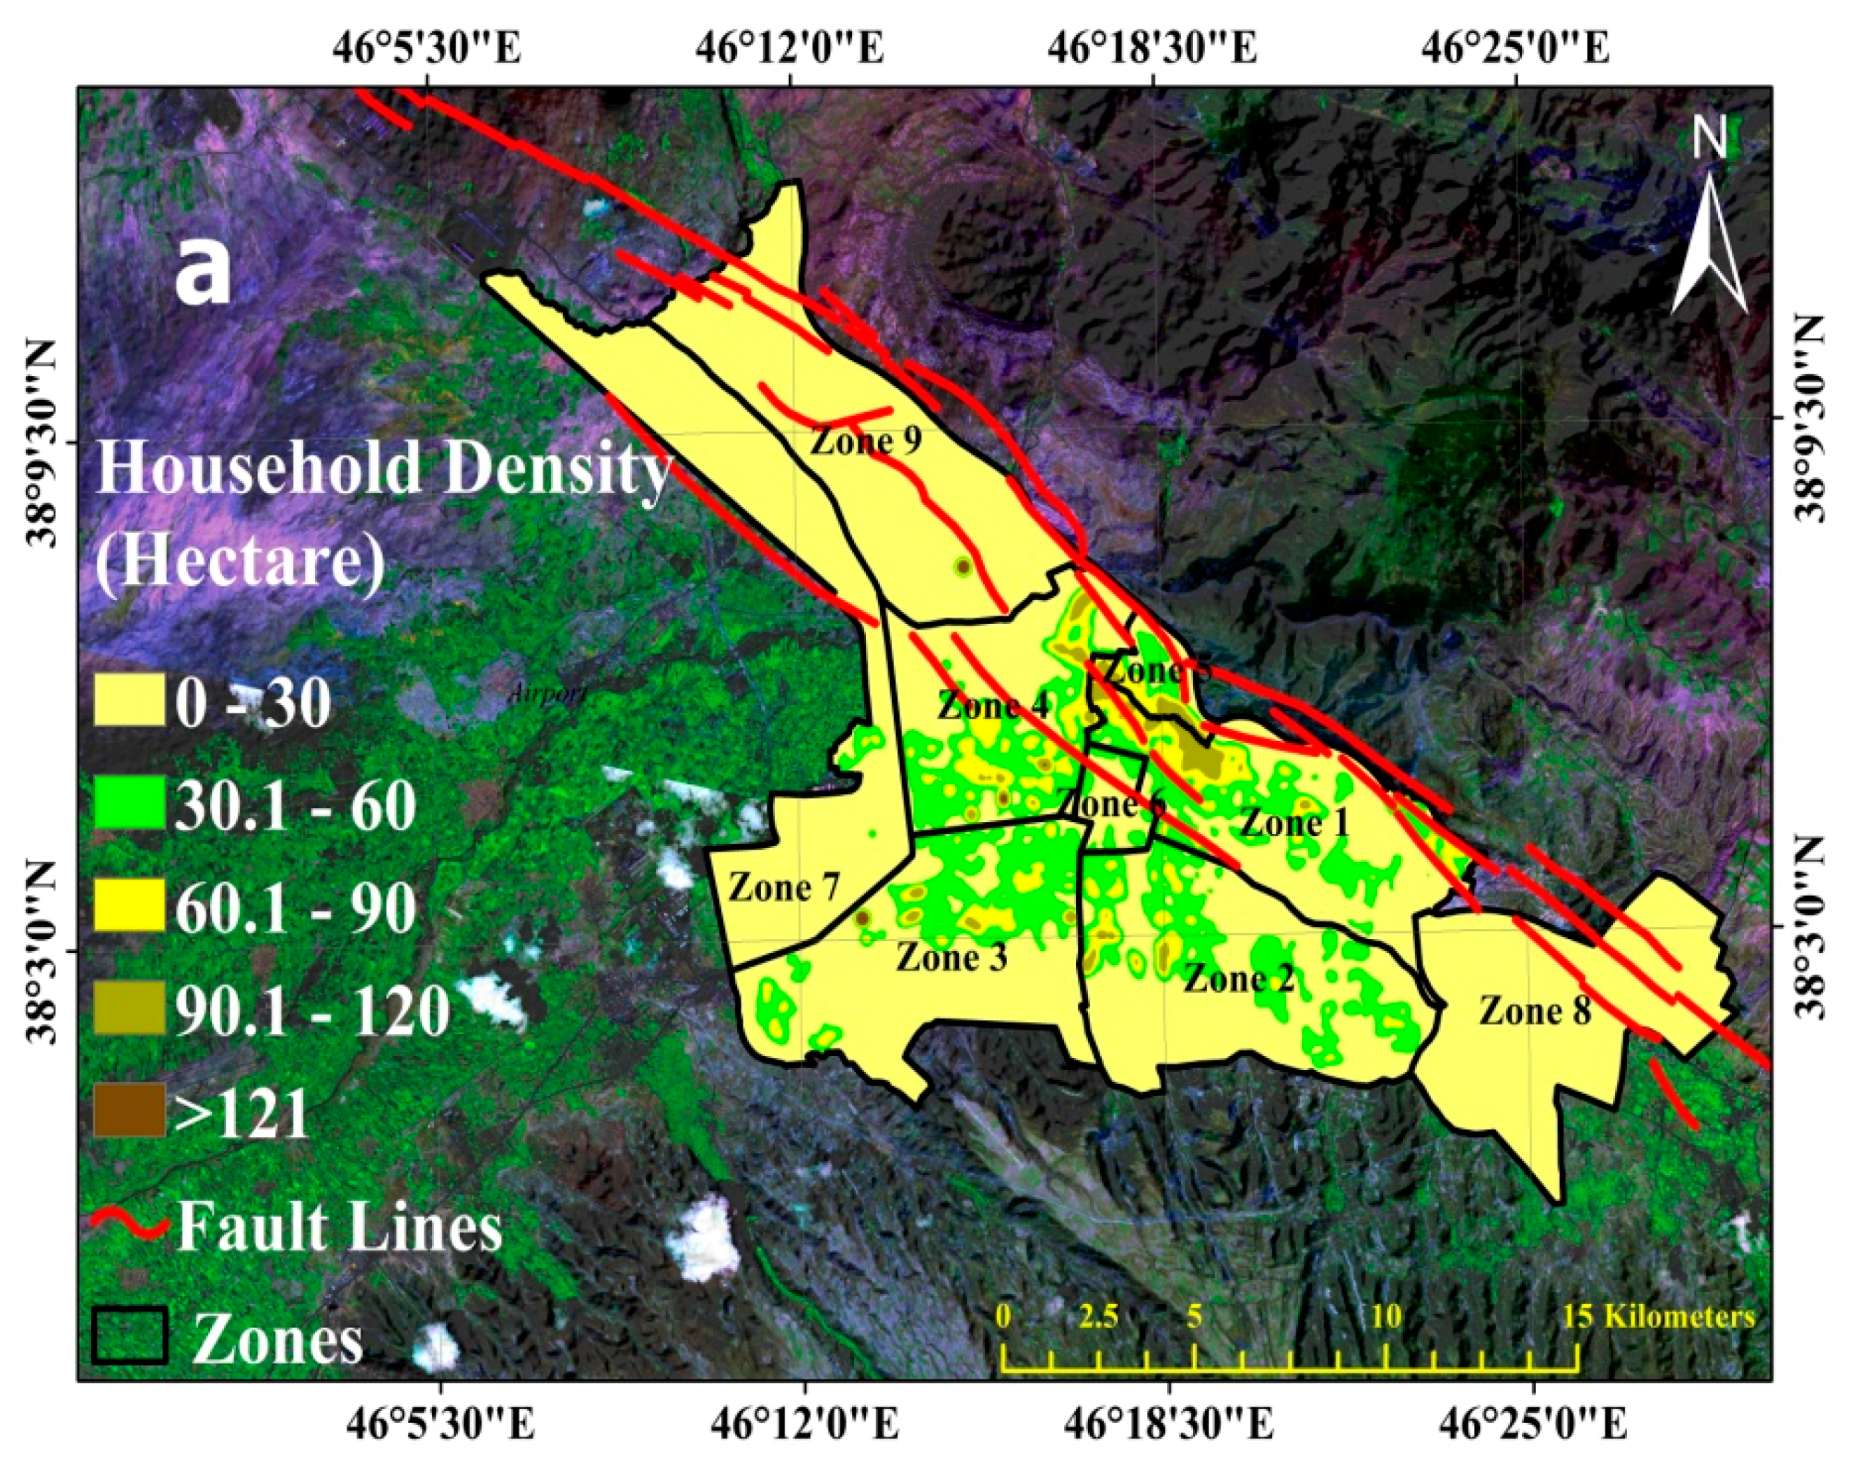
Figure 6. However, selected regions of Tabriz are located in the moderate-to-high hazard seismically zones. For nine zones in Tabriz, the seismic vulnerability reveals that many zones in the city are situated in a low to medium threshold of damage.
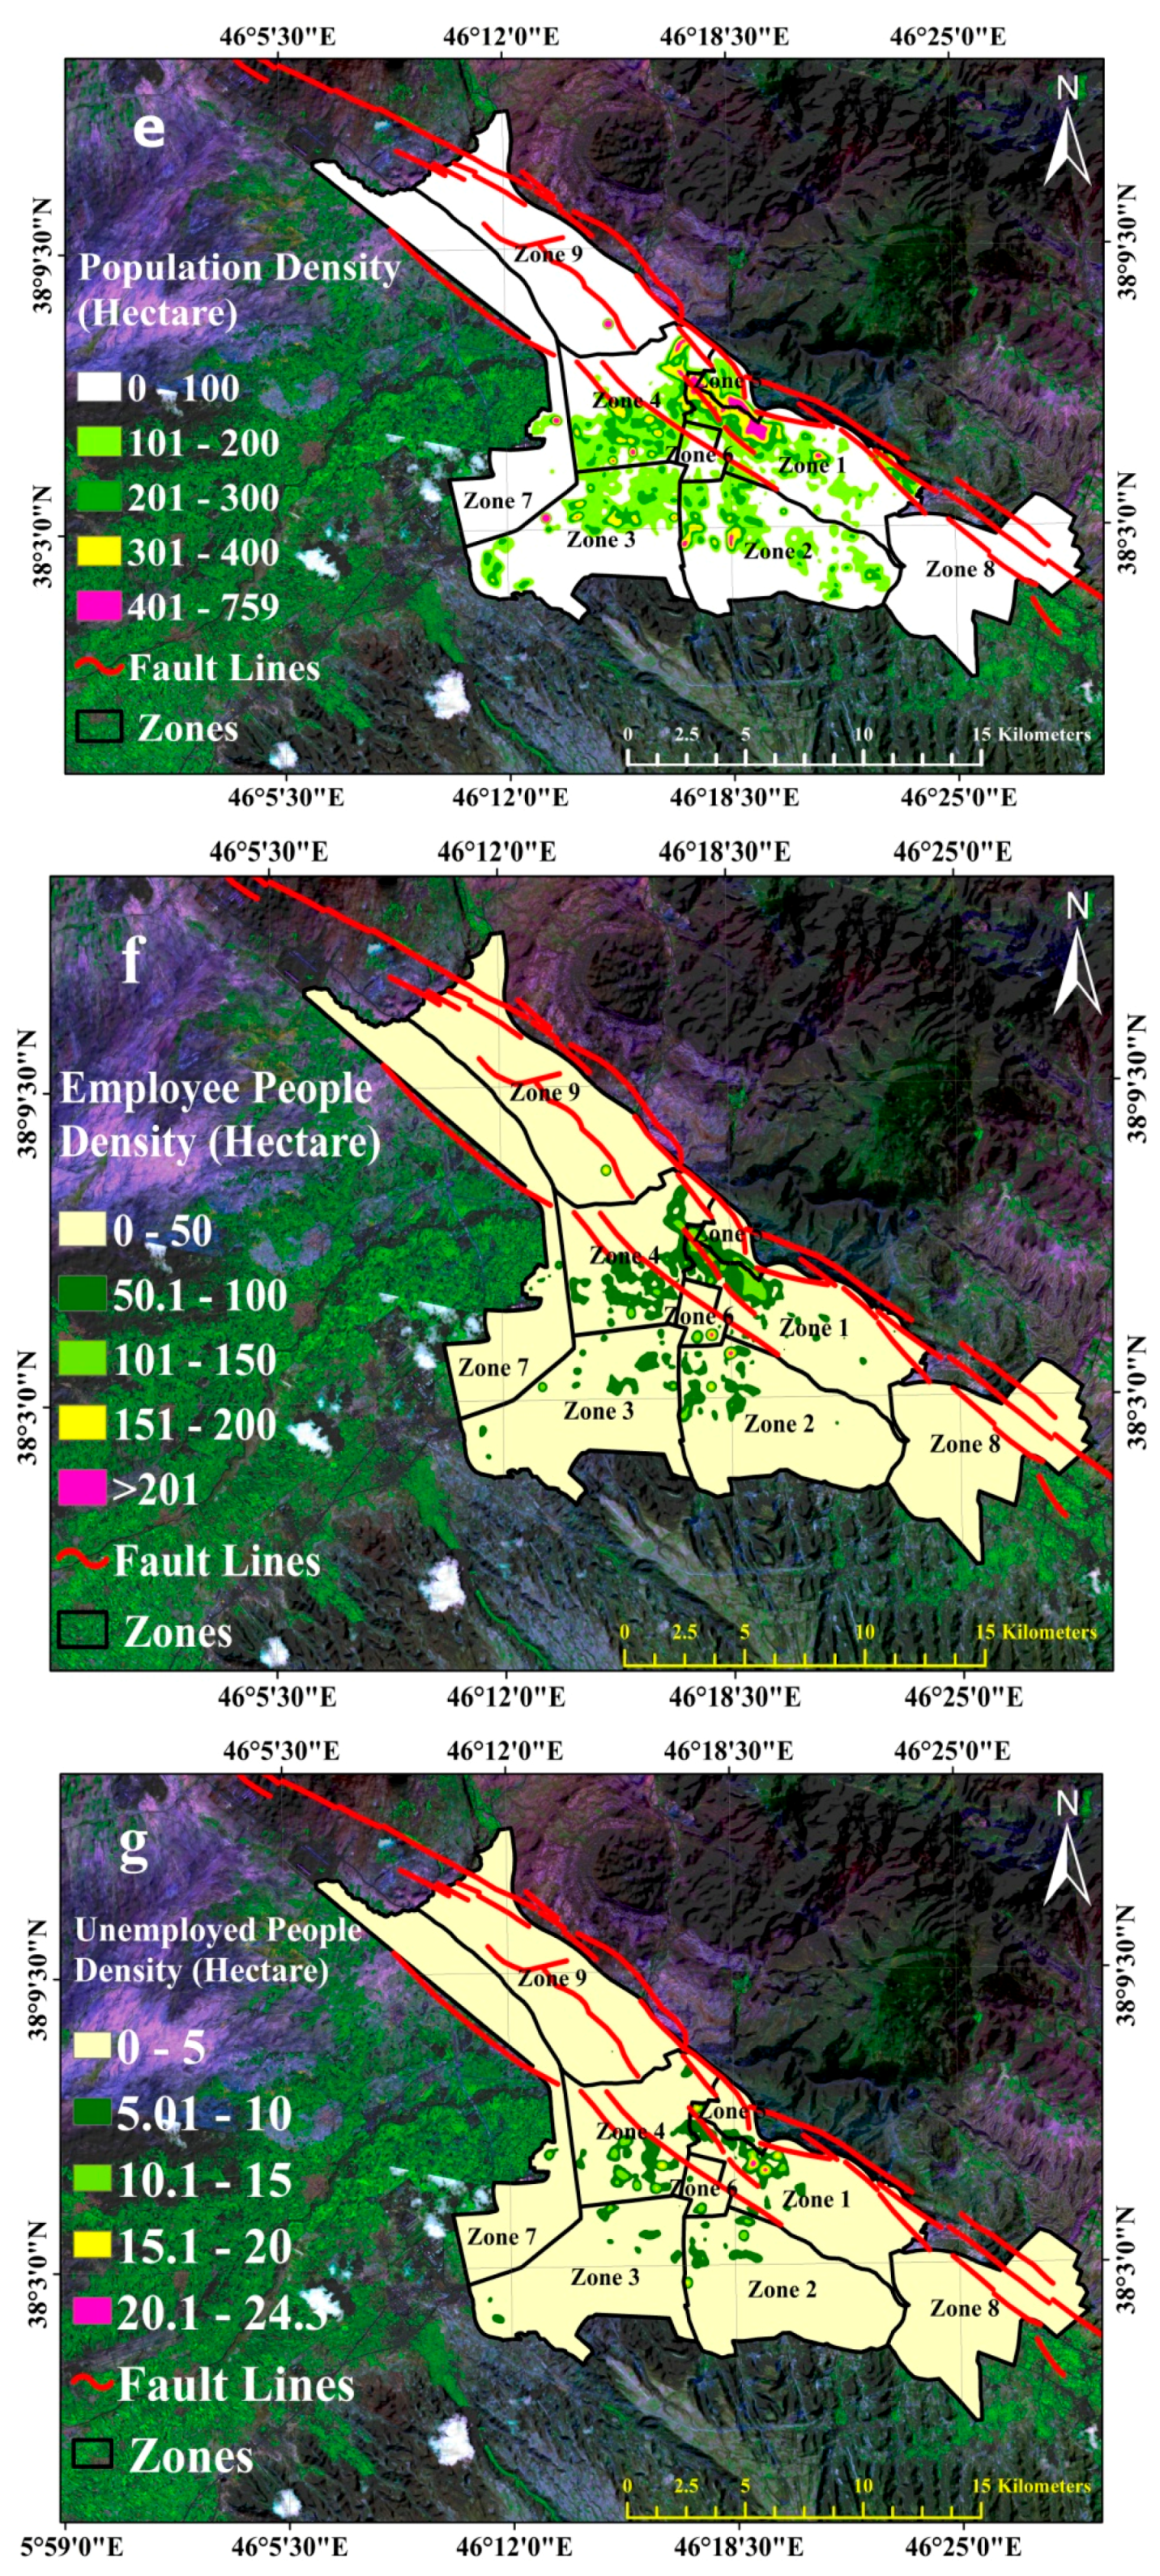
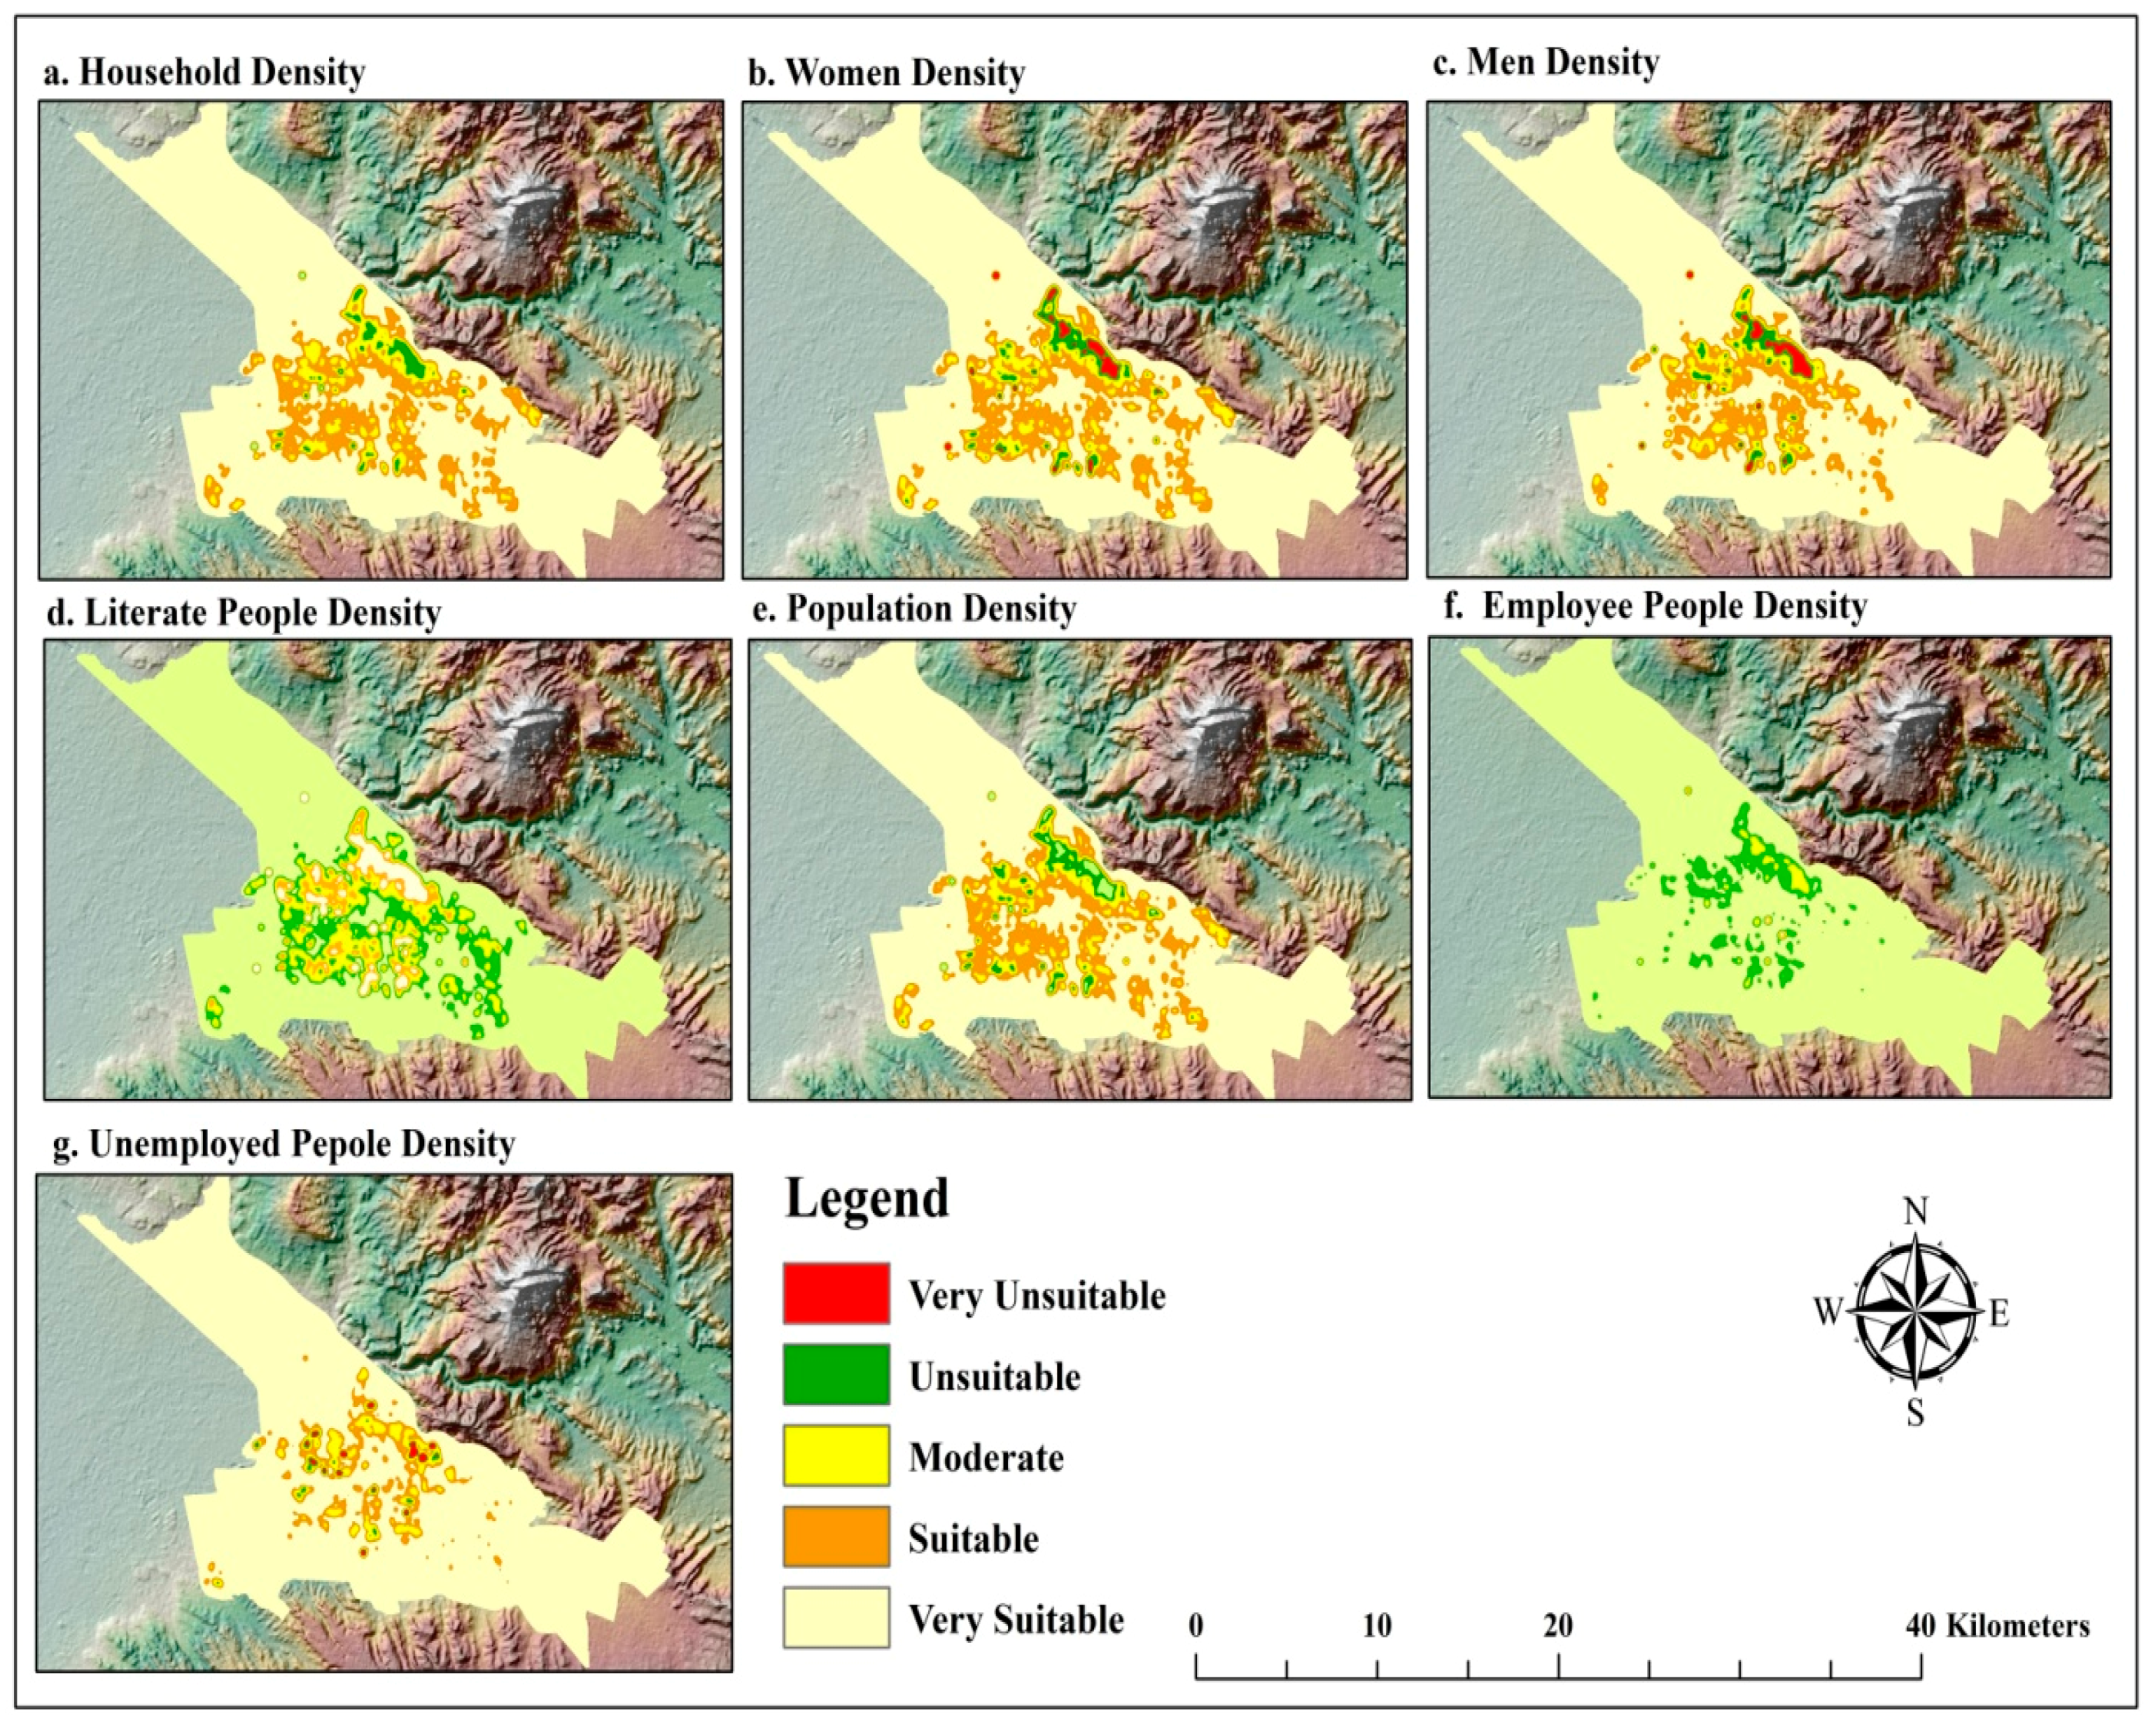
However, the south and southeast regions of the city are in suitable condition based on vulnerability. Given this, the zones such as 5, 4, and 1 are considered highly damaged areas. The maximal seismic vulnerability was observed in zone 5 due to its higher density of buildings in an area classified as one of the oldest in the city of Tabriz. The highest population among the nine zones in the city is zone 5, which has high probabilities of human casualties from potential earthquakes in this area. Other extremely populated areas are zone 4 and 1. Moreover, the highest buildings density in Tabriz can be found in zones 5, 4 and 1. Based on the data provided by SVM, zone 5 is classified in the very high and high vulnerability categories based on the values of 21.77% and 22.39%, respectively. As stated, the second most vulnerable area is zone 4, with 0.93% and 41.69%, which is categorized as very high and high vulnerability, respectively. Lastly, the third most precarious zone in Tabriz is zone 1, with 9.68% and 15.60%, which is categorized as very high and high vulnerability (see
Figure 6,
Table 3).
Conversely, the high social vulnerability score for these zones are based on different factors. To begin with, the higher population density in zone 5 exposes people to earthquakes. Consequently, the casualties, losses, and social vulnerability to earthquakes is significantly higher. Secondly, the level of regional economic development determines the quality of public infrastructure. Therefore, higher regional economic development ensures the availability of community service facilities, which includes better disaster response and recoverability. The public infrastructure in zone 5 is at a lower level than other zones, which means its social vulnerability to earthquakes is comparatively higher. Furthermore, the critical areas of zones 5, 4, and 1 are responsible for the vulnerability of some areas of Tabriz city, particularly at locations near the North Tabriz Fault (NTF). On the other hand, zone 8 with 100% very low vulnerability categories, shows the lowest vulnerability. Then, zone 7, with 1.72% and 98.02% in the low and very low vulnerability categories, is the second least vulnerable zone among the zones. Thereafter, zone 9 with 99.5% and 0.13% in low and very low vulnerability categories is classified as the third least vulnerable zone.
The social vulnerability in the selected zones is low due to the rebuilding efforts of the community and government. The use of high-quality building materials, robust designs, and the construction of houses with fewer levels has been implemented. In addition, the provision of generous subsidies and employment opportunities for victims by the government has prominently improved income levels. It stands to reason that higher per capita incomes result in wealth accumulation by families, and by extension stronger access to community resources. Lastly, the increased access to health-care services and facilities was increased by the government.
However, it is obvious that the northern regions of the city have a relatively better situation. This study estimated the southern parts of the city are faced with the highest earthquake risk. According to their final report, regions 5, 4, and 1 were defined as the most dangerous areas, which are so close to the North Tabriz Fault (NTF) and will experience the high seismic intensity and population damages. In fact, the spatial outcome of the SVM shows that such administrative subdivision in Tabriz can help better understand and synthesize the general characteristics of the city in relation to social vulnerability, and which of the systems have a major role in the different areas of the city. These results point to the heterogeneous spatiality distribution of SV, which affects the overall vulnerability of the city in different ways and with different intensities. This suggests the need to intervene in all of the systems to enhance the overall city’s resilience. On the other hand, interventions in Circumscription 1, which presents a higher SVA, can be considered as a priority in order to reduce the social vulnerability to earthquakes in Tabriz.
4. Discussion
The concept of social vulnerability stimulates people to make forehand preparations against disasters. These arrangements made during pre-existing conditions can enhance the capacity for communities to recuperate during the period of post-disaster reconstruction. As such, the concept is a social construct that exposes the stratification and disparity between different people, groups, or places. Therefore, the reduction of social vulnerability necessitates considerations for the fundamental features of the socioeconomic and local terrain. However, there is a lack of consistent metrics for evaluating social vulnerability to earthquakes. Currently, the indicators of social vulnerability are developed from statistical data. Therefore, the data that is available significantly influences the selection of indicators, which is a process that depends on readily quantifiable variables, although these might not be accurate for assessing social vulnerability. Cutter et al. (2003) [
40] created social vulnerability indicators that are described in a statistical yearbook published in the United States.
In Iran, as a developing country, a social vulnerability can play a greater role in the overall vulnerability to natural hazards than elsewhere [
85,
86,
87,
88]. Consequently, in order to reduce vulnerability, risk-reduction strategies must consider as much as possible the population’s characteristics and ensure that the population knows how to act in emergency situations. Similarly, institutions must have a clear picture of what preventive measures can be employed, both at the individual and the community level, to reduce the risk for individuals, households, and communities. As it has been observed, supporting the local community’s involvement is crucial for implementing strategies that will lead to a culture of safety [
89]. However, Iranian researchers have examined the concept based on various yearbooks available in Iran. Consequently, there is a significant difference between foreign and domestic scholars in the construction of indicators that describe social vulnerability. Furthermore, based on the disparities in political and cultural backgrounds, ethnic factors need to be considered by foreign scholars during the development of social vulnerability indicators, although Iranian academics do not take these factors into cognizance. The vulnerability of Iran to earthquakes is influenced by multi-dimensional factors classified as socioeconomic, physical, and environmental. In this paper, socioeconomic factors are considered the key element that influences earthquake vulnerability studies in Iran.
Tabriz city is located among a number of seismic faults with the high potential of earthquake occurrence. Its residential areas are highly vulnerable to earthquakes due to dense population, too many structures, and violations of construction codes [
64,
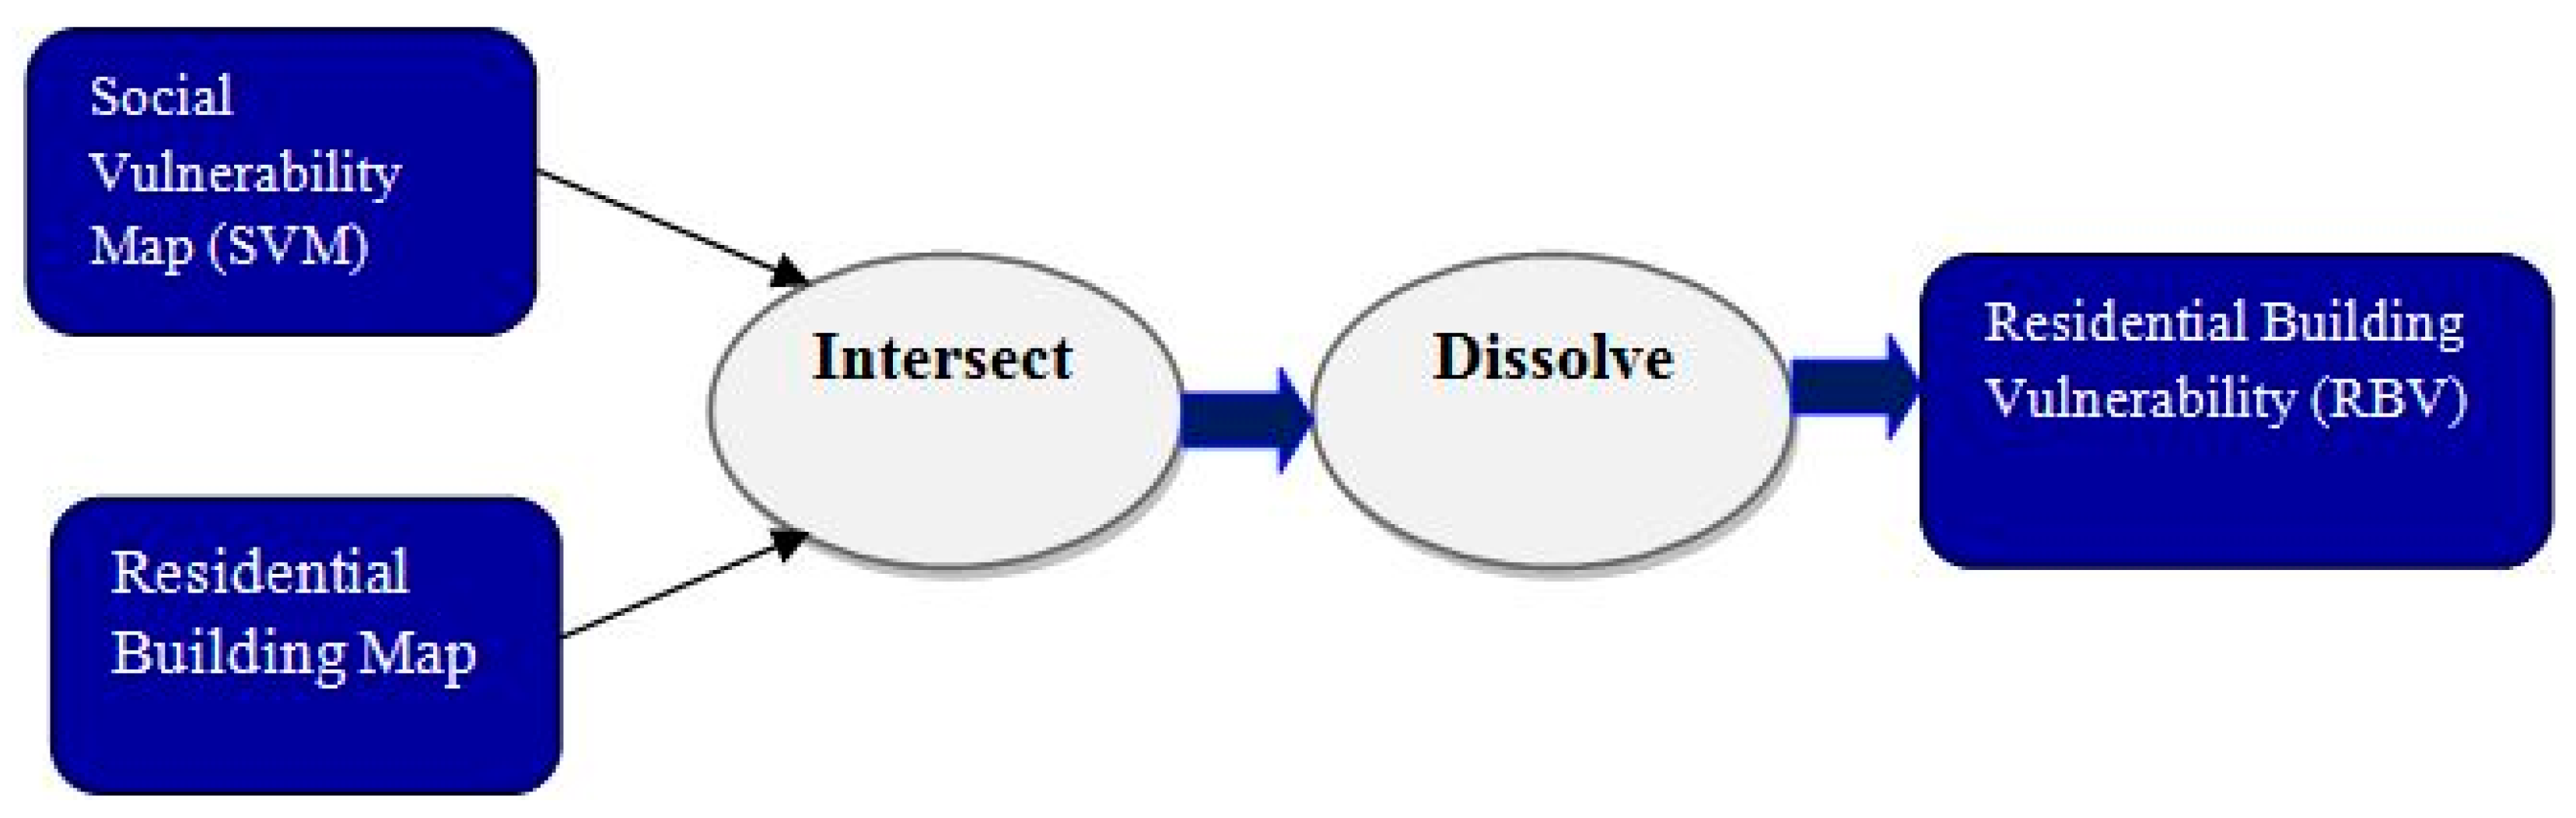
65]. Thus, in the case of an earthquake, the possibility of a severe damage will increase dramatically. Therefore, developing a seismic vulnerability map is a useful step to take in order to decrease the severity of a major earthquake impact in the area. The construction of vital structures such as hospitals and schools can be limited in highly vulnerable areas, and the establishment of vital roads can be banned or subject to observing all of the earthquake engineering principles, seismic regulations, and construction codes. The elaboration of SVA and SVM helped identify social vulnerability and visualize how it spreads spatially in Tabriz city. However, the data on the size and area of the vulnerable zones alone cannot highlight the probable impact or risk levels. Hence, data on residential buildings in the municipality zones of Tabriz can be adapted to estimate or forecast the vulnerability impact of Tabriz. Therefore, the residential building vulnerability (RBV) in different zones of Tabriz is deduced as depicted in
Figure 7.
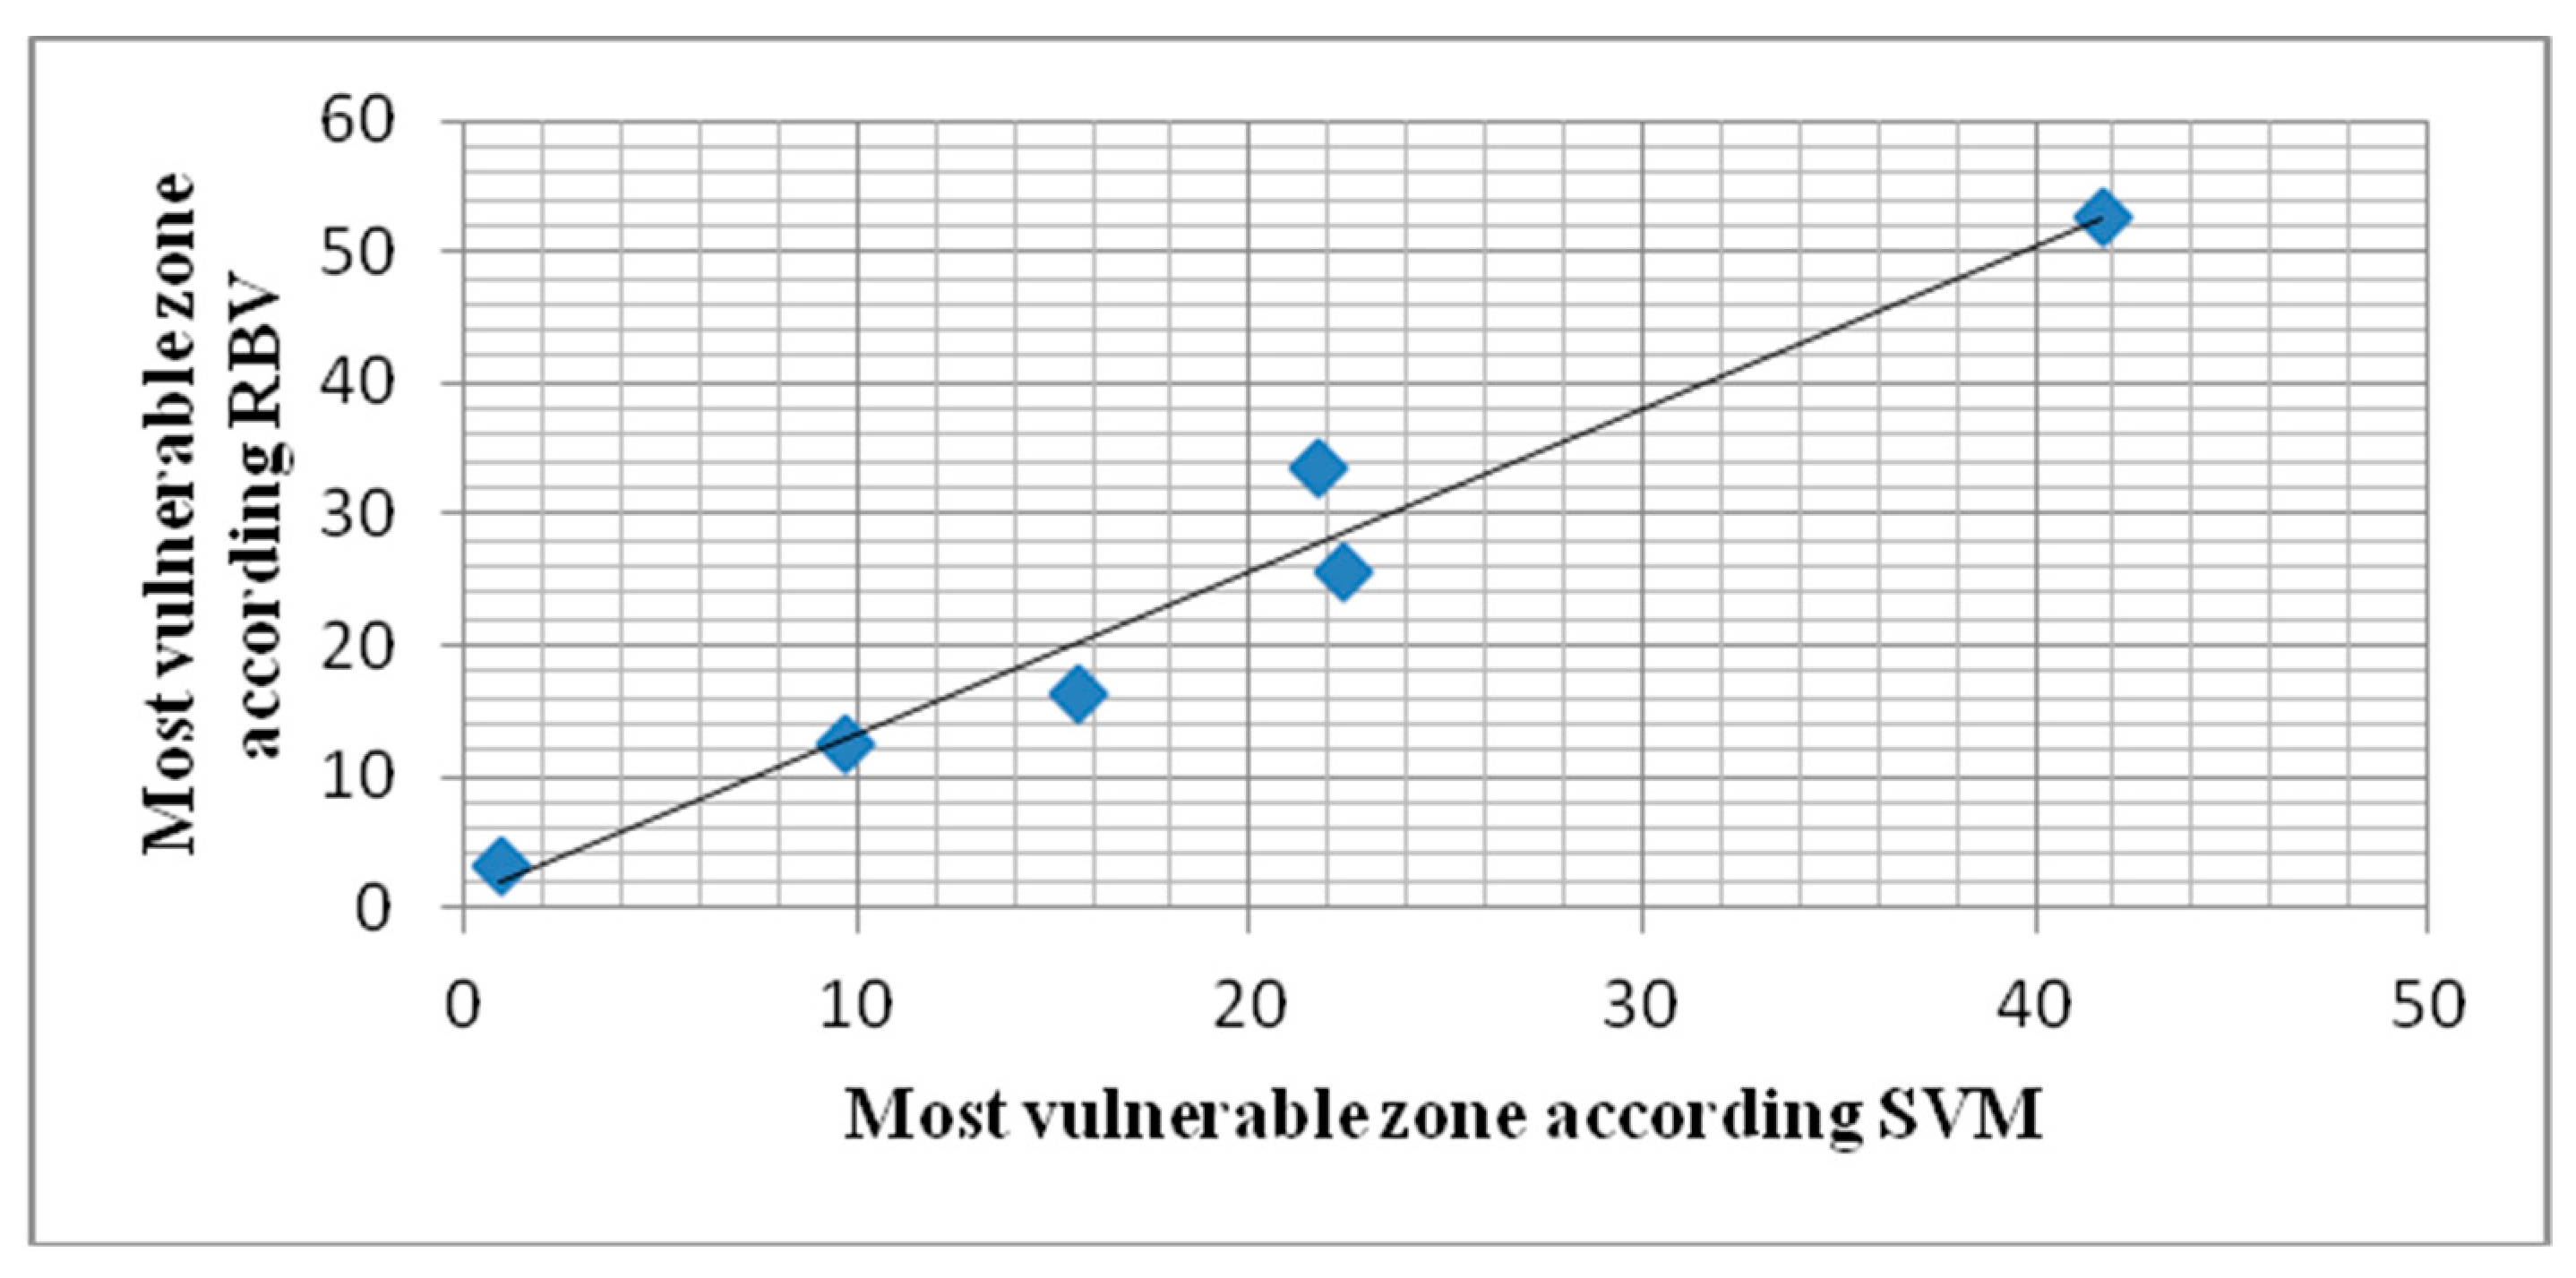
Comparing the SVM with data provided by residential buildings may enable researchers to analyze the amount of vulnerability more accurately.
Table 4 compares the vulnerability zones outlined for Tabriz city as derived from the SVM and residential building vulnerability (RBV) data. As observed, the most exposed zones are collected in zones 5, 4, and 1 of the city. These three zones due to their location on the North Tabriz Fault (NTF) specified as most vulnerable zones.
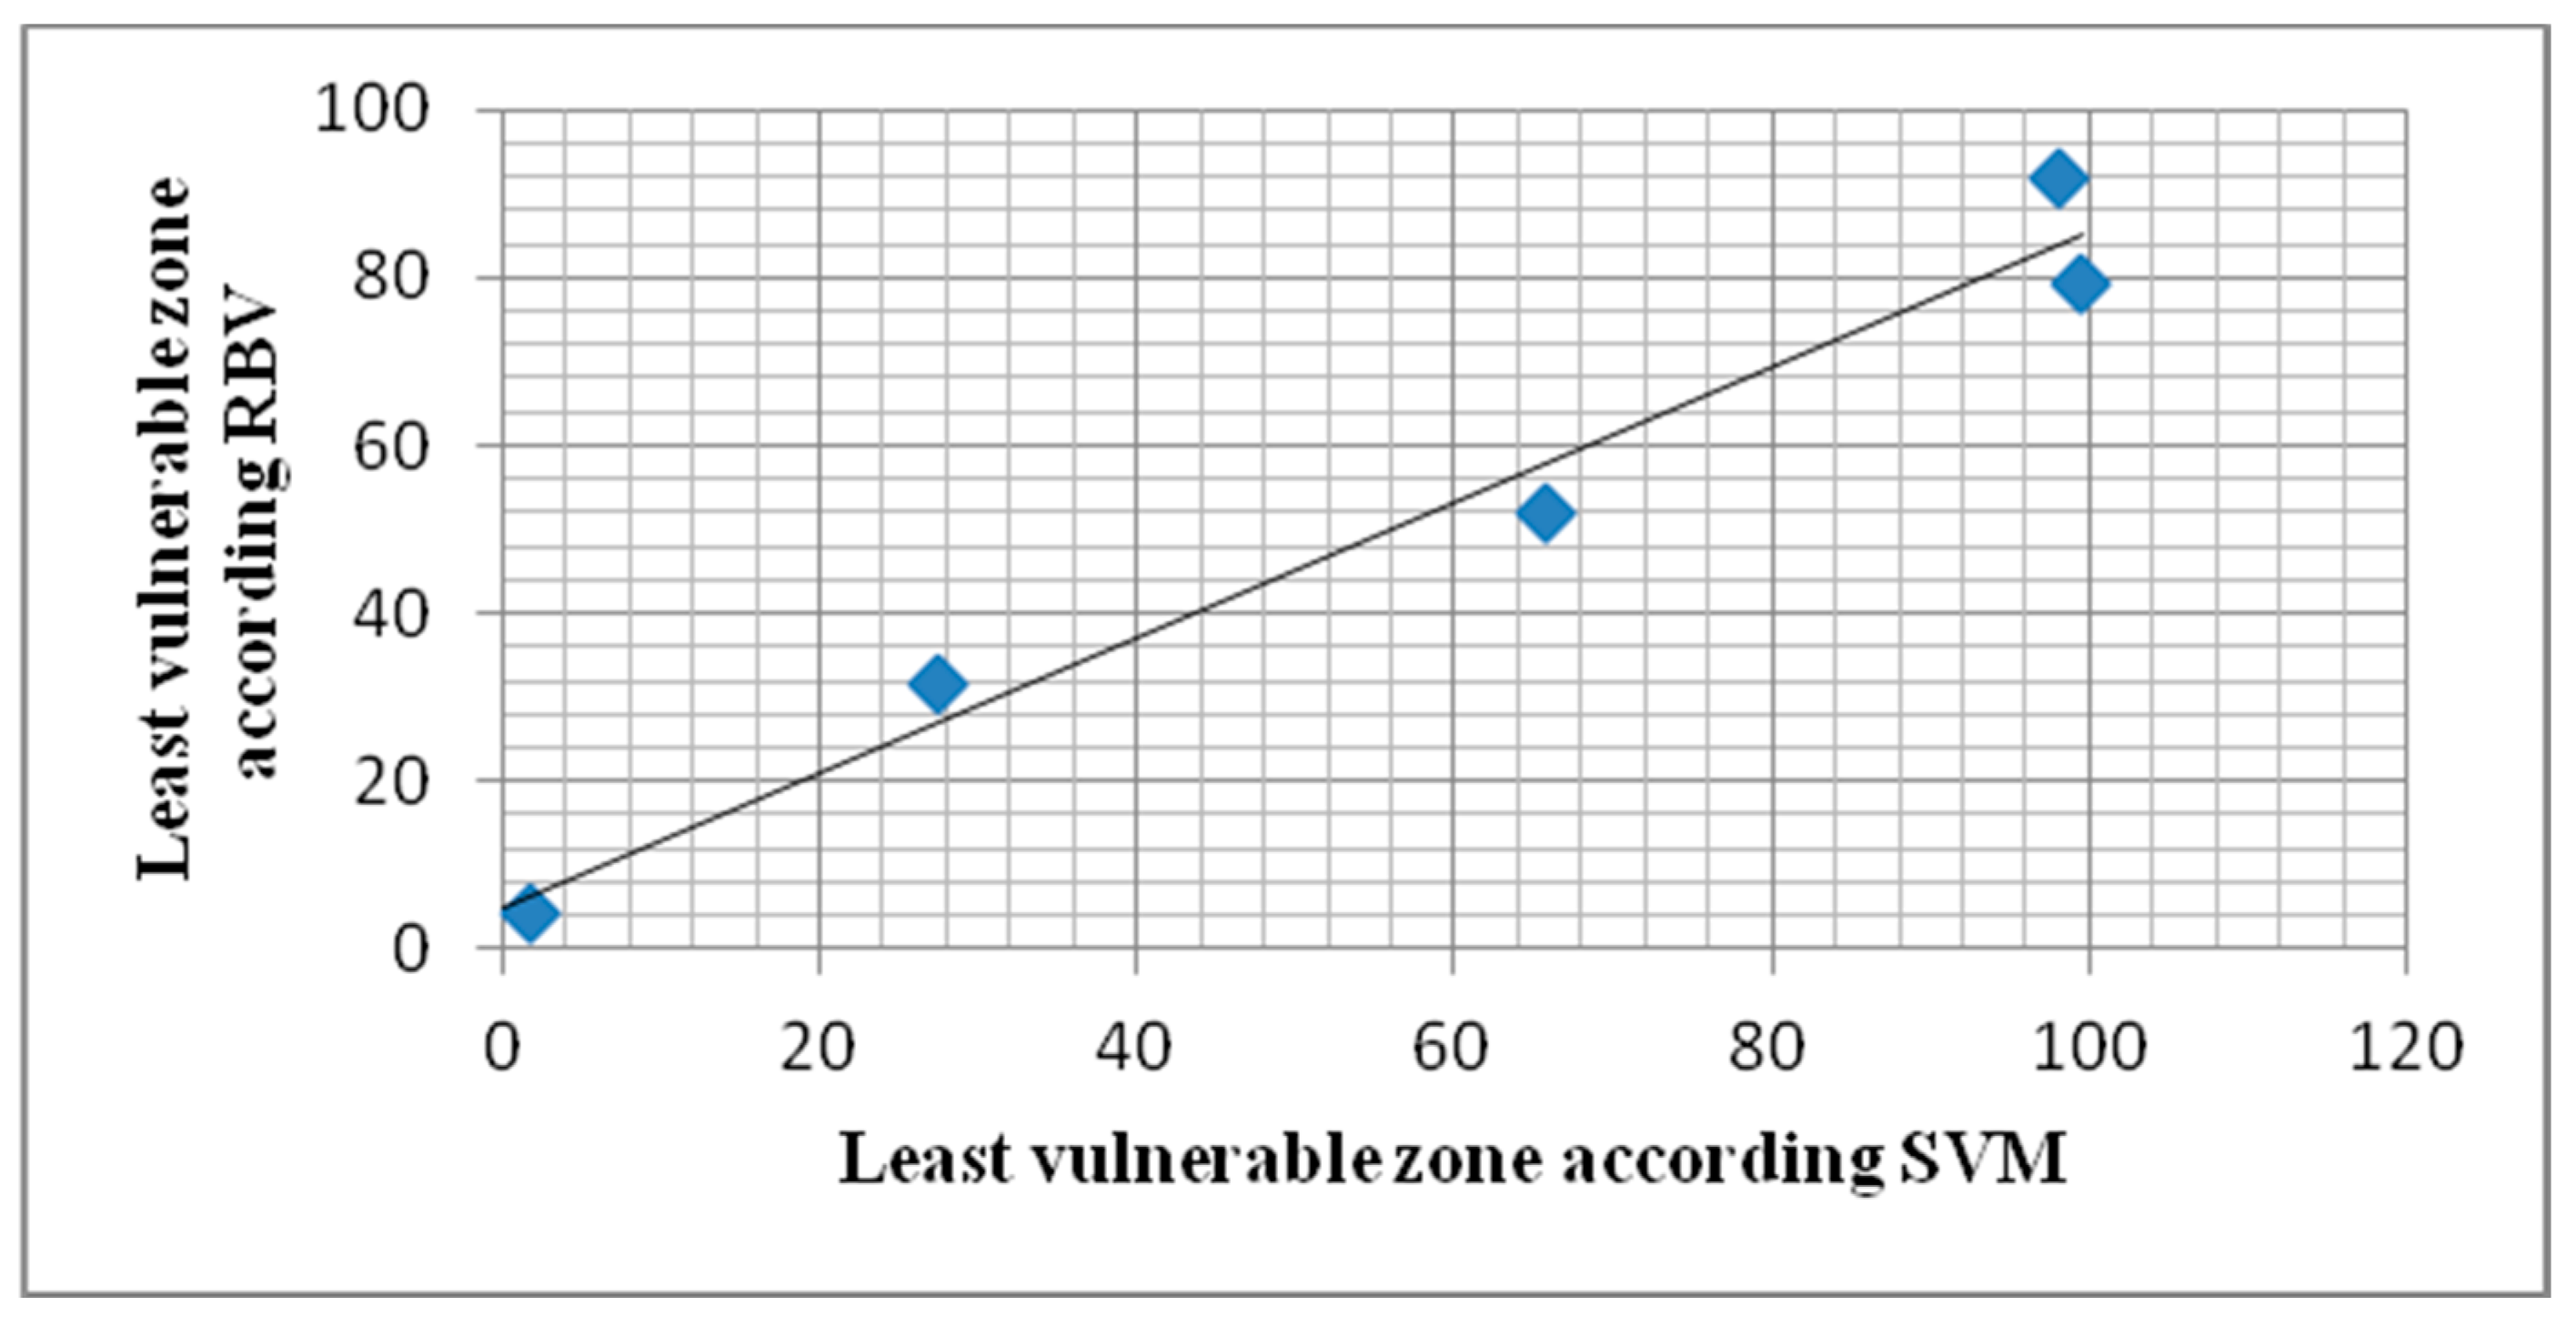
By overlapping the SVM and residential buildings vulnerability (RBV), it is possible to see that the lowest vulnerability zones are zones 3, 7, and 9. In this study, the urban vulnerability of Tabriz city against earthquake hazard has been investigated according to social indicators using the artificial neural network (ANN) model. The planned framework for vulnerability assessment is a flexible application for urban environments at various geographical scales and mapping units. However, limitations exist for applying social vulnerability indicators in the city of Tabriz. The key difficulty is a lack of data quality. Nevertheless, this paper has adopted suitable variables to explain most of the social vulnerability changes in the city of Tabriz. The data adopted for this study includes the current population census from 2011. This availed the authors with the most up-to-date information for the comprehensive understanding of the high spatial and social vulnerability distribution in the city. The results showed that that high disparities in social vulnerability to the hazards of earthquakes are prominent in the city of Tabriz. This is because all of the management strategies for earthquake hazards are based on a biophysical component of place vulnerability [
90]; this calls for a serious reconsideration of these strategies and the incorporation of a social vulnerability component in these strategies.


 ,
, 


