1. Introduction
The globalization trend has greatly expanded the dimensions and populations of cities in recent years, and city planning and coordination has also been improved in a pluralistic way [
1]. During this period, problems and contradictions of urban development have been increasing as the days have passed. Several issues have largely curbed the sustainable and harmonious development of cities, such as the aging of the population, the insufficient of per capita resources allocation, the urban traffic congestion, the decline of urban operation efficiency, the backward environmental governance, and the destruction of urban ecology and so on. Along with the development trend of cities and the need to urgently solve the contradictions, the management and development of a good city not only need the help of the traditional city management measures, but also require new technology which can be more scientific and harmonious [
2,
3].
Innovation and the development of new communication technologies such as Internet of things (IoTs), big data, and cloud computing have provided new solutions to cities’ governance and maintenance. They have built a new model for new cities’ construction [
4,
5,
6]. Integration of information and industrialization have made traditional cities gradually evolve into a new form of ecological social organization. The smart city is based on this trend, and traditional industrial society is transiting to modern innovation society. It can be said that a smart city provides a reliable solution to this process. A smart city gives an optimal approach for a resource-conserving and environmentally-friendly society. From a technical point of view, smart cities can realize the computing and integration of a ubiquitous network, overall perception, and connectivity through the comprehensive application of IoTs, big data, augmented reality, and computing cloud technology. From the perspective of social evolution, the intelligent construction of a city is also needed through the Living Lab, spatial information grid, and data grid integrated application tools and methods, so as to realize background knowledge and open vision, thus coordinating the sustainable development of social form innovation.
In recent years, the global smart city has entered the stage of high-speed development, and it will gradually realize the vision of “total connectivity, comprehensive perception, and intelligence”. The sixth world smart city conference kicked off in Barcelona in 2016 [
7], with delegations from more than 600 cities all over the world, and numerous enterprises and experts in communications participated in it. It predicted that by the end of 2016, global smart cities will be worth up to 40 billion US dollars. Additionally, there will be more than 20 countries enacting smart cities’ development planning policies by 2017. They will identify the investment project priority system matching with city information, and prioritize related information technology and the business process. The Prospective Research Report [
8] indicated that there were 311 prefecture-level cities and cities in China working on smart city construction by the end of 2015. A total of 158 smart cities have been built and widely used and promoted in more than 70 areas. Therefore, at the planning level, China attaches great importance to the construction and development of smart cities.
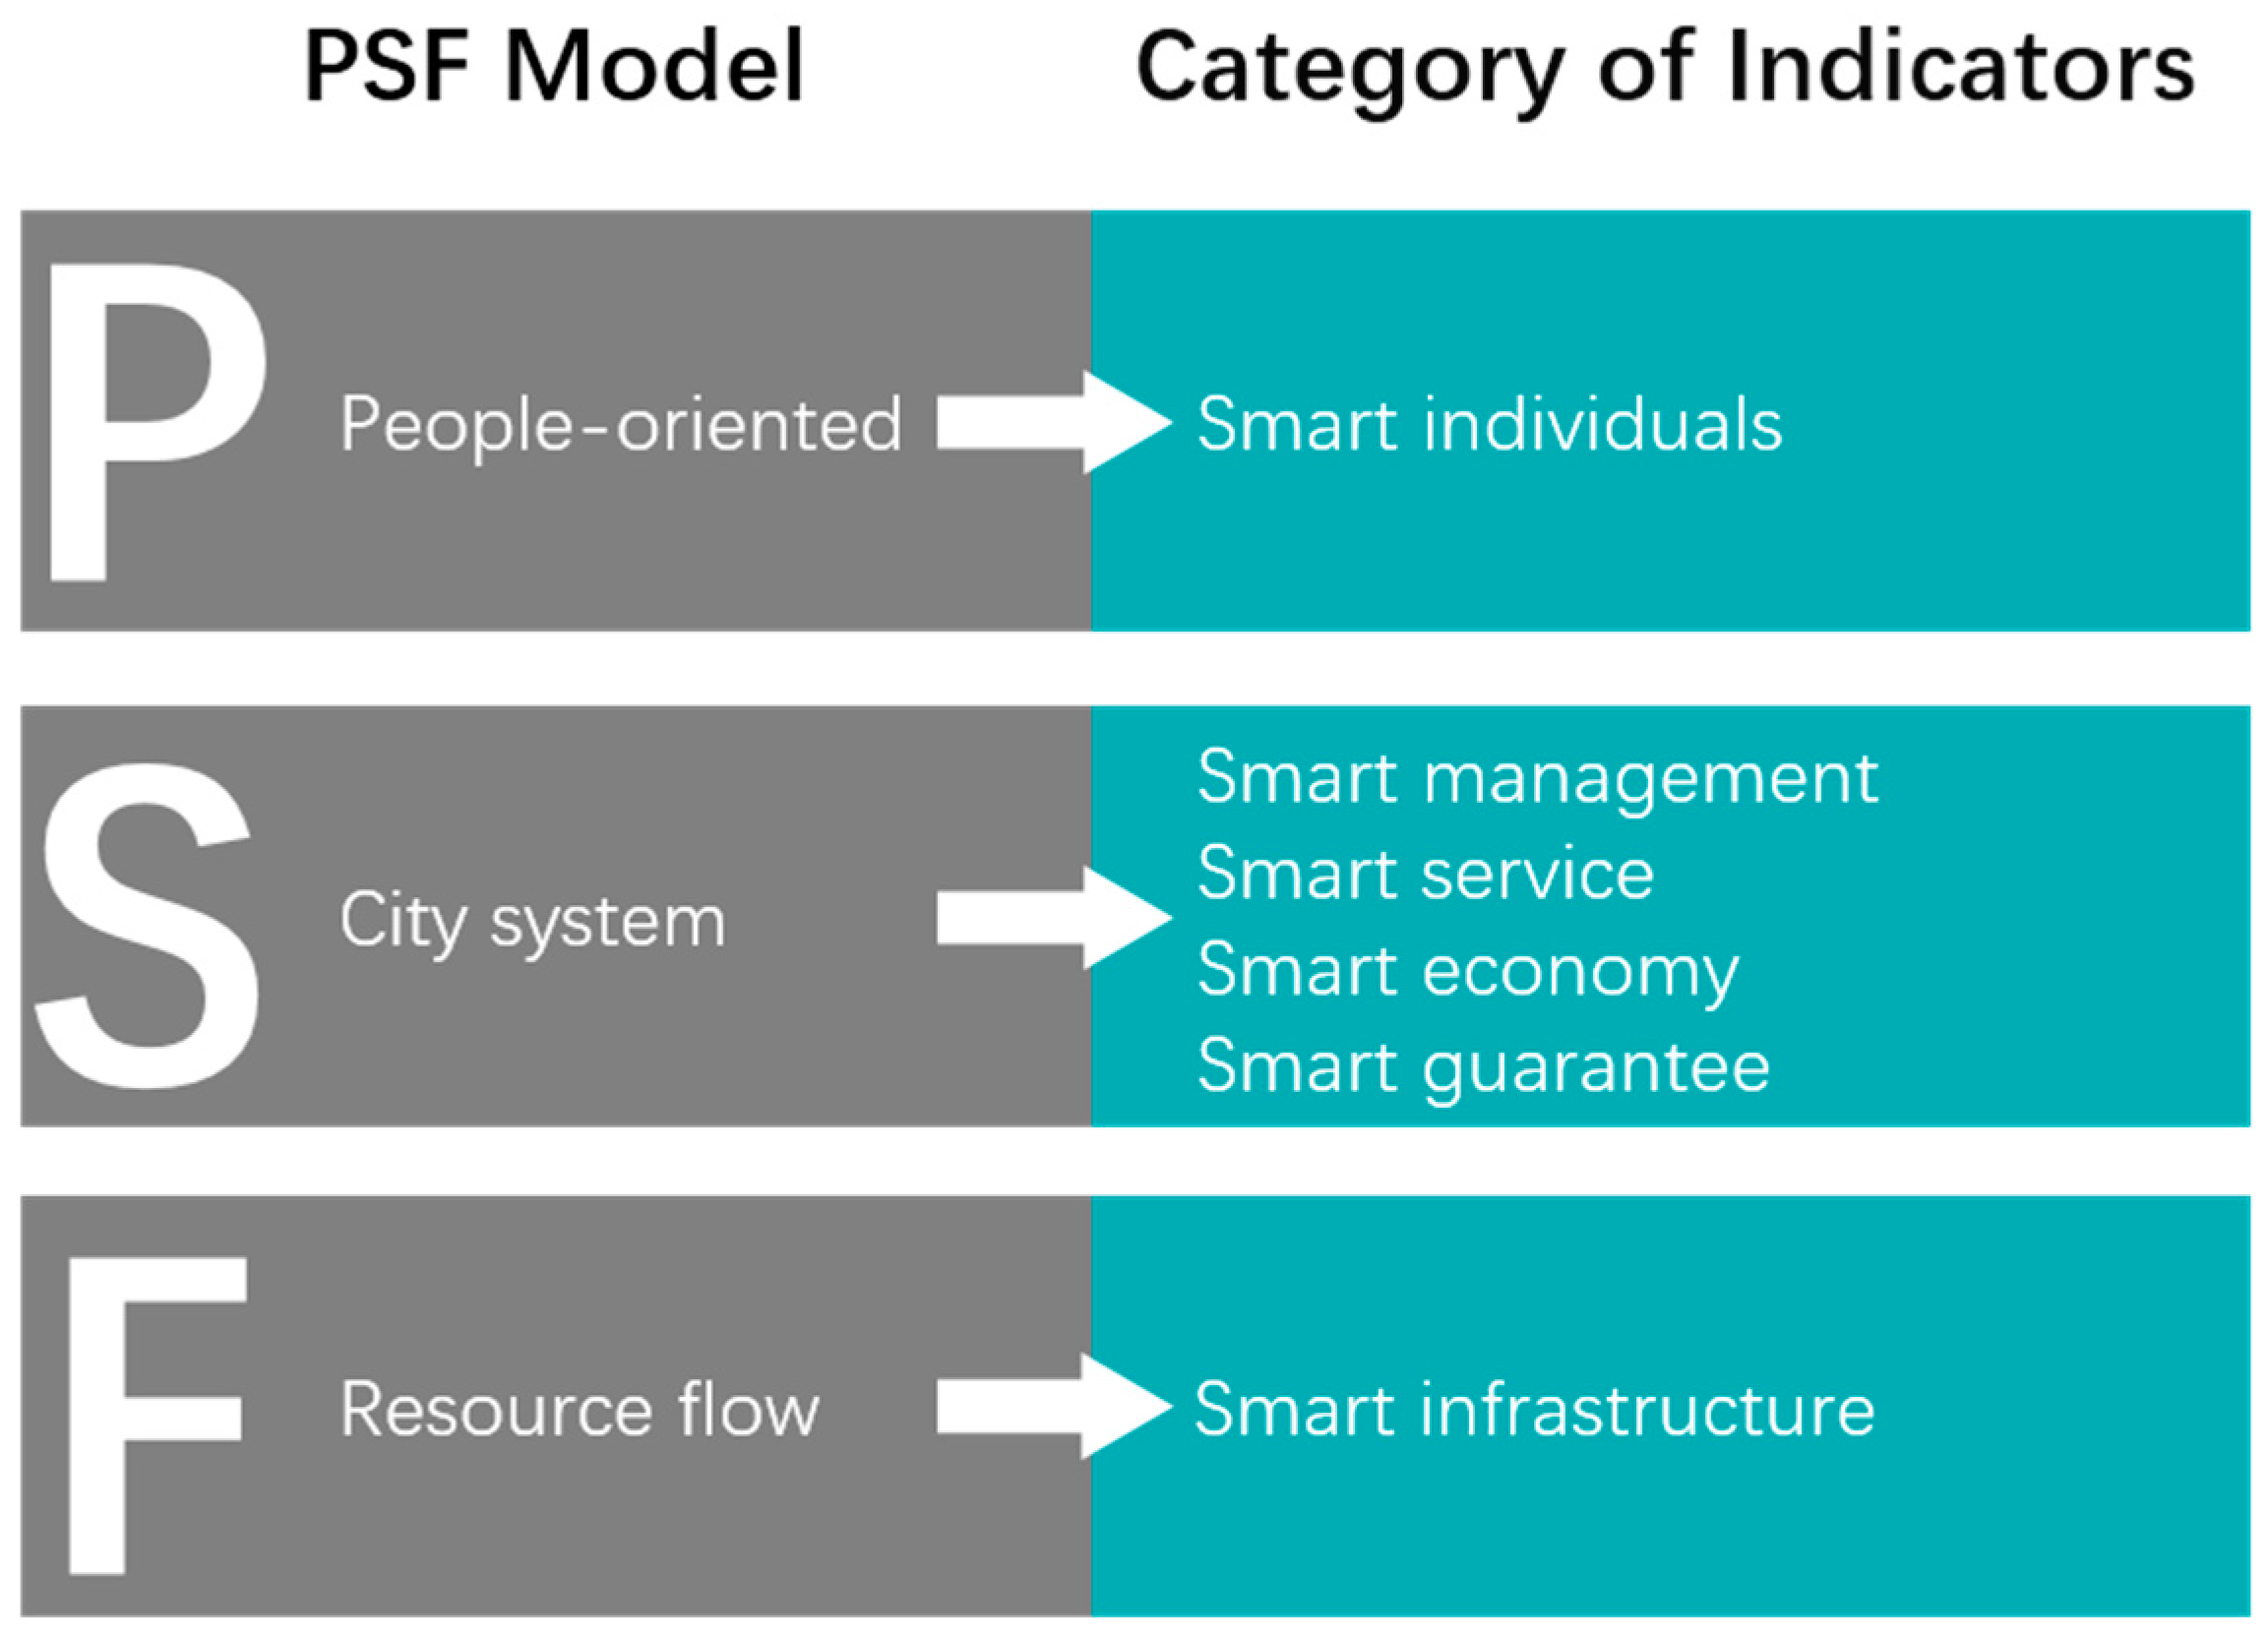
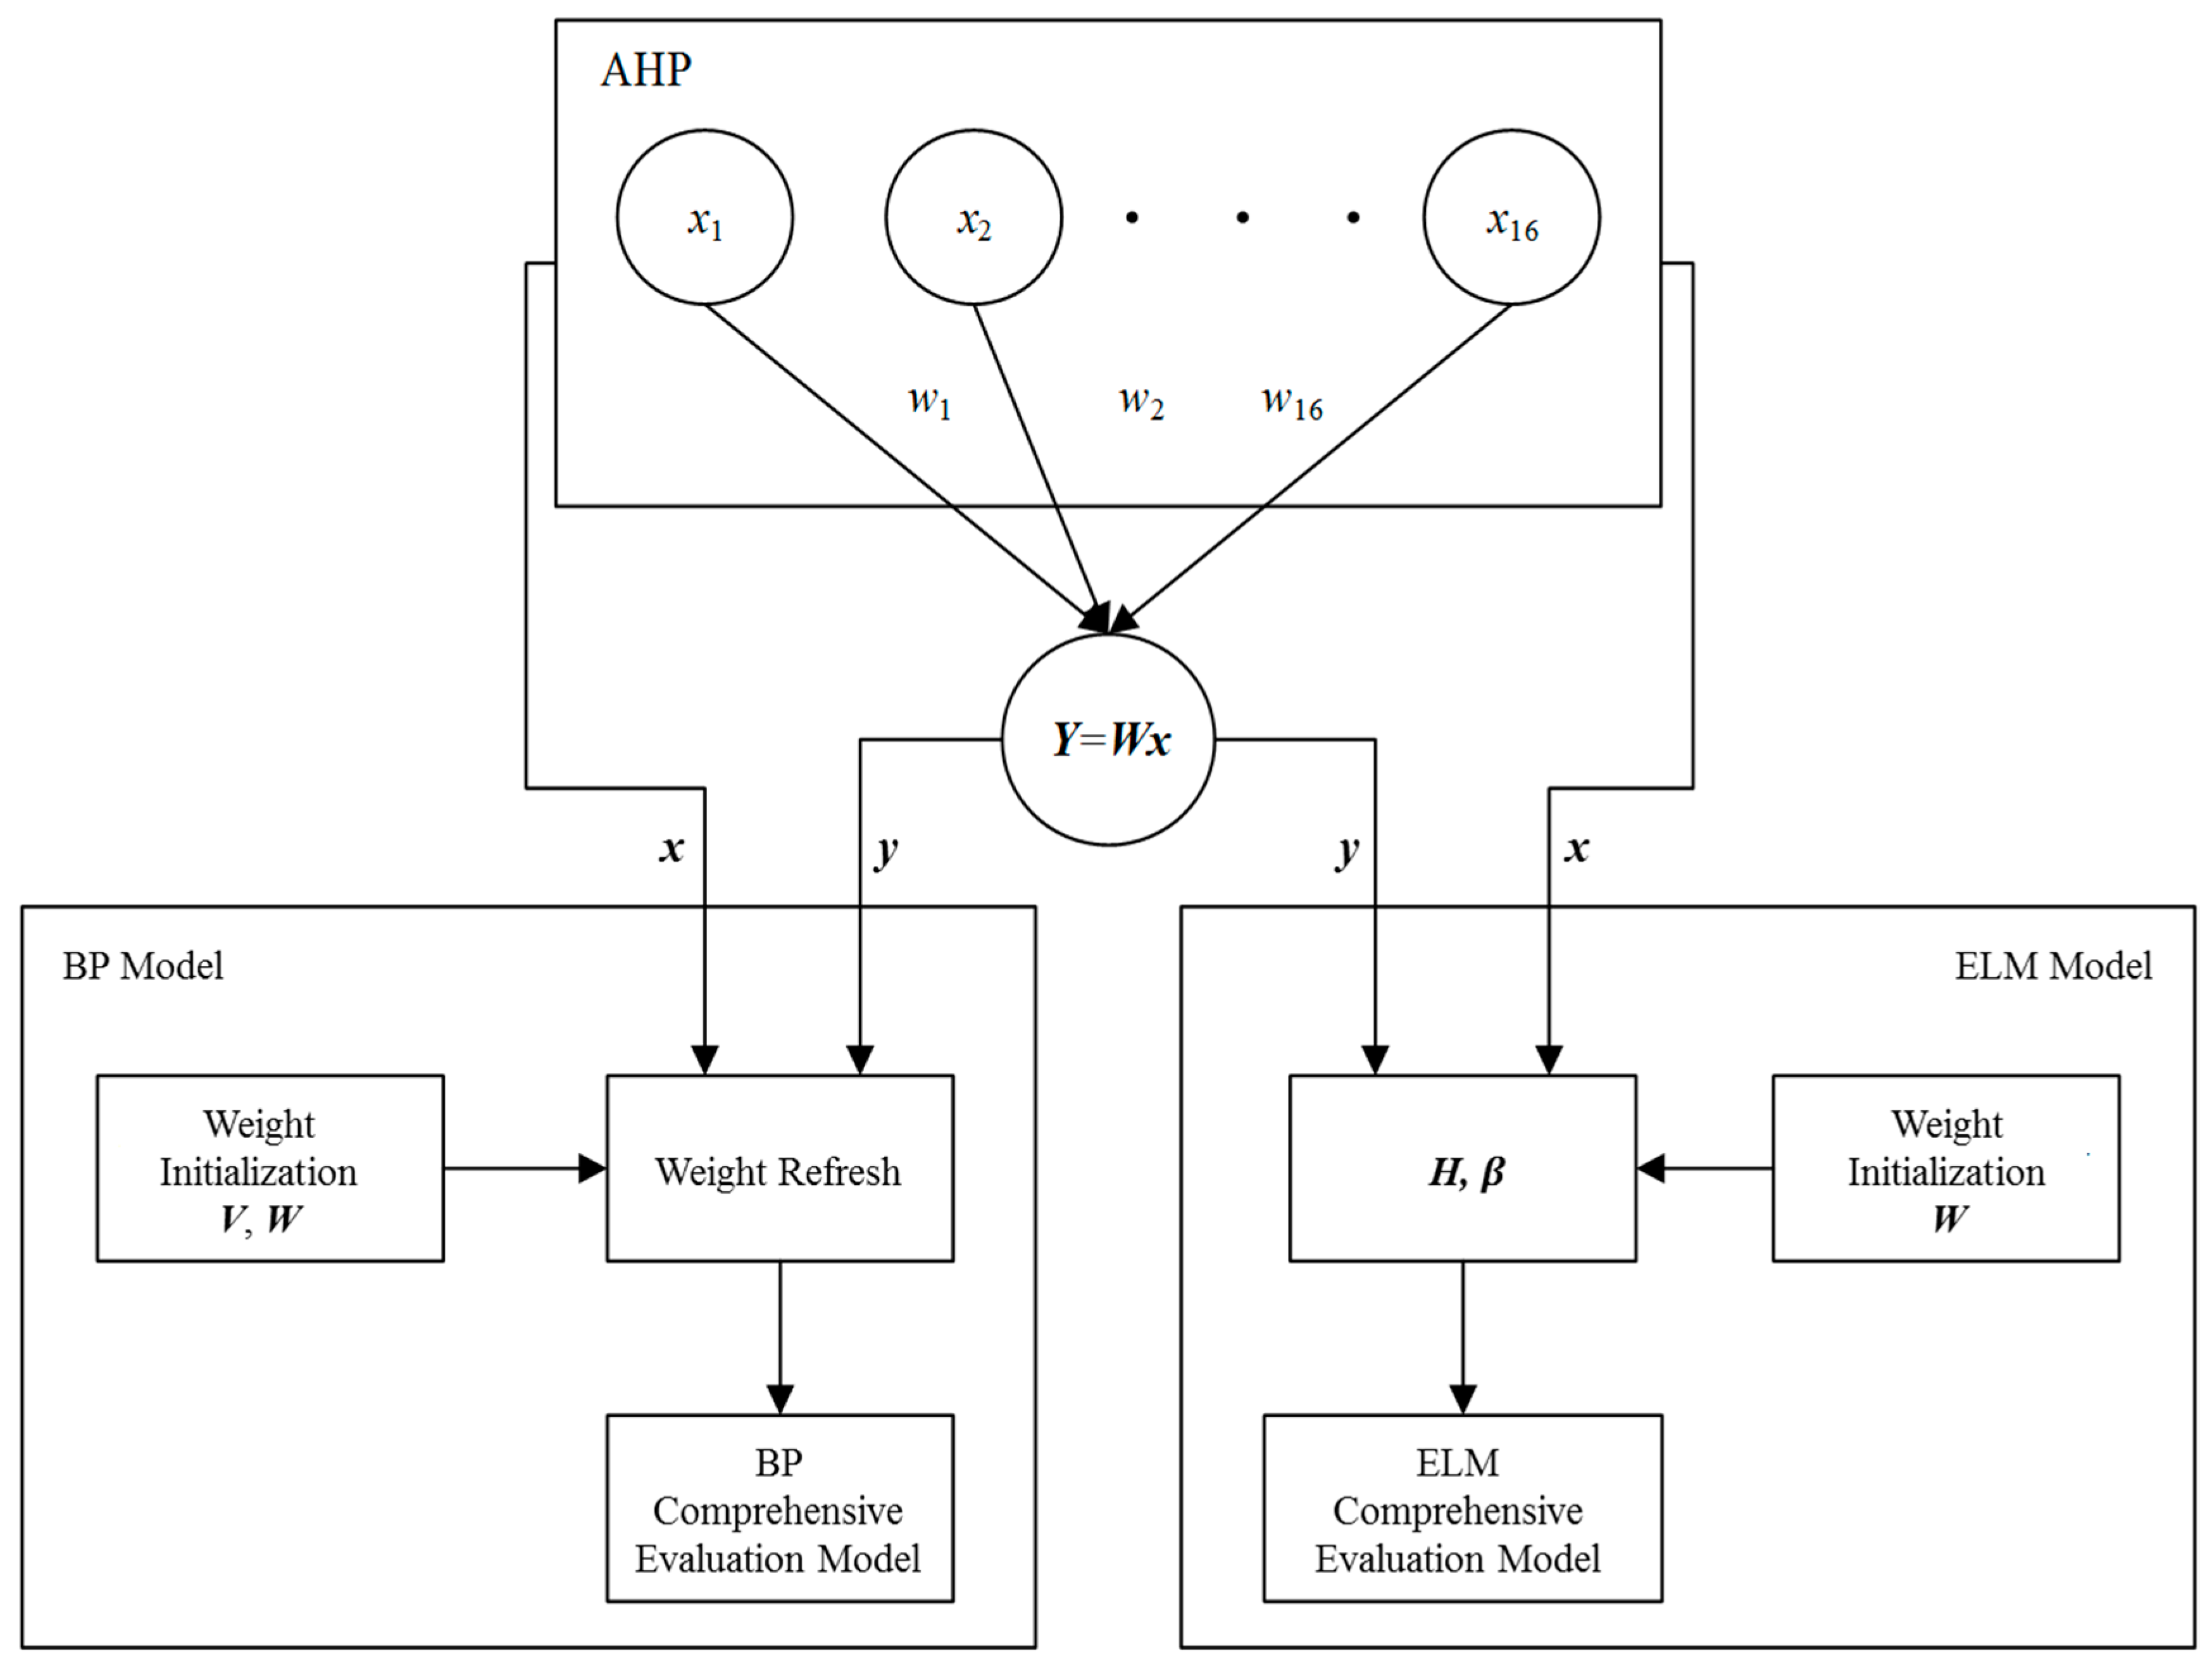
In order to solve the problems of supply shortage and the urban infrastructure demand, lack of information resources standardization, insufficient network information security, lag of governance mode of urban government, and lack of technology in the industry driving effect, etc., our paper will summarize the origin and connotation of the smart cities, the urban systems theory, and the people-oriented, city-system, and resources-flow (PSF) evaluation theory. Combining the development characteristics of China’s smart cities, the comprehensive evaluation index system for urban intelligent development is established. Based on the analytic hierarchy process (AHP) and Back Propagation (BP) neural network theory, an evaluation model of the intelligent development of 151 cities in China is evaluated. Finally, we compared the model precision and time cost. This will help to find the bottleneck in smart cities’ construction and provide an effective basis for scientific measures of the development of urban wisdom.
Literature Review
With the development of the smart city concept, research on the connotation and development of the smart city is increasing significantly. The two groundbreaking theories of Graham and Pomeroy, S. M. [
9,
10] in the 1990s laid the foundation for smart city theory. Previous studies have generally considered urban infrastructure construction as the most important factor. In addition to building, transportation, and other physical facilities, information technology has also dominated the fundamental functions of the city. The research explained how information communication technology influences the development of cities. The introduction of information technology to the evaluation of smart cities is an inevitable requirement of technological development. It is also an important turning point in urban evaluation.
Since then, Allwinkle [
11] made a comparative study of Graham and Mitchell. The IBM [
3], Forrester Research, Natural Resources Defense Council (NRDC), and the European Intelligence Council, from a different perspective, have given the definition of a smart city [
5]. These definitions are highly consistent, that is, smart cities rely on social, public, information, and commercial infrastructure of the city to promote the construction of smart cities through the circulation of resources [
12].
Evaluation of the city can support investors as an important guide for the cities to judge their strengths and to define their strategies for future development. Scholars take a different approach to intelligent city assessment. Giffinger R. [
13] summarizes the evaluation system as the economy, people, governance, mobility, environment, and living. However, for different cities, there is a need to combine their own characteristics and the analysis of regional diversity [
6]. Since then, Etzkowitz H. [
14] has comprehensively considered the triple helix of University-Industry-Government. In this way, the intent of urban evaluation is not just to apply the index system, but to find the relationship among social groups. Deakin M. proposed the theory and method to evaluate the correlation of wisdom urban. He chose the triple helix theory to construct the dynamic space of a regional innovation system [
15,
16,
17,
18]. On that basis, he reflected on the governance of smart cities, and went on to explain smart cities in terms of the social networks, cultural attributes, and environmental capacities [
19,
20,
21]. Lombardi P. also used the Analytic Network Process (ANP) method to evaluate European cities based on the theory of triple helix. Moreover, he integrated social relations into the evaluation system, and presented an advanced triple helix network model [
22,
23].
Countries around the world have put forward the related methods of urban construction evaluation. In the 1950s, the United States and Japan began to study a city informatization level evaluation system [
24]. The model of Machlup, Borat, the information index, and Information Utilization Potential is a typical method to evaluate urban informatization [
25]. Influenced by the development of information technology and Internet of things, IBM first proposed the concept of an Intelligent earth, and cisco put forward the concept of Global Intelligent. There are many international universities that are also involved in the intelligence development study of the index system, such as the University of California, Vienna University of Technology, and the University of Ljubljana, etc. [
26]. The global information technology report, jointly released by the World Economic Forum (WEF) [
27] and INSEAD [
28], introduces the network readiness index (NRI) [
29], which provides a basic methodology that has become the most authoritative benchmark preparation tool in information technology reports. In response to the impact of ICT technology, Japan has formulated the u-japan strategy [
30] and compared the information of the world’s major countries based on the international assessment of ICT infrastructure construction. In September 2001, the leading company in the field of electronic communications, Kang Sajige, established an evaluation index system that basically covered all levels of smart cities.
In addition, there are many related researches on intelligent city evaluation models and system constructions. Richard Florida [
31] and Komninos N. [
32] evaluated smart cities from three perspectives. The first is the wisdom of the working population city level, innovation ability, and creativity; The second is associated with the collective wisdom of urban residents, the collective wisdom by differentiation, forming a more creative collaboration competition mechanism; The third is the review of the artificial intelligence embedded city: communication technology infrastructure, digital information space, and provide citizens with online services, etc.
4. Results
We looked up the China Statistical Yearbook in 2015 and the public information of China’s provincial statistics bureau [
37]. The open data provided by the Tongheng smart city institute [
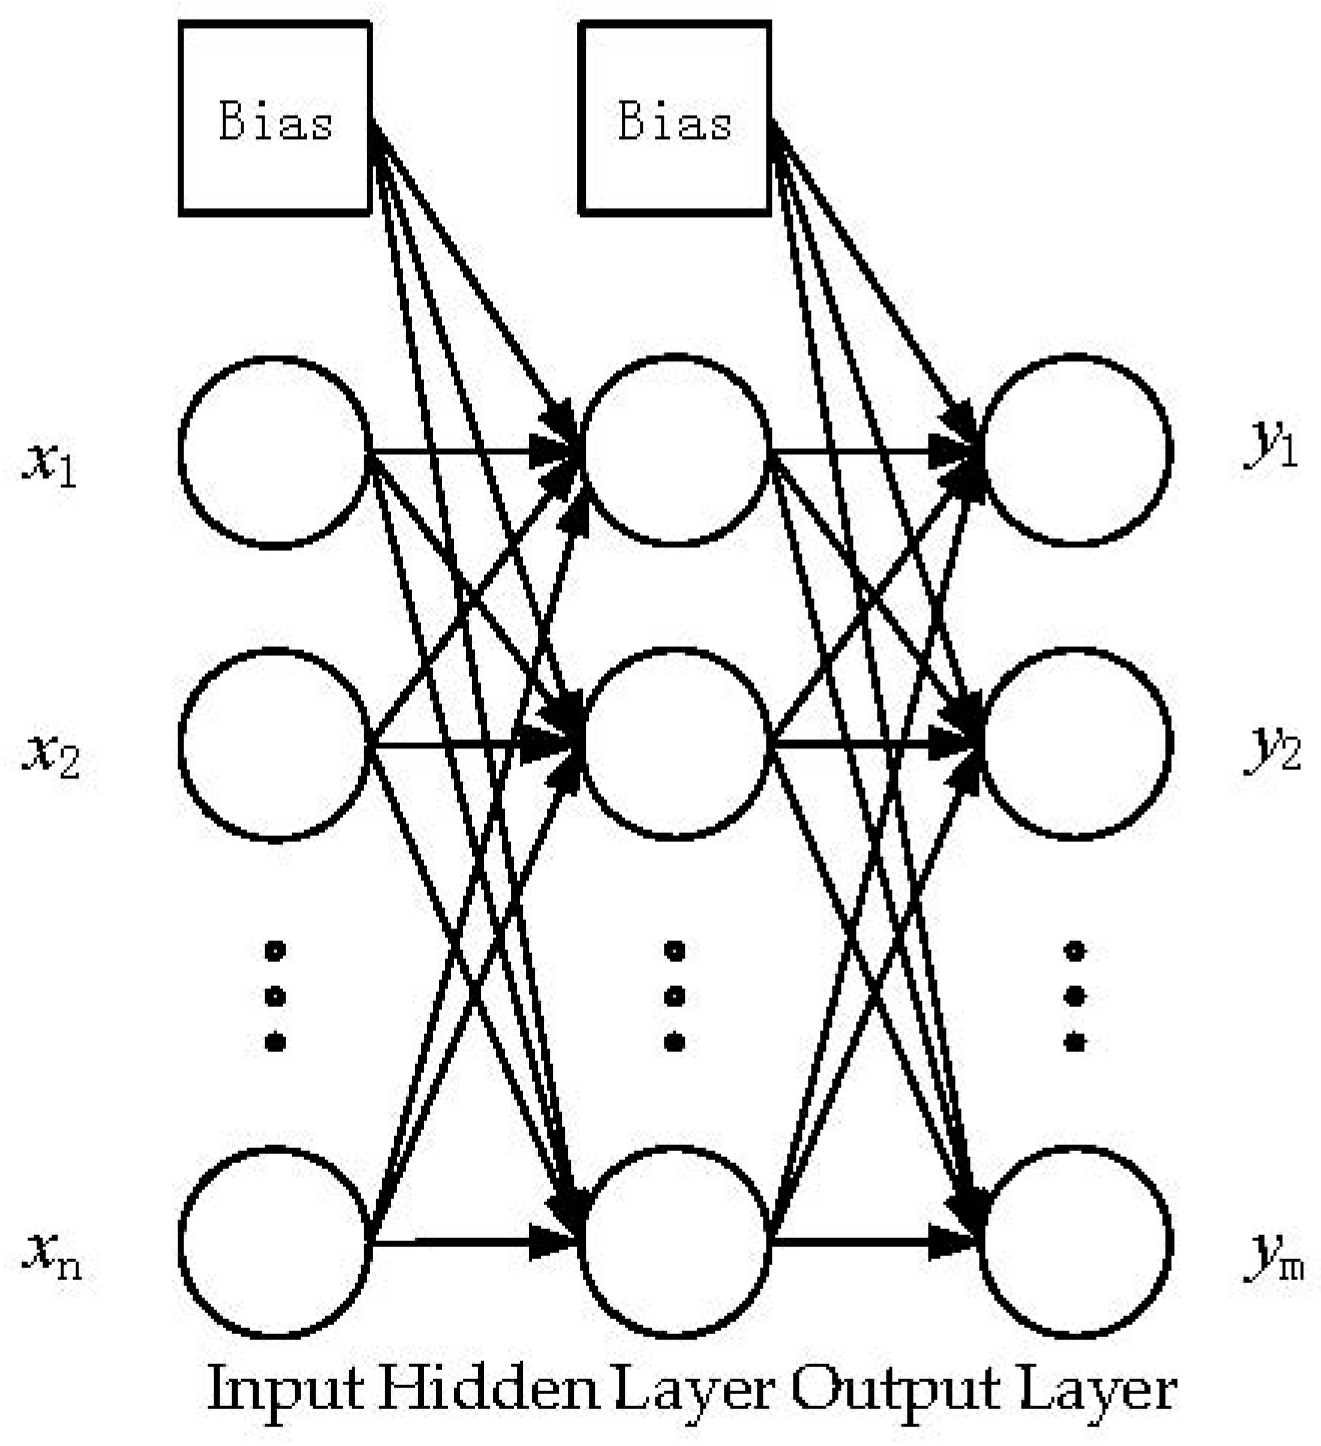
38], Tsinghua university, is also one of the data sources of our paper. Since the time of the statistics is not synchronized, it is critical to ensure the reliability and integrity of the data, and given the sluggish nature of the intelligent cities to respond to national policies, we use the data from 2015 to analyze it. Here, we take 151 cities with different economic scales in China as the research objects, and collect the comprehensive evaluation index data of urban intelligent development. The sample set involves 151 records, with 16 inputs (i.e., 16 secondary indicators), which we classify as training sets and test sets. Among them, the training set contains 100 training samples, and the test set contains 51 test samples. In the process of model training, the training samples are required to be typical, uniform, and diverse, and we selected data from 20 cities as a training sample; the remaining 80 training samples are selected from the sample to be selected randomly from the sample. The 20 cities include those such as Beijing, Shanghai, and Hangzhou, which also include Ningbo and Wuxi, which exhibit relatively stable economic development. They also include Liupanshui, Yulin, and Anhua, and other less developed cities.
After normalization of the data, we calculated the weight coefficients of each index.
For AHP, the judgment matrix can be obtained by the expert survey method.
For BP, the activation function is set to the Sigmoid function; The allowable error value (goal) is set to 1.00 × 10⁻⁶; The maximum iteration number (epoch) is set to 200; the momentum factor is set to 0.95; and the learning rate is set to 0.7.
For ELM, the activation function is also set to the Sigmoid function. In BP and ELM, the mean square error (MSE) of the test samples is used to measure the accuracy of the model.
For BP and ELM, the number of neurons in hidden layer nodes is obtained by the trial and error method. The BP model test error changes with the number of neuron nodes, as shown in
Table 3.
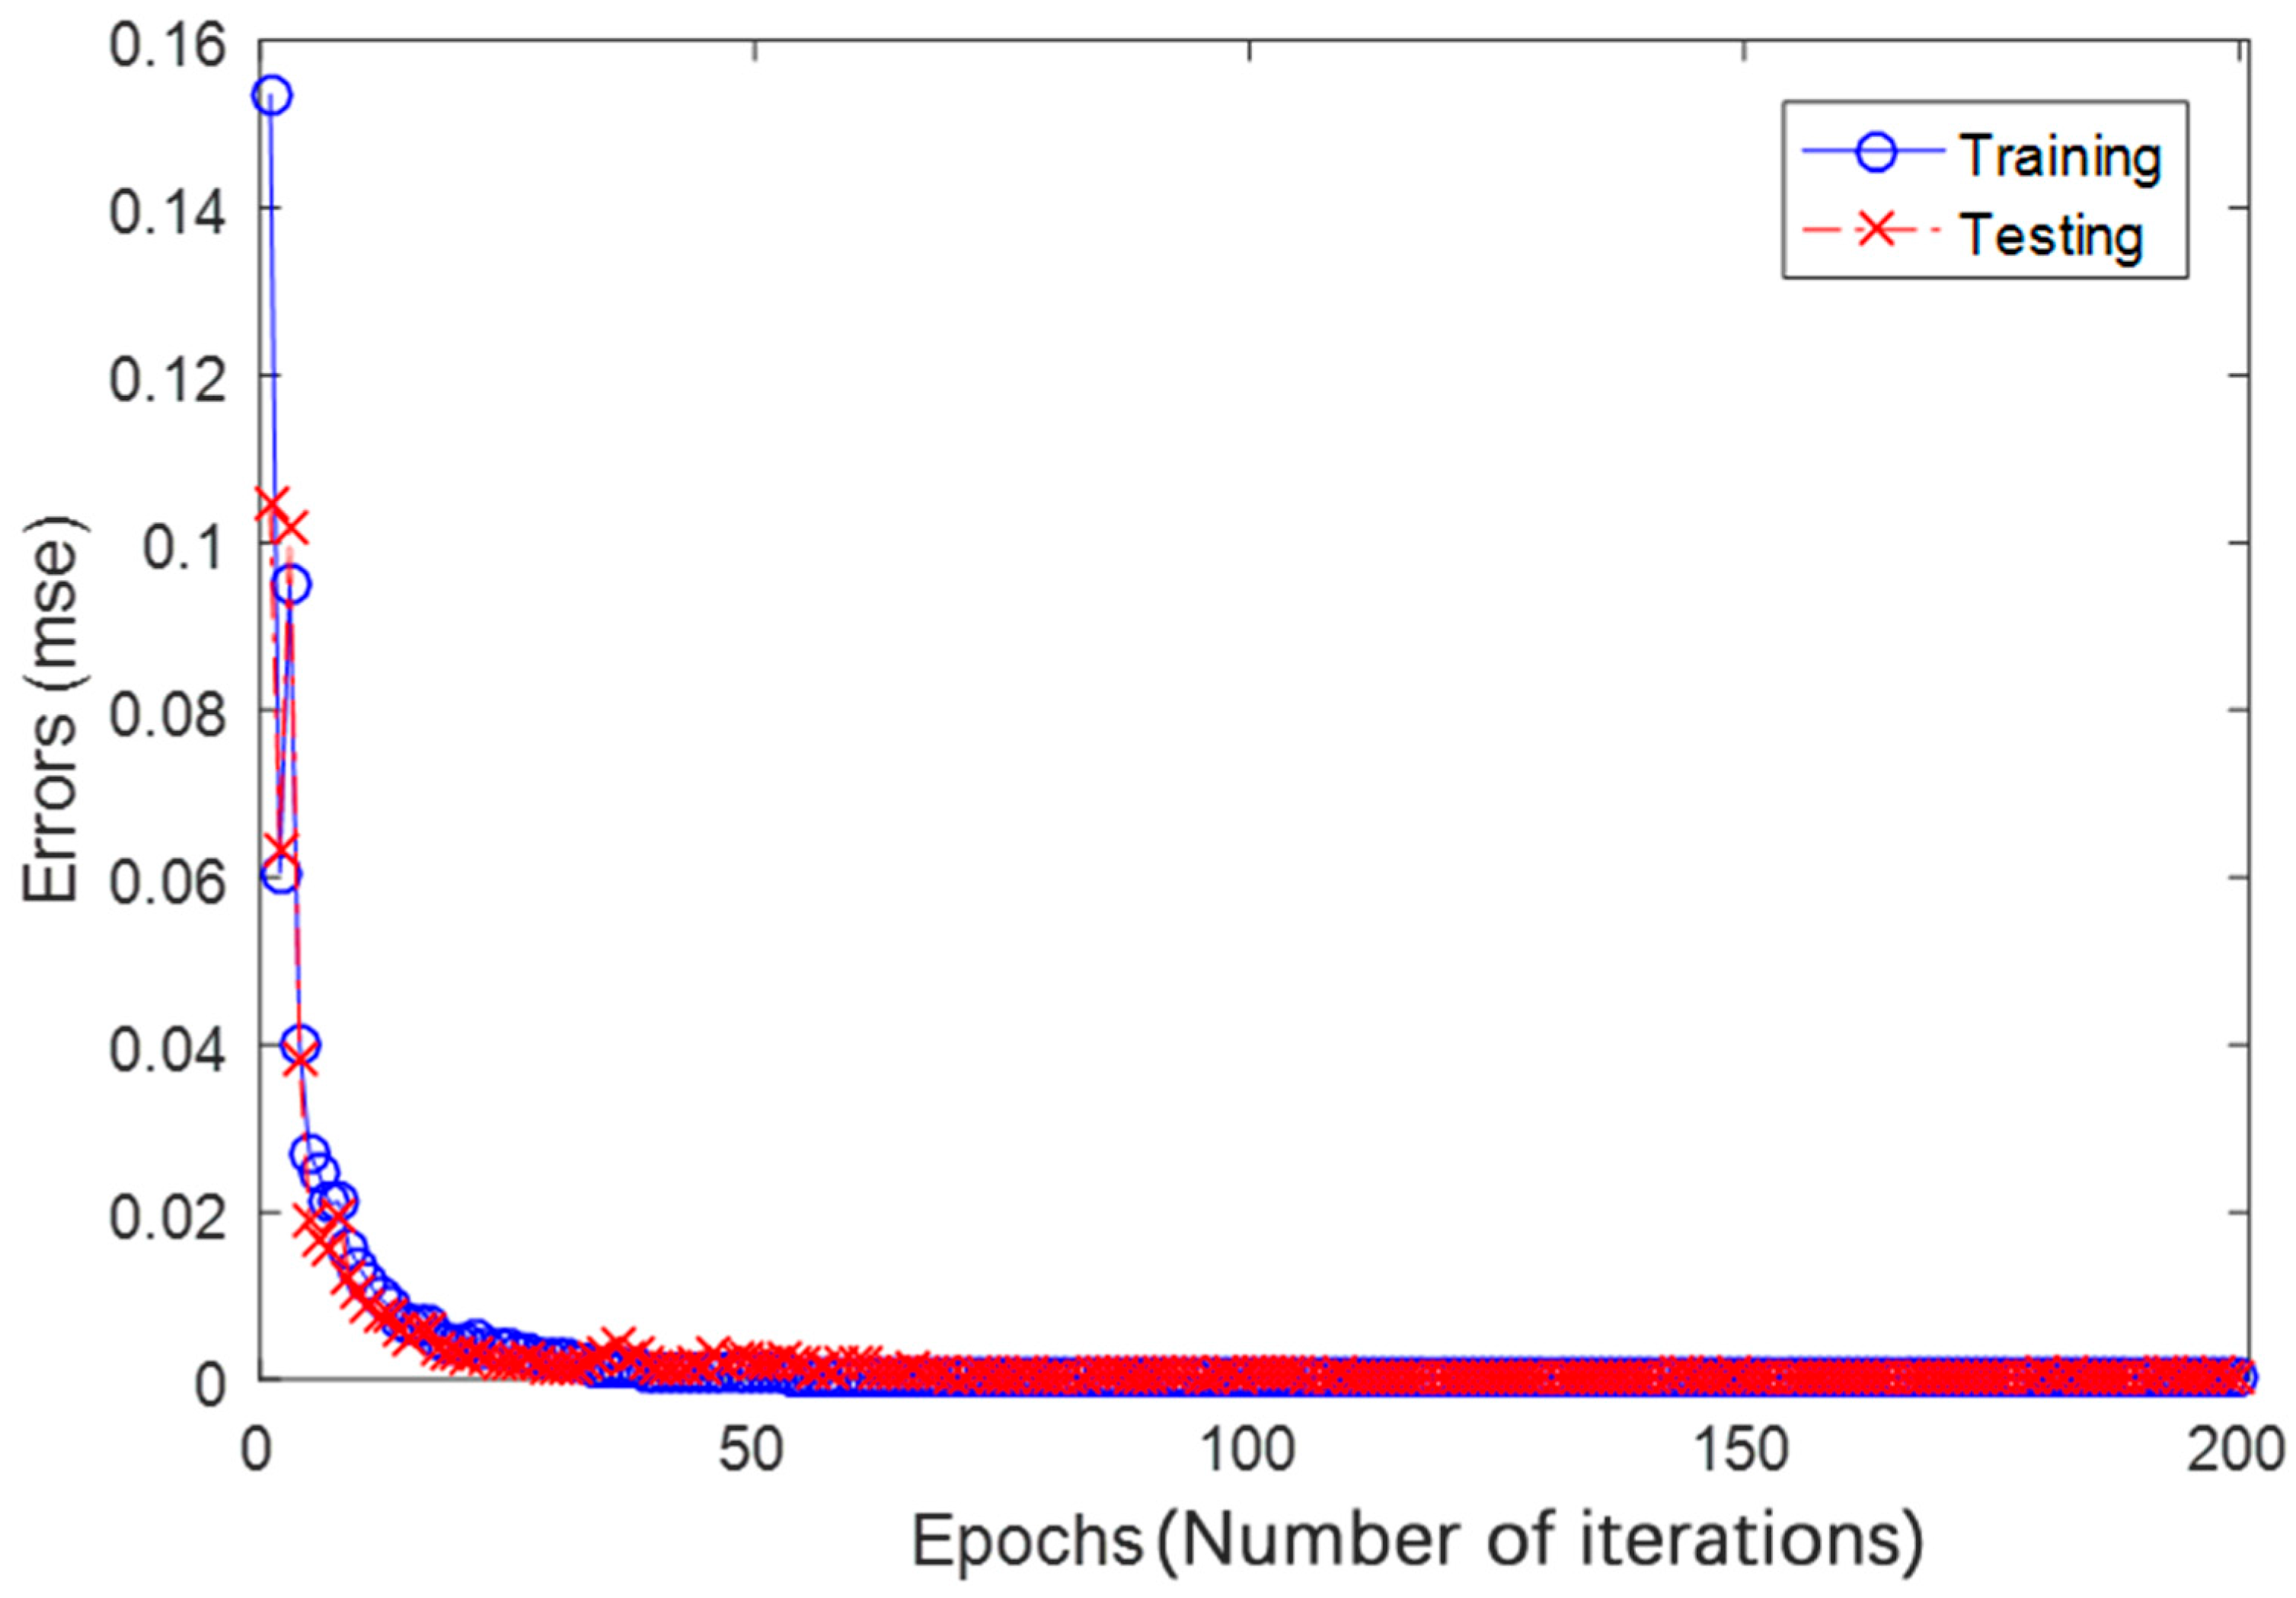
In the BP model, the number of neuron nodes in the hidden layer is set to 14. In this parameter setting, the training error and the test error are shown in
Figure 4. The ELM model test error changes with the number of neuron nodes, as shown in
Table 4.
It can be seen that in the ELM model, the number of neuron nodes in the hidden layer is set to 20.
Some results of the comprehensive evaluation index of urban intelligent development using AHP, AHP-BP, and AHP-ELM are shown in
Table 5, and the results of these three models correspond to
,
, and
, respectively.
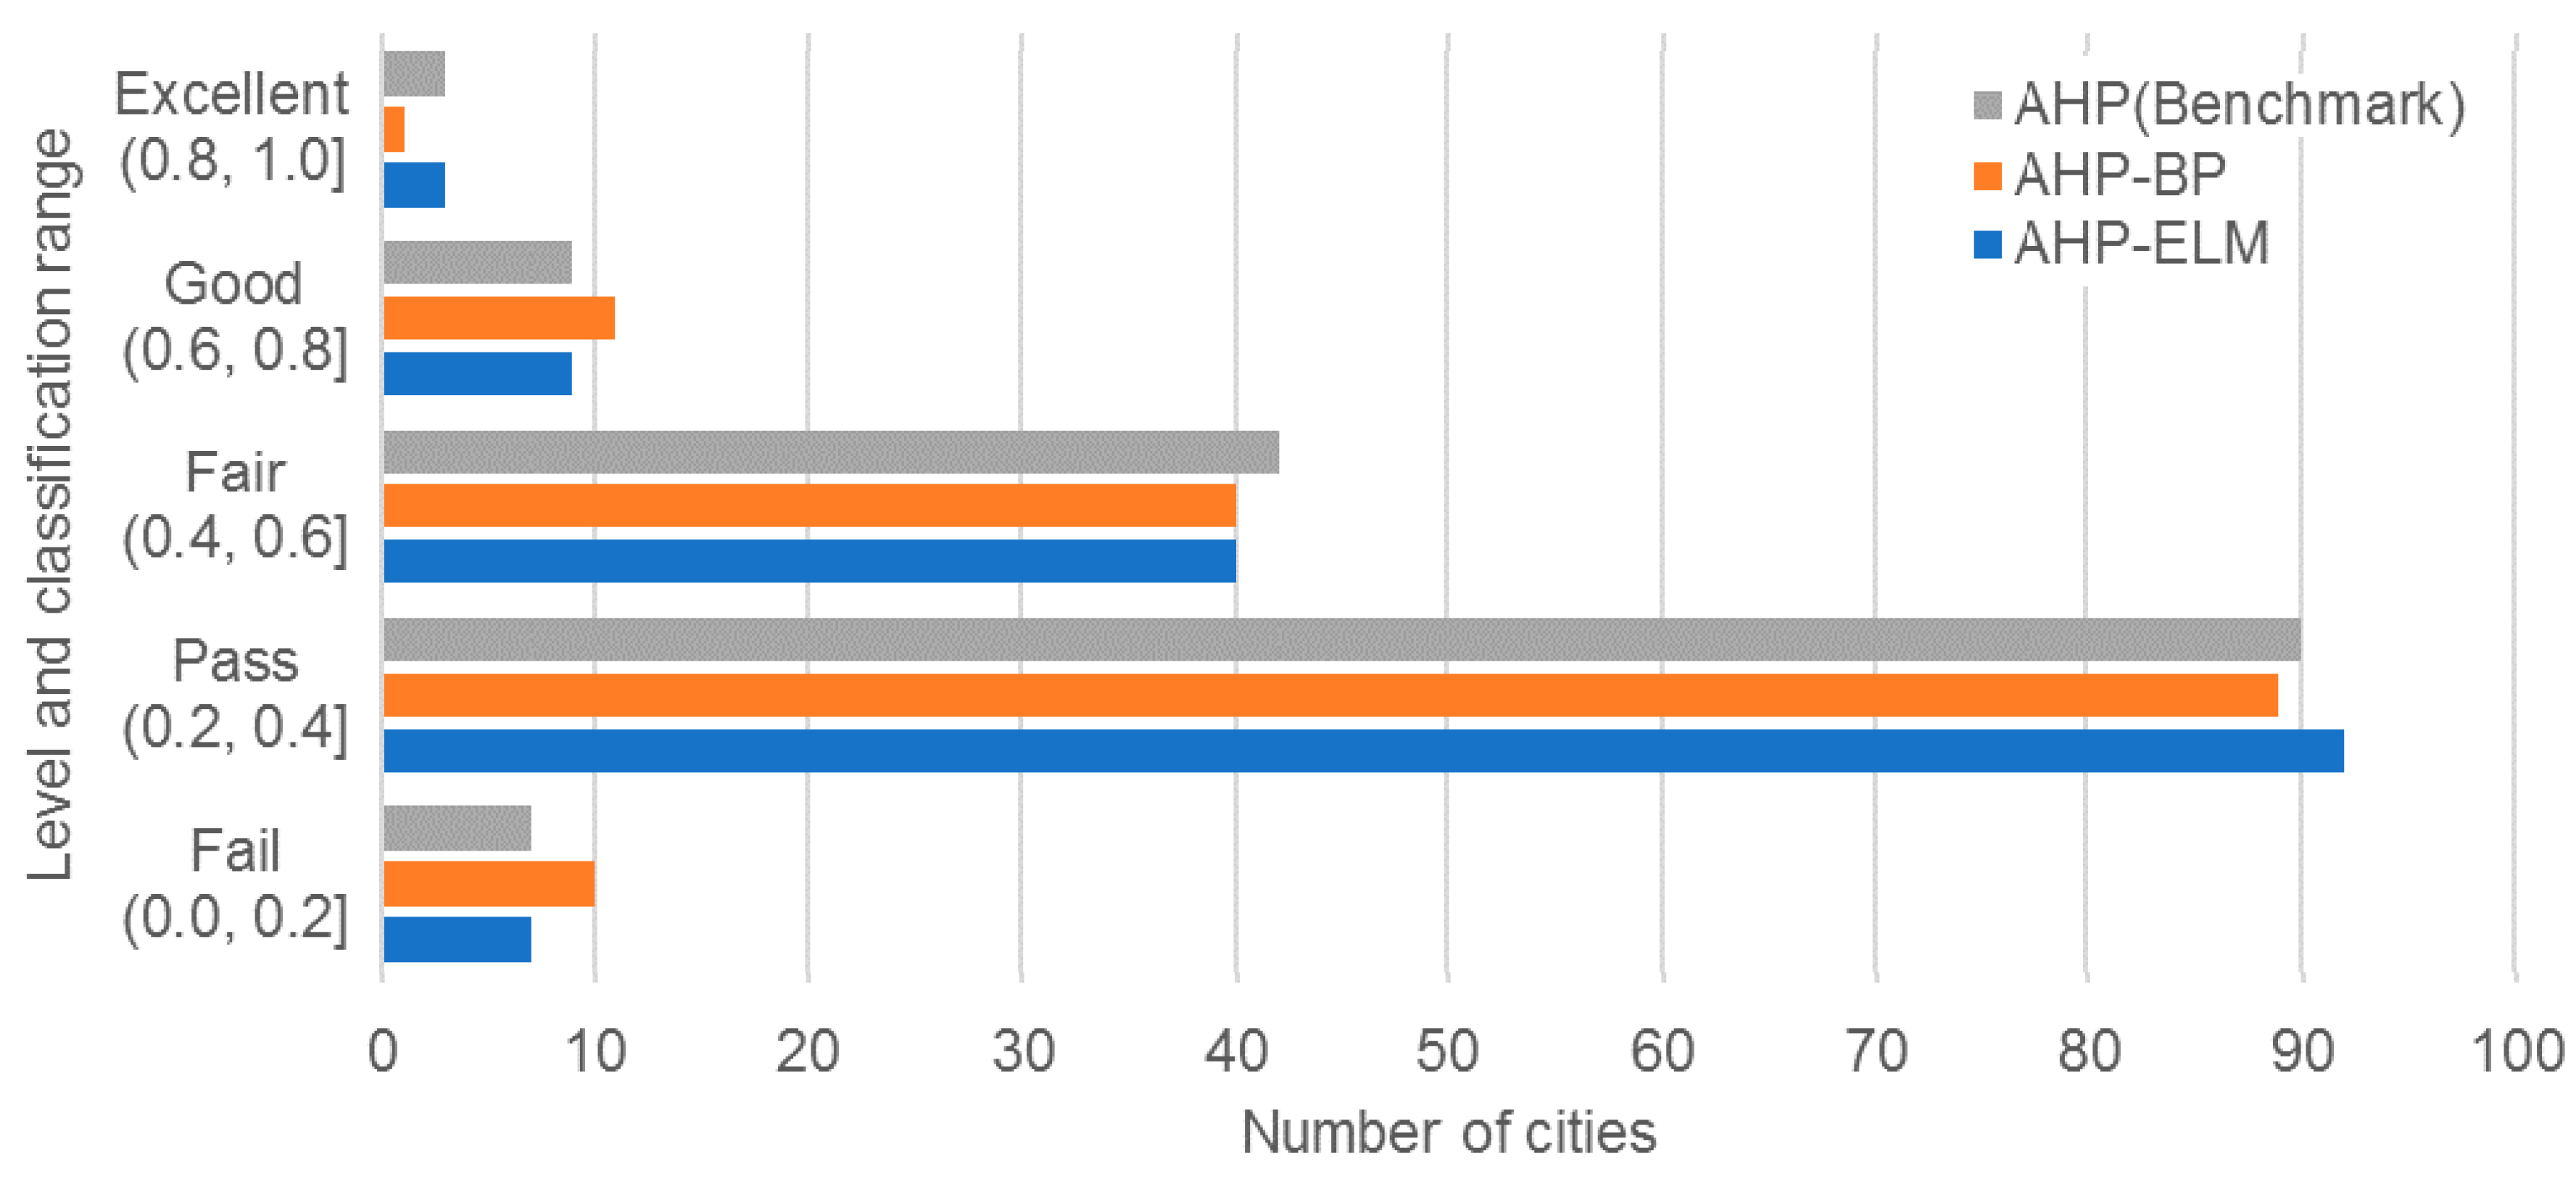
In order to make a better assessment of the level of urban intelligence, we have five evaluation criteria for the results of the sample values, which are “Excellent”, “Good”, “Fair”, “Pass”, and “Fail”. According to the above classification criteria, the classification results of the comprehensive evaluation model of intelligent development in three different cities are shown in
Table 5.
Figure 5 shows the distribution of the evaluation results obtained by using three methods.
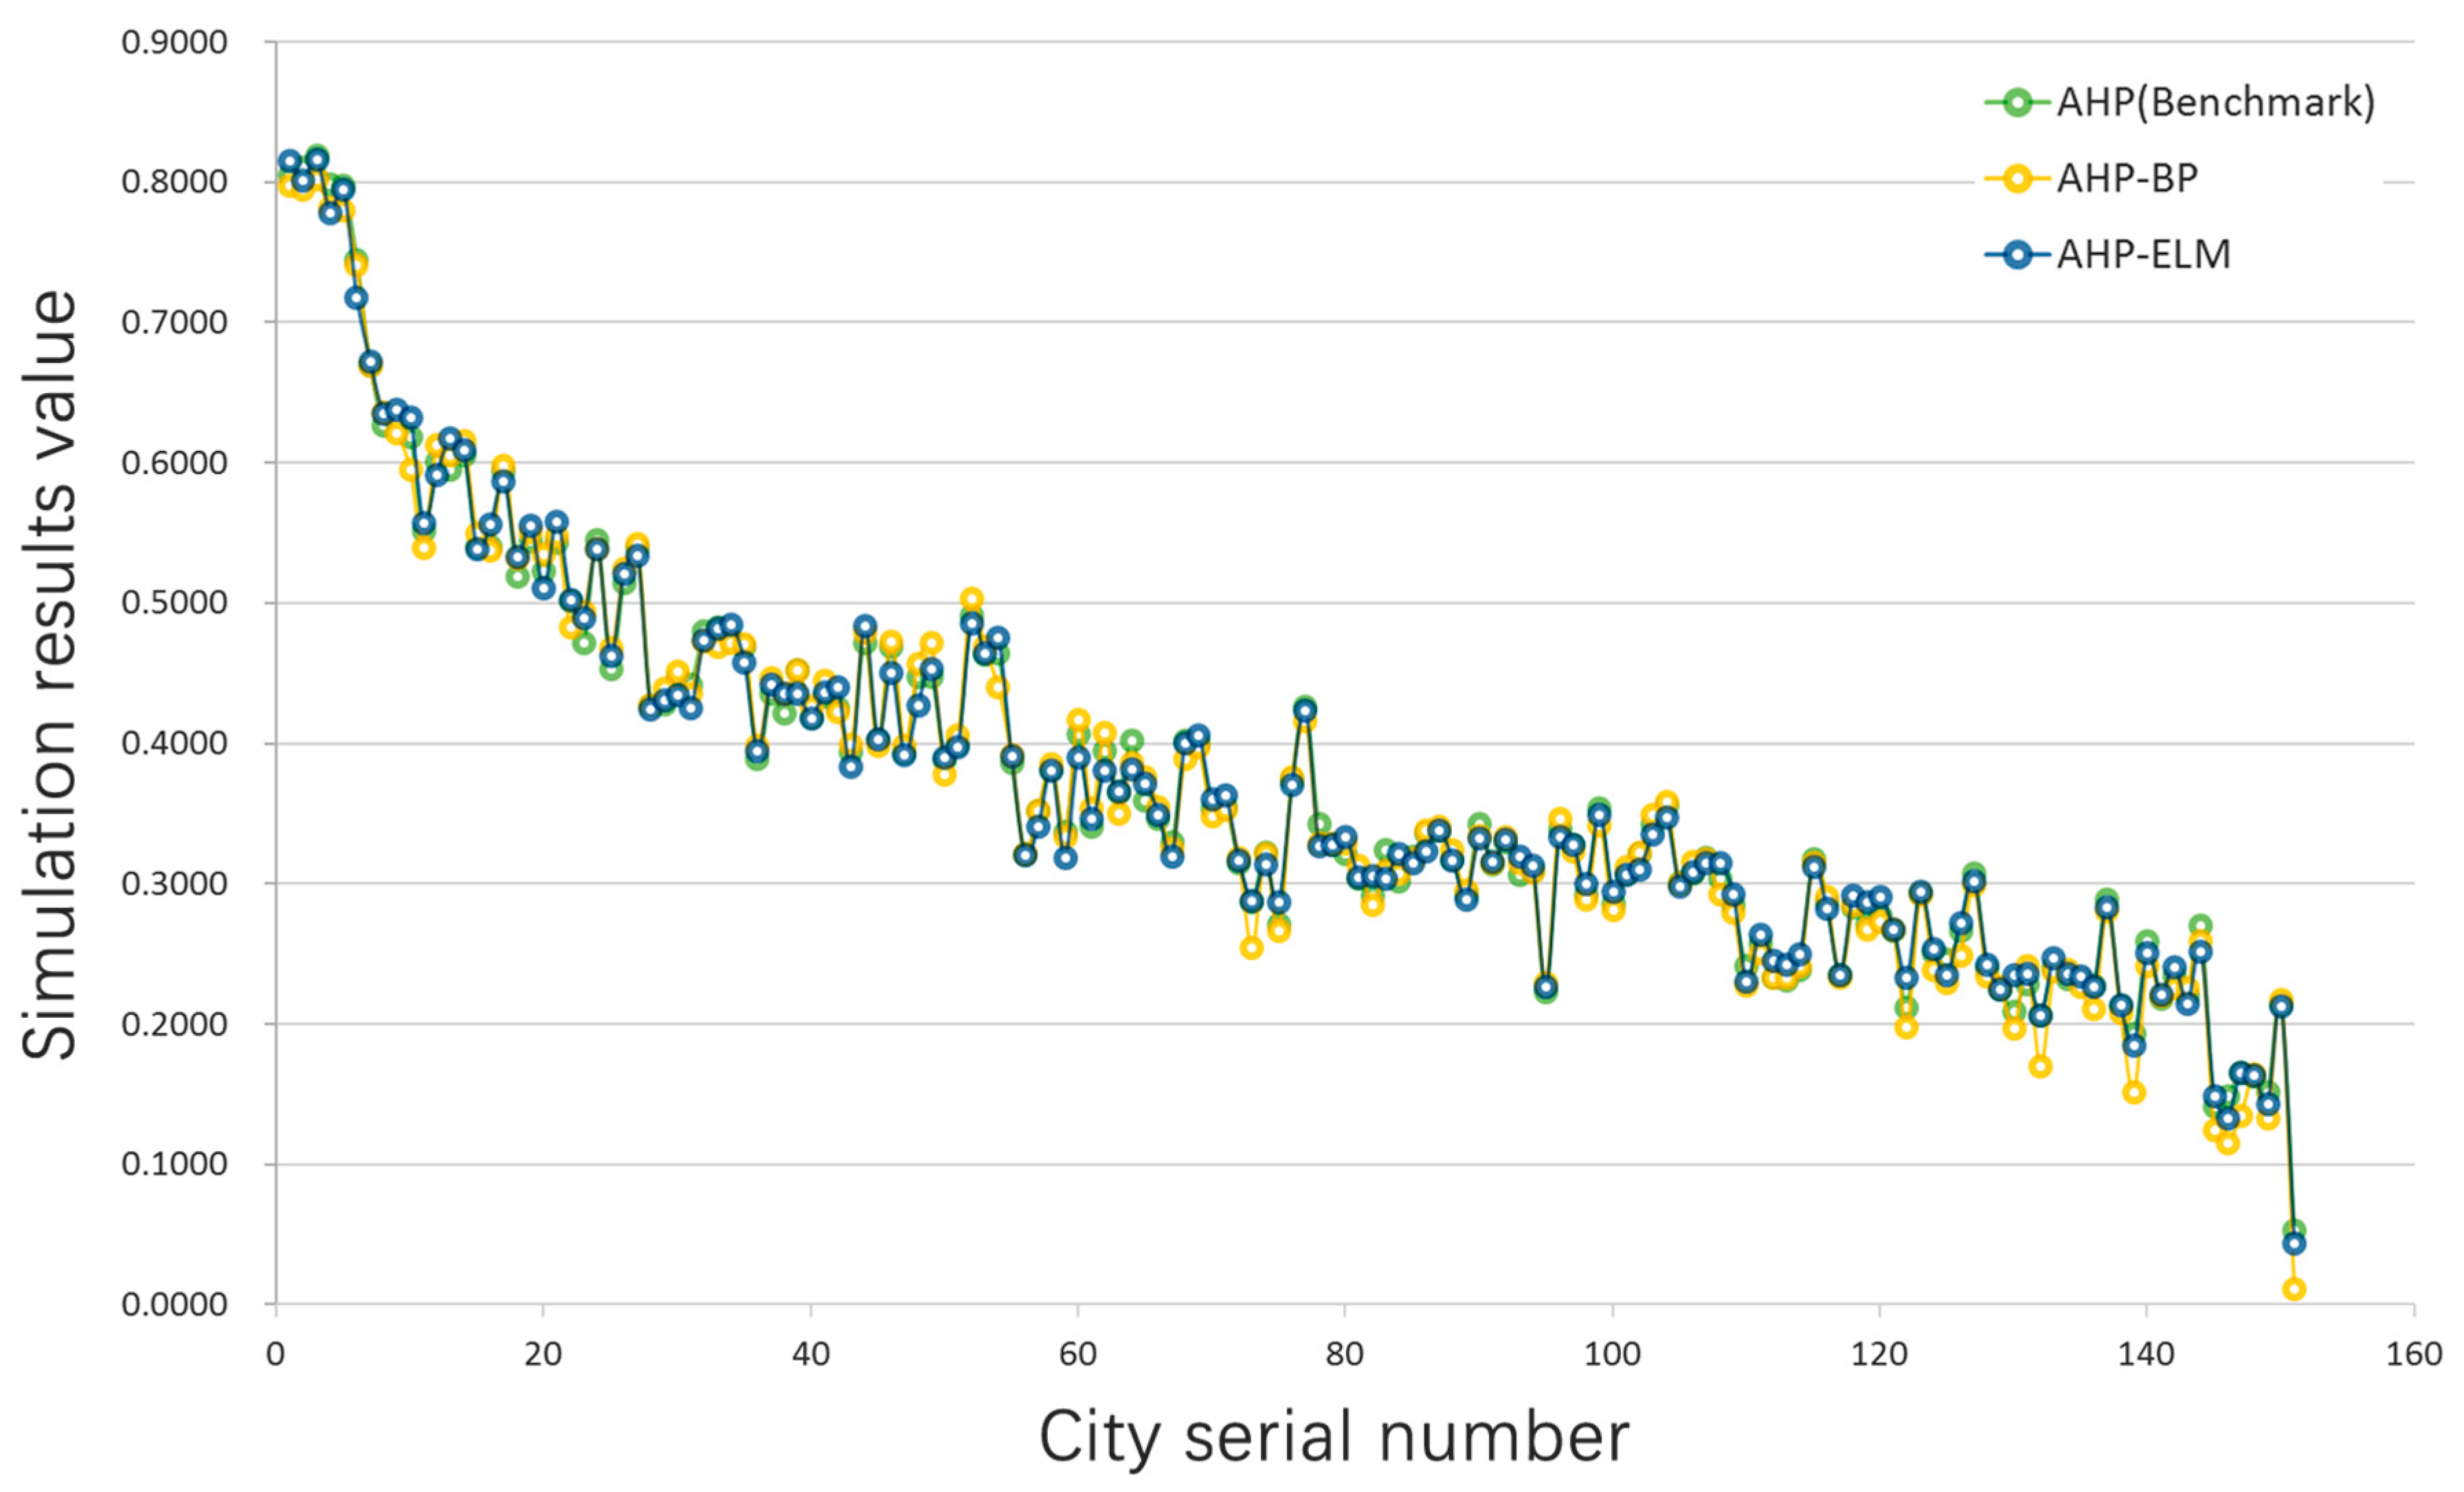
AHP, AHP-BP, and AHP-ELM city wisdom of the development comprehensive evaluation index of the classification result is generally consistent, conforming to the law of development of the smart city. The comparison of the comprehensive evaluation index of urban intelligent development based on these three models is shown in
Figure 6.
In the cities of Hangzhou, Ningbo, Qingdao, and Nanjing, there is a high energy efficiency, geographical environment, economic development, intelligent industry, and urban wisdom in the upper part of the country. In the AHP model, Hangzhou, Ningbo, Shenzhen, Zhuhai, Foshan, Xiamen, Guangzhou, Qingdao, and Nanjing are rated as “good”, and the AHP-BP model and the AHP-ELM model are consistent with the AHP model.
Cities such as Luzhou, Qinzhou, and Haidong are restricted by geographical environment, low economic development level, imbalance of urban industrial structure, high brain drain rate, low urban innovation vitality, and corresponding smart city infrastructure construction level backward. These cities’ intellectual development degree is in the lower reaches of China. In the AHP, AHP-BP, and AHP-ELM model, all seven cities were rated as “Fail”, and the results of these three were consistent.
In fact, Beijing and Shanghai are the first of the nation’s smart cities. On the one hand, they have a huge economic scale and a high concentration of resources, but on the other hand, with good infrastructure to build, and better management and services, these cities’ intellectual development is at the forefront of China. In the results of the AHP and AHP-ELM model, Beijing, Shanghai, and Wuxi are classified as “excellent” grades, which are consistent with the reality. However, in the results of the AHP-BP model, Wuxi and Shanghai were divided into “good” grades, which did not tally with their actual development conditions.
From the above analysis, compared with the AHP-BP model, the AHP-ELM model is more accurate for the comprehensive evaluation of urban acumen. As can be seen from
Table 3 and
Table 4, the test error of AHP-BP is 2.00 × 10
−4 and of AHP-ELM is 8.05 × 10
−5. Obviously, the accuracy of the AHP-ELM model is better than the AHP-BP model. Besides,
Table 6 shows that the AHP-ELM model takes a very short time.
Considering the factors of model precision and calculation costs, we believe that the performance of the AHP-ELM model is far superior to that of the AHP-BP model. So, this hybrid evaluation model has improved and focused on the information about urban informationization, without using the information technology infrastructure as a critical point, and thinking about the hardware and other dimensions that smart cities need to develop. In addition, the application of the PSF model also improves the subjectivity of the evaluation index. Moreover, to a certain extent, it eases the wisdom city facing the broad indicators on the evaluation of the problem. In the sample of China’s cities, we discovered that the AHP-ELM model could be effective in breaking the bottleneck in intelligent city evaluation.


