1. Introduction
The intense economic growth and globalization happened in the world during the last decades has entailed large pressures on natural resources. Today, climate change has entered in the political and institutional international agenda, as one of the most daunting problems to be faced by humankind, being economic globalization an accelerator of this process. The impact of climate change in water availability has been widely documented in the literature [
1,
2,
3] and the intensification of water scarcity in many regions is a global concern, given the confluence of growing water demands for economic and social uses in a context of uncertain supplies [
4,
5]. This leads to an increasing competition among users, irregularities in the availability of water resources and lower quality of water flows.
In a context of globalized economies, resources, inputs, productions and final products are internationally interconnected, through global supply chains. As Yu et al. [
6] recognize, globally distributed production activities are key drivers of environmental change, posing stress on local ecosystems. This entails a growing separation between the producer and consumer responsibilities as a result of the large integration of supply chains at the global level [
7,
8,
9,
10], in addition to severe regional and local water pressures related to the final consumption of goods long distances away. Thus, highlighting the links between consumers’ behavior and environmental impacts through international trade is a necessary step towards more sustainable, responsible and probably fair societies.
In this line, a remarkable case of study regarding water is the European Union (EU27) which, despite representing approximately 8% of world population, is responsible for over 30% of the imports of water embodied in products exchanged through international trade, of which a notable share comes from non-European areas (non-EU). In fact, from 1995 to 2009 the EU27 countries represented approximately 2% of the increase in population at the global level, but 25% of the increase in imports of virtual water in the world. This means that the strong economic expansion happened in Europe during this period represented a significant pressure on water resources worldwide, embodied in the goods finally demanded in the EU27. These increasing pressures on foreign water resources were not homogeneous in all the EU27, but were mostly driven by the demands of high income countries. Moreover, domestic EU27 water resources were also affected. According to the European Environment Agency [
11], Germany, UK, Italy, Malta, Belgium and Spain were the most severely affected countries by water stress (The EEA measures water stress using the Water Exploitation Index plus (WEI+), which is an indicator that evaluates total water use as a percentage of the renewable freshwater resources.) in Europe. Thus, the growing dependence on foreign water resources together with the increasing water scarcity in the EU27 countries made sustainable and effective water management practices more prevalent across Europe. In this context, the analysis of global supply chains and the implications of these international structures on natural resources are important in order to evaluate global economic and environmental dependencies, to identify potential bottlenecks and to achieve a better understanding on the links between economic activity and environmental impacts on a growing complex and interrelated world.
Our paper aims to examine water use linked to the EU27 activity during the period 1995–2009, deepening into the main driving forces of this process. These years are of particular interest as representative of the acceleration of the second globalization wave since the first nineties. We propose a multi-regional input-output model (MRIO) to estimate the water footprint of the EU27 countries (and the EU region as a whole), that is, the water embodied in the goods finally consumed within the EU27 countries. Environmentally extended MRIO models acknowledge the direct and indirect links between sectors and countries along the full supply chains, and allow connecting the production and consumption perspectives, also being possible to identify the contribution of domestic demand and production of each country and the role of imported goods and inputs. Expanding these relationships to water, we relate the final consumption of goods and services with direct and indirect water incorporated in the different stages of the production chain, identifying the sector and location where this use takes place. We will distinguish between the internal water footprint, namely, the consumptive use of domestic water resources to produce goods and services that are consumed domestically, and the external water footprint or virtual water imports (VWM), in other words, the consumption of foreign water resources embodied in goods and services imported from other nations [
12], being also informative on the external dependence on foreign water resources. There is a broad literature studying the water footprint of nations [
13,
14] or regions [
15,
16,
17,
18] and also decomposing water intensity in an input-output framework [
19], but to our knowledge none of them have tried to address the water use trends in the EU27 related to the distribution of income in Europe by means of a structural decomposition analysis (SDA). As stated previously, we use a multi-regional input-output model extended to water resources that allow tracking for international supply chains and represent differences in production technologies [
20], being an accurate tool to address the consumption-based accounting of natural resources. That way, we study the main factors potentially driving the changes happened in the EU27 water footprint from 1995 to 2009, evaluating the influence of water productivity, technological change and demand. We also study the contribution of these factors to the changes in different components obtained considering the location of water use for production and final consumption (domestic and external use of water resources including imports and exports).
Our results highlight the role of the demand growth in the EU27 as the main factor boosting water use within the EU and abroad, a quite negligible effect of technological and structural change and a decline in water intensity, representative of an increasing productivity of water use. Additionally our findings suggest that the increasing integration of agriculture and food production in global supply chains considerably impacted on the use of resources worldwide, with a significant growth of the embodied water in agricultural imports from non-EU countries.
The rest of the article is organized as follows.
Section 2 deepens into the methodological framework and the main data sources used for this study.
Section 3 presents the main findings of our analysis and is divided into three subsections.
Section 3.1 focuses on the trends of water consumption at the country level,
Section 3.2 depicts the sectorial features and
Section 3.3 shows the results on the structural decomposition analysis. Finally,
Section 4 closes the paper with the main conclusions.
2. Materials and Methods
Methodologically our starting point is a MRIO model for the world economy [
21,
22,
23] environmentally extended for water resources. The total water flows among countries and sectors, as well as the internal and external components of the water footprints can be obtained as follows:
where
is a matrix with information on the water directly and indirectly used in the production and trade flows between the
n countries and
m sectors in the world.
is a diagonalized matrix of coefficients of the water used per unit of output for each country
r and sector
i.
represents the multi-regional Leontief inverse and
is a matrix of block diagonals with information on the domestic and foreign demand for final consumption of households, non-profit organizations serving households and government, gross fixed capital formation and changes in inventories and valuables.
More specifically,
where each
is a matrix of the water used in production in region (country) r to meet its own final demand for each sector
i.
is the water used in other regions production to support the final demand of region s (VWM of region
s) and
is the water used in r to support the final demands of other regions, virtual water exports (VWX of region
r). Therefore, matrix
informs on the embodied water in trade flows and allows estimating the internal, external and total water footprints of countries. All these calculations are obtained in a disaggregated matrix by country and sector. If we focus on the parts corresponding to the EU countries, we get the evaluation of the footprints of these areas within a global MRIO framework. As it is shown in Equation (2), water flows can be explained on the basis of three different components: water intensity, which proxies water productivity, technological production structure (which is captured with the Leontief inverse) and final demand. Variations in water productivity, structural and technological change and demand growth condition the water use patterns in the world and in the different regions in our MRIO model.
We get the changes in
between
(1995) and
(2009):
Then, we apply SDA to quantify the factors that explain changes in the water footprint or embodied water of countries from 1995 to 2009. The SDA separates a time trend of a variable into the drivers that could act as accelerators or retardants [
24,
25,
26]. Following Dietzenbacher and Los [
24] that prove that the simple average of the two polar decompositions is a good approximation of all the exact decompositions, we take the average of the two polar forms in (3) which yields:
We obtain the intensity effect (IE), which measures the contribution of changes in water intensities (m3 of water per $) to water use trends. Secondly, we get the technology effect (TE) that links changes in water use with changes in the technology of production. Finally, we have the scale effect (SE), which quantifies how much of the change in water use is due to changes in the final demand.
As it is well known, production can be described as a chain of processes that, departing from some primary inputs generates intermediate inputs used in subsequent processes until the generation of final demand. This is the basis of the vertically integrated production. When this production chain is established in a MRIO model, the different countries and technologies contribute to the generation of the final demand of a country. Therefore, intensity, technological and scale changes along the entire production chain will condition the volume of water embodied in a specific final demand. Each of the three previous effects can be decomposed into variations of the internal and external determinants. Thus, we will explain changes in the European water footprint according to the domestic and backwards linkages, considering the level of development (high, medium and low income) of European countries and their commercial partners (EU27 regions and non-EU areas).
We use the MRIO tables provided by the World Input Output Database (WIOD) [
27,
28] as the main database. They summarize the economic information on the production and commercial exchanges for 35 sectors in 40 countries and a region called Rest of the World (ROW). 27 of these countries belong to the EU, whereas the rest of them are non-European areas (non-EU). As we are comparing and explaining water use in 1995 and 2009, the MRIO table for 2009 is deflated and expressed in 1995 constant dollars. Following the approach developed by Junius and Oosterhaven [
29] and improved by Lenzen et al. and Temurshoev et al. [
30,
31], we apply the Generalized RAS (GRAS) adjustment to obtain a balanced MRIO table. Data on the water used per country and sector have been taken from the Environmental Accounts of the WIOD [
32] for the period 1995–2009. We utilize the information on green and blue water, which is aggregated for the presentation of the results [
12]. Thus, the WIOD database provide homogenous economic and environmental data that allow calculating the impact on water resources generated through global supply chains for different periods. Despite these advantages, water use data present some uncertainties that must be acknowledged. As an example, Genty el al. [
32] indicate that industrial water use was distributed using information from the EXIOPOL database. Besides, as Timmer and Genty et al. recognized [
28,
32], they estimated agricultural water use using crop and livestock water intensities from Mekonnen and Hoesktra [
33,
34] and data on crop production and livestock from the statistics of Food and Agriculture Organization of the United Nations (FAOSTAT). Hoekstra and Mekonnen [
10] recognize the uncertainties on their data stemming from the source statistics on production and trade, from precipitation, crop and irrigation maps or from assumptions as for example on planting and harvesting dates. However, taking in mind these drawbacks and being cautious when looking at specific areas and products, these data offer a good approximation to analyze general trends and making overall comparisons on water impacts at the macro level.
As we explained before, in order to have a better idea of the relationship between economic structure, income patterns and water footprints, EU27 countries are classified depending on their level of per capita income into three groups: low- (EU-L), middle- (EU-M) and high- (EU-H) income countries (see the list of countries in the
Supplementary Information). This classification has been made on the basis of the real gross domestic product for 2009 taken from Eurostat. We consider as high income countries France, Germany, Belgium, Finland, United Kingdom, Austria, Sweden, Netherlands, Ireland, Denmark and Luxembourg. Middle income areas are mostly Mediterranean countries in the south of Europe as Malta, Portugal, Slovenia, Greece, Cyprus, Spain and Italy. Finally, the low income countries are Eastern European countries and the Baltic republics, namely, Bulgaria, Romania, Latvia, Lithuania, Poland, Estonia, Slovakia, Hungary and Czech Republic. This breakdown will be used to analyze the contribution of the different income groups to the size and composition of the water footprint and its evolution, as well as to study the role of intensity, technology, structural change and demand composition in the evolution of European water footprints.
3. Results
The methodology presented above allows us linking the final demand of countries with all the water incorporated in the different steps of the production chain, that is, in the production of all the inputs needed to satisfy the final demand of the EU27 countries, being an approximation to their water footprint. First, we present the main changes on the overall EU27 over the period studied considering the variations experienced in the internal and foreign components, also distinguishing by blocks of countries. Then in
Section 3.1 and
Section 3.2, these trends are particularized by countries and sectors, respectively. Once the main global, country and sector features have been described,
Section 3.3 goes into the factors driving the EU27 water footprint (i.e., the results for the SDA presented in Equation (4)), deepening in the meaning and significance.
From 1995 to 2009 water use followed a growing trend worldwide. Whereas the rise in the EU27 water footprint represented 7% of the increase at the global level, this region accounted for more than 25% of the rise in the water embodied in imports in the world (see
Table 1). On the whole, these countries tended to increase their virtual water imports (from EU27 and non-EU countries), reducing at the same time their internal water footprint. In fact, the water footprint increase (This growing trend is not conditioned by the selection of two specific years (1995 and 2009). As it is shown in
Figure S1 in the Supplementary Information, the increase in water use was continuous during the whole period.) in the EU reached 175 km
3, 84% of it corresponding to the growth of water embodied in products coming from countries outside the EU27, 24% to the virtual water exchanged within the region and 6% to the decline in domestic water use. These figures indicate that the EU27 countries kept externalizing pressures on water resources during the period, consuming goods produced in foreign countries that were mostly located outside the borders of the EU27.
Within the EU27, 66% of the increase in the water footprint took place in those countries with the highest income. More concretely, the most developed areas were the largest importers of water resources both from EU27 countries and non-EU nations, followed by far by middle income areas. Domestic water use, that is, water used to produce goods that were domestically consumed, decreased in high income, but especially low income countries. Nevertheless, it experienced a notable increase in middle income countries. In these regions, mostly Mediterranean areas largely specialized in water intensive activities as agriculture and the food industry, the water footprint grew both as a result of more virtual water imports and larger impacts on internal water resources. These results are in line with other results in the literature. For instance, Steen-Olsen et al. [
16] and Arto et al. [
18] found that the EU displaced water pressures to the rest of the world through imports of products, with Spain outstanding as the largest net exporter of freshwater in the EU. Similarly, Duarte et al. [
35] also for Spain, showed the importance of water embodied in imports linked to the agri-food complex in Spain.
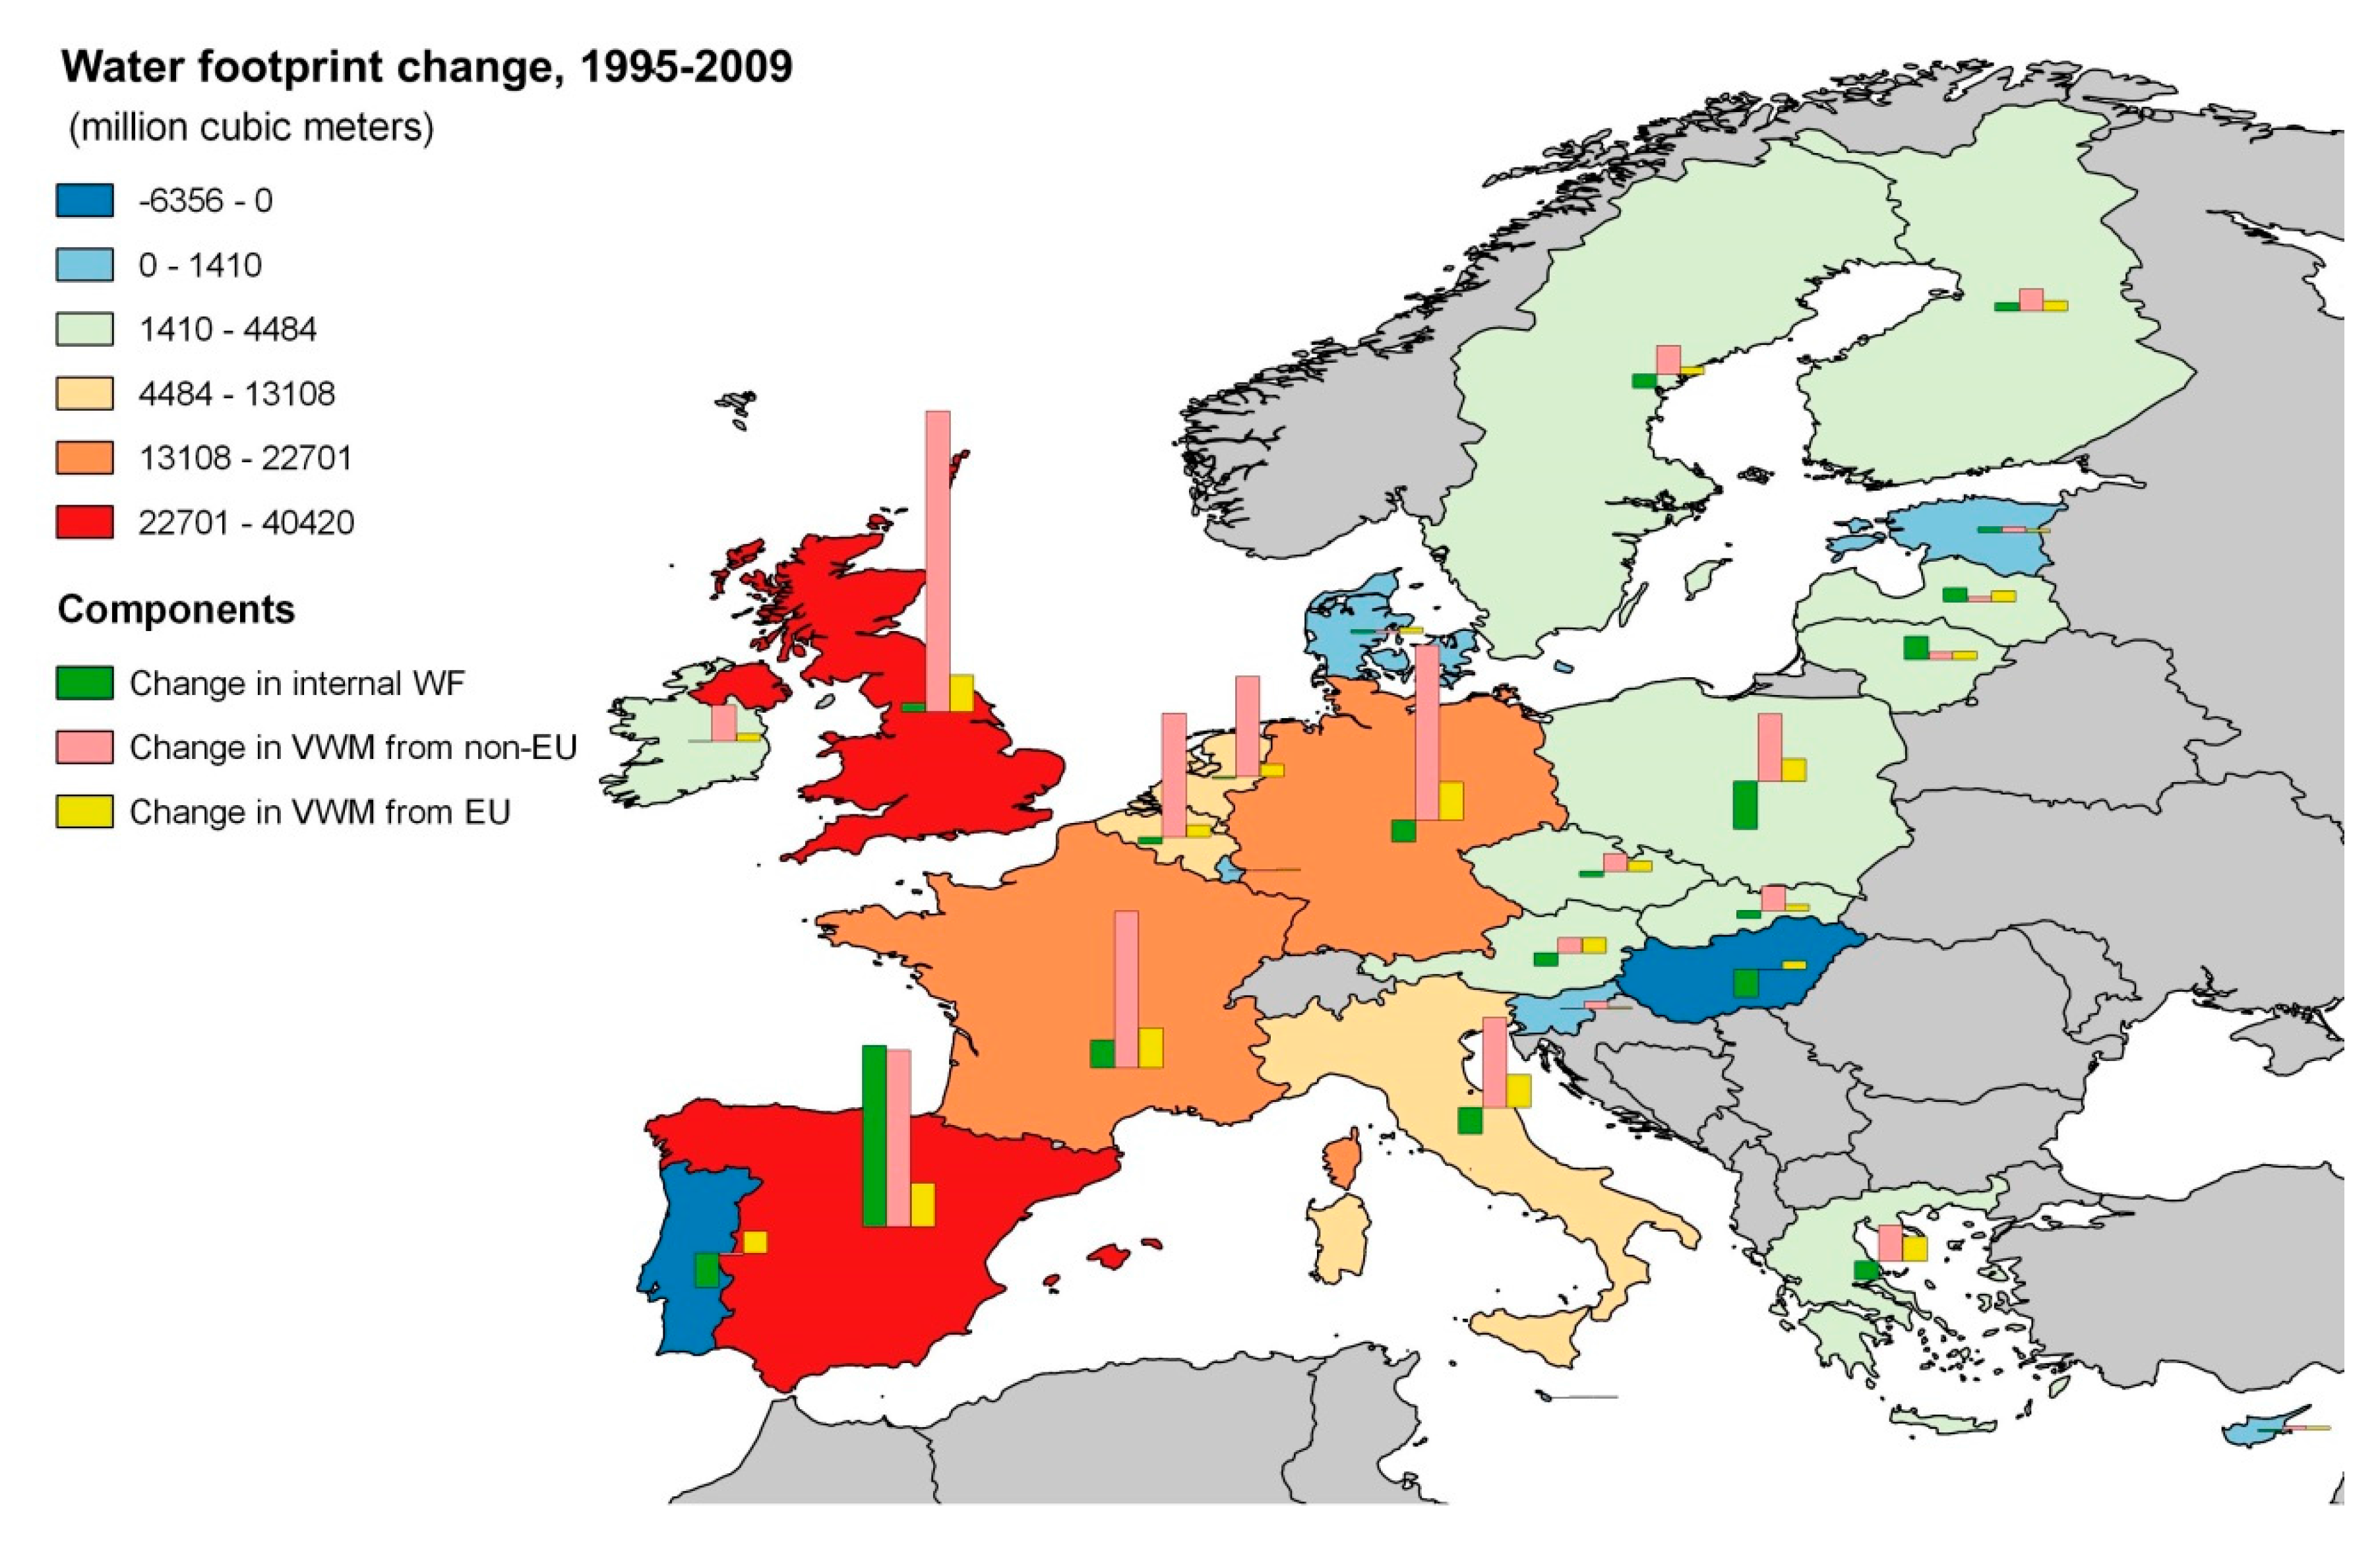
3.1. Trends at the Country Level
If we look at the areas with the highest income, the largest increase in the water footprint took place in Great Britain, France and Germany (see
Figure 1), together accounting for about 44% of total water footprint in the EU27 and mostly associated to agriculture, the food industry, hotels and restaurants as well as to the health and social work sector. Within this group it is possible to find two different patterns. On the one hand, we observe nations where domestic water use was largely replaced by virtual water imports (Austria, Belgium, Germany, Luxembourg, The Netherlands and Sweden). In most of these countries the largest increase in water imports was determined by water coming from non-EU areas. As an example, large volumes of water were imported from Brazil embodied in agricultural products that were transformed by the German food industry or used in the German hotels and restaurants sector. Besides, the textile sector in Germany also imported water through agricultural raw materials from China. On the other hand, Denmark, Finland, France, Great Britain and Ireland increased their water footprint as a result of both the growth of virtual water imports and to a lesser extent of domestic water use.
As for middle income areas, embodied water increased in all the countries but Portugal, where water use declined from 1995 to 2009. As it is shown in
Figure 1, the largest water footprint increase took place in Spain (representing 74% of total water footprint growth in middle income areas), followed by Italy (accounting for 18% of the growth in the water footprint). In this regard, Spain was the only middle income country where both the internal WF and virtual water imports (particularly from non-EU countries) grew. Domestically, Spain used large volumes of water to produce agricultural inputs that were mostly used in the food industry as well as in the hotels and restaurants sector. Water was virtually imported by means of agricultural products mostly from Brazil, China, Indonesia or ROW. This can be explained given the strong growth of the agri-food industry and its exports in this period. For instance, during these years the meat industries notably expended, boosting the demands of food for livestock [
36] and therefore of water resources embodied in these goods. Besides, interregional virtual water flows were also important. In this line, Spain, Greece and Italy imported significant volumes of water resources from European low income areas as Bulgaria and Hungary.
Finally, the increase in water use in low income European countries was driven mostly by Poland, Latvia and Lithuania (
Figure 1), representing about 6% of the total water footprint increase in the EU27. Whereas Poland offset the decline in domestic water use increasing virtual water imports mostly from China and ROW; Latvia and Lithuania raised domestic and imported water use from Poland and ROW, among others. Quite the opposite, the water footprint fell in Bulgaria, Hungary and Rumania between 1995 and 2009 because of the large drop of domestic water use in agriculture and the food industry sector.
3.2. Trends at the Sectorial Level
The MRIO model proposed also offer relevant information when we analyze the composition of water footprints by sectors. As can be seen, nearly 50% of the increase in total European water footprint was associated to agriculture and the food industry (see
Table 2). Water is a necessary input of both rain-fed and irrigated agriculture, the sector with the largest direct water use in the world. Besides, the food industry, a sector that largely developed in Southern European countries, presents a large footprint given the strong interdependencies with agriculture. Other sectors account for an important share of the increase in the water footprint. This is the case of hotels and restaurant (9%) and health and social work (According to the United Nations ISIC rev.3 classification, the “health and social work sector” includes hospital, medical and veterinary activities as well as activities that are directed to provide social assistance to children, the aged and special categories of persons with some limits on ability for self-care) (6%). Both sectors show important backward linkages with water intensive activities as agriculture and the food industry. This picture is quite similar to the pattern at the global level but we find some differences. For example, worldwide the increase in water use associated with agriculture and the food industry was higher (65% on total global water use increase). Besides, the construction sector depicts a notable share (7%), larger than the 3% shown in the EU27.
As it is observed in
Table 2, within the EU it is possible to find some divergences among income groups. Agriculture and the food industry accounted for more than 50% of the total water footprint increase in high and middle income areas. Looking by geographical areas, the share of agriculture on the water footprint is particularly important in Mediterranean economies, which accounted for 36% of the total water embodied in EU27 demand. Note that the good climatic conditions (sunshine hours, mild climate, etc.) of these regions together with the development of irrigation made agriculture a dynamic and export oriented sector. The case of Spain is surely the best example of how the dynamic performance of its agricultural exports has contributed decisively to the increase in its water footprint [
37,
38]. Regarding the food industry, it displays a significant share in the water footprint of high income areas. On the whole, the food industry tended to reduce the domestic backwards linkages with the agricultural sector, but increased the virtual water imports from other EU regions and particularly from non-EU countries. The hotels and restaurants sector was an important water consumer in both middle and high income areas (8%), its water consumption was indirectly but strongly related to the agricultural sector. The health and social work sectors also entailed an increase in water use (8% in high income and 5% in middle income countries). Finally, the textile sector was significant in middle income economies (6% on total water use increase). We can observe a reduction in the linkages with the domestic agricultural sector but an increase with the non-EU agricultural sector.
The pattern in low income areas was quite different (
Table 2). The most significant sectors contributing to the increase in the water footprint were hotels and restaurants (28%) highly related to the domestic agricultural sector, textiles (18%) linked mostly through VWM from non-EU countries, electricity, gas and water supply (18%), real estate activities (13%) and construction (12%). However, the agriculture and food industry decreased their water use from 1995 to 2009. It was particularly important in the case of the food industry that notably contributed to the deceleration of the water footprint increase and the retail trade sector, also moderating the growth in the water footprint.
3.3. Determinants of Water Footprint Trends
Table 3 shows that the scale effect, that is, the increase in demand was the main driver of the increase in the water footprint during these years. In other words, all other things constant, the increase in the size of the economies (mostly explained by population and income growth) would have represented even higher demands for domestic and foreign water resources, given the dynamic economic situation for most EU27 countries during the period studied.
This effect is outstanding for all the magnitudes analyzed and has a remarkable incidence in the imports from non-EU countries, meaning that the increasing demands in the EU27 were met at the expense on the production and water used outside the EU27. The changes in the technology of production also had a positive effect in the water footprint increase, but were negligible compared to the boost of demand. Note that the technology effect computes the effect on water demands of changes in the Leontief inverse, that is, on the structural and technological composition of production. Our results suggest that the contribution of these changes on the water footprint evolution were small, but in any case, they also played in the direction of rising water footprints. Note that the period analyzed was not characterized by visible and relevant changes in the production structures of those water intensive sectors; in other words, global production structures kept relatively stable in this expansive period, without a significant influence on the changes observed for water demands. Finally, the intensity changes, that is, variations in the water necessary per dollar produced, contributed to a partial levelling off of the water footprint in the EU27. On the whole, the water necessary per dollar of gross domestic product (GDP) decreased, that is, the efficiency or water productivity increased. However, this growth was not enough to make up for the large growth of the scale effect.
The increasing imports of high income countries notably contributed to the large scale effect, particularly given the rise of VWM from non-EU areas (69%). This was the case of the VWM of the food and textile industries in Germany, France and Great Britain from the Chinese agricultural sector. Again, we find evidence of the externalization of water pressures on developing areas driven to a large extent by the growing demands in the most developed areas. Secondly, the scale effect was also determined by the impacts of increasing domestic demands of European countries, reaching a contribution of 41% (see
Table 3). It was rather distributed among high, low and middle income areas, but was most significant in the least developed areas in the EU27, probably as a result of their lower integration in international markets relatively to the wealthiest regions. In this regard, the most significant countries were Romania (because of the water use in the internal food industry), Poland (due to the domestic food industry water use), France (given the water use of the national agriculture and food industry) and Spain (as a result of the internal water use in agriculture and hotels and restaurants). Finally, virtual water imports of middle income economies from non-EU members were also significant, representing 25% of total water footprint increase in the EU27. The increase in imports of Spain and Italy from China (as a result of Chinese raw agricultural products used in the Spanish and Italian textile sector) or USA (mostly agricultural products used in the food industry) were also remarkable.
As we said before, the technology effect contributed to the increase in the water footprint, but it was insignificant compared to the scale effect. It shows a positive sign in the case of imports of every European sub-group. That is, the growing imports of water through intermediate inputs that were processed in European supply chains moderately contributed to the increase in the EU27 water footprint. In this regard, the most important component was the increase in imports of intermediate goods of high income from non-EU areas, reaching 21% of the total water footprint increase. It was mostly concentrated in imports of the food sector in countries as Germany, Great Britain and The Netherlands from Brazil, China and ROW. Despite the technology effect considered as a whole shows positive sign, some of its sub-components depict negative sign. This was the case of the domestic technology effect (−25% on total water use increase). This means that technological changes in the production of intermediate inputs in Europe contributed to a partial levelling off in the growing trend seen for the water footprint between 1995 and 2009. This effect was particularly relevant in low income economies (−17%), especially in the food industry and agriculture of Poland and Romania.
Finally,
Table 3 displays that the intensity effect was the factor contributing to the moderation of the water footprint increase. Without these efficiency improvements, the water footprint would have grown even more (as much as 136 km
3). This effect was chiefly associated to the decreasing intensity (growing efficiency) of the products imported by high income EU countries as Germany, France or Great Britain from non-EU areas like Brazil, China and India (−35% on total water use increase). Besides, high income (France) and low income (Poland and Romania) areas also produced using domestically less water per unit of GDP, especially in the agriculture and food sectors (−23% on total water use growth). On the contrary, middle income areas as Spain showed a small but positive domestic intensity effect (1% on total water use).
4. Discussion and Conclusions
From 1995 to 2009 the water footprint notably increased in the EU27. The sustained European economic growth over this period, which on average reached 2% every year, induced intensive demands for water resources throughout the whole global supply chains. That is, the growing final demands of the EU27 countries boosted production but also water resources depletion worldwide. As an example, the water used to meet European final demands tripled the volume of water resources directly used in production activities. This gap can only be explained looking at the external components of the water footprint, that is, virtual water imports.
The objective of this paper has been to analyze the water use changes in the EU27 during a period of economic expansion. We acknowledge the multisectoral character of the economies, the increasing role of trade in economic growth and the need of combining the production and consumption perspectives for better addressing the relationship between production activities, pressures on natural resources and the final destination of goods and services. To that aim, we make use of an environmentally extended input-output approach to obtain the changes in the volume of water embodied in domestic production and in trade flows at the sector and country levels. Moreover, we use a structural decomposition analysis clustered by income blocks to evaluate the factors responsible for water footprint changes. With this technique we want to evaluate to what extent changes in the size and economic composition of the EU27 countries have contributed to the increase in water demands.
Our results show the large positive impact of demand growth in that period, the direct but negligible effect of structural change, and the decline in water intensity. Moreover, these findings also point at a gradual substitution of domestic water use for virtual water imports. More specifically, the growth in embodied water was mostly driven by the important upsurge of virtual water imports from non-EU countries. In high- and low-income areas the use of domestic resources was significantly replaced by water embodied in products coming from abroad, involving a significant externalization of water pressures. However, in middle-income countries both the internal and external water footprint rose given their relatively important agri-food-based character, intensive in the use of water resources and with important connections with other economic activities. The water footprint growth was largely explained by countries as Spain, United Kingdom, Germany and France. On the whole, the strong linkages of agriculture with the food industry as well as with some other sectors as hotels and restaurants and textiles can explain this growing WF. In this context, despite notable improvements in water productivity—it was necessary to use less water to get a dollar amount of GDP—this effect was not enough to make up for the great boost of domestic and foreign demands, which were the main drivers of the growing trend of the EU27 water footprint.
Accordingly, European countries tended to consolidate externalization of the pressures on water resources from 1995 to 2009. The food industry reduced its backward linkages with the domestic agricultural sector in most countries, increasing the embodied water in agricultural imports from non-European regions. In other words, we observe a progressive substitution of domestic inputs through the supply chain. These areas imported primary agricultural inputs that were processed or used in other sectors that are placed higher in national and international supply chains. This has also important implications in terms of the dependence of European countries on foreign water resources, indirectly taking the risk of any environmental, economic or institutional shock affecting their main commercial partners. Other Mediterranean areas such as Spain kept importing foreign water resources, but also exerting significant impacts on local resources, chiefly as a result of the growing importance of the agri-food complex in its economic structure, notably boosted by exports of high value added and water intensive agri-food products from the mid-1990s [
39]. In Spain, the relative good climatic conditions (sunshine hours, mild temperatures, etc.), despite the associated aridity, and the hydraulic infrastructure to store and distribute water resources have also favored the development of the agri-food system [
40,
41] involving pressures on water.
Multi-regional input-output models appear as an important methodological framework to identify and distinguish responsibilities on the use of natural resources at the macro level. In our view, it is essential to go beyond indicators of direct water use, utilizing measures that enable to get an overall perspective of the water use of countries and sectors considering the consumption approach. In this line, our analysis offers a comprehensive assessment of the impact that the changes in the economic activities in the EU27 had in domestic and foreign water resources and the way in which these effects are transferred through international supply chains. The results also suggest different patterns of water demand in Europe and a quite different composition of the global supply chains associated to agricultural and food production, with relevant implications on the water pressures worldwide. In consequence, the extension of the analysis to different clusters of countries and sectors (attending to different socioeconomic and environmental criteria) and a deeper study of the agri-food supply chains in Europe are clear lines of advance for future research.


