Exploring the Technological Collaboration Characteristics of the Global Integrated Circuit Manufacturing Industry


1
School of Management and Economics, Beijing Institute of Technology, Beijing 100081, China
2
School of Public Policy and Management, University of Chinese Academy of Sciences, Beijing 100049, China
*
Author to whom correspondence should be addressed.
Sustainability 2018, 10(1), 196; https://doi.org/10.3390/su10010196
Submission received: 31 October 2017
/
Revised: 2 January 2018
/
Accepted: 11 January 2018
/
Published: 22 January 2018
(This article belongs to the Special Issue Knowledge Management, Innovation and Big Data: Implications for Sustainability, Policy Making and Competitiveness)
Abstract
:With the intensification of international competition, there are many international technological collaborations in the integrated circuit manufacturing (ICM) industry. The importance of improving the level of international technological collaboration is becoming more and more prominent. Therefore, it is vital for a country, a region, or an institution to understand the international technological collaboration characteristics of the ICM industry and, thus, to know how to enhance its own international technological collaboration. This paper depicts the international technological collaboration characteristics of the ICM industry based on patent analysis. Four aspects, which include collaboration patterns, collaboration networks, collaboration institutions, and collaboration impacts, are analyzed by utilizing patent association analysis and social network analysis. The findings include the following: first, in regard to international technological collaboration, the USA has the highest level, while Germany has great potential for future development; second, Asia and Europe have already formed clusters, respectively, in the cooperative network; last, but not least, research institutions, colleges, and universities should also actively participate in international collaboration. In general, this study provides an objective reference for policy making, competitiveness, and sustainability in the ICM industry. The framework presented in this paper could be applied to examine other industrial international technological collaborations.
1. Introduction
The Integrated Circuit (IC) industry is the foundation and power source of high-speed development in the information technology industry [1] and it has infiltrated every area of national economic and social development. The technological level and development scale of a country’s IC industry has become the key for achieving competitive advantage and sustainable development for companies, economies, and societies [2,3]. For example, as one of the research directions of the IC industry, Radio Frequency Identification (RFID) technology is a catalyst which can promote big data analysis and application [4]. RFID can revolutionize big data analytics, benefitting various sustainability themes: the use of big data analytics based on RFID technology in areas such as smart city, smart power grid, smart building, smart industry, supply chain analytics, and better logistics planning can effectively reduce the environmental stress from broader social and economic activities [5,6]. In addition, countries all over the world have accelerated the strategic adjustment for their economic structures after the international financial crisis, which makes the strategic adjustment fundamental, and the leading position of the IC industry more obvious. For instance, the USA regards the IC industry as one of the four major technical areas that can radically transform the manufacturing industry over the next 20 years [7]. The European Union implemented its Micro- and Nanoelectronic Technology Industry Strategy Roadmap [8]. Also, China issued the policy “Outline of Development of the National Integrated Circuit Industry” and a series of policy documents [9,10,11] that promoted the status of the IC industry from inside the industry to the national level. As a result of the crucial technological and economic importance of its innovations, it is no surprise that this industry is the focus of many innovation researchers [12]. Located in the middle of the IC industrial value chain [13], the Integrated Circuit Manufacturing (ICM) industry is both technology- and capital-intensive, and the level of technological development also matters a great deal in this sector [14,15].
In fact, the ICM industry is experiencing a rapid technological development [16,17]. The number of transistors on a single chip is up to 109 orders in magnitude from 10 of thirty years ago [18]. As ICM technologies become more complicated, it is impossible for any single institution to endure merely with its own patents and technologies [15]. Technological cooperation is becoming increasingly popular [19]. Also, because of the intensification of the international competition and the existence of a technological gap among countries, international technological collaboration is increasing gradually [20]. International technological collaboration plays a pivotal role in promoting the emergence of a knowledge flow among countries [21]. The benefit from cross-border collaboration, particularly pronounced for a small country, is that the pool of knowledge a firm usually pulls from is no longer limited. Firms may thus benefit from the larger pool of knowledge provided by international collaboration partners that facilitate spillovers from a richer pool of other Research and Development (R&D)-active firms [22]. Therefore, collaborating with international partners has become an important strategy for firms in the ICM industry to develop next-generation technology by sharing expenses and risks [23].
More importantly, if a country, a region or an institution has a high level of international technological collaboration, it can further promote the transmission of technological knowledge to other organizations [24], thus contributing to achieving and utilizing technological knowledge resources worldwide with higher efficiency [25]. This will improve its innovation efficiency and technological level in the ICM industry because an organization’s accumulated knowledge is key to its continued ability to innovate. Specifically, having a diverse technological knowledge-base within the organization can facilitate innovation through novel combinations of readily accessible pieces of knowledge [26]. On the other hand, this efficient technological knowledge collaboration, which is based on knowledge management, is essential to bring about sustainable innovation [27]. The necessary condition to generate a shift towards sustainable innovation is that the various actors and stakeholders involved can share knowledge and learn from experiments, practices, and other kinds of R&D activities [27]. It should be emphasized that the air pollution and water pollution generated in the process of IC manufacturing are receiving more and more attention [28,29]. The sustainable innovation which is promoted by the efficient international collaboration in the context of knowledge management can lead to sustainable consumption and production that are ecologically sound, are accepted and adopted by society, and effectively relieve the environmental pollution from the ICM industry. Therefore, a high level of international technological collaboration will enable a country, a region or an institution to enhance its innovation efficiency, technological level, and competencies to sustainably develop in the global ICM industry.
In summary, with the development of technology and the intensification of international competition, there are many international technological collaborations in the ICM industry [15,23], and the important role of improving the level of international technological collaboration is becoming more and more prominent. Therefore, it is vital for a country, a region or an institution in the ICM industry to understand the international technological collaboration characteristics of the ICM industry and thus to know its own advantages and disadvantages for international collaboration, which technology partners have a strong technical force and collaboration potential, and, finally, how to improve its own level of international technology collaboration. Nevertheless, although various computer chips are being investigated, few articles can be obtained about these research topics in the ICM industry.
As one of the objects of knowledge management, patents provide a reliable quantification basis for technology or industry development studies because they are the manifestation of the latest and most valuable technological knowledge for inventions [30,31]. In consequence, the majority of studies were done using patent bibliometric methods [32]. The ICM industry is also ideal for information on innovation, quality, and technological knowledge that can be obtained through the analyses of pertinent patent data [33,34,35]. This is because this industry places a strong emphasis on the importance of patents and patent rights [35]. The ICM industry is somewhat unique in that it is characterized by a highly cumulative process of innovation and has patented all landmark inventions dating back to the early 1980s [36,37]. IC firms often require access to a “thicket” of patent rights in order to advance the technology, or to legally produce or sell their products [16]; therefore, many of them have drawn considerable revenues from royalties and the licensing of patented technologies [38]. For example, in an earlier study, patents issued to ICM enterprises from 1975 to 1994 were utilized to examine the effects of the value of a firm’s technological advancement and of the newness of its technology on the probability of its failure [12]. In 2010, another study showed a bibliometric analysis of the patent publications of 73 Taiwanese IC design firms covering the period from 1995 to 2007 [39]. Using the patents from Taiwan and U.S. IC design and manufacturing firms, Tsai [40] shed light on the patent and Research and Development (R&D) spillover effects on productivity. Later, patent citation data was analyzed to demonstrate that Taiwan’s Hsinchu Science Park is a healthy and knowledge-based cluster surrounded by the IC sector [41]. Recently, researchers investigated the different developmental paths in the IC industry in China and India using qualitative and quantitative data, including U.S. utility patent holdings [3,42]. Patent data can also be used in the study of international technological cooperation [43]. Scholars have studied international technological collaboration by patent data from various angles, including the collaboration network [21,44,45], collaboration pattern [20], driving factors [46], knowledge flow [24], industrial degree [25], national degree [47,48], etc. Although the academia has actively promoted the research of international technological collaboration and ICM industrial innovation by patent analysis, ICM international technological collaboration studies using patent data are not yet fully developed.
Therefore, this paper attempts to explore the international technological collaboration characteristics of the ICM industry by discussing the issue from the following three points of view based on patent analysis:
(1) What are the differences among each country and region in the distribution of technical topics? What is the key cooperative direction for international collaboration of each country and region? By answering these questions, we can know for a specific country and region which countries and regions are easy to collaborate with and how to promote a technological collaboration with a country or region by focusing on some specific collaboration directions, and we can thus learn the potential for future development of each country and region in the ICM international technological collaboration.
(2) What position does each country and region occupy in the ICM international collaboration network? Which institutions from each country and region participate in international collaboration? Is there any difference in the distribution of institution types? These questions are mainly about the current situation of the ICM international technological collaboration. By answering these questions, we can know the performance of each country and region in the collaboration network or at the institutional level and the performance of each institution in the international technological collaboration, and thus we can put forward some suggestions specifically to improve the performance.
(3) What are the impact characteristics of each country and region in the ICM international collaboration network? What are the differences among the collaboration impact characteristics from typical countries and regions? By answering these questions, we can know which countries and regions have a high influence in the collaboration network, understand the relative strengths and weaknesses of each country and region for their collaboration impact, and thus we can know the consequences of the international collaboration of each country and region.
The research results can help the policymakers of all countries and regions and the decision makers of different institutions understand the technological collaboration characteristics of the global ICM industry, recognize their own advantages and disadvantages, look for appropriate technology partners, and improve their performance in the collaboration network or at the institutional level, respectively, based on the specific suggestions. We try to explore the international technological collaboration characteristics to provide a reference for both the countries and regions and the institutions to improve their level of international technological collaboration.
The paper is organized as follows. First, we describe the data and methodology. For the data, we construct a technical classification system and patent search strategy for each subfield of the ICM industry. A sample of 11,621 patents in the ICM industry from the European Patent Office (EPO) was collected for analysis. In addition, the methods of patent bibliometric analysis and social network analysis utilized in this paper are also described. Second, the characteristics of the collaboration pattern, collaboration network, collaboration institution, and collaboration impact are described, based on patent analysis. Finally, conclusions are given and specific questions are discussed. Overall, this study explores the international technological collaboration characteristics in the ICM industry and provides an objective reference for both the countries and regions and institutions to facilitate their decisions for future policy making, to improve the level of international technological collaboration, and to sustainably develop in the global ICM industry.
2. Data and Methodology
2.1. Research Framework
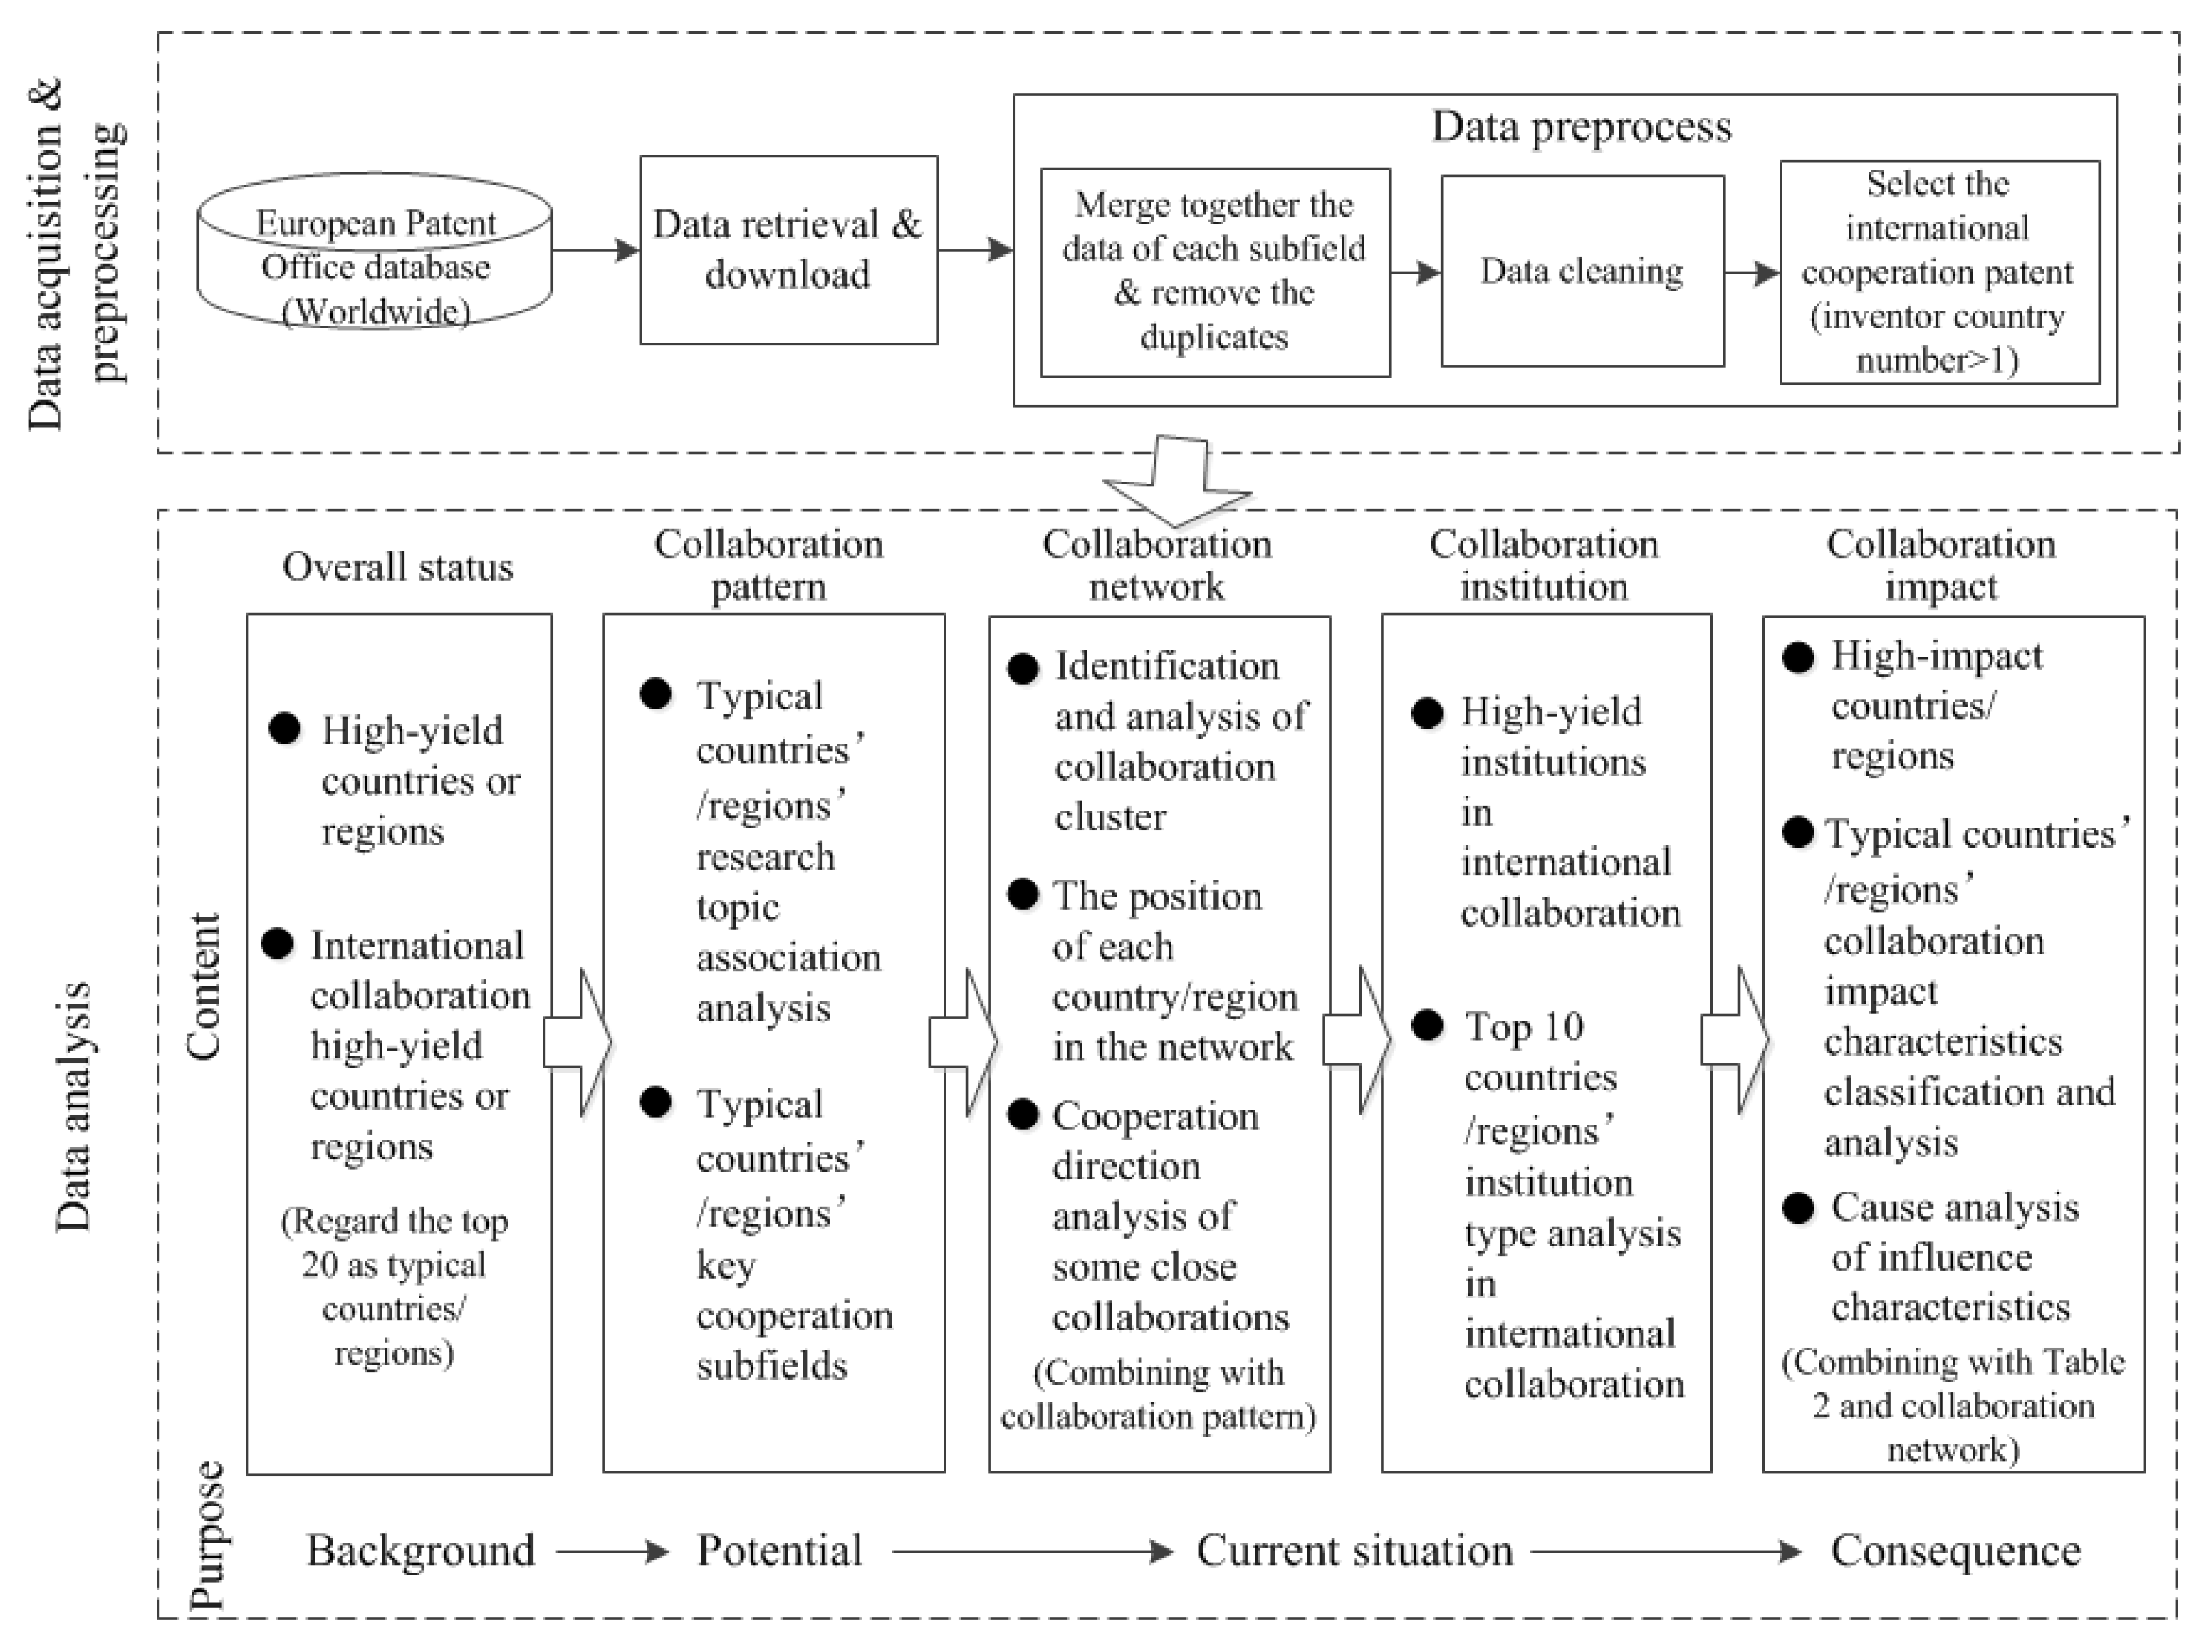
We analyzed the characteristics of the international technology cooperation in the ICM industry from four aspects: collaboration pattern, collaboration network, collaboration institution, and collaboration impact, as shown in Figure 1. Specifically, through the analysis of the collaboration patterns, we could find out the differences among countries or regions in the main technological research directions, as well as their main technological collaboration subfields, and understand the potential for future technological collaborations for these countries and regions. Through the research on the collaboration networks and collaboration institutions, we could understand the developmental situation for each country and region. And through the research on the collaboration impact, we could understand to some extent the consequences of the international technological collaboration for each country and region.
2.2. Technical Classification System and Data Collection
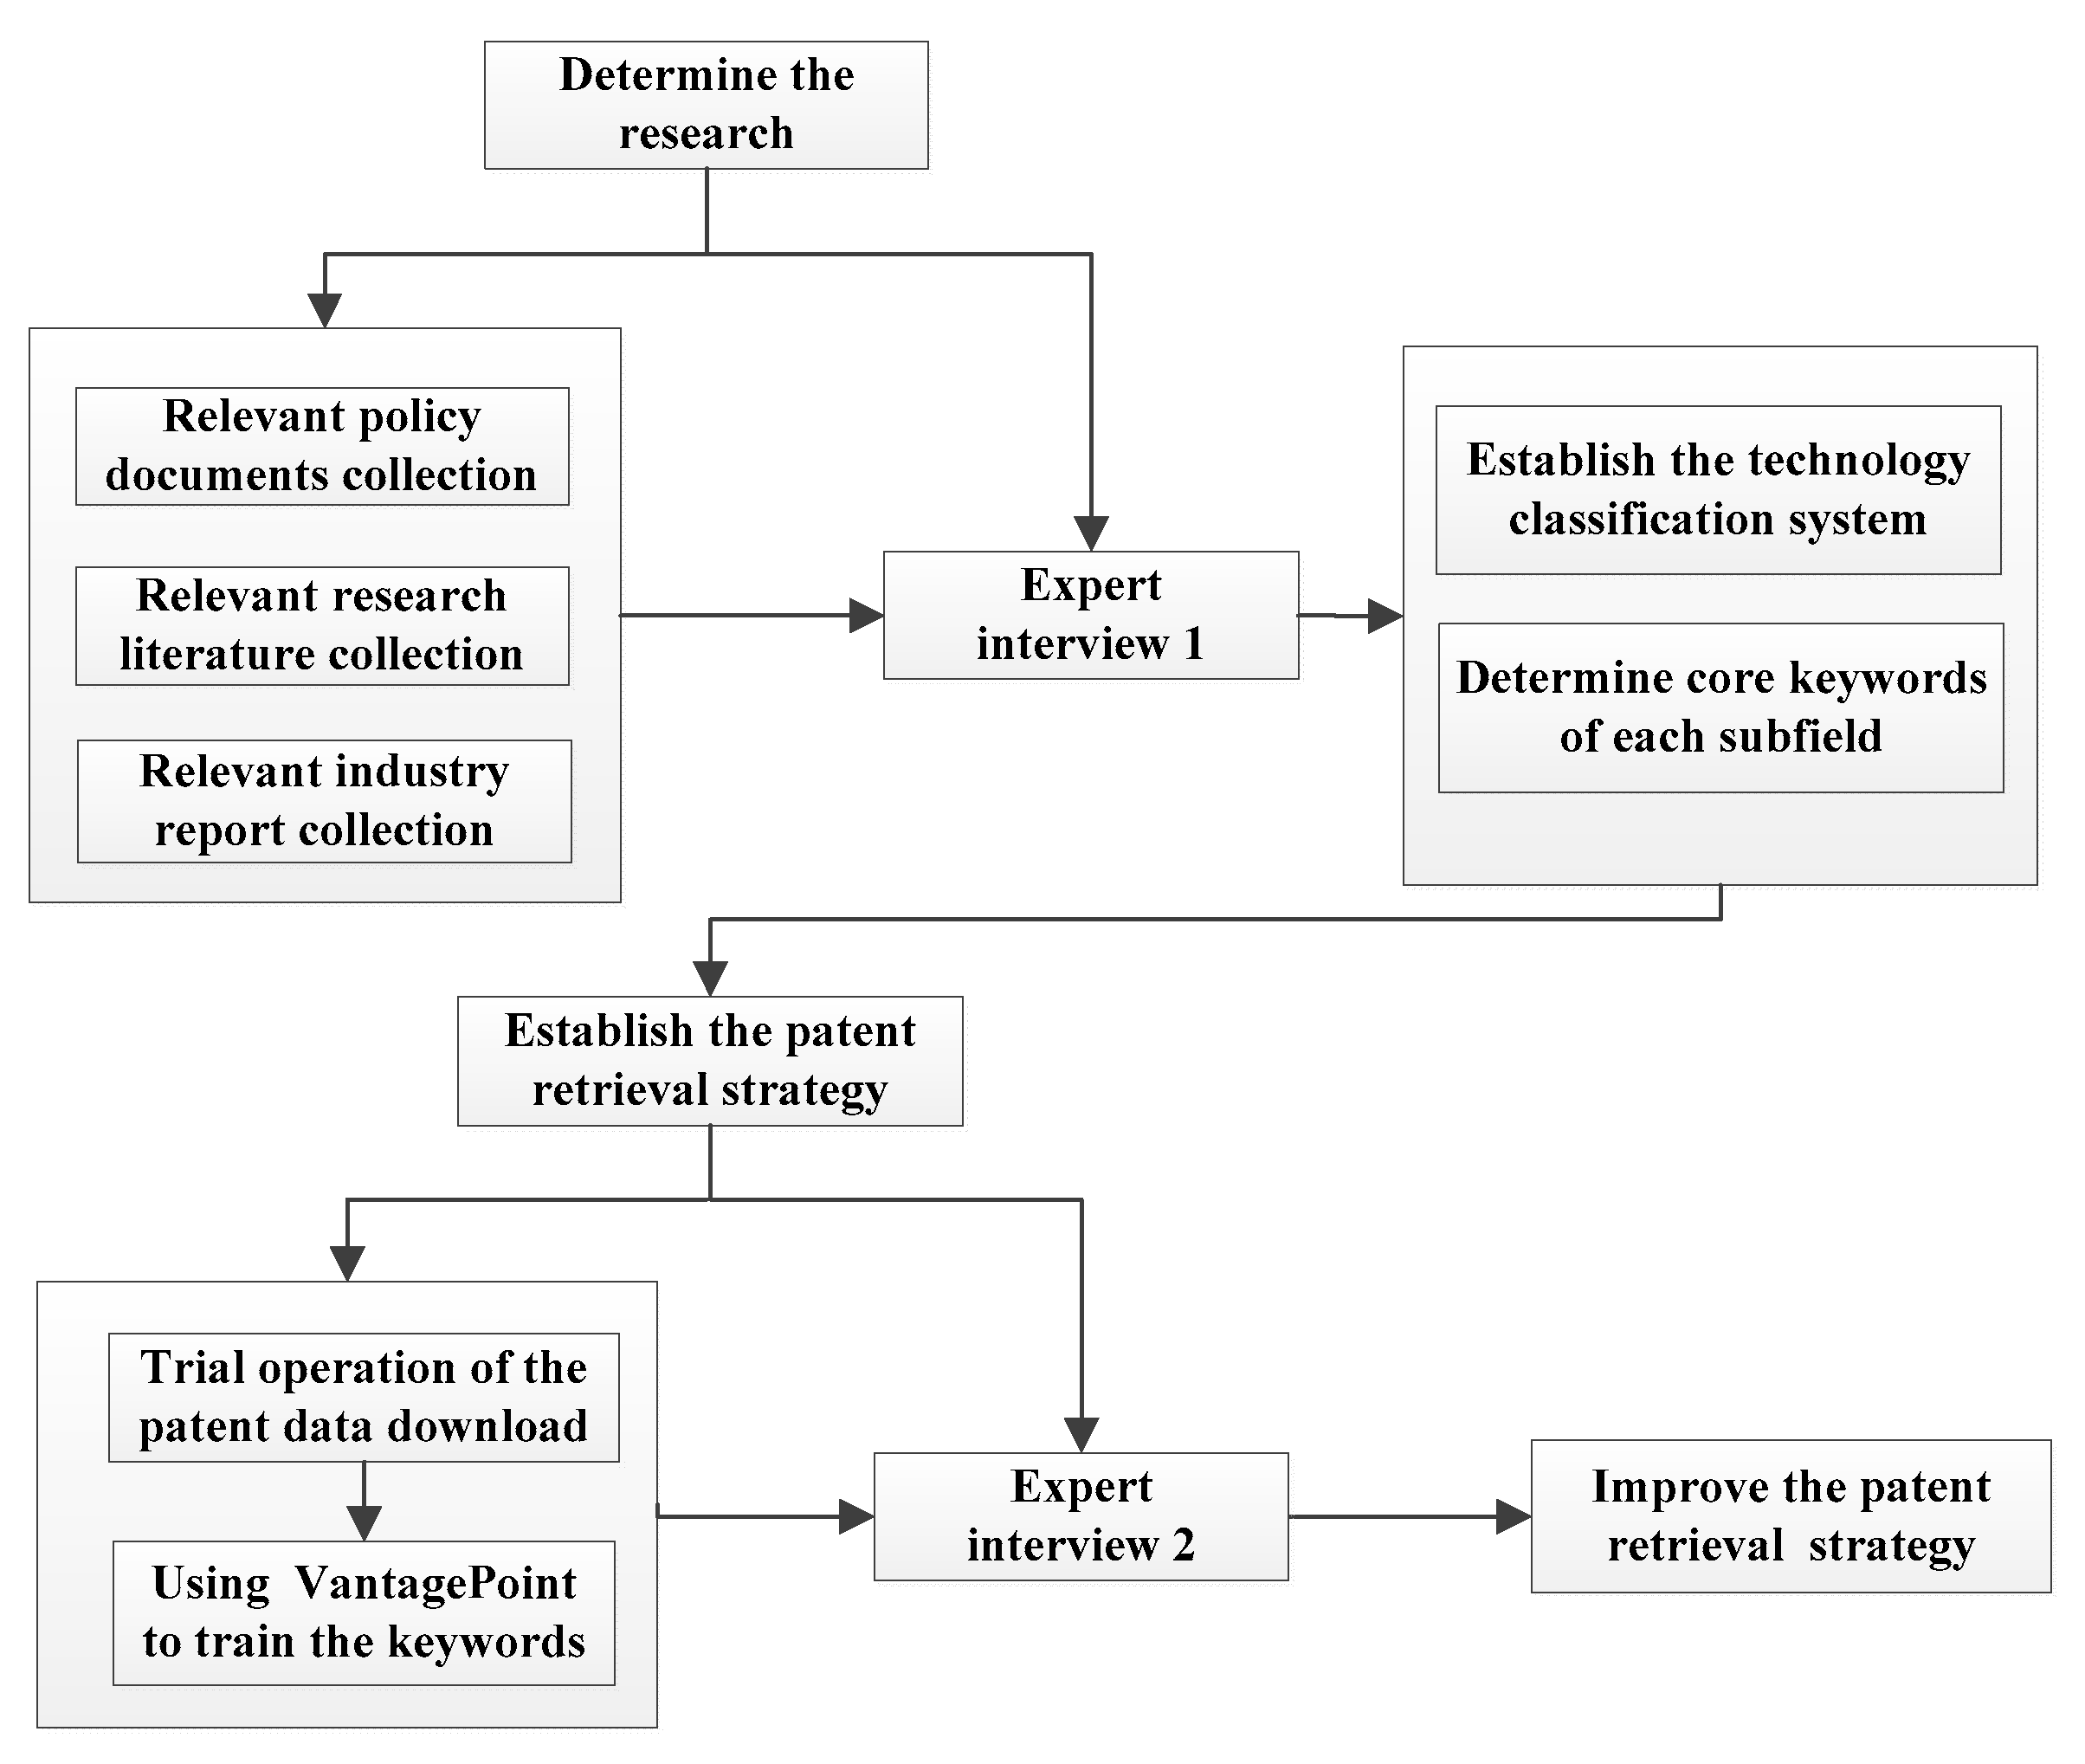
Because the ICM includes various types of manufacturing processes and technologies, it is difficult to retrieve all patents by a single International Patent Classification (IPC) code or IPC combination. Thus, we first established an ICM technology classification system. Next, based on the improved vocabulary query methods, a patent retrieval strategy was formulated by selecting keywords in every subfield. As shown in Figure 2, the determination of the ICM technology classification system and patent retrieval strategy refer to three kinds of documents: (1) research literature related to the ICM, whose research contents can be divided into patent bibliometrics [12,39,40,41], developing situations [11,12,13,15], technology fields [14,18], etc.; (2) industrial information related to the ICM, which includes industrial research reports [49,50], popular science books [51], etc.; and (3) policy documents related to the ICM.
As shown in Figure 2, in addition to the three document types for reference, interviews with technical experts and keyword training were also used for the optimization of the technology classification system and patent retrieval strategy. Among them, the expert interview mainly refers to communication with experts in the form of a semistructured interview. The interview is divided into two rounds, as shown in the figure. In the first round, the experts worked in the Chinese Academy of Science and Technology for Development, and their research area is technology assessment and foresight. We consulted three experts for advice, mainly focusing on the establishment and improvement of the ICM industry’s technology classification system and core keyword selection in each subfield. In the second round, we invited four experts from the Institute of Microelectronics of the Chinese Academy of Sciences, whose research area is the ICM. These experts mainly provided suggestions on the processing of the keyword training results and on the further improvement of the retrieval strategy. It is worth noting that every round of expert interviews involved multiple interviews. We expected to get guidance and recommendations from the experts based on their professional background knowledge through a number of exchanges about the interview results and a feedback between the two sides involved in the interview.
Keyword training is a method that searches and downloads patent data roughly on the basis of core keywords for each subfield. It also includes extracting vocabularies from the download patent data on the basis of the VantagePoint software and selecting the appropriate vocabularies as new keywords to improve the retrieval strategy by replacing the previous keywords or adding them directly. Patent data is then downloaded on the basis of the improved strategy, and a new round of keyword updates is conducted over and over, until no suitable new keyword appears [52,53]. Furthermore, the VantagePoint is a software application for structured text mining and analysis [52]. In this paper, the VantagePoint software was used to recognize and extract vocabularies from the title and summary information of the patent data.
Eventually, as shown in Table 1, the ICM technology was divided into a total of eight subfields: cleaning technology, lithography technology, etching technology, thin film technology, doping technology, annealing technology, planarization technology, and packaging technology. It is worth noting that the 8 subfields have more than 40 key technical topics and thus derived more than 60 keywords. The specific retrieval strategies are shown in Table A1.
According to this established patent retrieval strategy, a total of 11,621 patents between 2004 and 2013 were downloaded from the world patent database from the EPO [32]. After the process of data cleaning and removal of duplicates, the remaining 7077 patents were built into a database. Data cleaning included the unification of the names of the countries and regions of the inventors and the deletion of patent data that lacked the inventor’s nationality information. Next, 533 patents in which the number of the inventor’s countries or regions was greater than or equal to 2 were selected to establish the ICM international cooperation patent database. It is of note that both the international co-inventor information and the international co-assignee information in the patents could be used for the international cooperation research. However, if inventors from two or more different nations worked together (i.e., international co-inventors), it implied that the inventive human resources from different nations were combined. If institutions from two or more different nations shared the ownership of the patent (i.e., international co-assignee), it would typically imply that these institutions engaged in collaboration in terms of finance, human resources, etc. [46]. In this paper, we believe that a direct contact among persons would be critical in identifying and designing an international technological collaborative research. Thus, we analyzed the ICM international technical cooperation based on the international co-inventions. This practice is not only the choice of many scholars for the study of the international technical cooperation [20,21,24,25,46,48,54], but it has also been discussed and proven effective [43,55].
2.3. Patent Association Analysis
The association analysis measures the degree of association among some related factors, such as the assignee, country or region, and application year. This analytic process transfers the degree of association into a matrix and maps it into a two-dimensional figure using a multidimensional scaling method [20]. Of the various measures used to produce association matrices, this study employed the similarity-based association analysis [56].
To be specific, we could obtain the degree of association by cosine similarity. Consider the patent inventor’s country or region as an example, and assume there are m topic words in the patent having vectors A = (a1, a2, …, am) and B = (b1, b2, …, bm), representing the eigenvectors of two different countries (or regions). Using cosine similarity, we define the degree of association between vectors A and B as follows:
where is the number of times topic word i appears in the patent of an inventor belonging to country or region A; similarly, is the number of times topic word i appears in the patent of an inventor belonging to country or region B. With this formula, we can calculate the degree of association in each country or region and further enhance the research on the collaboration pattern.
In this paper, the topic words’ thesaurus was established according to the title and summary information from the ICM patents. Then, the degrees of technological correlation among countries or regions were calculated by the patent association analysis method based on all the ICM patents. Finally, a visual technology map was generated from the results. In addition, a stop words’ thesaurus, synonym thesaurus, normal vocabulary of patent documents, thematic vocabulary were all constructed on the basis of specific technology fields, which could improve the effectiveness of the association analysis results.
2.4. Social Network Analysis
2.4.1. Cohesive Subgroups Analysis
The cohesive subgroups in the social network analysis mainly refer to subgroups with certain cohesion. Wasserman and Faust have defined it as that there are strong, direct, close, or positive relationships among nodes inside the cohesive subgroups [57]. At present, the scholars analyze the cohesive subgroups mainly from four perspectives: the reciprocity of the relationship, the proximity or accessibility between the nodes inside the subgroup, the frequency of the relationships among the nodes inside the subgroup, and the difference degree of the density of relationship among the nodes inside the subgroup relative to the density of the relationship between internal nodes and external nodes. This paper identifies the collaboration clusters in the international collaboration network based on the principle that the relationship among nodes inside the cluster is close, and the nodes inside the cluster have less collaboration with the nodes outside the cluster. This is the same as the fourth perspective of the cohesive subgroups research, and the CONCOR (Convergence of Iterated Correlations) algorithm is a common method to analyze cohesive subgroups from this perspective [58,59]. CONCOR is a kind of iterative correlation convergence method, clustering nodes by multiple iterations [60]. Specifically, the CONCOR process computes the Pearson product-moment correlation coefficients among the rows and columns of the input matrices by comparing the value of a given cell to the mean value of both the row and the column in which it occurs at first. It then uses the correlation matrices as input for a new round of correlation computations. The output from this calculation is used as input for yet another round of correlations, and the process continues in this fashion. After several iterations of this procedure, the values of all correlations in the matrix are equal to either +1 or −1. The final correlation matrices are dichotomized to allow all nodes to be grouped into different subgroups [61,62]. The CONCOR algorithm is frequently used for cluster analysis of multivariate relational data and multivalued relational matrices [58,63]. In this paper, we identified collaboration clusters in the ICM international collaboration network by the CONCOR algorithm.
2.4.2. Centrality Analysis
This paper assumes that there are close technological knowledge exchanges among inventors who have co-invented patents; thus, the technological information can be transmitted among different individuals. It is worth noting that this assumption has been supported by several empirical studies [24,64,65]. In this paper, actors in the collaboration network are taken as nodes, and the manifested relationships among them are seen as the links among the nodes [66]. A good position occupied by a node presents advantages in that it lets a central node enjoy profits in terms of information collection, processing, and transfer, and, therefore, it lets it have a strong impact in the network [54,67]. In other words, the position of a node in the network determines its collaboration impact. Thus, as a common evaluation criterion for the locations of nodes in a network, the centrality of a node can be used to analyze its collaboration impact within the network. Of the various indexes used to measure centrality, this study selected degree centrality, closeness centrality, and betweenness centrality [68]. It should be emphasized, for convenient comparisons, that the following formulas were used to calculate the relative centralities:
(1) Degree Centrality (DC)
The DC measures the number of nodes in the network that are directly connected to node i [69]. The higher the DC of a node, the higher the number of nodes it directly cooperates with, so the greater the direct collaboration impact range it has in the ICM collaboration network.
We define the DC as follows:
where is the relative DC of node i; is the absolute DC of node i; is the maximum possible absolute DC; is the number of nodes which are directly connected to node i; is the number of nodes in the network.
(2) Closeness Centrality (CC)
The CC measures to what degree the node i is not controlled by other nodes in the network [68]. Here, we introduce the concept of distance, which means the number of lines contained in the geodesics linking two nodes in the network. In the ICM collaboration network, a country or region node with a high CC value is at a short distance from all other countries and regions. This implies that it can easily both receive technological information from all countries and regions in the network and spread information to them. That is to say, its cooperation impact spreads faster in the network.
We define the CC as follows:
where is the relative CC of node i; is the absolute CC of node i; is the maximum possible absolute CC; is the number of nodes in the network; is the minimum distance between node i and node j.
(3) Betweenness Centrality (BC)
The BC measures the degree of node i in the shortest geodesics linking two other nodes in the network. That is to say, a high BC value indicates that node i plays the role of intermediary in the ICM technology cooperation network and can control the transmission of technological information in the network to a greater extent [69]. In short, the strength of the collaboration impact of i is greater.
We define the BC as follows:
where is the relative BC of node i; is the absolute BC of node i; is the maximum possible absolute BC; is the number of the shortest geodesics linking node j and node k; is the number of shortest geodesics linking node j and node k that contain node i; is the number of nodes in the network.
(4) Analysis model of the collaboration impact characteristics and location characteristics
In this paper, three kinds of centrality of typical nodes in the ICM international cooperation network were calculated and sorted according to the formulas above. Based on the above description about DC, CC, and BC, we used the three kinds of centrality of a node to symbolize the three dimensions of the node’s collaboration impact in the network: the range of direct collaboration impact, the speed of collaboration impact transmission and reception, and the strength of the collaboration impact. Afterwards, the average value of the rankings for three centralities (ARC) of one node was calculated and employed in this paper to analyze the collaboration impact of countries and regions in the collaboration network. To a certain extent, the ARC measure is a combination of one node’s results for three kinds of centrality which can reflect the three dimensions of the collaboration impact. Therefore, we used the ARC value of one node to represent its comprehensive collaboration impact in the cooperative network.
We define the ARC as follows:
where is the ARC value of node i; is the ranking for the DC value of node i in all nodes within the network; is the ranking for CC value of node i; is the ranking for the BC value of node i.
In order to analyze the relative strengths and weaknesses of each country and region regarding the collaboration impact, the rankings for three kinds of centrality of each node were compared, separately, with the node’s ranking of ARC. As we mentioned above, the three kinds of centrality of a node can be used to represent the three dimensions of the node’s collaboration impact. Thus, the results of the comparisons between the rankings for three kinds of centrality and the ARC ranking of typical nodes can be used to analyze their corresponding collaboration impact characteristics and location characteristics in the network. The location characteristics’ analysis model is shown in Table 2.
3. Results
3.1. Overall Status
There is a total of 45 countries and regions that have ICM international cooperation patents in the ICM industry from 2004 to 2013. The top 20 countries and regions with the most international cooperation patents are shown in Table 3. This paper defines them as typical countries and regions for international cooperation in the ICM industry and focuses on them in the following analysis. It can be seen that the USA is ranked first in the sorting. Its cooperation patent quantity is nearly four times that of Taiwan, which is ranked second; Taiwan is followed by Singapore and China. In terms of geographical distribution, the top 20 countries and regions are divided as follows; 10 in Asia, 7 in Europe, 2 in North America, and 1 (Australia) in Oceania. On the whole, Asian and European countries appeared to have more international technological cooperation output in the ICM industry.
3.2. Collaboration Pattern
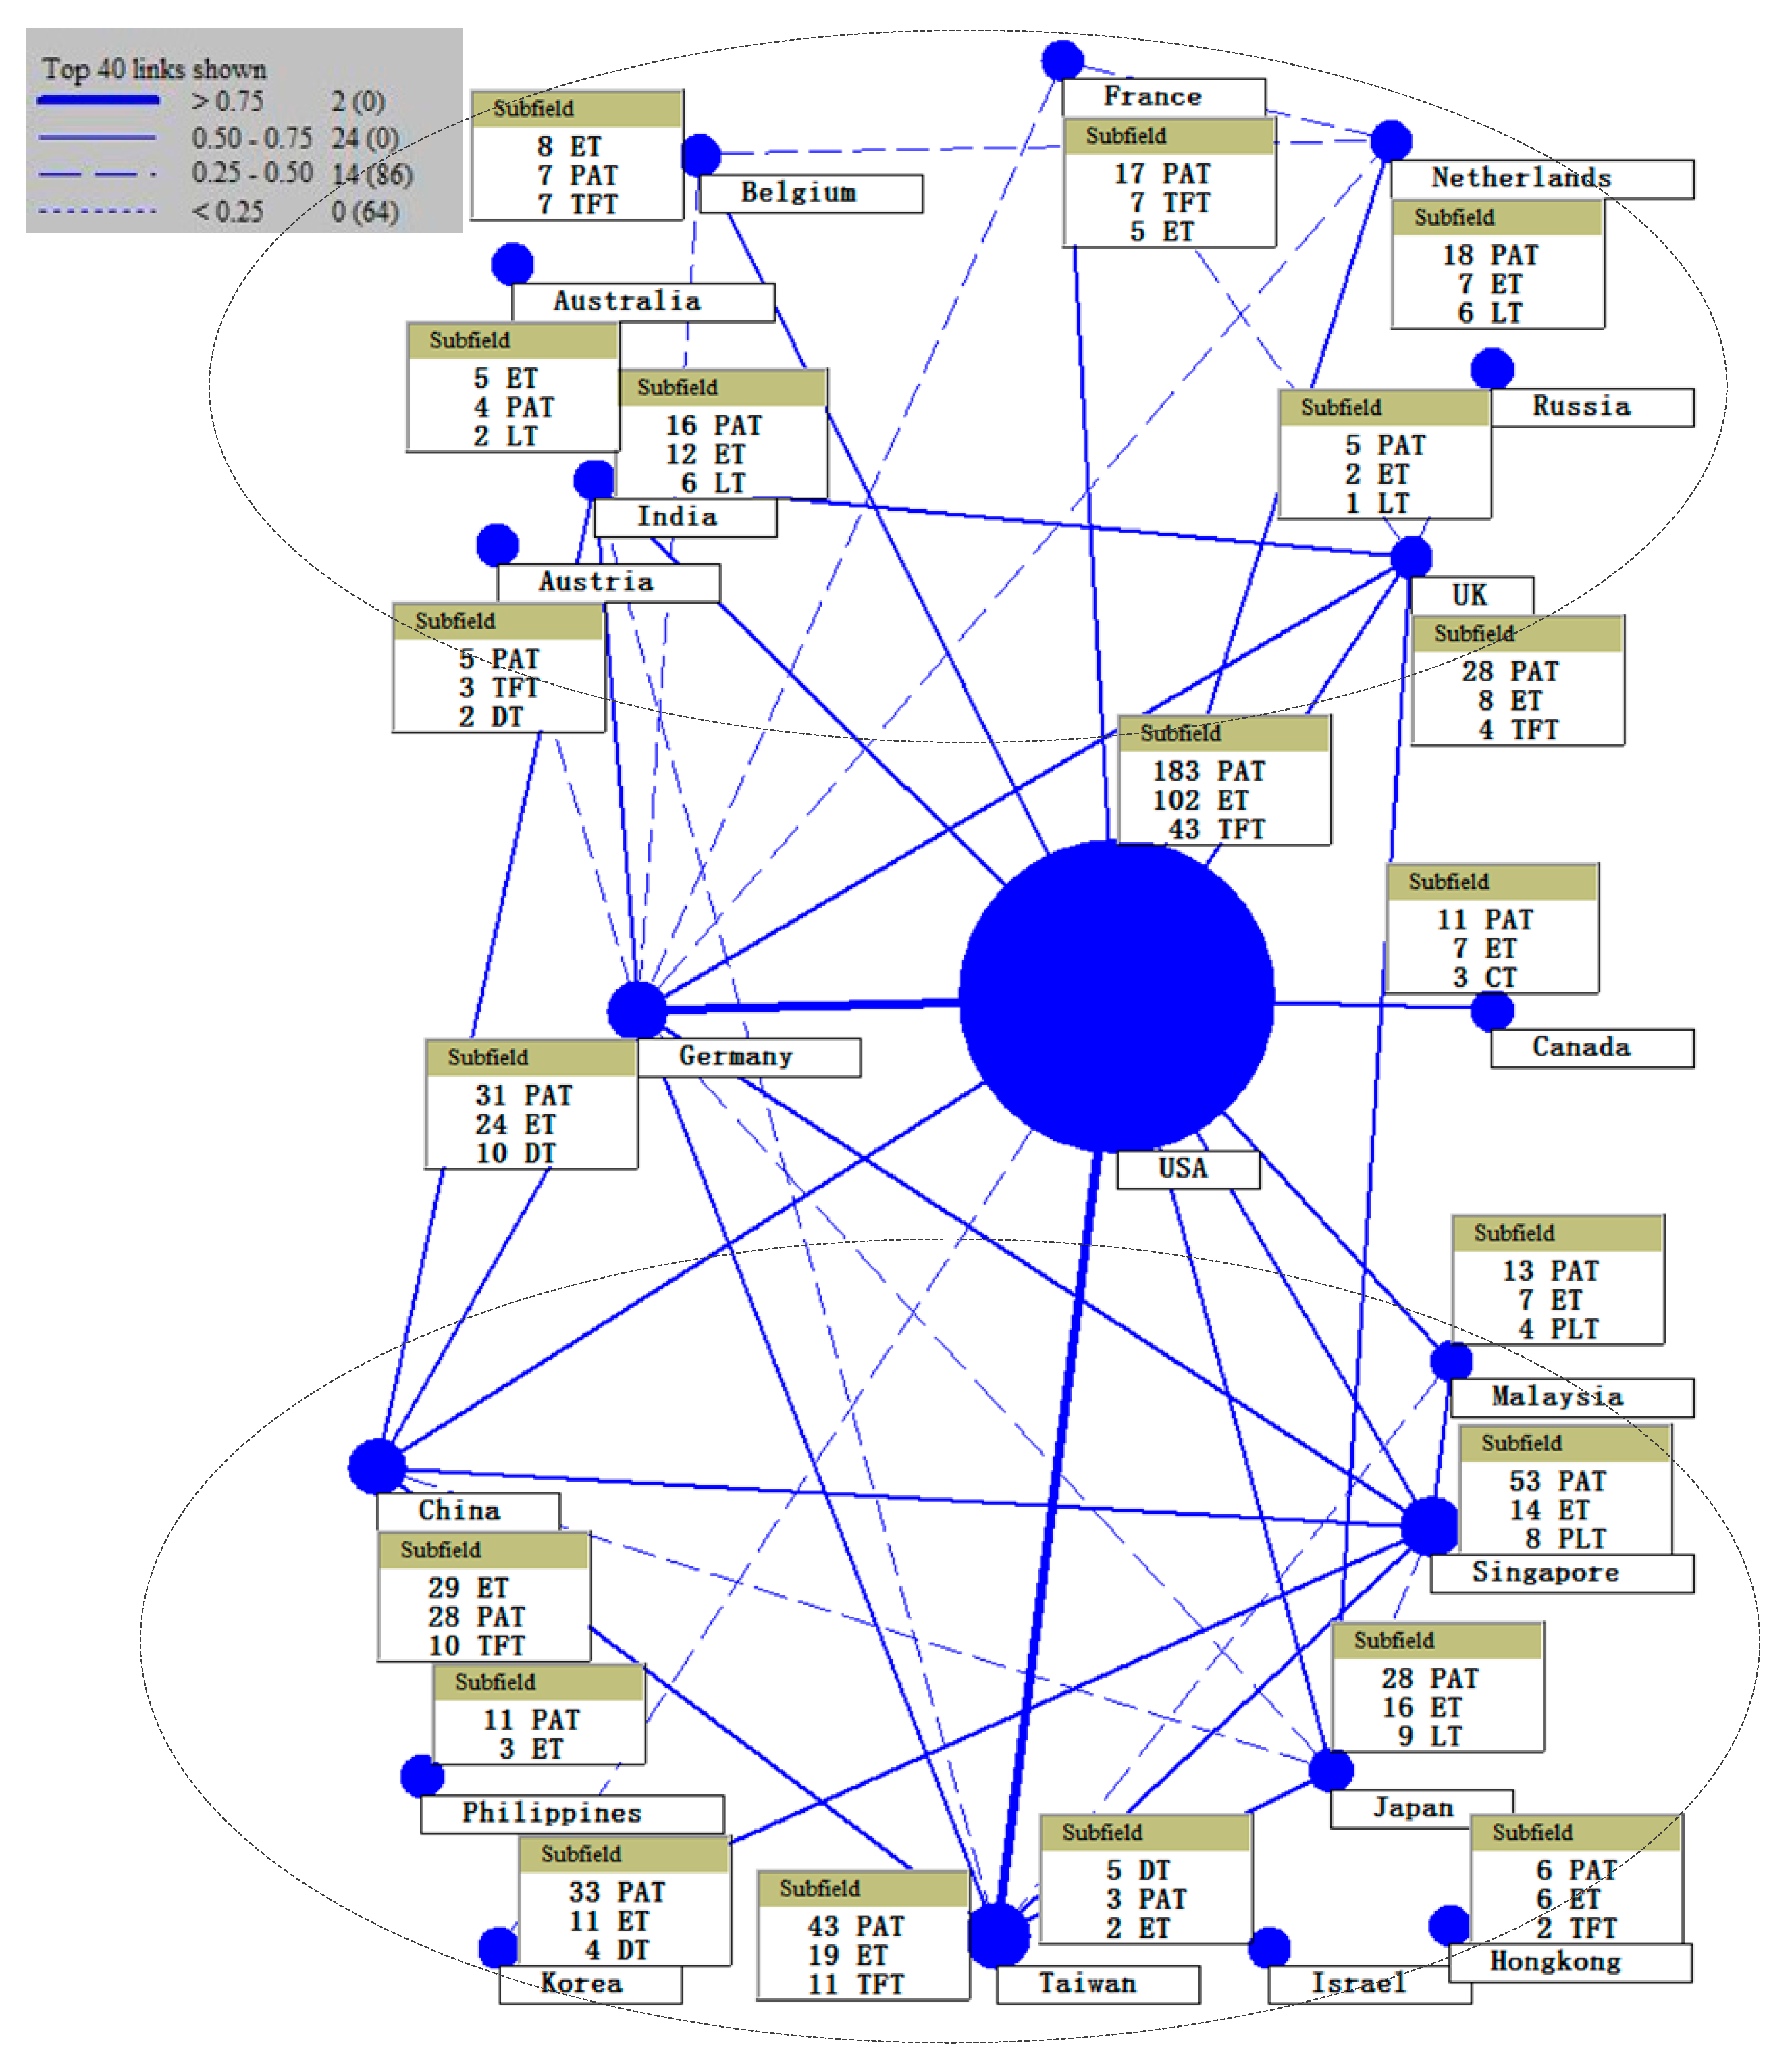
Based on all the ICM patents, the Topic Association Map was generated by the association analysis method, as shown in Figure 3. The larger the circles, the more patents there are; the thicker the lines, the stronger the relevance among them. The different meaning of various formats of connection lines are indicated in the legend on the upper left corner of Figure 3. To make the map as clear as possible, only the typical countries and regions and the top 40 connections with the strongest correlations are shown. In order to study combine with the current situation of cooperation, the top three subfields with the most collaboration patents and the exact number for each country and region are displayed around the circle.
It was observed that the USA has strong associations with almost every one of the typical countries and regions. Among them, Germany and Taiwan are the most similar to the USA. It is easier for them to have a technological cooperation with the USA in the ICM industry. In addition, it is easy to see that the map can be divided into two clusters. From the perspective of the geographical position, the top circles are mostly European countries and the remaining circles are Asian countries, and, thus, they can be called the European cluster and the Asian cluster, respectively. As can be seen in Figure 3, the two clusters show strong clustering characteristics: the associations among the internal circles of each cluster are stronger; the associations among the internal circles and the external circles are relatively weak. Germany is a notable country outside the two clusters. Although it is located in Europe, it is very similar to the Asian cluster of countries and regions. Therefore, like the USA, Germany is also a country with diversified research topics in the ICM industry that can cooperate with a number of countries and regions easily.
From the point of view of cooperative subfields, almost all the typical countries and regions have more international cooperation patents about packaging technology and etching technology. This illustrates that the internationalization level of scientists in these two subfields is higher, producing more cooperative innovation achievements. Of course, this has also a certain relationship with the rapid development of technological innovation in these two subfields. Except for these two high-yield subfields, it appeared that the European cluster tends to cooperate in subfields of lithography technology and thin film technology, while the Asian cluster tends to cooperate in subfields of planarization technology and thin film technology.
3.3. Collaboration Network
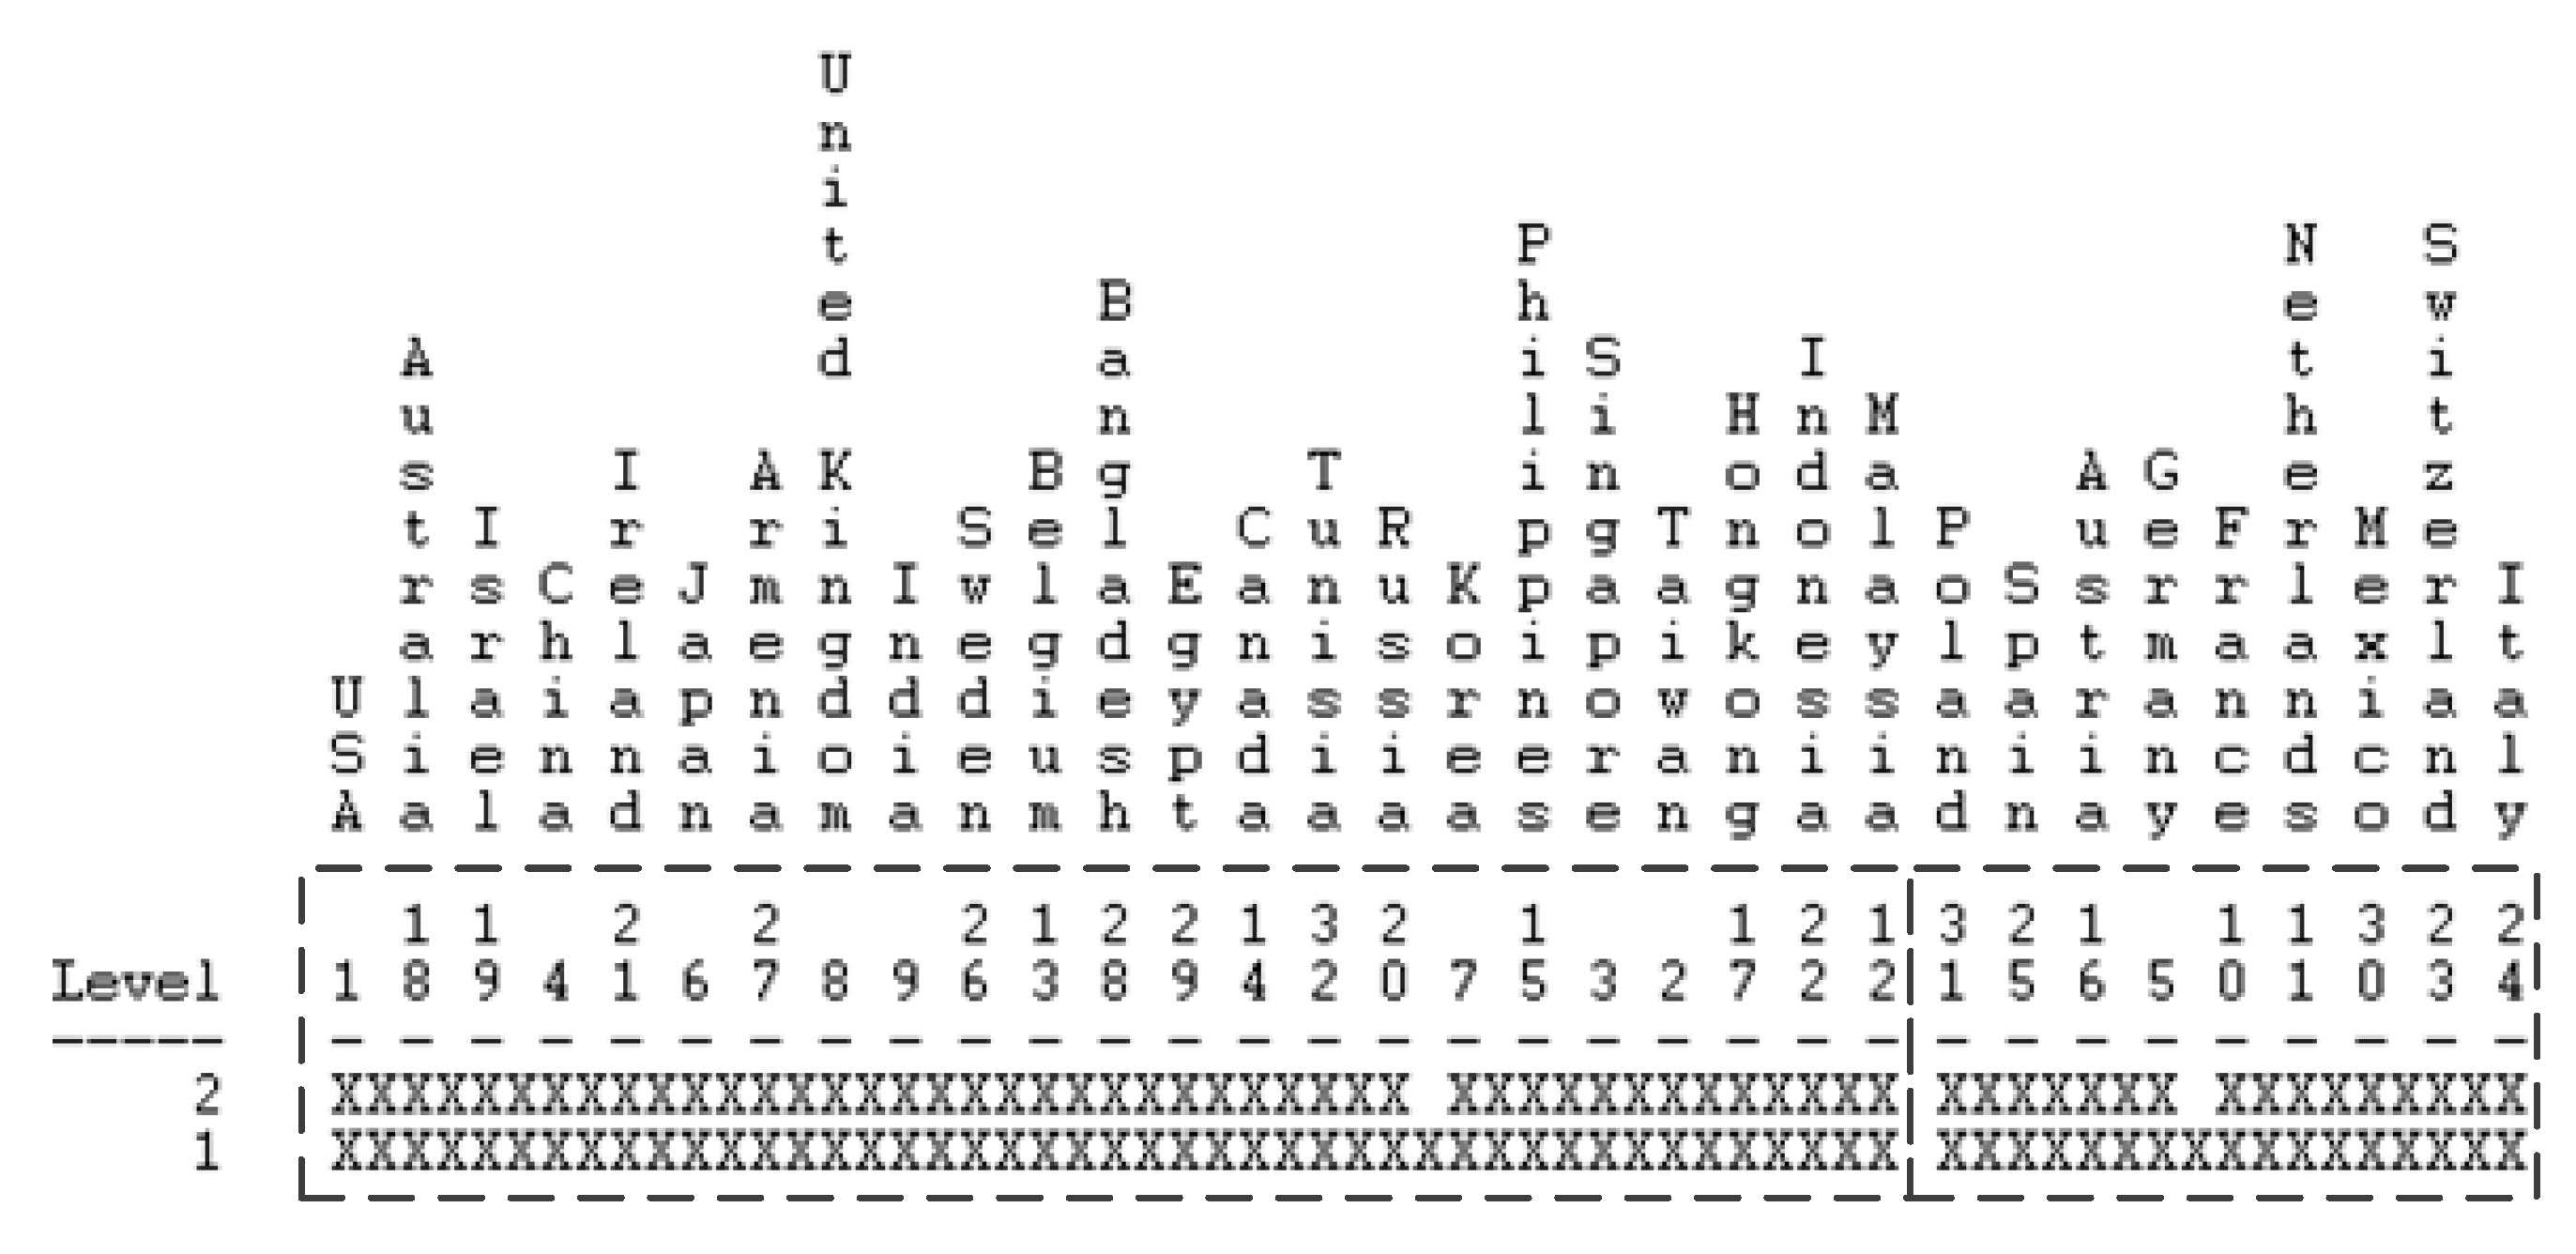
In this section, we identified the clusters in the collaboration network by the international cooperation matrix derived from the ICM international collaboration patents based on the CONCOR algorithm; the analysis results are shown in Figure 4. It can be seen from the dotted line box in the figure that the countries and regions are divided into four subgroups at the second level, and are divided into two subgroups at the first level. From the first level, the countries and regions in the left cluster are mostly in Asia, while the countries in the right cluster are all in Europe, with the exception of Mexico.
We then created the ICM international cooperation network map by using the international cooperation matrix. In order to see the position of all countries and regions in the ICM cooperation network more clearly, Figure 5 was created with the Ucinet software using Gower Metric Scaling, with the main principle that linked nodes plotted adjacent to each other and non-linked nodes pushed apart [70]. As shown in Figure 5, the larger the nodes, the higher the number of international collaboration patents; the thicker the line, the more the patents that inventors from two different countries or regions co-invented. It can be seen that the cooperation network map can be divided into two subgroups, as shown by the dotted-line circle. The nodes in the upper circle are mostly located in Asia, while the nodes in the lower circle are mostly located in Europe. By comparing the outcomes of CONCOR clustering in Figure 4 and the cooperative network map in Figure 5, we found that, although two different methods were adopted, the results were quite consistent: Asia and Europe both showed an obvious characteristic of clustering in international technological cooperation.
From the point of view of the location of nodes in the network map, the USA occupies the core position in the network. The inventors from the USA have co-invented patents with inventors from 43 of the 44 countries and regions in the network. Also, almost all of the thickest connecting lines are related to the USA in the network map; relationships with China, Taiwan, Germany, and Japan are the closest. The technological cooperation of USA with China and Germany is mainly focused on the subfields of etching technology and packaging technology, whereas the cooperation with Japan and Taiwan is mainly focused on the packaging technical subfield. In addition, India, China, Taiwan, Korea, Singapore, and Germany all have cooperative links with multiple nodes in their respective cluster, therefore they are active nodes.
3.4. Collaboration Institution
The patent outputs of institutions are the basis for a country or region to own patents [54]. This section explains the current situation of the ICM international technological cooperation through an analysis at the institutional level. Table 4 shows the top 20 high-yield institutions in ICM international collaboration patents. Among them, the USA has the most of the top 20 high-yield institutions. Furthermore, it can be seen that 19 of them are enterprises, so enterprises are the major force driving the ICM international technological cooperation.
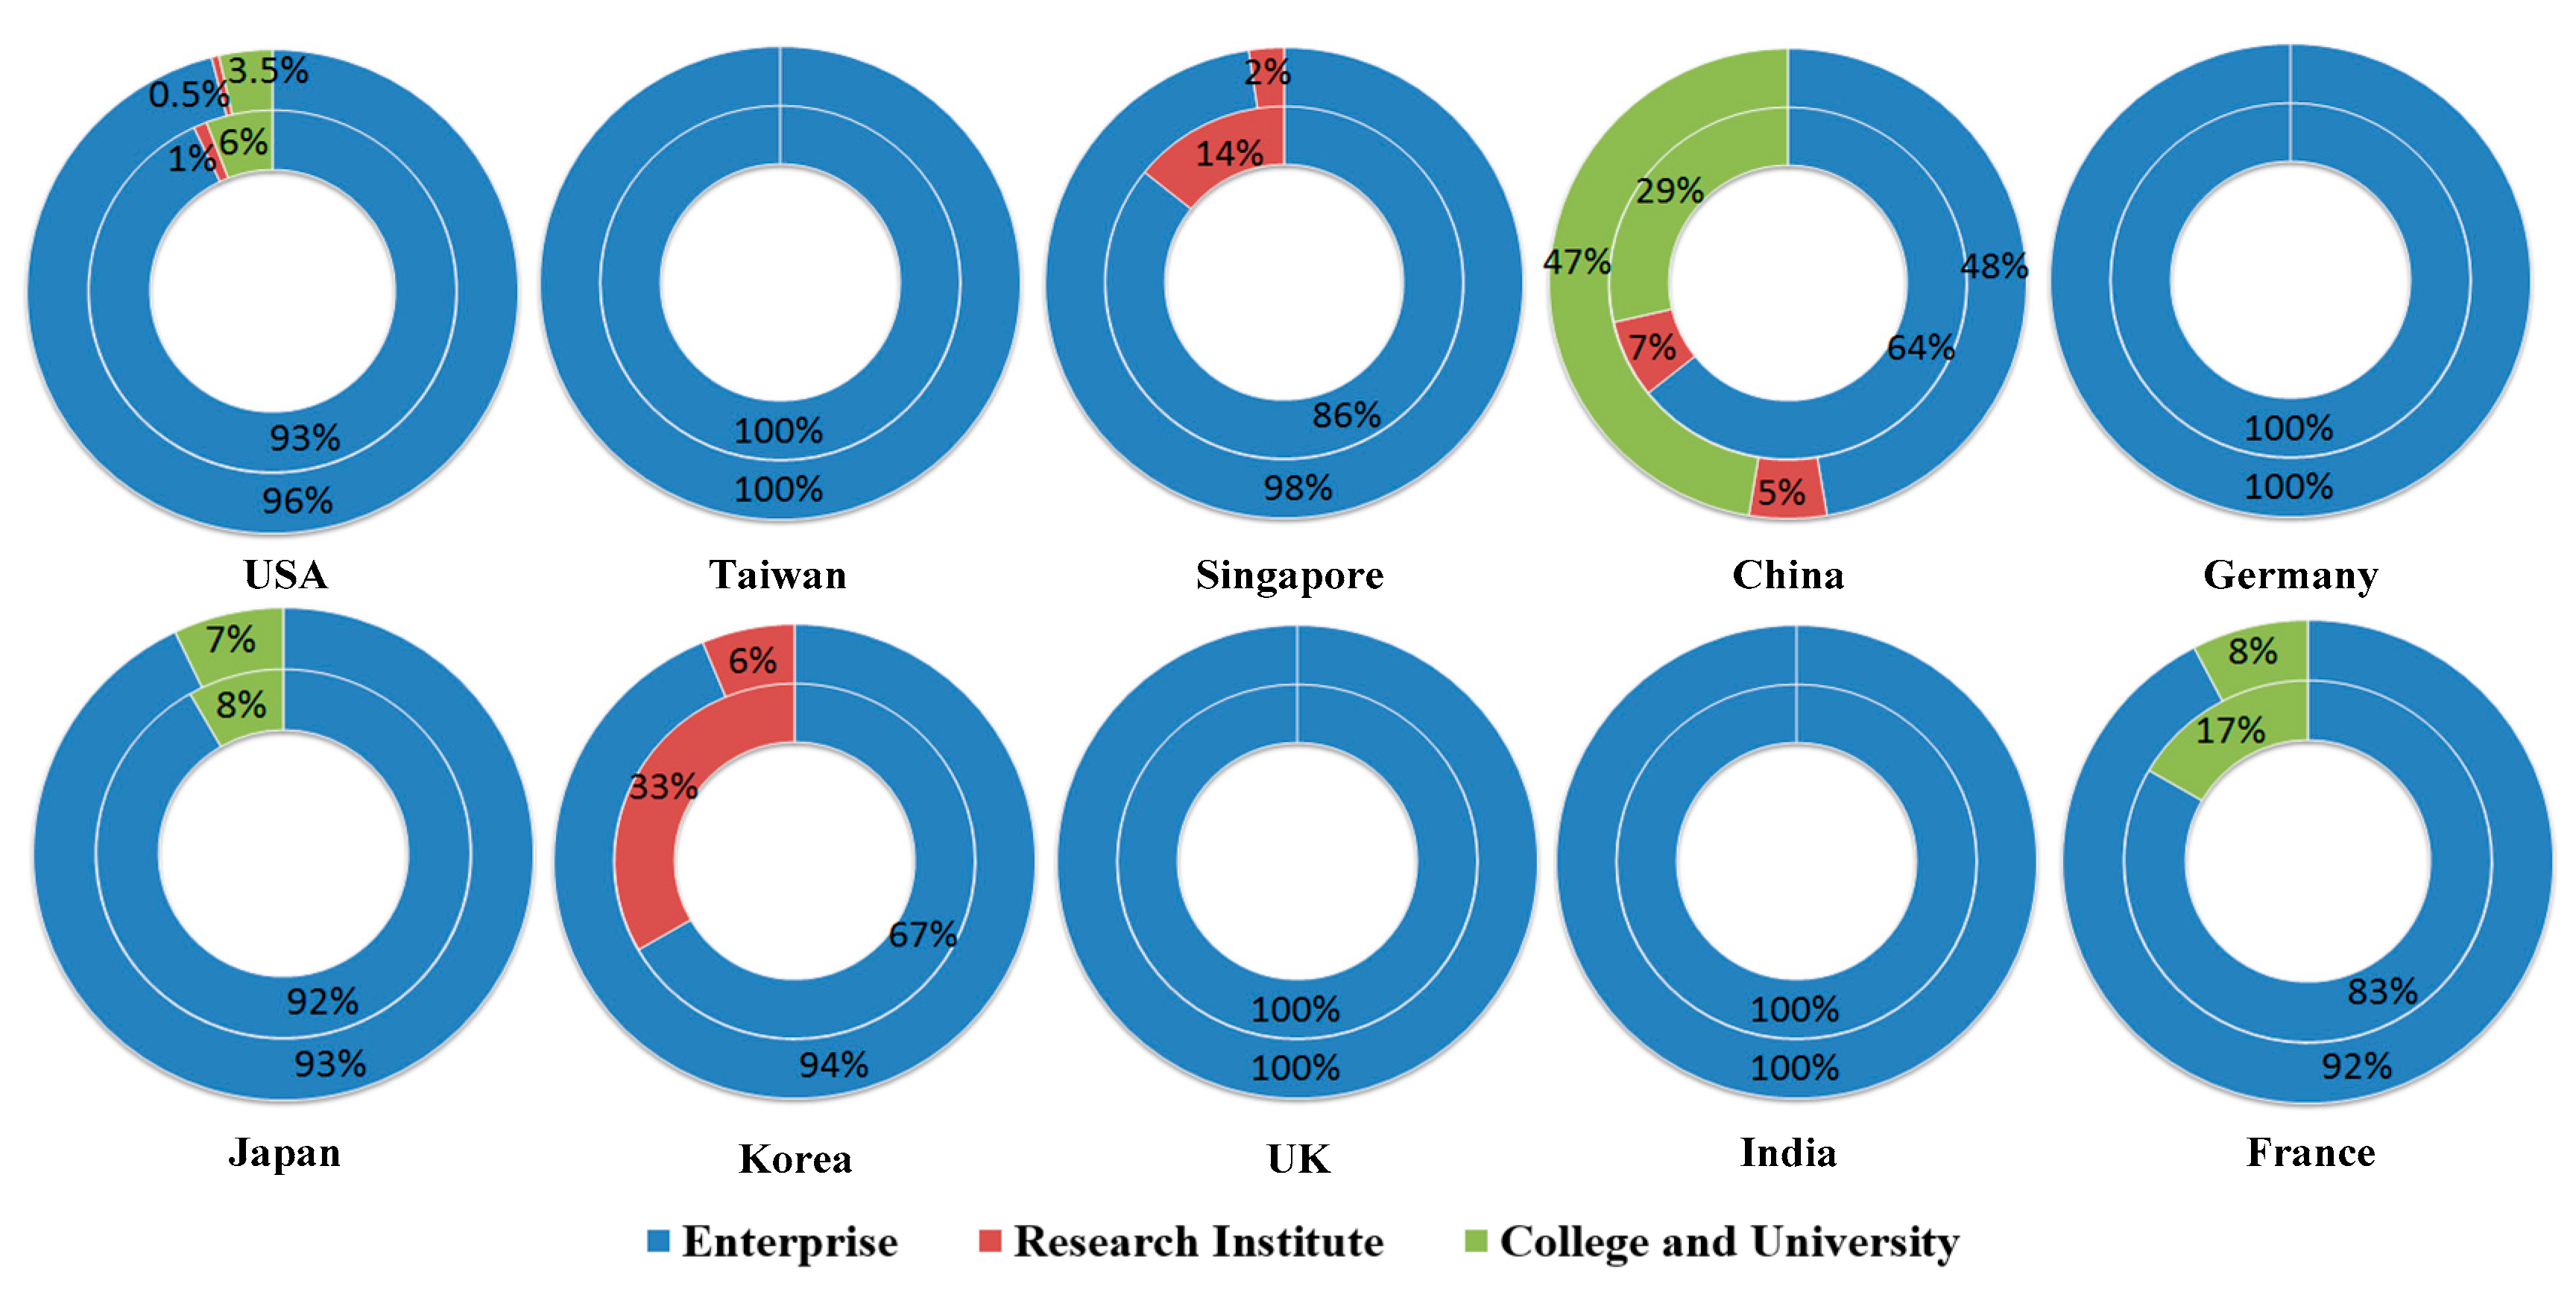
Subsequently, the type distribution of institutions owning ICM international collaboration patents in the top 10 countries and regions with the most international cooperation patents was analyzed, as shown in Figure 6. It can be seen that the distribution characteristics of the inner and outer circular rings of these countries and regions are basically consistent, apart from Korea, Singapore, and China. In Singapore and Korea, the average number of patents owned by research institutions is smaller than the average number of patents owned by companies, which means that the technological output of international cooperation for their research institutions is not as significant as that of their enterprises. Relatively speaking, the average number of patents owned by China’s enterprises is smaller than the average number of patents owned by China’s colleges and universities. Compared to enterprises, some universities in China have more international collaboration patents.
The top 10 countries and regions can be divided into four groups according to Figure 6. The first group includes Taiwan, Germany, the United Kingdom, and India. Their international cooperation patents are all owned by enterprises, which means that enterprises dominate the ICM international technological cooperation in these countries and regions. The second group includes Singapore and Korea. Most of their patents belong to enterprises, and the rest belong to research institutions. The third group includes the USA, Japan, and France. The majority of the international cooperation patents in these countries are owned by enterprises, but colleges and universities have also achieved some results. The last group includes only China, where China’s enterprises, colleges, and universities are the dominant force in international technological cooperation. Beyond that, research institutions also share part of the international cooperation output.
3.5. Collaboration Impact
According to the formula discussed in Section 2.4.2, the three kinds of centrality and ARC values of the typical countries and regions in the ICM international cooperation network were calculated separately, and their rankings were also given, as shown in Table 5. It can be seen that the ARC of the USA ranked first for all countries, which also confirms the core position of the USA in the network. In terms of geographical distribution, the ARC-rank for the top 20 countries and regions includes 10 countries or regions in Asia, 8 in Europe, and 2 in North America. Overall, the countries and regions in Asia and Europe have not only many technological cooperation outputs, but also a great impact on the international cooperation network. Therefore, Asia and Europe are very successful in ICM international technological cooperation.
Next, the rankings of each node for the three centralities were compared to the node’s ARC ranking. If the ranking of a centrality was higher than the ARC ranking, we used H to denote the centrality of the node (represented in Table 6 by a solid circle); in contrast, L was used to denote a centrality lower than the ARC ranking (represented by an open circle). Thus, according to the different characteristics of the collaboration impact in three dimensions, the countries and regions could be divided into eight categories. Based on the international cooperation network and location characteristics analysis model, three of these categories were analyzed in detail in the following subsections.
(1) HHH
This category of node has more direct cooperation objects and a close indirect relationship with most of the other nodes in the network. In addition, because of the scarce relationship with some conservative collaborative nodes, HHH nodes can control the transmission of technology information to a certain extent. As seen in Table 6, the USA, India, and Germany are categorized as this type of node; they are ranked in the forefront of the three centralities and ARC. In the network, the USA is the core node; India and Germany are active nodes in the cluster of Asian and European clusters and have cooperative relationships with many nodes outside the cluster. Moreover, some of their connections have monopolized the transmission of technological information among the “conservative” nodes and others; this regards, for example, the connections between the USA and Egypt, the USA and Norway, India and Bulgaria, India and Sultan, Germany and Turkey, Germany and Poland, etc. The common features of an HHH node include a wide range of direct impact, faster impact spread speed, and greater impact strength.
(2) HHL
According to Table 2, there is usually a direct cooperation among the partners of an HHL node, which makes the cooperative relation usually regarded as redundant by its connected nodes. In addition, an HHL node is close to a lot of nodes, but other nodes are close to others. Taiwan, Singapore, China, Japan, Korea, the United Kingdom, Malaysia, Hong Kong, and Israel belong to the HHL category. They are both active nodes in the Asian cluster according to the analysis of the collaboration network section, and have direct connections with many nodes in the Asian cluster (because of the characteristics of the cluster cooperation, there is usually a connection among its connected nodes); they also have a direct cooperation with active nodes of the European cluster, so they are very close to most of the nodes in the network, but cannot control the transmission of technological information effectively. Among these countries and regions, the characteristics of China are especially evident. China connects most of the nodes in the Asian cluster. In addition, it also connects with the USA and Germany. Overall, an HHL node can be called a cross-cluster node. This category of nodes has a large direct impact range and a faster information propagation speed, but because its cooperation relationship is regarded as redundant, the impact strength is weak.
(3) HLL
On the basis of the analysis model mentioned in Table 2, an HLL node is directly connected to multiple nodes that are all in the same cooperative cluster, and the cluster is far away from the other nodes in the network. This leads to the average distance among it and the other nodes in the network as being very large. In addition, because of the characteristics of the cluster cooperation, its cooperative relations are also regarded as redundant by its connected nodes. An HLL node can be termed a within-cluster node. The Philippines, Russia, and Canada belong to the within-cluster node category, and the characteristics of the Philippines are particularly prominent. Although the Philippines has a lot of connected nodes, all these connected nodes are located in the Asia cluster except for the node representing the USA, which makes the Philippines far from the European cluster nodes. In general, a within-cluster node has a wide range of direct impact, but has a low information propagation speed and a weak impact strength.
4. Conclusions and Discussion
(1) In regard to international technological collaboration in the ICM industry, the USA has the highest level in the world; Germany has great potential for future development.
First, the USA has the largest number of patents, international collaboration patents, and top 20 high-yield institutions for international collaboration in the ICM industry worldwide. It is also located at the core position of the topic association map and collaboration network. In addition, the USA has the greatest comprehensive impact and possesses the characteristics of a wide range of direct impact, fast impact spread speed, and great impact strength. Thus, it can be said that the USA has the highest level in the world.
Second, Germany is the country most similar to the USA in the distribution of research topics, and also has similarities with numerous countries and regions in the research topics. In addition, Germany is a HHH node. In the future, Germany should not only strengthen the technological collaboration with the USA to further enhance its technological level by taking advantage of the similarities with the USA in research themes, but also seek technological collaborations with many countries and regions that are similar to it in the technology direction, so as to utilize many external technological knowledge resources on the basis of a wide range of direct impact, fast impact spread speed, and great impact strength. Therefore, Germany has great potential for future development.
(2) There are obvious clustering patterns in Asia and Europe, respectively, in the collaboration network. The nodes within these two clusters should further play the role of the innovation cluster.
The countries and regions in Asia and Europe show, separately, an obvious trend of clustering in the international cooperation network map. Asia and Europe are also successful in the ICM international technical cooperation. Furthermore, on the basis of the analysis of the collaboration pattern, the topic association map can also be divided into two clusters in Asia and Europe. The consistency of the research direction could promote the technical cooperation among countries and regions within a cluster and accelerate the process of agglomeration in the international cooperation network [20].
Therefore, the node within the Asian or European cluster should take advantage of the convergence in research themes inside the collaboration cluster to further play the role of the innovation cluster [71]. For example, in addition to the two high-yield subfields of packaging technology and etching technology, European nodes should focus on the further development of collaboration in the subfields of lithography technology and thin film technology, while Asian nodes should focus on the collaboration in the subfields of planarization technology and thin film technology.
(3) At the same time that the enterprises operate as a major force, research institutions, colleges, and universities of each country and region should also actively participate in international collaboration to improve the level of ICM international technological collaboration.
Although the enterprises have always been the dominant power in promoting the international collaboration in the ICM industry, the types of institutions that owned international collaboration patents in typical countries and regions are different. This means that there are differences in the type of institutions that are actually engaged in international collaboration among countries and regions [72]. For example, only enterprises that participated in international collaboration in Taiwan, Germany, the United Kingdom, and India, while universities in the USA, Japan, and France, and research institutions in Korea and Singapore also carried out some international collaboration activities.
In general, China has the most complete structure for its institution type. China’s enterprises, research institutions, colleges, and universities have all participated in international collaborations. Some studies found that the industry–academy collaboration can not only promote the increase in the number of collaboration patents [73,74], but it can also improve the patent value and quality [75]. Although China’s international collaboration output in the ICM industry is still lagging behind that of the USA, we think the gap is most likely due to the difference in ICM patent numbers between the USA and China. This is because if a country has more patents, other countries will be more willing to cooperate with it [54], and the number of its own patents also affects its international collaboration output positively in each collaborative relationship [21]. Therefore, we recommend that the research institutions, colleges, and universities of each country and region (especially for Taiwan, Germany, the United Kingdom, and India) should participate in international collaboration actively, while the enterprises operate as the major force. And the industry–academy collaboration will play a facilitating role in improving the level of ICM international technological collaboration.
Despite our careful analysis and resulting outcomes, this work still suffers from several limitations and weaknesses. First, this paper analyzes ICM international technical cooperation based on the international co-inventor of patents, but the inventor cooperative information in patents cannot reflect the international technological collaboration accurately. Above all, the patent has limitations when it is used as a measure of innovation. This is because in the ICM industry, where the pace of technology is rapid, and firms advance quickly utilizing the innovations made by others, firms may patent for strategic reasons [16,36]. For example, firms in this industry are likely to build larger portfolios for their own “legal rights to exclude”, to reduce the holdup problem posed by external patent owners and enable firms to negotiate access to external technologies on more favorable terms [76]. In general, the innovation level of patent rights may vary widely among firms over time, even within one industry. Therefore, patents cannot measure innovation effectively in the case that the patent quality is not considered. Furthermore, the inventor cooperative information in patents can also only reflect part of the international technical cooperation. For example, technology transformation, expert visits, R&D organization co-building, academic exchange meetings, etc., also contribute to international technical cooperation.
Second, based on the concrete calculation method of the three kinds of centrality, we regarded the centralities as three separate dimensions of the collaboration impact: direct impact range, impact propagation speed, and impact strength; however, this may not be accurate. This is because a high CC does not necessarily indicate that the country or region can receive and send the technical information in the network more quickly. With the acceleration of globalization, there is a variety of ways to exchange technical information. In addition, a high BC is usually due to the cooperation with conservative collaborative nodes, but the actual correlation among this cooperation and the country or region’s impact strength is not as strong as often supposed. Moreover, the three kinds of centrality do not take into account the weight of the collaboration relationships—they only measure the two-valued collaboration matrices. Therefore, they cannot fully reflect the collaboration impact characteristics of nodes in the three dimensions. As Freeman [68] said, it remains to be seen how well each of them will stand up in the light of further empirical work in this area.
Third, the classification of the collaboration impact of a typical node was derived from the comparative analysis of its rankings for three kinds of centrality based on its ARC ranking. In a sense, this is a comparison between a typical node and itself. Because the nodes both had similar rankings for the three kinds of centralities (as shown in Table 5), this comparison could reasonably categorize the country or region more effectively compared to other methods (e.g., the comparison based on the average value of centrality among the typical countries and regions). Although this may cause some countries which have a similar value for three kinds of centralities to be categorized into two different groups (e.g., the United Kingdom is HHL and India is HHH), we could see the relative strengths and weaknesses of each country and region more clearly in the three dimensions of the collaboration impact through this analysis, and thus draw the collaboration impact characteristics more accurately.
There are various avenues for future research. An important research question to be answered is how to find more accurate international technical cooperation information. How do we take patent quality into account, and how do we analyze other types of technological collaboration information? We believe that big data analytics can be used for collecting, transforming, and analyzing different types of raw data about international technological collaboration. For instance, more technological information could be available from patent data by big data analytics [77]. This is our key research direction for the future. In addition, it would be worthwhile to investigate how to improve the measurement method of the three kinds of centrality. How do we make the characteristics reflected by each centrality more obvious, and how do we highlight the weight of the collaboration relationship? Of course, the most important thing is how to combine this research with the actual situation, find the reasons behind the characteristics, and further play the role of knowledge management on the basis of patent analysis.
In summary, this paper studies the international technological collaboration characteristics of the ICM industry from four aspects: collaboration pattern, collaboration network, collaboration institution, and collaboration impact. Through research on these four aspects, we attempted to understand the characteristics from three points of view: development potential, current situation, and consequence. Based on the analysis from these three angles, this paper reveals the advantages and disadvantages of countries and regions for international technological collaboration in the ICM industry, puts forward some suggestions, and provides an objective reference for policy making, competitiveness, and sustainability. Specifically, through this paper, the policymakers of all countries and regions and the decision makers of different institutions can better understand the technological collaboration characteristics of the global ICM industry; they can recognize and implement their own advantages; they can identify technology partners who have a strong technical force and collaboration potential; they can refer to the specific recommendations given. Based on the above measures, they will further enhance their international technological collaborations. This will enable a country, a region, or an institution to enhance its technological level, innovation efficiency, and competencies to sustainably develop in the global ICM industry according to the elaboration in Section 1. It is also worth noting that, so far, no scholars have studied the international technological collaboration based on these three perspectives. The research framework of this paper provides a new research approach for the future research of industrial international collaboration based on patent analysis. It could also be applied to analyze the international technological collaboration of other industries and to provide assistance for the purpose of sustainable development in other industries.
Acknowledgments
The paper was funded by the National Natural Science Foundation of China (No. 71573017, No. 71603019 and No. 71273030). We are thankful for the suggestions and efforts from the experts and editors.
Author Contributions
The manuscript was approved by all authors for publication. Yun Liu, Zhe Yan, and Xuanting Ye conceived and designed the study; Zhe Yan and Xuanting Ye collected the data; Yun Liu, Zhe Yan, and Xuanting Ye analyzed the data; Yun Liu and Zhe Yan wrote the paper. Zhe Yan, Xuanting Ye, and Yijie Cheng reviewed and edited the manuscript.
Conflicts of Interest
The authors declare no conflict of interest.
Appendix A

Table A1.
Retrieval Strategy for ICM Patents.
| Technical Subfields | Patent Retrieval Strategy |
|---|---|
| Cleaning Technology | TS = ((IC OR “integrated circuit*” OR semiconductor) AND (cleaning* OR “plasma cleaning” OR “plasma-cleaned” OR (megasonic* AND cleaning) OR “laser cleaning” OR “laser-clean*”)) |
| Lithography Technology | TS = ((IC OR “integrated circuit*” OR semiconductor) AND (“lithograph*” or (X-ray AND lithograph*) OR XRL OR ((FIB OR “focused ion beam” OR “focused-ion-beam”) AND (Lithograph* OR FIBL)) OR ((EUV OR “extreme ultraviolet lithography” OR “extreme-ultraviolet-lithography”) AND (lithograph* OR EUVL)) OR NIL OR “nanoimprint lithography” OR “nanoimprint-lithography” OR EPL OR “electron projection lithograph*” OR “electron-projection-lithograph*”)) |
| Etching Technology | TS = ((IC OR “integrated circuit*” OR semiconductor) AND (“etch*” OR “wet chemical etching” OR “plasma etching” OR PE OR “reactive ion etching” OR RIE OR “inductively coupled plasma etching” OR ICP)) |
| Thin Film Technology | TS = ((IC OR “integrated circuit*” OR semiconductor) AND (“thermal-oxidated” OR “thermal oxidation” OR “physical vapor deposition” OR “physical-vapor-deposition” OR PVD OR “chemical vapor deposition” OR “chemical-vapor-deposition” OR CVD OR electroplate OR “epitax*” OR “vapor phase epitax*” OR “vapor-phase-epitax*” OR VPE OR “molecular beam epitax*” OR “molecular-beam-epitax*” OR MBE OR “complementary metal oxide semiconductor”)) |
| Doping Technology | TS = ((IC OR “integrated circuit*” OR semiconductor) AND (“ion-implant*” OR “ion implant*” OR diffusion)) |
| Annealing Technology | TS = ((IC OR “integrated circuit*” OR semiconductor) AND (“anneal*” OR “rapid thermal anneal*” OR “rapid-thermal-anneal*” OR RTA OR “laser anneal*” OR “laser-anneal*”)) |
| Planarization Technology | TS = ((IC OR “integrated circuit*” OR semiconductor) AND (polish* OR “chemical mechanical polish*” OR “chemical-mechanical-polish*” OR CMP OR “stress-free polish*” OR “stress free polish*” OR SFP)) |
| Packaging Technology | TS = ((IC OR “integrated circuit*” OR semiconductor) AND (“interconnect*” OR “Cu interconnect*” OR “copper interconnect*” OR “low k dielectric*” OR “optical interconnect*” OR “carbon nanotube*” OR CNT OR “through silicon via” OR TSV OR “packag*” OR “ball grid array” OR “ball-grid-array” OR BGA OR “chip size package” OR “chip-size package” OR CSP OR “multi chip package” OR “multi-chip package” OR MCP OR “wafer level package” OR “wafer-level package” OR WLP OR “flip chip packag*” OR “flip-chip packag*” OR “product in packag*” OR “product-in packag*” OR PIP OR “system on packag*” OR “system in packag*” OR SIP OR SOP OR “3D packag*” OR “pin gird array package*” OR “pin-gird-array packag*” OR PGA)) |
References
- Wu, X.B.; Dou, W.; Wang, Y.Q. China’s ICT Industry: Catch-Up Trends, Challenges and Policy Implications. China Int. J. 2013, 11, 117–139. [Google Scholar]
- Lee, T.L.; Tunzelmann, N. A dynamic analytic approach to national innovation systems: The IC industry in Taiwan. Res. Policy 2005, 34, 425–440. [Google Scholar] [CrossRef]
- Fuller, D.B. China’s national system of innovation and uneven technological trajectory The case of China’s integrated circuit design industry. Chin. Manag. Stud. 2009, 3, 58–74. [Google Scholar] [CrossRef]
- Zhong, R.Y.; Huang, G.Q.; Lan, S.; Dai, Q.; Chen, X.; Zhang, T. A big data approach for logistics trajectory discovery from RFID-enabled production data. Int. J. Prod. Econ. 2015, 165, 260–272. [Google Scholar] [CrossRef]
- Hashem, I.A.T.; Chang, V.; Anuar, N.B.; Adewole, K.; Yaqoob, I.; Gani, A.; Ahmed, E.; Chiroma, H. The role of big data in smart city. Int. J. Inf. Manag. 2016, 36, 748–758. [Google Scholar] [CrossRef]
- Wang, G.; Gunasekaran, A.; Ngai, E.W.; Papadopoulos, T. Big data analytics in logistics and supply chain management: Certain investigations for research and applications. Int. J. Prod. Econ. 2016, 176, 98–110. [Google Scholar] [CrossRef]
- Cheyre, C.; Kowalski, J.; Veloso, F.M. Spinoffs and the ascension of Silicon Valley. Ind. Corp. Chang. 2015, 24, 837–858. [Google Scholar] [CrossRef]
- Group, E.L. A European Industrial Strategic Roadmap for Micro- and Nano-Electronic Components and Systems: Implementation Plan; European Commission: Brussels, Belgium, 2014.
- Rasiah, R.; Kong, X.X.; Lin, Y. Innovation and learning in the integrated circuits industry in Taiwan and China. J. Asia Pac. Econ. 2010, 15, 225–246. [Google Scholar] [CrossRef]
- China’s State Council. Outline of Development of National Integrated Circuit Industry; China’s State Council: Beijing, China, 2014.
- Kong, X.X.; Zhang, M.; Ramu, S.C. China’s semiconductor industry in global value chains. Asia Pac. Bus. Rev. 2016, 22, 150–164. [Google Scholar] [CrossRef]
- Levitas, E.F.; McFadyen, M.A.; Loree, D. Survival and the introduction of new technology: A patent analysis in the integrated circuit industry. J. Eng. Technol. Manag. 2006, 23, 182–201. [Google Scholar] [CrossRef]
- Tsai, B.H.; Li, Y.M. Cluster evolution of IC industry from Taiwan to China. Technol. Forecast. Soc. 2009, 76, 1092–1104. [Google Scholar] [CrossRef]
- Corsino, M.; Passarelli, M. The competitive advantage of business units: Evidence from the integrated circuit industry. Eur. Manag. Rev. 2009, 6, 182–194. [Google Scholar] [CrossRef]
- Chen, L.; Xue, L. Global Production Network and the Upgrading of China’s Integrated Circuit Industry. China World Econ. 2010, 18, 109–126. [Google Scholar] [CrossRef]
- Hall, B.H.; Ziedonis, R.H. The patent paradox revisited: An empirical study of patenting in the US semiconductor industry, 1979–1995. RAND J. Econ. 2001, 32, 101–128. [Google Scholar] [CrossRef]
- Kapoor, R.; Mcgrath, P.J. Unmasking the interplay between technology evolution and R&D collaboration: Evidence from the global semiconductor manufacturing industry, 1990–2010. Res. Policy 2014, 43, 555–569. [Google Scholar]
- Liu, X.P.; Xu, Q.; Ning, F.; Wang, H. A summary of the current development of developing technology in the field of integrated circuit manufacturing. ACSR Adv. Comput. 2015, 15, 1333–1340. [Google Scholar]
- Ernst, D. Global production networks and the changing geography of innovation systems. Implications for developing countries. Econ. Innov. New Technol. 2002, 11, 497–523. [Google Scholar] [CrossRef]
- Wang, X.F.; Ren, J.; Zhang, Y.; Zhu, D.H.; Qiu, P.J.; Huang, M. China’s patterns of international technological collaboration 1976–2010: A patent analysis study. Technol. Anal. Strateg. 2014, 26, 531–546. [Google Scholar] [CrossRef]
- Prato, G.D.; Nepelski, D. Global technological collaboration network: Network analysis of international co-inventions. J. Technol. Transf. 2014, 39, 358–375. [Google Scholar] [CrossRef] [Green Version]
- Hottenrott, H.; Lopesbento, C. (International) R&D collaboration and SMEs: The effectiveness of targeted public R&D support schemes. Res. Policy 2014, 43, 1055–1066. [Google Scholar]
- Chang, Y.C. Benefits of co-operation on innovative performance: Evidence from integrated circuits and biotechnology firms in the UK and Taiwan. R&D Manag. 2003, 33, 425–437. [Google Scholar]
- Guan, J.C.; Chen, Z.F. Patent collaboration and international knowledge flow. Inf. Process. Manag. 2012, 48, 170–181. [Google Scholar] [CrossRef]
- Zheng, J.; Zhao, Z.Y.; Zhang, X.; Chen, D.Z.; Huang, M.H. International collaboration development in nanotechnology: A perspective of patent network analysis. Scientometrics 2014, 98, 683–702. [Google Scholar] [CrossRef]
- Singh, J. Distributed R&D, cross-regional knowledge integration and quality of innovative output. Res. Policy 2008, 37, 77–96. [Google Scholar]
- Quist, J.; Tukker, A. Knowledge collaboration and learning for sustainable innovation and consumption: Introduction to the ERSCP portion of this special volume. J. Clean. Prod. 2013, 48, 167–175. [Google Scholar] [CrossRef]
- Chen, H.-W. Gallium, indium, and arsenic pollution of groundwater from a semiconductor manufacturing area of Taiwan. Bull. Environ. Contam. Toxicol. 2006, 77, 289–296. [Google Scholar] [CrossRef] [PubMed]
- Lin, A.Y.-C.; Panchangam, S.C.; Lo, C.-C. The impact of semiconductor, electronics and optoelectronic industries on downstream perfluorinated chemical contamination in Taiwanese rivers. Environ. Pollut. 2009, 157, 1365–1372. [Google Scholar] [CrossRef] [PubMed]
- Narin, F.; Hamilton, K.S. Bibliometric performance measures. Scientometrics 1996, 36, 293–310. [Google Scholar] [CrossRef]
- Meyer, M.; Persson, O. Nanotechnology—Interdisciplinarity, patterns of collaboration and differences in application. Scientometrics 1998, 42, 195–205. [Google Scholar] [CrossRef]
- Chen, N.; Liu, Y.; Cheng, Y.J.; Liu, L.; Yan, Z.; Tao, L.X.; Guo, X.H.; Luo, Y.X.; Yan, A.S. Technology Resource, Distribution, and Development Characteristics of Global Influenza Virus Vaccine: A Patent Bibliometric Analysis. PLoS ONE 2015, 10, e0136953. [Google Scholar] [CrossRef] [PubMed]
- Albert, M.B.; Avery, D.; Narin, F.; Mcallister, P. Direct validation of citation counts as indicators of industrially important patents. Res. Policy 1991, 20, 251–259. [Google Scholar] [CrossRef]
- Podolny, J.M.; Stuart, T.E. A Role-Based Ecology of Technological Change. Am. J. Sociol. 1995, 100, 1224–1260. [Google Scholar] [CrossRef]
- Bapuji, H.; Loree, D.; Crossan, M. Connecting external knowledge usage and firm performance: An empirical analysis. J. Eng. Technol. Manag. 2011, 28, 215–231. [Google Scholar] [CrossRef]
- Ziedonis, R.H. Don’t fence me in: Fragmented markets for technology and the patent acquisition strategies of firms. Manag. Sci. 2004, 50, 804–820. [Google Scholar] [CrossRef]
- Tsai, B.H. Does Litigation over the Infringement of Intellectual Property Rights Hinder Enterprise Innovation? An Empirical Analysis of the Taiwan IC Industry. Issues Stud. 2010, 46, 173–203. [Google Scholar]
- Podolny, J.M.; Hannan, M.T. Networks, Knowledge, and Niches: Competition in the Worldwide Semiconductor Industry, 1984–1991. Am. J. Sociol. 1996, 102, 659–689. [Google Scholar] [CrossRef]
- Chen, J.H.; Jang, S.L.; Wen, S.H. Measuring technological diversification: Identifying the effects of patent scale and patent scope. Scientometrics 2010, 84, 265–275. [Google Scholar] [CrossRef]
- Tsai, B.H. Innovation spillover effect in semiconductor industry. In Proceedings of the Technology Management for Global Economic Growth (PICMET), Phuket, Thailand, 18–22 July 2010; pp. 1–4. [Google Scholar]
- Hu, M.C. Evolution of knowledge creation and diffusion: The revisit of Taiwan’s Hsinchu Science Park. Scientometrics 2011, 88, 949–977. [Google Scholar] [CrossRef]
- Fuller, D.B. Chip design in China and India: Multinationals, industry structure and development outcomes in the integrated circuit industry. Technol. Forecast. Soc. 2014, 81, 1–10. [Google Scholar] [CrossRef]
- Bergek, A.; Bruzelius, M. Are patents with multiple inventors from different countries a good indicator of international R&D collaboration? The case of ABB. Res. Policy 2010, 39, 1321–1334. [Google Scholar]
- Liu, F.; Zhang, N.; Cao, C. An evolutionary process of global nanotechnology collaboration: A social network analysis of patents at USPTO. Scientometrics 2017, 111, 1449–1465. [Google Scholar] [CrossRef]
- Su, H.-N. Global Interdependence of Collaborative R&D-Typology and Association of International Co-Patenting. Sustainability 2017, 9, 541. [Google Scholar]
- Tsukada, N.; Nagaoka, S. Determinants of International Research Collaboration: Evidence from International Co-Inventions in Asia and Major OECD Countries. Asian Econ. Policy Rev. 2015, 10, 96–119. [Google Scholar] [CrossRef]
- Ma, Z.Z.; Lee, Y.; Chen, C.F.P. Booming or emerging? China’s technological capability and international collaboration in patent activities. Technol. Forecast. Soc. 2009, 76, 787–796. [Google Scholar] [CrossRef]
- Zheng, J.; Zhao, Z.Y.; Zhang, X.; Chen, D.Z.; Huang, M.H.; Lei, X.P.; Zhang, Z.Y.; Zhao, Y.H. International scientific and technological collaboration of China from 2004 to 2008: A perspective from paper and patent analysis. Scientometrics 2012, 91, 65–80. [Google Scholar] [CrossRef]
- Semiconductor Industry Association. Global Sales Report; Semiconductor Industry Association: Washington, DC, USA, 2015. [Google Scholar]
- IC Insights. Global Wafer Capacity 2016–2020; IC Insights: Scottsdale, AZ, USA, 2015. [Google Scholar]
- Van Zant, P.; Chapman, P. Microchip Fabrication: A Practical Guide to Semiconductor Processing; McGraw-Hill: New York, NY, USA, 2000; Volume 5. [Google Scholar]
- Arora, S.K.; Porter, A.L.; Youtie, J.; Shapira, P. Capturing new developments in an emerging technology: An updated search strategy for identifying nanotechnology research outputs. Scientometrics 2013, 95, 351–370. [Google Scholar] [CrossRef]
- Huang, Y.; Schuehle, J.; Porter, A.L.; Youtie, J. A systematic method to create search strategies for emerging technologies based on the Web of Science: Illustrated for Big Data. Scientometrics 2015, 105, 2005–2022. [Google Scholar] [CrossRef]
- Guan, J.C.; Zhang, J.J.; Yan, Y. The impact of multilevel networks on innovation. Res. Policy 2015, 44, 545–559. [Google Scholar] [CrossRef]
- Ma, Z.; Lee, Y. Patent application and technological collaboration in inventive activities: 1980–2005. Technovation 2008, 28, 379–390. [Google Scholar] [CrossRef]
- Zhu, D.H.; Porter, A.L. Automated extraction and visualization of information for technological intelligence and forecasting. Technol. Forecast. Soc. 2002, 69, 495–506. [Google Scholar] [CrossRef]
- Wasserman, S.; Faust, K. Social Network Analysis: Methods and Applications; Cambridge University Press: Cambridge, UK, 1994; Volume 8. [Google Scholar]
- Steiber, S.R. Building Better Blockmodels: A Non-Hierarchical Extension of CONCOR With Applications to Regression Analysis. Mid-Am. Rev. Sociol. 1981, 6, 17–40. [Google Scholar] [CrossRef]
- Munene, E.; Mottice, S.; Reid, J. Evaluating a Social Network Analytic Tool to Support Outbreak Management and Contact Tracing in an Outbreak of Pertussis. Online J. Public Health Inform. 2013, 5, e72. [Google Scholar] [CrossRef]
- Radil, S.M.; Flint, C.; Tita, G.E. Spatializing social networks: Using social network analysis to investigate geographies of gang rivalry, territoriality, and violence in Los Angeles. Ann. Assoc. Am. Geogr. 2010, 100, 307–326. [Google Scholar] [CrossRef]
- Breiger, R.L.; Boorman, S.A.; Arabie, P. An algorithm for clustering relational data with applications to social network analysis and comparison with multidimensional scaling. J. Math. Psychol. 1975, 12, 328–383. [Google Scholar] [CrossRef]
- Ju, Y.; Sohn, S.Y. Patent-based QFD framework development for identification of emerging technologies and related business models: A case of robot technology in Korea. Technol. Forecast. Soc. Chang. 2015, 94, 44–64. [Google Scholar] [CrossRef]
- Zhang, J.; Zhai, S.; Liu, H.; Stevenson, J.A. Social network analysis on a topic-based navigation guidance system in a public health portal. J. Assoc. Inf. Sci. Technol. 2016, 67, 1068–1088. [Google Scholar] [CrossRef]
- Singh, J. Collaborative networks as determinants of knowledge diffusion patterns. Manag. Sci. 2005, 51, 756–770. [Google Scholar] [CrossRef]
- Agrawal, A.; Kapur, D.; McHale, J. How do spatial and social proximity influence knowledge flows? Evidence from patent data. J. Urban Econ. 2008, 64, 258–269. [Google Scholar] [CrossRef]
- Wang, X.F.; Li, R.R.; Ren, S.M.; Zhu, D.H.; Huang, M.; Qiu, P.J. Collaboration network and pattern analysis: Case study of dye-sensitized solar cells. Scientometrics 2014, 98, 1745–1762. [Google Scholar] [CrossRef]
- Schilling, M.A.; Phelps, C.C. Interfirm collaboration networks: The impact of large-scale network structure on firm innovation. Manag. Sci. 2007, 53, 1113–1126. [Google Scholar] [CrossRef]
- Freeman, L.C. Centrality in social networks conceptual clarification. Soc. Netw. 1978, 1, 215–239. [Google Scholar] [CrossRef]
- Schiffauerova, A.; Beaudry, C. Collaboration spaces in Canadian biotechnology: A search for gatekeepers. J. Eng. Technol. Manag. 2012, 29, 281–306. [Google Scholar] [CrossRef]
- Beyers, J.; Donas, T. Inter-regional networks in Brussels: Analyzing the information exchanges among regional offices. Eur. Union Politics 2014, 15, 547–571. [Google Scholar] [CrossRef]
- Engel, J.S.; Del-Palacio, I. Global Clusters of Innovation: The Case of Israel and Silicon Valley. Calif. Manag. Rev. 2011, 53, 27–49. [Google Scholar] [CrossRef]
- Ma, J.; Wang, X.; Zhu, D.; Zhou, X. Analysis on patent collaborative patterns for emerging technologies: A case study of nano-enabled drug delivery. Int. J. Technol. Manag. 2015, 69, 210–228. [Google Scholar] [CrossRef]
- George, G.; Zahra, S.A.; Wood, D.R. The effects of business–university alliances on innovative output and financial performance: A study of publicly traded biotechnology companies. J. Bus. Ventur. 2002, 17, 577–609. [Google Scholar] [CrossRef]
- Eom, B.-Y.; Lee, K. Determinants of industry–academy linkages and, their impact on firm performance: The case of Korea as a latecomer in knowledge industrialization. Res. Policy 2010, 39, 625–639. [Google Scholar] [CrossRef]
- Grönqvist, C. The private value of patents by patent characteristics: Evidence from Finland. J. Technol. Transf. 2009, 34, 159–168. [Google Scholar] [CrossRef]
- Blind, K.; Edler, J.; Frietsch, R.; Schmoch, U. Motives to patent: Empirical evidence from Germany. Res. Policy 2006, 35, 655–672. [Google Scholar] [CrossRef]
- Park, S.; Lee, S.J.; Jun, S. Patent Big Data Analysis using Fuzzy Learning. Int. J. Fuzzy Syst. 2017, 19, 1158–1167. [Google Scholar] [CrossRef]
Figure 1.
Research framework.

Figure 2.
The process of the establishment of the technical classification system and search strategy for the ICM.
Figure 2.
The process of the establishment of the technical classification system and search strategy for the ICM.

Figure 3.
Topic Association Map of the ICM international collaboration patents for typical countries and regions.
Figure 3.
Topic Association Map of the ICM international collaboration patents for typical countries and regions.

Figure 4.
CONCOR Partition Diagram of ICM international cooperation.

Figure 5.
The ICM collaboration network of all countries and regions from 2004 to 2013 based on the Gower Metric Scaling layout.
Figure 5.
The ICM collaboration network of all countries and regions from 2004 to 2013 based on the Gower Metric Scaling layout.
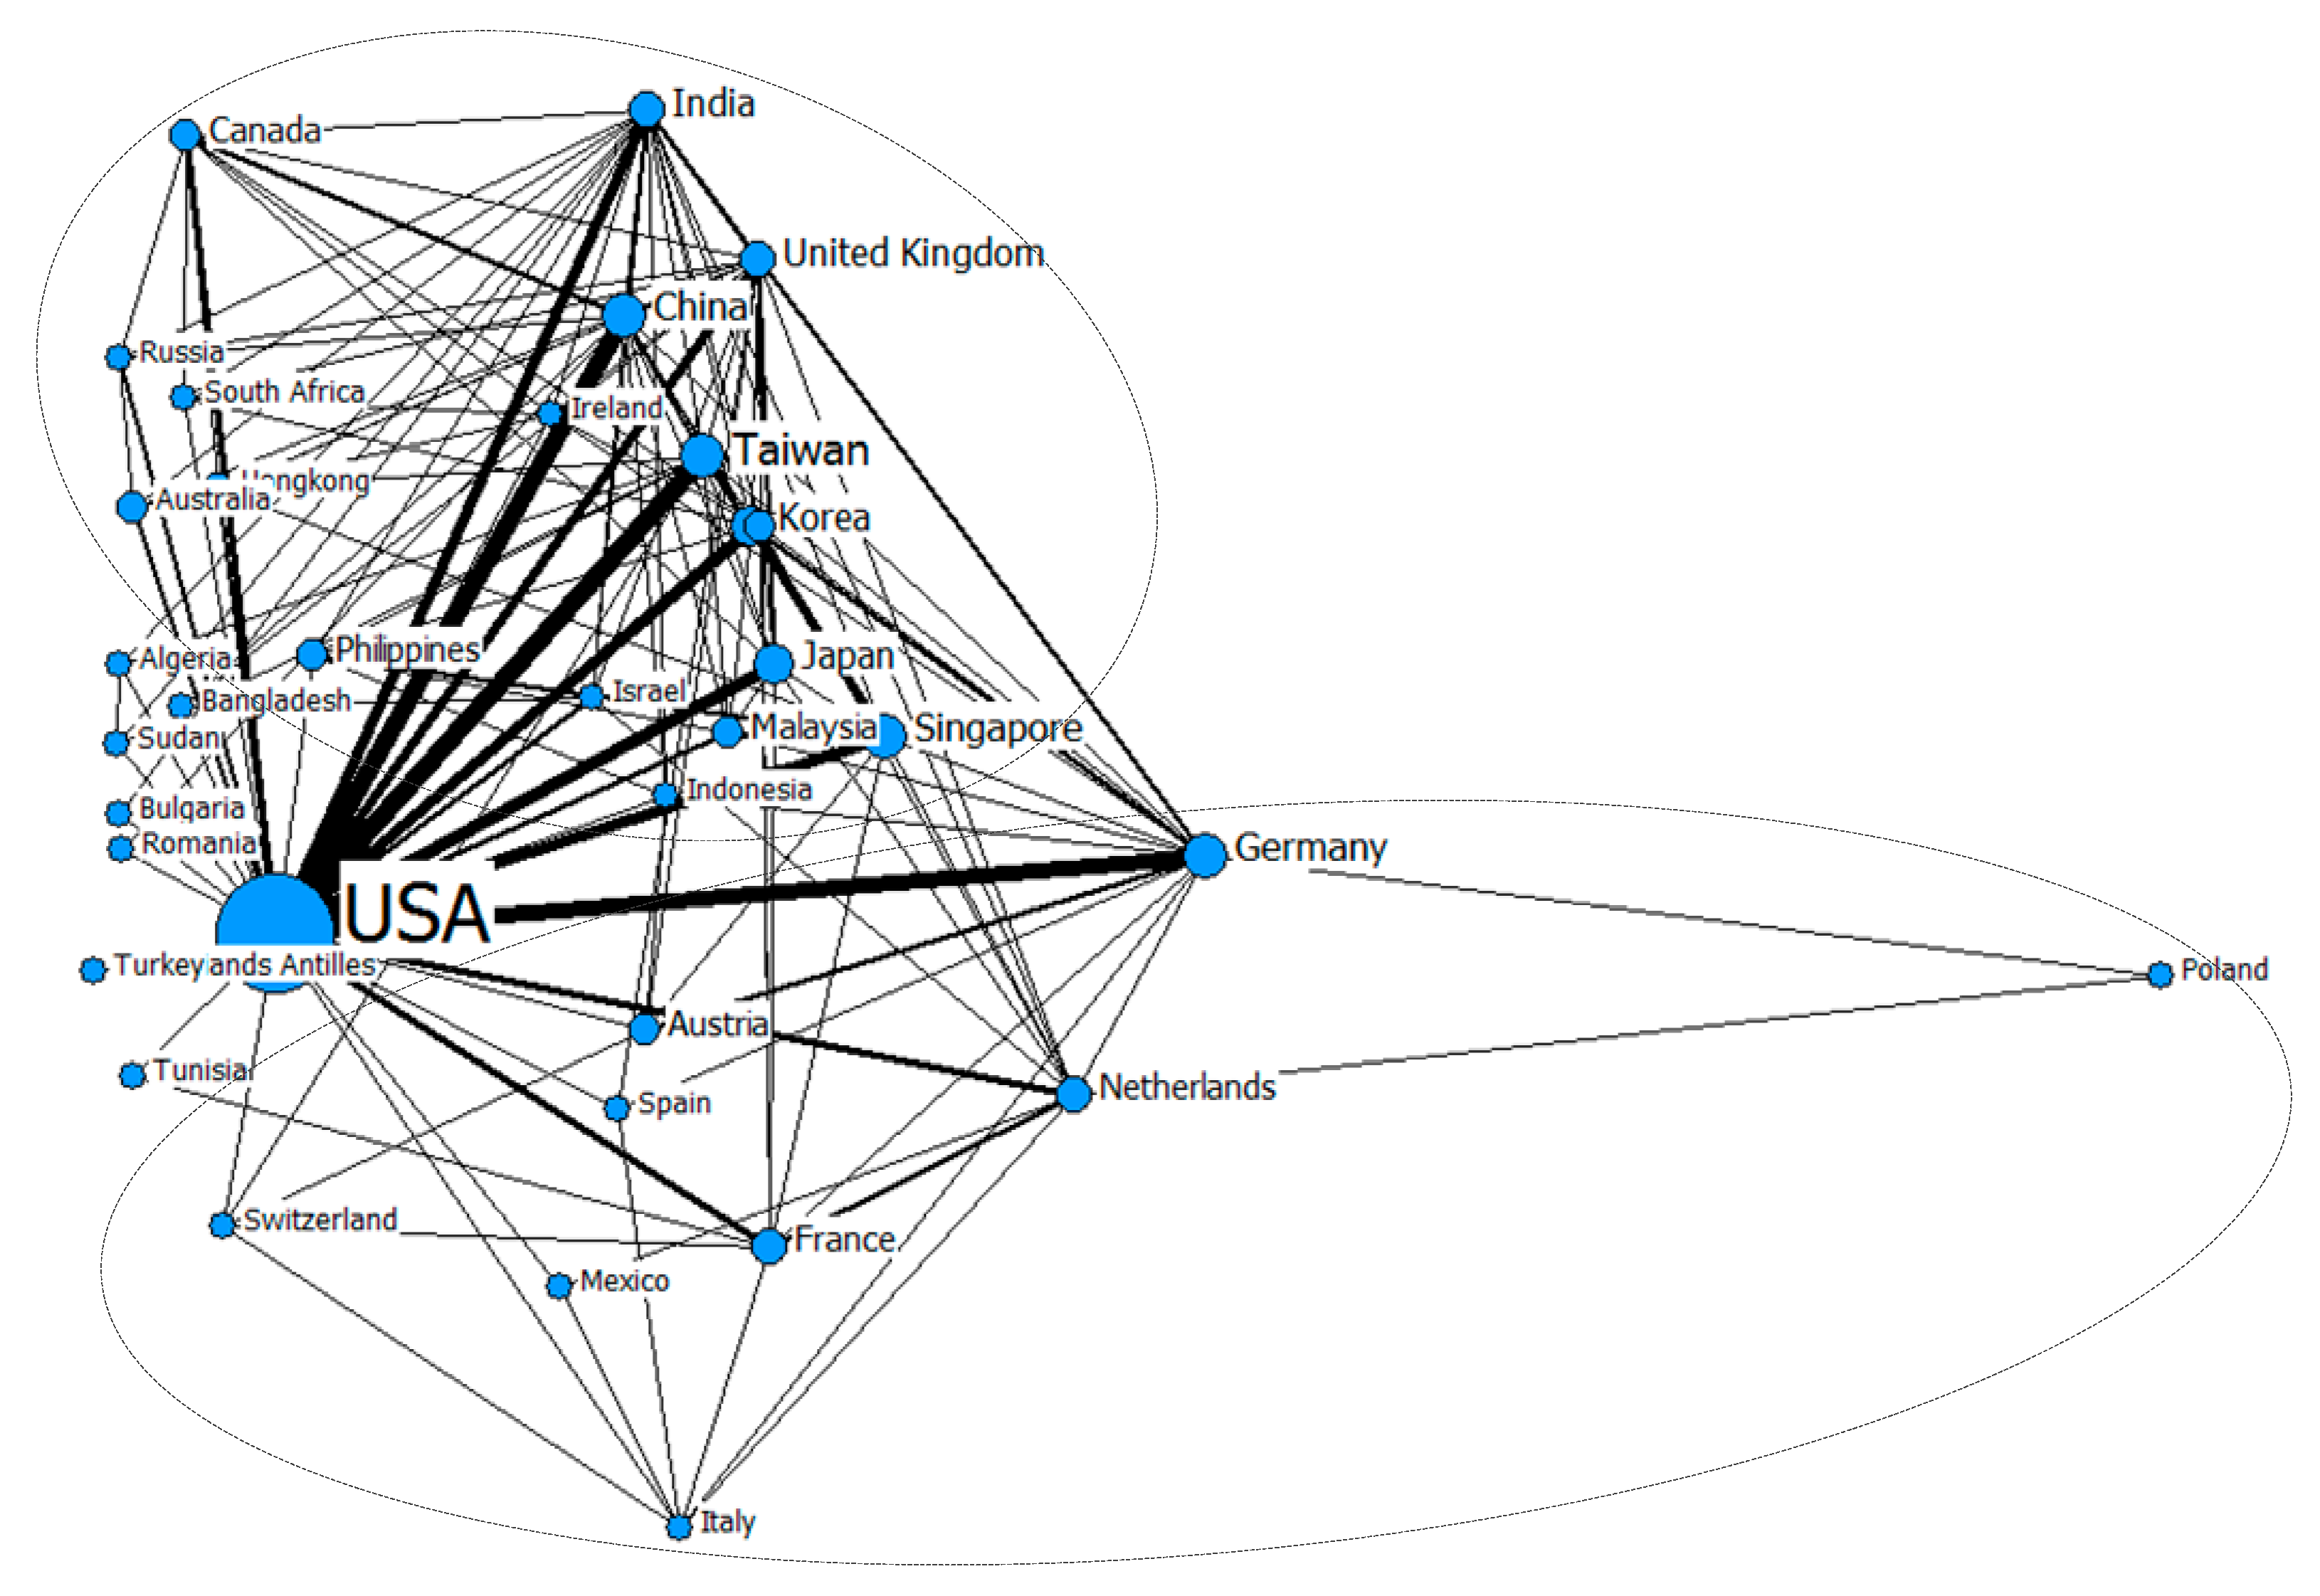
Figure 6.
Type distribution of institutions that owned ICM international collaboration patents in the top 10 countries and regions. Note: The outer circular ring represents the quantity distribution of international cooperation patents owned by various types of institutions; the inner ring represents the quantity distribution of various types of institutions that have international cooperation patents.

Table 1.
The Technical Classification System and Key Technical Topics of the ICM Industry.
| No. | Technical Subfields | Key Technical Topics | Number of Patents Retrieved |
|---|---|---|---|
| 1 | Cleaning Technology (CT) | Plasma cleaning, Megasonic cleaning, Laser cleaning | 566 |
| 2 | Lithography Technology (LT) | X-ray Lithography (XRL), Focused Icon Beam Lithography (FIBL), Extreme Ultraviolet Lithography (EUV), Nanoimprint Lithography (NIL), Electron Projection Lithography (EPL) | 539 |
| 3 | Etching Technology (ET) | Wet Chemical Etching, Plasma Etching (PE), Reactive Ion Etching (RIE), Inductively Coupled Plasma Etching (ICP) | 2495 |
| 4 | Thin Film Technology (TFT) | Thermal Oxidation, Physical Vapor Deposition (PVD), Chemical Vapor Deposition (CVD), Electroplate, Vapor Phase Epitaxy (VPE), Molecular Beam Epitaxy (MBE), Complementary Metal Oxide Semiconductor | 1021 |
| 5 | Doping Technology (DT) | Ion Implantation, diffusion | 855 |
| 6 | Annealing Technology (AT) | Rapid Thermal Annealing (RTA), Laser Annealing | 409 |
| 7 | Planarization Technology (PLT) | Stress-Free Polishing (SFP) | 736 |
| 8 | Packaging Technology (PAT) | Copper Interconnect, Low K Dielectric, Optical Interconnect, Carbon Nanotubes (CNT), Through Silicon Via (TSV), Ball Grid Array Package (BGA), Chip Size Package (CSP), Multi Chip Package (MCP), Wafer Level Package (WLP), Flip Chip Package, Product In Package, System On Package (SOP), System In Package (SIP), 3D Packaging, Pin Gird Array Package (PGA) | 5000 |
Note: In the third column, brackets contain the special abbreviation of the technology mentioned before the brackets. The acronym of each technical topic, if any, is also added to the patent search strategy to make the retrieved patent data more complete.
Table 2.
Location Characteristics’ Analysis Model.
| Low Degree Centrality (DC) | Low Closeness Centrality (CC) | Low Betweenness Centrality (BC) | |
|---|---|---|---|
| High DC | The cooperative nodes of this kind of node are all in the same cooperative cluster, which is far away from the other nodes in the network. | The cooperative relation of this kind of node can be regarded as a redundant relation by its cooperative nodes. That is to say, there is usually a direct cooperation among the partners of the node. | |
| High CC | A node with this ranking is the key node that has a direct cooperation with the core node. | There may be many ways of technological information flow in the network, which means that the node is close to a lot of nodes but other nodes are closer to others. | |
| High BC | Few cooperative relationships of this kind of node are very important for the flow of technological information in the network. | This kind of node is relatively rare because it monopolizes the flow of information among some nodes and the other nodes. |
Note: Whether the value of each centrality is high or low is determined by the comparison results among the rankings of the three individual centralities of each node and its ARC ranking. If the ranking of the centrality for an individual node is higher than that of the sum of the three kinds of centrality, then it is considered high.
Table 3.
Top 20 High-Yield Countries and Regions in ICM International Collaboration Patents.
| Country (Region) | Integrated Circuit Manufacturing (ICM) International Collaboration Patents | ICM Patents |
|---|---|---|
| Rank (Number) | Rank (Number) | |
| USA | 1 (322) | 1 (2951) |
| Taiwan | 2 (73) | 4 (651) |
| Singapore | 3 (69) | 8 (232) |
| China | 4 (61) | 3 (801) |
| Germany | 5 (58) | 6 (325) |
| Japan | 6 (47) | 2 (1207) |
| Korea | 6 (47) | 5 (513) |
| United Kingdom | 8 (38) | 9 (98) |
| India | 9 (34) | 13 (45) |
| France | 10 (30) | 7 (249) |
| The Netherlands | 11 (26) | 10 (89) |
| Malaysia | 12 (22) | 15 (43) |
| Belgium | 13 (19) | 16 (30) |
| Canada | 13 (19) | 11 (52) |
| Philippines | 15 (13) | 19 (19) |
| Austria | 16 (12) | 18 (23) |
| Hong Kong | 17 (11) | 19 (19) |
| Australia | 18 (10) | 12 (46) |
| Israel | 19 (9) | 16 (30) |
| Russia | 20 (8) | 14 (44) |
Table 4.
Top 20 High-Yield Institutions in ICM International Collaboration Patents.
| Rank | Institutions | Country (Region) | Type |
|---|---|---|---|
| 1 | IBM | USA | Enterprise |
| 2 | Taiwan Semiconductor Mfg. | Taiwan | Enterprise |
| 3 | Infineon Technologies AG | Germany | Enterprise |
| 4 | Stats Chippac Ltd. | Singapore | Enterprise |
| 5 | Texas Instruments Inc. | USA | Enterprise |
| 6 | Samsung Electronics Co. Ltd. | Korea | Enterprise |
| 7 | Chartered Semiconductor Mfg. | Singapore | Enterprise |
| 8 | Applied Materials Inc. | USA | Enterprise |
| 9 | Globalfoundries Sg Pte Ltd. | Singapore | Enterprise |
| 10 | NXP Bv | The Netherlands | Enterprise |
| 11 | Agere Systems Inc. | USA | Enterprise |
| 12 | D2S Inc. | USA | Enterprise |
| 13 | Koninkl Philips Electronics NV | The Netherlands | Enterprise |
| 14 | St. Microelectronics Sa | France | Enterprise |
| 15 | Univ Fudan | China | College and university |
| 16 | ASAT Ltd. | Hong Kong | Enterprise |
| 17 | Broadcom Corp. | USA | Enterprise |
| 18 | Intel Corp. | USA | Enterprise |
| 19 | Pulsic Ltd. | United Kingdom | Enterprise |
| 20 | Synopsys Inc. | USA | Enterprise |
Table 5.
The Centralities and the ARC of the Typical Countries and Regions in the ICM International Collaboration Network.
Table 5.
The Centralities and the ARC of the Typical Countries and Regions in the ICM International Collaboration Network.
| Country (Region) | Degree Centrality (DC) | Closeness Centrality (CC) | Betweenness Centrality (BC) | Average Value of the Rankings for Three Centralities (ARC) |
|---|---|---|---|---|
| Rank (Value) | Rank (Value) | Rank (Value) | Rank (Value) | |
| USA | 1 (97.73) | 1 (97.78) | 1 (64.70) | 1 (1) |
| Taiwan | 6 (34.09) | 6 (60.27) | 7 (1.90) | 6 (6.33) |
| Singapore | 7 (31.82) | 7 (59.46) | 8 (1.11) | 7 (7.33) |
| China | 4 (38.64) | 4 (61.97) | 5 (3.14) | 5 (4.33) |
| Germany | 4 (38.64) | 4 (61.97) | 3 (4.48) | 4 (3.67) |
| Japan | 10 (22.73) | 10 (56.41) | 13 (0.33) | 11 (11) |
| Korea | 13 (20.46) | 12 (55.70) | 18 (0.11) | 14 (14.33) |
| United Kingdom | 2 (45.46) | 2 (64.71) | 4 (4.00) | 3 (2.67) |
| India | 2 (45.46) | 2 (64.71) | 2 (4.68) | 2 (2) |
| France | 10 (22.73) | 10 (56.41) | 9 (0.83) | 10 (9.67) |
| The Netherlands | 8 (27.27) | 8 (57.90) | 6 (2.61) | 7 (7.33) |
| Malaysia | 14 (18.18) | 14 (55.00) | 19 (0.10) | 16 (15.67) |
| Belgium | 9 (25.00) | 9 (57.14) | 10 (0.43) | 9 (9.33) |
| Canada | 10 (22.73) | 12 (55.70) | 11 (0.39) | 11 (11) |
| Philippines | 16 (15.91) | 18 (53.66) | 21 (0.07) | 18 (18.33) |
| Austria | 19 (13.64) | 18 (53.66) | 15 (0.17) | 17 (17.33) |
| Hong Kong | 19 (13.64) | 21 (53.01) | 23 (0.05) | 22 (21) |
| Australia | 24 (11.36) | 24 (52.38) | 24 (0.02) | 24 (24) |
| Israel | 19 (13.64) | 18 (53.66) | 20 (0.09) | 20 (19) |
| Russia | 19 (13.64) | 21 (53.01) | 22 (0.05) | 21 (20.67) |
| Average | - (28.64) | - (59.22) | - (4.46) | - (-) |
Note: In order to analyze the collaboration impacts of the typical countries and regions in the whole ICM international cooperation network more accurately, all the rankings in this table are in the scope of all 45 countries and regions in the network.
Table 6.
Comparison of Rankings among the Three Centralities and the ARC of the Typical Countries and Regions.
Table 6.
Comparison of Rankings among the Three Centralities and the ARC of the Typical Countries and Regions.
| Country (Region) | DC vs. ARC | CC vs. ARC | BC vs. ARC | Category |
|---|---|---|---|---|
| USA | ● * | ● * | ● * | HHH |
| Taiwan | ● * | ● * | ○ | HHL |
| Singapore | ● * | ● * | ○ | HHL |
| China | ● | ● | ○ * | HHL |
| Germany | ● * | ● * | ● | HHH |
| Japan | ● | ● | ○ | HHL |
| Korea | ● | ● | ○ | HHL |
| United Kingdom | ● | ● | ○ | HHL |
| India | ● * | ● * | ● * | HHH |
| France | ○ * | ○ * | ● | LLH |
| The Netherlands | ○ | ○ | ● | LLH |
| Malaysia | ● | ● | ○ | HHL |
| Belgium | ○ * | ○ * | ○ | LLL |
| Canada | ● | ○ | ○ * | HLL |
| Philippines | ● | ○ * | ○ | HLL |
| Austria | ○ | ○ * | ● | LLH |
| Hong Kong | ● | ● | ○ | HHL |
| Australia | ○ * | ○ * | ○ * | LLL |
| Israel | ● | ● | ○ * | HHL |
| Russia | ● | ○ * | ○ | HLL |
Note: * represents a situation where the centrality ranking of a node is consistent with its ARC ranking, then the concrete value of this centrality is compared to the average value of the centrality among the typical countries and regions. If the concrete value is higher, then it is a solid circle; conversely, it is an open circle.
© 2018 by the authors. Licensee MDPI, Basel, Switzerland. This article is an open access article distributed under the terms and conditions of the Creative Commons Attribution (CC BY) license (http://creativecommons.org/licenses/by/4.0/).
Share and Cite
MDPI and ACS Style
Liu, Y.; Yan, Z.; Cheng, Y.; Ye, X. Exploring the Technological Collaboration Characteristics of the Global Integrated Circuit Manufacturing Industry. Sustainability 2018, 10, 196. https://doi.org/10.3390/su10010196
AMA Style
Liu Y, Yan Z, Cheng Y, Ye X. Exploring the Technological Collaboration Characteristics of the Global Integrated Circuit Manufacturing Industry. Sustainability. 2018; 10(1):196. https://doi.org/10.3390/su10010196
Chicago/Turabian StyleLiu, Yun, Zhe Yan, Yijie Cheng, and Xuanting Ye. 2018. "Exploring the Technological Collaboration Characteristics of the Global Integrated Circuit Manufacturing Industry" Sustainability 10, no. 1: 196. https://doi.org/10.3390/su10010196
Note that from the first issue of 2016, this journal uses article numbers instead of page numbers. See further details here.