Threatened Plants in China’s Sanjiang Plain: Hotspot Distributions and Gap Analysis


1
Institute of Ecology and Environment, Jilin Normal University, Siping 136000, China
2
Key Laboratory of Wetland Ecology and Environment, Northeast Institute of Geography and Agroecology, Chinese Academy of Sciences, Changchun 130102, China
3
No. 1 Senior Middle School of Siping, Siping 136000, China
*
Authors to whom correspondence should be addressed.
Sustainability 2018, 10(1), 194; https://doi.org/10.3390/su10010194
Submission received: 25 November 2017
/
Revised: 10 January 2018
/
Accepted: 12 January 2018
/
Published: 15 January 2018
(This article belongs to the Special Issue Wetland Ecology, Conservation and Sustainability: Applications of Geospatial Techniques)
Abstract
:Global biodiversity is markedly decreasing in response to climate change and human disturbance. Sanjiang Plain is recognized as a biodiversity hotspot in China due to its high forest and wetland coverage, but species are being lost at an unprecedented rate, induced by anthropogenic activities. Identifying hotspot distributions and conservation gaps of threatened species is of particular significance for enhancing the conservation of biodiversity. Specifically, we integrated the principles and methods of spatial hotspot inspection, geographic information system (GIS) technology and spatial autocorrelation analysis along with fieldwork to determine the spatial distribution patterns and unprotected hotspots of vulnerable and endangered plants in Sanjiang Plain. A gap analysis of the conservation status of vulnerable and endangered plants was conducted. Our results indicate that six nationally-protected plants were not observed in nature reserves or were without any protection, while the protection rates were <10% for 10 other nationally-protected plants. Protected areas (PAs) cover <5% of the distribution areas for 31 threatened plant species, while only five species are covered by national nature reserves (NNRs) within >50% of the distribution areas. We found 30 hotspots with vulnerable and endangered plants in the study area, but the area covered by NNRs is very limited. Most of the hotspots were located in areas with a high-high aggregation of plant species. Therefore, it is necessary to expand the area of existing nature reserves, establish miniature protection plots and create new PAs and ecological corridors to link the existing PAs. Our findings can contribute to the design of a PA network for botanical conservation.
1. Introduction
Biodiversity plays an important role in determining ecosystem structure and function, as species composition and richness impact and respond to ecosystem properties [1]. Different species can alter abiotic conditions, which affect the energy and material fluxes that help to define an ecosystem [2]. The loss of even one species can impact multiple ecosystem functions and lead to ecosystem destabilization [3]. Due to habitat loss caused by human activities and climate change, the rate of species extinction has been rapidly increasing [4]. The unprecedented rates of biodiversity loss have been directly linked to human alteration of the environment, including changes in land cover and the destructive exploitation of natural resources [5]. A recent study suggested that current global extinction rates are 1000-times higher than the natural background extinction rates and may increase in the future [6]. Therefore, protecting biodiversity is a matter of great urgency. Additionally, the question of how to effectively reduce the rate of species extinction has become a major challenge for conservation biologists and policymakers [7,8].
One of the most effective ways to protect biodiversity is to establish protected areas (PAs). The importance of PAs has been generally recognized, and numerous international laws consider PAs as a key tool for environmental protection [9]. However, numerous studies about nature conservation networks have demonstrated that PAs cannot adequately protect all the biodiversity of a region or country [10,11]. Many nature reserve systems do not represent regional biodiversity, and many are unable to fulfill their conservation goals [12]. China harbors more threatened species than other regions in the world [13]. In China, the PA network has many gaps in terms of biodiversity representation at both the ecoregion and species level [14]. Much research concerning the geographic distribution of bird and vertebrate diversity in Southern China has already been carried out, but few studies have comprehensively investigated the distribution of threatened plant species diversity in Northeast China [15]. Therefore, there is an urgent need to detect and analyze the distribution of threatened plants in order to enhance the overall conservation efficiency of nature reserves [16].
Gap analysis is an effective approach to test the effectiveness of PAs in representing local biodiversity [17,18]. Gap analysis of threatened plant species in nature reserves could provide valuable information to improve management efficiency. It has been widely used in many European countries [4,18,19,20,21]. Sanjiang Plain in Northeast China is the largest freshwater marsh area in the country and has been identified as a key area for wetland biodiversity due to its high species richness and number of endemic species [17]. Using gap analysis, Liu et al. (2008) evaluated bird diversity in Sanjiang Plain, but studies of vulnerable and endangered plant species in Northeast China are rare [22,23,24,25]. Sanjiang Plain has many important vulnerable and endangered plant species and associated habitats. These habitats act as crucial areas for many globally-endangered plants. Gap analysis of threatened plant species is critical to improve the conservation efficiency of nature reserve systems in Sanjiang Plain.
Before the middle of the 20th century, natural wetlands were widely distributed in Sanjiang Plain. In the 1940s, there were >50,000 km2 of wetlands in the region [18]. From the 1950s to the 2000s, areas of cropland expanded by 250%, mainly converted from natural wetlands [19]. The loss and fragmentation of wetlands damaged the habitats of endangered plants, significantly impacting the landscape and the biodiversity of this area. Protecting the wetlands in Sanjiang Plain not only benefits the ecological environment of Northeast Asia, but also contributes to mitigating the sharp loss of biodiversity [20]. Due to the importance of wetlands and valuable biodiversity, Sanjiang Plain has become a target of numerous research projects, including those aimed at detecting changes in habitats and biodiversity, analyzing the underlying anthropogenic drivers and formulating conservation strategies [26,27,28,29]. However, previous studies mainly focused on particular hotspots such as nature reserves at a local scale. Thus, conservation strategies have been generated based on local and site-based protection, which cannot be used as adequate guidelines for broad-scale freshwater wetland conservation initiatives across Sanjiang Plain. Therefore, using hotspot analysis and gap analysis, this study aimed to: (1) assess whether the PAs in Sanjiang Plain provide representative and biologically-sustainable coverage of the region’s biodiversity; (2) evaluate the conservation status of 60 threatened plant species by comparing their distribution with the spatial database of the national nature reserves (NNRs) and therefore calculate the proportion of each species covered by the PAs; and (3) propose broad recommendations to improve the representativeness of the PA system. The results are expected to provide useful information for future botanical conservation and maintaining the habitats of endangered species in situ in Sanjiang Plain.
2. Data and Methods
2.1. Study Area
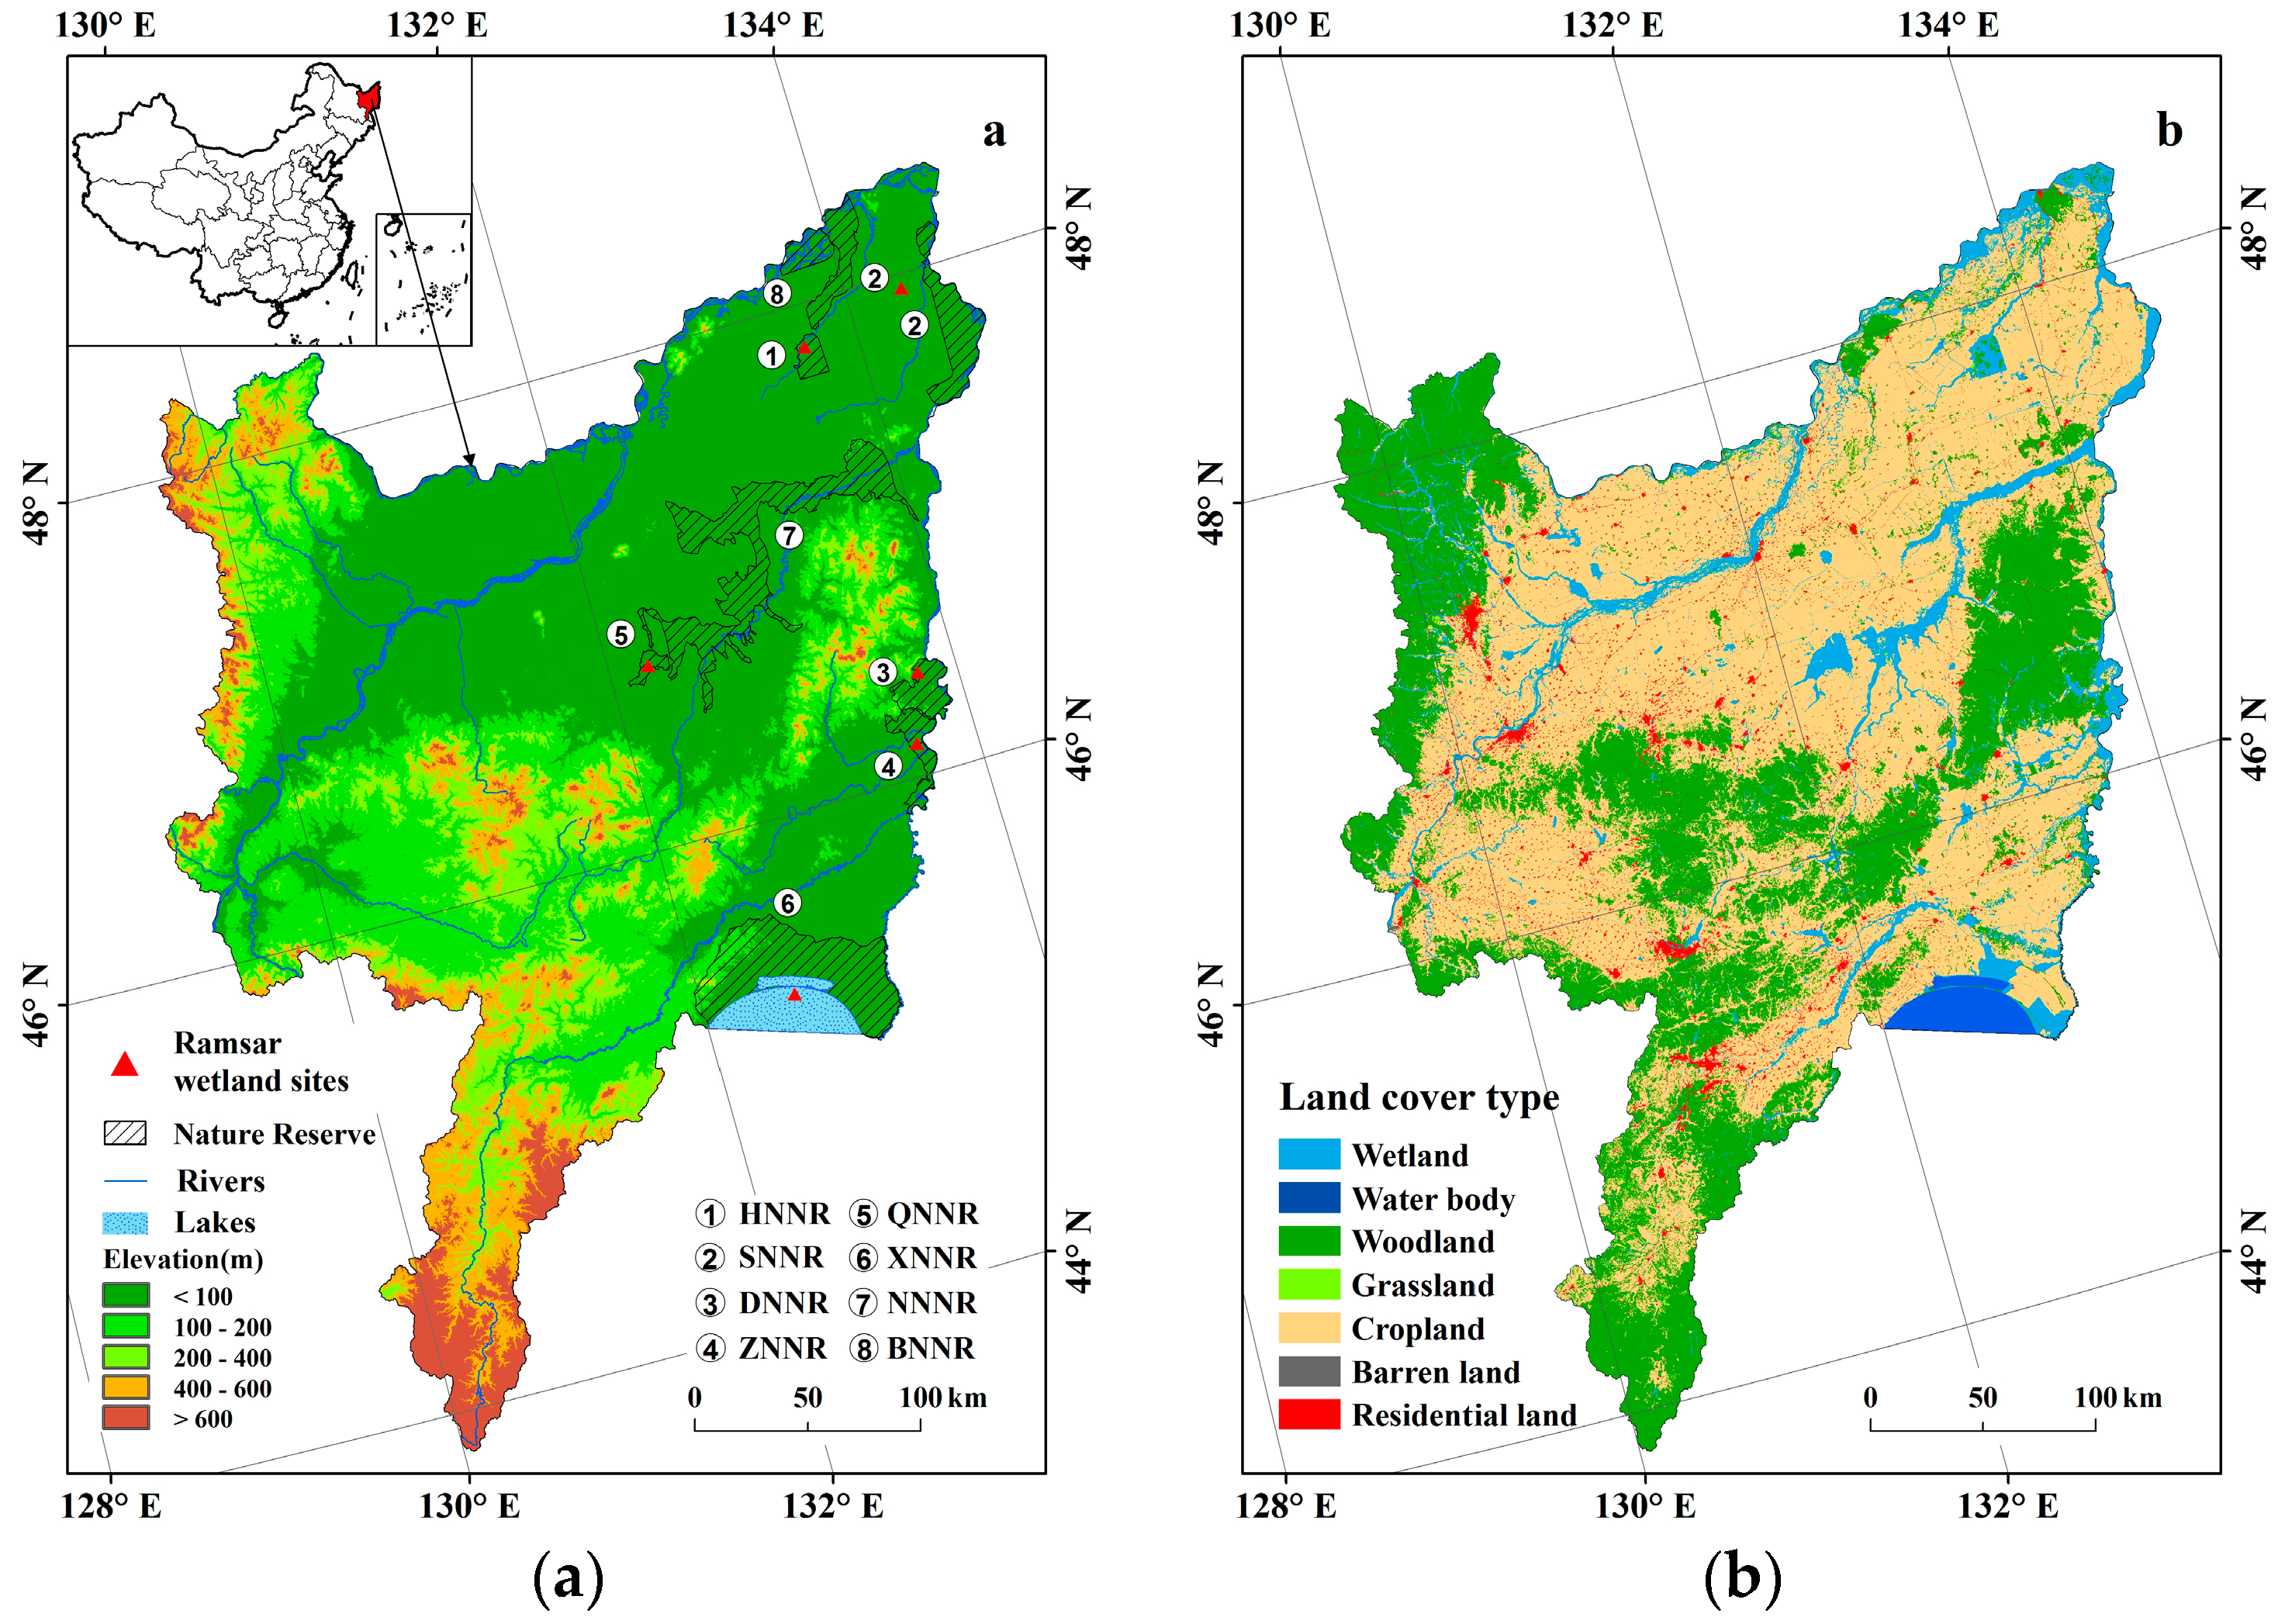
Sanjiang Plain is located in the northeastern region of Heilongjiang Province, ranging in latitude from 43°49′55″–48°27′40″ and in longitude from 129°11′20″–135°05′26″, covering a total area of 108,900 km2. The altitude is lower than 200 m in most of the region. This area includes the alluvial plain of Heilongjiang, Songhua and the Ussuri River in the north of the Wanda Mountains, the Ussuri tributaries and Xingkai Lake to the south of the Wanda Mountains. It has a humid and semi-humid temperate continental climate, with a mean annual precipitation of 500–650 mm and a mean annual temperature of 1.4–4.3 °C [30]. There are eight major soil types: dark brown soil, meadow soil, white slurry soil, black soil, swamp soil, paddy soil, peat and sand soil. There are eight national nature reserves: Zhenbaodao National Nature Reserve (ZNNR), Dongfanghong National Nature Reserve (DNNR), Bachadao National Nature Reserve (BNNR), Sanjiang National Nature Reserve (SNNR), Naolihe National Nature Reserve (NNNR), Xingkaihu National Nature Reserve (XNNR), Qixinghe National Nature Reserve (QNNR) and Honghe National Nature Reserve (HNNR) (Figure 1).
2.2. Inventory of Vulnerable and Endangered Plant Species
In our study, we collected 60 plant species (40 vulnerable and 20 endangered), all of which were categorized as protected species at different levels. National threatened plant species in the study area are found on the China Species Red List, a list of rare and endangered plants in China (Ministry of Environment Protection of the People’s Republic of China, 2013), the List of National Key Protected Wild Plants (National Forestry Administration and Department of Agriculture, 1999) and the List of Provincial Key Protected Wild Plants in Heilongjiang (government of Heilongjang Province, 2007). Provincial and regional threatened plant species are recorded in comprehensive investigation reports of nature reserves in Sanjiang Plain.
Distribution information on the 60 threatened plant species was obtained from four sources: (1) specimen collection records (including vegetation type and elevation range), (2) specimen records from the Chinese Virtual Herbarium (http://www.cvh.ac.cn/), (3) Flora of China, and (4) local Floras. All the collected information was reviewed, discussed and integrated. Finally, we established a distribution database of 60 threatened species, which includes their scientific names, habitats, vertical upper and lower distribution limits and present locations.
2.3. Other Geographic Datasets
To obtain information on topography, a digital elevation model (DEM) of Sanjiang Plain was extracted from the Shuttle Radar Topographic Mission 90-m Digital Elevation Database Version 4.0 (http://www.gscloud.cn/). The elevation coverage was produced by using the “Reclassify” option in ArcGIS10.0 to classify the DEM into five categories: <100 m, 100–200 m, 200–400 m, 400–600 m and >600 m. Land cover data from 2012 were derived from Wang et al. [30]. The overall classification accuracy for the land cover map in 2012 was 92.5% (assessed by 2436 field samples). The geomorphologic map, soil type map and vegetation type map were digitized from the existing corresponding maps. These electronic maps were obtained from the website of the Northeast Institute of Geography and Agroecology, Chinese Academy of Sciences (http://www.osgeo.cn/map/). National nature reserve distribution maps came from the planning chart of the natural preservation areas administration.
2.4. Mapping Geographic Distributions of Species Richness
The geographic distributions of 60 threatened plant species were mapped using ArcGIS 10.0 software. The distribution of threatened plant species is influenced by five environmental factors: elevation, land cover types, geomorphologic conditions, soil types and vegetation types [31]. Based on species-habitat relationships and the available environmental layers [32], we predicted the distribution of threatened species through overlap analysis of those five layers. We generated a grid with a 3-km resolution to obtain the richness of threatened species in the study area. There were 12,578 grid cells in total covering the whole study area [33]. We summed and sorted the species richness of each grid, and the threatened species richness was divided into five levels: low (<5 species), low-mid (6–10 species), mid (11–15 species), mid-high (16–20 species) and high (>20 species).
2.5. Gap Analysis
Gap analysis is the process of finding the species and vegetation types that are not represented or not fully represented in PAs. Gap analysis emphasizes that every species in a region should occur at least once in the PA. A vegetation type or “hotspot” that does not appear is considered a gap [22]. Identifying conservation gaps of threatened plants within NNRs is done by overlapping and comparing the distributions of hotspots of threatened species with the distributions of protected areas [19,20,24,34,35]. We aimed to find ideal areas to expand protection; such planning makes it possible to improve the efficiency of conservation optimally while minimizing the cost of land area. We evaluated the conservation gaps of 60 threatened plant species by calculating the percentage of threatened plant species covered by nature reserves.
All threatened plant species distribution maps are assessed for their accuracy. As with the land cover maps, this is done by comparing the predicted distributions with independent reference data [17]. In this study, we compared the numbers of threatened plant species between field samples and predicted results. As shown in Table 1, the field survey found that the average prediction accuracy was >89%. The average prediction accuracy was 91.74% in Sanjiang Plain. The field sample surveys proved that the distribution map of threatened species was sufficiently accurate to meet the needs of this study. The actual numbers of threatened plant species of the field survey came from the Comprehensive Scientific Investigation Reports on ZNNR, on SNNR on DNNR and on BNNR.
2.6. Spatial Autocorrelation Analysis and Hotspot Detection
An understanding of threatened plant species distribution is central to biodiversity conservation. The distributions of many organisms are spatially autocorrelated. Usually, if spatial autocorrelation exists, it will be exhibited by similarities between contiguous regions, although negative patterns of dependence are also possible [36]. Spatial autocorrelation analysis includes global spatial autocorrelation and local spatial autocorrelation. Global spatial autocorrelation detects the spatial pattern of the whole study area. In contrast, local spatial autocorrelation calculates the value of each unit relative to each neighboring unit. Local spatial autocorrelation analysis helps us more accurately master space element aggregation and heterogeneity characteristics. Using local spatial autocorrelation analysis, we can obtain the spatial position and range of the place of aggregation and measure the degree of local spatial correlation between each spatial unit and adjacent units [37].
In this study, we used Geoda software (Center for Spatially Integrated Social Science (CSISS), Chicago, IN, USA) for the spatial autocorrelation analysis of vulnerable and endangered plants [38]. Spatial autocorrelation analysis was used to test whether the values for richness of threatened species within a location were markedly related to those of neighboring areas [39,40]. A spatial autocorrelation analysis of the spatial distribution of threatened plant richness in Sanjiang Plain was conducted, then a cluster map of local indicators of spatial associations of threatened plants and the statistical results of local spatial autocorrelation were obtained.
Spatial aggregation of the vulnerable and endangered plant species was divided into four patterns: high-high aggregation (areas and their surroundings with high species richness), low-low aggregation (areas and their surroundings with low species richness), low-high aggregation (areas with low species richness that had surrounding areas with high species richness) and high-low aggregation (areas with high species richness that had surrounding areas with low species richness; that is, high value existed in the form of isolated wetlands or islands). Spatial autocorrelation analysis showed that the global autocorrelation coefficient was 0.5023, and the significance level was a = 0.01, which indicates that threatened species richness has significant spatial autocorrelation. Using ArcGIS10.0 software (Esri, Redlands, CA, USA), the results of the local spatial autocorrelation analysis were connected with the distribution maps of the NNRs, then exported to the attribute table, and Microsoft Excel was used to calculate the area ratio of the autocorrelation type region of each reserve (Table 2).
A hotspot is defined as a condition indicating some form of clustering in a spatial distribution that can separate clusters of high value from clusters of low value [41]. Hotspot detection is one of the methods for testing global aggregation, which not only can measure the degree of local correlation and analyze the characteristics of spatial distribution, but also can identify the clustering characteristics of high- or low-value species richness [42,43]. CrimeStat is spatial statistics software for the analysis of incident locations that can interface with most desktop geographic information system programs [44]. First, the data setup section required that we define the “Primary” file, which is a shape file of threatened plant species distribution incidence with X and Y coordinates and attribute fields. Second, we defined the reference grids and measurement parameters (which identify the type of distance measurement to be used and specify parameters for the area of the study region and the length of the spatial units) for various routines, such as the X, Y coordinates in the data setting module and running hotspot analysis tools, then obtaining the hotspot distribution map. The detailed operation steps of the software are available at http://www.icpsr.umich.edu/CrimeStat.
3. Results
3.1. Geographical Distribution of Threatened Plant’s Richness
As shown in Figure 2, threatened plants were distributed widely across Sanjiang Plain, and their geographic distribution was uneven. Regions with mid-high species richness were distributed mainly in the southeast part of Xiaoxinganling, Laoyeling Mountains, Taipingling and Wanda Mountains. Among these, the Xiaoxinganling area had the highest number of threatened species (27). The distribution of threatened species was relatively concentrated, and the distribution area was the largest. The pattern indicates that the species richness of mountainous areas is mid-high compared to the species richness of plains. By overlapping the threatened species richness map with the distribution of NNRs, we found that some areas with mid-high species richness in the eastern part of the study area have been protected. For example, HNNR, SNNR, DNNR and BNNR covered some areas of mid-high species richness. A large percentage of threatened plants in the central, northwest and southwest Sanjiang Plain were not covered by NNRs and had no protection.
3.2. Spatial Autocorrelation of Threatened Plant Distribution
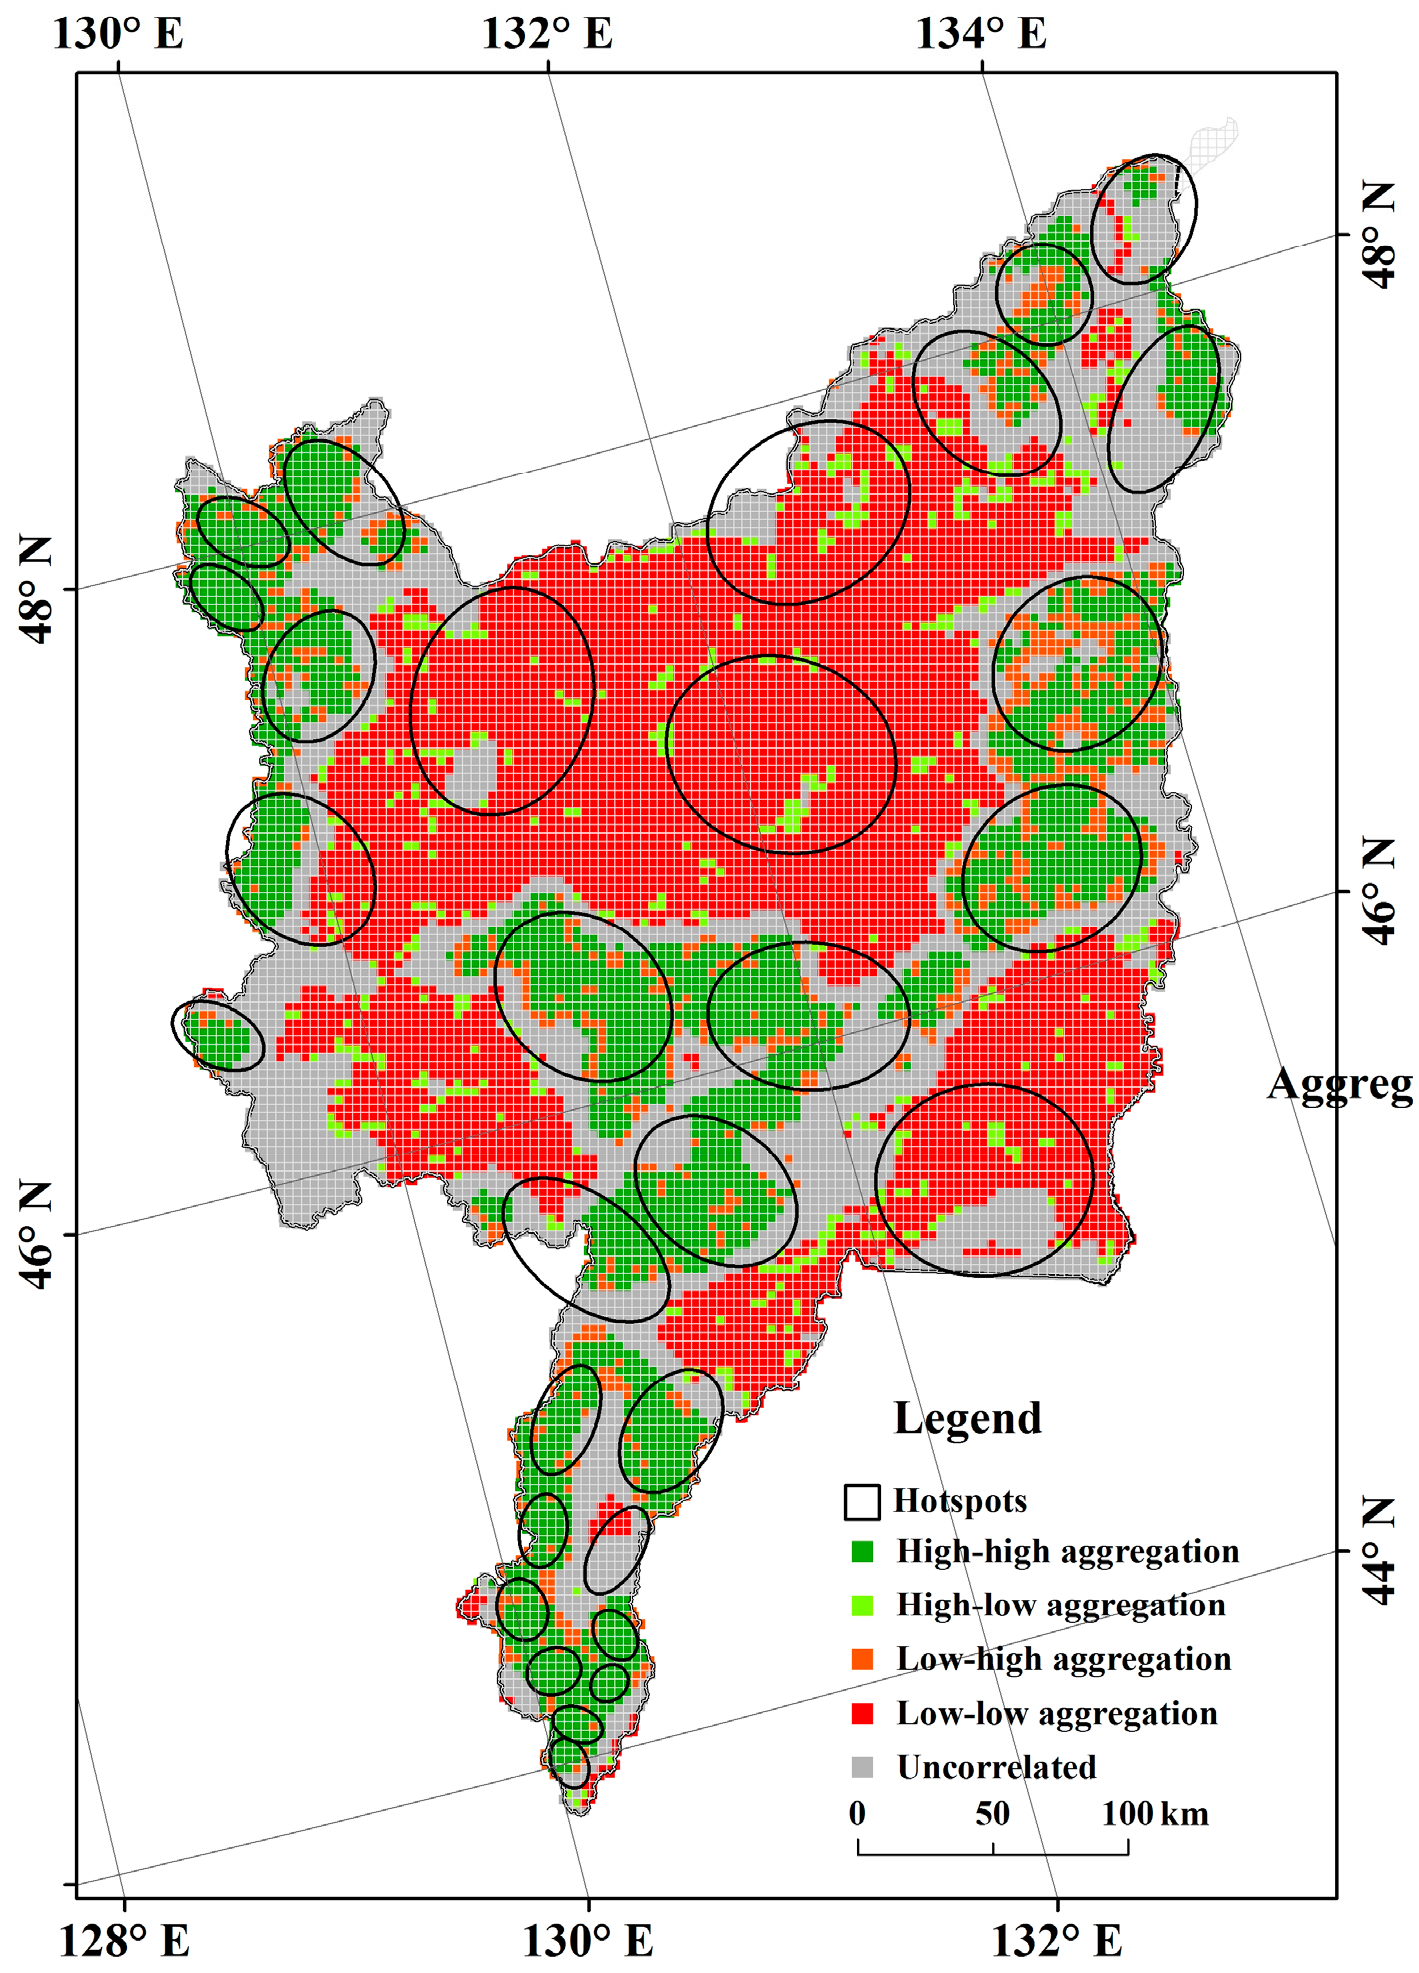
Using local spatial autocorrelation analysis, we calculated the area percentage for each spatial aggregation type distribution within the PAs and generated a map of vulnerable and endangered plants by spatial aggregation. According to Figure 3 and Table 2, an area of uncorrelated types occupied the largest proportion in the DNNR and the BNNR, at 63.08% and 65.22%, respectively. An area of low-low aggregation type occupied the largest proportion in the NNNR, with a value of 83.03%. It was concluded that the spatial correlation of threatened plants was relatively low in the DNNR, BNNR, and NNNR. An area of high-high aggregation type occupied the largest proportion in the XNNR, QNNR, SNNR and HNNR, with values of 56.19%, 50%, 57.32% and 50%, respectively. The spatial correlation of threatened plants was relatively high. An area of high-low aggregation type occupied the largest proportion in the QNNR, with a value of 39.29%.
An area of high-high aggregation type accounted for about 21.28% of the total area in Sanjiang Plain. Areas of high-low aggregation type accounted for about 4.08% of the total area in Sanjiang Plain; that is, an area with mid-high species richness accounted for about a quarter of the total area. To protect the diversity of threatened plants in Sanjiang Plain, it is necessary to find the hotspots with high species richness.
3.3. Distribution of Threatened Plant Species Hotspots
Following the principles and methods of spatial hotspot inspection, we obtained a hotspot distribution map of 60 threatened plant species; 30 hotspots were identified in Sanjiang Plain. As shown in Figure 3, in the spatial position, the seven hotspots in the eastern Sanjiang Plain corresponded to the existing NNRs (Figure 1a). These hotspot areas were only partly covered by reserves. Among them, the four hotspots in the northeast corresponded to SNNR, BNNR and HNNR; two hotspots in the east corresponded to NNNR, DNNR and ZNNR. The one hotspot in the southeast corresponded to XNNR. There were 17 hotspots in the western and southern Sanjiang Plain, located outside the existing reserves. The three hotspots in the northern Sanjiang Plain were located in cropland, low floodplain, high floodplain, and river terrace. The 14 hotspots in the central and southern regions were mainly distributed in the Laoyeling Mountains and Taipingling. The six hotspots in the western Sanjiang Plain were located in southeastern Xiaoxinganling. Most hotspots were of the high-high aggregation type in spatial autocorrelation.
3.4. Conservation Gaps of Threatened Plants
To estimate the protective efficacy of PAs on threatened species, by overlapping the species richness distribution map and the NNR distribution map, we found that only 10.6% of the grid area (1331 of 12,578 cells) was covered by existing NNRs; 0.27% of the grid area (34 of 12,578 cells) with high species richness was not covered by existing NNRs and 1.66% of the grid area (207 of 12,578 cells) with mid-high species richness was not covered by existing NNRs (complete conservation gaps). We calculated the percentage for 60 threatened plants covered by PAs. As shown in Figure 4, 31 threatened plants were protected in NNRs, but only within <5% of their distribution areas. Only five threatened plants were protected in NNRs covering >50% of their distribution areas. As shown in Table 3, six of the 20 nationally-protected species (Gymnadenia conopsea, Juglans mandshurica Maxim, Malaxis monophyllos, Dioscorea nipponica, Chosenia arbutifolia and Actinidia argute) were identified in national conservation gaps, which indicates no protection. Ten species were found in NNRs with <10% of their distribution areas. Only four of the 20 nationally-protected species (Astragalus membranaceus, Glycine soja, Myriophyllum propinquum and Nelumbo nucifera) were protected by NNRs with >40% of their distribution areas. Three of the 10 provincially protected species (Syringa reticulata, Spiranthes sinensis, and Rosa koreana Kom) were identified in provincial conservation gaps, which indicates no protection, while seven species were protected in NNRs with <10% of their distribution areas.
4. Discussion
4.1. Conservation of Threatened Plants in Sanjiang Plain
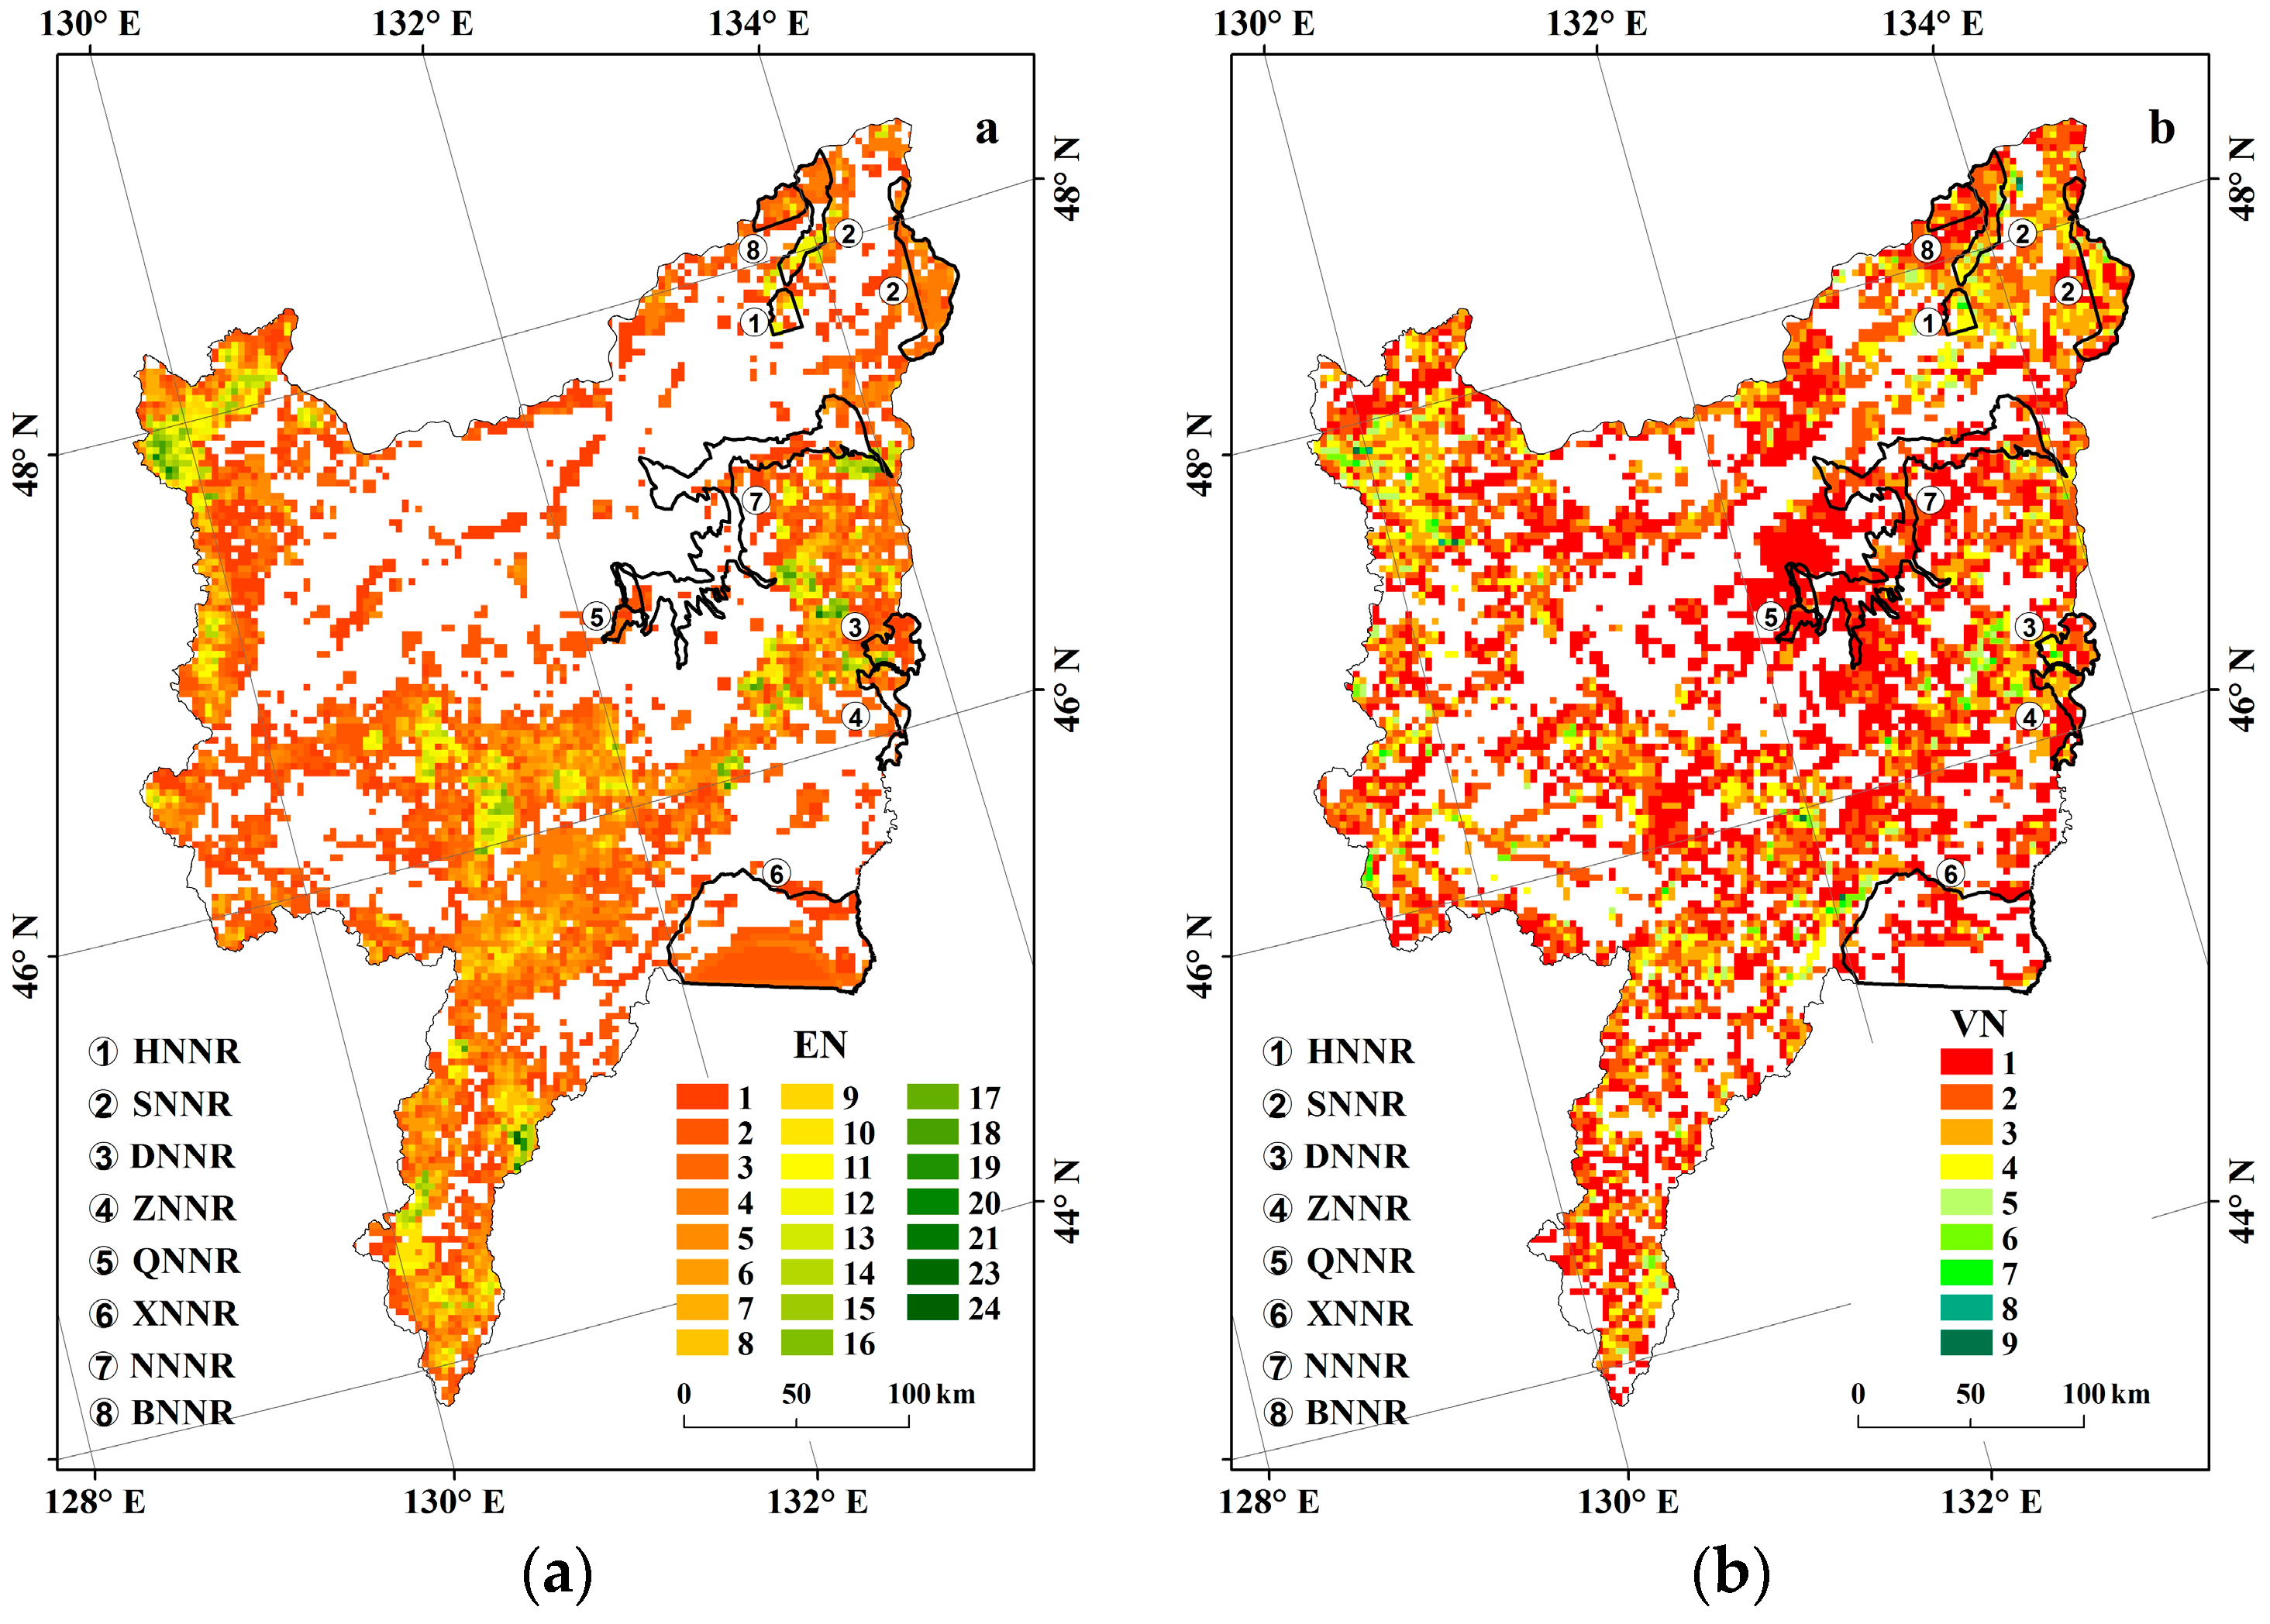
Our results show that vulnerable and endangered plant species are mainly located in the southern, western and eastern Sanjiang Plain (Figure 5), which is consistent with findings from Zhang et al. [45]. In this study, we found that species richness was higher in the western than the eastern Sanjiang Plain. For the entire study area, the distribution of NNRs is far from providing adequate coverage of threatened plants. The total PA coverage is low when compared with the commonly used target of 10% [46], with only 8.7% of the area having PA status. NNRs cover 11.09% of the area of endangered plants and 12.18% of the area of vulnerable plants. At least 88% of the area of threatened species is not covered by NNRs.
In this study, we identified 30 hotspots of threatened plants, most located in mountainous areas, which is consistent with the results of Tang et al. [47]. As shown in Figure 3, we found that parts of the areas of the seven hotspots in eastern Sanjiang Plain are covered by NNRs, but the covered area is very limited. The rest of the hotspots, located in Xiaoxinganling, Laoyeling Mountains, and Taipingling, are not covered by any NNRs (Figure 3 and Figure 5). Compared with other hotspots, we found that three hotspots in the northern part of Sanjiang Plain and one hotspot in XNNR are rather special. Although the species richness of these four hotspots was not high, they were identified as important hotspots. According to the spatial autocorrelation analysis, in terms of spatial autocorrelation types, these four hotspots are high-low aggregation type. Zhao et al. [48] reported that cropland expansion was widespread in Sanjiang Plain from 1990–2010, which largely led to habitat fragmentation of the endangered species in this region. Isolated wetland has become an important habitat for threatened species in the northern part of Sanjiang Plain. Thus, there are considerable conservation gaps among these hotspot areas. Habitat conservation should be a high priority to prevent many threatened plant species from going extinct. We suggest that new nature reserves be established to fill the conservation gaps in these hotspot areas for threatened plants.
4.2. Threatened Plant Biodiversity Conservation: Problems and Recommendations
The destruction or fragmentation of natural habitats can lead to the extinction of threatened plant species. During the past three decades, the area has experienced extensive reclamation that has resulted in the rapid vanishing of marsh area, as well as croplands being converted from forests and grasslands. The important changes have been a decline in wetland (−53.32%) and a slight decline in woodland (−1.87%). Meanwhile, there was an increase in farmland (+13.40%) [30,49]. Moreover, overexploitation of natural resources and environmental pollution have led to serious habitat degradation, potentially compromising species survival. Our results also confirm that the threatened species richness is higher in mountains than in low-altitude areas. Compared with the plain, the human disturbance factors are relatively weak in mountainous areas.
As shown in Figure 3, most of the spatial aggregation types of threatened species in mountainous areas are characterized as the high-high aggregation type. The number of threatened species is higher. On the other hand, human disturbance in the plains is more significant. This result is consistent with the findings of Zhang et al. [50]. For example, cropland expansion around isolated wetlands has resulted in the fragmentation of habitats of endangered plants. Most of the spatial aggregation types of threatened species in these regions are high-low. Therefore, these hotspots of high-high and high-low spatial aggregation should receive special attention, as this is where threatened species are particularly concentrated.
A large number of nature reserves have been established in Sanjiang Plain, and animal and plant protection has also been strengthened [22]. Although biodiversity conservation in Sanjiang Plain has achieved some success, the efficiency of these reserves is not ideal. The existing nature reserves in Sanjiang Plain are not adequate to protect the biodiversity of the threatened plants [45]. Our analysis clearly indicates that 11 threatened plants (including 6 national-level species) are not covered by nature reserves. Some hotspots with high species richness have not been adequately protected. The main reason for this is that the nature reserve system was originally established to conserve endangered animals, resulting in many endangered plant species being outside of PAs. The design of nature reserves was not completely rational in the past, nor have criteria addressing biogeographical and ecosystem representativeness been followed [51]. Conserving threatened plant species is therefore more urgent than ever before. On the basis of existing PAs in the eastern Sanjiang Plain, we propose the establishment of ecological corridors to protect threatened plant diversity. We also suggest filling the conservation gaps between the hotspots and nature reserves by establishing new protected areas and enlarging isolated nature reserves in the western and southern Sanjiang Plain. By reducing the area without protection for endangered or vulnerable plant species, new nature reserves can increase the proportion of protected species.
4.3. Uncertainty of the Present Study
This study successfully identifies the hotspots and conservation gaps of threatened plant species. However, there are some limitations to this study. First, the datasets regarding elevation range and habitat preferences of threatened species were important for predicting the distribution of species [12,22,24,52,53,54]. We confirm that DEM data at a fine scale provides more accurate support for predicting potential distributions of species than DEM data at coarse scale. In this study, we predicted the distribution of threatened species using DEM data with 90-m resolution, which may overestimate the distribution ranges of threatened species. Distribution information on threatened plant species is mainly extracted from different sources, including survey records, Flora of China, and local Floras. As the temporal and spatial resolutions of the datasets could directly impact the results of our research, there is an urgent need for more systematic field inventory surveys to obtain precise data on the species locations and trends of their habitat changes. Second, the land cover data we used were not updated. Land cover changes may also affect the distribution of threatened species [15]. Land use and land cover have changed rapidly over recent decades in Northeast China [48], especially species associated with cropland habitats. With the fragmentation and loss of natural wetlands attributed to cropland development, the habitat structures of threatened species may change. As human population has increased rapidly in Northeast China in recent decades, the anthropogenic influence is expanding and many threatened plant species have been overexploited as traditional medicines and foods, all of which could contribute either directly or indirectly to changes in species survival [55]. Continue studies based on field investigations and updated land cover datasets are needed in order to design nature reserves specifically for threatened plants at a local scale. Since this study used coarse datasets that are readily available, its usefulness could be extended to other countries and/or regions to assess species richness, conservation gaps of species and protection status.
5. Conclusions
As the global climate continues to change and an increasing number of species become extinct, people are paying closer attention to the consequences of decreased biodiversity. In this research, the hotspot and gap analysis strategy using multisource data provided a more accurate and comprehensive approach for predicting the distribution of vulnerable and endangered plant species. We identified some unprotected areas with remarkably high conservation value in Sanjiang Plain. Through our analysis, we not only found gaps, but also recommend where they could be filled most efficiently.
The results of our research show that the existing network of PAs is inadequate for the conservation of vulnerable and endangered plant species. Thirty one threatened plants were protected in NNRs, but only within <5% of their distribution areas. Only five threatened plants were protected in NNRs covering >50% of their distribution areas. NNRs cover 11.09% of the area of endangered plants and 12.18% of the area of vulnerable plants. At the national level, the reserve network still lacks minimum coverage for some endangered species; six nationally-protected plants have not been observed in the nature reserves and have no protection, while the protection rate of 10 other species is <10%. Furthermore, the distribution of only four threatened species is protected by >40%. Therefore, the existing nature reserves provide a limited degree of protection. We recommend expanding the existing NNRs in the eastern Sanjiang Plain to fill the conservation gaps, establishing miniature protection plots and creating new PAs and ecological corridors to link the existing PAs. Additionally, we should establish new nature reserves in the areas of Xiaoxinganling, Taipingling and the Laoyeling Mountains to improve the protective efficiency of nature reserves. We need to protect the high-high aggregation hotspots, that is the higher elevation wetlands and the surroundings of nature reserves. Second, we should protect the high-low aggregation hotspots (high-altitude central areas with low-altitude surroundings), that is the isolated wetlands or toroidal wetlands formed by abandoned farmlands.
Acknowledgments
This study was jointly supported by the National Key Research and Development Project (No. 2016YFA0602301), the National Natural Science Foundation of China (41771383) and the Jilin Normal University Graduate Research and Innovation Program (201633).
Author Contributions
Jiping Liu and Yanyan Zheng conceived of and designed the experiments. Yanyan Zheng performed the experiments. Baojia Du and Yanyan Zheng analyzed the data and wrote the manuscript draft. Dehua Mao and Jiping Liu helped with the review of the manuscript.
Conflicts of Interest
The authors declare no conflict of interest.
References
- Hooper, D.U.; Chaplin, F.S.; Ewel, J.J.; Hector, A.; Inchausti, P.; Lavorel, S.; Lawton, J.H.; Lodge, D.M.; Loreau, M.; Naeem, S.; et al. Effects of biodiversity on ecosystem functioning: A consensus of current knowledge. Ecol. Monogr. 2005, 75, 3–35. [Google Scholar] [CrossRef] [Green Version]
- Chapin, F.S.; Zavaleta, E.S.; Eviner, V.T.; Naylor, R.L.; Vitousek, P.M.; Reynolds, H.L.; Hooper, D.U.; Lavorel, S.; Sala, O.E.; Hobbie, S.E.; et al. Consequences of changing biodiversity. Nature 2000, 405, 234–242. [Google Scholar] [CrossRef] [PubMed]
- Gamfeldt, L.; Hillebrand, H.; Jonsson, P.R. Multiple functions increase the importance of biodiversity for overall ecosystem functioning. Ecology 2008, 89, 1223–1231. [Google Scholar] [CrossRef] [PubMed]
- Drielsma, M.; Love, J.; Manion, G.; Williams, K.; Saremi, H.; Harwood, T. Bridging the gap between climate science and regional-scale biodiversity conservation in south-eastern Australia. Ecol. Model. 2017, 360, 343–362. [Google Scholar] [CrossRef]
- Sala, O.E.; Stuart Chapin, F., III; Armesto, J.J.; Berlow, E.; Bloomfield, J.; Dirzo, R.; Huber-Sanwald, E.; Huenneke, L.F.; Jackson, R.B.; Kinzig, A.; et al. Global biodiversity scenarios for the year 2100. Science 2000, 287, 1770–1774. [Google Scholar] [CrossRef] [PubMed]
- De Vos, J.M.; Joppa, L.N.; Gittleman, J.L.; Stephens, P.R.; Pimm, S.L. Estimating the normal background rate of species extinction. Conserv. Biol. 2015, 29, 452–462. [Google Scholar] [CrossRef] [PubMed] [Green Version]
- Myers, N. Biodiversity hotspots for conservation priorities. Nature 2000, 403, 853–858. [Google Scholar] [CrossRef] [PubMed]
- Joppa, L.N.; Visconti, P.; Jenkins, C.N.; Pimm, S.L. Achieving the convention on biological diversity’s goals for plant conservation. Science 2013, 341, 1100–1103. [Google Scholar] [CrossRef] [PubMed]
- Heywood, V.H.; Dulloo, M.E. In Situ Conservation of Wild Plant Species: A Critical Global Review of Best Practices; International Plant Genetic Resources Institute (IPGRI): Technical Bulletin No. 11; Bioversity International: Rome, Italy, 2005. [Google Scholar]
- Rodrigues, A.S.L.; Tratt, R.; Wheeler, B.D.; Gaston, K.J. The performance of existing networks of conservation areas in representing biodiversity. Proc. R. Soc. Lond. B Biol. Sci. 1999, 266, 1453–1460. [Google Scholar] [CrossRef]
- Margules, C.R. Systematic conservation planning. Nature 2000, 405, 243–253. [Google Scholar] [CrossRef] [PubMed]
- Maiorano, L.; Falcucci, A.; Boitani, L. Gap analysis of terrestrial vertebrates in Italy: Priorities for conservation planning in a human dominated landscape. Biol. Conserv. 2006, 133, 455–473. [Google Scholar] [CrossRef]
- Jenkins, M.; Green, R.E.; Madden, J. The challenge of measuring global change in wild nature: Are things getting better or worse? Conserv. Biol. 2003, 17, 20–23. [Google Scholar] [CrossRef]
- Xu, Y.; Shen, Z.; Ying, L.; Wang, Z.; Huang, J.; Zang, R.; Jiang, Y. Hotspot analyses indicate significant conservation gaps for evergreen broadleaved woody plants in China. Sci. Rep. 2017, 7, 1859. [Google Scholar] [CrossRef] [PubMed]
- Feng, G.; Mao, L.; Benito, B.M.; Swenson, N.G.; Svenning, J.-C. Historical anthropogenic footprints in the distribution of threatened plants in China. Biol. Conserv. 2017, 210, 3–8. [Google Scholar] [CrossRef]
- Huang, J.; Huang, J.; Liu, C.; Zhang, J.; Lu, X.; Ma, K. Diversity hotspots and conservation gaps for the Chinese endemic seed flora. Biol. Conserv. 2016, 198, 104–112. [Google Scholar] [CrossRef]
- Jennings, M.D. Gap analysis: Concepts, methods, and recent results. Landsc. Ecol. 2000, 15, 5–20. [Google Scholar] [CrossRef]
- Mendoza-Fernández, A.; Pérez-García, F.J.; Medina-Cazorla, J.M.; Martínez-Hernández, F.; Garrido-Becerra, J.A.; Sánchez, E.S.; Mota, J.F. Gap analysis and selection of reserves for the threatened flora of eastern Andalusia, a hot spot in the eastern Mediterranean region. Acta Bot. Gallica 2010, 157, 749–767. [Google Scholar] [CrossRef]
- Knight, A.T.; Cowling, R.M.; Rouget, M.; Balmford, A.; Lombard, A.T.; Campbell, B.M. Knowing but not doing: Selecting priority conservation areas and the research-implementation gap. Conserv. Biol. 2008, 22, 610–617. [Google Scholar] [CrossRef] [PubMed]
- Sharafi, S.M.; Moilanen, A.; White, M.; Burgman, M. Integrating environmental gap analysis with spatial conservation prioritization: A case study from Victoria, Australia. J. Environ. Manag. 2012, 112, 240–251. [Google Scholar] [CrossRef] [PubMed]
- Du, H.; Jiang, H.; Zhang, L.; Mao, D.; Wang, Z. Evaluation of spectral scale effects in estimation of vegetation leaf area index using spectral indices methods. Chin. Geogr. Sci. 2016, 26, 731–744. [Google Scholar] [CrossRef]
- Liu, J.; Li, C.; Liu, Q.; Yu, Y. Gap analysis of wetland bird habitat diversity in sanjiang plain. In Proceedings of the Geoinformatics 2008 and Joint Conference on GIS and Built Environment, Geo-Simulation and Virtual GIS Environments, Guangzhou, China, 28–29 June 2008; SPIE: Bellingham, WA, USA, 2008; p. 9. [Google Scholar]
- Xiaowen, L.; Haijin, Z.; Li, M. Gap analysis and conservation network for freshwater wetlands in central yangtze ecoregion. Sci. World J. 2013, 2013, 918718. [Google Scholar] [CrossRef] [PubMed]
- Zhang, Y.-B.; Liu, Y.-L.; Fu, J.-X.; Phillips, N.; Zhang, M.-G.; Zhang, F. Bridging the “gap” in systematic conservation planning. J. Nat. Conserv. 2016, 31, 43–50. [Google Scholar] [CrossRef]
- Tian, Y.; Bai, X.; Wang, S.; Qin, L.; Li, Y. Spatial-temporal changes of vegetation cover in Guizhou province, southern China. Chin. Geogr. Sci. 2017, 27, 25–38. [Google Scholar] [CrossRef]
- Liu, H.; Zhang, S.; Li, Z.; Lu, X.; Yang, Q. Impacts on wetlands of large-scale land-use changes by agricultural development: The small Sanjiang plain, China. Ambio J. Hum. Environ. 2004, 33, 306–310. [Google Scholar] [CrossRef]
- Wang, Z.; Zhang, B.; Zhang, S.; Li, X.; Liu, D.; Song, K.; Li, J.; Li, F.; Duan, H. Changes of land use and of ecosystem service values in Sanjiang plain, northeast China. Environ. Monit. Assess. 2006, 112, 69–91. [Google Scholar] [CrossRef] [PubMed]
- Zhang, S.; Na, X.; Kong, B.; Wang, Z.; Jiang, H.; Yu, H.; Zhao, Z.; Li, X.; Liu, C.; Dale, P. Identifying wetland change in china’s Sanjiang plain using remote sensing. Wetlands 2009, 29, 302–313. [Google Scholar] [CrossRef]
- Liu, T.; Zhang, S.; Xu, X.; Bu, K.; Ning, J.; Chang, L. High resolution land cover datasets integration and application based on landsat and globcover data from 1975 to 2010 in siberia. Chin. Geogr. Sci. 2016, 26, 429–438. [Google Scholar] [CrossRef]
- Wang, Z.; Mao, D.; Li, L.; Jia, M.; Dong, Z.; Miao, Z.; Ren, C.; Song, C. Quantifying changes in multiple ecosystem services during 1992–2012 in Sanjiang Plain of China. Sci. Total Environ. 2015, 514, 119–130. [Google Scholar] [CrossRef] [PubMed]
- Rodríguez, J.P.; Brotons, L.; Bustamante, J.; Seoane, J. The application of predictive modelling of species distribution to biodiversity conservation. Divers. Distrib. 2007, 13, 243–251. [Google Scholar] [CrossRef]
- Tews, J.; Brose, U.; Grimm, V.; Tielbörger, K.; Wichmann, M.C.; Schwager, M.; Jeltsch, F. Animal species diversity driven by habitat heterogeneity/diversity: The importance of keystone structures. J. Biogeogr. 2004, 31, 79–92. [Google Scholar] [CrossRef]
- Zhang, M.-G.; Zhou, Z.-K.; Chen, W.-Y.; Cannon, C.H.; Raes, N.; Slik, J.W.F. Major declines of woody plant species ranges under climate change in Yunnan, China. Divers. Distrib. 2014, 20, 405–415. [Google Scholar] [CrossRef]
- Hutto, R.; Reel, S.; Landres, P.B. A critical evaluation of the species approach to biological conservation. Endanger. Species 1987, 4, 1–4. [Google Scholar]
- Oldfield, T.E.E.; Smith, R.J.; Harrop, S.R.; Leader-Williams, N. A gap analysis of terrestrial protected areas in England and its implications for conservation policy. Biol. Conserv. 2004, 120, 303–309. [Google Scholar] [CrossRef]
- Ord, J.K.; Getis, A. Local spatial autocorrelation statistics: Distributional issues and an application. Geogr. Anal. 1995, 27, 286–306. [Google Scholar] [CrossRef]
- Moran, P.A.P. Notes on continuous stochastic phenomena. Biometrika 1950, 37, 17–23. [Google Scholar] [CrossRef] [PubMed]
- Anselin, L.; Syabri, I.; Kho, Y. Geoda: An introduction to spatial data analysis. Geogr. Anal. 2006, 38, 5–22. [Google Scholar] [CrossRef]
- Lichstein, J.W.; Simons, T.R.; Shriner, S.A.; Franzreb, K.E. Spatial autocorrelation and autoregressive models in ecology. Ecol. Monogr. 2002, 72, 445–463. [Google Scholar] [CrossRef]
- Dormann, C.F.; McPherson, J.M.; Araújo, M.B.; Bivand, R.; Bolliger, J.; Carl, G.; Davies, R.G.; Hirzel, A.; Jetz, W.; Daniel Kissling, W.; et al. Methods to account for spatial autocorrelation in the analysis of species distributional data: A review. Ecography 2007, 30, 609–628. [Google Scholar] [CrossRef]
- Yao, H.; Sinha, S.; Chiang, C.; Hong, X.; Cai, Y. Efficient process-hotspot detection using range pattern matching. In Proceedings of the 2006 IEEE/ACM International Conference on Computer Aided Design, San Jose, CA, USA, 5–9 Novermber 2006; pp. 625–632. [Google Scholar]
- Getis, A.; Ord, J.K. The analysis of spatial association by use of distance statistics. Geogr. Anal. 1992, 24, 189–206. [Google Scholar] [CrossRef]
- Diniz-Filho, J.A.F.; De Campos Telles, M.P. Spatial autocorrelation analysis and the identification of operational units for conservation in continuous populations análisis de autocorrelación espacial e identificación de unidades operacionales para la conservación en poblaciones continuas. Conserv. Biol. 2002, 16, 924–935. [Google Scholar] [CrossRef]
- Jeefoo, P.; Tripathi, N.K.; Souris, M. Spatio-temporal diffusion pattern and hotspot detection of dengue in Chachoengsao province, Thailand. Int. J. Environ. Res. Public Health 2011, 8, 51–74. [Google Scholar] [CrossRef] [PubMed]
- Zhang, Z.; He, J.-S.; Li, J.; Tang, Z. Distribution and conservation of threatened plants in China. Biol. Conserv. 2015, 192, 454–460. [Google Scholar] [CrossRef]
- Miller, K.R. The Bali Action Plan: A Framework for the Future of Protected Areas; Smithsonian Institution Press: Washington, DC, USA, 1984; pp. 756–764. [Google Scholar]
- Tang, Z.; Wang, Z.; Zheng, C.; Fang, J. Biodiversity in China’s mountains. Front. Ecol. Environ. 2006, 4, 347–352. [Google Scholar] [CrossRef]
- Zhao, G.; Liu, J.; Kuang, W.; Ouyang, Z.; Xie, Z. Disturbance impacts of land use change on biodiversity conservation priority areas across China: 1990–2010. J. Geogr. Sci. 2015, 25, 515–529. [Google Scholar] [CrossRef]
- Wang, Z.; Song, K.; Ma, W.; Ren, C.; Zhang, B.; Liu, D.; Chen, J.M.; Song, C. Loss and fragmentation of marshes in Sanjiang Plain, northeast China, 1954–2005. Wetlands 2011, 31, 945–954. [Google Scholar] [CrossRef]
- Peng, X. China’s demographic history and future challenges. Science 2011, 333, 581–587. [Google Scholar] [CrossRef] [PubMed]
- López-Pujol, J.; Zhang, F.-M.; Ge, S. Plant biodiversity in China: Richly varied, endangered, and in need of conservation. Biodivers. Conserv. 2006, 15, 3983–4026. [Google Scholar] [CrossRef]
- Rodrigues, A.S.L.; Akçakaya, H.R.; Andelman, S.J.; Bakarr, M.I.; Boitani, L.; Brooks, T.M.; Chanson, J.S.; Fishpool, L.D.C.; Da Fonseca, G.A.B.; Gaston, K.J.; et al. Global gap analysis: Priority regions for expanding the global protected-area network. BioScience 2004, 54, 1092–1100. [Google Scholar] [CrossRef]
- Catullo, G.; Masi, M.; Falcucci, A.; Maiorano, L.; Rondinini, C.; Boitani, L. A gap analysis of southeast Asian mammals based on habitat suitability models. Biol. Conserv. 2008, 141, 2730–2744. [Google Scholar] [CrossRef]
- Huang, F. Dynamics and responses of vegetation to climatic variations in Ziya-Daqing basins, China. Chin. Geogr. Sci. 2016, 26, 478–494. [Google Scholar] [CrossRef]
- Zhang, Y.-B.; Wang, Y.-Z.; Phillips, N.; Ma, K.-P.; Li, J.-S.; Wang, W. Integrated maps of biodiversity in the Qinling mountains of china for expanding protected areas. Biol. Conserv. 2017, 210, 64–71. [Google Scholar] [CrossRef]
Figure 1.
(a) Location and (b) land cover map of Sanjiang Plain. Zhenbaodao National Nature Reserve (ZNNR), Dongfanghong National Nature Reserve (DNNR), Bachadao National Nature Reserve (BNNR), Sanjiang National Nature Reserve (SNNR), Naolihe National Nature Reserve (NNNR), Xingkaihu National Nature Reserve (XNNR), Qixinghe National Nature Reserve (QNNR) and Honghe National Nature Reserve (HNNR)
Figure 2.
Species richness pattern of threatened plants in Sanjiang Plain.

Figure 3.
Spatial distribution pattern of aggregation type and hotspots of threatened plant species.
Figure 3.
Spatial distribution pattern of aggregation type and hotspots of threatened plant species.

Figure 4.
Numbers of threatened species in different percentages of areas covered by existing NNRs.
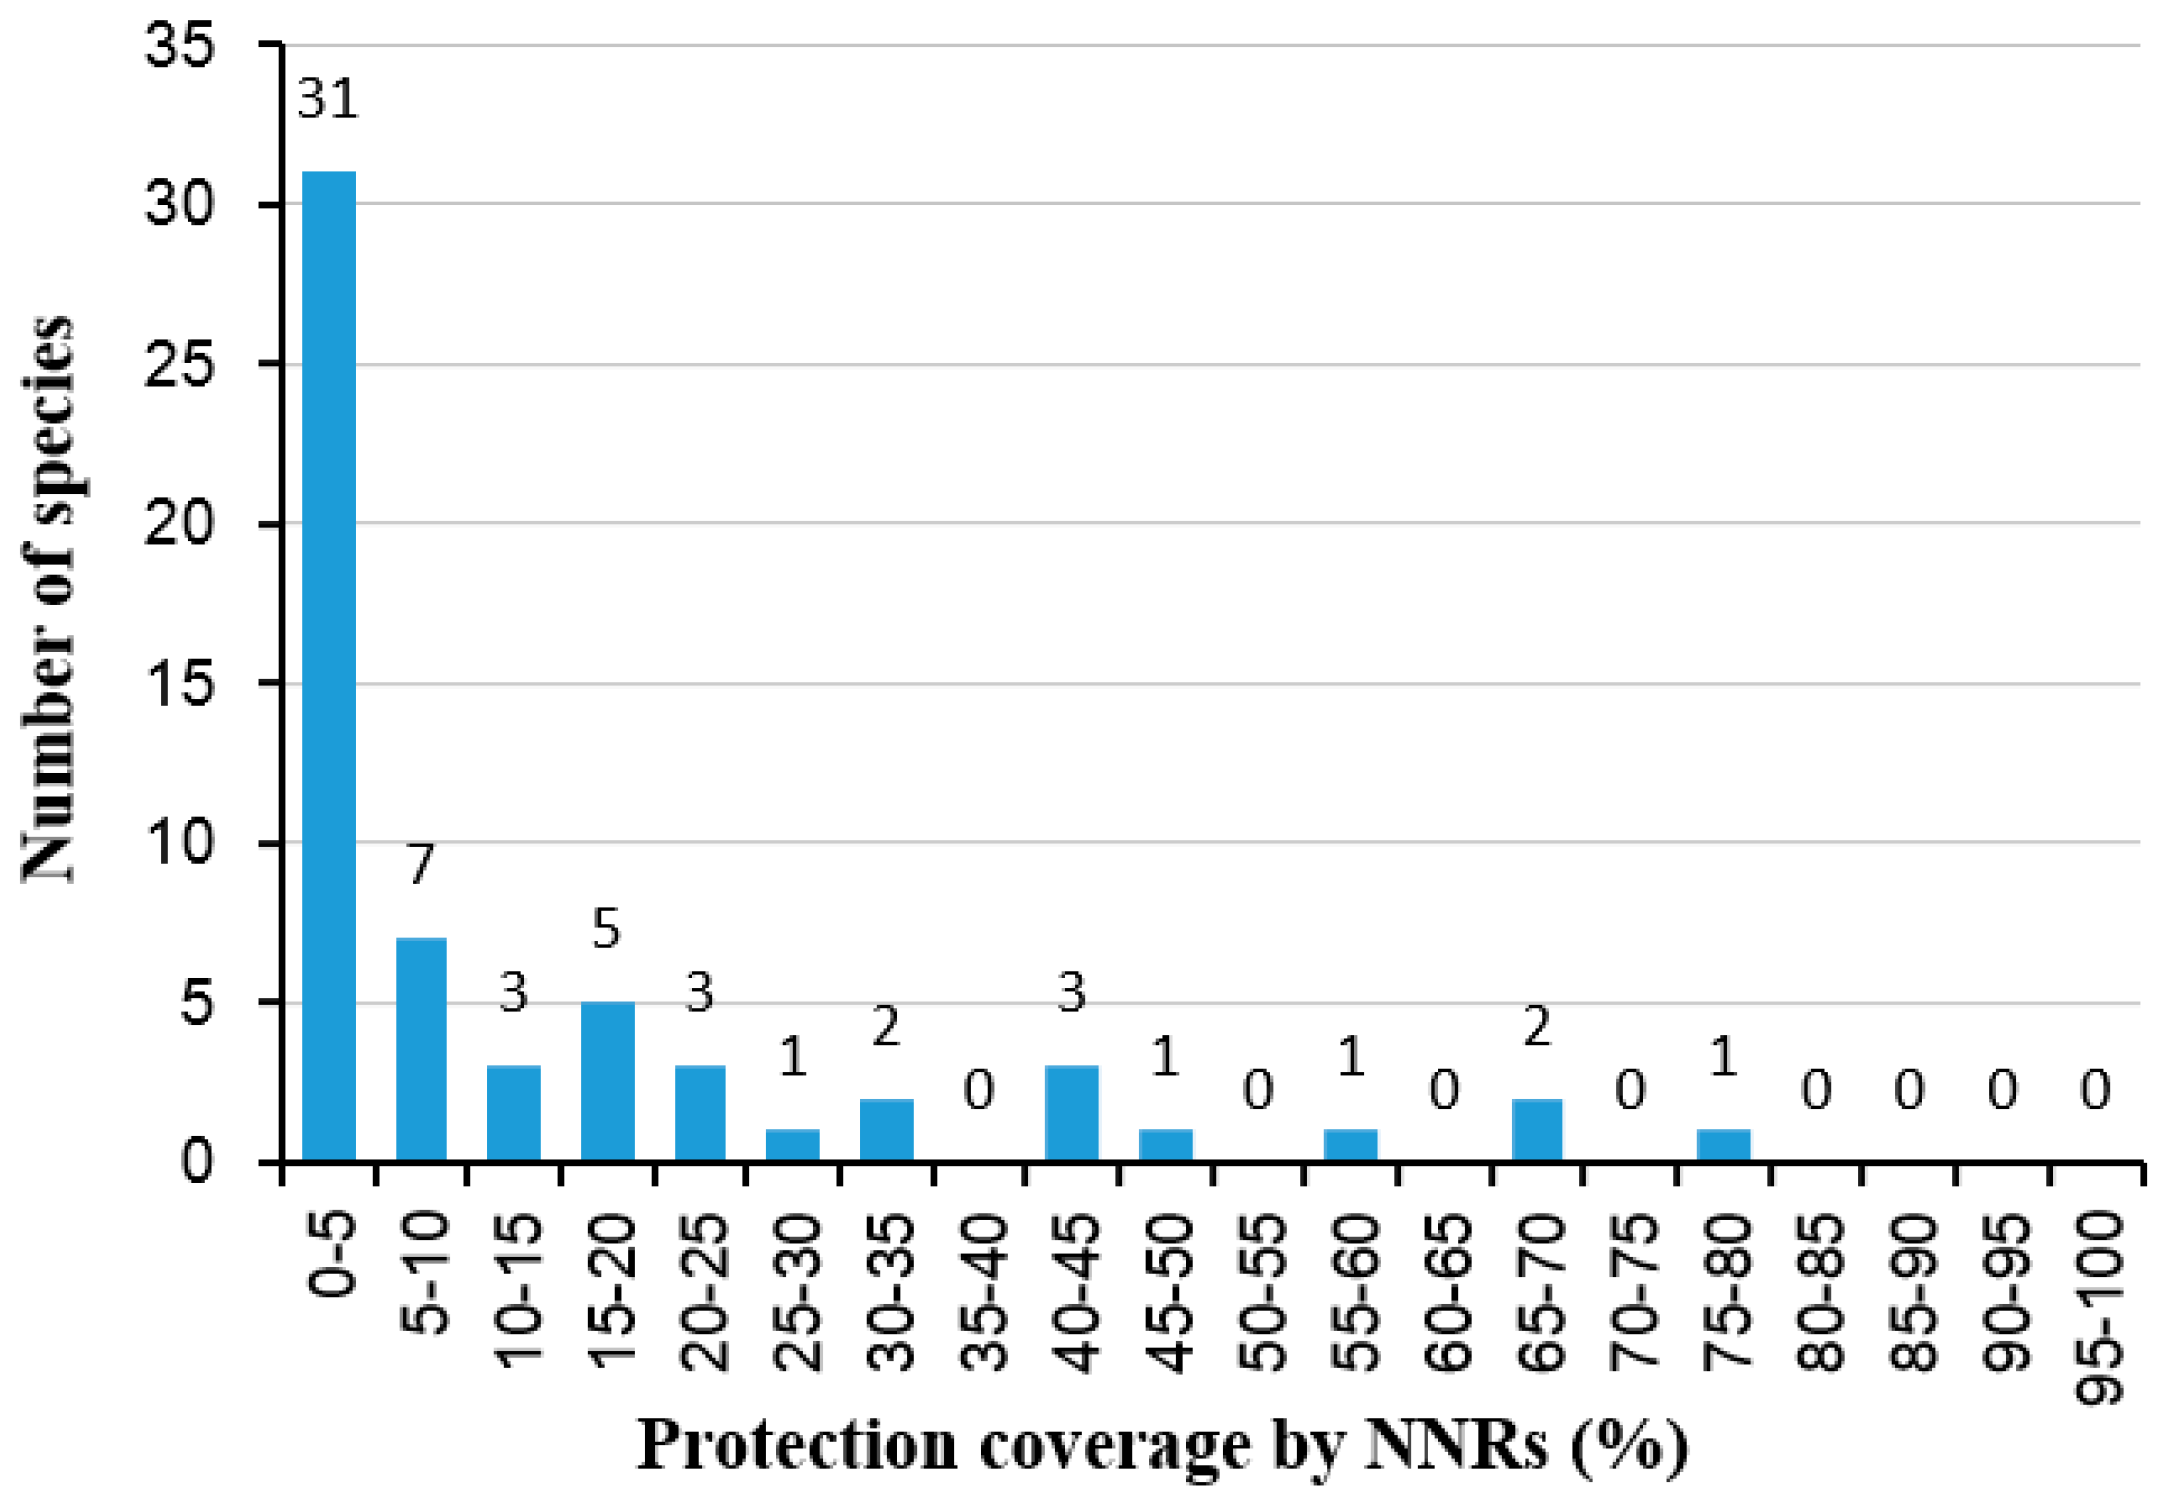
Figure 5.
Species richness pattern of endangered plants (a) and vulnerable plants (b) and distribution of NNRs in Sanjiang Plain.
Figure 5.
Species richness pattern of endangered plants (a) and vulnerable plants (b) and distribution of NNRs in Sanjiang Plain.

Table 1.
Accuracy of the predicted plant species in Sanjiang Plain.
| Area | Actual Numbers of Plant Species | Predicted Numbers of Plant Species | Prediction Accuracy (%) |
|---|---|---|---|
| ZNNR | 36 | 33 | 91.67 |
| SNNR | 37 | 33 | 89.19 |
| DNNR | 33 | 32 | 96.97 |
| BNNR | 46 | 41 | 89.13 |
| Average | – | – | 91.74 |
Table 2.
Proportion statistics of spatial autocorrelation type of vulnerable and endangered plant species.
Table 2.
Proportion statistics of spatial autocorrelation type of vulnerable and endangered plant species.
| Area | Uncorrelated (%) | High-High Aggregation (%) | Low-Low Aggregation (%) | High-Low Aggregation (%) | Low-High Aggregation (%) |
|---|---|---|---|---|---|
| ZNNR | 39.24 | 22.78 | 24.05 | 6.33 | 7.59 |
| DNNR | 63.08 | 21.54 | 3.08 | 12.31 | 0.00 |
| XNNR | 36.95 | 56.19 | 0.00 | 6.86 | 0.00 |
| QNNR | 10.71 | 50.00 | 0.00 | 39.29 | 0.00 |
| SNNR | 28.86 | 57.32 | 0.00 | 0.00 | 13.82 |
| HNNR | 27.78 | 50.00 | 0.00 | 0.00 | 22.22 |
| NNNR | 10.18 | 3.62 | 83.03 | 0.00 | 3.17 |
| BNNR | 65.22 | 19.57 | 0.00 | 0.00 | 15.22 |
| Sanjiang Plain | 26.75 | 21.28 | 41.37 | 4.08 | 6.54 |
Table 3.
Percentage of threatened plants being protected on Sanjiang Plain.
| Plant Species | Protection Level | EN/VU | Unprotected Area (km2) | Protected Area (km2) | Total Area (km2) | Protected Area/Total Area (%) |
|---|---|---|---|---|---|---|
| Utricularia intermedia | regional | EN | 35.73 | 0 | 35.73 | 0 |
| Gymnadenia conopsea | national II | EN | 531.76 | 0 | 531.76 | 0 |
| Syringa reticulata | provincial | EN | 101.66 | 0 | 101.66 | 0 |
| Juglans mandshurica Maxim | national III | EN | 714.88 | 0 | 714.88 | 0 |
| Malaxis monophyllos | national II | EN | 39.91 | 0 | 39.91 | 0 |
| Dioscorea nipponica | national II | EN | 26.66 | 0 | 26.66 | 0 |
| Spiranthes sinensis | provincial | EN | 365.61 | 0 | 365.61 | 0 |
| Chosenia arbutifolia | national II | EN | 7.40 | 0 | 7.40 | 0 |
| Commelina communis | regional | VU | 48.04 | 0 | 48.04 | 0 |
| Rosa koreana Kom | provincial | EN | 478.51 | 0 | 478.51 | 0 |
| Actinidia arguta | national II | EN | 1636 | 0 | 1636 | 0 |
| Lilium callosum | regional | VU | 717.18 | 0.66 | 717.84 | 0.09 |
| Polemonium liniflorum | regional | VU | 439.13 | 0.74 | 439.87 | 0.17 |
| Platycodon grandiflorus | provincial | EN | 2630.32 | 11.63 | 2641.95 | 0.44 |
| Maackia amurensis | provincial | EN | 1563.29 | 9.04 | 1572.33 | 0.57 |
| Platanthera hologlottis | national II | EN | 413.54 | 2.62 | 416.15 | 0.63 |
| Lobelia sessilifolia | regional | VU | 409.35 | 2.62 | 411.96 | 0.64 |
| Actinidia polygamae | national II | EN | 3611.04 | 33.79 | 3644.83 | 0.93 |
| Schisandra chinensis | national II | EN | 148.78 | 1.63 | 150.41 | 1.08 |
| Rubus saxatilis | provincial | EN | 2187.05 | 27.23 | 2214.28 | 1.23 |
| Tilia amurensis | national II | EN | 1100.28 | 18.18 | 1118.46 | 1.63 |
| Paris verticillata | national II | EN | 1044.97 | 18.18 | 1063.15 | 1.71 |
| Ribes mandshuricum | national II | EN | 950.78 | 18.17 | 968.95 | 1.88 |
| Berberis amurensis | provincial | EN | 974.19 | 19.28 | 993.47 | 1.94 |
| Gentiana manshurica | provincial | EN | 139.21 | 3.72 | 142.93 | 2.60 |
| Acer mono Maxim | provincial | EN | 1663.63 | 52.06 | 1715.69 | 3.03 |
| Acanthopanax senticosus Harms | national III | EN | 1547.04 | 52.06 | 1599.11 | 3.26 |
| Phellodendron amurense | national II | EN | 1408.19 | 52.06 | 1460.26 | 3.57 |
| Aralia elata | provincial | EN | 1560.39 | 67.10 | 1627.49 | 4.12 |
| Ottelia alismoides | regional | VU | 347.71 | 16.26 | 363.97 | 4.47 |
| Valeriana amurensis | regional | VU | 1585.90 | 75.30 | 1661.20 | 4.53 |
| Hypericum ascyron | regional | VU | 543.96 | 30.99 | 574.95 | 5.39 |
| Fraxinus mandschurica | national II | EN | 674.99 | 40.11 | 715.10 | 5.61 |
| Anemone silvestris | regional | VU | 204.13 | 15.87 | 220.00 | 7.21 |
| Sagittaria trifolia | regional | VU | 473.03 | 44.33 | 517.36 | 8.57 |
| Butomus umbellatus | regional | VU | 169.33 | 16.36 | 185.69 | 8.81 |
| Sagittaria natans | national II | EN | 270.71 | 27.40 | 298.11 | 9.19 |
| Habenaria sagittifera | regional | EN | 146.43 | 15.11 | 161.54 | 9.35 |
| Caltha natans | regional | VU | 186.86 | 28.95 | 215.81 | 13.42 |
| Trollius ledebouri | regional | EN | 598.55 | 99.46 | 698.01 | 14.25 |
| Gentiana triflora | regional | VU | 726.47 | 125.10 | 851.57 | 14.69 |
| Eriophorum polystachion | regional | VU | 147.99 | 28.36 | 176.36 | 16.08 |
| Hemerocallis minor | regional | EN | 506.61 | 104.88 | 611.49 | 17.15 |
| Sparganium minimum Wallr | regional | VU | 3698.23 | 795.15 | 4493.38 | 17.70 |
| Monochoria korsakowii | regional | VU | 377.77 | 86.43 | 464.20 | 18.62 |
| Pedicularis grandiflora | regional | EN | 171.22 | 40.07 | 211.29 | 18.96 |
| Euryale ferox | regional | VU | 399.78 | 110.25 | 510.03 | 21.62 |
| Monochoria vaginalis | regional | VU | 612.15 | 170.18 | 782.33 | 21.75 |
| Lythrum salicaria | regional | VU | 91.93 | 26.99 | 118.92 | 22.70 |
| Stachys baicalensis | regional | EN | 806.85 | 311.24 | 1118.09 | 27.84 |
| Actinostemma tenerum | regional | VU | 9.00 | 3.96 | 12.96 | 30.53 |
| Lilium dauri | regional | EN | 67.68 | 30.86 | 98.56 | 31.33 |
| Nymphaea tetragona | regional | VU | 50.78 | 36.91 | 87.69 | 42.09 |
| Hemerocallislilio-asphodelus | regional | EN | 52.37 | 38.13 | 90.50 | 42.13 |
| Utricularia minor | regional | EN | 117.99 | 96.14 | 214.13 | 44.90 |
| Glycine soja | national II | EN | 208.85 | 185.75 | 394.60 | 47.07 |
| Astragalus membranaceus | national II | EN | 158.38 | 224.95 | 383.33 | 58.68 |
| Utricularia vulgaris | regional | EN | 645.32 | 1229.77 | 1875.09 | 65.58 |
| Myriophyllum propinquum | national II | EN | 72.00 | 155.34 | 227.34 | 68.33 |
| Nelumbo nucifera | national II | EN | 368.60 | 1201.15 | 1569.75 | 76.52 |
EN: endangered species, VU: vulnerable species. Unprotected area: area unprotected by a PA. Protected area: area protected by a PA. Total area: total distribution area of threatened plant species.
© 2018 by the authors. Licensee MDPI, Basel, Switzerland. This article is an open access article distributed under the terms and conditions of the Creative Commons Attribution (CC BY) license (http://creativecommons.org/licenses/by/4.0/).
Share and Cite
MDPI and ACS Style
Du, B.; Zheng, Y.; Liu, J.; Mao, D. Threatened Plants in China’s Sanjiang Plain: Hotspot Distributions and Gap Analysis. Sustainability 2018, 10, 194. https://doi.org/10.3390/su10010194
AMA Style
Du B, Zheng Y, Liu J, Mao D. Threatened Plants in China’s Sanjiang Plain: Hotspot Distributions and Gap Analysis. Sustainability. 2018; 10(1):194. https://doi.org/10.3390/su10010194
Chicago/Turabian StyleDu, Baojia, Yanyan Zheng, Jiping Liu, and Dehua Mao. 2018. "Threatened Plants in China’s Sanjiang Plain: Hotspot Distributions and Gap Analysis" Sustainability 10, no. 1: 194. https://doi.org/10.3390/su10010194
Note that from the first issue of 2016, this journal uses article numbers instead of page numbers. See further details here.