1. Introduction
In recent years, several new technologies for space heating have entered the German market. Moreover, German policies support these new technologies. The main reason for this trend is that with the introduction of the condensing boiler technology in the 1990s, the existing fuel oil and natural gas based heating technologies have reached their physical limitation with respect to efficiency and CO2 emissions.
Consequently, the German government has introduced the Renewable Energy Heat Act to enforce and promote renewable heating systems (Erneuerbare-Energien-Wärmegesetz); for every new building the investor has the obligation to use a certain share of renewable heat (e.g., 15% in the case of solar thermal collectors). This means that either heating systems must use 100% renewable fuel, like a wood-pellet-based central heating system, or conventional heating systems must use a minimum of renewable fuel, like rapeseed oil in oil heating systems or biomethane in natural gas heating systems. Since the use of solar thermal energy also leads to fossil fuel replacement, conventional boilers in combination with solar thermal systems are allowed as well. If the obligatory quota is overfulfilled, the investments into these types of heating systems are highly subsidized. With this legislation, the government aims to significantly reduce the use of fossil fuels and greenhouse gas emissions in the heating sector. The technologies explicitly mentioned in the legislation are listed as follows, with the required renewable quotas shown in parentheses:
- -
Fuel oil heating combined with solar thermal collectors (15%)
- -
Fuel oil heating using a quota of rapeseed oil (50%)
- -
Natural gas heating combined with solar thermal collectors (15%)
- -
Natural gas heating using a quota of biomethane (30%)
- -
Natural gas absorption heat pump system
- -
Wood pellet heating
- -
Wood pellet heating combined with solar thermal collectors (15%)
- -
An electric heat pump
All of these technologies are supported by the German government, as they are supposed to reduce fossil fuel usage and greenhouse gas (GHG) emissions, or at least CO2 emissions, compared to the older technologies. However, the technologies listed above differ in their fossil fuel and GHG emission savings. Moreover, the effects on local (non-GHG) emissions are more or less disregarded in the legislation.
The objective of this paper was the comparison of new technologies in the heating sector with respect to their GHG emission reductions and other environmental implications. We used two conventional heating systems as reference cases: a fuel oil condensing boiler and a natural gas condensing boiler. In our analysis, the environmental impacts were compared on a 3-level-basis:
Global emissions: A life cycle assessment was performed and the overall emissions and environmental impacts were evaluated. The goal of this analysis was to evaluate the following impact categories: cumulative energy demand, global warming, acidification, eutrophication, and tropospheric ozone precursor potential.
Local emissions: In this assessment, we accounted for the difference between the pollution occurring locally in residential areas and the pollution occurring in the neighborhoods of large conversion plants or similar sources. The objective of this step was to determine the local emissions and to assess their impact on human health.
Immissions: As immissions play a major role in the health damage caused by atmospheric emissions, we carefully modeled the diffusion process of local emissions in this study. The goal of the dispersion calculation was to determine the additional immission load caused by the heating systems with the highest emissions.
For the purpose of these comparisons, we tried to analyze the situation as it is in reality, which means in residential boiler rooms. This implies that database or manufacturer values from certification test procedures cannot be used for this assessment, as the test bed values differ significantly from those obtained by real applications. Therefore, the values obtained from databases of manufacturers were replaced by values from field studies, whenever possible.
2. Relevance of Global Emissions, Local Emissions and Immissions
2.1. Global Emissions and Life Cycle Assessment
The overall environmental effects of a product, process, or activity are evaluated by a so-called life cycle assessment (LCA). An LCA sums up all of the emissions and environmental effects resulting from the production, use, and disposal of a product, regardless of the geographical location of their generation. All emissions are equally weighted. Therefore, an LCA is an appropriate tool for calculating the integral environmental footprint of technologies on a global scale. An LCA is usually conducted in four steps:
Definition of the goal and scope. In this step, precise definitions of the product, comparison basis (functional unit), system boundaries and time frame of the assessment are made.
The life cycle inventory (LCI) stage. In this step, all of the environmental in- and out-flows of the investigated system are collected, calculated and analyzed. Databases are usually used to handle the large amount of data. When the data is unclear, the influences of uncertainties have to be investigated via a sensitivity analysis, as described in the discussion of the results.
Life cycle impact assessment. Here, the in- and out-flows of the system are categorized and allocated to impact categories, such as global warming or acidification. After calculating the environmental effects of the different categories, optional steps include normalization, grouping and weighting. In particular, weighting is based on subjective assumptions and valuations.
Interpretation of the results. In this last step, the results are summarized and discussed so that conclusions and recommendations can be drawn. Also, any limitations are discussed; a sensitivity analysis is an appropriate tool for this step.
The two key elements of an LCA are the assessment of the entire life cycle of the investigated system and the assessment of a variety of environmental impacts [
1,
2].
2.2. Local Emissions and Their Impact on Human Health
An LCA is an appropriate tool for evaluating the overall environmental impacts, including the impacts on biota, ecosystems, resource depletion, human health, and global warming. In some categories, such as global warming, it is irrelevant where the emissions occur, since the effects of the pollutants are global. In other categories, however, this is not the case. In particular, the location of the emissions is highly important when considering human health. For example, the emissions from a compressor station of a pipeline or a cargo ship have a lower impact on human health than if the same amount of emissions occurred in a residential area where the population density is higher. Since decentralized heating systems are installed in residential areas and thus represent an extreme case, a new methodology has to be developed.
Since the quantification of such damages would require extensive research, this study assesses the emissions that are relevant to the human health impact category by distinguishing local emissions from non-local emissions.
2.3. Immissions
In the third step we take local effects like the wind conditions and the topographic situation into account in order to quantify the effects of emissions on the local air quality. Immissions describe how humans uptake emissions and, as a result, immissions are restricted by law (Bundes-Immissionsschutzgesetz). Immissions can be either measured directly or modeled, if the emission sources, wind conditions and the topography of the location are known. Such models include dispersion calculations that cannot be applied to a whole country with a sufficient resolution. Nevertheless, estimations of the upper and lower limits are possible and they will be carried out in this work. In our simulation, only the particulate matter (PM) emissions are taken into account, because the effects of PM immissions on human health have been discussed the most by the public in the last few years. In order to contribute to this discussion, the additional immission load caused by the main pollutant in a typical, highly populated residential area in Germany is estimated.
The best and worst case scenarios associated with very good and very unfavorable meteorological dispersion conditions, respectively, were developed. Test reference years TRY 1 and TRY 15 from the DWD (Deutscher Wetterdienst, German weather agency) were used for this analysis. Moreover, different scenarios of the amount and location of emission sources in the study area were investigated.
For the dispersion calculations the software LASAT (Lagrangian Simulation of Aerosol-Transport) was used. This dispersion model computes the transport of trace substances in the atmosphere by simulating the dispersion and transport of a representative sample of tracer particles utilizing a random walk process (a Lagrangian simulation). It is a professional tool for the study of special dispersion situations and is based on a research model that was developed in 1980 and tested in various research projects. It served as the basis for the development of the dispersion model AUSTAL2000, which is the official reference model of the German Regulation ''TA Luft'' [
4,
5].
4. Results and Discussion
4.1. LCA Comparison
The results of the LCA are classified in terms of environmental impact categories. The categories used by the GEMIS software are:
- -
Cumulative energy demand
- -
Global warming potential
- -
Acidification potential
- -
Tropospheric ozone precursor potential
Since the quantification of the impacts of pollutant emissions on human health is controversial and complex, GEMIS does not support this impact category. However, the effects on human health are considered in
Section 4.2.
Cumulative energy demand (CED)
The results of the cumulative energy demand impact category are shown in
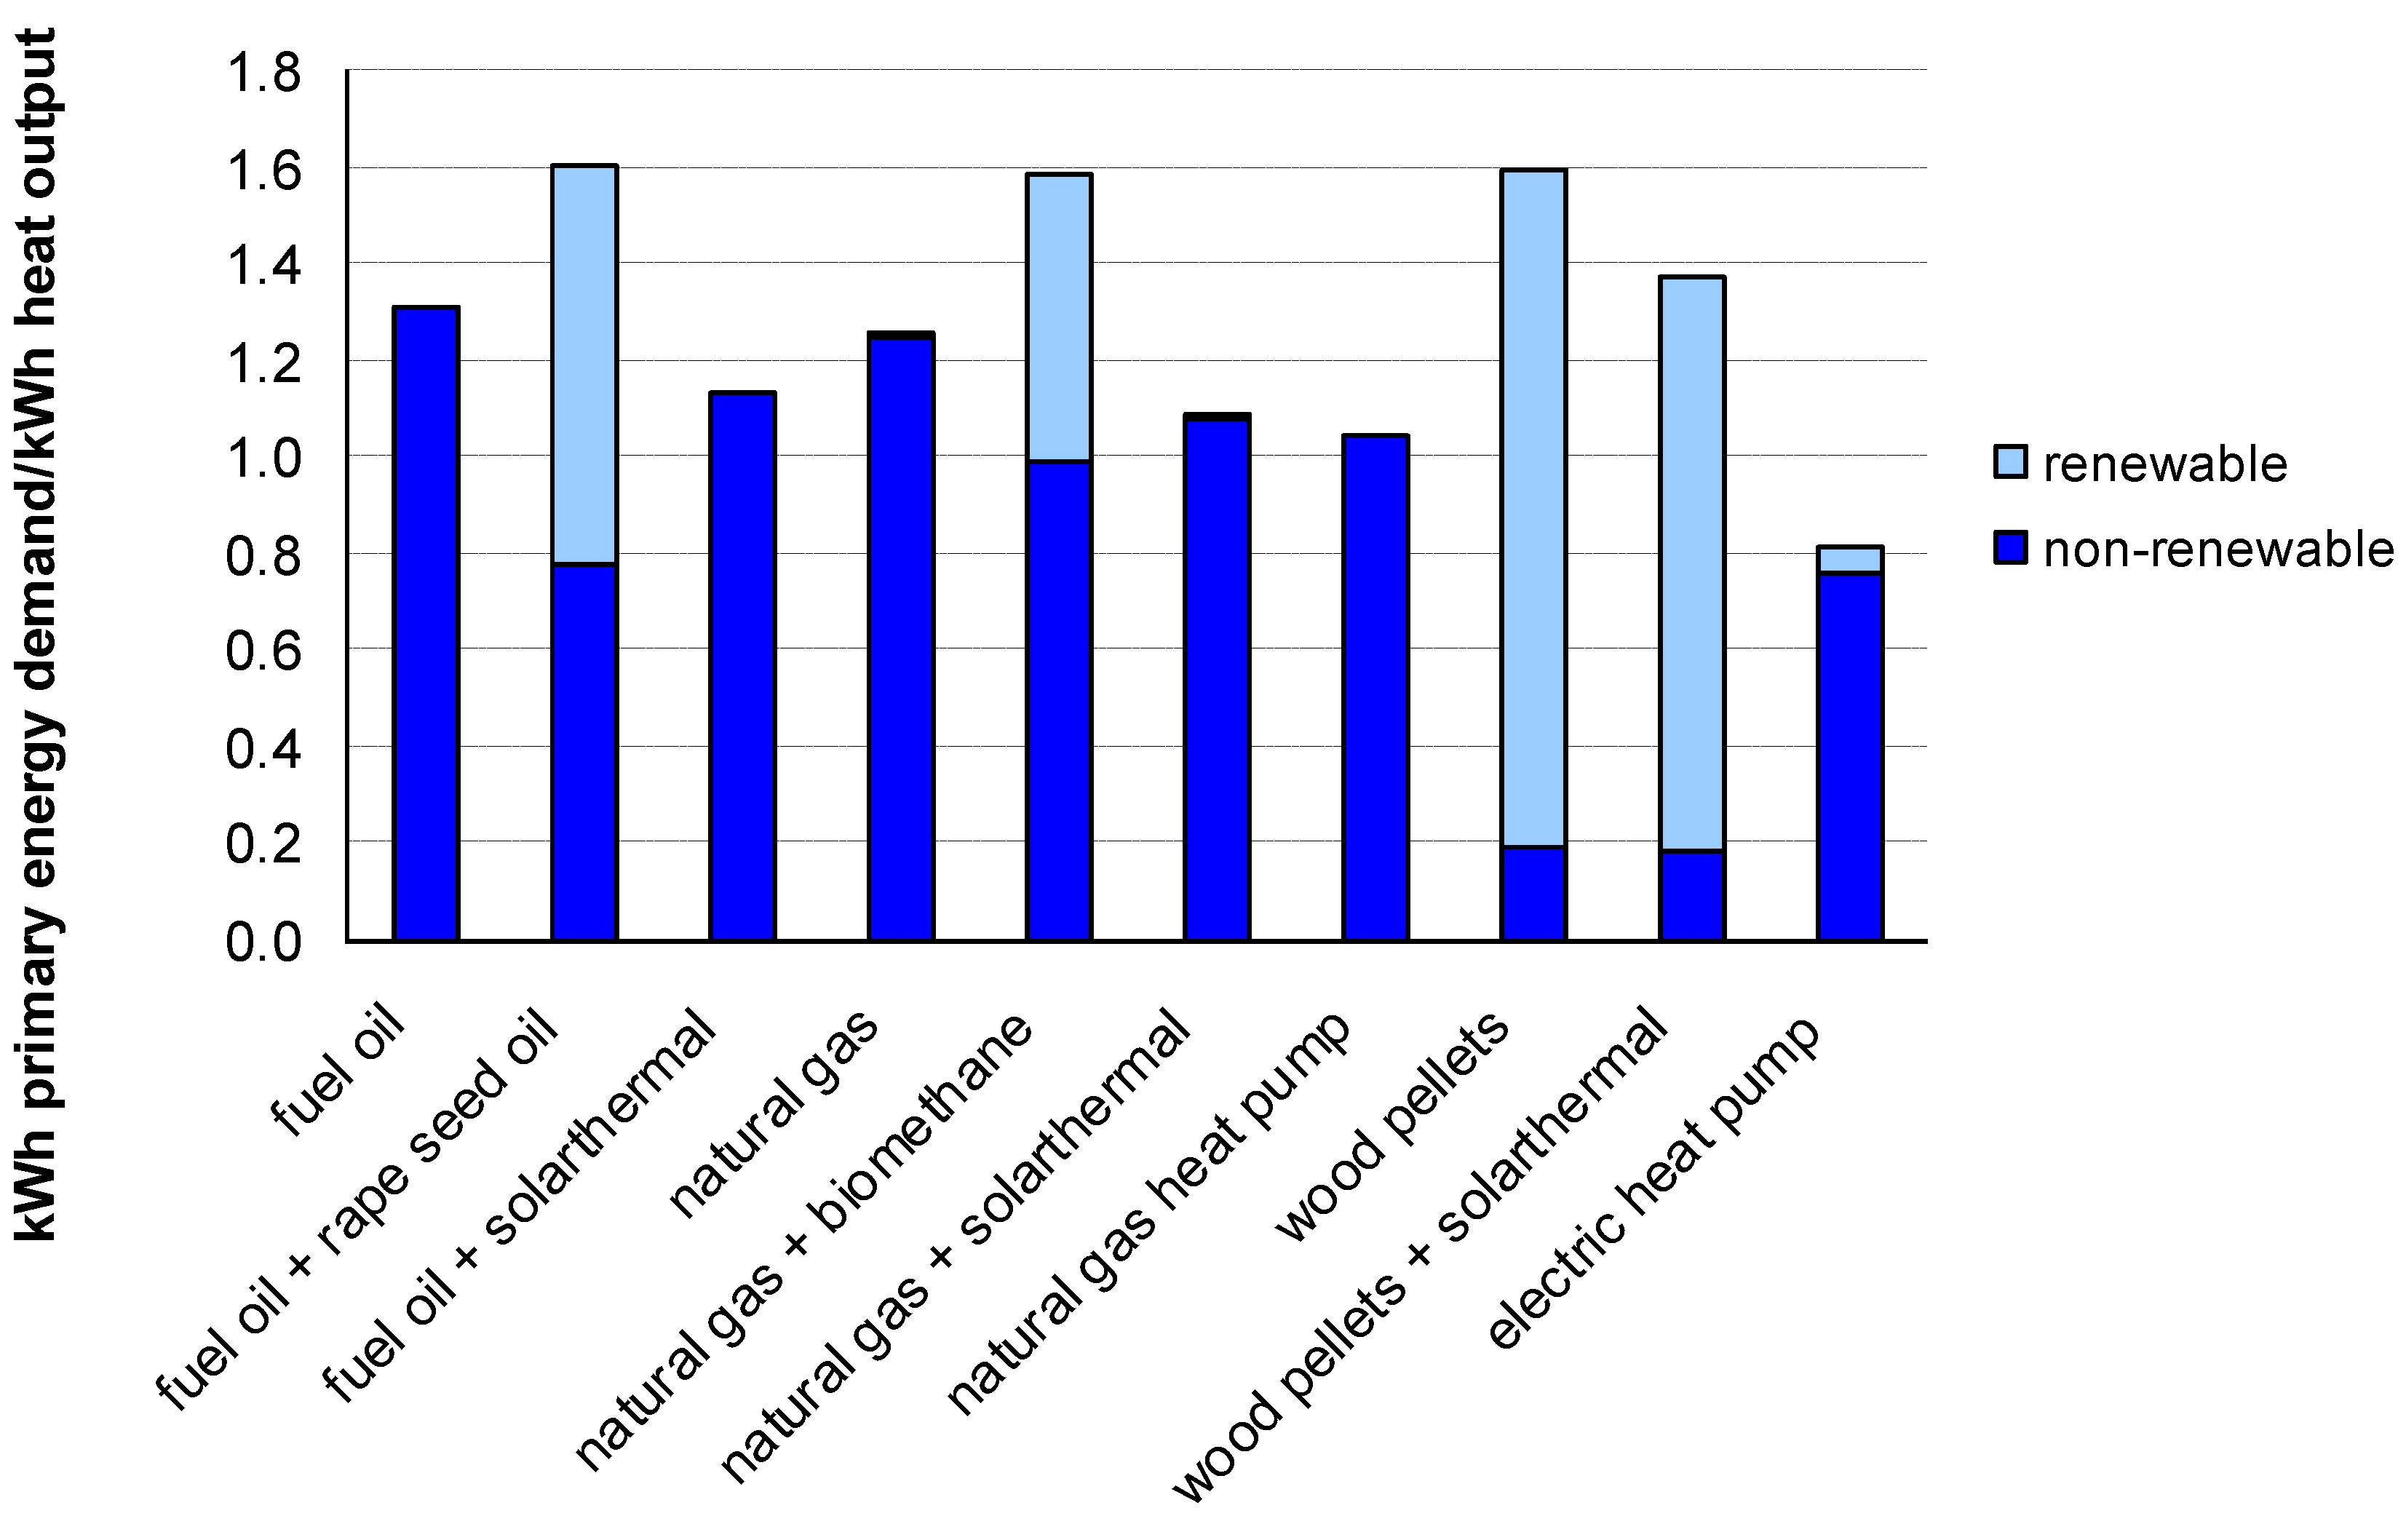
Figure 1. The heat pumps (electric heat pump as well as natural gas heat pumps) were the most efficient systems studied from the primary energy demand point of view. The natural gas heat pump nearly reached a factor of 1, i.e., a 1 kWh heat output from 1 kWh of primary energy. For the case of the electric heat pump, this ration was even better as it reaches 0.8. The reason that this value is below 1 is that the geothermal low temperature energy in not balanced, because it is not a scarce good and thus cannot be used for other purposes with currently available technical means. The same holds true for the systems with solarthermal support: the natural gas + solarthermal and the fuel oil + solarthermal systems are very efficient, as they use solar energy, which is abundantly available. The primary energy demand of wood pellet systems as well as systems based on biomethane or rapeseed oil is quite high. In the case of wood pellets, the reason is a relatively poor end-use efficiency (low boiler efficiency). In the case of biogas and rapeseed oil, the upstream chain is responsible for the low primary energy efficiency: both rapeseed oil and biomethane are produced with high processing and energy efforts.
With regard to the fuel, the electric heat pump had the best results in this impact category, followed by the natural gas systems, the fuel oil systems, and the wood pellet systems. However, both the utilization of biomethane and rapeseed oil resulted in a sharp increase in the primary energy demand.
Figure 1.
LCA results for the cumulative energy demand (CED) impact category.
Figure 1.
LCA results for the cumulative energy demand (CED) impact category.
The CED is not only a measure for system efficiency but also for resource exhaustion. Therefore, it is useful to analyze the non-renewable primary energy demand separately; the wood pellet systems were associated with the least non-renewable energy demand because they use 100% renewable fuel. Therefore, fossil fuel energy is only needed in the upstream processes (wood processing and transportation). The electric heat pump, because of its high efficiency, had the second lowest primary energy consumption. A combination of fuel oil or natural gas with renewable energy also resulted in a significant reduction of the non-renewable primary energy demand when compared to the reference systems.
Global warming potential (GWP100)
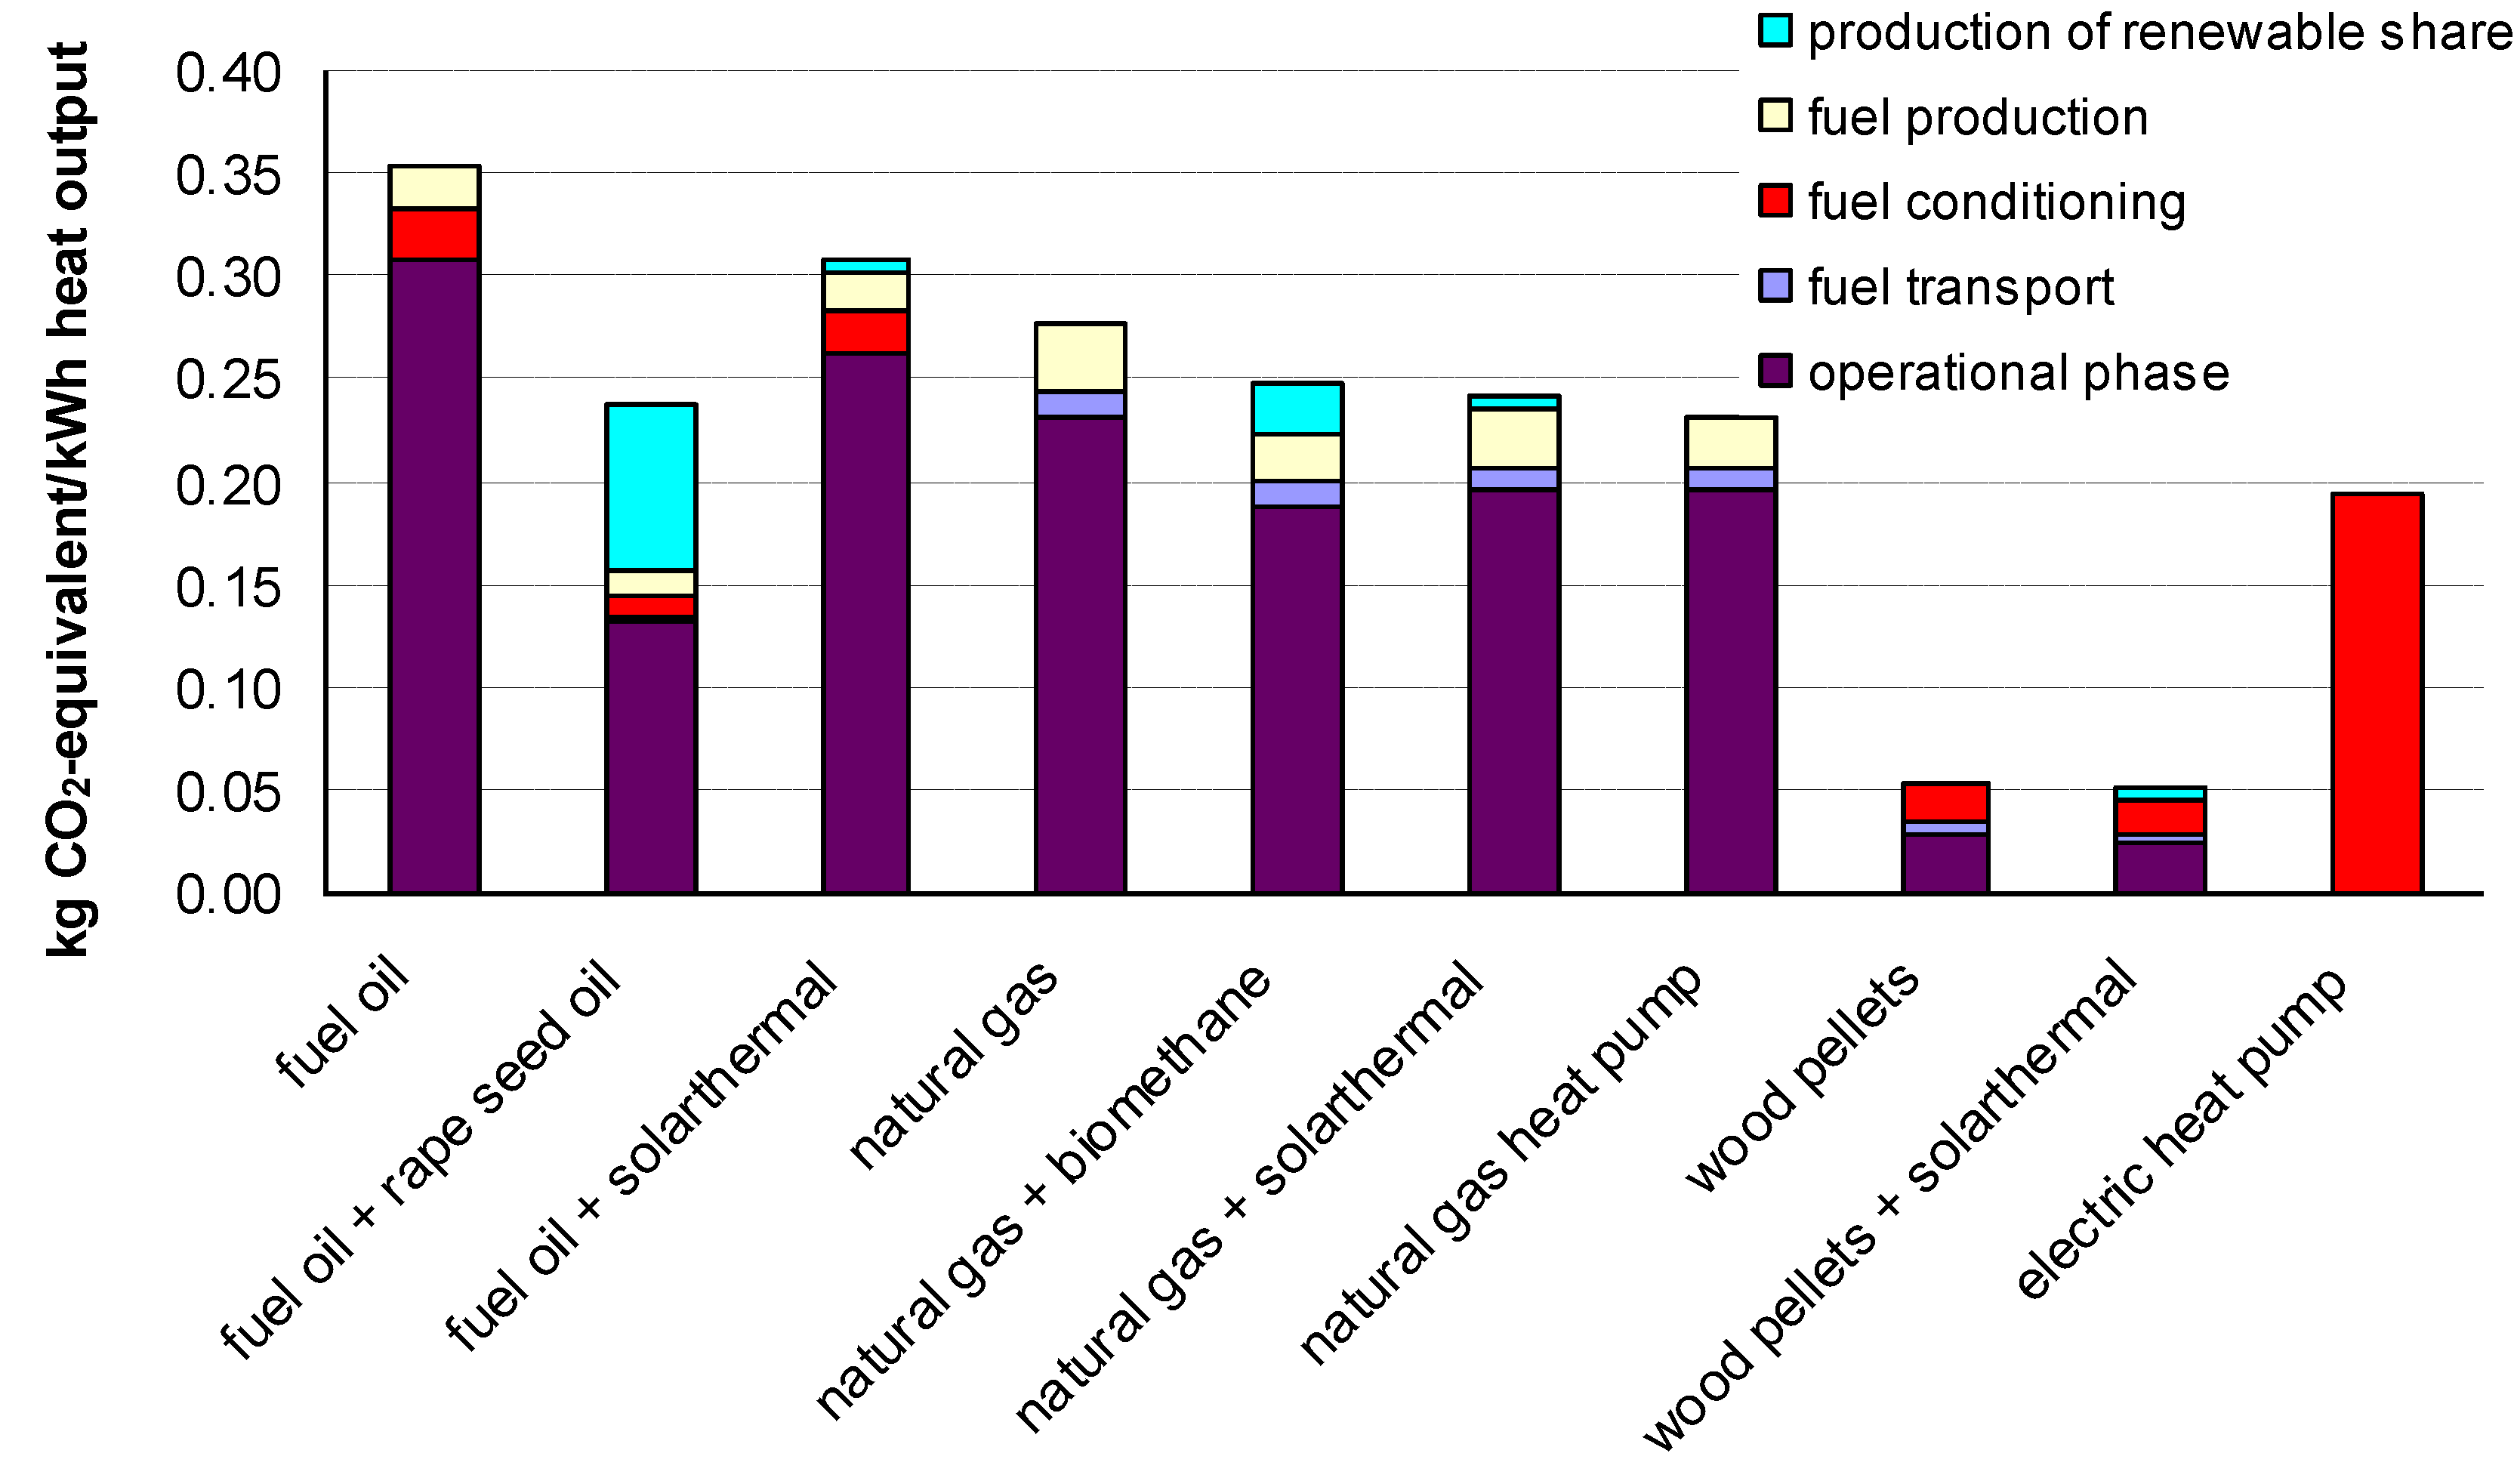
The LCA results for the global warming impact category are shown in
Figure 2. In this category and the following two impact categories the respective results were classified in terms of life cycle phases in order to give a more detailed view of the causes of the values. The life cycle phases were split into an operational phase (which beside fuel combustion includes auxiliary energy consumption of the boilers and heat pumps), fuel transport, fuel conditioning (e.g., crude oil fractioning and wood pelletizing), fuel production (e.g., crude oil or natural gas extraction) and the production of the renewable share. In the category “production of renewable share”, the impacts associated with the production of the renewable quota (e.g., 15% solar thermal energy, 30% biomethane, 50% rapeseed oil) are summarized. This category included the production and the installation of solar thermal collectors and the associated auxiliary energy consumption, cultivation of rapeseed and subsequent production of rapeseed oil, biogas production and conditioning.
In the case of electric heat pumps, this categorization was not applied, because the fuel of an electric heat pump (electric energy) is generated by various means and this categorization would not provide useful insights. A large share of the emissions resulted from electricity production in large power plants. Therefore, as a simplification, all of the emissions were allocated to the “fuel conditioning” category for the case of the electric heat pump.
For the global warming impact category, the wood pellet systems were associated with the lowest impacts. The life-cycle GHG emissions of these systems were over 75% lower than the emissions of a combination of natural gas and solar thermal energy systems. The electric heat pump was the second best solution, but it was only slightly (20%) better than the natural gas combinations. Among the natural gas based systems, it is notable that the configuration with the highest share of renewable energy, the natural gas boiler that uses 30% biomethane, reached the lowest reduction in GHG emissions (only about 10%). In contrast, the combination of a natural gas boiler with a solarthermal system, which produced 15% of its heat from solar thermal energy, resulted in a GHG reduction of nearly 13%. Thus, the net GHG reduction of solar thermal systems per kWh renewable energy applied was three times as high as that of biomethane. The same held true for the fuel oil + rapeseed oil system: although 50% of renewable energy was used, the net reduction in the GHG emissions was only 33%.
Figure 2.
LCA results for the global warming impact category.
Figure 2.
LCA results for the global warming impact category.
Moreover, given the current legislation, it is notable that the combination of fuel oil boiler with a solarthermal system results in GHG emissions that were about 10% higher than those of a conventional natural gas boiler.
With regard to the contribution of the different life cycle phases to the overall global warming potential, for fossil fuels about 80% of the contribution to global warming was produced in the operational phase, which is when the fossil fuel is burnt. For the case of natural gas, there are upstream GHG emissions that can to a large extent be ascribed to methane (leakage) emissions in (mostly Russian) natural gas pipelines. The magnitude of these emissions is under discussion and recent high natural gas prices have created an incentive for reducing leakage emissions. In [
18], a literature review of estimations of these emissions was performed, with the result that estimations can vary by a factor of 6. The values in the GEMIS database are lower than the average value of this spectrum. Moreover, as the total upstream emissions were only responsible for about 16% of the total global warming, the influence of this value on the overall picture is limited.
An analysis of the wood pellet systems showed that about 50% of GHG emissions could be ascribed to the operational phase. These emissions were caused by non-CO2 GHG as well as the auxiliary electricity consumption that leads to GHG production. Fuel conditioning (wood pelletizing) was responsible for another 40% of GHG emissions, resulting from the energy consumption for wood drying, grinding and compacting, while transport emissions were less important.
Acidification potential (AP)
The LCA results for the acidification impact category are shown in
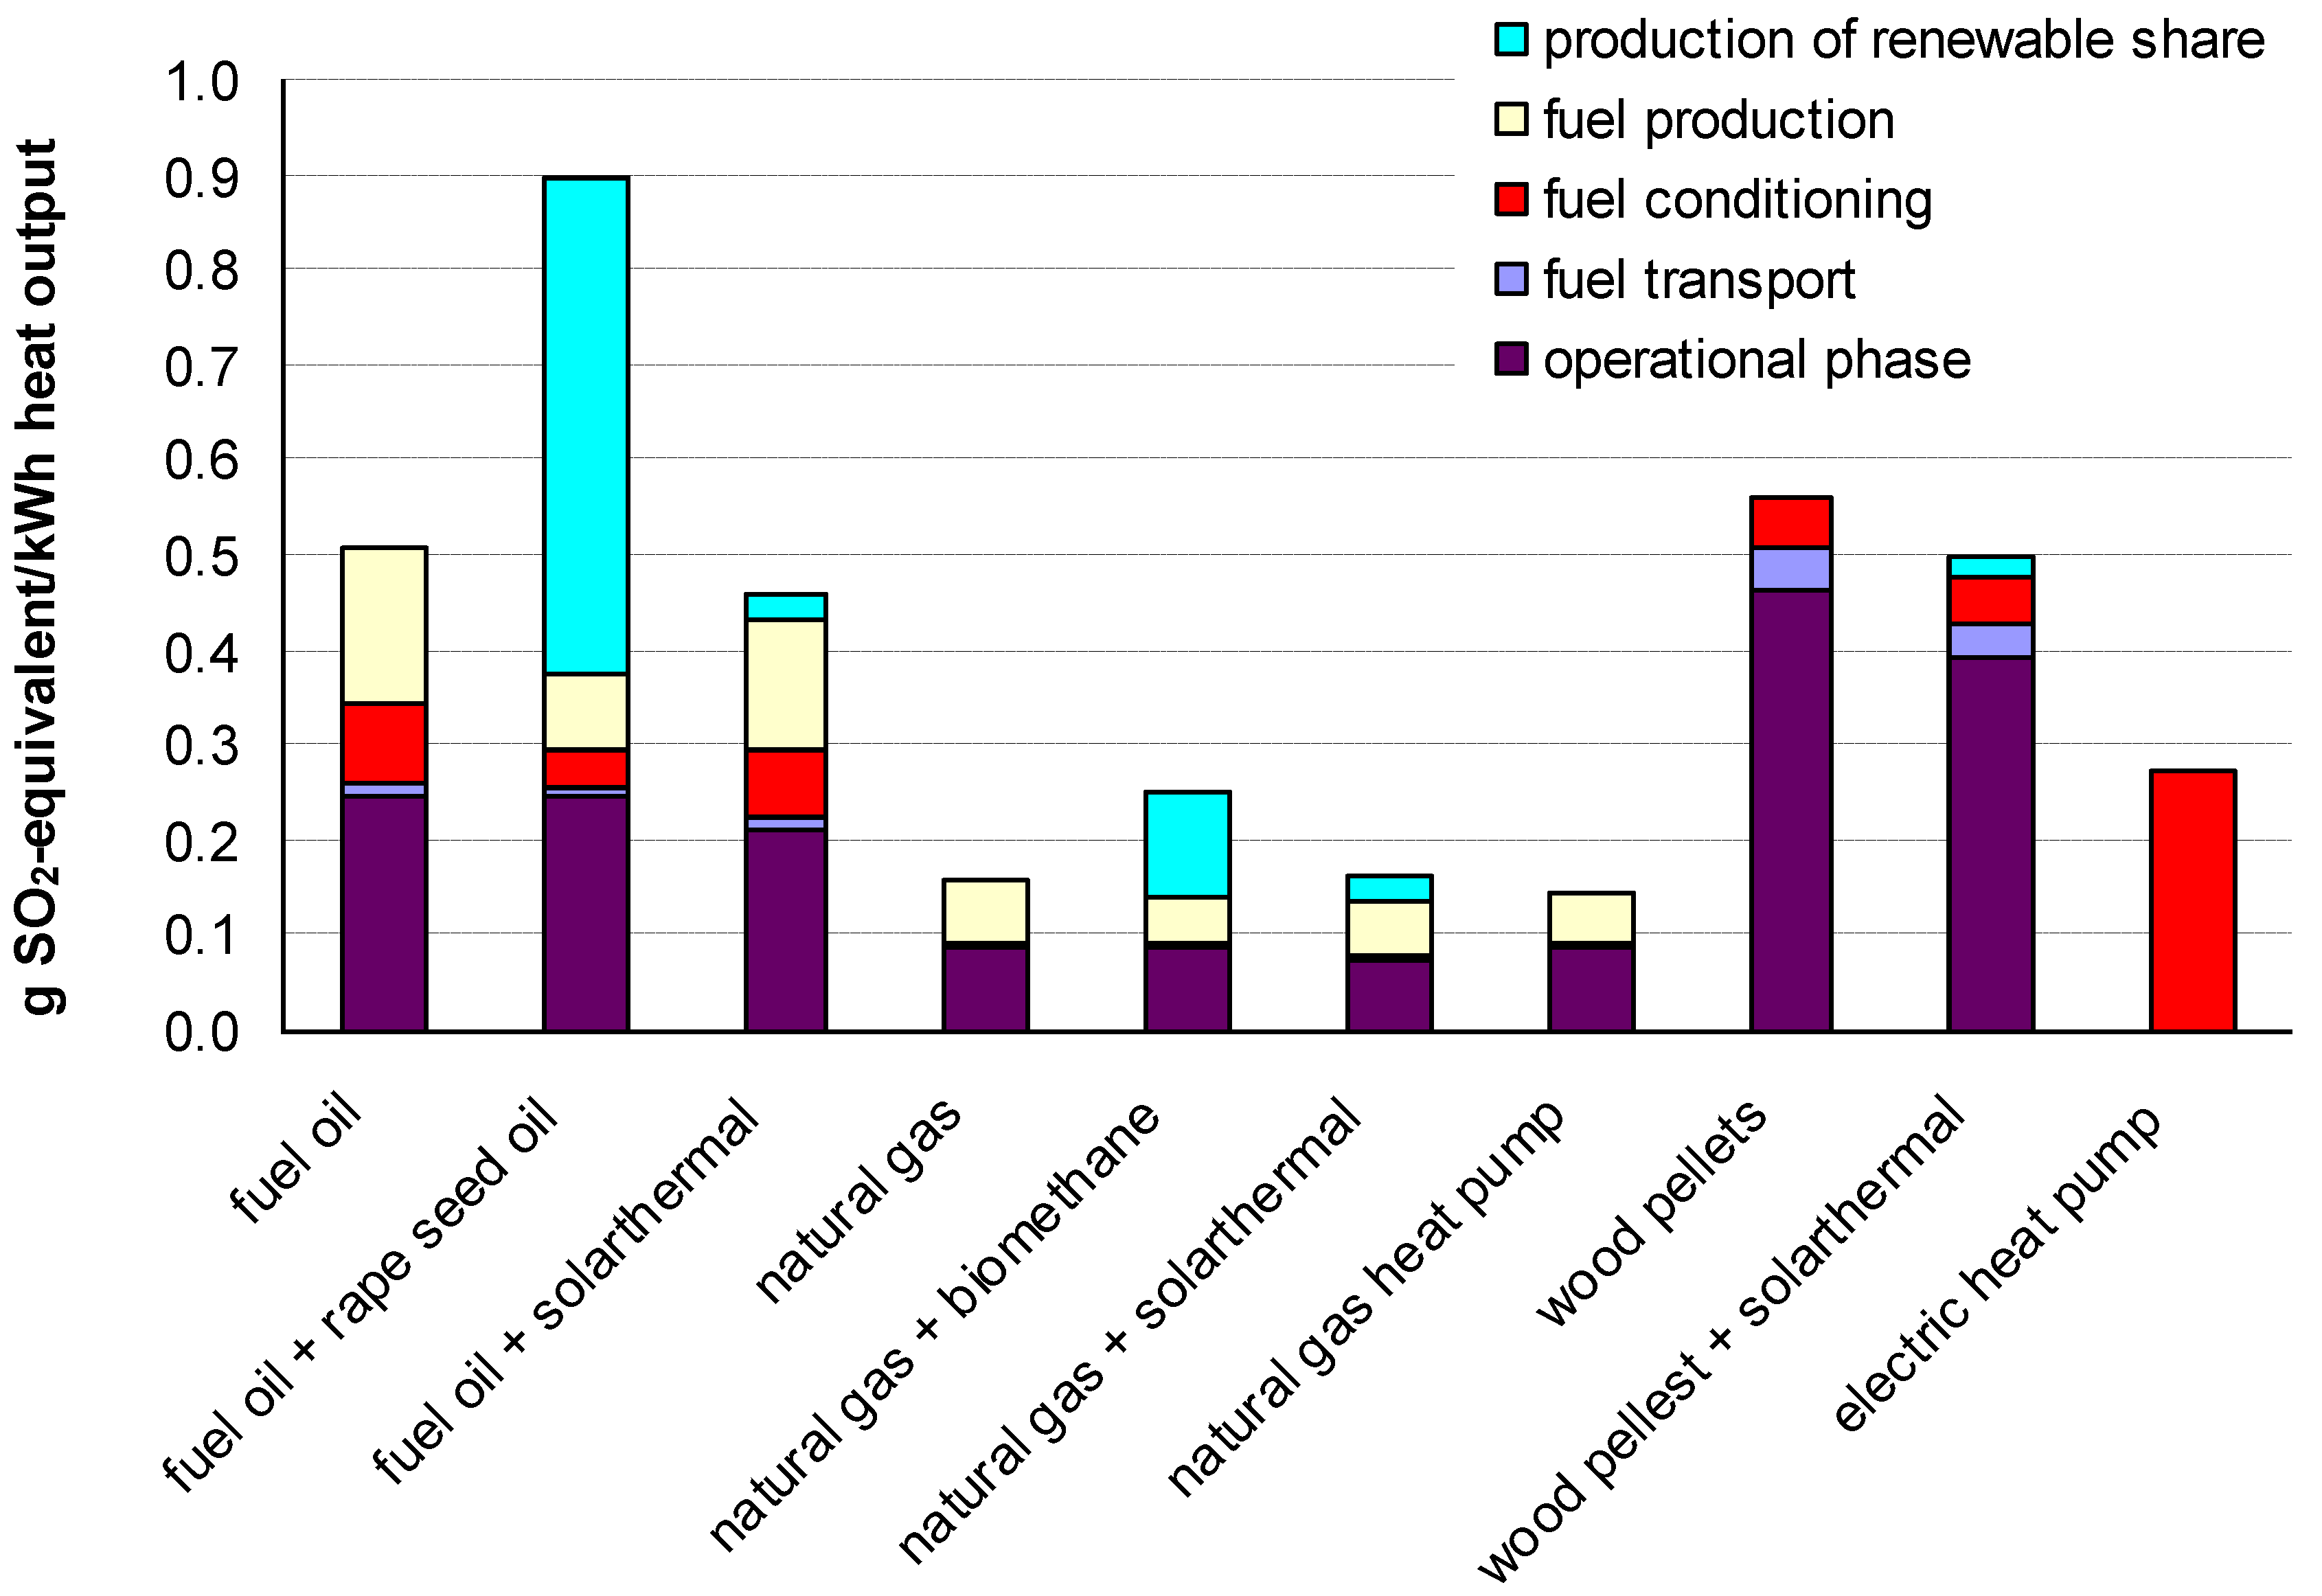
Figure 3. The natural gas systems in this impact category were associated with the lowest environmental impacts. The electric heat pump was once again the second best system. Wood pellet and fuel oil based systems were more or less equal and led to the highest acidification. Only the rapeseed oil system was an outlier with emissions that were more than 75% higher than those of the other fuel oil and wood pellet based systems.
Figure 3.
LCA results for the acidification impact category.
Figure 3.
LCA results for the acidification impact category.
Note that the addition of rapeseed oil to fossil fuel oil and the addition of biomethane to fossil natural gas led to poor results: the total acidification of these systems was considerably higher than acidification of the respective reference systems. Acidification rose by nearly 60% for the addition of 30% biomethane and for rapeseed oil it rose by 76%. The emissions for these systems were from the renewable fuel production processes, including the cultivation of rapeseed and biomass for biogas production and processing biogas.
Solar thermal systems were associated with considerable SO2-equivalent emissions that were emitted in the upstream production chain during the production of solar thermal collectors.
Although the total acidifications of the wood pellet systems and the fuel oil systems were about equal, there were some important differences in their life cycle phases and, therefore, in the geographic locations of the emissions. The majority of the SO2-equivalent emissions from wood pellet systems (more than 80%) were produced during the operational phase of the heating system, i.e., in a residential area. For the case of the fuel oil systems, a considerable part of the emissions occurred in upstream processes and only 50% of the emissions occurred locally.
There is a need for discussion of the input emission values, as the values in GEMIS do not always correspond to current research results. Therefore, the GEMIS input values were compared with more up-to-date values taken from [
19]. This study contains the most recent update on the direct emission values of heating systems found by the German Federal Environmental Agency (Umweltbundesamt). The value of combustion SO
2 emissions from wood pellet heating systems given in [
19] is only 15% of the value used in GEMIS. For fuel oil heating system the opposite is true, as reference [
19] gives an emission value that is 40% higher than the value given in GEMIS. Calculating the corresponding acidification using the values of [
19] showed that the wood pellet system was 25% lower and the impact of the fuel oil heating system was 12% higher than the acidification results calculated using the GEMIS values. The updated values not only led to lower overall impacts of the wood pellet system, but also led to a significant change in the life-cycle phase emissions. The impacts caused by local emissions, which with the GEMIS input values were significantly higher for the wood pellet system, were about equal. For reasons of consistency, however, the GEMIS values were not replaced by the more recent values.
Tropospheric ozone precursor potential (TOPP)
The LCA results for the tropospheric ozone precursor potential impact category are shown in
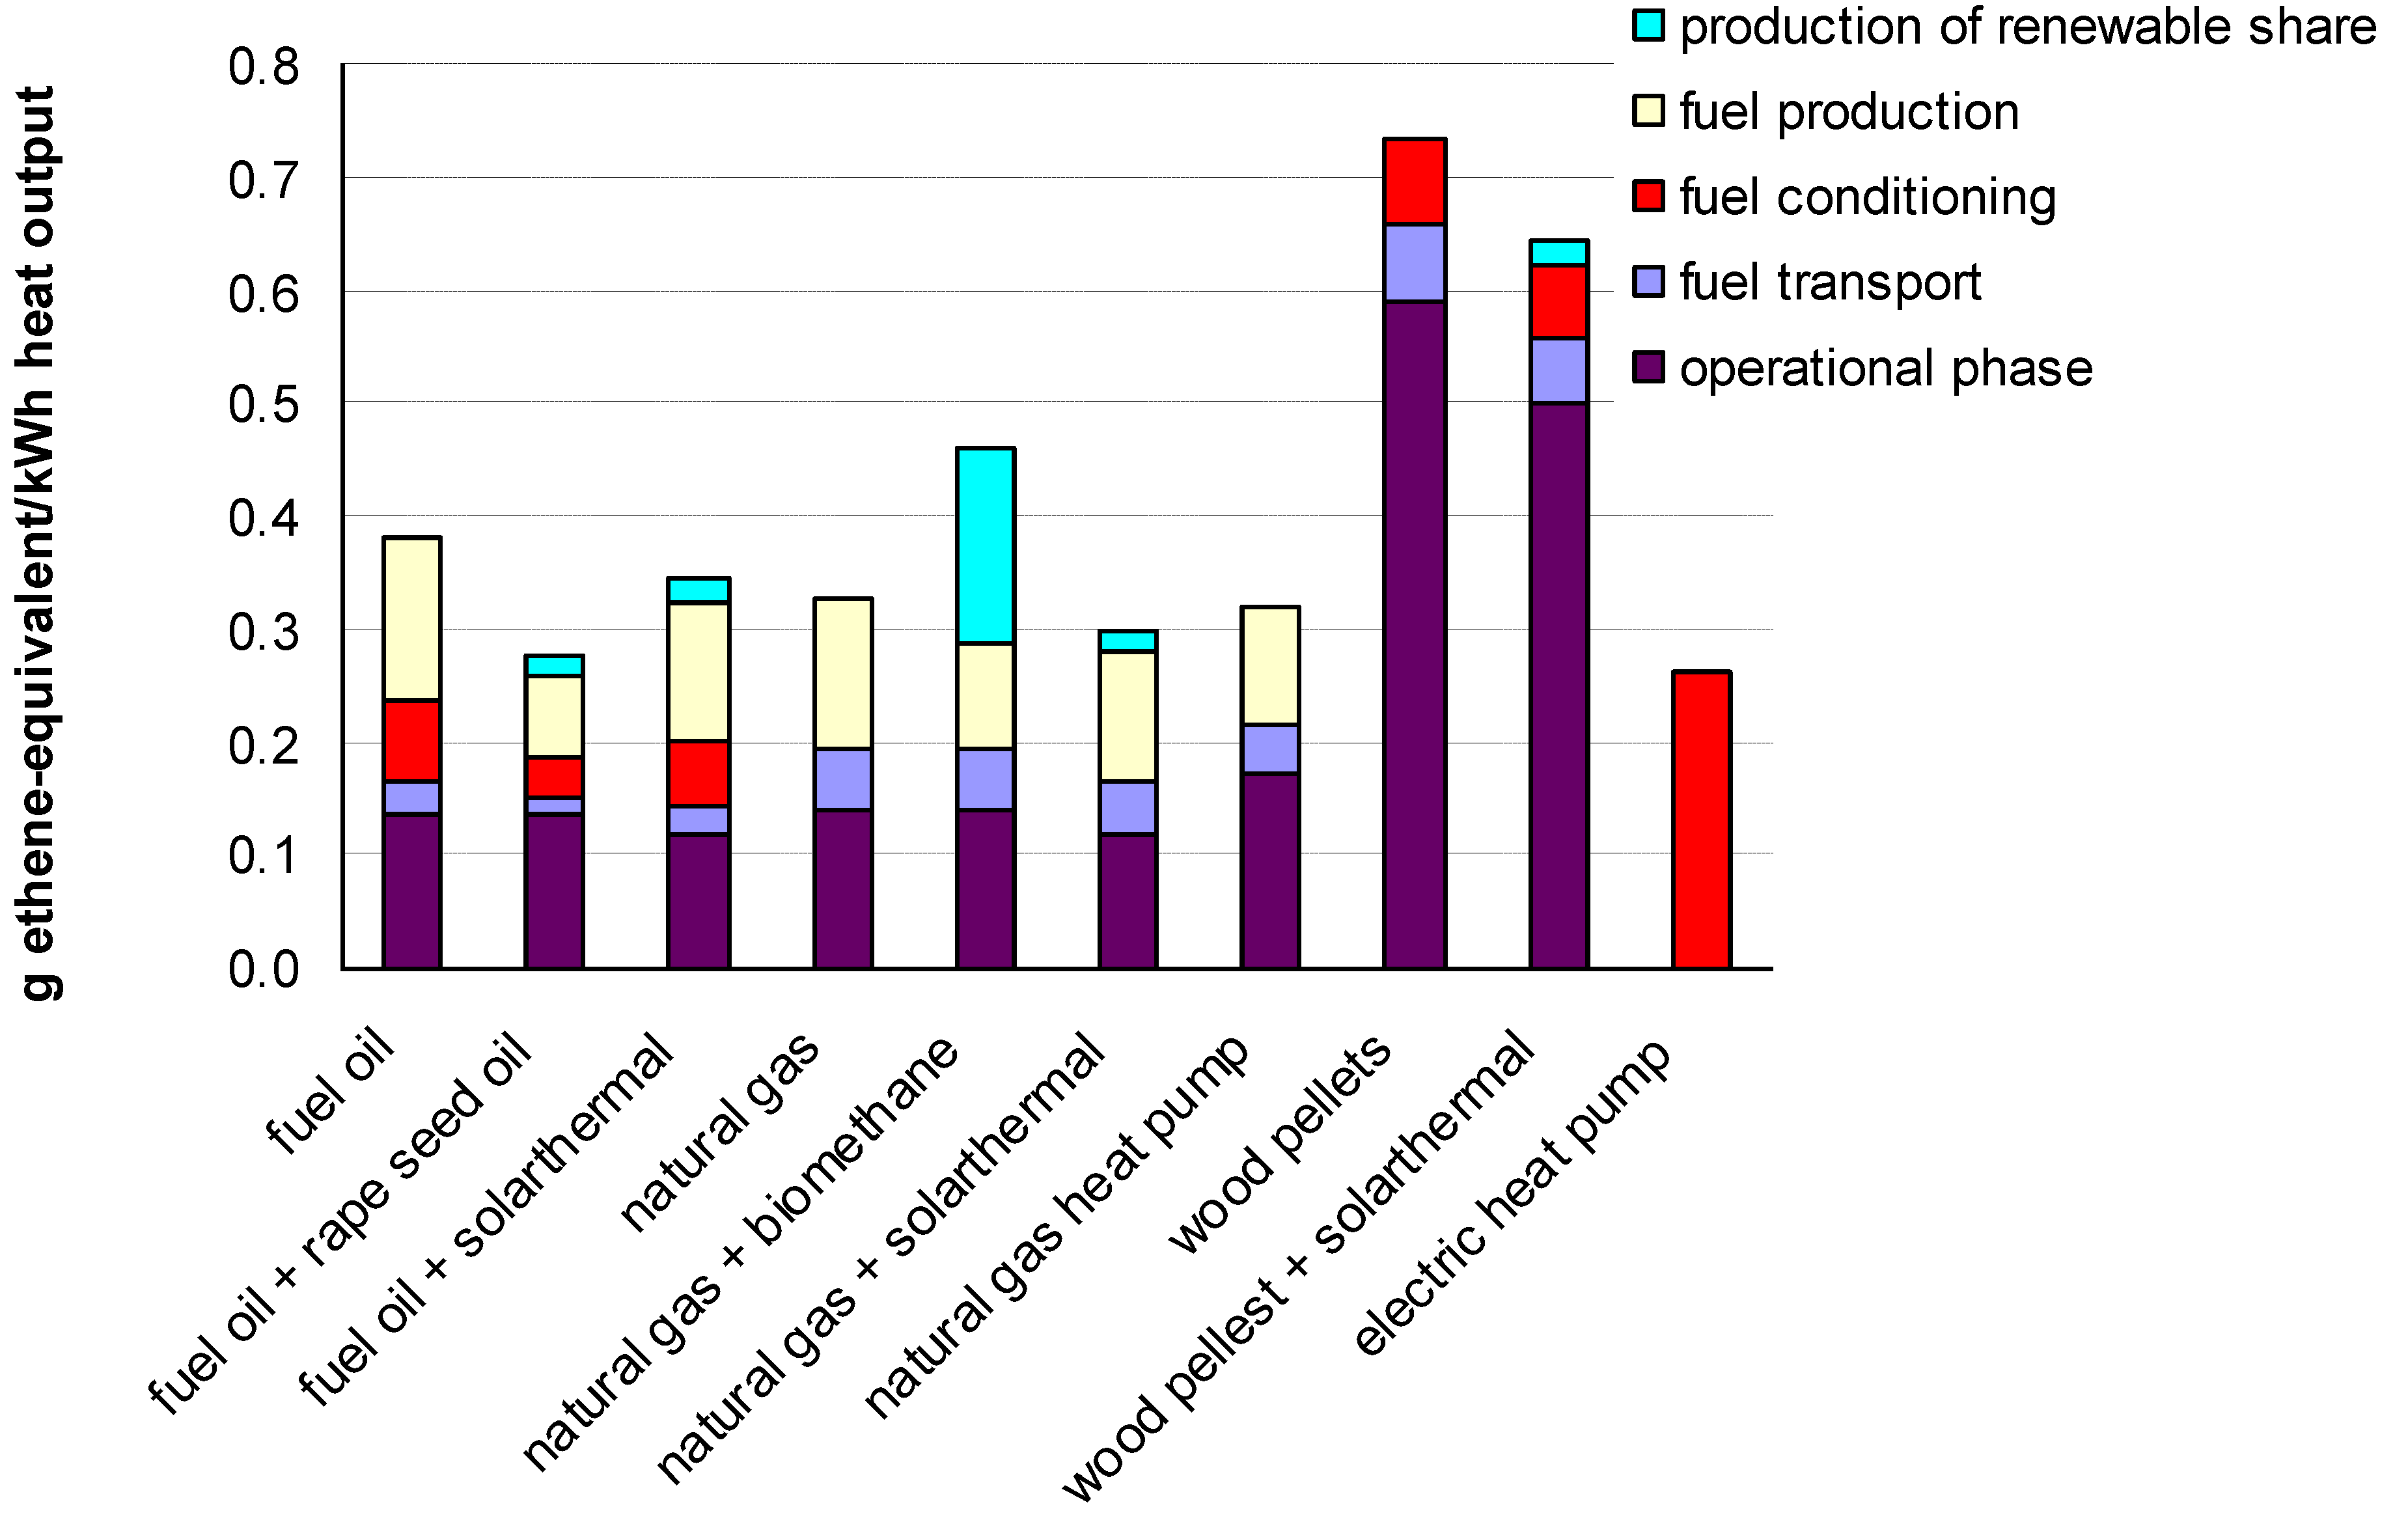
Figure 4. In this category, all systems had similar impacts, except for three systems: the two wood pellet systems and the natural gas system that used biomethane, which caused considerably higher impacts. The electric heat pump was associated with the lowest impacts, but the impacts of the fuel oil + rapeseed oil system was nearly equal. In this category, considerable reductions were achieved by replacing fuel oil by rapeseed oil (27% reduction). In the case of biomethane use, the situation was different: impacts in this category increased by 40%. When analyzing the contributions of the different life cycle phases to the overall result, the picture is similar to the previous category: for the case of fuel oil or natural gas based systems, only about 50% of the impacts were produced locally, while it was the majority (80%) for wood pellet systems. The GEMIS input emission values were checked and compared with the values of [
19], as shown in
Section 4.1.3. GEMIS assumes higher NMVOC emission values for pellet systems, which resulted in higher impacts. Moreover, the difference in NO
x emission values mentioned above also led to higher impacts from the fuel oil system when using the values in [
19]. Like the acidification, the use of the values of [
19] therefore resulted in lower impact values for the pellet systems and higher values for the fuel oil systems such that the impacts are nearly equal.
Figure 4.
LCA results in the tropospheric ozone precursor potential impact category.
Figure 4.
LCA results in the tropospheric ozone precursor potential impact category.
4.2. Local Emissions and Human Health
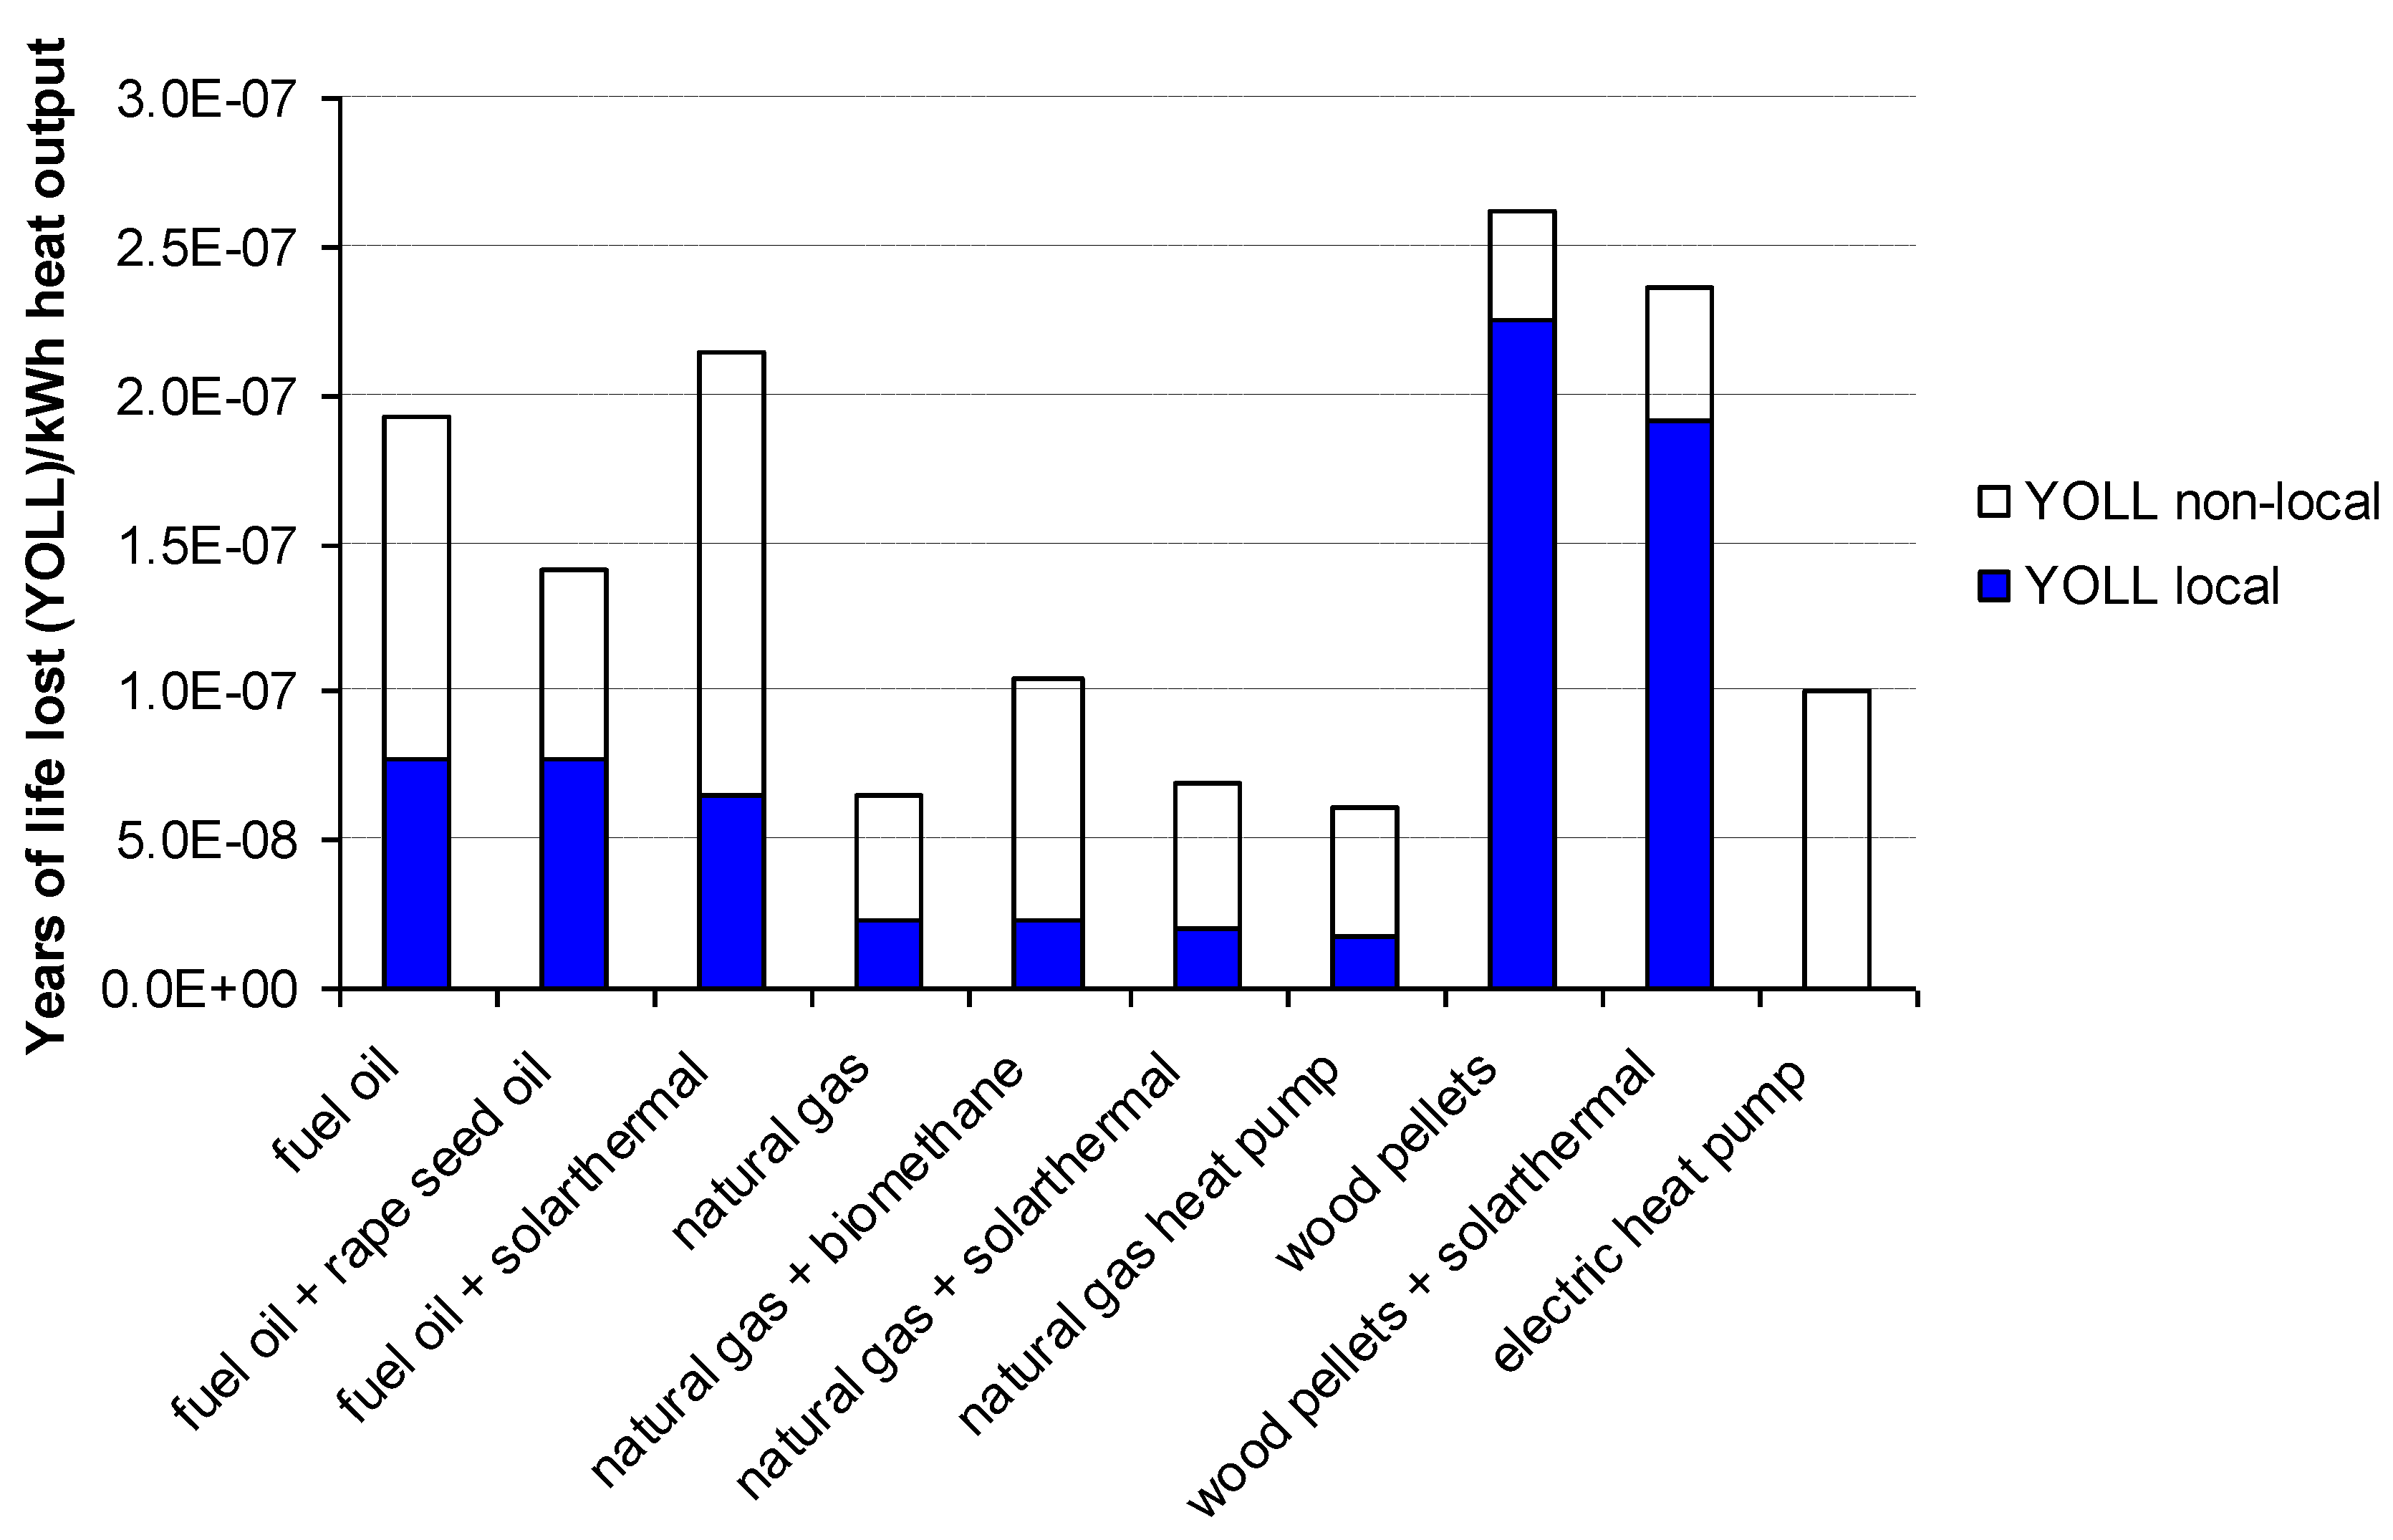
In order to compare the direct environmental effects of the heating systems on the local air quality in residential areas and the resulting impacts on human health, the years of life lost (YOLL) approach was used. The values were calculated in accordance with [
20]. This indicator is based on the impact of substances that directly damage human health. In our comparison, the relevant substances included: particulate matter, SO
2, NO
x, NMVOC (non-methane volatile organic compound), CH
4, and PAH (polycyclic aromatic hydrocarbons). In order to display the influence of human health damaging emissions that did not emerge in residential areas, the non-local YOLL are displayed as well (transparent part of the bar in
Figure 5). The filled bars correspond to the local emissions. By contrast, the transparent part of the bar is caused by emissions that were produced in large processing plants or factories in industrial areas, along pipelines, in harbors, etc. Usually, in an LCA the emissions are weighted equally, independent of the geographical location of the production. However, in the special case of heating systems, we agree that this assumption is not justified and local emissions have to be regarded as more important because they are more damaging than other emissions. In order to quantify the extent of this effect, weighting factors would have to be introduced that are a function of the population density near the emission source. However, this type of analysis is outside of the scope of this study. Therefore, the work of this study is restrained to a qualitative discussion, and the results of the local emissions were evaluated separately and assigned a higher importance than the non-local emissions. The results are shown in
Figure 5.
Figure 5.
Human toxicity of the analyzed systems measured in years of life lost (YOLL).
Figure 5.
Human toxicity of the analyzed systems measured in years of life lost (YOLL).
Overall, considering the total YOLL, natural gas systems performed the best, the electric heat pump was the second best solution, and fuel oil and wood pellet based systems were the worst. However, if one takes into account the local emissions the picture changes. From a local point of view, the electric heat pump was the best solution because there were no emissions that occurred locally, as no fuel has to be combusted in the residential area. Consequently, there are no YOLL induced by local emissions.
Moreover, wood pellet based systems have extremely high negative impacts on human health compared with the other systems when local effects are accounted for. Compared with fuel oil systems the local YOLL was nearly three times as high, and compared with natural gas systems the local YOLL was more than nine times as high. The types of pollutants can be seen in
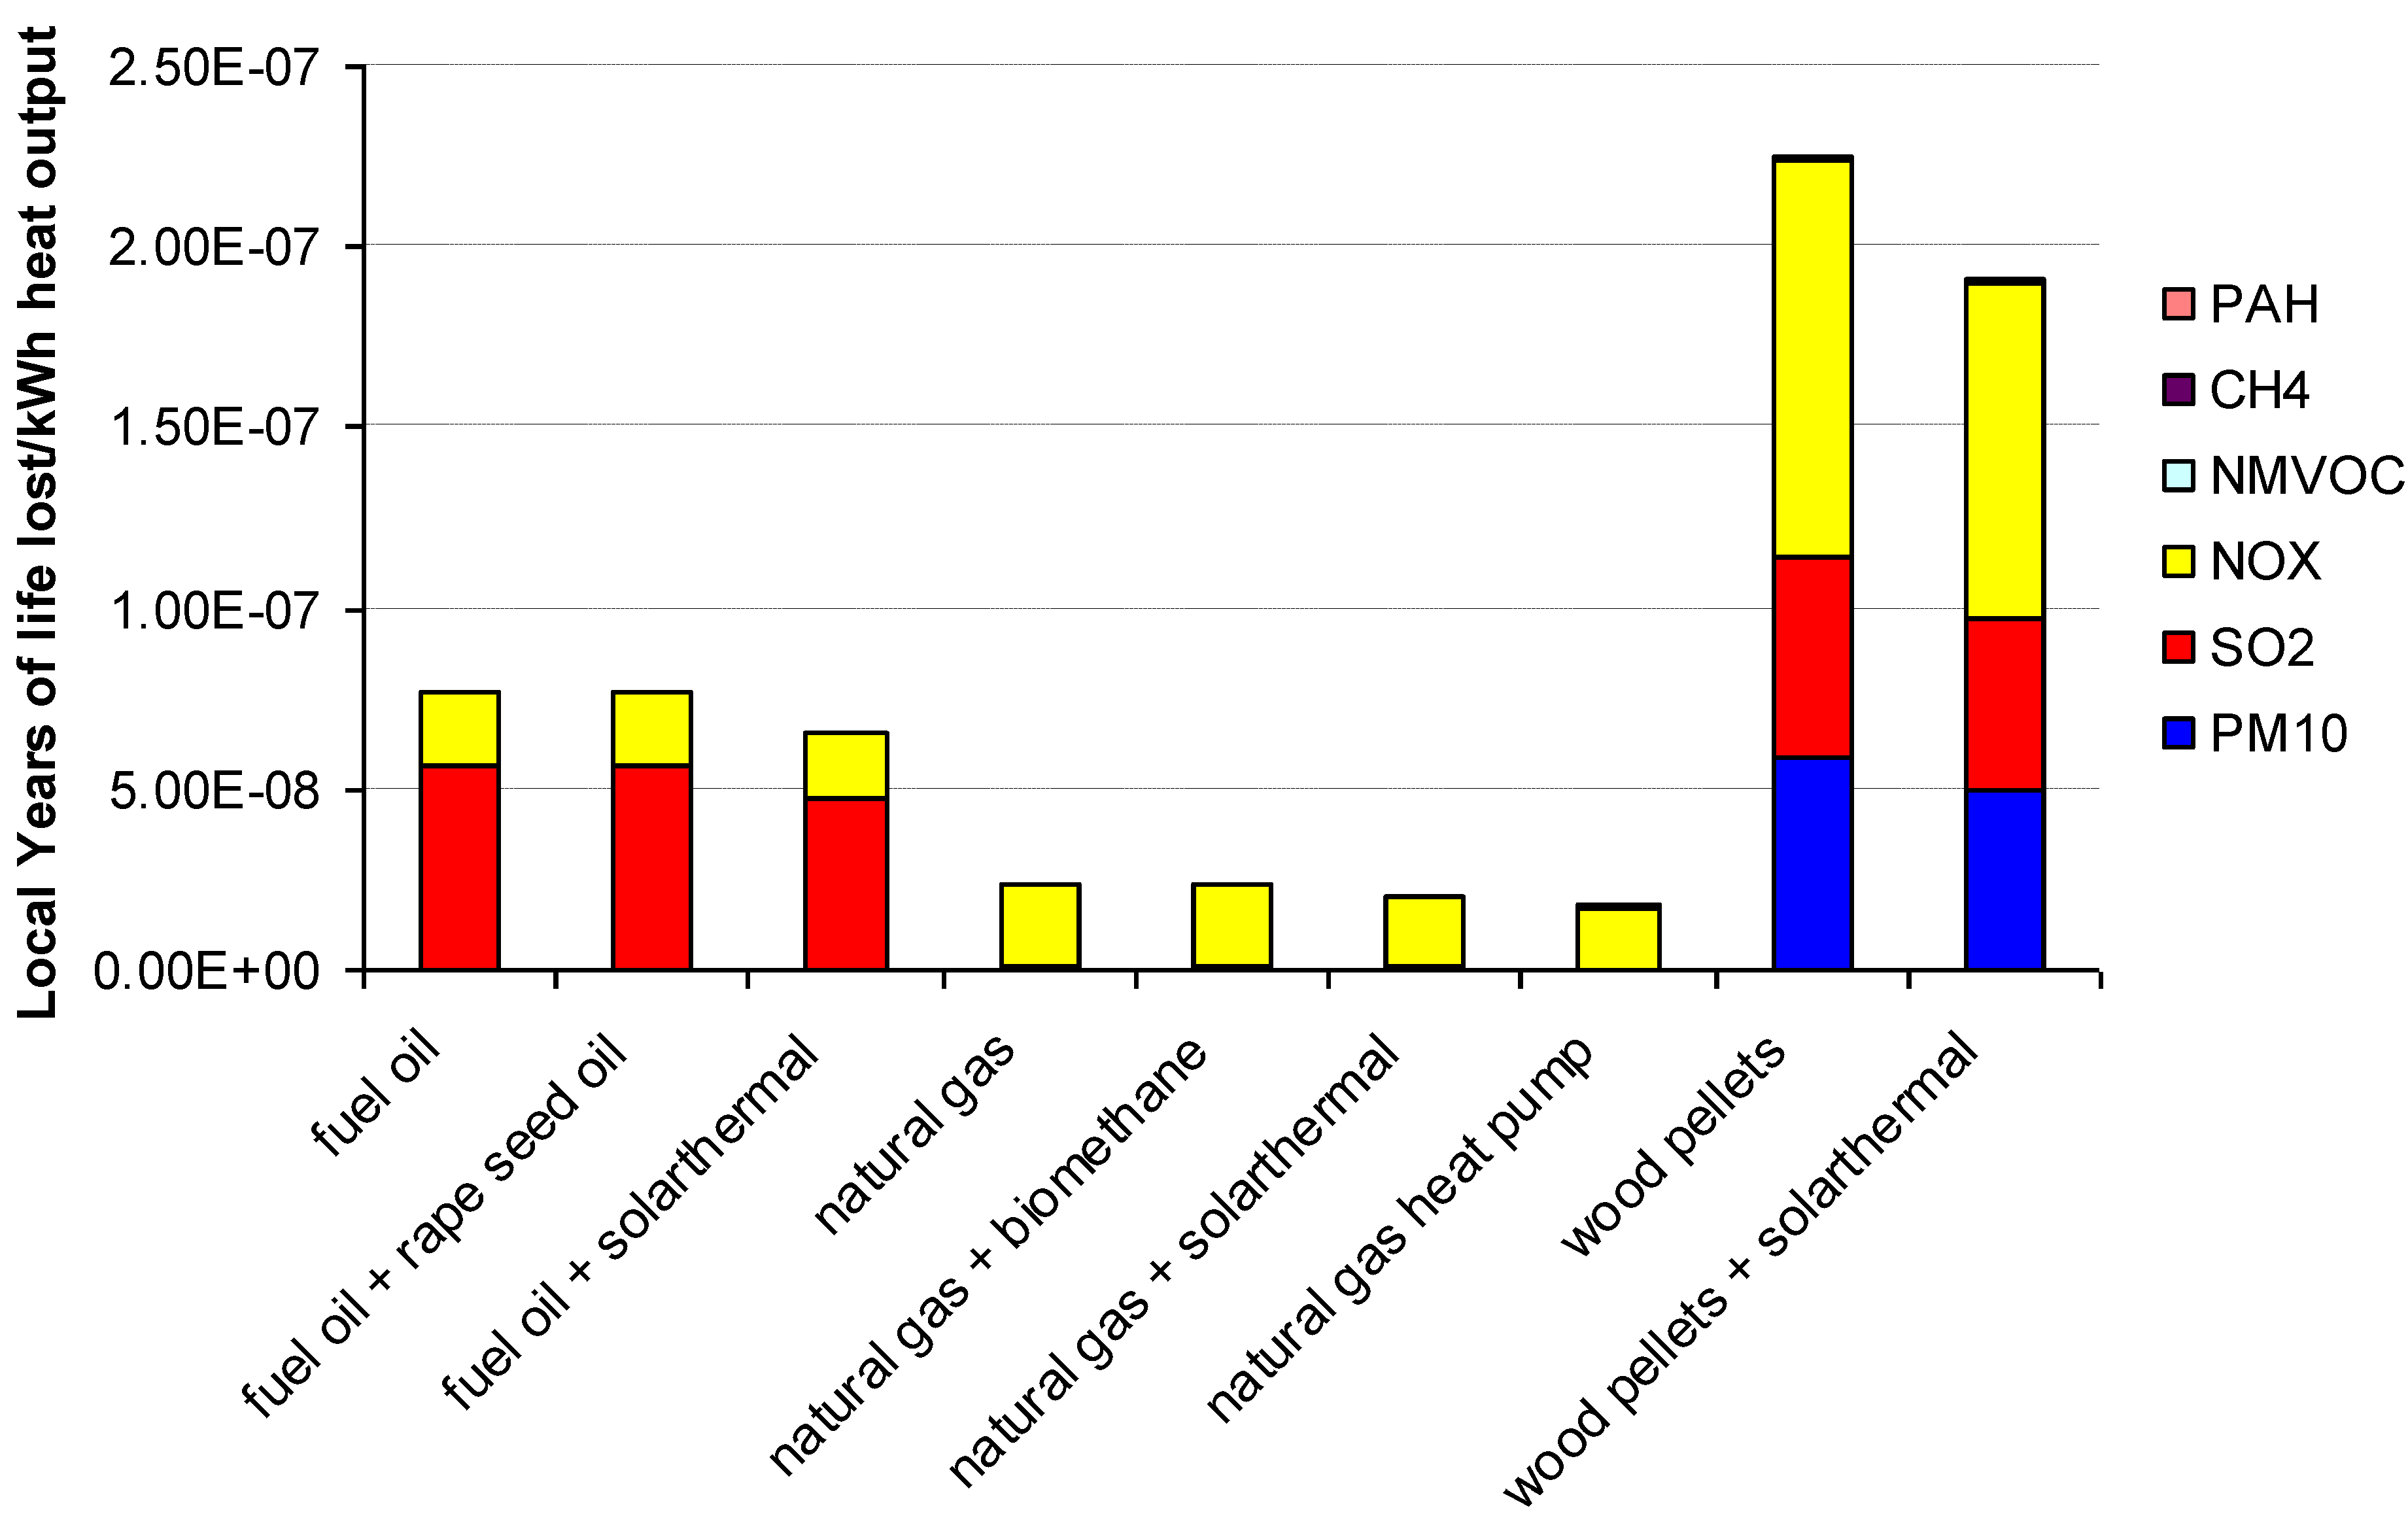
Figure 6, where the locally-induced YOLL are shown in terms of the contributions of different pollutants.
Generally, the only significant contributions to this impact are SO
2, NO
x and PM10 emissions. For natural gas systems, nearly 100% of the YOLL were induced by NO
x emissions. For fuel oil based systems, SO
2 emissions were responsible for the majority of YOLL, while NO
x emissions caused about 25%. For wood pellet systems, particulate matter induced a considerable amount of YOLL. However, NO
x emissions were responsible for a major portion (nearly 50%) of the locally induced YOLL. The pollutants SO
2 and PM10 were more or less equally important, both causing about 25% of the YOLL. This result is quite surprising considering the recent discussion about PM emissions from wood pellet heating systems in Europe (Germany, Austria, Switzerland, Finland, Sweden, etc.). In this discussion, the emissions are perceived as the main environmental problem of wood pellet heating systems and the government promotes their reduction (such as electrostatic precipitators) via large subsidies.
Figure 6 indicates that it would be much more effective to reduce NO
x emissions. However, this decision obviously depends on the abatement costs.
Figure 6.
Human toxicity of the analyzed systems measured in years of life lost (YOLL).
Figure 6.
Human toxicity of the analyzed systems measured in years of life lost (YOLL).
A calculation of the results using the values of [
19] was carried out to find the input data uncertainties. Similar to the acidification and tropospheric ozone precursor potential categories, the resulting impacts were considerably lower for the wood pellet system and considerably higher for the fuel oil system.
4.3. Immissions
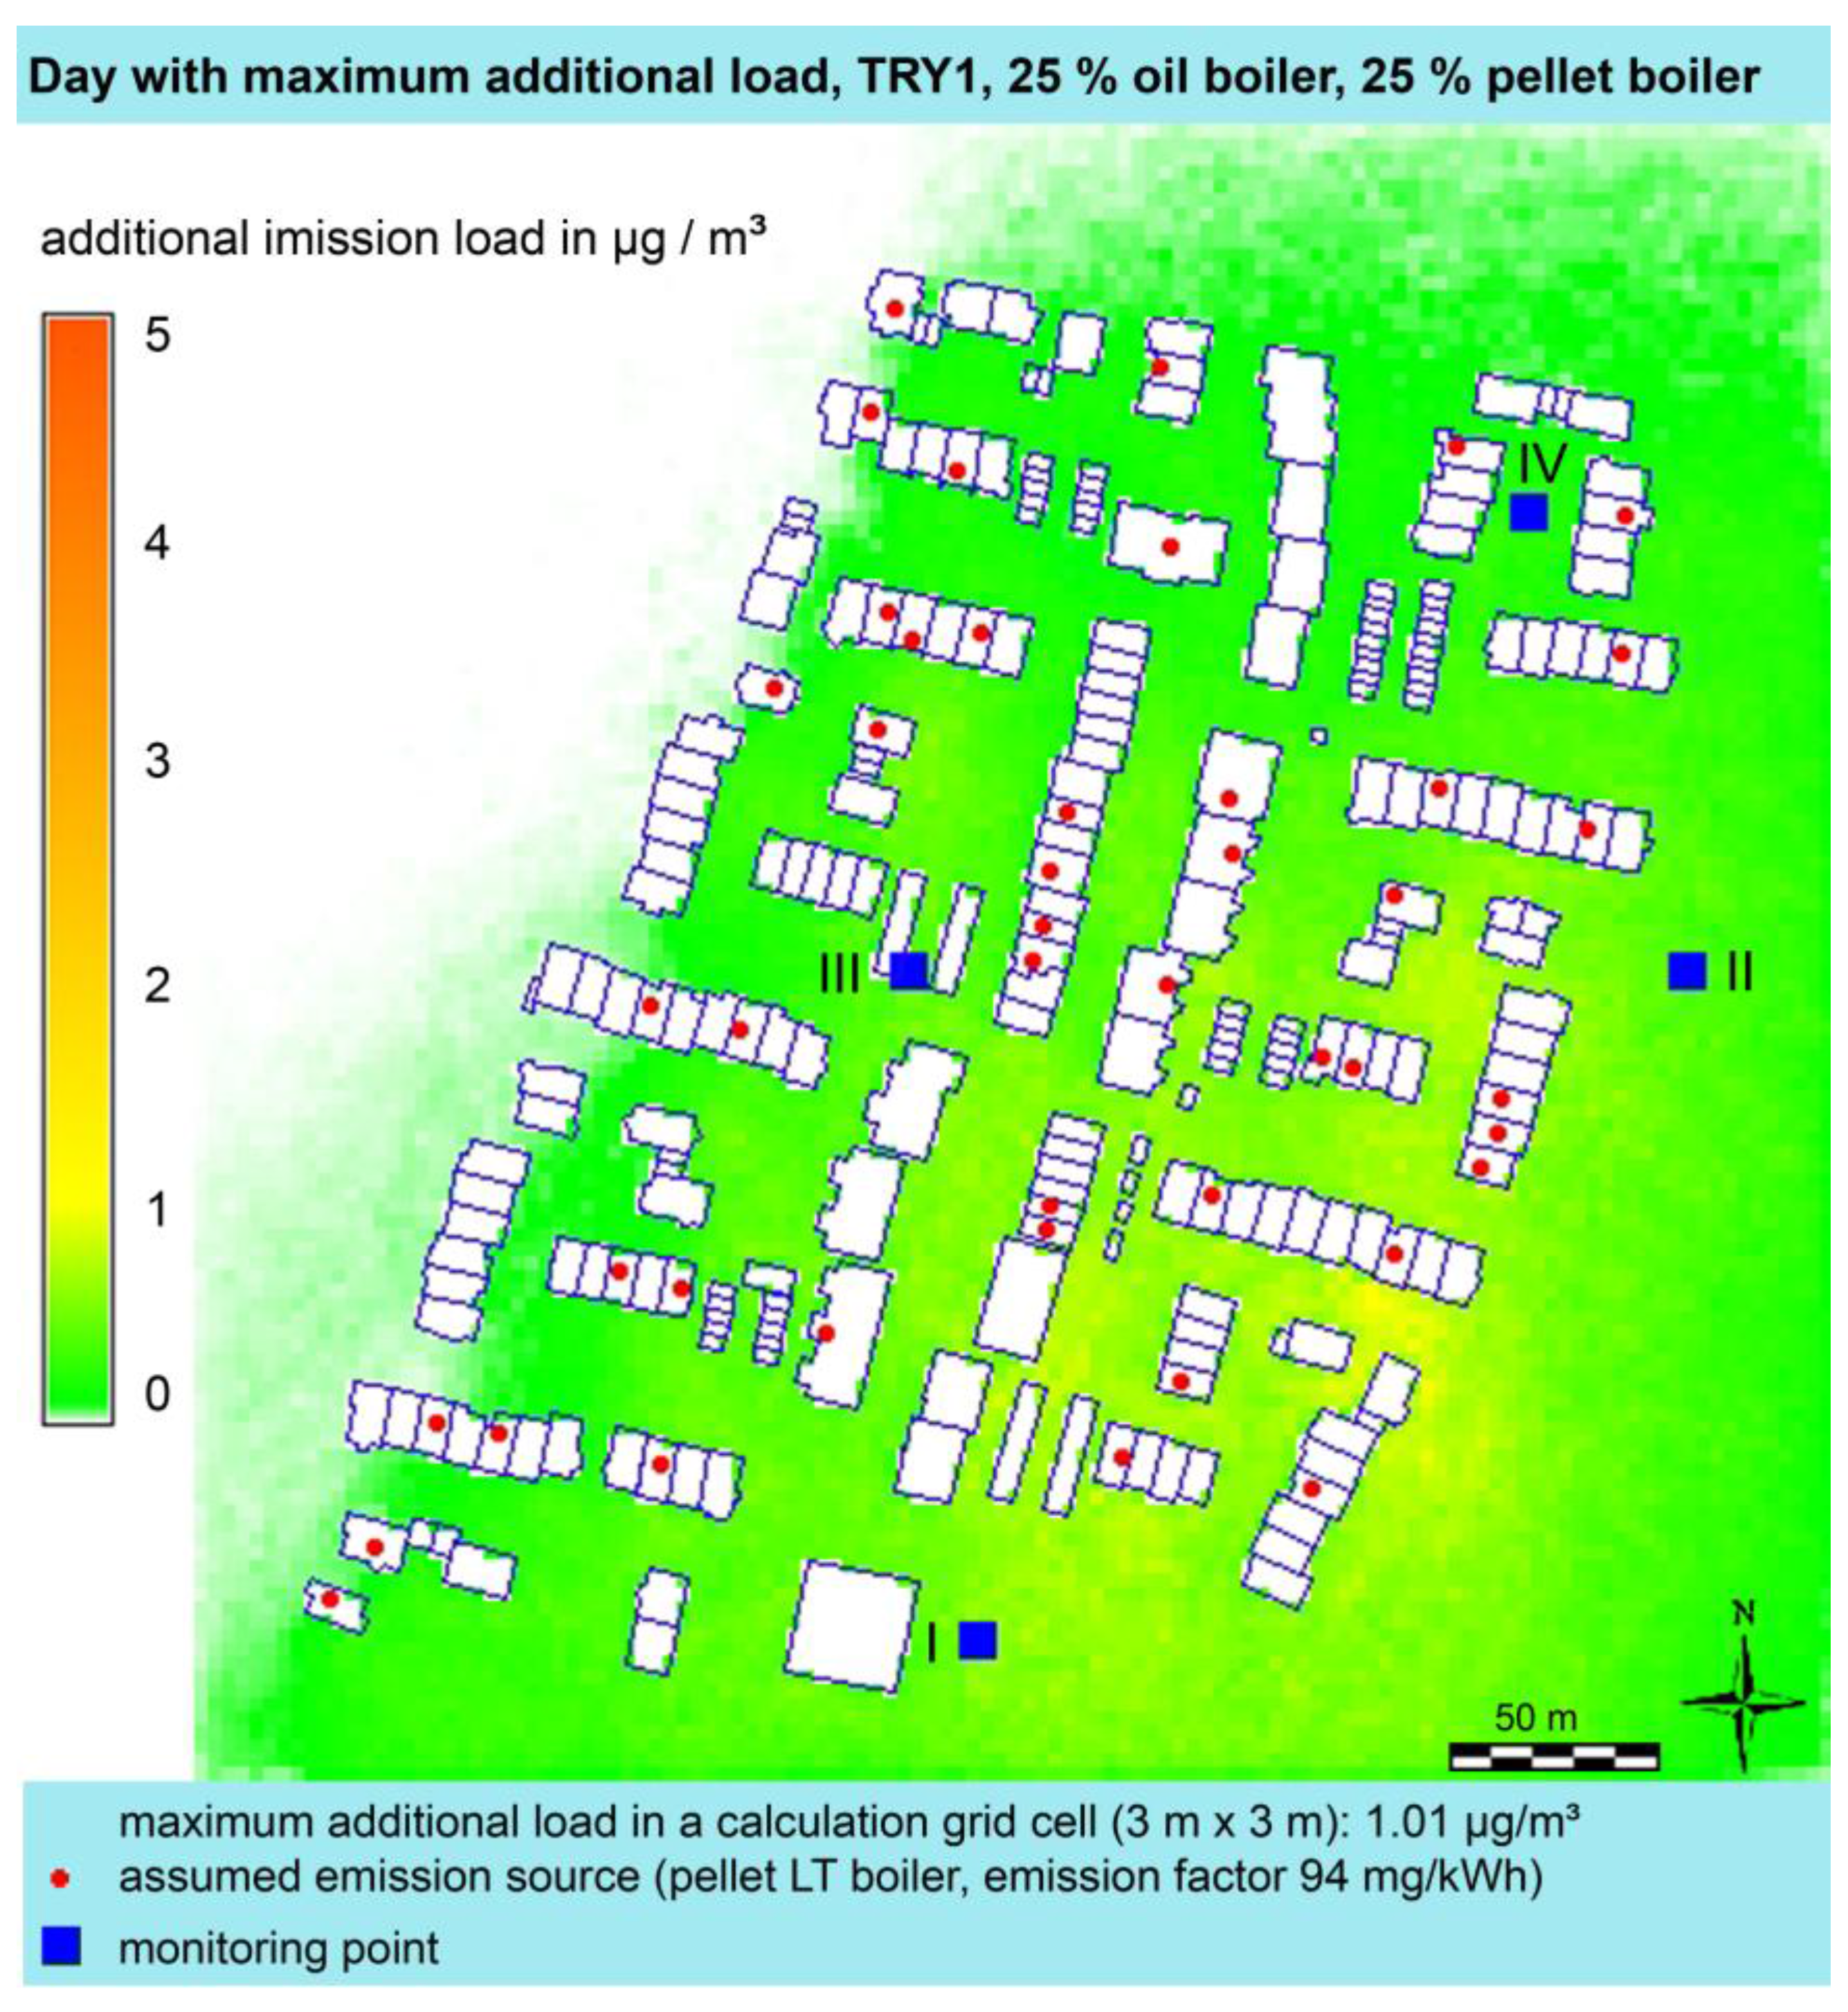
The PM10 immissions were calculated in form of annual mean values as well as daily mean values for the maximum loaded days according to very good (TRY 1) and very unfavorable (TRY 15) meteorological dispersion conditions, thereby representing the best-case (TRY1) and worst-case (TRY15) scenario. These conditions were taken from two places in Germany: Bremerhaven (TRY1) and Garmisch-Partenkirchen (TRY 15). For the best-case scenario, the immission concentrations for maximum additional immission load are shown in
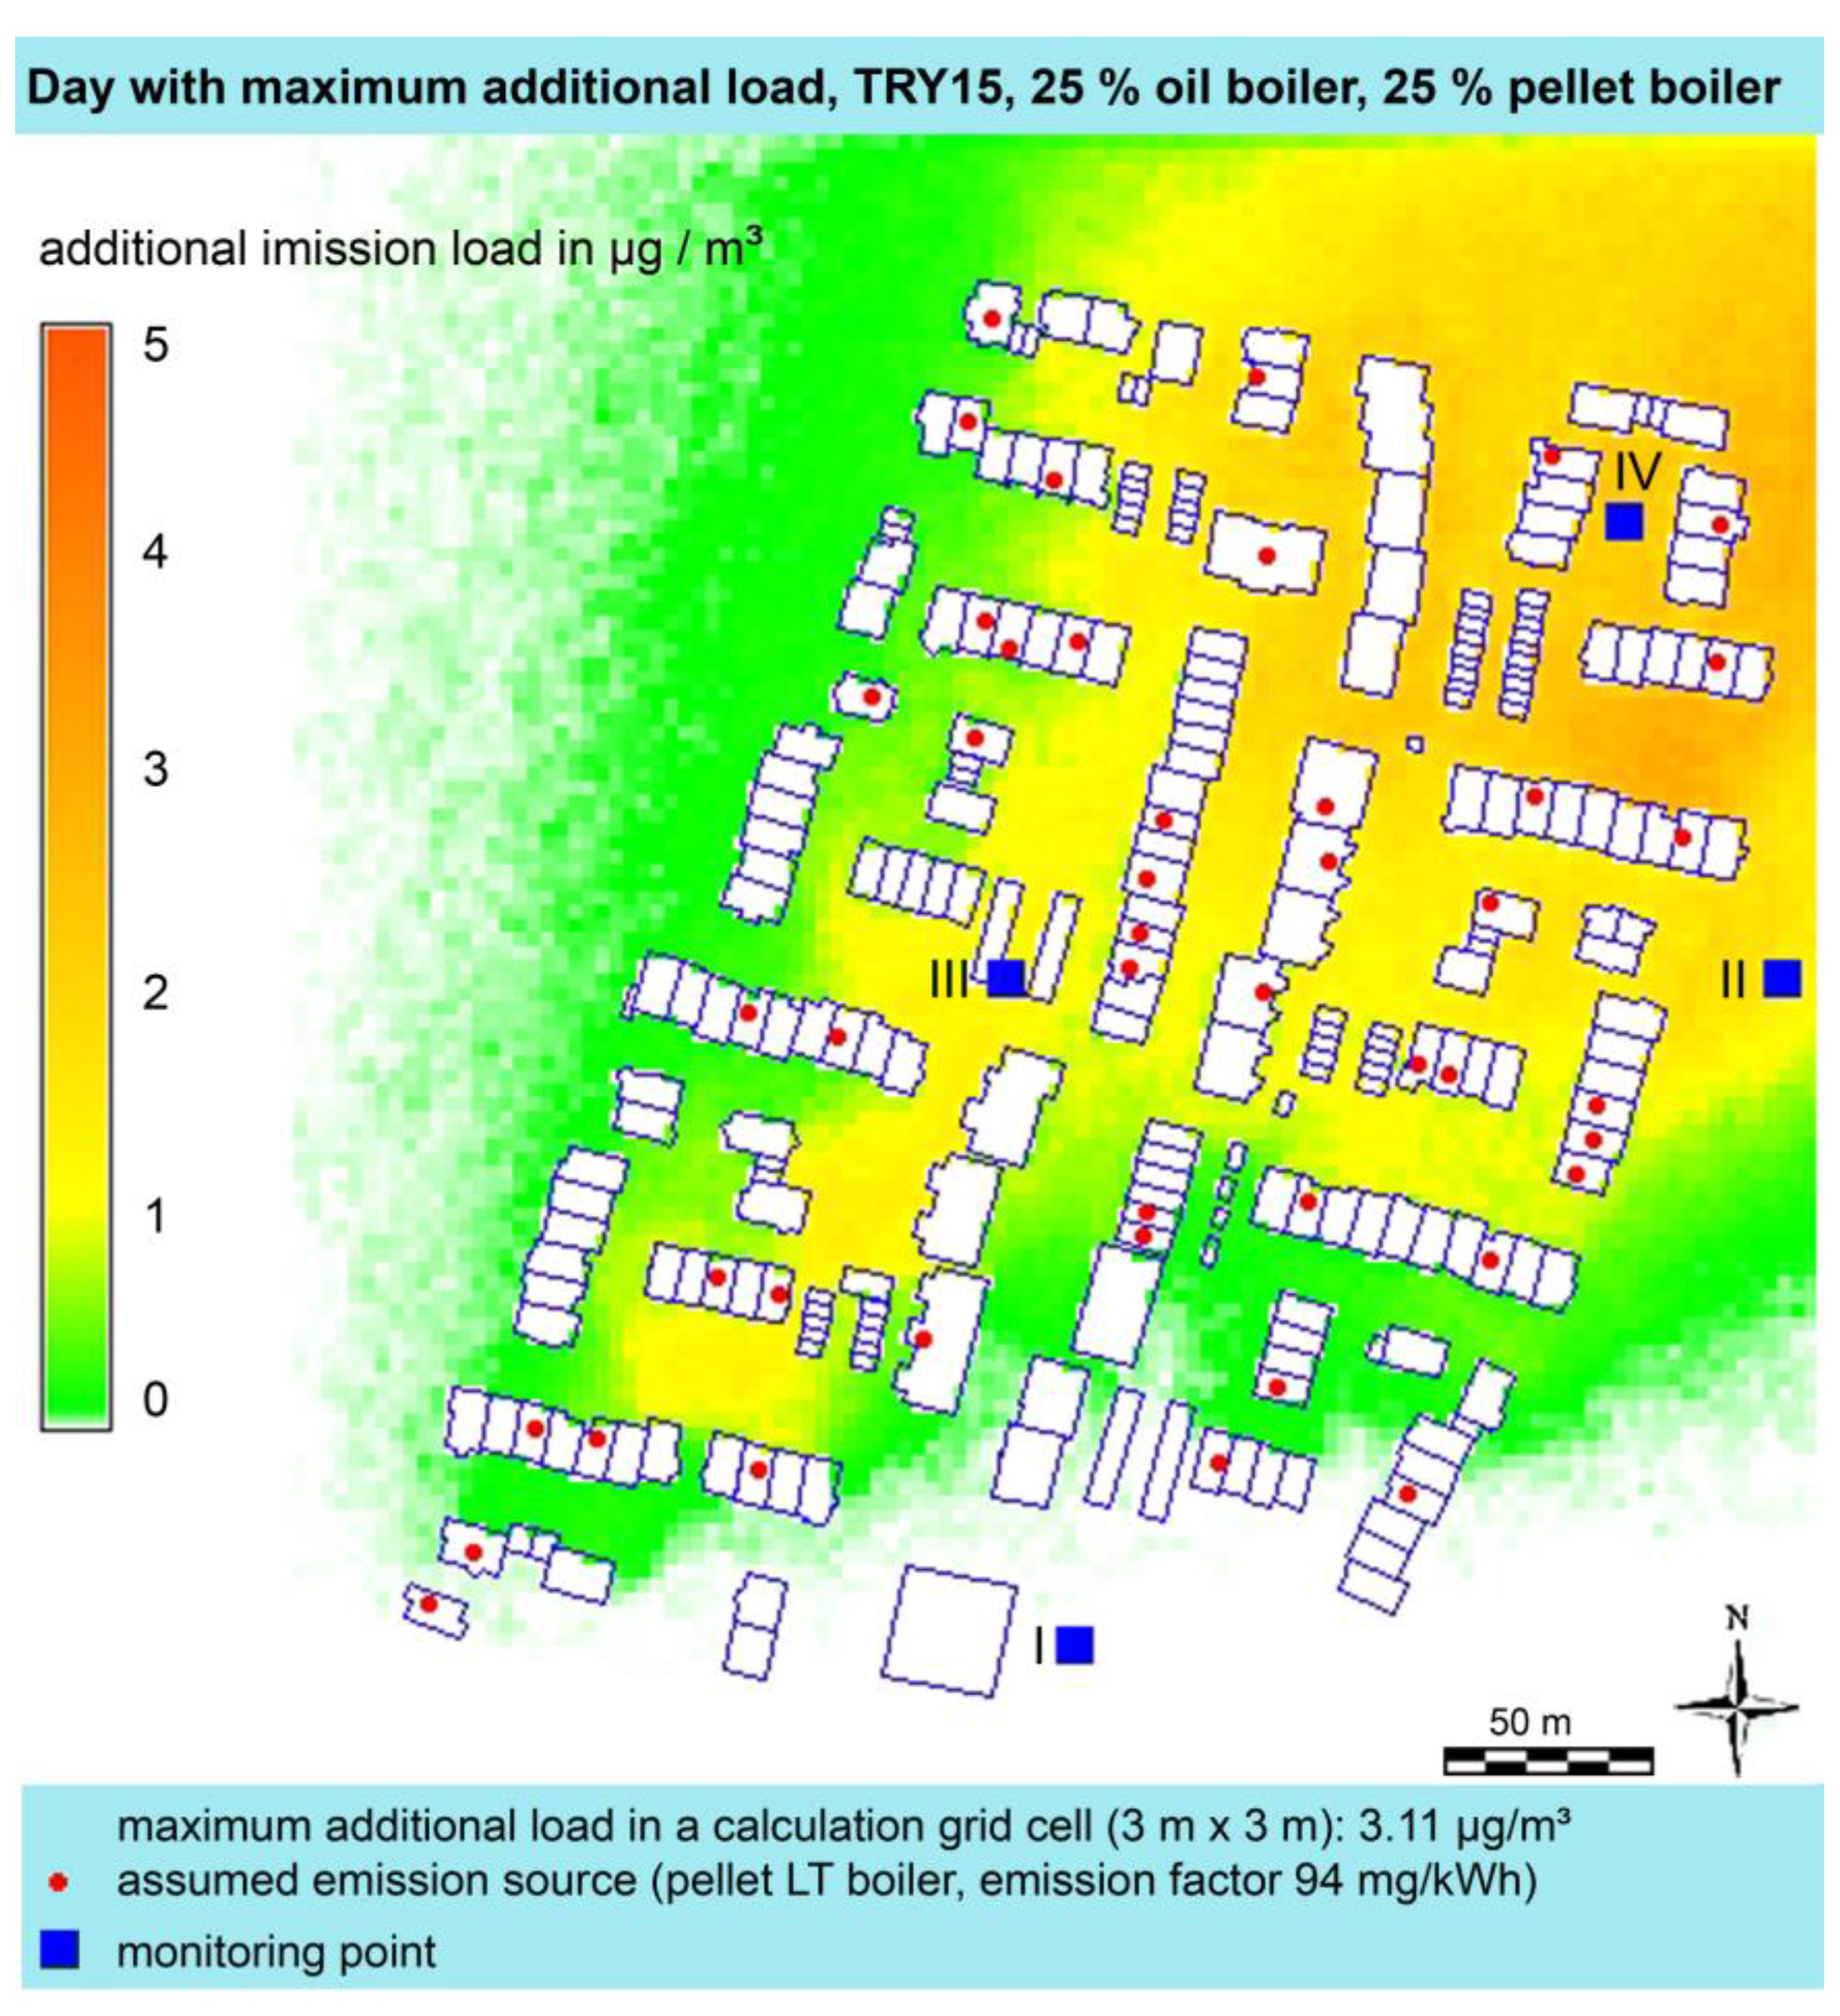
Figure 7 and for the worst-case scenario are shown in
Figure 8.
Figure 7.
The day with maximum additional load for the best-case scenario.
Figure 7.
The day with maximum additional load for the best-case scenario.
The calculated additional PM load in the ambient air was dominated by the PM emissions of the wood pellet boilers. This results from their specific PM emission (94 mg/kWh) which were about 17 times higher than that of fuel oil boilers (5.4 mg/kWh). Moreover, the additional load obviously depends on the number and location of such heating systems. The additional immission load was significantly influenced by the meteorological conditions. Under very good meteorological conditions, the calculated additional immission load was three times lower than for very unfavorable meteorological conditions.
The maximum immission concentrations were found to be very local: within 100 m distance of the building. With increasing distances from the building, immission concentrations decreased rapidly by dilution. A classified frequency distribution of the daily mean values showed that the maximum concentration values occur under unfavorable meteorological conditions and a maximum emission rate. However, these high concentrations only occur for 10 to 20 days per year.
The maximum daily arithmetic mean value of the additional immission load due to emissions from wood pellet LT boilers (25%) was calculated to be 2.9 µg/m
3 (based on an examination area of 250 m
2 as specified in the German “TA Luft” [
4]). The corresponding maximum annual mean value of the additional immission load was 0.46 µg/m
3 (for an examination area of 250 m
2).
So far, there are no direct assessment criteria for the influence of the additional PM load caused by the heating systems. However, the additional load can be compared with the limits on the total allowed immission concentration or the limit corresponding to the influence of a larger single plant.
Figure 8.
The day with maximum additional load for the worst-case scenario.
Figure 8.
The day with maximum additional load for the worst-case scenario.
Since 2005, a European directive [
21] has set limits for the total PM load in the ambient air. An annual mean value of 40 µg/m
3 may not be exceeded and a 24-hour mean value of 50 µg/m
3 may not be exceeded on more than 35 days per year until 2010 and on 7 days per year after 2010.
The maximum additional load, which was calculated to be 2.9 µg/m³, was a fraction of 5.8% of the maximum daily mean value allowed. So the influence of wood-pellet-boiler-heated residential buildings (25%) on the ambient PM load can be up to 6% for unfavorable meteorological conditions.
The German “TA Luft” [
4] specifies a so-called “irrelevance limit” for plants under regulation. This limit is set at 3% of the annual mean value from the European directive 1999/30/EC, i.e., 1.2 µg/m
3. The calculated additional PM load (0.46 µg/m
3) was about 30% of the “irrelevance value”. This means that 25% of residential buildings in a densely populated residential area heated with wood pellet LT boilers had a negligible effect on the total PM load in the ambient air.
4.4. Overall Assessment and Summary of Results
The qualitative results are provided in
Table 2. Since a dispersion calculation was not performed for all of the technologies, the results of the immission analysis are not included in the table. Three technologies were associated with positive impacts for all three of the categories in the table, including the natural gas + solarthermal system, the natural gas heat pump, and the electric heat pump. The wood pellet systems performed best with regards to global warming. However, the trade-off was a poor performance in the other two categories.
Table 2.
Environmental performances of the allowed heating systems (according to current legislation) are shown for different categories, where the reference system is the fuel oil heating system.
Table 2.
Environmental performances of the allowed heating systems (according to current legislation) are shown for different categories, where the reference system is the fuel oil heating system.
| | Reduction of global warming | Reduction of other environmental impacts | Reduction of impacts of local emissions on human health |
|---|
| Fuel oil + rapeseed oil | + | - | 0 |
| Fuel oil + solarthermal | 0 | + | + |
| Natural gas + biomethane | + | -- | 0 |
| Natural gas + solarthermal | + | + | + |
| Natural gas heat pump | + | + | + |
| Wood pellets | ++ | -- | -- |
| Wood pellets + solarthermal | ++ | - | -- |
| Electric heat pump | + | + | ++ |
5. Conclusions
The newly introduced legislation in Germany sets an obligatory quota of renewable energy in heating systems that can be achieved by various technologies. These technologies have been assessed with respect to several ecological criteria. Our results imply that the environmental performance of the allowed technologies and fuels is quite different for the various categories.
The electric heat pump was associated with relatively low GHG emissions, high primary energy efficiency, and a good overall ecological performance. Moreover, the share of renewable energy in the German electricity market is expected to grow in the coming years. Therefore, GHG and other emissions related to the use of electric energy will decrease in the future along with life cycle GHG emissions. An uncertain parameter of this technology is the seasonal performance factor, which is required to be above 3.8 according to current legislation. The feasibility of this mandatory requirement as well as its verification by the authorities has yet to be proven.
Based on our results, we suggest that wood pellet systems (with and without solar thermal support) are the best choice in terms of the effects on global warming. However, the trade-off is high impacts in categories other than GHG emissions, especially when compared to natural gas based systems. Also, the impacts of local emissions are quite high, due to high emissions of pollutants other than GHG. Therefore, further improvements of wood pellet combustion systems (especially with respect to NOx emissions) are desirable and would improve the ecological performance.
For natural gas systems working in combination with solar thermal energy or biomethane systems, only a slight reduction in the GHG emissions was observed relative to a reference natural gas system. For the case of biomethane, the results in the three categories were very poor and led to a steep increase in the impacts compared to the reference system.
The innovative natural gas absorption heat pump, which is planned to be introduced to the market in the coming years, had a strong overall performance. Since it was more efficient compared to the reference natural gas system, less fuel is needed to produce one kWh of heat. Therefore, all of the impacts were reduced by about 20% to 25%, which is a considerable effect. However, the technical and, in particular, the economic viabilities of this technology are not yet proven. Moreover, it has yet to proven that seasonal performance factors of 1.2, as required by legislation, can be realized with this technology.
The environmental performances of the systems based on fuel oil were, in most cases, worse than those that use natural gas. Using solar thermal energy combined with a fuel oil boiler led to only slightly better results than using only fuel oil. In nearly all impact categories, this combination was even worse than the natural gas reference system, which does not use any renewable energy. From a political point of view, this combination should only be allowed where no natural gas is available, i.e., it should be prohibited in areas where there is a natural gas distribution grid available at reasonable cost. A combination of fuel oil and rapeseed oil can achieve good results. However, a high share (50%) of scarce renewable fuel is required. Moreover, the production of rapeseed oil is associated with high acidification that is caused by NH3 emissions from the cultivation process.
From an economic point of view, the cost of the respective technologies would give more information about factors such as the CO2 abatement cost. Therefore, further research on the investment and operating costs is necessary. The same is valid for other environmental impacts that are outside of the scope of this paper, like noise levels or emissions into water. The latter is especially interesting with respect to condensing boilers that feed their condensate into the sewage system.
From a political point of view, it is questionable whether or not to promote solutions that use rapeseed oil and biomethane. In both cases, there is a need to improve biofuel production processes with respect to various environmental impacts and the resource efficiency achieved during the production process.
More research is also needed on the effects of the local air quality on human health: the human health damaging effects of emission occurring locally in residential areas should be compared to those of emissions occurring in other locations. Our paper has only pointed out the importance of this difference and presented a qualitative discussion.
Finally, the immission analysis showed that the local topographic and meteorological conditions are very important. For the case of unfavorable conditions, immission values can reach values up to three times higher than for favorable conditions. However, even under unfavorable conditions, the immissions do not make a significant contribution to any regulatory limit.

