
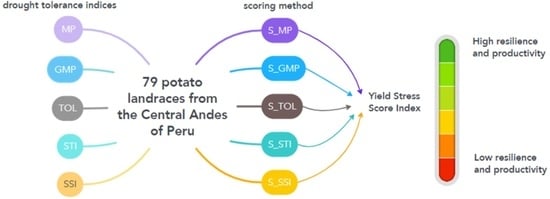
Screening Potato Landraces to Cope with Climate Change in the Central Andes of Peru
 , ,
, ,  , , , ,
  ,
,  and
and 
Abstract
:
1. Introduction
2. Materials and Methods
2.1. Location
2.2. Plant Material and Experimental Design
2.3. Evaluation of Tolerance to Drought Stress
2.4. Statistical Analysis
3. Results
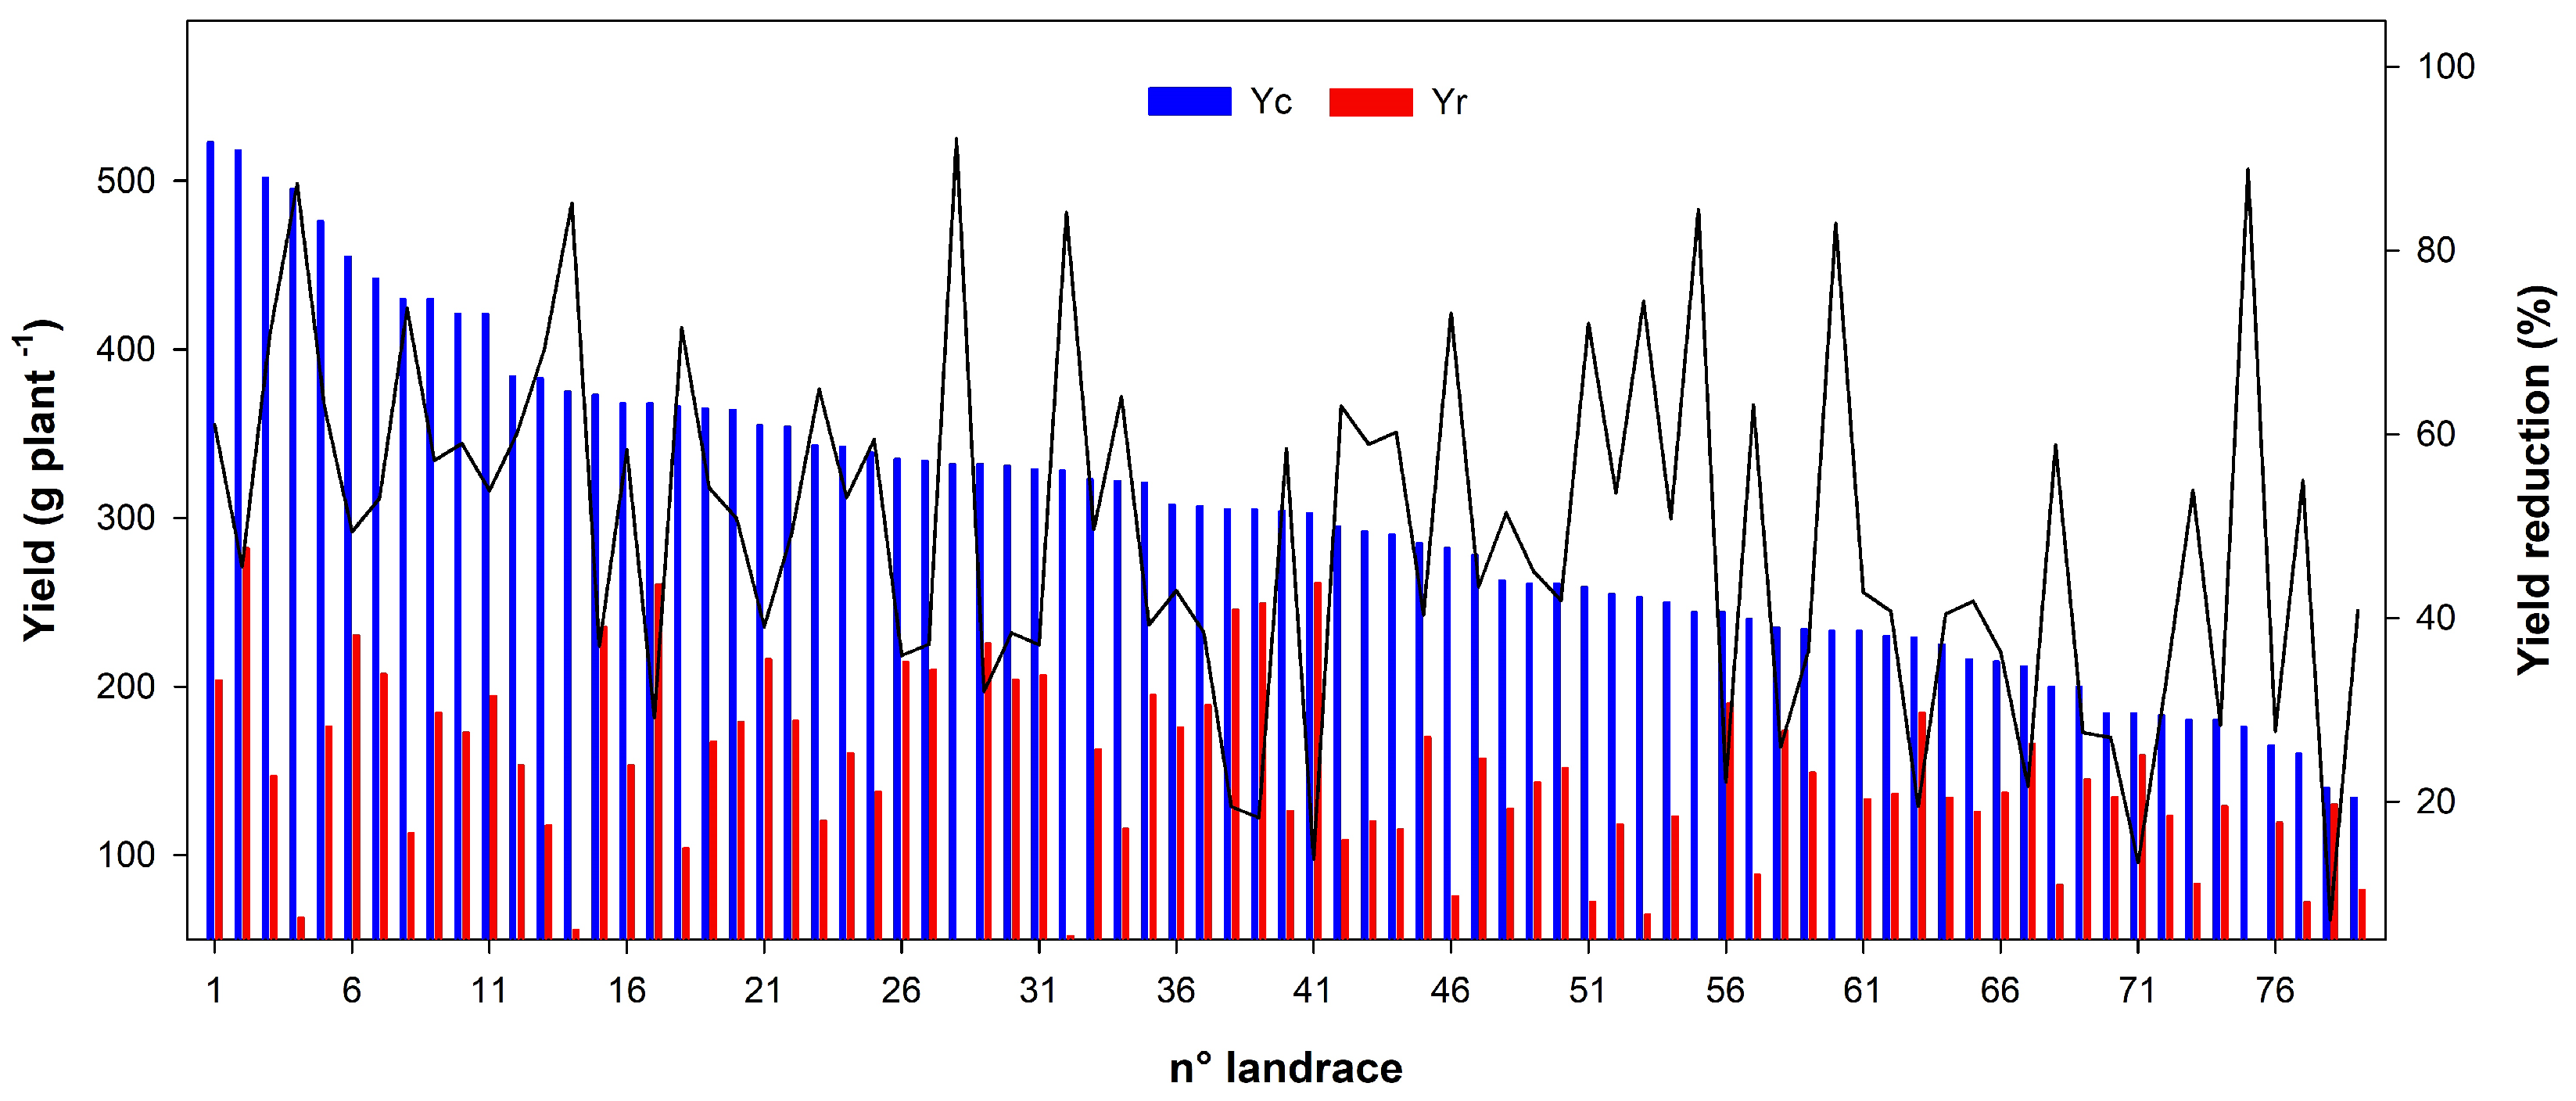
3.1. The Yield of Potatoes Landraces in Different Scenarios
3.2. Tolerance Indices Based on Yield
3.3. Scoring the Indices Responses
4. Discussion
4.1. Yield Gap in the Central Andean Region of Peru
4.2. Usefulness of Tolerance Indices
4.3. Highlights within Local Diversity
5. Conclusions
Author Contributions
Funding
Institutional Review Board Statement
Informed Consent Statement
Data Availability Statement
Acknowledgments
Conflicts of Interest
References
- World Bank. Water in Agriculture. Available online: https://www.worldbank.org/en/topic/water-in-agriculture (accessed on 9 December 2022).
- INEI—Instituto Nacional de Estadística e Informática. The 2007 National Census: XI of Population and VI of Houses; Institute of National Statistics and Information: Lima, Peru, 2007. [Google Scholar]
- INEI—Instituto Nacional de Estadística e Informática. IV Censo Nacional Agropecuario 2012. IV Censo Nacional Agropecuario 2012; Institute of National Statistics and Information: Lima, Peru, 2007; Available online: http://censos.inei.gob.pe/cenagro/tabulados/ (accessed on 9 December 2022).
- Browman, D.L. Arid Land Use Strategies and Risk Management in the Andes: A Regional Anthropological Perspective, 1st ed.; Westview Press: Boulder, CO, USA, 1987; p. 335. Available online: https://library.wur.nl/WebQuery/titel/535539 (accessed on 27 February 2023).
- Lasage, R.; Muis, S.; Sardella, C.; van Drunen, M.; Verburg, P.; Aerts, J. A stepwise, participatory approach to design and implement community-based adaptation to drought in the Peruvian Andes. Sustainability 2015, 7, 1742–1773. [Google Scholar] [CrossRef]
- Vuille, M.; Francou, B.; Wagnon, P.; Juen, I.; Kaser, G.; Mark, B.G.; Bradley, R.S. Climate change and tropical Andean glaciers: Past, present and future. Earth Sci. Rev. 2008, 89, 79–96. [Google Scholar] [CrossRef]
- Winterhalder, B. The ecological basis of water management in the central Andes: Rainfall and temperature in southern Peru. In Irrigation at High Altitudes: The Social Organization of Water Control Systems in the Andes; Mitchell, W., Guillet, D., Eds.; American Anthropological Association: Arlington, VA, USA, 1994; pp. 21–67. Available online: https://escholarship.org/uc/item/7f60z8r3 (accessed on 27 February 2023).
- MIDAGRI—Ministerio de Agricultura del Perú. Marco Orientador de Cultivos. Ministerio de Desarrollo Agrario y Riego. Available online: https://cdn.www.gob.pe/uploads/document/file/3863155/Marco%20Orientador%20de%20Cultivos%202022/2023.pdf (accessed on 27 February 2023).
- Parra-Rondinel, F.; Casas, A.; Begazo, D.; Paco, A.; Márquez, E.; Cruz, A.; Segovia, J.; Torres-García, I.; Zarazúa, M.; Lizárraga, L.; et al. Natural and cultural processes influencing gene flow among wild (atoq papa), weedy (araq papa and k’ipa papa), and crop potatoes in the Andean region of Southern Peru. Front. Ecol. Evol. 2021, 9, 617969. [Google Scholar] [CrossRef]
- Egusquiza, R.; Salinas, J.; Vidal, M. Reaction to drought: A case study of native potatoes (Solanum Spp.) Cultiv. Huanuco, Peru. Peruv. J. Agron. 2020, 4, 82–87. [Google Scholar] [CrossRef]
- Lüttringhaus, S.; Pradel, W.; Suarez, V.; Manrique-Carpintero, N.C.; Anglin, N.L.; Ellis, D.; Hareau, G.; Jamora, N.; Smale, M.; Gómez, R. Dynamic guardianship of potato landraces by Andean communities and the genebank of the International Potato Center. CABI Agric. Biosci. 2021, 2, 45. [Google Scholar] [CrossRef] [PubMed]
- Diez, A. Tensiones y Transformaciones en Comunidades Campesinas, 1st ed.; Pontificia Universidad Católica del Perú, Departamento de Ciencias Sociales: Lima, Peru, 2012; p. 284. Available online: https://repositorio.pucp.edu.pe/index/handle/123456789/187148 (accessed on 1 December 2022).
- Agrawal, T.; Hirons, M.; Gathorne-Hardy, A. Understanding farmers cropping decisions and implications for crop diversity conservation: Insights from Central India. Curr. Res. Environ. Sustain. 2021, 3, 10006. [Google Scholar] [CrossRef]
- De Haan, S. Potato Diversity at Height: Multiple Dimensions of Farmer-Driven In-Situ Conservation in the Andes, 1st ed.; Wageningen University and Research ProQuest Dissertations Publishing: Wageningen, The Netherlands, 2009; p. 28230485. Available online: https://www.researchgate.net/publication/37788907_Potato_diversity_at_height_Multiple_dimensions_of_farmer-driven_in-situ_conservation_in_the_Andes (accessed on 1 December 2022).
- Monneveux, P.; Ramírez, D.A.; Pino, M.-T. Drought tolerance in potato (S. tuberosum L.): Can we learn from drought tolerance research in cereals? Plant Sci. 2013, 205–206, 76–86. [Google Scholar] [CrossRef]
- Pradel, W.; Gatto, M.; Hareau, G.; Pandey, S.K.; Bhardway, V. Adoption of potato varieties and their role for climate change adaptation in India. Clim. Risk Manag. 2019, 23, 114–123. [Google Scholar] [CrossRef]
- Rosielle, A.A.; Hamblin, J. Theoretical aspects of selection for yield in stress and non-stress environments. Crop Sci. 1981, 21, 943–946. [Google Scholar] [CrossRef]
- Ramírez, N.; Roldán, A.; Jiménez, J. Evaluation of drought tolerance in native potato (Solanum spp.) under semicontrolled conditions, to mitigate climate change. In Proceedings of the Libro de resúmenes 10° Congreso WPC-XXVIII ALAP 2018: Biodiversidad, Seguridad Alimentaria y Negocios, Cusco, Peru, 27–31 May 2018; Available online: https://scholar.google.com/citations?view_op=view_citation&hl=es&user=hklPOHUAAAAJ&citation_for_view=hklPOHUAAAAJ:3fE2CSJIrl8C (accessed on 3 May 2023).
- Torres, Y.; Lozano, R.; Merino, C.; Orjeda, G. Identificación de genes relacionados a sequía en papas nativas empleando RNA-Seq. Rev. Peru. Biol. 2013, 20, 211–214. [Google Scholar] [CrossRef]
- Zaki, H.; Radwan, K. Response of potato (Solanum tuberosum L.) Cultiv. Drought Stress Vitr. Field Conditions. Chem. Biol. Technol. Agric. 2022, 9, 211–214. [Google Scholar] [CrossRef]
- Cabello, R.; De Mendiburu, F.; Bonierbale, M.; Monneveux, P.; Roca, W.; Chujoy, E. Large-Scale Evaluation of Potato Improved Varieties, Genetic Stocks and Landraces for Drought Tolerance. Am. J. Potato Res. 2012, 89, 400–410. [Google Scholar] [CrossRef]
- Cabello, R.; Monneveux, P.; De Mendiburu, F.; Bonierbale, M. Comparison of yield based drought tolerance indices in improved varieties, genetic stocks and landraces of potato (Solanum tuberosum L.). Euphytica 2013, 193, 147–156. [Google Scholar] [CrossRef]
- Santos, P. Diseño y Ejecución de la Línea Principal y Laterales Para Riego a Presión en el Anexo de Aco del Distrito Paucartambo—Pasco; Agricultural Engineering, Universidad Nacional Agraria La Molina: Lima, Peru, 2018; Available online: https://renati.sunedu.gob.pe/handle/sunedu/3286790 (accessed on 3 May 2023).
- Zevallos, E.; Inga, J.; Alvarez, F.; Marmolejo, K.; Paitan, R.; Viza, I.; Becerra, D.; Rixi, G.; Silva-Diaz, C. First signs of late blight resistance in traditional native potatoes of Pasco—Peru, a preliminary assay. Agric. Food Secur. 2021, 10, 33. [Google Scholar] [CrossRef]
- van Loon, C.D. The effect of water stress on potato growth, development, and yield. Am. Potato J. 1981, 58, 51–69. [Google Scholar] [CrossRef]
- Gabriel, J.; Magne, J.; García, R.; Coca, J. Variedades nativas de papa: Tecnología tangible para afrontar el efecto causado por la helada y la sequía. Rev. Latinoam. Papa 2009, 15, 75–77. [Google Scholar] [CrossRef]
- Fernandez, G. Effective selection criteria for assessing plant stress tolerance. In Proceedings of the International Symposium on Adaptation of Food Crops to Temperature and Water Stress, Taiwan, China, 13–18 August 1992; pp. 257–270. [Google Scholar] [CrossRef]
- Hossain, A.B.S.; Sears, R.G.; Cox, T.S.; Paulsen, G.M. Desiccation tolerance and its relationship to assimilate partitioning in winter wheat. Crop Sci. 1990, 30, 622–627. [Google Scholar] [CrossRef]
- Fischer, R.A.; Maurer, R. Drought resistance in spring wheat cultivars. I. Grain yield responses. Aust. J. Agric. Res. 1978, 29, 897–912. [Google Scholar] [CrossRef]
- Thiry, A.A.; Chavez Dulanto, P.N.; Reynolds, M.P.; Davies, W.J. How can we improve crop genotypes to increase stress resilience and productivity in a future climate? A new crop screening method based on productivity and resistance to abiotic stress. J. Exp. Bot. 2016, 67, 5593–5603. [Google Scholar] [CrossRef]
- Ninanya, J.; Ramirez, D.; Rinza, J. Thiry’s Screening Method (TSM). International Potato Center. Available online: https://data.cipotato.org/dataset.xhtml?persistentId=doi:10.21223/FOOZ1Y (accessed on 3 May 2023).
- De Mendiburu, F. Package ‘Agricolae’. R Package Version 1.2-2. Available online: http://tarwi.lamolina.edu.pe/fmendiburu (accessed on 30 June 2023).
- INIA. Caracterización Morfológica y Agronómica de 61 Variedades Nativas de Papa. Ministerio de Agricultura de Peru, 1st ed.; Ministerio de Agricultura y Riego & Instituto Nacional de Innovación Agraria: Lima, Peru, 2009; p. 343. Available online: http://repositorio.minagri.gob.pe/jspui/handle/MINAGRI/734 (accessed on 6 November 2022).
- Sofi, P.A.; Rehman, K.; Ara, A.; Mir, S.A.; Dar, S.A. Improving screening methods for water stress in common bean (Phaseolus vulgaris L.) using new score indices based on productivity and resilience. Int. J. Curr. Microbiol. Appl. Sci. 2017, 6, 967–981. [Google Scholar] [CrossRef]
- PRODERN. La Papa Nativa en Apurímac. Identificación Participativa de Variedades en los Distritos de Huayna y Pomacocha, 1st ed.; PRODERN: Lima, Peru, 2018; p. 170. Available online: https://prodern.minam.gob.pe/sites/default/files/documents/Papas%20nativas%20ApurimacFinal.pdf (accessed on 6 November 2022).
- Silva-Díaz, C.; Ramírez, D.A.; Rodríguez-Delfín, A.; de Mendiburu, F.; Rinza, J.; Ninanya, J.; Loayza, H.; Quiroz, R. Unraveling Ecophysiological Mechanisms in Potatoes under Different Irrigation Methods: A Preliminary Field Evaluation. Agronomy 2020, 10, 827. [Google Scholar] [CrossRef]
- Dresselhaus, T.; Hückelhoven, R. Biotic and abiotic stress responses in crop plants. Agronomy 2018, 8, 267. [Google Scholar] [CrossRef]
- Huang, J.; Pray, C.; Rozelle, S. Unraveling Enhancing the crops to feed the poor. Nature 2002, 418, 678–684. [Google Scholar] [CrossRef] [PubMed]
- Getie, A.T.; Dechassa, N.; Tana, T. Response of potato (Solanum tuberosum L.) Yield Yield Components Nitrogen Fertil. Plant. Density Haramaya, East. Ethiopia. J. Plant Sci. 2015, 3, 320–328. [Google Scholar]
- Hirel, B.; Le Gouis, J.; Ney, B.; Gallais, A. The challenge of improving nitrogen use efficiency in crop plants: Towards a more central role for genetic variability and quantitative genetics within integrated approaches. J. Exp. Bot. 2007, 58, 2369–2387. [Google Scholar] [CrossRef] [PubMed]
- Patel, J.M.; Patel, A.S.; Patel, C.R.; Mamrutha, H.M.; Pradeep, S.; Pachchigar, K.P. Evaluation of selection indices in screening durum wheat genotypes combining drought tolerance and high yield potential. Int. J. Curr. Microbiol. Appl. Sci. 2019, 8, 1165–1178. [Google Scholar] [CrossRef]
- Blum, A. Crop responses to drought and the interpretation of adaptation. J. Plant Growth Regul. 1996, 20, 135–148. [Google Scholar] [CrossRef]
- Pantuwan, G.; Fukai, S.; Cooper, M.; Rajatasereekul, S.; O’Toole, J.C. Yield response of rice (Oryza sativa L.) Genotypes Differ. Types Drought Rainfed Lowl. Part 1. Grain Yield Yield Components. Field Crop. Res. 2002, 73, 153–168. [Google Scholar] [CrossRef]
- Roy, N.N.; Murty, B.R. A selection procedure in wheat for stress environment. Euphytica 1970, 19, 509–521. [Google Scholar] [CrossRef]
- Sandaña, P.; Villagra, P.; Kalazich, J.; Uribe, M.; Gutiérrez, R. Selección de genotipos de papas en función de los índices de tolerancia a sequía. In Estrés híDrico y téRmico en Papas, Avances y Protocolos; Pino, M., Ed.; Instituto de Investigaciones Agropecuarias—INIA: Santiago, Chile, 2016; p. 148. Available online: http://bibliotecadigital.ciren.cl/bitstream/handle/20.500.13082/31638/INIA_Libro_0094.pdf?sequence=1&isAllowed=y (accessed on 1 December 2022).
- Cengiz, T.; Ílhan, C. Assessment of Response to Drought Stress of Chickpea(Cicer arietinum L.) Lines Rainfed Conditions. Turk. J. Agric. For. 1998, 22, 615–622. Available online: https://journals.tubitak.gov.tr/agriculture/vol22/iss6/13 (accessed on 9 December 2022).
- Ghagar Sepanlo, M.; Siyadat, H.; Mirlatifi, M.; Mirnia, S.K. Effect of Cutting of Irrigation in Different Growth Sages on Yield and Water Use Efficiency and Comparison Some Drought Tolerance. Soil Water J. 2000, 12, 64–75. [Google Scholar]
- Kharrazi, M.R.; Naroui, M. Evaluation of sorghum genotypes under drought stress conditions using some stress tolerance indices. Afr. J. Biotechnol. 2011, 10, 13086–13089. [Google Scholar]
- Cahuana, R.; Arcos, J. Variedades Nativas y Mejoradas de Papa en Puno, 1st ed.; INIA: Puno, Peru, 2002; p. 120. Available online: http://repositorio.inia.gob.pe/bitstream/20.500.12955/898/1/Cahuana-Variedades_nativas_Papa.pdf (accessed on 27 February 2023).
- Ramirez, P.; Kelly, J.D. Traits related to drought resistance in common bean. Euphytica 1998, 99, 127–136. [Google Scholar] [CrossRef]
- Boicet-Fabre, T.; Baldaquín-Hernández, M.; Boudet-Antomarchi, A.D.; Merino-Hernández, Y.; Alarcón-Zayas, A.; Almarales-Frías, W. Evaluation of different indices tolerance to drought based on multivariate analysis. Cultiv. Trop. 2018, 39, 61–67. Available online: https://www.cabdirect.org/cabdirect/abstract/20183313456 (accessed on 3 May 2023).
- Kamrani, M.; Hoseini, Y.; Ebadollahi, A. Evaluation for heat stress tolerance in durum wheat genotypes using stress tolerance indices. Arch. Agron. Soil Sci. 2018, 64, 38–45. [Google Scholar] [CrossRef]
- Sofi, P.A.; Shafi, S.; Singh, B.; Jaiswal, J.P.; Mishra, V.K.; Mir, R.R. Combined selection for productivity and resilience through modified stress tolerance indices in a HUW-234 X HUW-468 derived wheat (Triticum aestivum L.) RIL Mapp. Popul. Heat Stress. Electron. J. Plant Breed. 2021, 12, 612–622. [Google Scholar]
- Gomez-Pando, L.; Dood, I.; Zamudio Ayala, D.; Deza Montoya, D.; Eguiluz De La Barra, A. Identification of bread wheat genotypes (Triticum aestivum L.) Toler. Drought Cond. Cent. Coast Peru. Peruv. J. Agron. 2022, 6, 175–190. [Google Scholar] [CrossRef]
- Ramírez, D.A.; Grüneberg, W.; Andrade, M.I.; De Boeck, B.; Loayza, H.; Makunde, G.S.; Ninanya, J.; Rinza, J.; Heck, S.; Campos, H. Phenotyping of productivity and resilience in sweet potato under water stress through UAV-based multispectral and thermal imagery in Mozambique. J. Agron. Crop. Sci. 2023, 209, 41–55. [Google Scholar] [CrossRef]
- Blum, A. Plant Breeding for Stress Environments, 1st ed.; CRC Press: Boca Raton, FL, USA, 1998; p. 231. Available online: https://books.google.com.pe/books?hl=es&lr=&id=2kcPEAAAQBAJ&oi=fnd&pg=PP1&dq=Blum,+A.+(1988).+Plant+Breeding+For+Stress+Environments.+CRC+Press&ots=CbYyJVibZX&sig=WdZRFVDVWWIZoF-wpfDMA36zJC4#v=onepage&q=Blum%2C%20A.%20(1988).%20Plant%20Breeding%20For%20Stress%20Environments.%20CRC%20Press&f=false (accessed on 6 November 2022).


| n° | Landraces | Yc | Yr | HSD | MP | GMP | TOL | STI | SSI |
|---|---|---|---|---|---|---|---|---|---|
| 2 | Sumaq sunqu rojo | 518 | 282.0 | a | 400.0 | 382.2 | 236.0 | 1.6 | 0.9 |
| 41 | Huayro negro | 303 | 261.3 | ab | 282.2 | 281.4 | 41.7 | 0.9 | 0.3 |
| 16 | Yana galla shaco | 368 | 260.7 | abc | 314.3 | 309.7 | 107.3 | 1.0 | 0.6 |
| 38 | Huayro plomo | 305 | 249 | abcd | 277.2 | 275.8 | 55.7 | 0.8 | 0.4 |
| 39 | Viuda | 305 | 246 | abcde | 275.3 | 273.7 | 59.3 | 0.8 | 0.4 |
| 15 | Shogo chata | 373 | 235.3 | abcdef | 304.2 | 296.3 | 137.7 | 1.0 | 0.7 |
| 6 | Gara callhuan | 455 | 230.3 | abcdef | 342.7 | 323.7 | 224.7 | 1.1 | 1.0 |
| 28 | Uncuy | 332 | 225.7 | abcdef | 278.8 | 273.7 | 106.3 | 0.8 | 0.6 |
| 21 | Muru dólar | 355 | 216.3 | abcdef | 285.7 | 277.1 | 138.7 | 0.8 | 0.8 |
| 26 | Niña papa | 335 | 214.7 | abcdef | 274.8 | 268.2 | 120.3 | 0.8 | 0.7 |
| 27 | Puka cauriña | 334 | 210.0 | abcdef | 272.0 | 264.8 | 124.0 | 0.8 | 0.7 |
| 7 | Azul callhuan | 442 | 207.7 | abcdef | 324.8 | 303.0 | 234.3 | 1.0 | 1.0 |
| 31 | Azulino | 329 | 207.0 | abcdef | 268.0 | 261.0 | 122.0 | 0.7 | 0.7 |
| 30 | Muru ranra ñahui | 331 | 204.0 | abcdef | 267.5 | 259.9 | 127.0 | 0.7 | 0.7 |
| 1 | Cantiña | 523 | 203.7 | abcdef | 363.3 | 326.4 | 319.3 | 1.2 | 1.2 |
| 35 | Yana shenga | 321 | 195.0 | abcdef | 258.0 | 250.2 | 126.0 | 0.7 | 0.8 |
| 10 | Rayhuana | 421 | 194.3 | abcdef | 307.7 | 286.0 | 226.7 | 0.9 | 1.0 |
| 55 | Galleta blanca | 244 | 190.0 | abcdef | 217.0 | 215.3 | 54.0 | 0.5 | 0.4 |
| 37 | Muru pillush | 307 | 189.0 | abcdef | 248.0 | 240.9 | 118.0 | 0.6 | 0.7 |
| 8 | Muru piña | 430 | 184.3 | abcdef | 307.2 | 281.5 | 245.7 | 0.9 | 1.1 |
| 63 | Cacho de toro | 229 | 184.3 | abcdef | 206.7 | 205.5 | 44.7 | 0.5 | 0.4 |
| 22 | Morales rojo | 354 | 179.7 | abcdef | 266.8 | 252.2 | 174.3 | 0.7 | 1.0 |
| 20 | Puka canasta | 364 | 179.0 | abcdef | 271.5 | 255.3 | 185.0 | 0.7 | 1.0 |
| 5 | Huasho | 476 | 176.3 | abcdef | 326.2 | 289.7 | 299.7 | 0.9 | 1.2 |
| 36 | Runtush | 308 | 175.7 | abcdef | 241.8 | 232.6 | 132.3 | 0.6 | 0.8 |
| 58 | Matucana | 235 | 174.0 | abcdef | 204.5 | 202.2 | 61.0 | 0.4 | 0.5 |
| 11 | Acacluy pecho | 421 | 172.7 | abcdef | 296.8 | 269.6 | 248.3 | 0.8 | 1.1 |
| 45 | Tarma | 285 | 170.0 | abcdef | 227.5 | 220.1 | 115.0 | 0.5 | 0.8 |
| 19 | Yuraj morales | 365 | 167.3 | abcdef | 266.2 | 247.1 | 197.7 | 0.7 | 1.1 |
| 67 | Cahuashina moro | 212 | 166.0 | abcdef | 189.0 | 187.6 | 46.0 | 0.4 | 0.4 |
| 33 | Higos | 323 | 162.7 | abcdef | 242.8 | 229.2 | 160.3 | 0.6 | 1.0 |
| 24 | Yuca suytu | 342 | 160.3 | abcdef | 251.2 | 234.2 | 181.7 | 0.6 | 1.0 |
| 70 | Muru puñete | 184 | 159.3 | abcdef | 171.7 | 171.2 | 24.7 | 0.3 | 0.3 |
| 47 | Huayti chuco | 278 | 157.3 | abcdef | 217.7 | 209.1 | 120.7 | 0.5 | 0.8 |
| 12 | Niño suytu | 384 | 153.3 | abcdef | 268.7 | 242.7 | 230.7 | 0.6 | 1.2 |
| 17 | Yuraj pillish | 368 | 153.3 | abcdef | 260.7 | 237.5 | 214.7 | 0.6 | 1.1 |
| 49 | Alcarraz | 261 | 151.7 | abcdef | 206.3 | 199.0 | 109.3 | 0.4 | 0.8 |
| 59 | Cahuashina | 234 | 149.0 | abcdef | 191.5 | 186.7 | 85.0 | 0.4 | 0.7 |
| 3 | Leona | 502 | 147.0 | abcdef | 324.5 | 271.7 | 355.0 | 0.8 | 1.4 |
| 68 | Yawar taico | 200 | 145.0 | abcdef | 172.5 | 170.3 | 55.0 | 0.3 | 0.5 |
| 50 | Piña negra | 261 | 143.3 | abcdef | 202.2 | 193.4 | 117.7 | 0.4 | 0.9 |
| 25 | Chaucha | 339 | 137.7 | abcdef | 238.3 | 216.0 | 201.3 | 0.5 | 1.2 |
| 66 | Huayro rojo | 215 | 137.0 | abcdef | 176.0 | 171.6 | 78.0 | 0.3 | 0.7 |
| 62 | Milagro rojo | 230 | 136.3 | abcdef | 183.2 | 177.1 | 93.7 | 0.3 | 0.8 |
| 71 | Puka pampiña | 184 | 134.3 | abcdef | 159.2 | 157.2 | 49.7 | 0.3 | 0.5 |
| 64 | Yana semita | 225 | 134.0 | abcdef | 179.5 | 173.6 | 91.0 | 0.3 | 0.8 |
| 60 | Puka dólar | 233 | 133.3 | abcdef | 183.2 | 176.3 | 99.7 | 0.3 | 0.8 |
| 78 | Jilguero rojo | 140 | 130.0 | abcdef | 135.0 | 134.9 | 10.0 | 0.2 | 0.1 |
| 73 | Muru tarma | 180 | 129.0 | abcdef | 154.5 | 152.4 | 51.0 | 0.3 | 0.6 |
| 48 | Santo domingo | 263 | 127.7 | abcdef | 195.3 | 183.2 | 135.3 | 0.4 | 1.0 |
| 40 | Chaulina | 304 | 126.3 | abcdef | 215.2 | 196.0 | 177.7 | 0.4 | 1.1 |
| 65 | Clavel suytu | 216 | 125.7 | abcdef | 170.8 | 164.8 | 90.3 | 0.3 | 0.8 |
| 72 | Huayro blanco | 183 | 123.3 | abcdef | 153.2 | 150.2 | 59.7 | 0.2 | 0.6 |
| 54 | Huayro moro rojo | 250 | 123.0 | abcdef | 186.5 | 175.4 | 127.0 | 0.3 | 1.0 |
| 23 | Yana pillush | 343 | 120.3 | abcdef | 231.7 | 203.2 | 222.7 | 0.5 | 1.3 |
| 43 | Yana huaca | 292 | 120.0 | abcdef | 206.0 | 187.2 | 172.0 | 0.4 | 1.1 |
| 76 | Peruanita | 165 | 119.3 | abcdef | 142.2 | 140.3 | 45.7 | 0.2 | 0.5 |
| 52 | Huanuqueña | 255 | 118.3 | abcdef | 186.7 | 173.7 | 136.7 | 0.3 | 1.0 |
| 13 | Chiaquil rojo | 383 | 117.7 | abcdef | 250.3 | 212.3 | 265.3 | 0.5 | 1.3 |
| 34 | Camotillo | 322 | 115.7 | abcdef | 218.8 | 193.0 | 206.3 | 0.4 | 1.2 |
| 44 | Cauriña | 290 | 115.3 | abcdef | 202.7 | 182.9 | 174.7 | 0.4 | 1.2 |
| 9 | Cuchipa ismaynan | 430 | 113.0 | abcdef | 271.5 | 220.4 | 317.0 | 0.5 | 1.4 |
| 42 | Jilguero | 295 | 109.0 | abcdef | 202.0 | 179.3 | 186.0 | 0.4 | 1.2 |
| 18 | Piña morada | 366 | 104.0 | abcdef | 235.0 | 195.1 | 262.0 | 0.4 | 1.4 |
| 57 | Gargash suytu | 240 | 88.3 | abcdef | 164.2 | 145.6 | 151.7 | 0.2 | 1.2 |
| 74 | Shashai warmi | 180 | 83.0 | abcdef | 131.5 | 122.2 | 97.0 | 0.2 | 1.0 |
| 69 | Yana cauriña | 200 | 82.3 | abcdef | 141.2 | 128.3 | 117.7 | 0.2 | 1.1 |
| 79 | Añaspi yawarmi | 134 | 79.3 | abcdef | 106.7 | 103.1 | 54.7 | 0.1 | 0.8 |
| 46 | Llama chupan | 282 | 75.7 | abcdef | 178.8 | 146.1 | 206.3 | 0.2 | 1.4 |
| 51 | Piña blanca | 259 | 72.3 | abcdef | 165.7 | 136.9 | 186.7 | 0.2 | 1.4 |
| 77 | Sunic | 160 | 72.0 | abcdef | 116.0 | 107.3 | 88.0 | 0.1 | 1.1 |
| 53 | Galleta | 253 | 64.7 | abcdef | 158.8 | 127.9 | 188.3 | 0.2 | 1.4 |
| 4 | Shiri | 495 | 63.0 | abcdef | 279.0 | 176.6 | 432.0 | 0.3 | 1.7 |
| 14 | Chiaquil negro | 375 | 55.7 | bcdef | 215.3 | 144.5 | 319.3 | 0.2 | 1.7 |
| 32 | Orgon runtush | 328 | 52.0 | bcdef | 190.0 | 130.6 | 276.0 | 0.2 | 1.6 |
| 61 | Merino | 233 | 39.7 | cdef | 136.3 | 96.1 | 193.3 | 0.1 | 1.6 |
| 56 | Puka ranra ñahui | 244 | 38.0 | def | 141. | 96.3 | 206.0 | 0.1 | 1.6 |
| 29 | Huanuco suytu | 332 | 26.0 | ef | 179.0 | 92.9 | 306.0 | 0.1 | 1.8 |
| 75 | Cera monilla | 176 | 19.7 | f | 97.8 | 58.8 | 156.3 | 0.0 | 1.7 |
| Landraces | S_SSI | S_TOL | S_MP | S_GMP | S_STI | YSSI |
|---|---|---|---|---|---|---|
| Huayro negro | 10 | 10 | 7 | 7 | 6 | 8.5 |
| Sumaq sunqu rojo | 6 | 5 | 10 | 10 | 10 | 8 |
| Yana galla shaco | 8 | 8 | 8 | 8 | 7 | 8 |
| Viuda | 9 | 9 | 6 | 7 | 6 | 7.5 |
| Gara callhuan | 6 | 5 | 9 | 9 | 8 | 7.5 |
| Huayro plomo | 9 | 9 | 6 | 7 | 6 | 7.5 |
| Shogo chata | 7 | 7 | 7 | 8 | 6 | 7 |
| Uncuy | 8 | 8 | 6 | 7 | 6 | 7 |
| Muru dólar | 7 | 7 | 7 | 7 | 6 | 7 |
| Cantiña | 4 | 3 | 9 | 9 | 8 | 6.5 |
| Azulino | 7 | 8 | 6 | 7 | 5 | 6.5 |
| Muru ranra ñahui | 7 | 8 | 6 | 7 | 5 | 6.5 |
| Niña papa | 7 | 8 | 6 | 7 | 5 | 6.5 |
| Muru puñete | 10 | 10 | 3 | 4 | 2 | 6.5 |
| Cacho de toro | 9 | 10 | 4 | 5 | 3 | 6.5 |
| Puka cauriña | 7 | 8 | 6 | 7 | 5 | 6.5 |
| Galleta blanca | 9 | 9 | 4 | 5 | 4 | 6.5 |
| Cahuashina moro | 9 | 10 | 4 | 4 | 3 | 6.5 |
| Yana shenga | 7 | 8 | 6 | 6 | 5 | 6.5 |
| Azul callhuan | 5 | 5 | 8 | 8 | 7 | 6.5 |
| Tarma | 7 | 8 | 5 | 5 | 4 | 6 |
| Morales rojo | 6 | 7 | 6 | 6 | 5 | 6 |
| Huasho | 4 | 4 | 8 | 8 | 6 | 5 |
| Jilguero rojo | 10 | 10 | 2 | 3 | 2 | 6 |
| Matucana | 8 | 9 | 4 | 5 | 3 | 6 |
| Muru piña | 5 | 5 | 7 | 7 | 6 | 6 |
| Rayhuana | 5 | 5 | 7 | 8 | 6 | 6 |
| Muru pillush | 7 | 8 | 5 | 6 | 4 | 6 |
| Leona | 3 | 2 | 8 | 7 | 5 | 5.5 |
| Cahuashina | 7 | 9 | 4 | 4 | 3 | 5.5 |
| Yuca suytu | 5 | 6 | 6 | 6 | 4 | 5.5 |
| Higos | 6 | 7 | 5 | 6 | 4 | 5.5 |
| Acacluy pecho | 4 | 5 | 7 | 7 | 5 | 5.5 |
| Yuraj morales | 5 | 6 | 6 | 6 | 5 | 5.5 |
| Yawar taico | 8 | 9 | 3 | 4 | 2 | 5.5 |
| Runtush | 6 | 8 | 5 | 6 | 4 | 5.5 |
| Puka pampiña | 8 | 10 | 3 | 4 | 2 | 5.5 |
| Puka canasta | 5 | 6 | 6 | 7 | 5 | 5.5 |
| Alcarraz | 6 | 8 | 4 | 5 | 3 | 5 |
| Muru tarma | 8 | 10 | 2 | 3 | 2 | 5 |
| Peruanita | 8 | 10 | 2 | 3 | 2 | 5 |
| Yana semita | 7 | 9 | 3 | 4 | 2 | 5 |
| Milagro rojo | 7 | 9 | 3 | 4 | 2 | 5 |
| Niño suytu | 4 | 5 | 6 | 6 | 4 | 5 |
| Piña negra | 6 | 8 | 4 | 5 | 3 | 5 |
| Huayti chuco | 6 | 8 | 4 | 5 | 3 | 5 |
| Huayro rojo | 7 | 9 | 3 | 4 | 2 | 5 |
| Huayro blanco | 8 | 9 | 2 | 3 | 2 | 5 |
| Yuraj pillish | 7 | 9 | 3 | 4 | 2 | 5 |
| Chiaquil rojo | 3 | 4 | 6 | 5 | 3 | 4.5 |
| Santo domingo | 5 | 8 | 4 | 4 | 3 | 4.5 |
| Chaucha | 4 | 6 | 5 | 5 | 4 | 4.5 |
| Camotillo | 4 | 6 | 5 | 5 | 3 | 4.5 |
| Clavel suytu | 6 | 9 | 3 | 4 | 2 | 4.5 |
| Puka dólar | 6 | 8 | 3 | 4 | 2 | 4.5 |
| Cuchipa ismaynan | 3 | 3 | 6 | 5 | 4 | 4.5 |
| Yana pillush | 4 | 5 | 5 | 5 | 3 | 4.5 |
| Huanuqueña | 5 | 7 | 3 | 4 | 2 | 4 |
| Yana huaca | 4 | 7 | 4 | 4 | 3 | 4 |
| Chaulina | 4 | 7 | 4 | 5 | 3 | 4 |
| Añaspi yawarmi | 7 | 9 | 1 | 2 | 1 | 4 |
| Piña morada | 3 | 5 | 5 | 5 | 3 | 4 |
| Huayro moro rojo | 5 | 8 | 3 | 4 | 2 | 4 |
| Cauriña | 4 | 7 | 4 | 4 | 3 | 4 |
| Jilguero | 4 | 6 | 4 | 4 | 3 | 4 |
| Shiri | 1 | 1 | 6 | 4 | 2 | 3.5 |
| Shashai warmi | 5 | 8 | 2 | 2 | 1 | 3.5 |
| Gargash suytu | 4 | 7 | 3 | 3 | 2 | 3.5 |
| Piña blanca | 3 | 6 | 3 | 3 | 2 | 3 |
| Yana cauriña | 4 | 8 | 2 | 3 | 1 | 3 |
| Galleta | 3 | 6 | 3 | 3 | 1 | 3 |
| Sunic | 5 | 9 | 1 | 2 | 1 | 3 |
| Lama chupan | 3 | 6 | 3 | 3 | 2 | 3 |
| Chiaquil negro | 1 | 3 | 4 | 3 | 2 | 2.5 |
| Orgon runtush | 1 | 4 | 4 | 3 | 1 | 2.5 |
| Merino | 2 | 6 | 2 | 2 | 1 | 2 |
| Huanuco suytu | 1 | 3 | 3 | 2 | 1 | 2 |
| Puka ranra ñahui | 1 | 6 | 2 | 2 | 1 | 1.5 |
| Cera monilla | 1 | 7 | 1 | 1 | 1 | 1 |
Disclaimer/Publisher’s Note: The statements, opinions and data contained in all publications are solely those of the individual author(s) and contributor(s) and not of MDPI and/or the editor(s). MDPI and/or the editor(s) disclaim responsibility for any injury to people or property resulting from any ideas, methods, instructions or products referred to in the content. |
© 2023 by the authors. Licensee MDPI, Basel, Switzerland. This article is an open access article distributed under the terms and conditions of the Creative Commons Attribution (CC BY) license (https://creativecommons.org/licenses/by/4.0/).
Share and Cite
Zevallos, E.; Marmolejo, K.; Alvarez, F.; Paitan, R.; Viza, I.; Becerra, D.; Rixi, G.; Silva-Diaz, C.; Inga, J. Screening Potato Landraces to Cope with Climate Change in the Central Andes of Peru. Int. J. Plant Biol. 2023, 14, 1167-1179. https://doi.org/10.3390/ijpb14040085
Zevallos E, Marmolejo K, Alvarez F, Paitan R, Viza I, Becerra D, Rixi G, Silva-Diaz C, Inga J. Screening Potato Landraces to Cope with Climate Change in the Central Andes of Peru. International Journal of Plant Biology. 2023; 14(4):1167-1179. https://doi.org/10.3390/ijpb14040085
Chicago/Turabian StyleZevallos, Edith, Karina Marmolejo, Fernando Alvarez, Rocio Paitan, Ines Viza, Dante Becerra, Gina Rixi, Cecilia Silva-Diaz, and Josue Inga. 2023. "Screening Potato Landraces to Cope with Climate Change in the Central Andes of Peru" International Journal of Plant Biology 14, no. 4: 1167-1179. https://doi.org/10.3390/ijpb14040085