Estimating the Charging Profile of Individual Charge Sessions of Electric Vehicles in The Netherlands


Department Urban Technology, University of Applied Sciences Amsterdam, Weesperzijde 190, 1097 DZ Amsterdam, The Netherlands
*
Author to whom correspondence should be addressed.
World Electr. Veh. J. 2018, 9(2), 17; https://doi.org/10.3390/wevj9020017
Submission received: 18 May 2018
/
Revised: 8 June 2018
/
Accepted: 13 June 2018
/
Published: 22 June 2018
(This article belongs to the Special Issue Selected Papers from The 30th International Electric Vehicles Symposium and Exhibition (Stuttgart, Germany))
Abstract
:The mass adoption of Electric Vehicles (EVs) might raise pressure on the power system, especially during peak hours. Therefore, there is a need for delayed charging. However, to optimize the charging system, the progression of charging from an empty battery to a full battery of the EVs, based on real-world data, needs to be analyzed. Currently, many researchers view this charging profile as a static load and ignore the actual charging behavior during the charging session. However, this study investigates how different factors influence the charging profile of individual EVs based on real-world data of charging sessions in The Netherlands, and thereby enable optimization analysis of EV smart charging schemes.

1. Introduction
Although the mass adoption of Electric Vehicles (EVs) is often seen as beneficial in reducing greenhouse gas emissions, it will put an additional load on the electric power system, with potential adverse effects on its operation. Currently, the charging activity of EV users is highest during evening peak periods, around 18:00, when EV users arrive at home [1]. The charging infrastructure, indeed, has the potential to significantly impact the local electrical grids [1]. However, it is possible to shave demand peaks in the afternoon, with smartcharging management. Currently, there is a lack of such management, hence, many researchers emphasize a need for delayed charging in the near future [1,2,3,4]; this can result in “many benefits, such as cheaper electricity rates for consumers, peak demand load shaving, and night time demand valley filling“ ([1] p. 268).
However, to actually improve time management of charging, which has been researched in [5,6], the variables influencing the charging time need to be determined and the effects of these variables need to be analyzed. This enables understanding of the actual charging profile of the EVs. The charging profile entails the progress of the charging of a battery over time. This leads to the question: What effects do external variables have on charging from an empty battery to a full battery? Can charging be considered as a non-linear process? “In many designs and studies related to EV battery chargers, the EV battery loads are considered as a static load, and the realistic system behavior of the batteries during the charging process has been ignored“ ([2] p 483).
Research that is done on these charging profiles have not yet been validated with real world data, as they have only been obtained with data from laboratory experiments [2,4], or with the use of transportation data combined with predictive or stochastic approaches [3]. More importantly, Jain and Jain [3] emphasize that the “accurate modeling of the charging profile of EVs is fundamental for analyzing the impacts of increased EV load and their charging mechanism on the distribution system, namely overloading of transformers and cables, circuit losses, and power quality“ and the effect on market price in the electricity market ([3] p. 74).
This research aims to fill this research gap by analyzing the charging profiles of Electric Vehicles (EVs) through studying public AC charging points with real world data. The relevant literature is presented, after which a theoretical model is presented, entailing both variables based on the literature and exploratory variables influencing the charging profile. These variables are analyzed through a regression analysis on data of charging sessions of EVs. Subsequently, the results are presented and conclusions on the predictive value of these variables are made.
2. State of the Art
2.1. Battery Characteristics
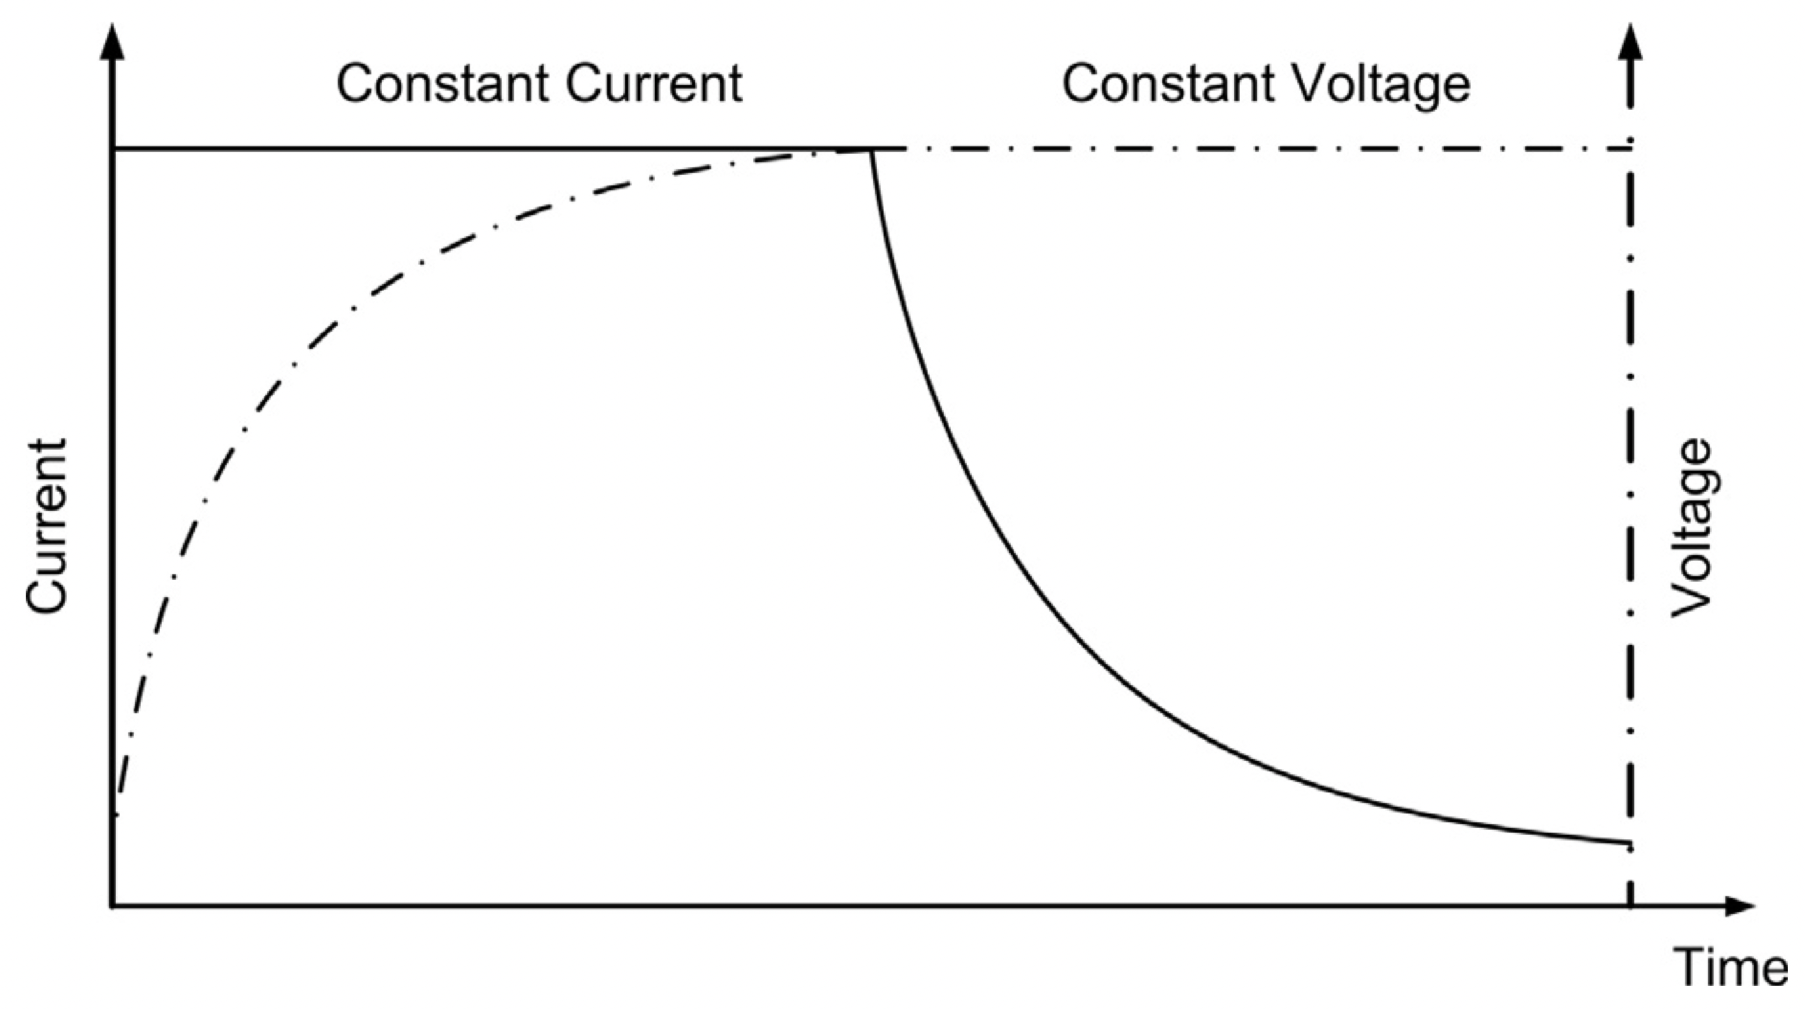
The speed of energy transfer during charging is dependent on two factors: the Voltage (V) and the current, expressed in Ampere (A). Power transfer is based on the Voltage multiplied by the current; with the same Voltage, a lower current will decrease the energy transfer rate and thus results in a lower charging speed of batteries. The charging of a Li-ion battery consists of three sequential phases. When charging is initiated, the first phase occurs, and during this ’pre-charge’ phase, the current is kept low, while the Voltage steadily increases. However, most of battery charging of EVs take place in the second and third phase, which is illustrated in Figure 1 [7]. The second phase is initiated when the EV has at least 10% a State-of-Charge (SOC) of 10%. For an EV with a starting SOC of more than 10%, there is not a significant pre-charge’ phase. During this second phase, also named the constant current (CC) phase, the current is kept constant at a high level, until the Voltage of the lithium cell has reached a specified Voltage level. At this point, the third phase starts. In this phase, the Voltage is kept constant, while the current is exponentially decaying: the battery is charged with a trickle current and therefore the charging of the battery is slower [2].
2.2. Environmental Effects
2.2.1. Peak
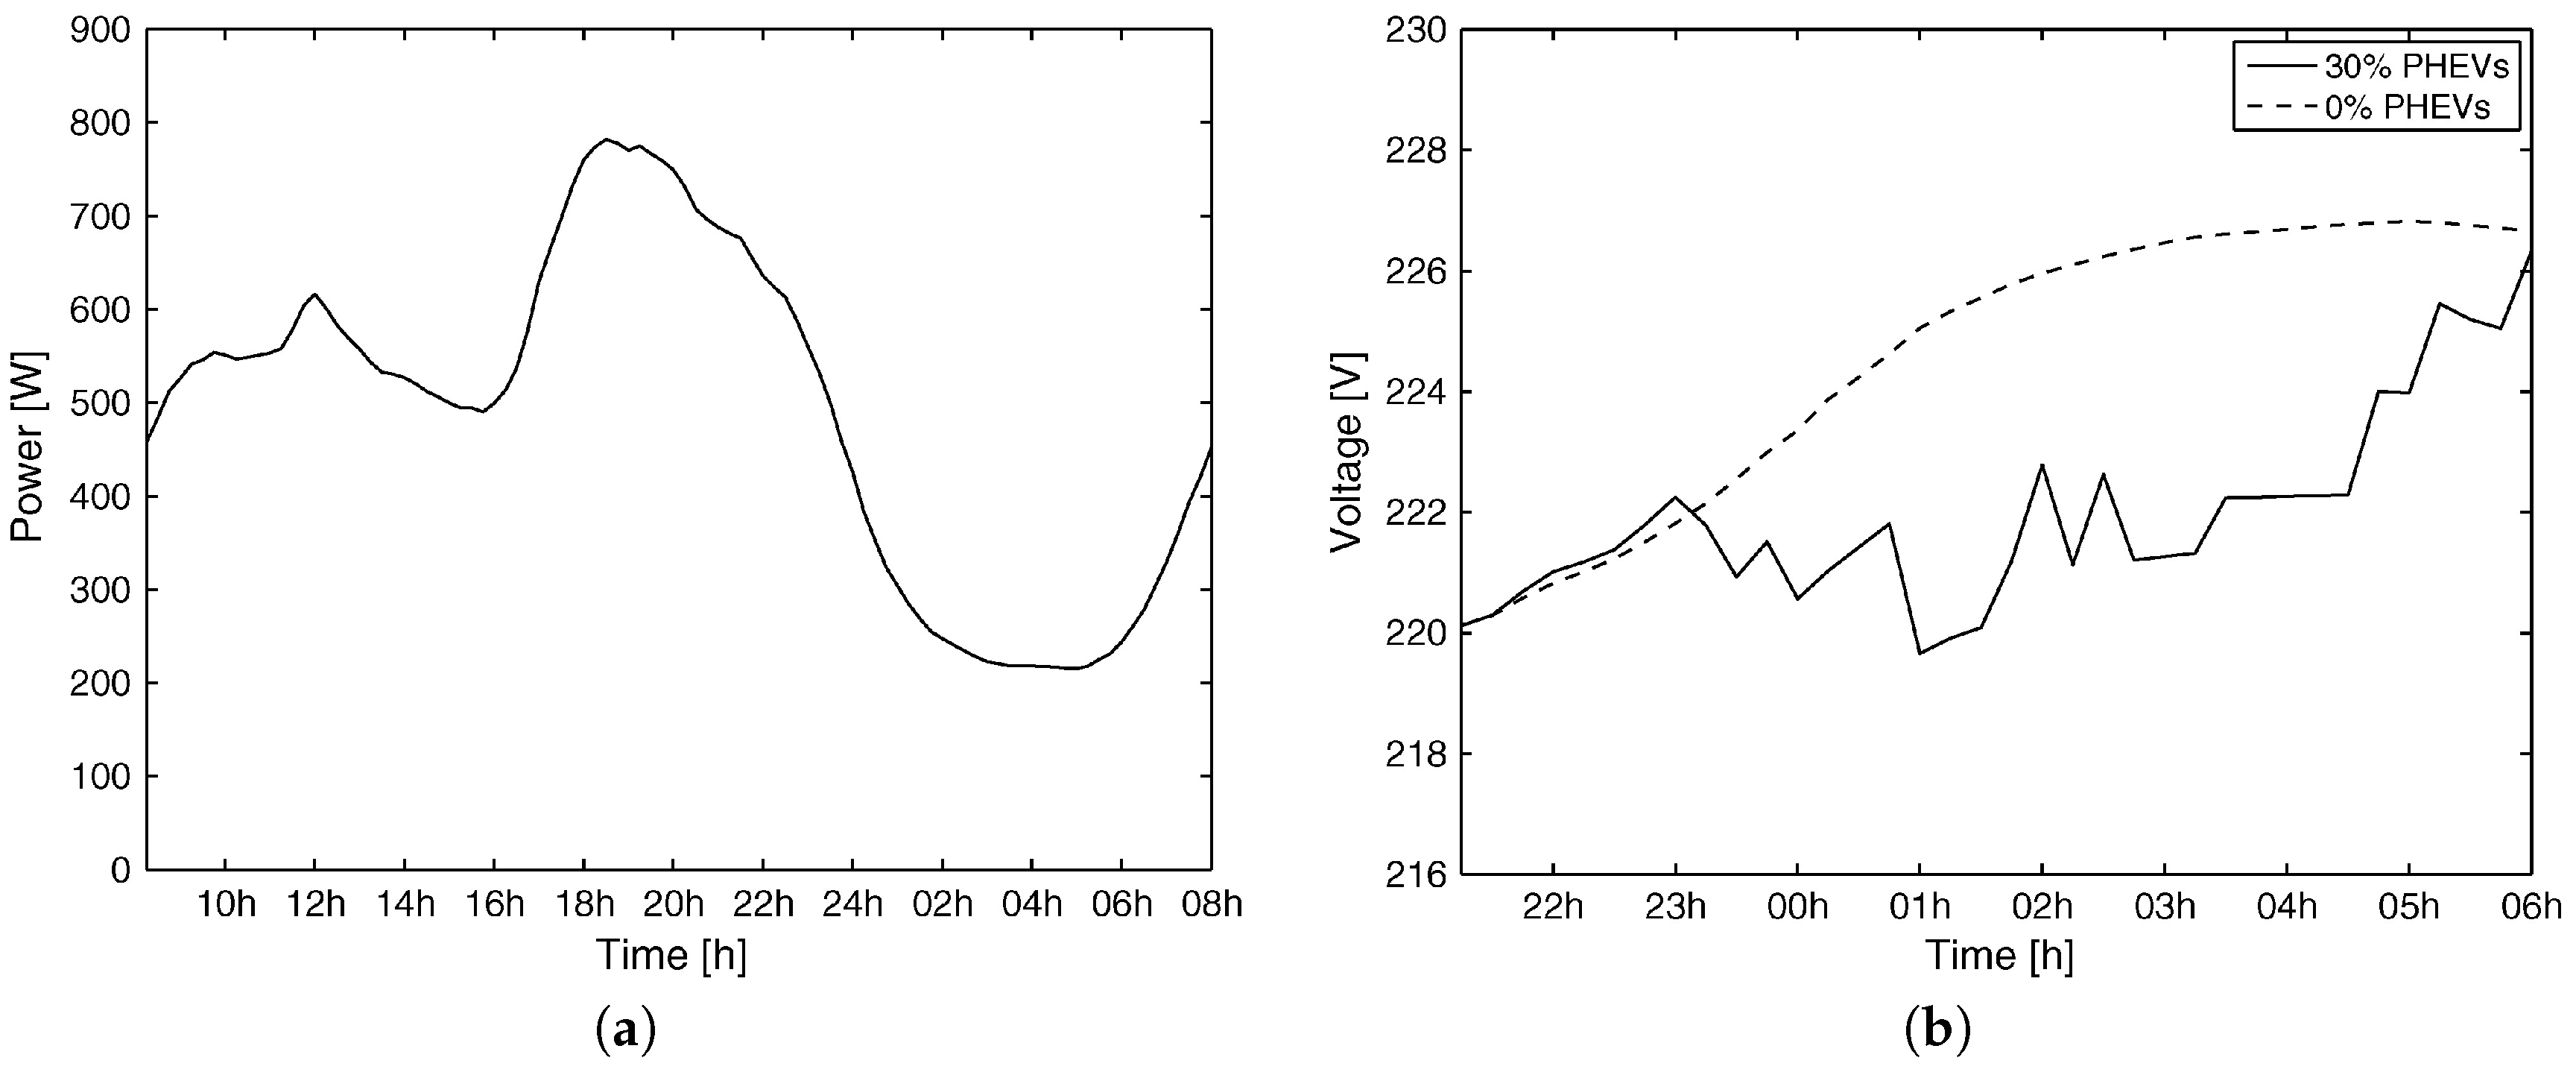
Many researchers have used data on the charging infrastructure to investigate the charging behavior of EV users. They have investigated the peak demand, and tried to predict the pressure on the energy aggregators used for local distribution of power [1,3,8]. The large demand of electrical power for charging EVs can lead to undesired peaks, potentially overloading transformers and cables, leading to circuit losses and reduced power quality, such as a decrease in Voltage level [3]. These extra large peaks in electrical consumption coincide with peaks in household consumption [9], since people tend to charge their EVs immediately when they get home [1]. In Figure 2a, the typical Belgian household consumption power profile is illustrated [9].
For this research the peak times as defined in [9,10] are considered. Both studied peak consumption, and examined power losses and Voltage deviation for different Plug-in EV (PEV) penetration levels. This penetration level implies the percentage of households charging a PEV; in a residential power network of 20 houses and 4 PEVs the penetration level is 20%. They consider PEV penetration levels between 0 and 30%, see Figure 2b, since 20% penetration “s representative of early low PEV adoption case in the near future as PEV prices remain too high for most families to afford PEVs initially“ ([10] p. 4). As shown in Table 1, during peak time (18:00–21:00), power losses can reach 5% in summer during peak time, and 6% in winter, which theoretically leads to a decrease in charging speed with the same factor.
In addition to the power losses, the Voltage level deviates-with a maximum of 10.3%, in winter and 8.7% in summer - from the situation in which no EVs are charging, as shown in Figure 2b and Table 1, which are retrieved from [9]. These Voltage deviations “cause reliability problems which must be avoided to assure good operation of electric appliances“( [9] p. 371) and could potentially lead to a lower charging speed.
2.2.2. Day/Evening
Another implication of the findings of Clement-Nyns et al. is the difference between charging during the night and during the day or the evening [9]. On the one hand, the rate of power losses with EVs charging is higher during the day and evening (10:00–21:00) than during the night (21:00–06:00), which can result in higher charging speeds during the night. This is because charging during the day and the evening is more demanding for the distribution grid, since the households’ electricity demand-as was shown in Figure 2a is also higher. On the other hand, during the night the low Voltage level is expected to have a negative relationship with the charging speed. Because the household electricity demand is low and many EVs are charging, there is a higher ratio of electricity demand for EV charging to household demand. This relative surplus of EVs during the night which potentially decreases the Voltage level, as shown in Figure 2a. “Between 23:00 and 4:00, most of the vehicles are charging and the Voltage drop during these hours is the largest and deviates the most from the 0% [PEV penetration] Voltage profile“ ([9] p. 373). In contrast, as mentioned in [7], the network Voltage drops are within acceptable levels since the Voltage deviations stay below 1%.
2.2.3. Temperature
Additionally, the temperature of the battery influences the charging profile because the battery cannot be charged most efficiently at very low or very high outside temperatures. Charging of most batteries is limited to 5–45 degrees Celsius for fast charging. The battery first has to get heated, by charging with a trickle current [11]. Subsequently, EVs are able to absorb power to charge the battery, unless extensive heating of the battery forces the charging to pause; the battery can cool down to manage possible overheating of the battery [11]. Moreover, battery cells are suggested to operate most effectively between 20–25 degrees of Celsius. When the battery temperature diverges from this ideal, the Battery Management System (BMS) of the EV reduces the requested current to make sure the health of the battery cells is protected.
Some EVs have active liquid thermal management systems, such that the BMS can control the cell temperature, reducing the effects of the outside temperature, and from charging and driving.
2.3. Battery Degradation
A study by [12] researched lithium-ion batteries by analyzing the capacity loss over time and over charging cycles. They concluded that time influences the capacity of the battery, so that the capacity loss “progresses linearly with the square root of the time“ ([12] p. 2). This decrease in battery capacity was due to several variables: for higher temperatures this decay was larger as can be seen in Figure 3a. What is more, when the State-of-Charge was lower, the decay was lower as well—as shown in Figure 3b. This illustration shows that after about 200 charge cycles with discharging rate 1 C and charging rate of 1/2 C, the battery loss is around 3.5%—at 15 degrees and 50% of the total capacity charged.
3. Theoretical Model
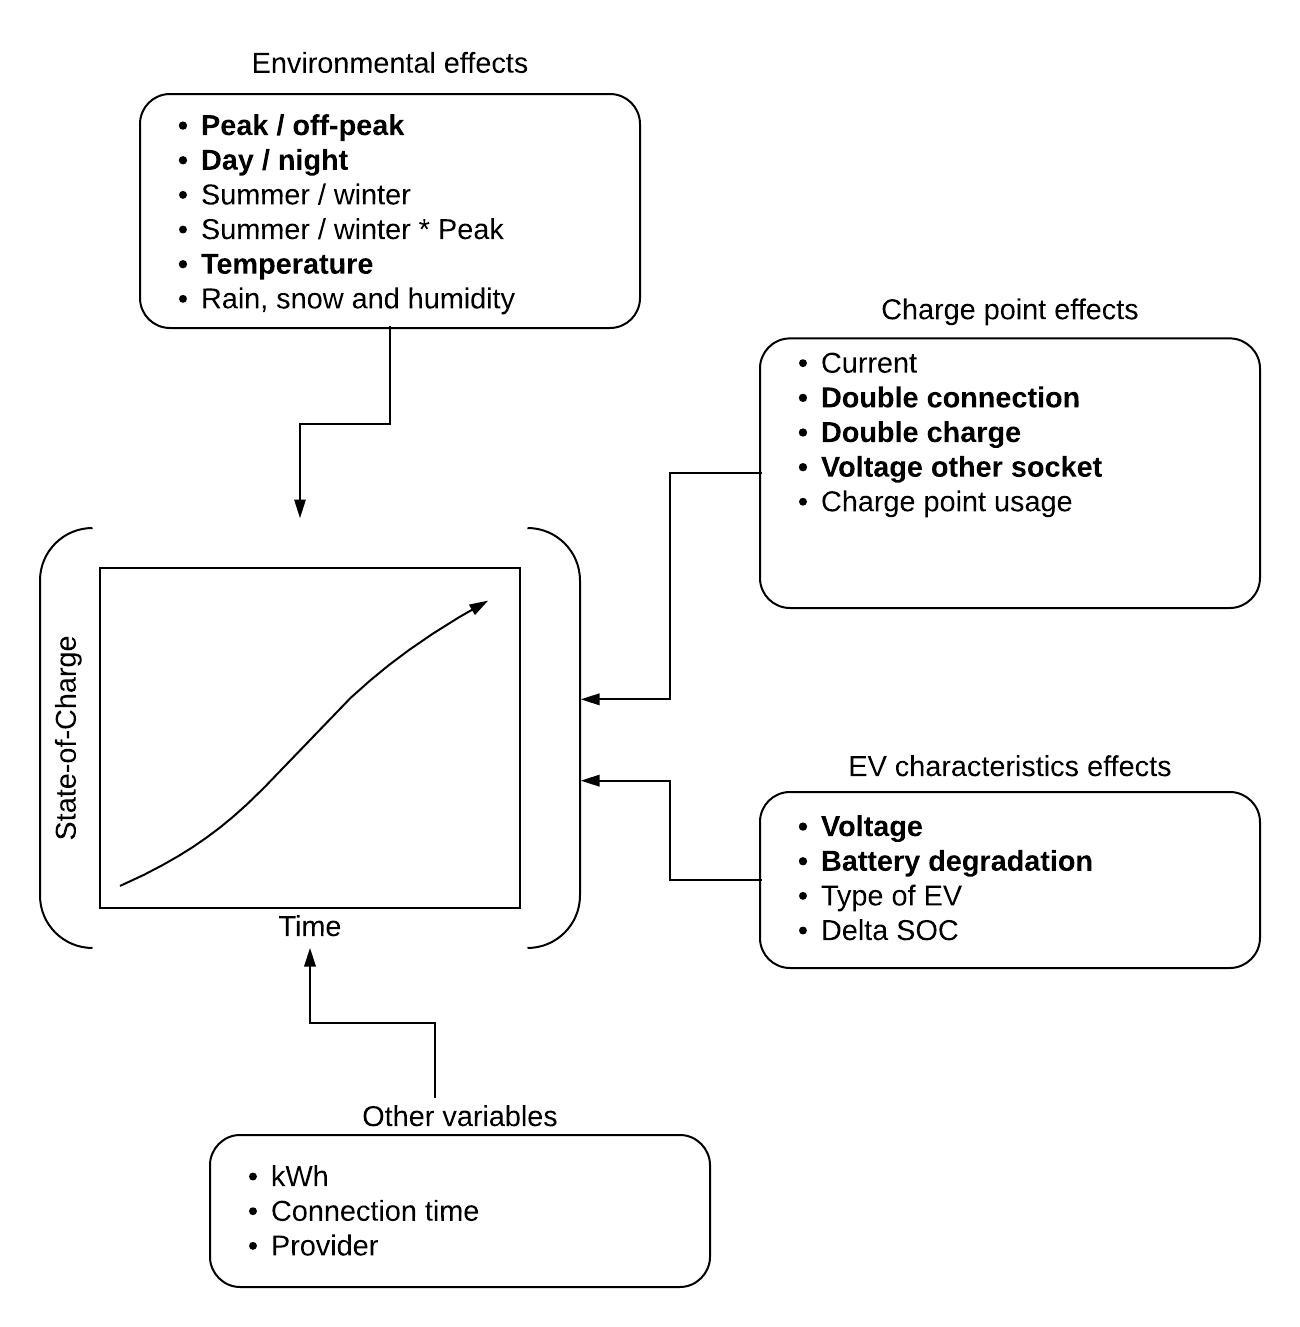
Charging profiles are dependent on a large number of variables, that can be categorized as (i) environmental, (ii) charge point, (iii) EV characteristics and (iv) external factors. Due to the scope of this paper a limited amount of variables is presented. This is done based on selecting the variables with large effects (charge point effects and battery degradation), and selecting variables most relevant for smart charging with significant effects (peak, temperature and day).
3.1. Environmental Effects
As mentioned in Section 2.2.1, power losses and Voltage deviations can lead to lower charging speeds during peak time and therefore, the binary variable peak is considered in this research. Although it is uncertain if this holds for the power grid in The Netherlands as well since the research was done in Belgium, peak is expected to be negatively related to charging speed. Due to the lower power losses and higher Voltage deviations, which are mentioned in Section 2.2.2, the effect of the binary variable day is uncertain. The effect of the variable temperature on the charging speed is explored and is expected to have a positive relationship with charging speed because temperatures lower than 20 degrees are suggested to negatively impact the charging speed.
3.2. Charge Point
In the electrical power distribution system, it is expected that if more EVs are charging at the same time, the Voltage in the system decreases and power loss increases. Since most charge points have two sockets and thereby possibly facilitating two EVs at the same time, this research will explore potential power loss on the micro-scale of the charge point itself, so if on both the sockets of a charging point EVs are charging, does this affect the charging profile? Furthermore, this research will consider the effect on the maximum charging speed if the EV at the other socket is not charging but only connected. Consequently, the effects of the binary variables double charge-with the possibility of the other EV taking up power-and double connection on the charging speed are analyzed (Table 2).
The effects of double charging and double connection are evaluated with the Voltage of the EV at the other socket as well. Both the level of penetration in an electrical power system and the charging method—e.g., 400V-affect the maximum charging speed [9]. This can result in a difference in effect between a three-phase EV (400 V), using the other socket, and a single-phase EV (230 V).
3.3. EV Characteristics
3.3.1. Voltage
Besides the current, the Voltage also defines the charging speed. There are two popular methods of alternating current (AC) charging: single-phase charging (230 V) and three-phase charging (400 V). Three-phase charging facilitates charging speeds are three times as fast as with single-phase charging; it only uses times the Voltage of single-phase charging to enable this charge speed difference. Because of this difference in speed of charging, this research takes the binary variable voltage-either single-phase (0) or three-phase (1)-into account and has examined the difference of the two methods of energy transfer.
3.3.2. Battery Degradation
As [12] showed that batteries lose capacity over time and over charging cycles, this likely impacts the charging profile of the EVs. If due to this capacity loss the last phase of charging-the Constant Voltage phase-is affected, the charging speed of the battery might be altered. This last phase of charging is the CV phase, in which the amount of Ampere is lowered and thus also the speed of charge is lowered. Due to the capacity loss, an effect on overall charging speed can occur, hence the continuous battery degradation variable is examined.
3.4. Conclusive Model
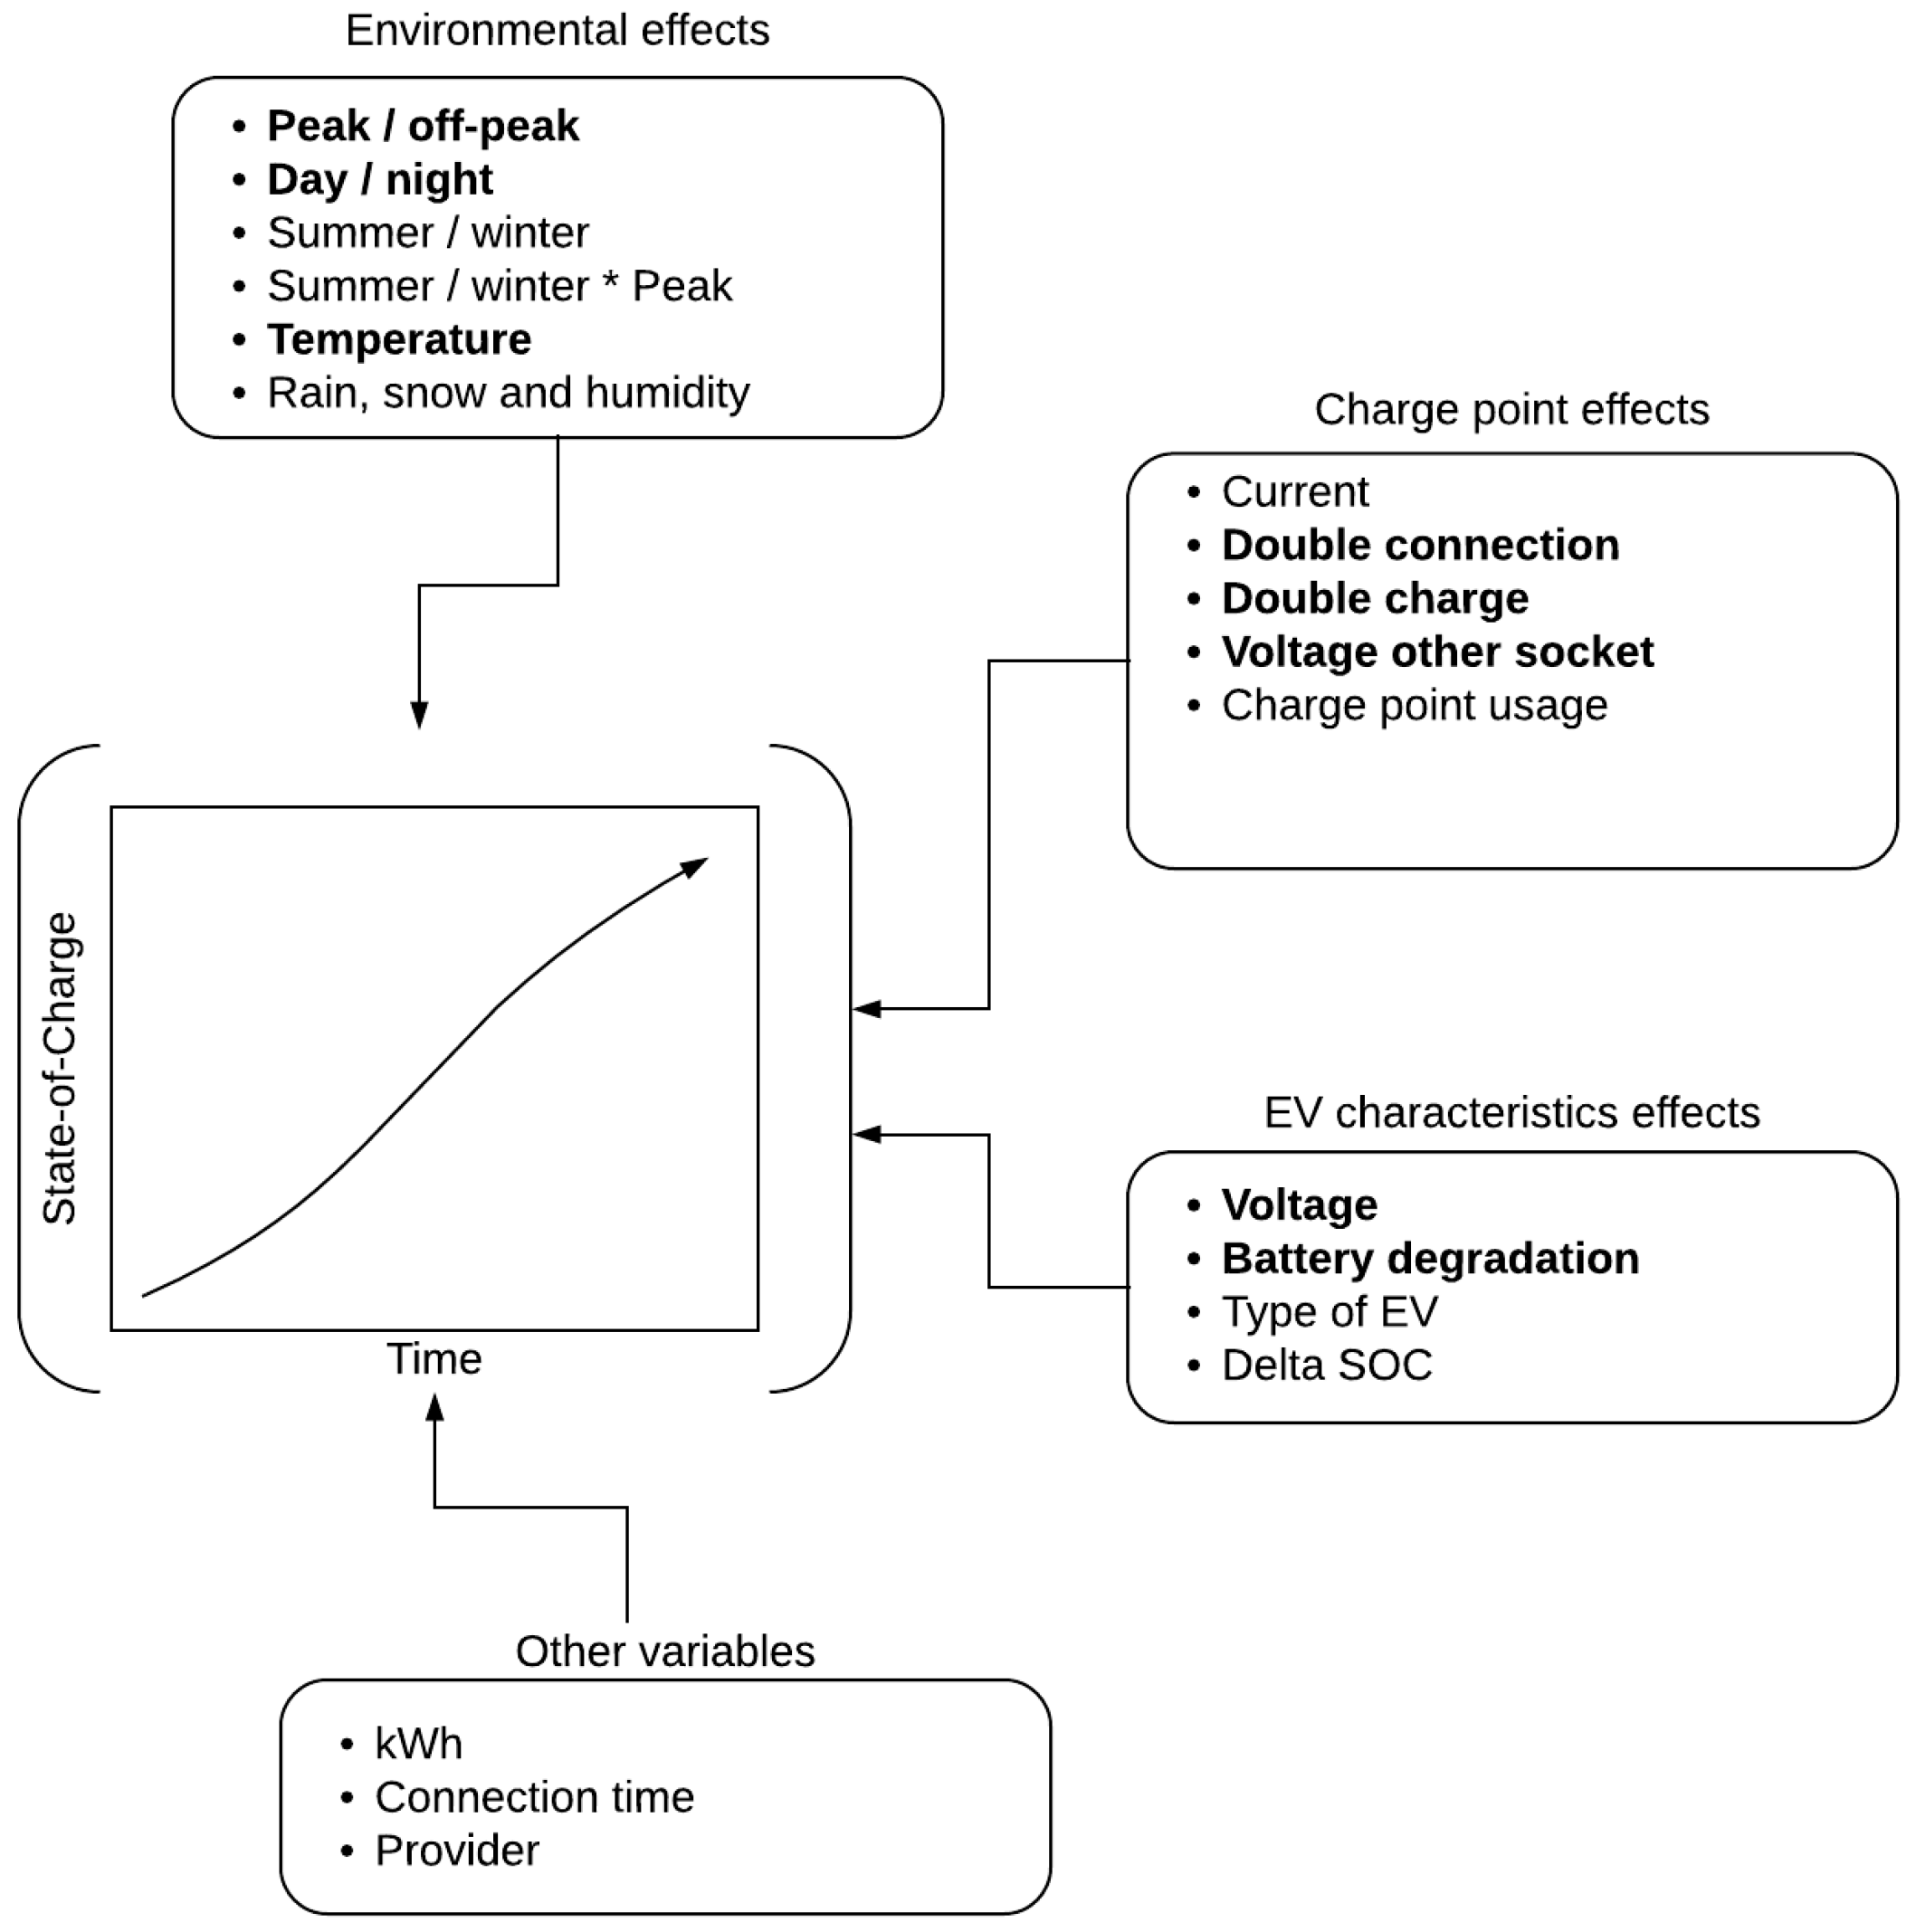
The variables listed in Section 3.1, Section 3.2 and Section 3.3 might have an effect on the charging profile, and the complete model is illustrated in Figure 4. The variables are presented in the following categories: environmental effects (time, temperature), charge point effects (connection/charging at sockets), EV/battery characteristics, and other variables. This is a multiple linear regression model, that intends to predict the charging profile. This profile is described as the average charging speed until full SOC. Each individual charging session is considered and the variables with changing values over time are averaged until the EV has reached full SOC. The results of this model are presented in the next chapter.
4. Methods
The previous section provided the theoretical model; this section will elaborate on how the model is evaluated. First, the dataset with its parameters is described. From these parameters the variables from the model are calculated. Conclusively, this chapter describes how these variables are transformed in a regression model.
4.1. Dataset
The dataset used in this research is provided by the Municipality of Amsterdam and the energy providers (EVNET and NUON) responsible for the delivery of the energy. This dataset consists of two parts:
The first part gives the charging sessions, providing information such as “the address, [provider], time details (date, start and connection time), amount of electricity and charging card/RFID used by the EV-user“ ([13] p. 2). The charging session lasts from the first connection moment until the EV leaves the charge point, thus including both the charging phase and the phase in which it is connected but not charging.
The second part of the dataset gives information on the specific meter values of the charging points every 15 minutes corresponding a Timestamp for every unique charging session coded with a Transaction ID, a Chargepoint ID and a Socket ID. Combining the two parts result in the total dataset with the parameters as shown in Table 3. The meter values represent the amount of kWh or Wh the charging point has charged in total. Therefore, during a charging session in which an EV has charged an x amount, the meter value of the charge point will also increase with x.
Several errors in the dataset were recognized and filtered, and some changes were made in order to get the same representation of data for both providers. These errors include records without a value for Transaction ID, Socket ID, RFID; charge sessions with more than 100 kWh charged, and charge points, which did not add up the meter values over time, were filtered. Furthermore, the charge points with more than two sockets were filtered, in order to get a good measure for the variables double connection and double charge.
Furthermore, some changes were made in order to get the same representation of data for both providers: the NUON data gave meter values in integer kWh, while EVNET gave more precise Wh meter values, which needed to be aligned. Moreover, the charge points with more than two sockets were filtered, in order to get a good measure for the variables of double connection and double charge. After filtering above errors, the database consisted of 4.8 million records of meter values, 128,000 records of charging sessions and 4700 unique RFIDs.
4.2. Regression
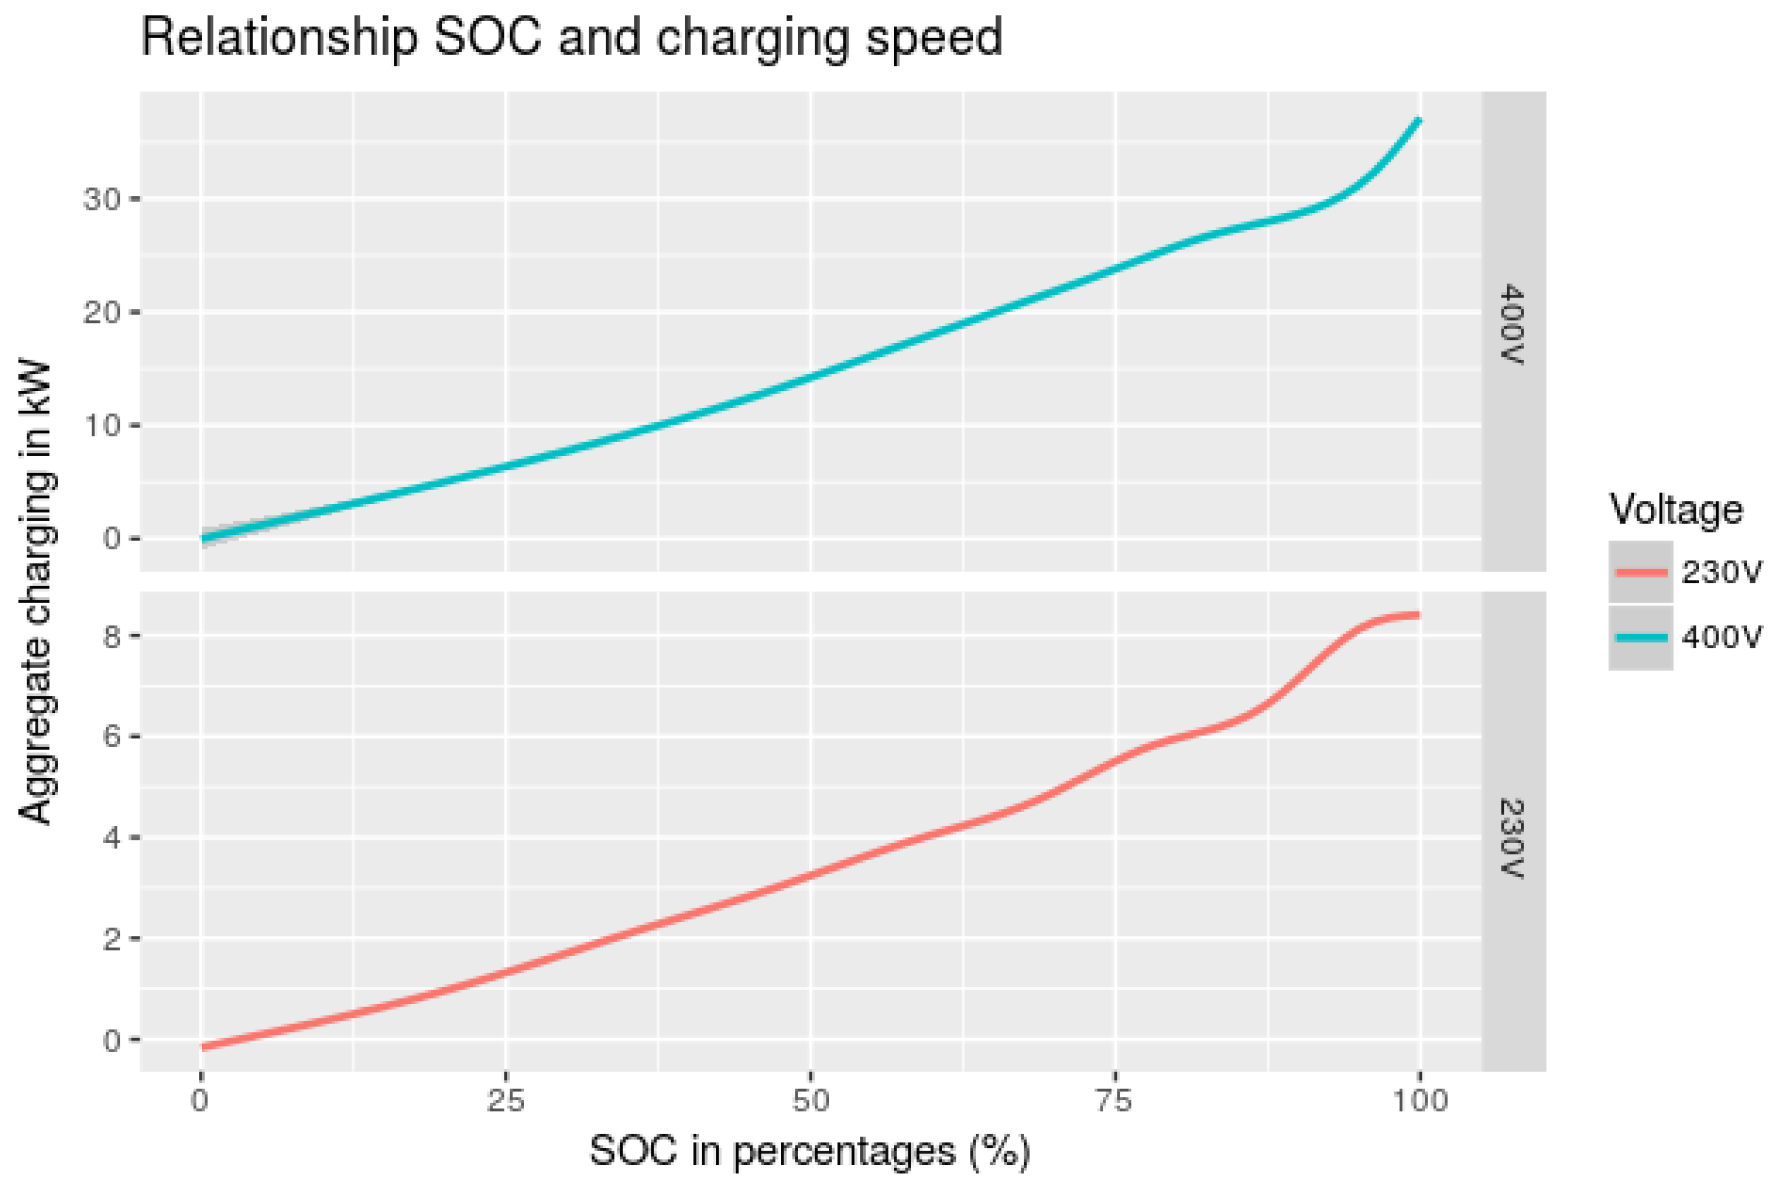
This research explains the charging profile with the help of a linear regression. The linear regression is used to observe the influence of the variables on the charging speed. This linear regression will enable researching multiple variables, which can lead to indications of actual (non-linear) results. The linear charging profile is obtained by averaging the charging speed until full SOC. The variables from the theoretical model are analyzed with regard to this average charging speed. Figure 5 suggests that the aggregate charging can be regarded mostly as a linear profile. Because a charging session can last from 14.00 to 17.00—and charges from 14.00 to 16.00—the hourly temperatures of 14.00 and 15.00 are taken into account and averaged over the charge session until full SOC.
4.3. Dependent Variable: ΔCharging Speed
To obtain the linear charging profile, described as the average charging speed until full SOC, the total amount charged is divided by the time it takes to charge to full SOC. This average charging speed is called the delta of the charging session. Batteries can remain a long time in the 99% State-of-Charge before reaching 100%, by charging with low current–for the purpose of preventing overcharging. Therefore, in this research full SOC is reached when the EV is not charging more than 100 W in the next hour, which entails that even with 99% SOC, the battery is considered as fully charged. In Table 4 an example is presented. However, it is important to note here that some figures illustrate the average charging speed, which is the average over a charging session, while other figures mention charging speed, which entails the actual charging speed at a certain moment.
4.4. Independent Variables
The variables day and peak were measured by looking at the time of charging. The timespan used for the variable day is 8.00–23.00 and for peak is 17:00–21:00. The variable temperature is measured by looking at both the historical hourly and daily temperatures distributed by the Dutch public weather institutute–Koninklijk Nederlands Meteorologisch Instituut (KNMI)—of the weather station in Schiphol over 2015 and 2016. Additionally, for this variable, the mean is calculated for the charging session when the EV has not reached full SOC. For these binary variables, this implies that if for example during the charging session 2 out of 3 h are considered during daytime, the value of the variable day will be 0.67. Battery degradation is measured by ranking all the sessions over RFIDs and examining the average charging speed of the charging sessions over the amount of charging cycles.
To measure Voltage, the individual EVs were categorized based on the RFID. The RFIDs can be categorized in two groups, depending on their maximum charging speed: single-phase or three-phase. Only 400 V EV chargers can have charging speeds over 7.4 kW, and therefore maximum charging speeds over 7.6 kW (to correct for a margin of error) categorizes the EV as a 400 V EV.
To filter errors and outliers surrounding the maximum charging speed, the second highest speed is also calculated. In case the second highest speed differs widely (as we will elaborate on later) from the maximum speed , the charging session with the maximum charging speed is filtered and the maximum speed is recalculated. This step is repeated until the fastest charging speed is close to the second fastest charging speed. For the data with provider EVNET, which has meter values in Wh, the limit of difference between maximum charging speed and the second highest speed is at 200 W. For the NUON data, since the meter values are in kWh, the maximum difference to be accepted is 1 kW between the fastest and second fastest charging speed. By doing so, large outliers are filtered, but this also means that charging stations with only a handful charging sessions might be filtered. This also holds for charging stations with only one record of a 400 V EV.
5. Results
5.1. Regression Model
The results section first describes the regression model, after which the results of the individual variables is elaborated upon. The total model gives the regression output as in Table 5, in which the dependent variable Δ of charge session-the average charging speed of a charging session-is expressed in W. All variables except for battery degradation are rounded to two decimals in the regression model. This regression model is constructed in R, with the aforementioned dependent and independent variables, by taking into account all charging sessions.
5.2. Environmental Effects
The hypothesis that during peak time the charging of EVs would be slower is falsified as the effect is positive. Following the research of [9] as suggested in Section 2.2.1, a negative effect was expected for charging during peak time, but the results indicate that the charging speed is higher when the EV is charging during peak time, with an estimated positive effect of 65 W (2.4%) in the case where the EV is completely charged to full SOC between 17.00–21.00.
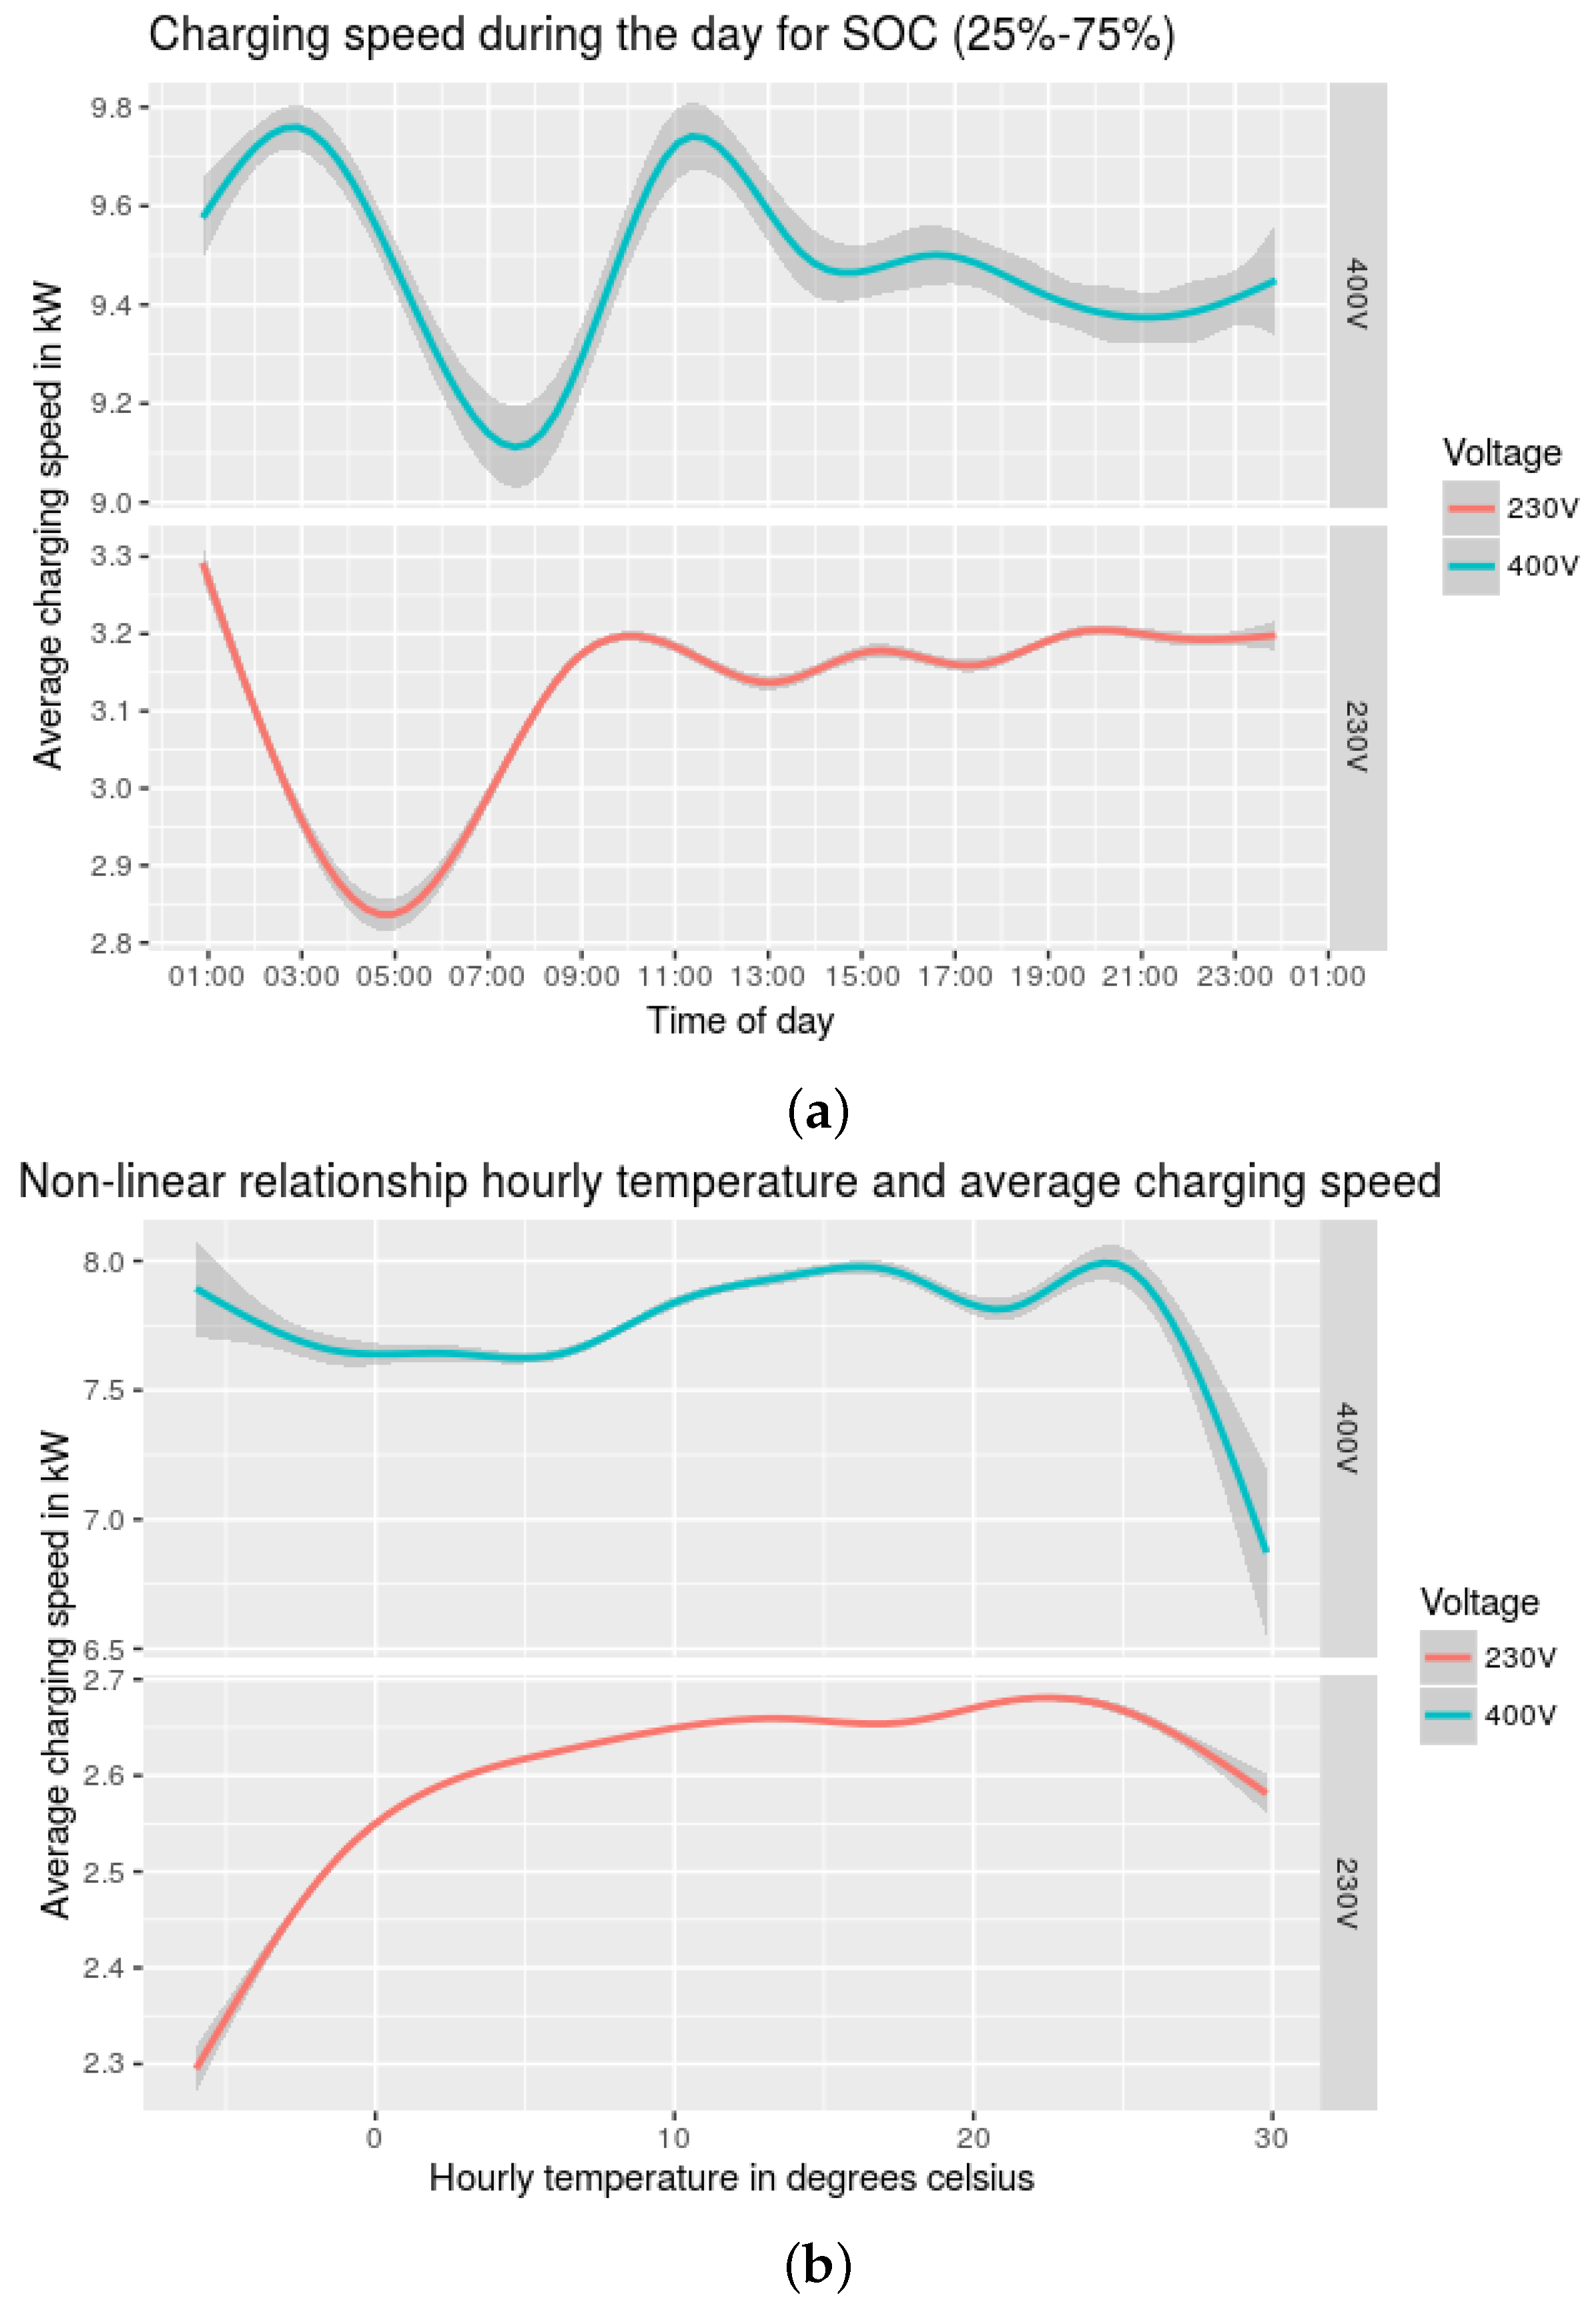
The variable day was expected to have, on the one hand, a negative effect due to more power loss during the day, while on the other hand, the higher Voltage levels during the day and the evening suggested a positive effect on charging speed. The results from the model suggest an overall negative effect of 5.7% on the average charging speed of the EVs by charging during daytime. However, taking a closer look at Figure 6a, it shows that 230 V EVs charge around 10% slower around 05:00 than during daytime, while 400 V EVs have valley hours around 08:00 in the morning. In this figure the slow pre-charge phase and trickle current phase (start and end of charging) are filtered, which could have impacted this result.
The effect of temperature on the charging time is positive, and since this is a continuous variable, for every degree of Celsius increase, the charging speed increases with 3.7 W. So for a difference of 20 degrees, the average charging speed difference is expected to be 2.7%. This result means that overall charging is slower when it is colder and as can be seen in Figure 6b, this is especially true for 230 V EVs below zero degrees Celsius. This may be because 230 V EVs have slower charge speeds, and thus it is more difficult to heat the battery for maximum charging speed. The higher charge speeds of 400 V EVs restrain maximizing charge speed with higher temperatures, while taking care of the battery health.
5.3. Charge Point
The results of the variables double connection, double charge and voltage other socket are illustrated in Table 6. Interestingly, there is a large contrast between 230 V and 400 V EVs. In situations 1–4 the results are shown for when at the measured socket (socket 1), a 230 V EV is charging. When at the other socket another 230 V EV is connected, there is a small positive result (situation 1). However, if at the other socket a 230 V EV is charging (situation 2), the average charging speed goes down by 1.5 %. Instead, if the EV at the other socket is a 400 V EV, the charging speed actually goes up by approximately 1.5% when it is only connected and when it is also charging (situations 3 and 4). Therefore, it makes a difference for a 230 V EV if at the other socket a 400 V EV is connected, and also when it is charging.
Situations 5–8 show the effect on charging speed for the scenario of a 400 V EV connected at socket 1. If a 230 V EV is charging at the other socket (situation 5), this results in a 6% decrease, while when the 230 V EV at the other socket is charging (situation 6), there is an increase of 3%. In situation 7, at both sockets 400 V EVs are connected, which has an insignificant result. When these 400 V EVs are both charging (situation 8), however, the average charging speed drops 7%.
These results show that there is a large contrast between the charging of 230 V EVs and 400 V EVs, and also that there is a large effect of the interaction between the EVs at the same charging station. The charging speed is dependent on the Voltage level of the EV at the other socket, and if it is charging or only connected. This study has not been able to explain this contrast and it may be a topic for further research.
5.4. EV Characteristics
The variable that explores the difference between single-phase (230 V) and three-phase (400 V) EVs (Voltage) was expected to be three times as high. This is true, as can be seen in Figure 5, Figure 6, Figure 7 and Figure 8 (the figures are split in two for 230 EVs and 400 EVs), and the regression Table 5 shows that the effect is at least three times as high. Therefore, the hypothesis that three phase charging speeds can be predicted by approximately multiplying the charging speed by three can be confirmed.
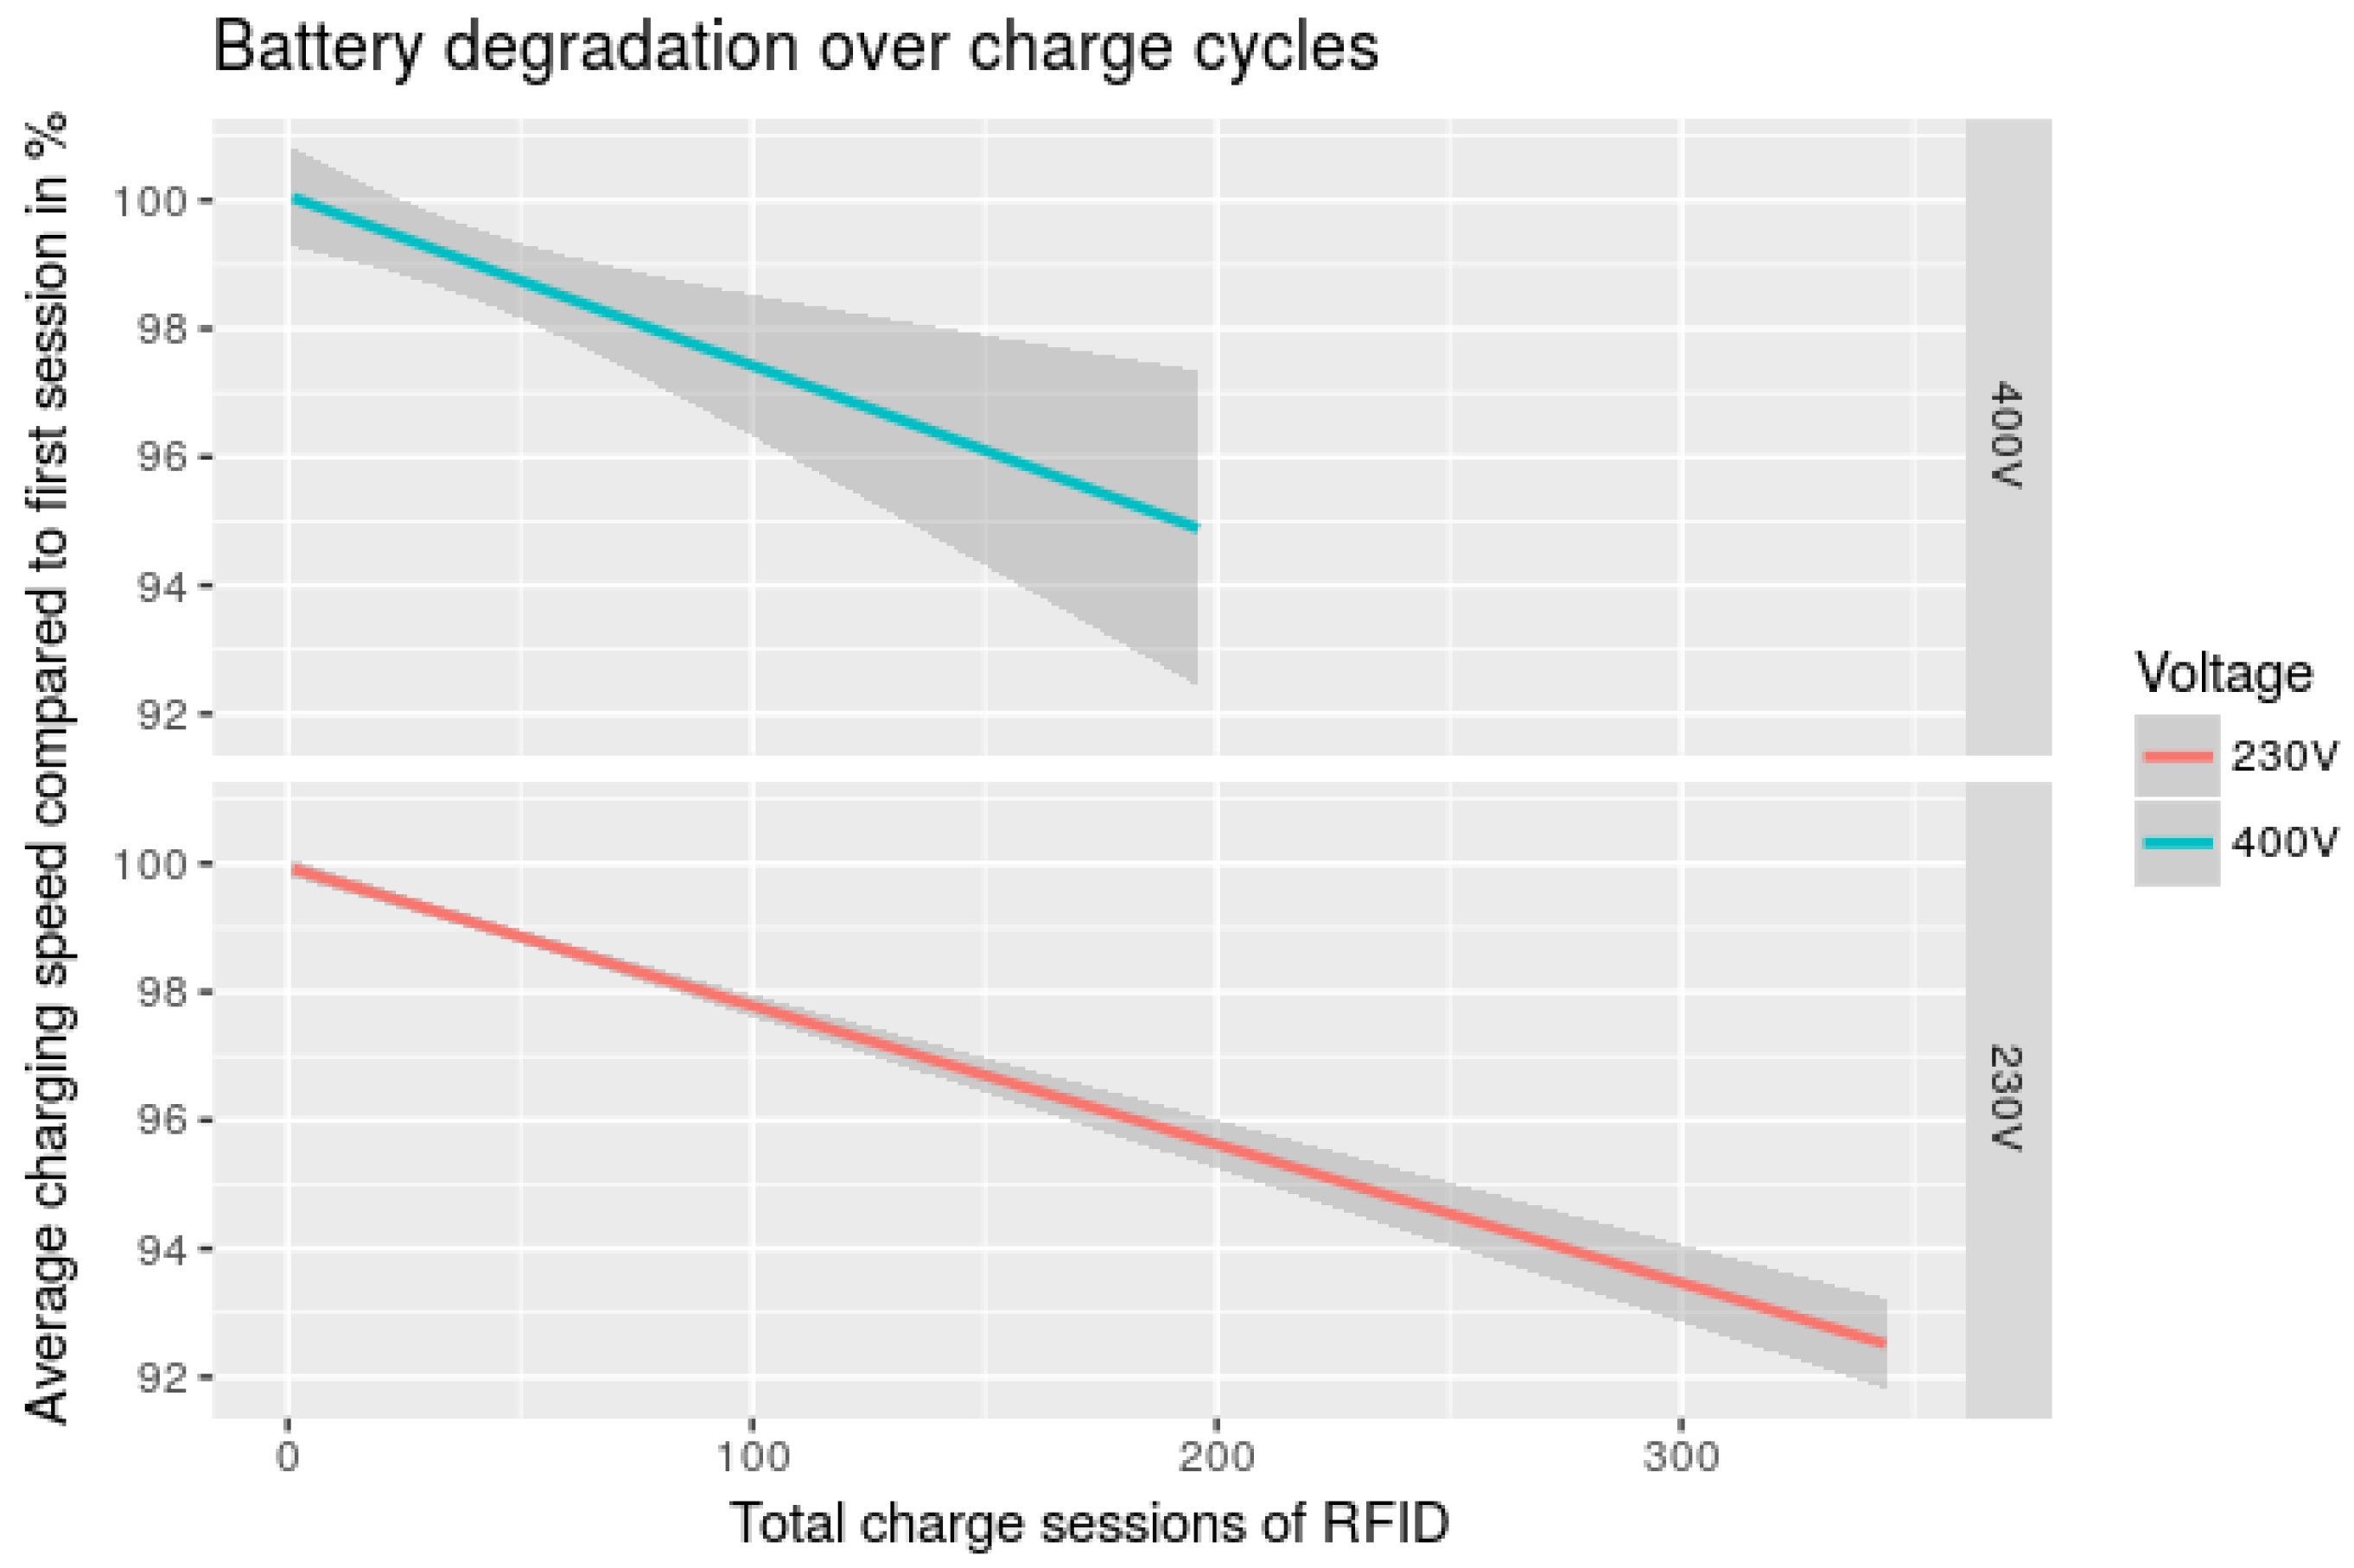
At first, the battery degradation component does not seem to have large impact; however, charging sessions of EVs in this dataset can amount to 350 sessions for a single RFID (in the used dataset, only 230 V EVs had reached more than 200 sessions). For 100 sessions, this effect would be around 3% compared to the first session and in total (for 350 sessions) up to almost 10%. This implies that the more often a EV is charged, the more the charge speed is decreased. This result of this variable for both 230 V and 400 V is shown in Figure 7. In the figure, the effects are normalized compared to the first charge session.
6. Discussion
The linearity of the variables is up for consideration, since some of the variables show a clear non-linear pattern. Therefore, the regression model that is used does not provide the full image, but the figures throughout Section 5 give a better representation of the actual influence of the variables. This non-linearity can be taken into consideration for future research of variables. To be more explicit, a variable not taken into account in this paper, the effect of SOC on the charging speed, can be seen in Figure 8. This figure shows that it is hard to draw a linear regression line on the effect of SOC, which is true for some other variables as well.
Furthermore, the battery degradation can only be calculated on the sessions that were in the dataset and an EV that is charging for the 150th time can be marked as the first charge session. Moreover, in this research, the charging sessions’ speeds are not measured against the first session of the RFID, but the general tendency of charging speed and charging sessions are taken into account. This means that the battery degradation of individual EVs is not measured, but overall, EVs tend to charge slower after each charging session.
Because of these two reasons, it is hard to draw final conclusions about the specific battery degradation of EVs and its effect on charging speed. There might be other endogenous variables playing a role in the impact due to charge sessions on the average charging speed. To get a better understanding of the influence of battery degradation, a longer time period can be chosen with more charge sessions. By making sure the first charging session of an EV is tracked, the influence of battery degradation can be checked. Furthermore, by comparing the charging speed of individual EVs over charging sessions, the direct influence of battery degradation can be examined.
From the literature, the effect during peak time was expected to be negative [9,10], but in this study this variable did not have a significant impact on the average charging speed. The lack of a negative effect could be due to a strong power grid with large capacity. However, more research can be conducted to explain the difference in positive peak time relationship, since this effect is different than expected. What is more, the regression model suggested a negative effect of charging during the day, but Figure 6a shows a positive result, meaning that there are other endogenous variables influencing the regression output. Including more variables would give a clearer image of the actual effects of the variables, which is not possible in this research due to the scope.
In this research, data was used from two energy providers: EVNET and NUON. Because the data provided by NUON was different in precision by a factor of thousand, the precision in the variables could also have been affected. In particular, since trickle charging at the end of a charge session was mostly filtered because of this lack of precision. However, the precision of the EVNET data also implied difficulty in determining a cut-off point at which an EV was described as fully charged. Due to this arbitrarily chosen point, the effects of—and during—the trickle current are hard to compare for both providers.
7. Conclusions
This research aimed to provide a more extensive analysis of the charging profile of EVs, through studying variables influencing the charging profile at public alternating current charging points. Until now, the charging time has only been based on the maximum charging speed, which is calculated by dividing the session time by the total amount charged, as mentioned in [14]. Various variables influence charging speed and total charging time and their effect have been analyzed. This research has demonstrated, based on real world data, that indeed many variables influence charging time. The most important findings have shown that the Voltage level of an EV has a large impact, especially in combination with the result that the number of EVs being connected or charging at a single charging station influence the charging speed, as illustrated in Table 6. Moreover, the charge speed decays due to battery degradation and during daytime and peak hours as illustrated in Figure 6a suggest a positive relationship with charging speed. In extreme cases, this can lead to charging time differing a total of approximately 10% from the default charging time.
The results of this study can be used to further develop a model that includes the most important influencing factors on charging profiles of EVs and can be used to predict these charging profiles. With the predictors of the complete model, the actual charging time can be estimated with more accuracy based on the available data, which makes it possible to further optimize charging behaviour.
The study has researched EVs in The Netherlands, and in countries with similar charging infrastructures the results can give similar estimations. However, in order to understand the charge point effects, it is necessary to validate the results through direct measurement, for example by observing the SOC from the battery of an EV over time when charging. Further work on linking real world datasets with other influencing variables could be carried out to enable more accurate estimation of real world charging profiles. This research has intended to contribute to more optimized, efficient charging, helping to limit greenhouse gas emissions and improve customer experience. Further research should focus on charging time estimation based on real world data, as it plays an important role in validating theoretical models of battery behavior. This research has already touched upon the influence of State-of-Charge and further research should be carried out to validate the charging profile, based on real-world data. Finally, additional research should be undertaken in related fields of study, for example charging behavior management, to explore strategies that could ensure EV owners actually charge their vehicles at night.
Author Contributions
Conceptualization and Design, J.R.H.; Methodology, J.R.H. & J.J.M.; Investigation and analyzing the data, J.J.M.; Analyzing and interpretation of the data, J.R.H. & J.J.M.; Writing, J.J.M.; Editing, J.R.H. and R.v.d.H.
Acknowledgments
This research is part of the IDO-laad project. The IDO-laad research project is funded by the Dutch “Regieorgaan SIA, part of the Dutch Organization for Scientific Research (NWO). Charging data of the public charging infrastructure have been provided by the municipalities of Amsterdam, The Hague, Rotterdam, Utrecht, and the Metropolitan Region of Amsterdam. We thank the city of Amsterdam and IDO-Laad partners for the possibility of using the public charging infrastructure data for this research.
Conflicts of Interest
The authors declare no conflict of interest.
References
- Morrissey, P.; Weldon, P.; O’Mahony, M. Future standard and fast charging infrastructure planning: An analysis of electric vehicle charging behaviour. Energy Policy 2016, 89, 257–270. [Google Scholar] [CrossRef]
- Haidar, A.M.A.; Muttaqi, K.M. Behavioral Characterization of Electric Vehicle Charging Loads in a Distribution Power Grid Through Modeling of Battery Chargers. IEEE Trans. Ind. Appl. 2015, 52, 483–492. [Google Scholar] [CrossRef]
- Jain, P.; Jain, T. Assessment of electric vehicle charging load and its impact on electricity market price. In Proceedings of the 2014 International Conference on Connected Vehicles and Expo, ICCVE, Vienna, Austria, 3–7 November 2014; pp. 74–79. [Google Scholar] [CrossRef]
- Pinto, F.A.V.; Costa, H.M.K.; Amorim, M.D.D. Modeling Spare Capacity Reuse in EV Charging Stations based on the Li-ion Battery Profile. In Proceedings of the 2014 International Conference on Connected Vehicles and Expo, ICCVE, Vienna, Austria, 3–7 November 2014; pp. 92–98. [Google Scholar] [CrossRef]
- Richardson, P.; Flynn, D.; Keane, A. Optimal Charging of Electric Vehicles in Low-Voltage Distribution Systems. IEEE Trans. Power Syst. 2012, 27, 268–279. [Google Scholar] [CrossRef] [Green Version]
- Geng, B.; Mills, J.K.; Sun, D. Two-stage charging strategy for plug-in electric vehicles at the residential transformer level. IEEE Trans. Smart Grid 2013, 4, 1442–1452. [Google Scholar] [CrossRef]
- Ying, J.; Ramachandaramurthy, V.K.; Miao, K.; Mithulananthan, N. A review on the state-of-the-art technologies of electric vehicle, its impacts and prospects. Renew. Sustain. Energy Rev. 2015, 49, 365–385. [Google Scholar] [CrossRef]
- Panahi, D.; Deilami, S.; Masoum, M.A.S.; Islam, S.M. Forecasting Plug-In Electric Vehicles Load Profile Using Artificial Neural Networks. In Proceedings of the Power Engineering Conference (AUPEC), Australasian Universities, Wollongong, Australia, 27–30 September 2015; pp. 1–6. [Google Scholar]
- Clement-nyns, K.; Haesen, E.; Member, S.; Driesen, J. The Impact of Charging Plug-In Hybrid Electric Vehicles on a Residential Distribution Grid. IEEE Trans. Power Syst. 2010, 25, 371–380. [Google Scholar] [CrossRef] [Green Version]
- Moses, P.; Deilami, S.; Masoum, A.S.; Masoum, M.A.S. Power Quality of Smart Grids with Plug-in Electric Vehicles Considering Battery Charging Profile. In Proceedings of the 2010 IEEE PES Innovative Smart Grid Technologies Conference Europe (ISGT Europe), Gothenberg, Sweden, 11–13 October 2010; pp. 1–7. [Google Scholar]
- Hager BV. Aangesloten op de toekomst: Laadstations voor E-mobility; Technical Report; Hager BV: ’s-Hertogenbosch, The Netherlands, 2015. [Google Scholar]
- Hato, Y.; Hung, C.; Toshio, C.; Kamiya, Y.; Daisho, Y.; Inami, S. Degradation Predictions of Lithium Iron Phosphate Battery. World Electr. Veh. J. 2015, 7, 25–31. [Google Scholar] [CrossRef] [Green Version]
- van den Hoed, R.; Helmus, J.R.; De Vries, R.; Bardok, D. Data analysis on the public charge infrastructure in the city of Amsterdam. In Proceedings of the 2013 World Electric Vehicle Symposium and Exhibition (EVS27), Barcelona, Spain, 17–20 November 2013; pp. 1–10. [Google Scholar] [CrossRef]
- Wolbertus, R.; van den Hoed, R.; Maase, S. Benchmarking Charging Infrastructure Utilization. World Electr. Veh. J. 2016, 8, 754–771. [Google Scholar] [CrossRef] [Green Version]
Figure 1.
The charging profile of a Lithium-ion battery reprinted from [7].
Figure 1.
The charging profile of a Lithium-ion battery reprinted from [7].

Figure 2.
(a) Electricity demand profile Belgium, (b) Voltage Profile at 30% PEV penetration level compared to 0%, both reprinted from [9].
Figure 2.
(a) Electricity demand profile Belgium, (b) Voltage Profile at 30% PEV penetration level compared to 0%, both reprinted from [9].

Figure 3.
(a) The effect of temperature (a) over days and SOC (b) over charge cycles, both reprinted from [12].
Figure 3.
(a) The effect of temperature (a) over days and SOC (b) over charge cycles, both reprinted from [12].
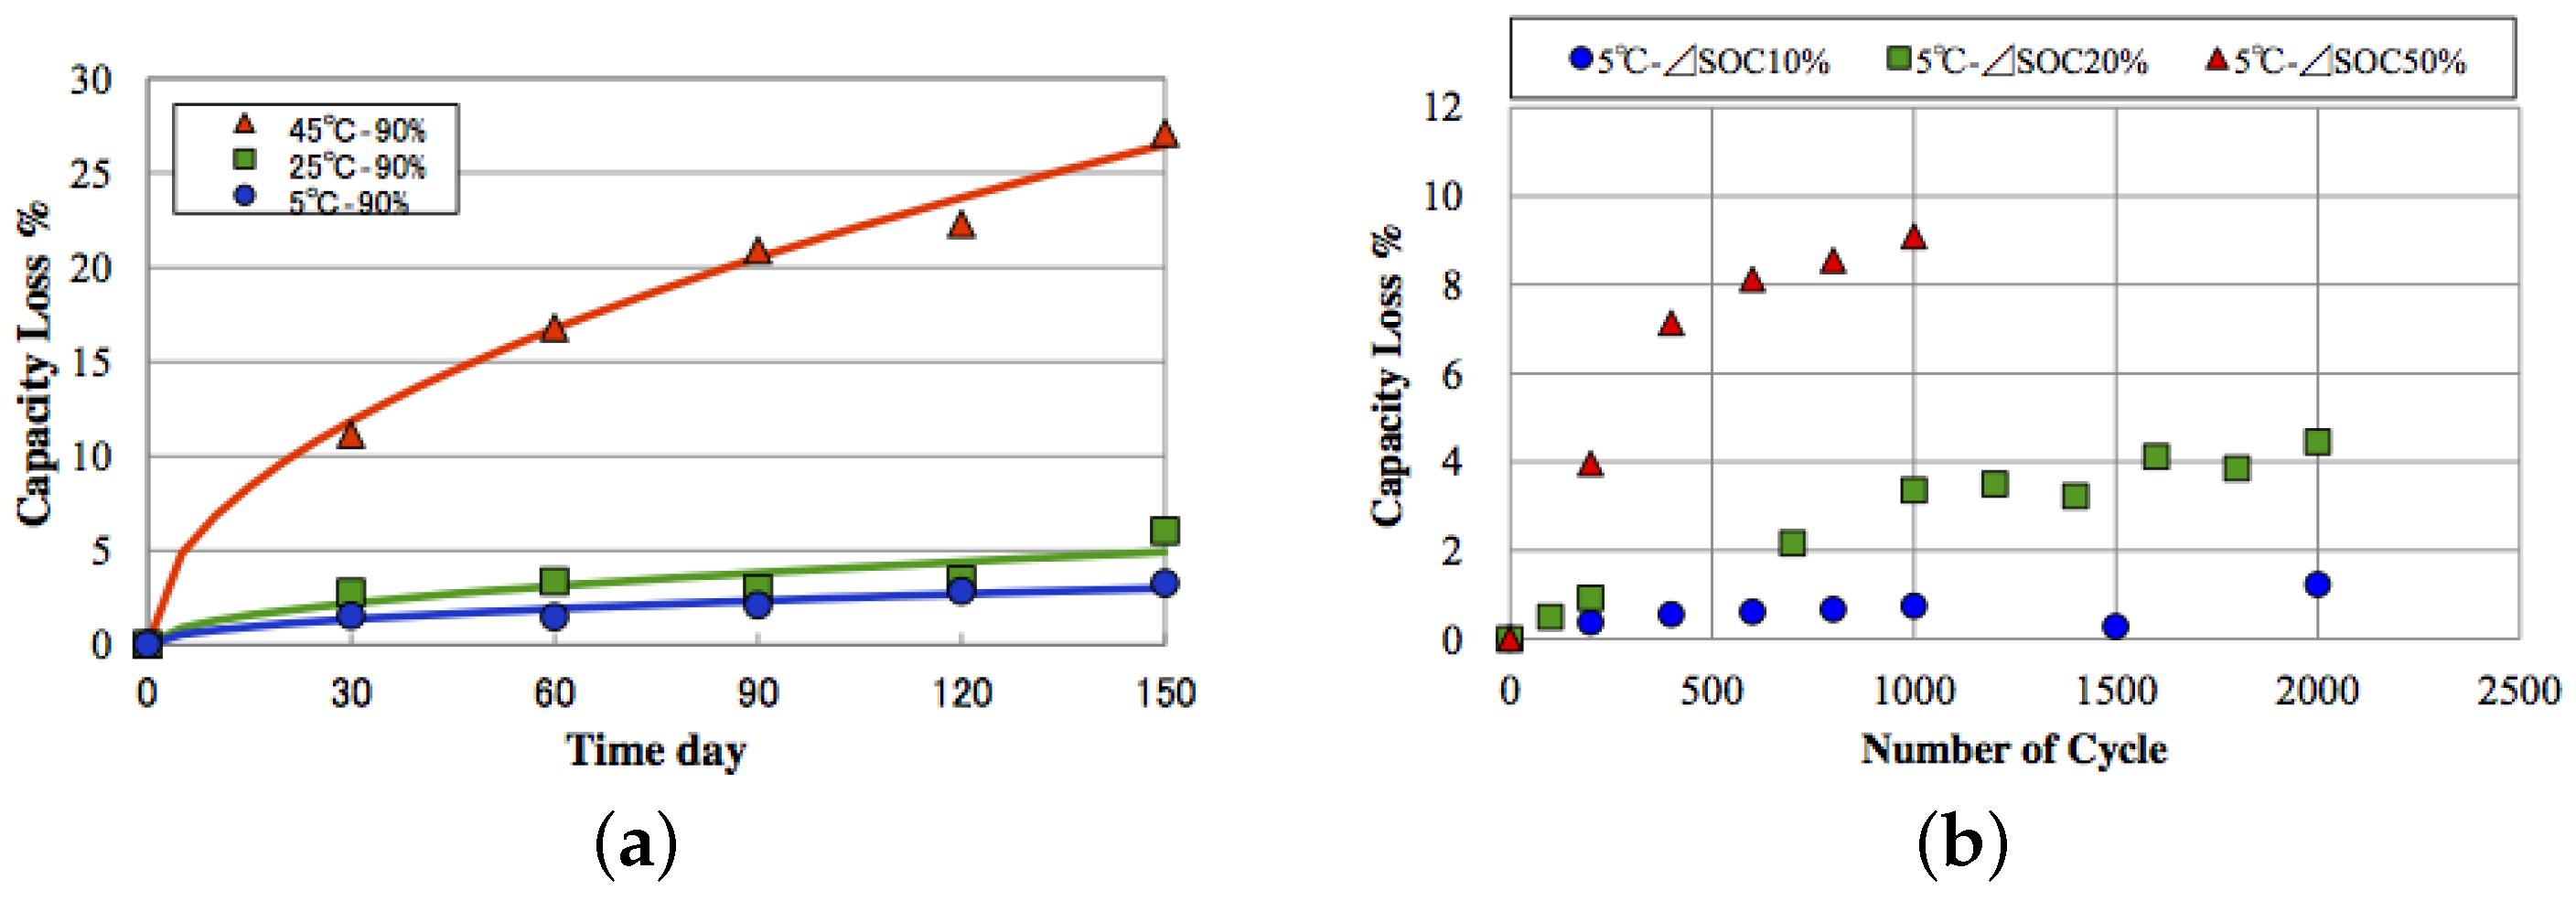
Figure 4.
Complete theoretical model, of which the included variables in this paper are bold.

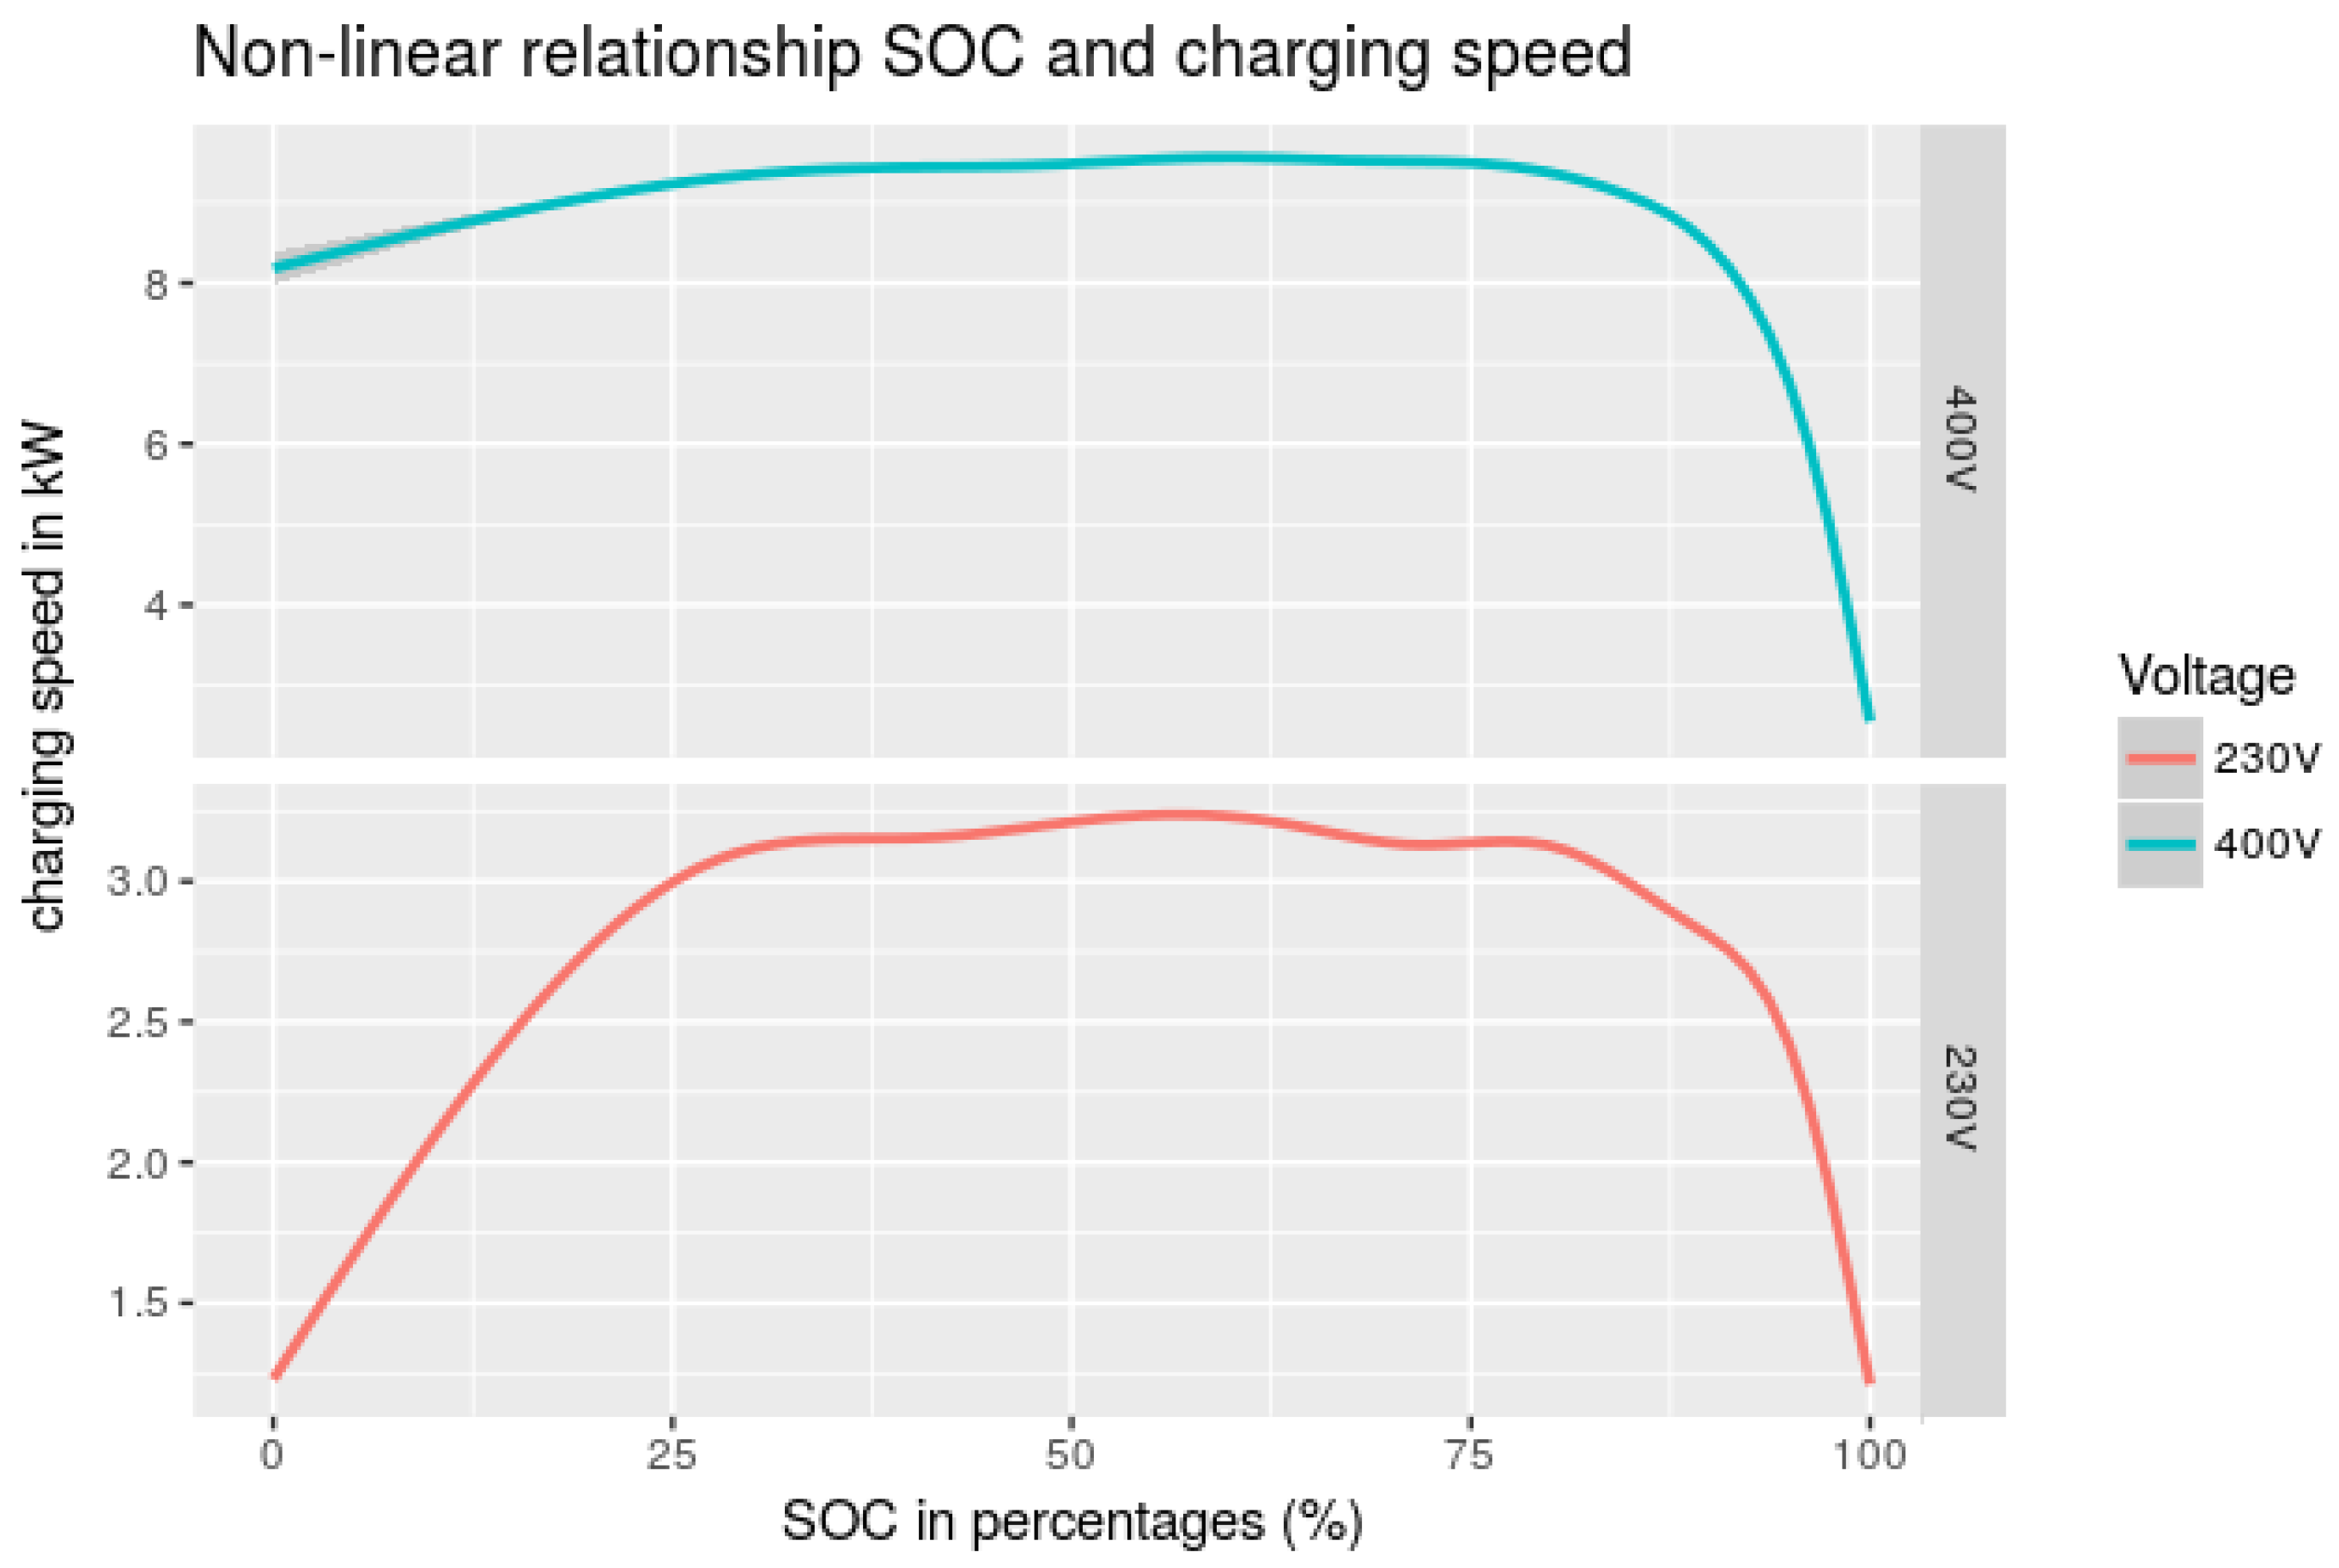
Figure 5.
Linearity for both Voltage levels. The x-axis shows the SOC, while total amount charged is on the y-axis. At the top right corner, the EV is fully charged. At the bottom left corner, the battery is completely empty.
Figure 5.
Linearity for both Voltage levels. The x-axis shows the SOC, while total amount charged is on the y-axis. At the top right corner, the EV is fully charged. At the bottom left corner, the battery is completely empty.

Figure 6.
(a) Charging speed during the day (SOC: 25%–75%), (b) Effect of temperature on charging speed.
Figure 6.
(a) Charging speed during the day (SOC: 25%–75%), (b) Effect of temperature on charging speed.

Figure 7.
Effect of battery degradation on charging speed. The x-axis represents the total number of charge sessions of a certain RFID.
Figure 7.
Effect of battery degradation on charging speed. The x-axis represents the total number of charge sessions of a certain RFID.

Figure 8.
Effect of State-of-Charge on charging speed, and is elaborated upon in the Discussion section.
Figure 8.
Effect of State-of-Charge on charging speed, and is elaborated upon in the Discussion section.

Table 1.
(upper part) Ratio of power loss to total power in (%), (lower part) maximum voltage deviations in (%), both retrieved from [9].
Table 1.
(upper part) Ratio of power loss to total power in (%), (lower part) maximum voltage deviations in (%), both retrieved from [9].
| Charging Period | Season | Penetration Level | |||
|---|---|---|---|---|---|
| 0% | 10% | 20% | 30% | ||
| 21:00–06:00 | Summer | 1.1 | 1.4 | 1.9 | 2.2 |
| Winter | 1.4 | 1.6 | 2.1 | 2.4 | |
| 18:00–21:00 | Summer | 1.5 | 2.4 | 3.8 | 5.0 |
| Winter | 2.4 | 3.4 | 4.8 | 6.0 | |
| 10:00–16:00 | Summer | 1.3 | 1.8 | 2.6 | 3.2 |
| Winter | 1.7 | 2.2 | 3.0 | 3.6 | |
| 21:00–06:00 | Summer | 3.1 | 3.5 | 4.4 | 5.0 |
| Winter | 4.2 | 4.4 | 4.9 | 5.5 | |
| 18:00–21:00 | Summer | 3.0 | 4.4 | 6.5 | 8.1 |
| Winter | 4.8 | 6.3 | 8.5 | 10.3 | |
| 10:00–16:00 | Summer | 3.0 | 4.1 | 5.6 | 6.9 |
| Winter | 3.7 | 4.9 | 6.4 | 7.7 | |
Table 2.
Categorization of charge point variables.
| Situation | Variables | Socket 1 | Socket 2 | ||||
|---|---|---|---|---|---|---|---|
| Connected | Charging | 400V | Connected | Charging | 400V | ||
| 1 | DoubleConnection | X | X | X | |||
| 2 | DoubleCharge | X | X | X | X | ||
| 3 | Voltage other socket | X | X | X | X | ||
| 4 | Voltage other socket: DoubleCharge | X | X | X | X | X | |
| 5 | Voltage: DoubleConnection | X | X | X | X | ||
| 6 | Voltage: DoubleCharge | X | X | X | X | X | |
| 7 | Voltage: Voltage other socket | X | X | X | X | X | |
| 8 | Voltage: Voltage other socket: DoubleCharge | X | X | X | X | X | X |
Table 3.
Parameters.
| Parameter | Example | Explanation |
|---|---|---|
| Charge service | Provider NUON | Owner of the used charging card |
| kWh | 10.303 | Charged energy in kWh |
| Connection time | 5.133 | Connection time in hours |
| Start Date | 21-01-2015 | Date the session started |
| End Date | 21-01-2015 | Date the session ended |
| Start Time | 11:52:57 | Time the session started |
| End Time | 17:00:29 | Time the session ended |
| Radio Frequency ID (RFID) | 01B0011223312345 | RFID code of a charging card |
| Chargepoint ID | AL101 | ID Code of a charging station |
| Socket ID | 1 | Code of used socket |
| Metervalue | 6205309 | Meter value in Wh |
| Timestamp of meter value | 2016-01-04 08:24:58 | Time of the specific meter value |
| Transaction ID | 1255503 | Code of unique charging session |
Table 4.
Example data.
| Chargepoint ID | Socket ID | Timestamp | Meter Value | ΔWh | Full SOC |
|---|---|---|---|---|---|
| AL101 | 1 | 11:52:57 | 6,205,309 | False | |
| AL101 | 1 | 12:07:57 | 6,206,195 | 886 | False |
| AL101 | 1 | 12:22:57 | 6,207,081 | 886 | False |
| AL101 | 1 | 12:37:57 | 6,207,968 | 887 | False |
| AL101 | 1 | 12:52:57 | 6,208,498 | 530 | False |
| AL101 | 1 | 13:07:57 | 6,208,508 | 10 | True |
| AL101 | 1 | 13:22:57 | 6,208,511 | 3 | True |
| AL101 | 1 | 13:37:57 | 6,208,513 | 2 | True |
| AL101 | 1 | 13:52:57 | 6,208,515 | 2 | True |
| AL101 | 1 | 14:03:26 | 6,208,515 | 0 | True |
Table 5.
Regression Model.
| Estimate (W) | Std. Error | t Value | Pr (>|t|) | |
|---|---|---|---|---|
| (Intercept) | 2746.39 | 8.47 | 324.10 | 0.0000 *** |
| Peak | 65.16 | 9.19 | 7.09 | 0.0000 *** |
| Day | −156.42 | 8.23 | −19.01 | 0.0000 *** |
| Hour_Temperature | 3.65 | 0.36 | 10.12 | 0.0000 *** |
| DoubleConnection (1) | 24.94 | 7.40 | 3.37 | 0.0008 *** |
| DoubleCharge (2) | −42.85 | 10.56 | −4.06 | 0.0000 *** |
| Voltage_other_socket (3) | 38.17 | 15.50 | 2.46 | 0.0138 * |
| Voltage_other_socket:DoubleCharge (4) | 46.56 | 28.49 | 1.63 | 0.1022 |
| Voltage | 5020.31 | 10.41 | 482.12 | 0.0000 *** |
| Rank_RFID (battery degradation) | −0.7535 | 0.047 | −16.17 | 0.0000 *** |
| Voltage:DoubleConnection (5) | −498.14 | 25.38 | −19.63 | 0.0000 *** |
| Voltage:DoubleCharge (6) | 230.97 | 43.26 | 5.34 | 0.0000 *** |
| Voltage:Voltage_other_socket (7) | −3.34 | 40.40 | −0.08 | 0.9341 |
| Voltage:Voltage_other_socket:DoubleCharge (8) | −636.42 | 79.83 | −7.97 | 0.0000 *** |
Signif. codes: 0 *** 0.001 ** 0.01 * 0.05; Residual standard error: 753.3 on 125747 degrees of freedom; Multiple R-squared: 0.7513, Adjusted R-squared: 0.7513; F-statistic: on 13 and 125747 DF, p-value: .
Table 6.
Effect of charge point variables. The at socket 1 is measured: for differing situations the EV at socket 1 is influenced and this effect is measured and illustrated.
Table 6.
Effect of charge point variables. The at socket 1 is measured: for differing situations the EV at socket 1 is influenced and this effect is measured and illustrated.
| Situation | Socket 1 | Socket 2 | Effect | ||||
|---|---|---|---|---|---|---|---|
| Connected | Charging | 400 V | Connected | Charging | 400 V | ||
| 1 | X | X | X | ↑ *** | |||
| 2 | X | X | X | X | ↓ *** | ||
| 3 | X | X | X | X | ↑ * | ||
| 4 | X | X | X | X | X | insignificant | |
| 5 | X | X | X | X | ⇓ *** | ||
| 6 | X | X | X | X | X | ⇑ *** | |
| 7 | X | X | X | X | X | insignificant | |
| 8 | X | X | X | X | X | X | ⇓ *** |
Signif. codes: 0 *** 0.001 ** 0.01 * 0.05; ↑/↓: small effect ( W); ⇑/⇓: large effect ( W).
© 2018 by the authors. Licensee MDPI, Basel, Switzerland. This article is an open access article distributed under the terms and conditions of the Creative Commons Attribution (CC BY) license (http://creativecommons.org/licenses/by/4.0/).
Share and Cite
MDPI and ACS Style
Mies, J.J.; Helmus, J.R.; Van den Hoed, R. Estimating the Charging Profile of Individual Charge Sessions of Electric Vehicles in The Netherlands. World Electr. Veh. J. 2018, 9, 17. https://doi.org/10.3390/wevj9020017
AMA Style
Mies JJ, Helmus JR, Van den Hoed R. Estimating the Charging Profile of Individual Charge Sessions of Electric Vehicles in The Netherlands. World Electric Vehicle Journal. 2018; 9(2):17. https://doi.org/10.3390/wevj9020017
Chicago/Turabian StyleMies, Jerome Jacob, Jurjen Rienk Helmus, and Robert Van den Hoed. 2018. "Estimating the Charging Profile of Individual Charge Sessions of Electric Vehicles in The Netherlands" World Electric Vehicle Journal 9, no. 2: 17. https://doi.org/10.3390/wevj9020017