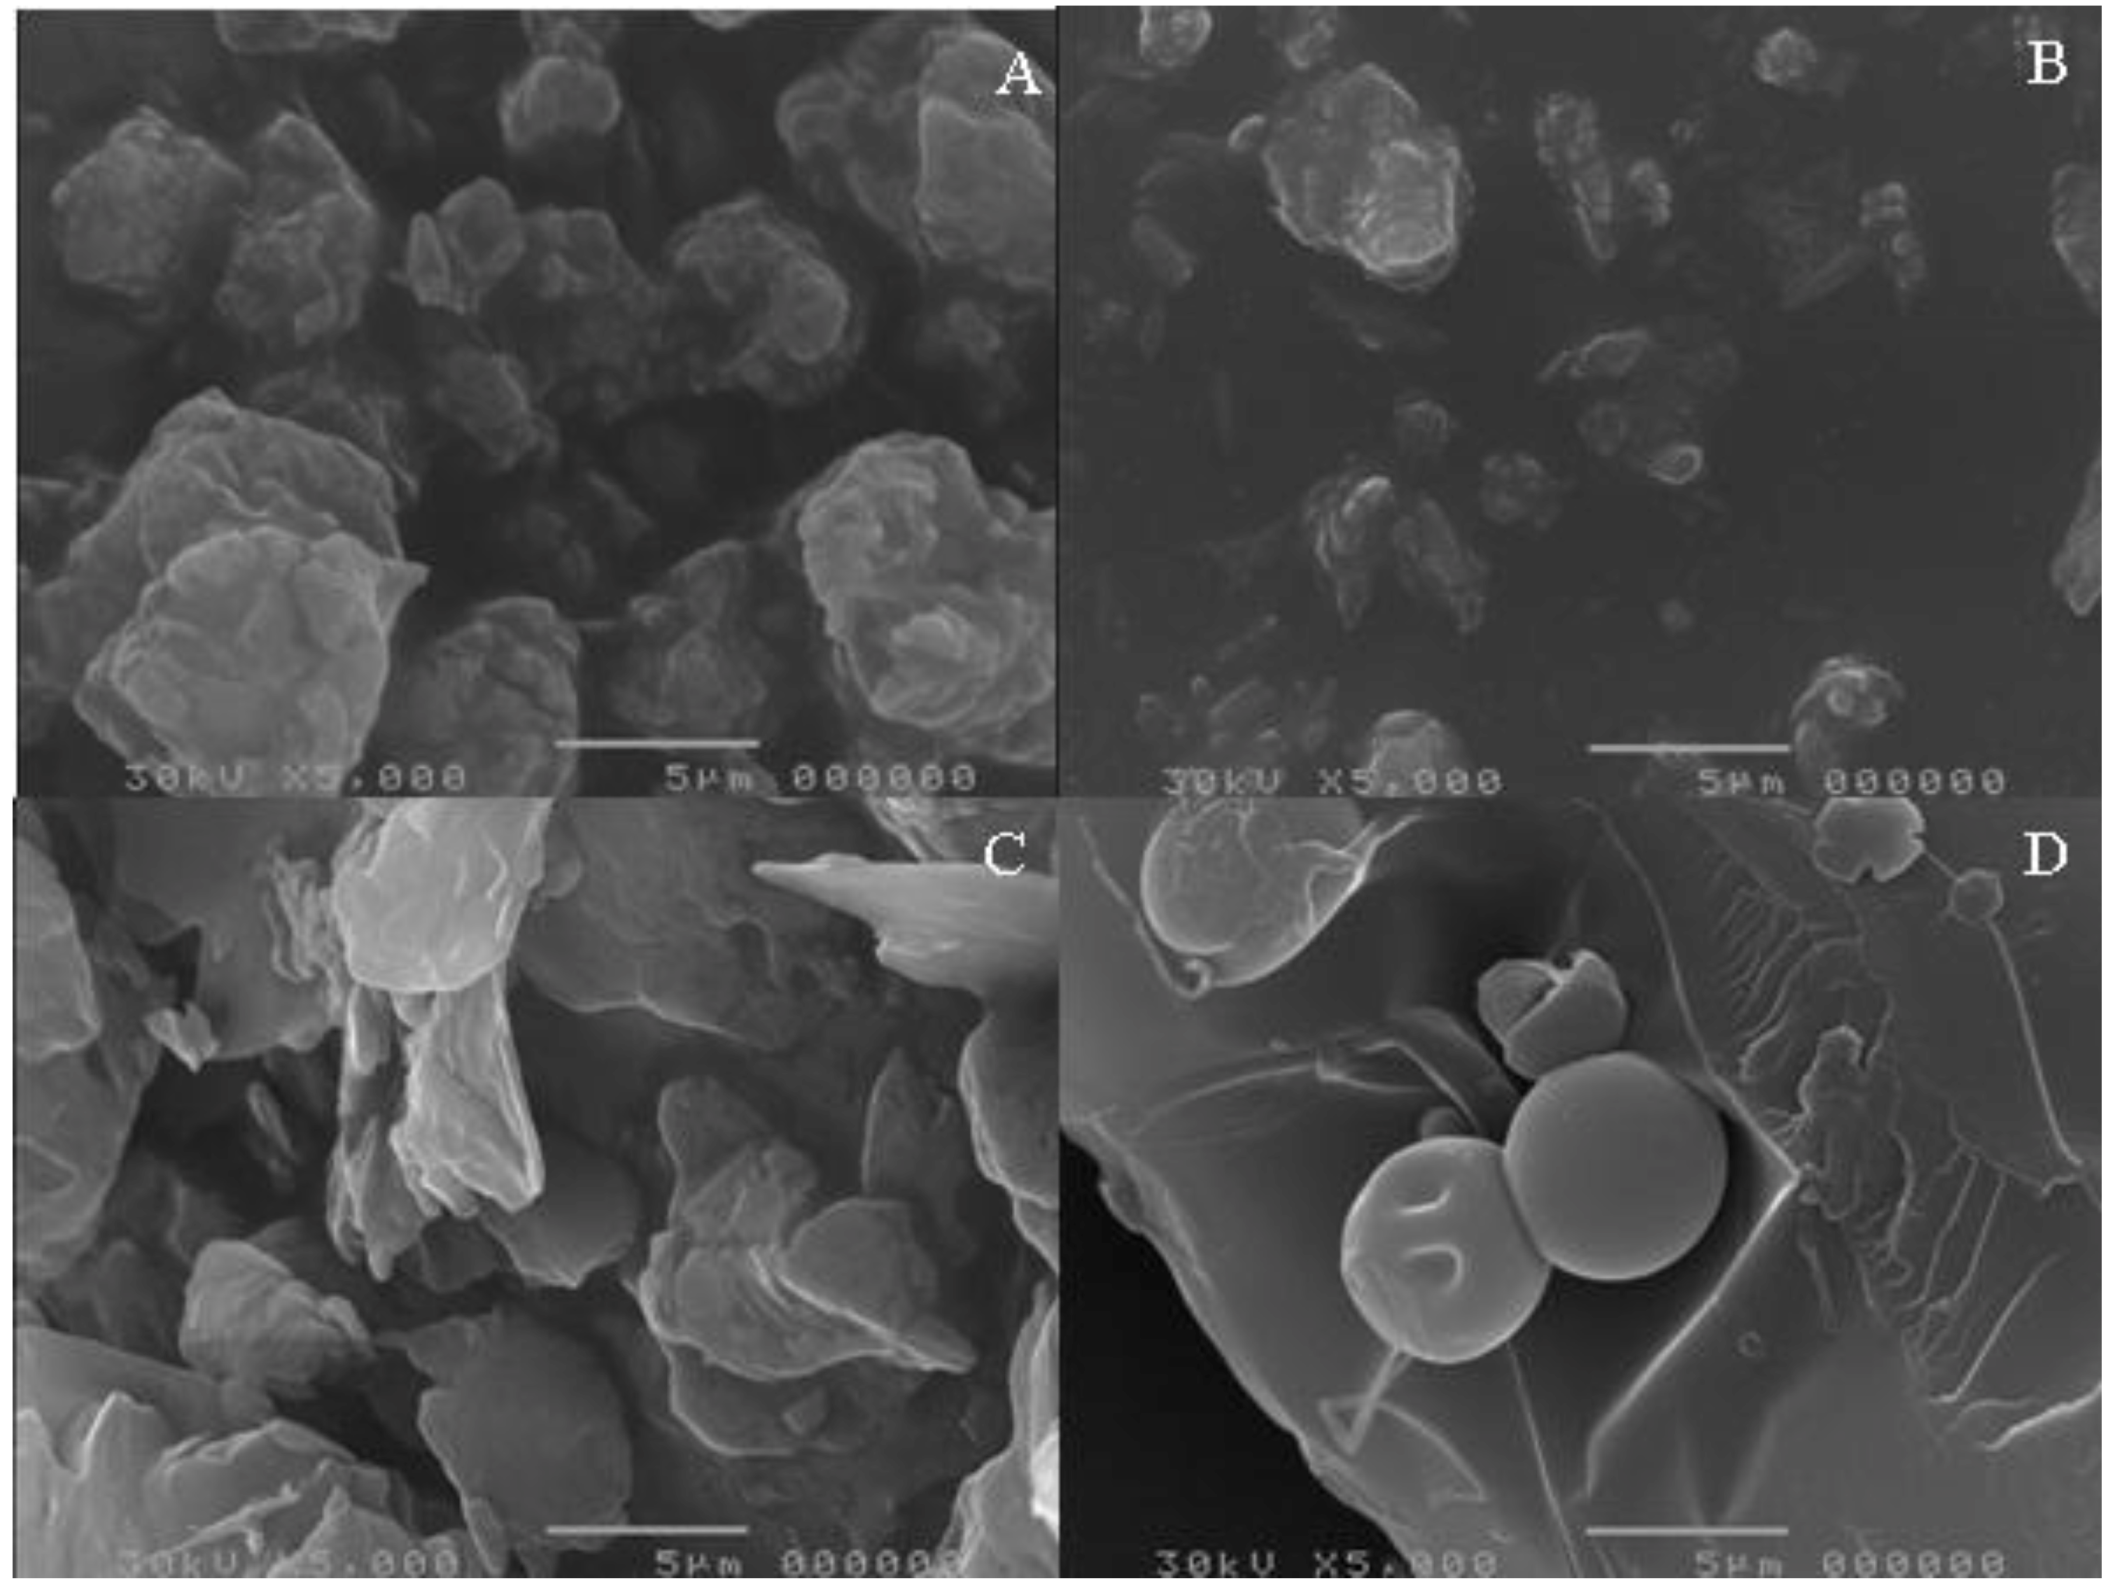
2.1. Scanning Electron Microscopy (SEM)
Figure 2 shows the photomicrographs of unprocessed and micronized EFV, unprocessed SLS and unprocessed PVP. A difference in morphology of the two dispersants is evident, as is the lower particle size of the micronized drug. Using direct measurement, the particle size of unprocessed and processed drug was 5.9 µm and 3.0 µm, respectively, showing a significant size decrease after processing. However, in practical terms, this size decrease may not be relevant for the processing or the dissolution of the material. The particle size of SLS and unprocessed PVP was 5.0 µm and 36.3 µm, respectively.
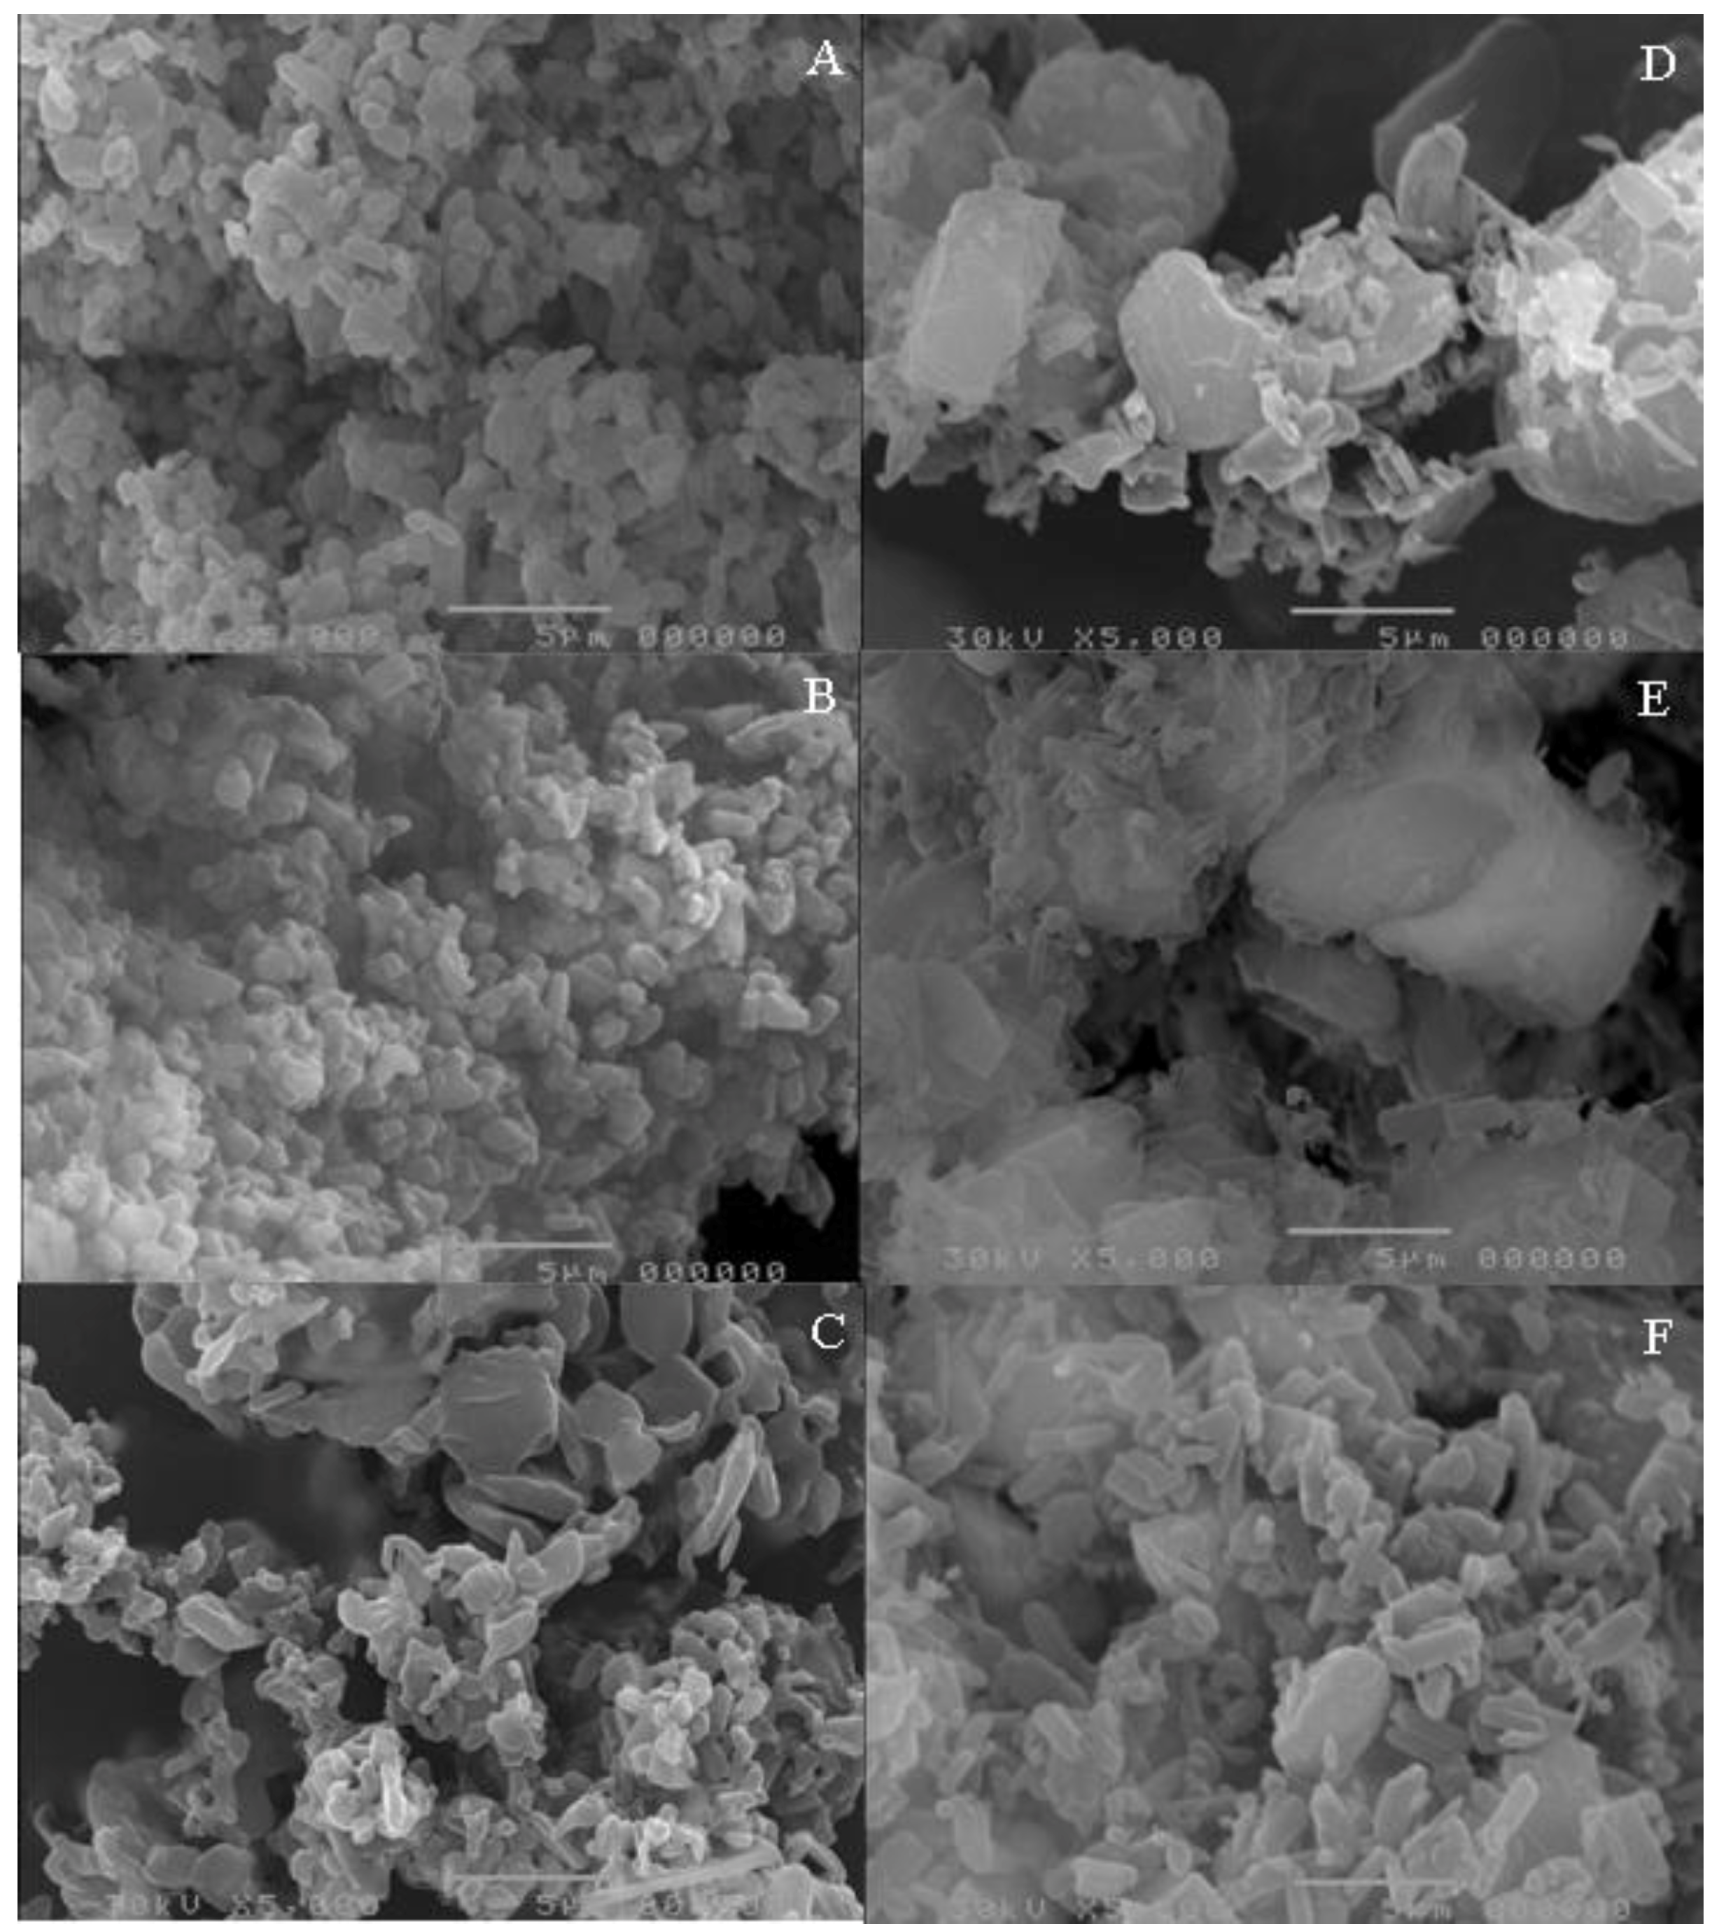
Figure 3 depicts the photomicrographs of co-micronized mixtures.
In general, distinct regions for drugs and carrier are not visible on the coprocessed photomicrographs, thus presenting a homogeneous system. Visualization could be achieved by spectroscopic techniques, such as Raman or Fourier transform infrared spectroscopy (FTIR) microscopy, but this detection is beyond the scope of the present paper.
The images of the co-micronized systems (
Figure 3) reveal that co-processed EFV:SLS particles are more homogeneous in size and morphology than co-processed EFV:PVP, and also have a smaller particle size.
Taking into account drug:excipient proportions, the lower the amount of carrier in the mix, the higher its particle size. The particle size range among EFV:SLS mixtures was smaller than among EFV:PVP, a finding which may be due to the larger average particle size of unprocessed PVP compared to unprocessed SLS. The values for average particle size of the co-micronized mixtures, measured directly, are listed in
Table 1.
Figure 2.
(A) Photomicrographs of unprocessed efavirenz (EFV); (B) micronized EFV; (C) unprocessed sodium lauryl sulfate (SLS); and (D)unprocessed polyvinylpyrrolidone (PVP).
Figure 2.
(A) Photomicrographs of unprocessed efavirenz (EFV); (B) micronized EFV; (C) unprocessed sodium lauryl sulfate (SLS); and (D)unprocessed polyvinylpyrrolidone (PVP).
Figure 3.
Photomicrographs of co-micronized mixtures EFV:SLS (A) (1:0.25); (B) (1:0.50) and (C) (1:1) and (D)EFV:PVP (1:0.25); (E) (1:0.50) and (F) (1:1).
Figure 3.
Photomicrographs of co-micronized mixtures EFV:SLS (A) (1:0.25); (B) (1:0.50) and (C) (1:1) and (D)EFV:PVP (1:0.25); (E) (1:0.50) and (F) (1:1).
Table 1.
Average particle size, measured directly.
Table 1.
Average particle size, measured directly.
| | Particle size (µm) |
|---|
| | SLS | PVP |
| EFV:dispersant (1:0.25) | 1.9 µm | 6.1 µm |
| EFV:dispersant (1:0.5) | 1.7 µm | 4.7 µm |
| EFV:dispersant (1:1) | 1.5 µm | 2.5 µm |
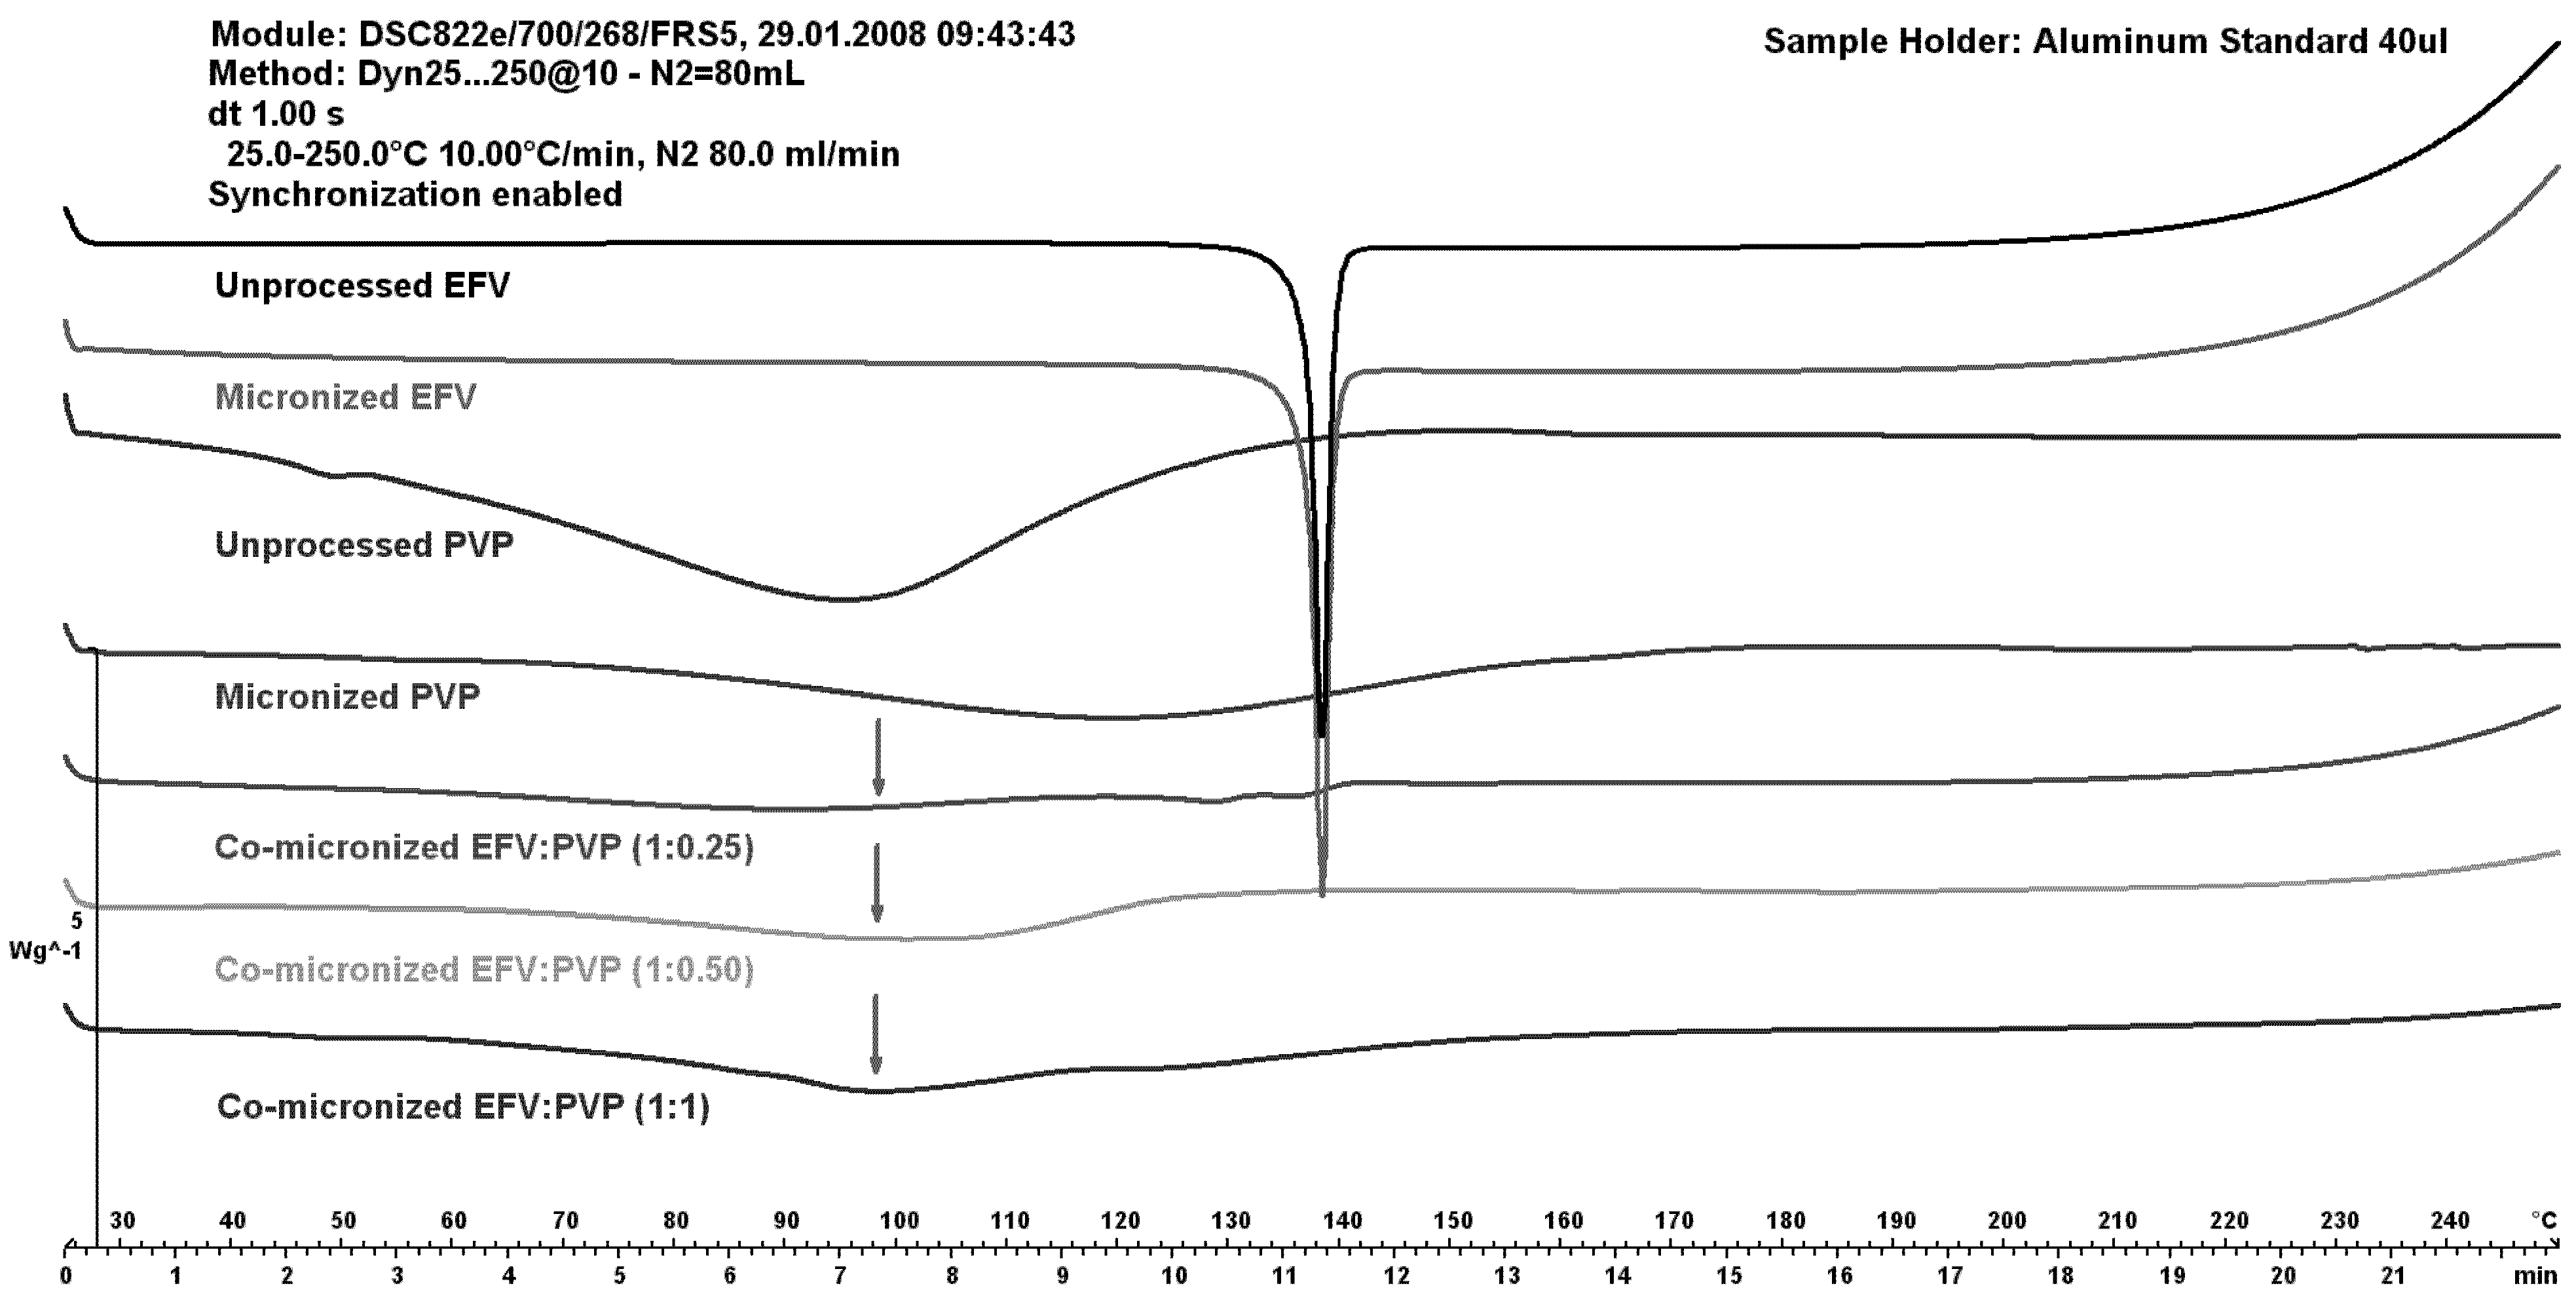
2.3. Differential Scanning Calorimetry (DSC)
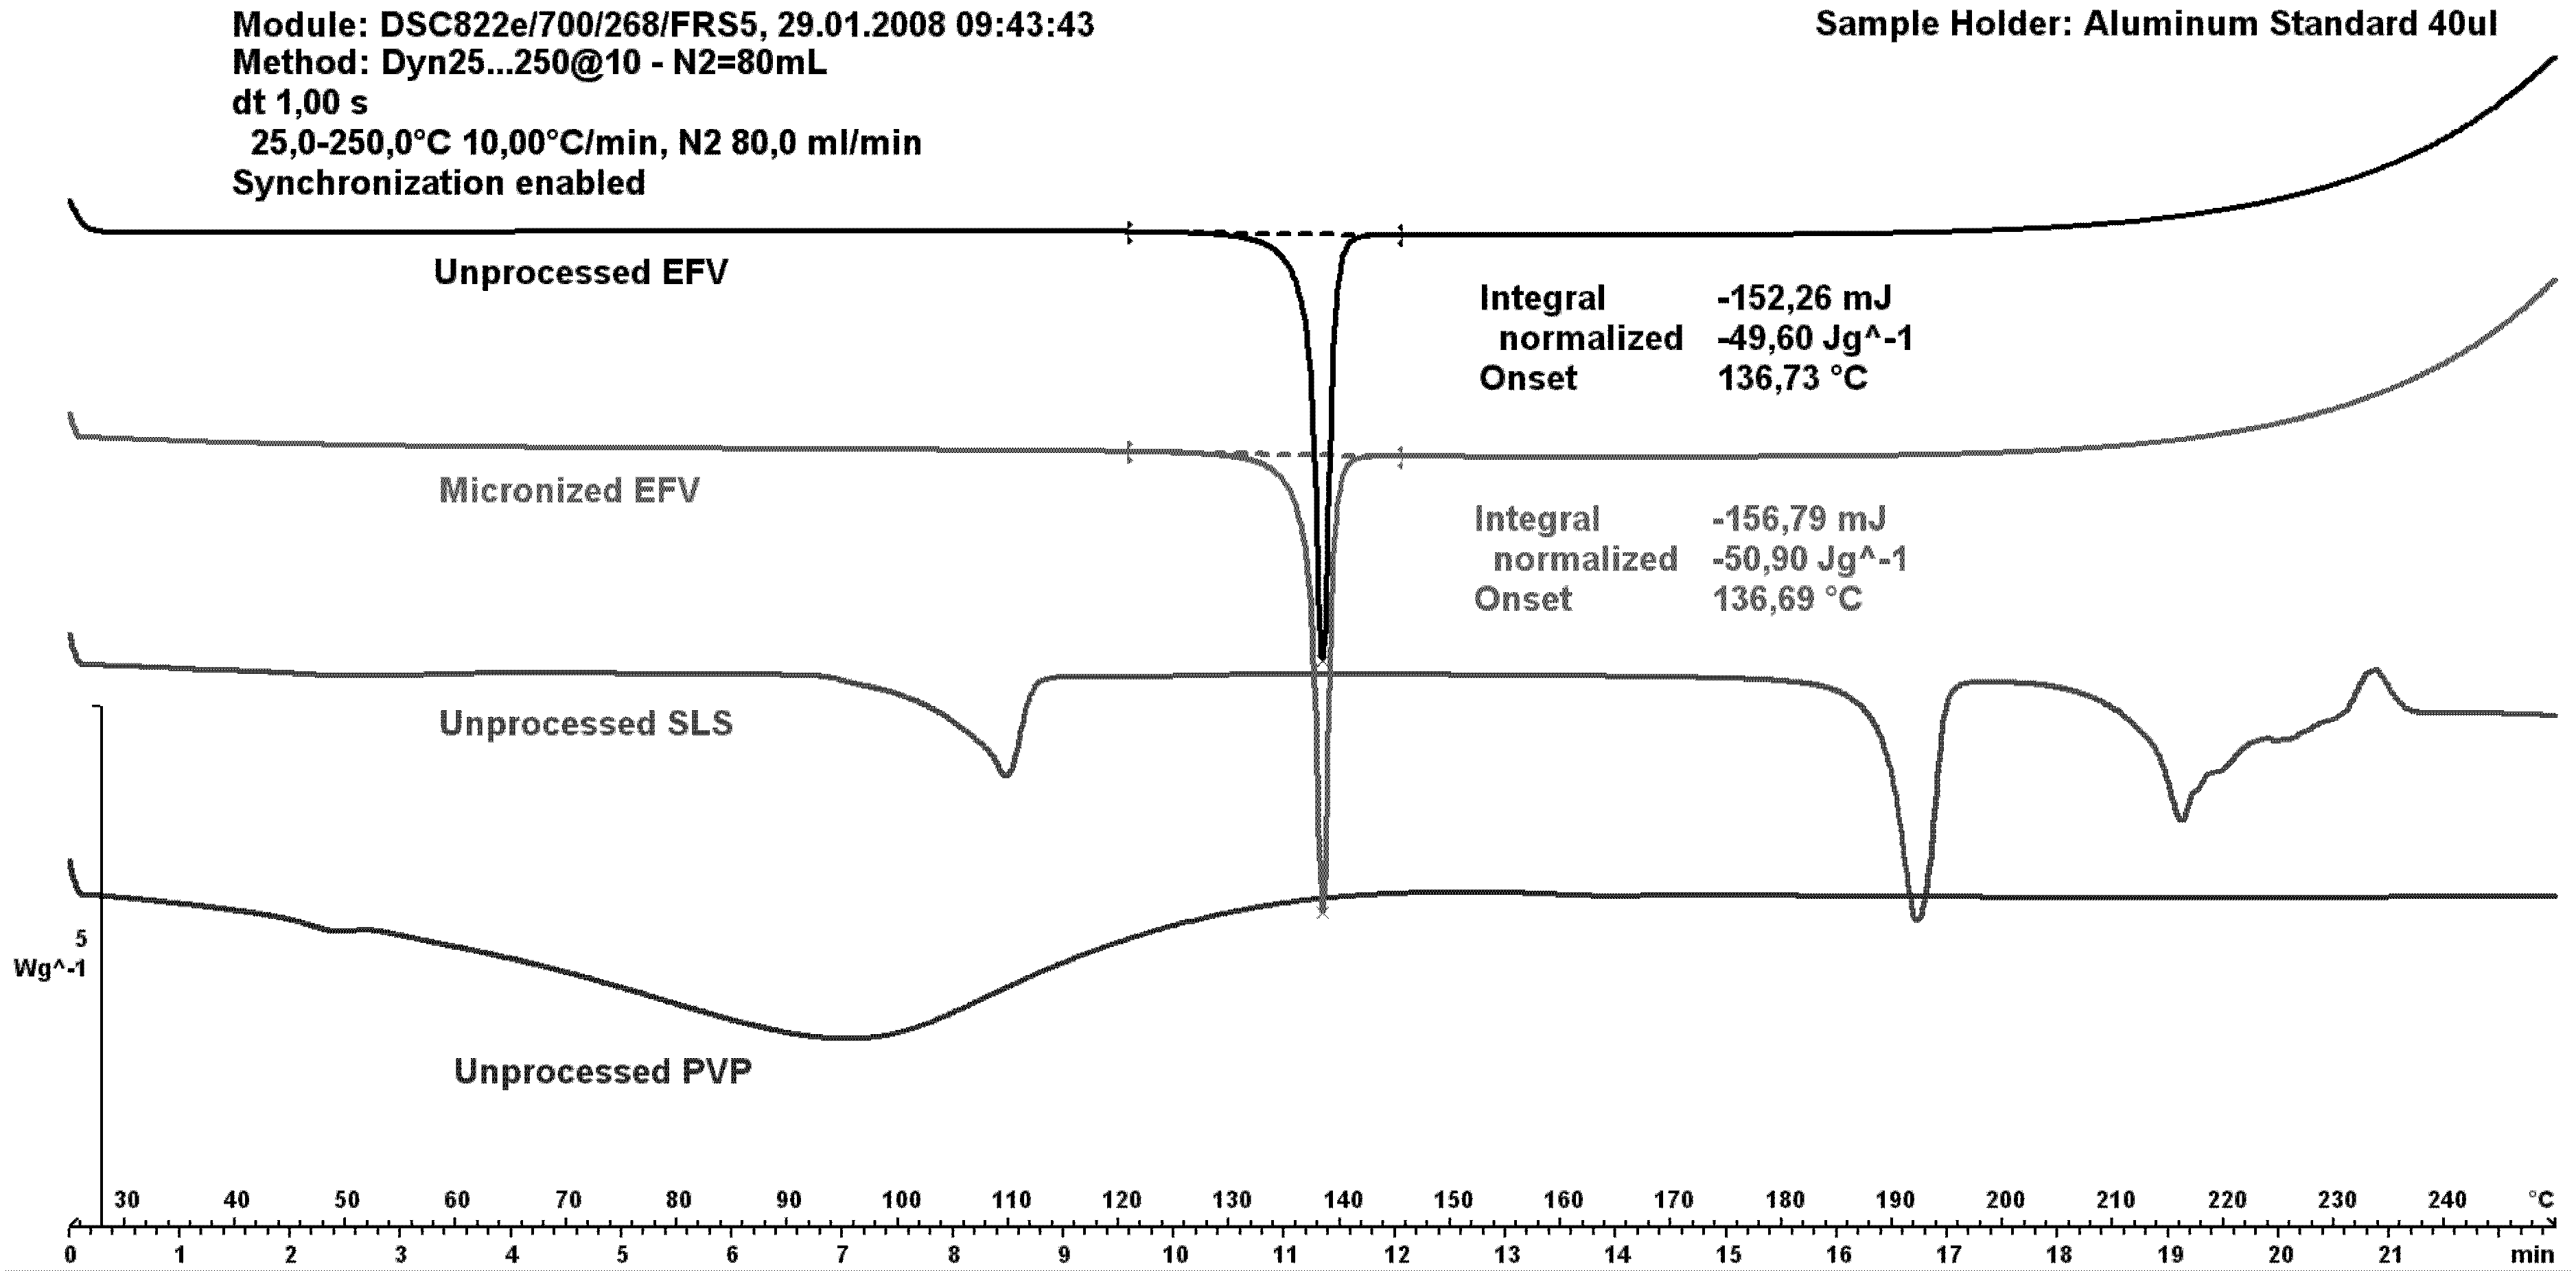
Figure 6 shows differential scanning calorimetry (DSC) curves of unprocessed excipients as well as both unprocessed and micronized efavirenz. The efavirenz endothermic peak was observed at 137 °C, similar to the peak value reported in the literature [
4]. These authors attributed the temperature range of 135.27–139.79 °C to the melting of efavirenz.
The peak for the micronized drug was similar to that of the unprocessed drug; indicating maintenance of crystallinity after micronization without hydrophilic carriers. The SLS curve depicts a first event; probably due to water loss; and a second attributed to melting point. The PVP showed no events given its amorphous nature.
The carriers micronized separately were analyzed (data not shown), demonstrating that size reduction of SLS resulted in faster water loss (the corresponding peak was displaced to a lower temperature). Micronization for PVP resulted in slower water loss.
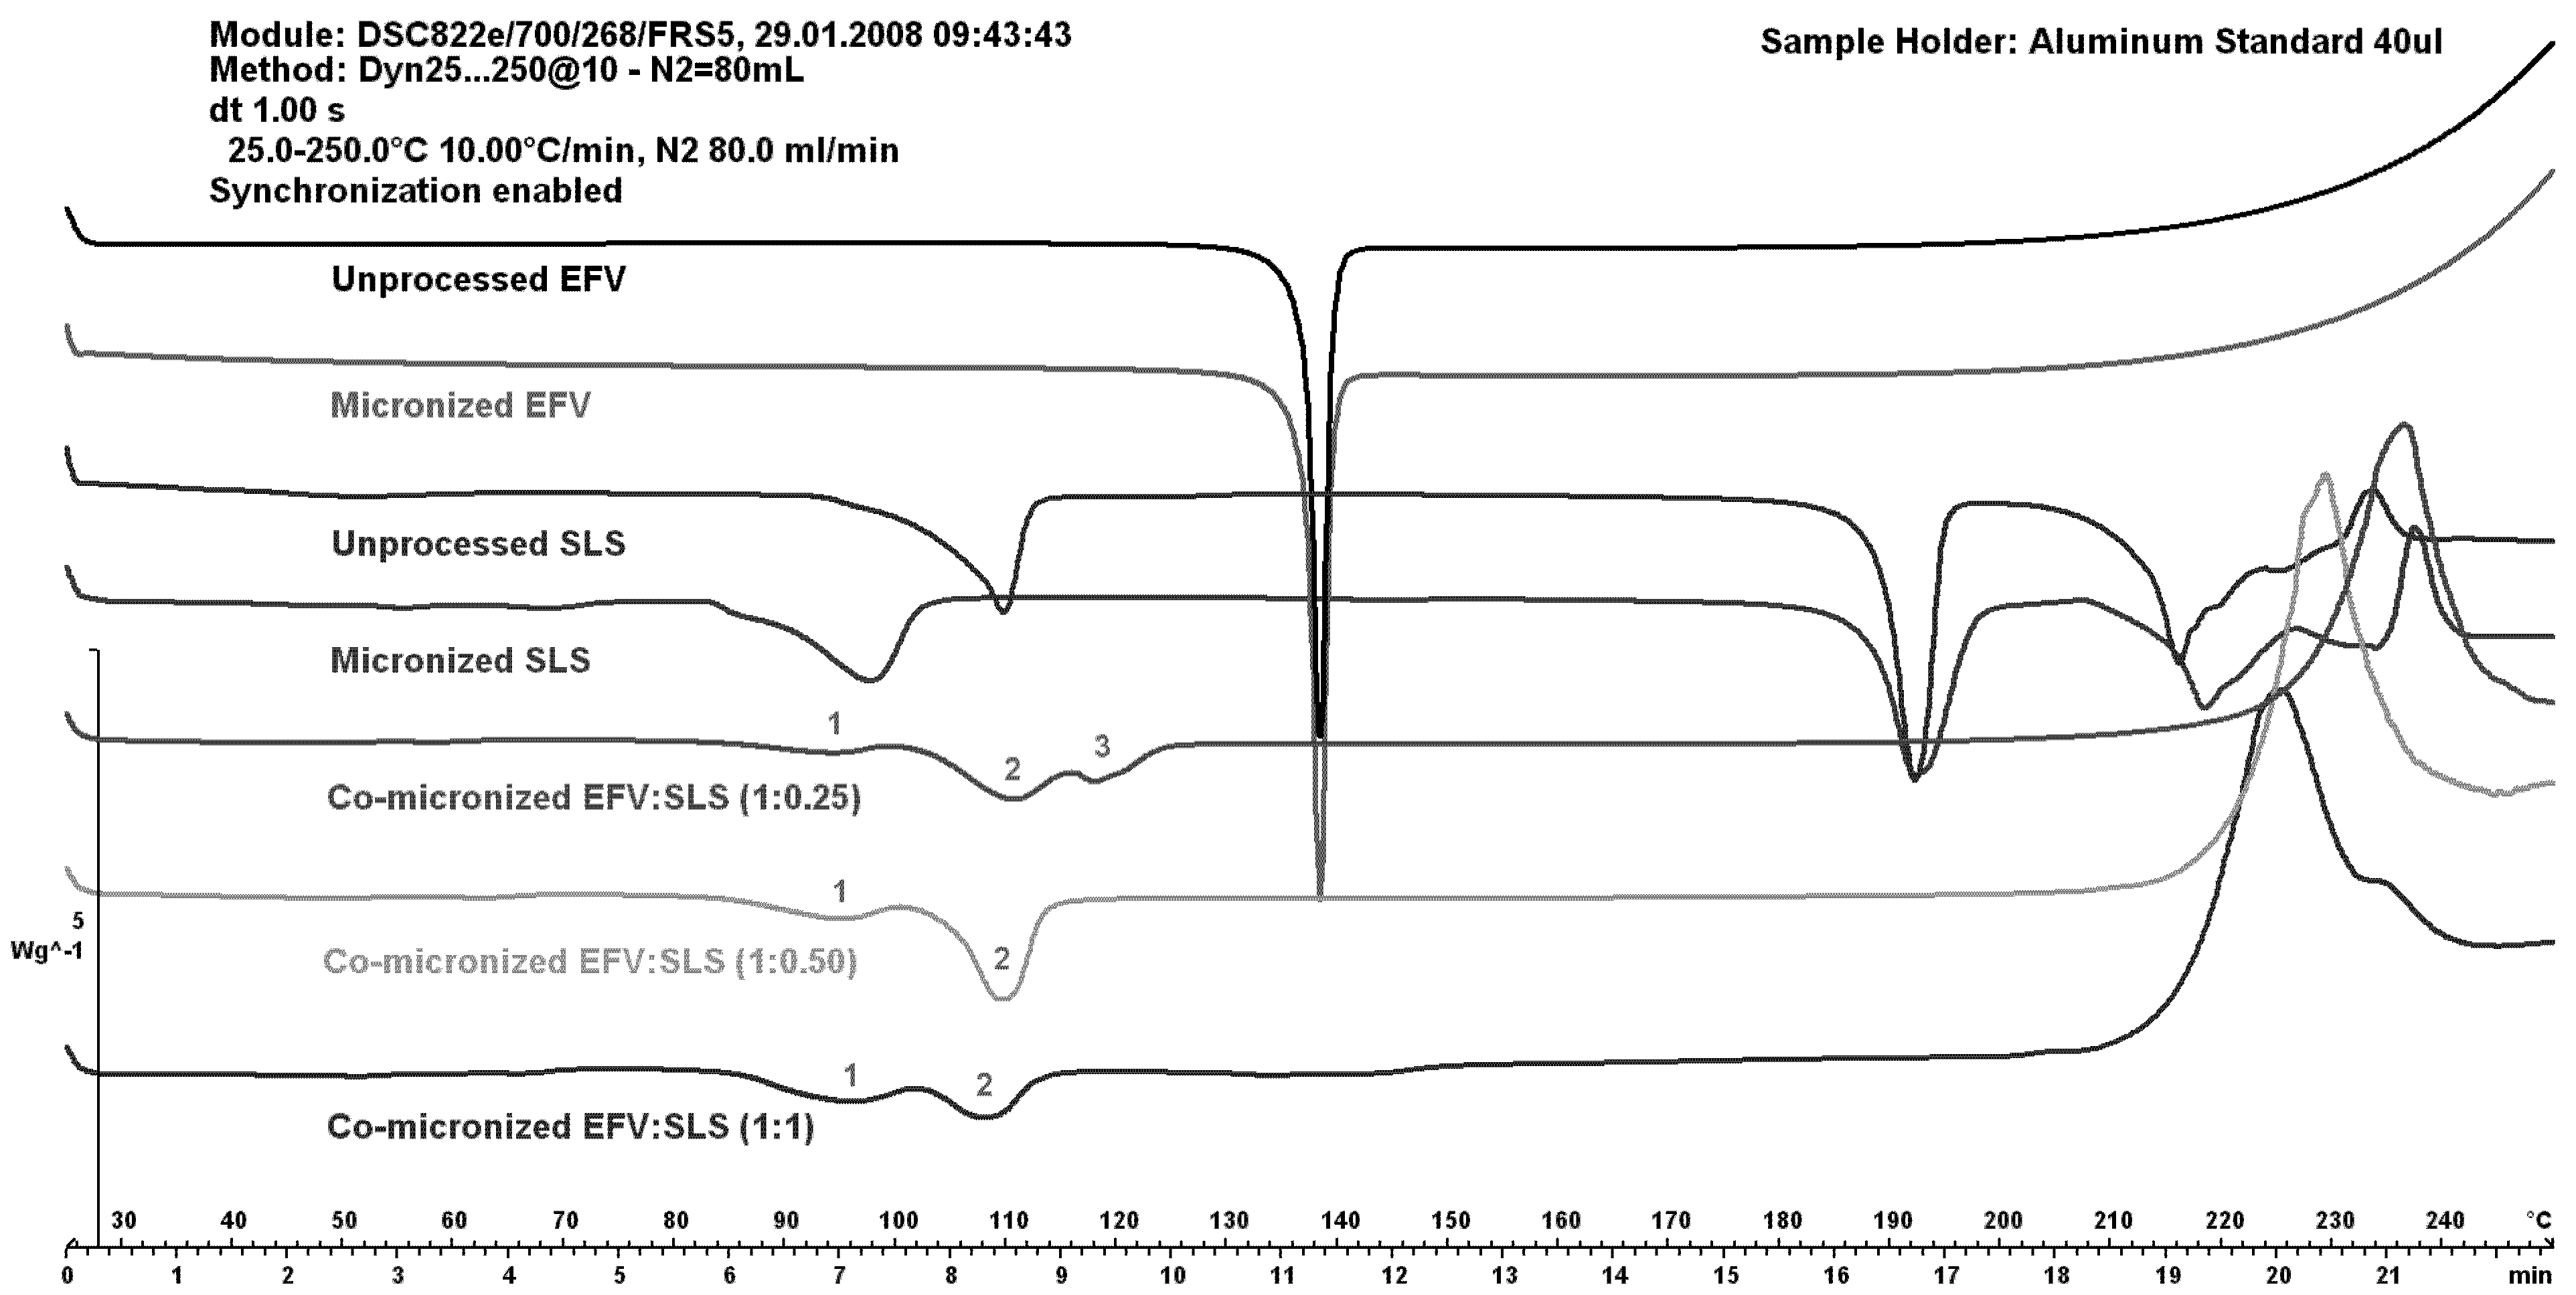
Figure 7 shows DSC curves of EFV:SLS co-micronized mixtures (1:0.25), (1:0.50) and (1:1) compared to both unprocessed and micronized EFV and SLS.
The peaks of SLS (1 and 2) increased with increasing SLS concentration in the co-micronized mixture. The peak of the proportion (1:0.50) was higher than for the proportion (1:1), probably due to homogeneity. The peak corresponding to the melting point of EFV (3) was higher with increased amount of drug in the mixture. These results may indicate interaction between components. The profile of physical mixtures was similar to that of co-processed materials, indicating no influence of the process.
Figure 6.
Differential scanning calorimetry (DSC) curves of unprocessed efavirenz, micronized efavirenz, unprocessed SLS and unprocessed PVP.
Figure 6.
Differential scanning calorimetry (DSC) curves of unprocessed efavirenz, micronized efavirenz, unprocessed SLS and unprocessed PVP.
Figure 7.
DSC curves of unprocessed and micronized efavirenz and SLS, compared to mixtures co-micronized at the proportions (1:0.25), (1:0.50) and (1:1).
Figure 7.
DSC curves of unprocessed and micronized efavirenz and SLS, compared to mixtures co-micronized at the proportions (1:0.25), (1:0.50) and (1:1).
Using PVP as the carrier for micronization, the peak for EFV melting almost disappeared at all proportions tested. On DSC curves of the physical mixture (data not shown), in contrast to that shown in co-micronized mixtures, the peak decreased with decreasing drug concentration in the mixture, and water loss of PVP was observed.
The DSC curves of unprocessed and micronized EFV and PVP are shown in comparison to co-micronized mixtures at (1:0.25), (1:0.50) and (1:1) in
Figure 8.
Figure 8.
DSC curves of unprocessed and micronized efavirenz and PVP, compared to the co-micronized mixture proportions of (1:0.25), (1:0.50) and (1:1).
Figure 8.
DSC curves of unprocessed and micronized efavirenz and PVP, compared to the co-micronized mixture proportions of (1:0.25), (1:0.50) and (1:1).
An increase in the peak of PVP can be observed (with increasing PVP concentration), and disappearance of the drug peak, which could indicate some interaction between components caused by processing. This was significantly different to the result obtained with SLS as the carrier.
Comparing DSC curves of EFV:SLS and EFV:PVP in different proportions, it could be inferred that there was an interaction between the drug and the carriers during heating, based on the changes seen in the peaks compared to the unprocessed drug. This possible interaction can occur from temperatures of around 80 °C. Interaction may occur in the form of partial amorphization, in other words, part of the drug loses crystallinity under analysis conditions (this can be refuted or confirmed by X-ray diffraction) or through the carrier interacting with the drug, possibly solubilizing EFV with analysis heating or as the system suffers degradation.
2.5. Hot-Stage Microscopy (HSM)
Figure 10 and
Figure 11 show the results from co-micronized samples (1:0.25) of EFV:SLS and EFV:PVP, respectively.
Figure 10.
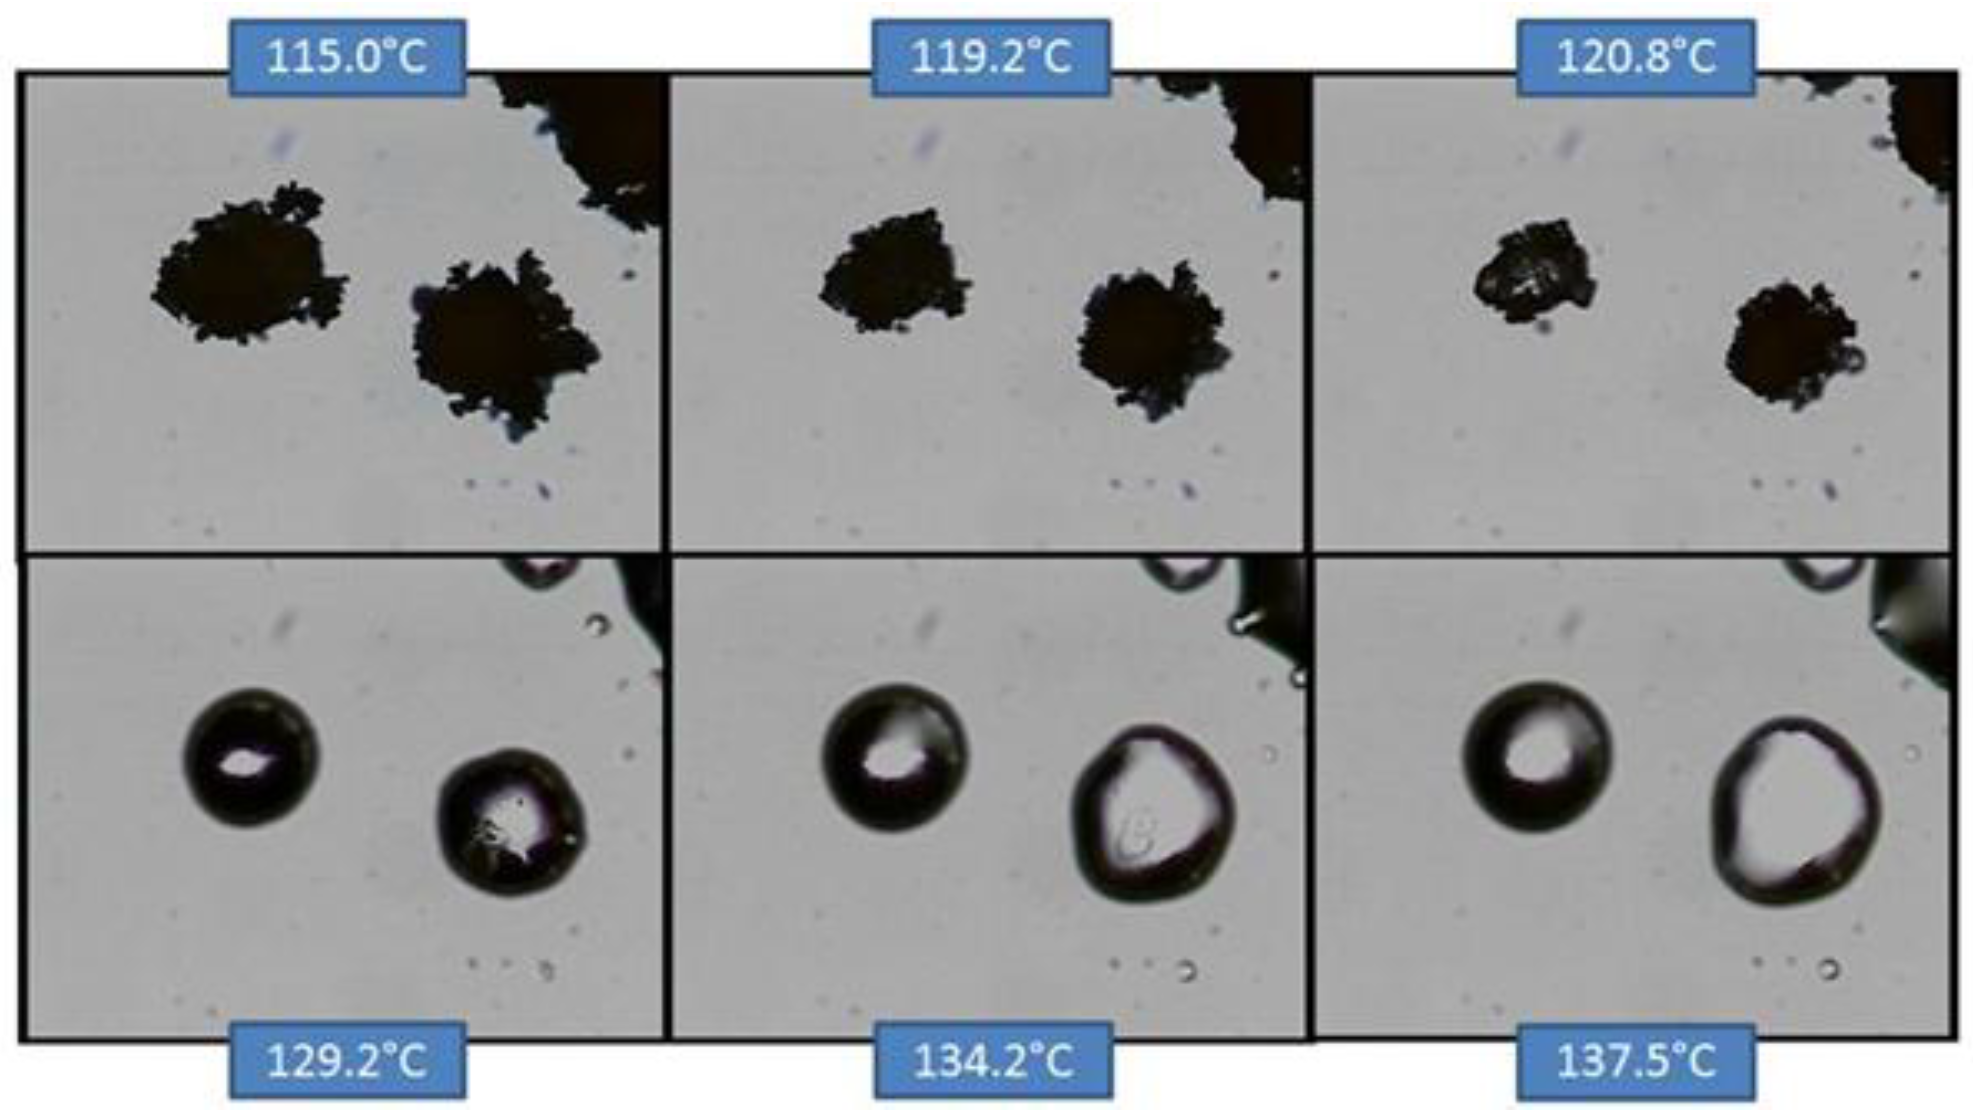
Hot-stage microscopy (HSM) of co-micronized EFV:SLS (1:0.25).
Figure 10.
Hot-stage microscopy (HSM) of co-micronized EFV:SLS (1:0.25).
In co-micronized samples with SLS, it was not possible to observe the water loss detected by TGA, since the percentage of solvent was too small. However, it was possible to detect the SLS melting point and the formation of a solution with EFV microcrystals. With continuous heating, EFV melting was evident. The temperatures seen are consistent with the transitions observed in the DSC analysis. The profiles were similar for the three proportions tested. The sequence of transitions confirms the hypothesis previously suggested by DSC.
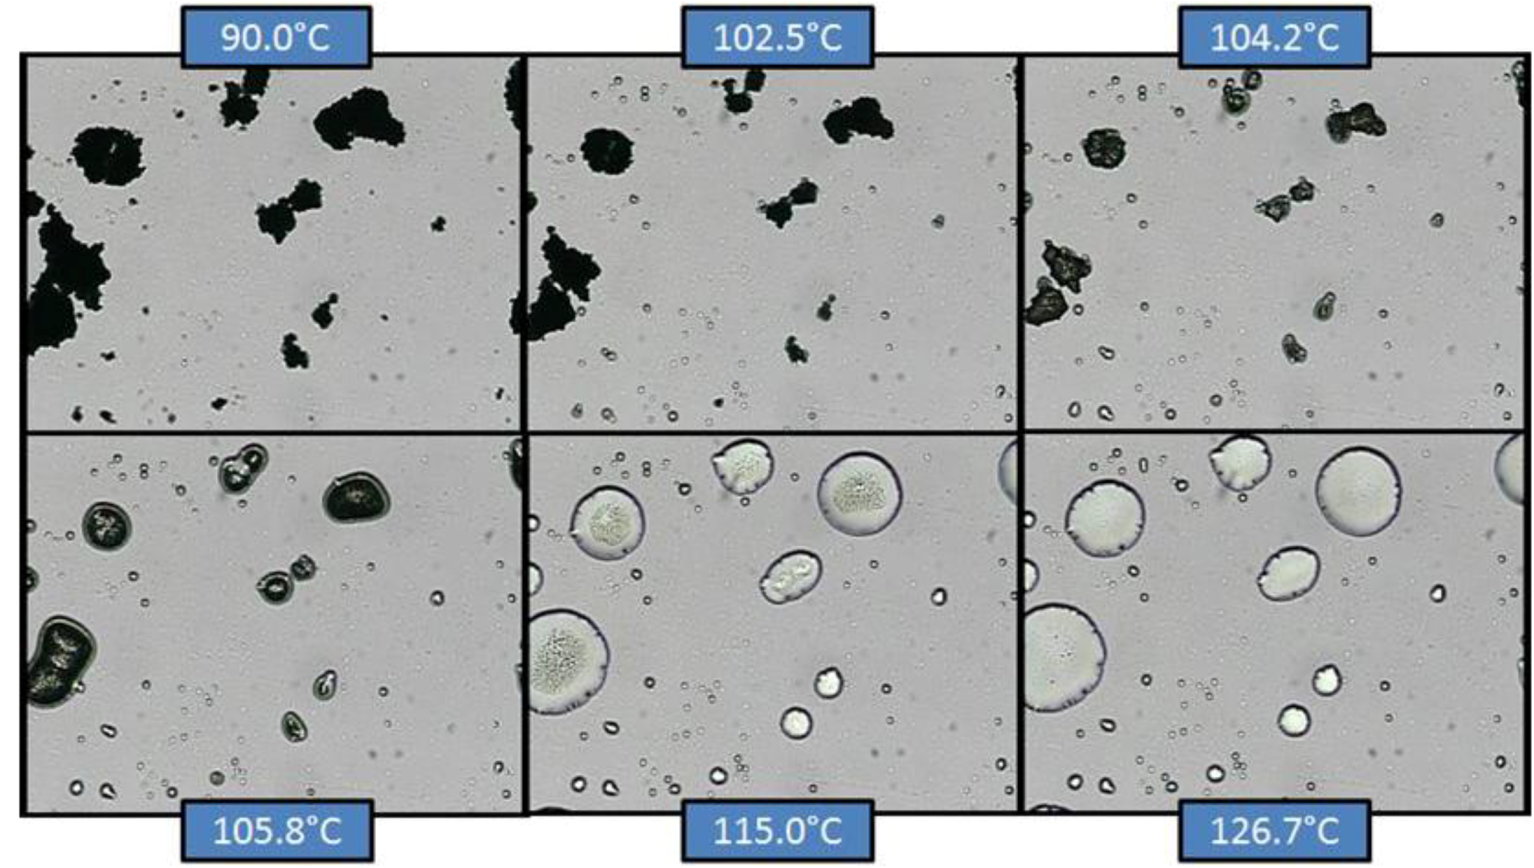
Figure 11.
HSM of co-micronized EFV:PVP (1:0.25).
Figure 11.
HSM of co-micronized EFV:PVP (1:0.25).
In the case of co-micronized samples with PVP, the three profiles were very similar, and it was not possible to identify any influence of PVP concentration. Unlike the situation with SLS, EFV melting can be seen concomitantly with PVP solubilization, and this dissolves the EFV crystals before they melt. This profile confirms those observed in the DSC curves, where it was not possible to observe the peak corresponding to EFV melting.
Thus, hot-stage microscopy proved to be a useful tool for the elucidation of DSC results, allowing visual observation of thermal behavior of the samples. This analytical tool has been used in the study and characterization of crystalline drugs, but its use for the evaluation of co-micronized systems was not found in the literature. In this study, the technique contributed significantly to help compare samples, confirming the hypothesis drawn from the evaluation of data derived from DSC analysis.
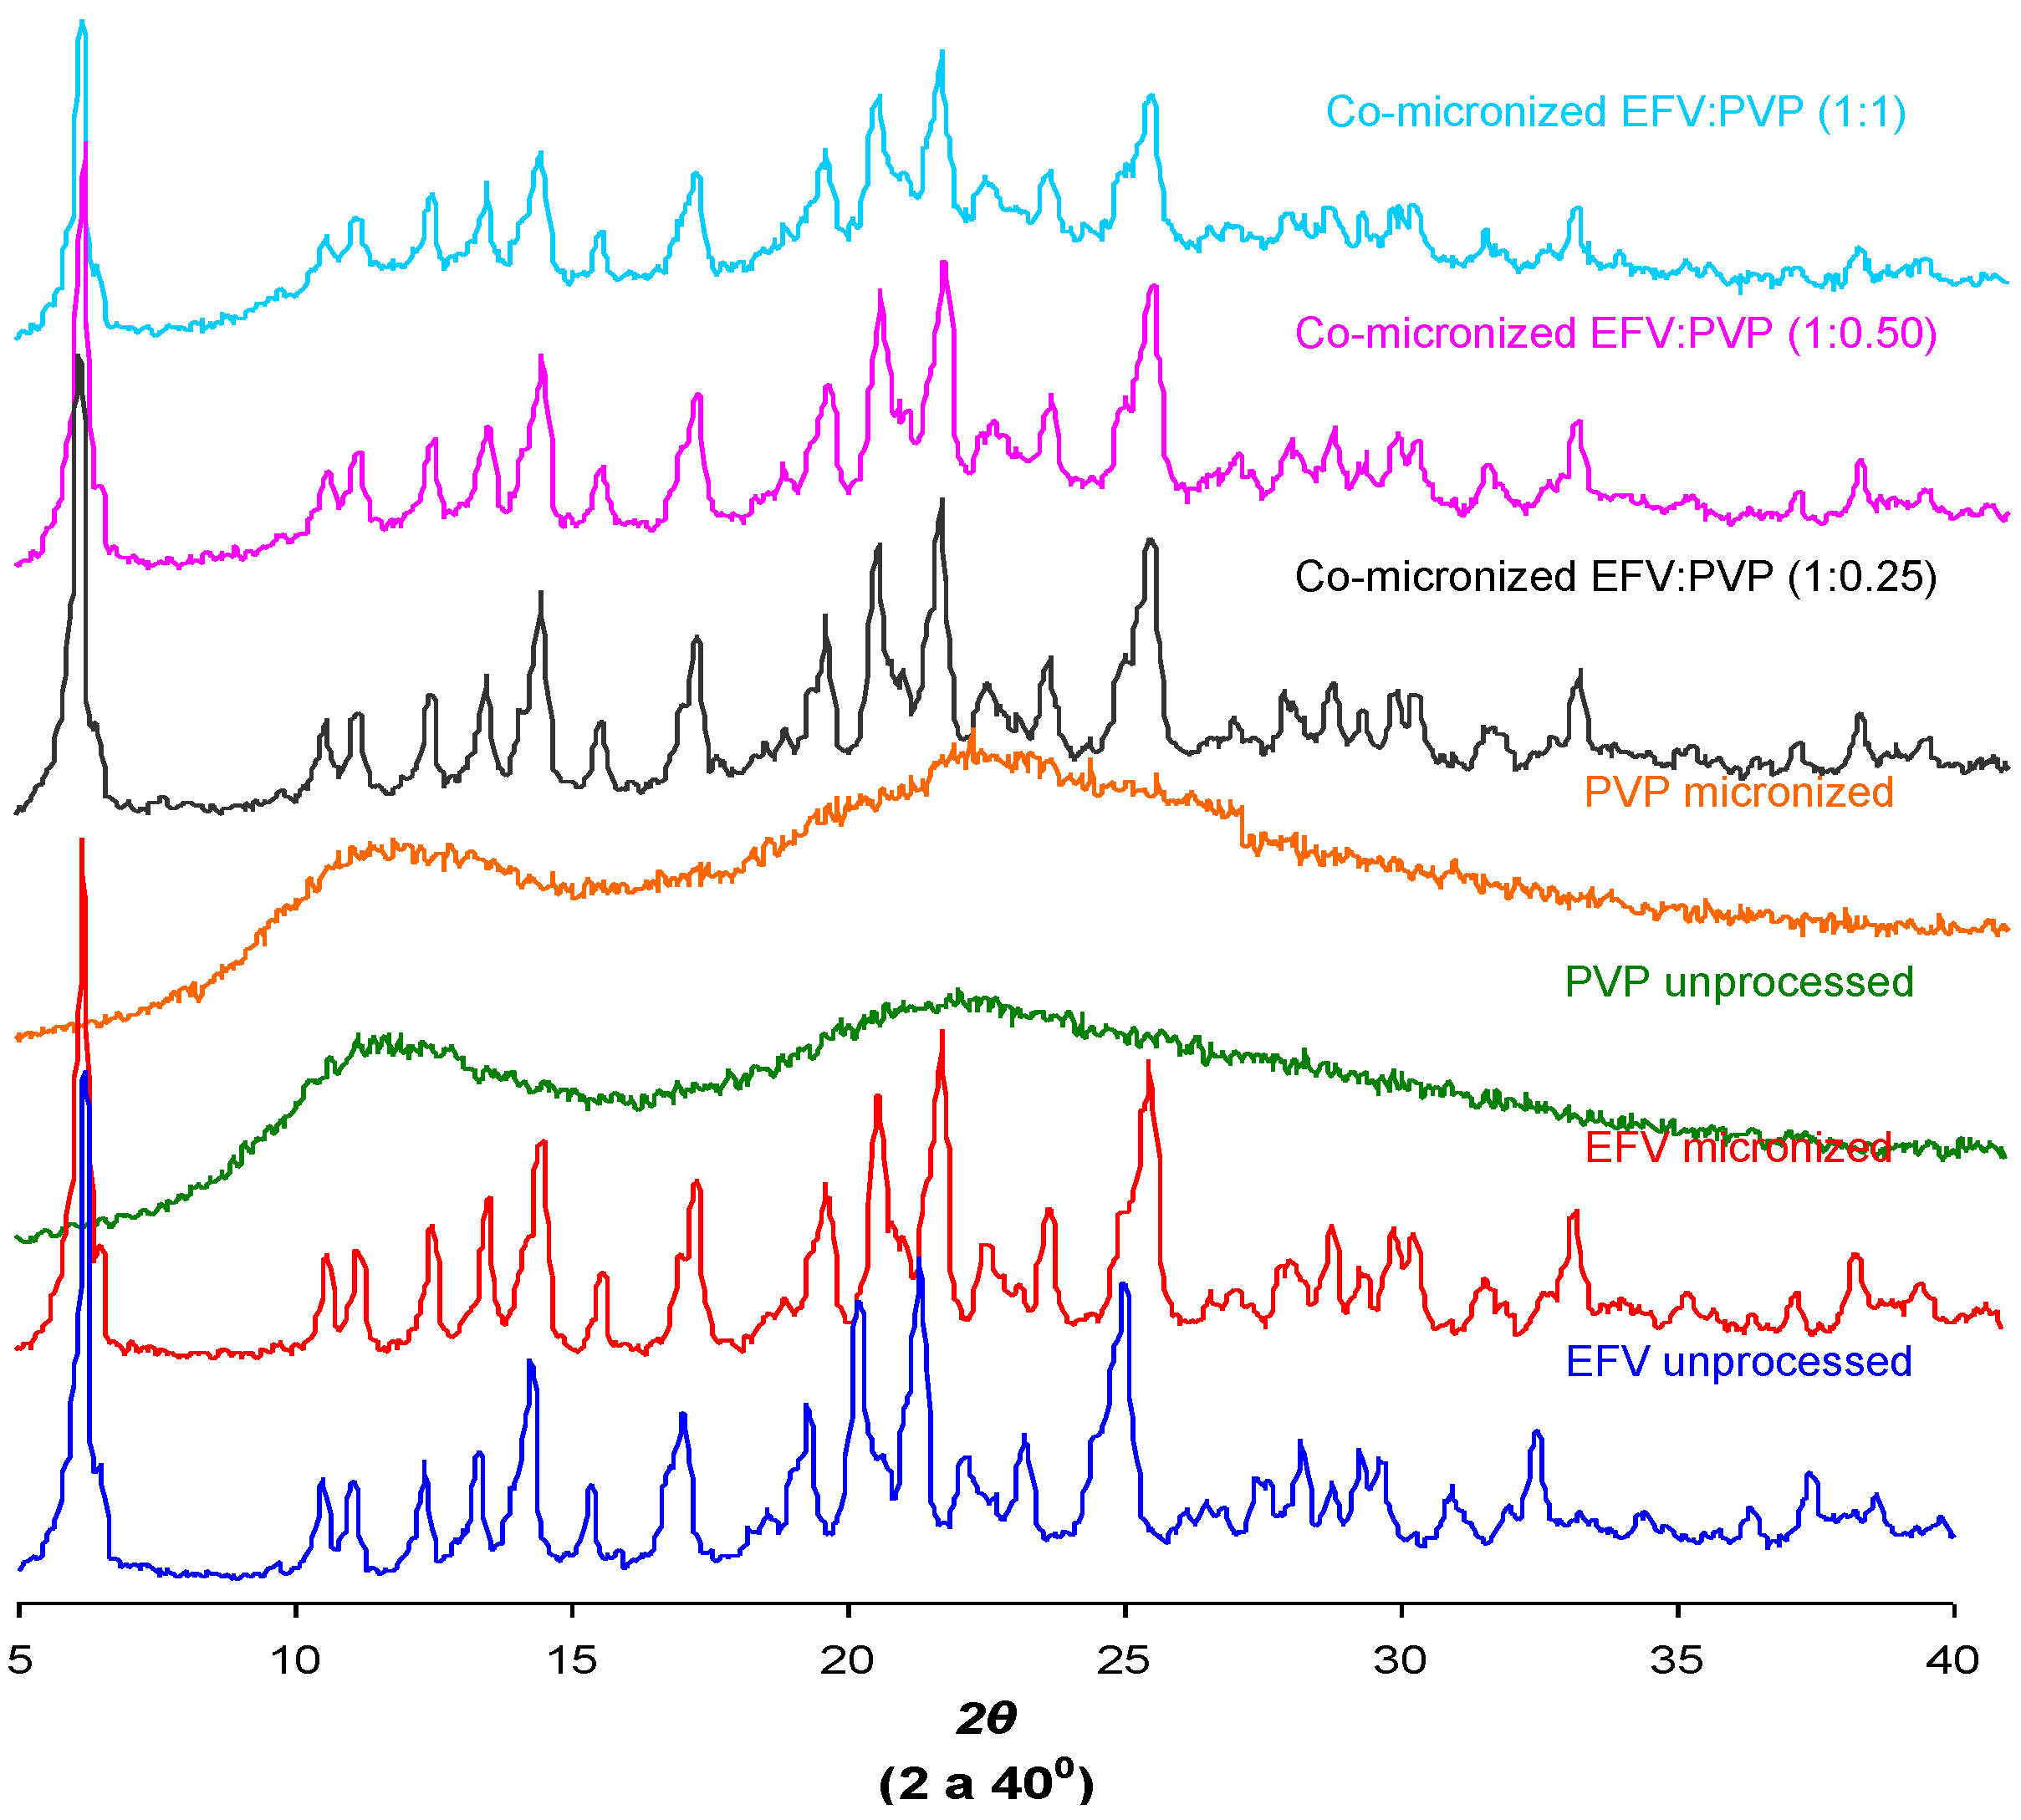
2.6. Powder X-ray Diffraction (DRX)
The crystal structure of a substance is an important characteristic that can influence solubility [
29]. The X-ray diffraction patterns found for unprocessed EFV and excipients, processed excipients alone and co-processed systems are depicted in
Figure 12.
Peak intensity is affected by crystal size and crystallinity [
30]. The peak intensity of the diffraction patterns of micronized and co-processed drug would therefore be expected to be lower than the pure drug or present a displacement peak due to decreasing particle size and/or amorphization.
The diffraction patterns obtained for the unprocessed drug were similar to those reported in the literature [
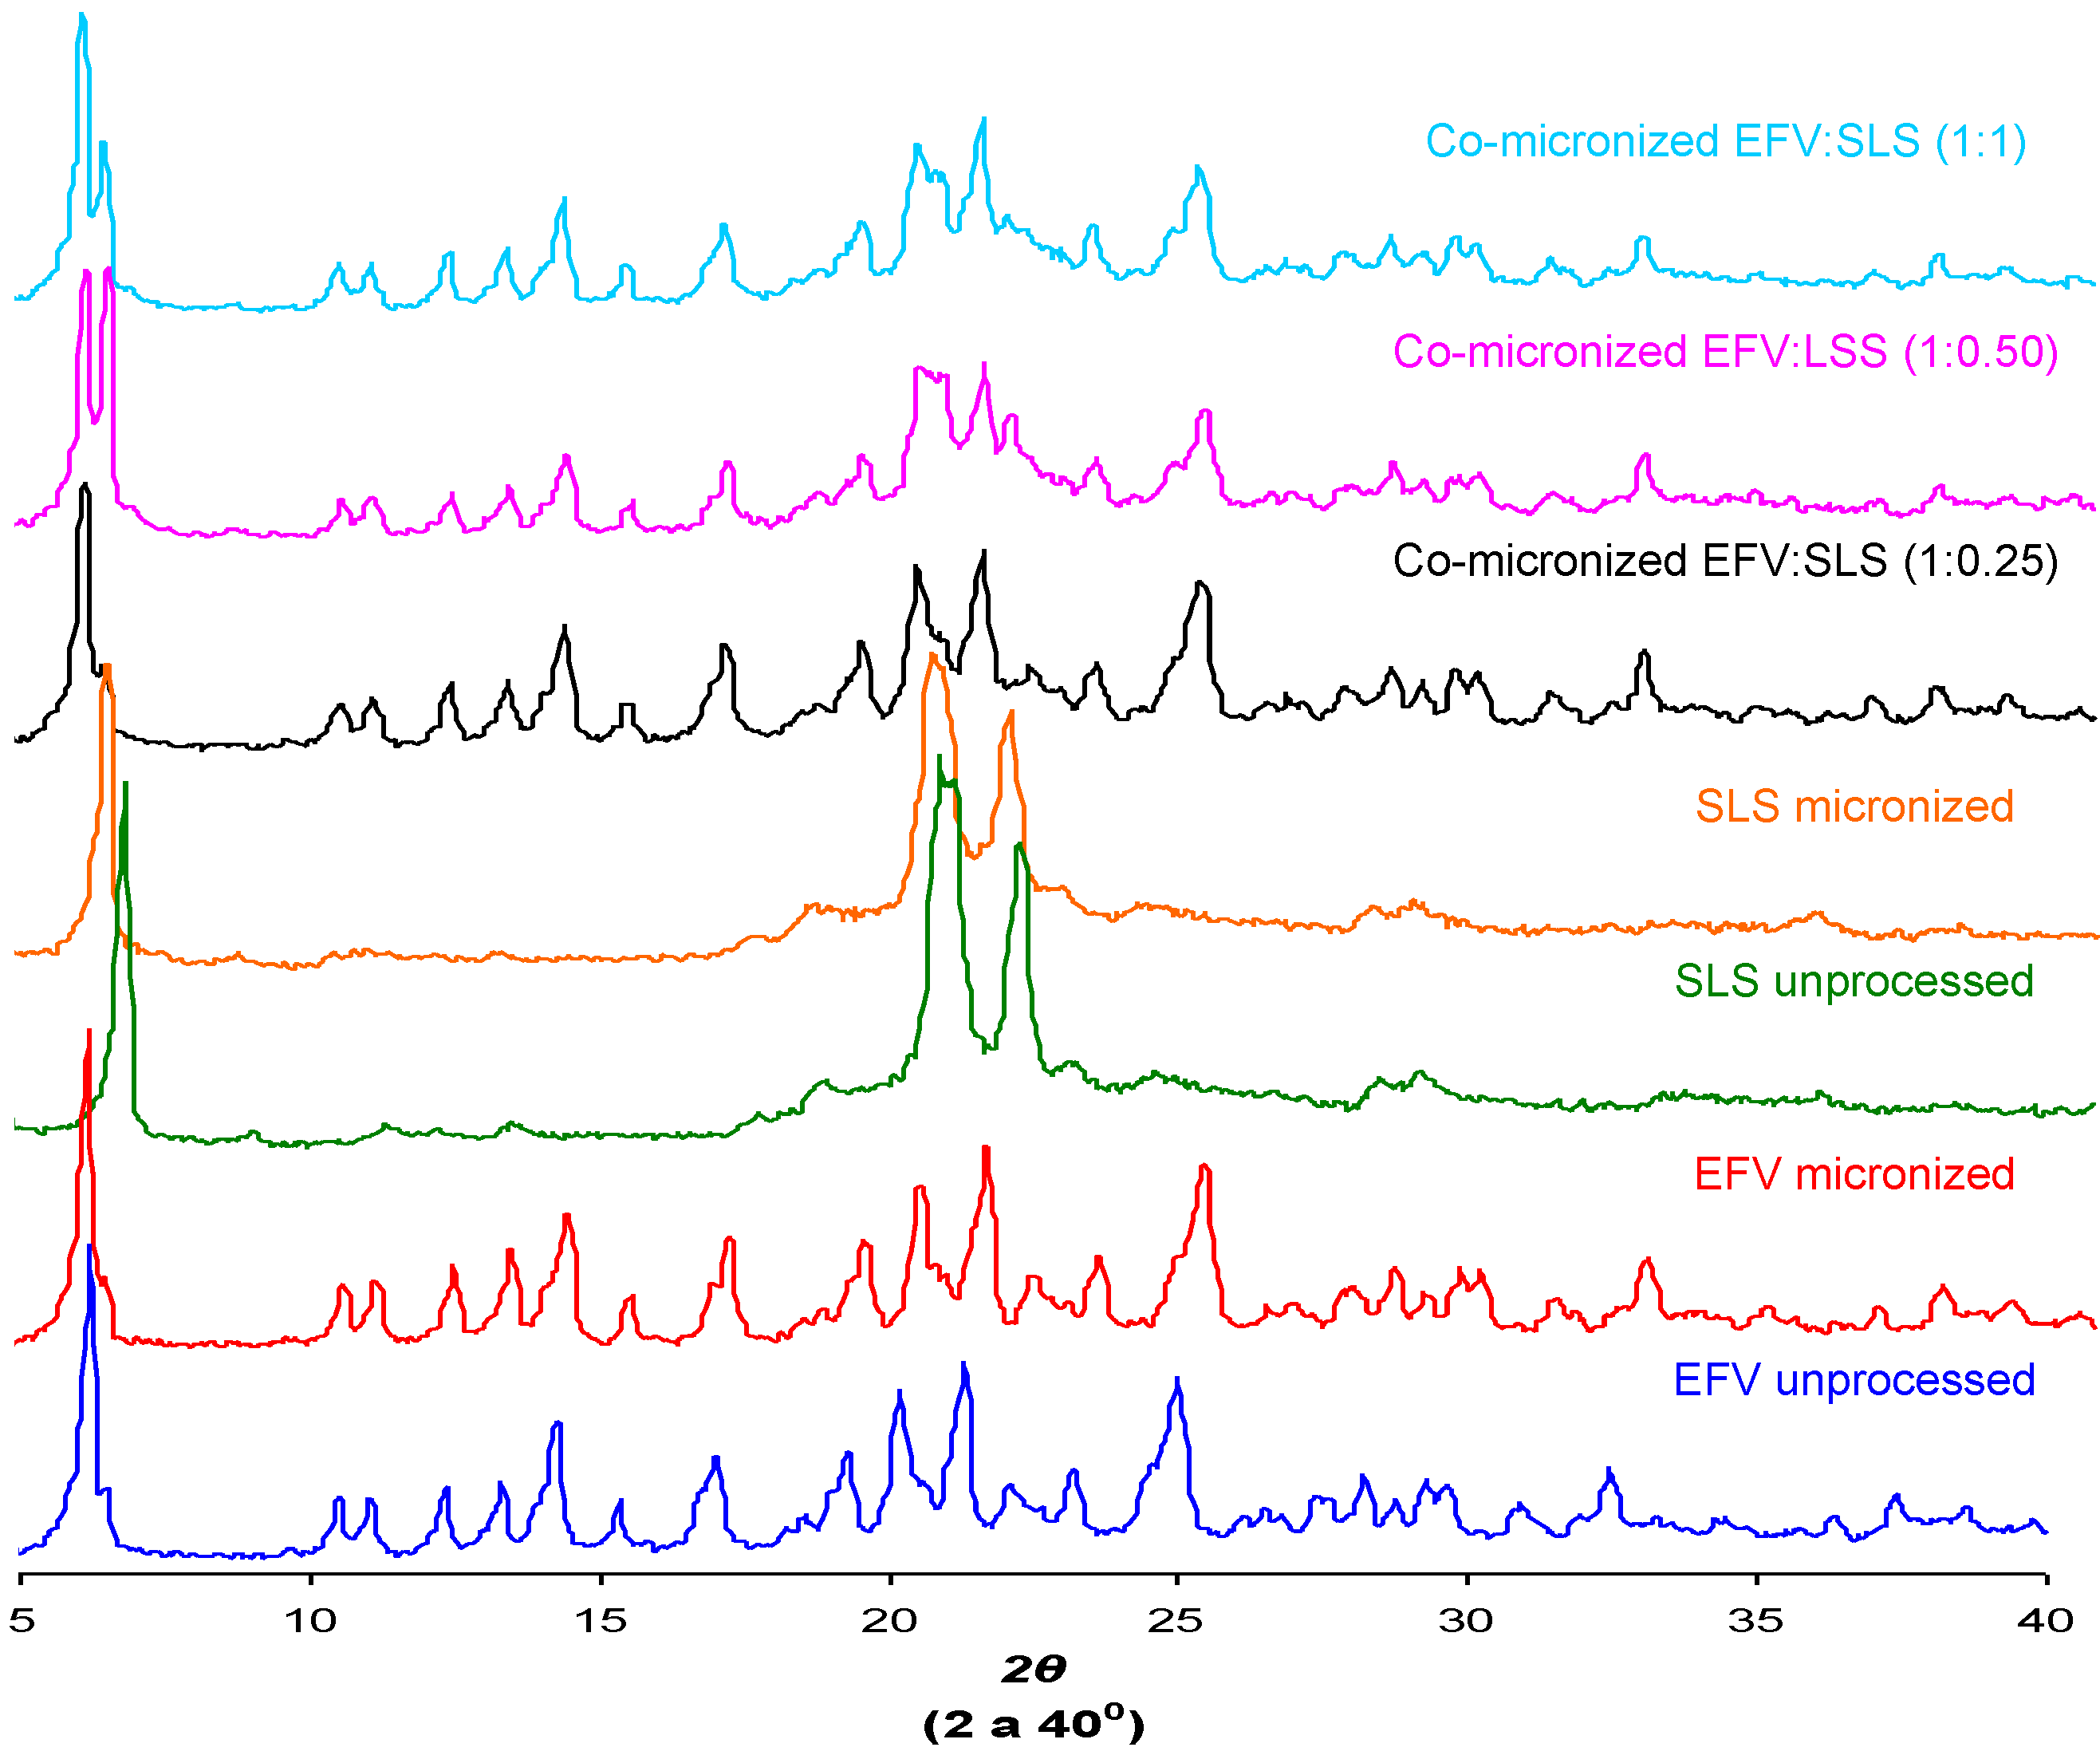
5]. The same peaks were found in diffraction patterns of micronized EFV and all co-processed samples, identifying the principal diffraction angles (2θ) as 6.20°, 20.20°, 21.35° and 25.00°.
Figure 12 and
Figure 13 show the X-ray diffraction patterns obtained for co-micronized mixtures with SLS and PVP, in comparison with the unprocessed and micronized drug and the carrier. The mean peaks found in unprocessed EFV can also be seen in the diffraction patterns of the co-processed mixtures. In conjunction with these peaks, the main peaks obtained for SLS, 6.85°, 20.55° and 21.90° are evident, while PVP shows no peak on the X-ray diffraction analyses because of its amorphous nature.
Figure 12.
X-ray diffraction patterns of unprocessed and micronized EFV and SLS, compared to co-micronized EFV:SLS mixtures at the proportions (1:0.25), (1:0.50) and (1:1).
Figure 12.
X-ray diffraction patterns of unprocessed and micronized EFV and SLS, compared to co-micronized EFV:SLS mixtures at the proportions (1:0.25), (1:0.50) and (1:1).
Figure 13.
X-ray diffraction patterns of unprocessed and micronized EFV and PVP, compared to co-micronized mixtures of EFV:PVP in the proportions (1:0.25), (1:0.50) and (1:1).
Figure 13.
X-ray diffraction patterns of unprocessed and micronized EFV and PVP, compared to co-micronized mixtures of EFV:PVP in the proportions (1:0.25), (1:0.50) and (1:1).
Only the characteristic peaks of each component could be identified in diffraction patterns of co-processed mixtures, and there were no significant changes in peak intensity and/or position compared to those of unprocessed EFV and excipients for all proportions tested. This result indicates the maintenance of the crystal habit of the substances, which does not confirm the amorphization disclosed by thermal analysis results. Thus, this phenomenon may have occurred due to heating during DSC analysis, as amorphization does not occur at room temperature and/or as a result of the process. The characteristic peaks of drug and carriers in the diffraction patterns of the co-processed mixtures also indicates that there was no degradation of the mixture as a result of processing, since it occurs when the peaks are not evident in the analysis. Thus, the possibility of degradation due to reduction and disappearance of peaks in DSC results was also not confirmed.
Previous results obtained in studies with fenofibrate [
7], glybuzole [
31], carbamazepine [
27] and EMD 57033 [
32], that used micronization, also showed that maintenance of a crystal structure after processing, akin to the EFV in the present study.
The co-micronization process is rarely described in the literature. The dissolution improvement of poorly water-soluble drugs for co-milling with surfactants, such as SLS, was also investigated [
31], however, an amorphous state was generated. Although conversion to the amorphous state can significantly improve solubility and dissolution, this state can revert to a lower energy condition, normally crystalline forms, during storage. Unfortunately, conversion time is not easy to predict. A formulation that offers a drug with rapid dissolution, but with crystalline API form therefore represents an ideal solid dosage form for oral administration [
32].
This paper failed to observe amorphization of the drug, although an increase in dissolution was seen, as verified by Jagadish and coworkers [
33], whose study showed increased dissolution and bioavailability without amorphization, simply by enhancing the wettability of the particles.
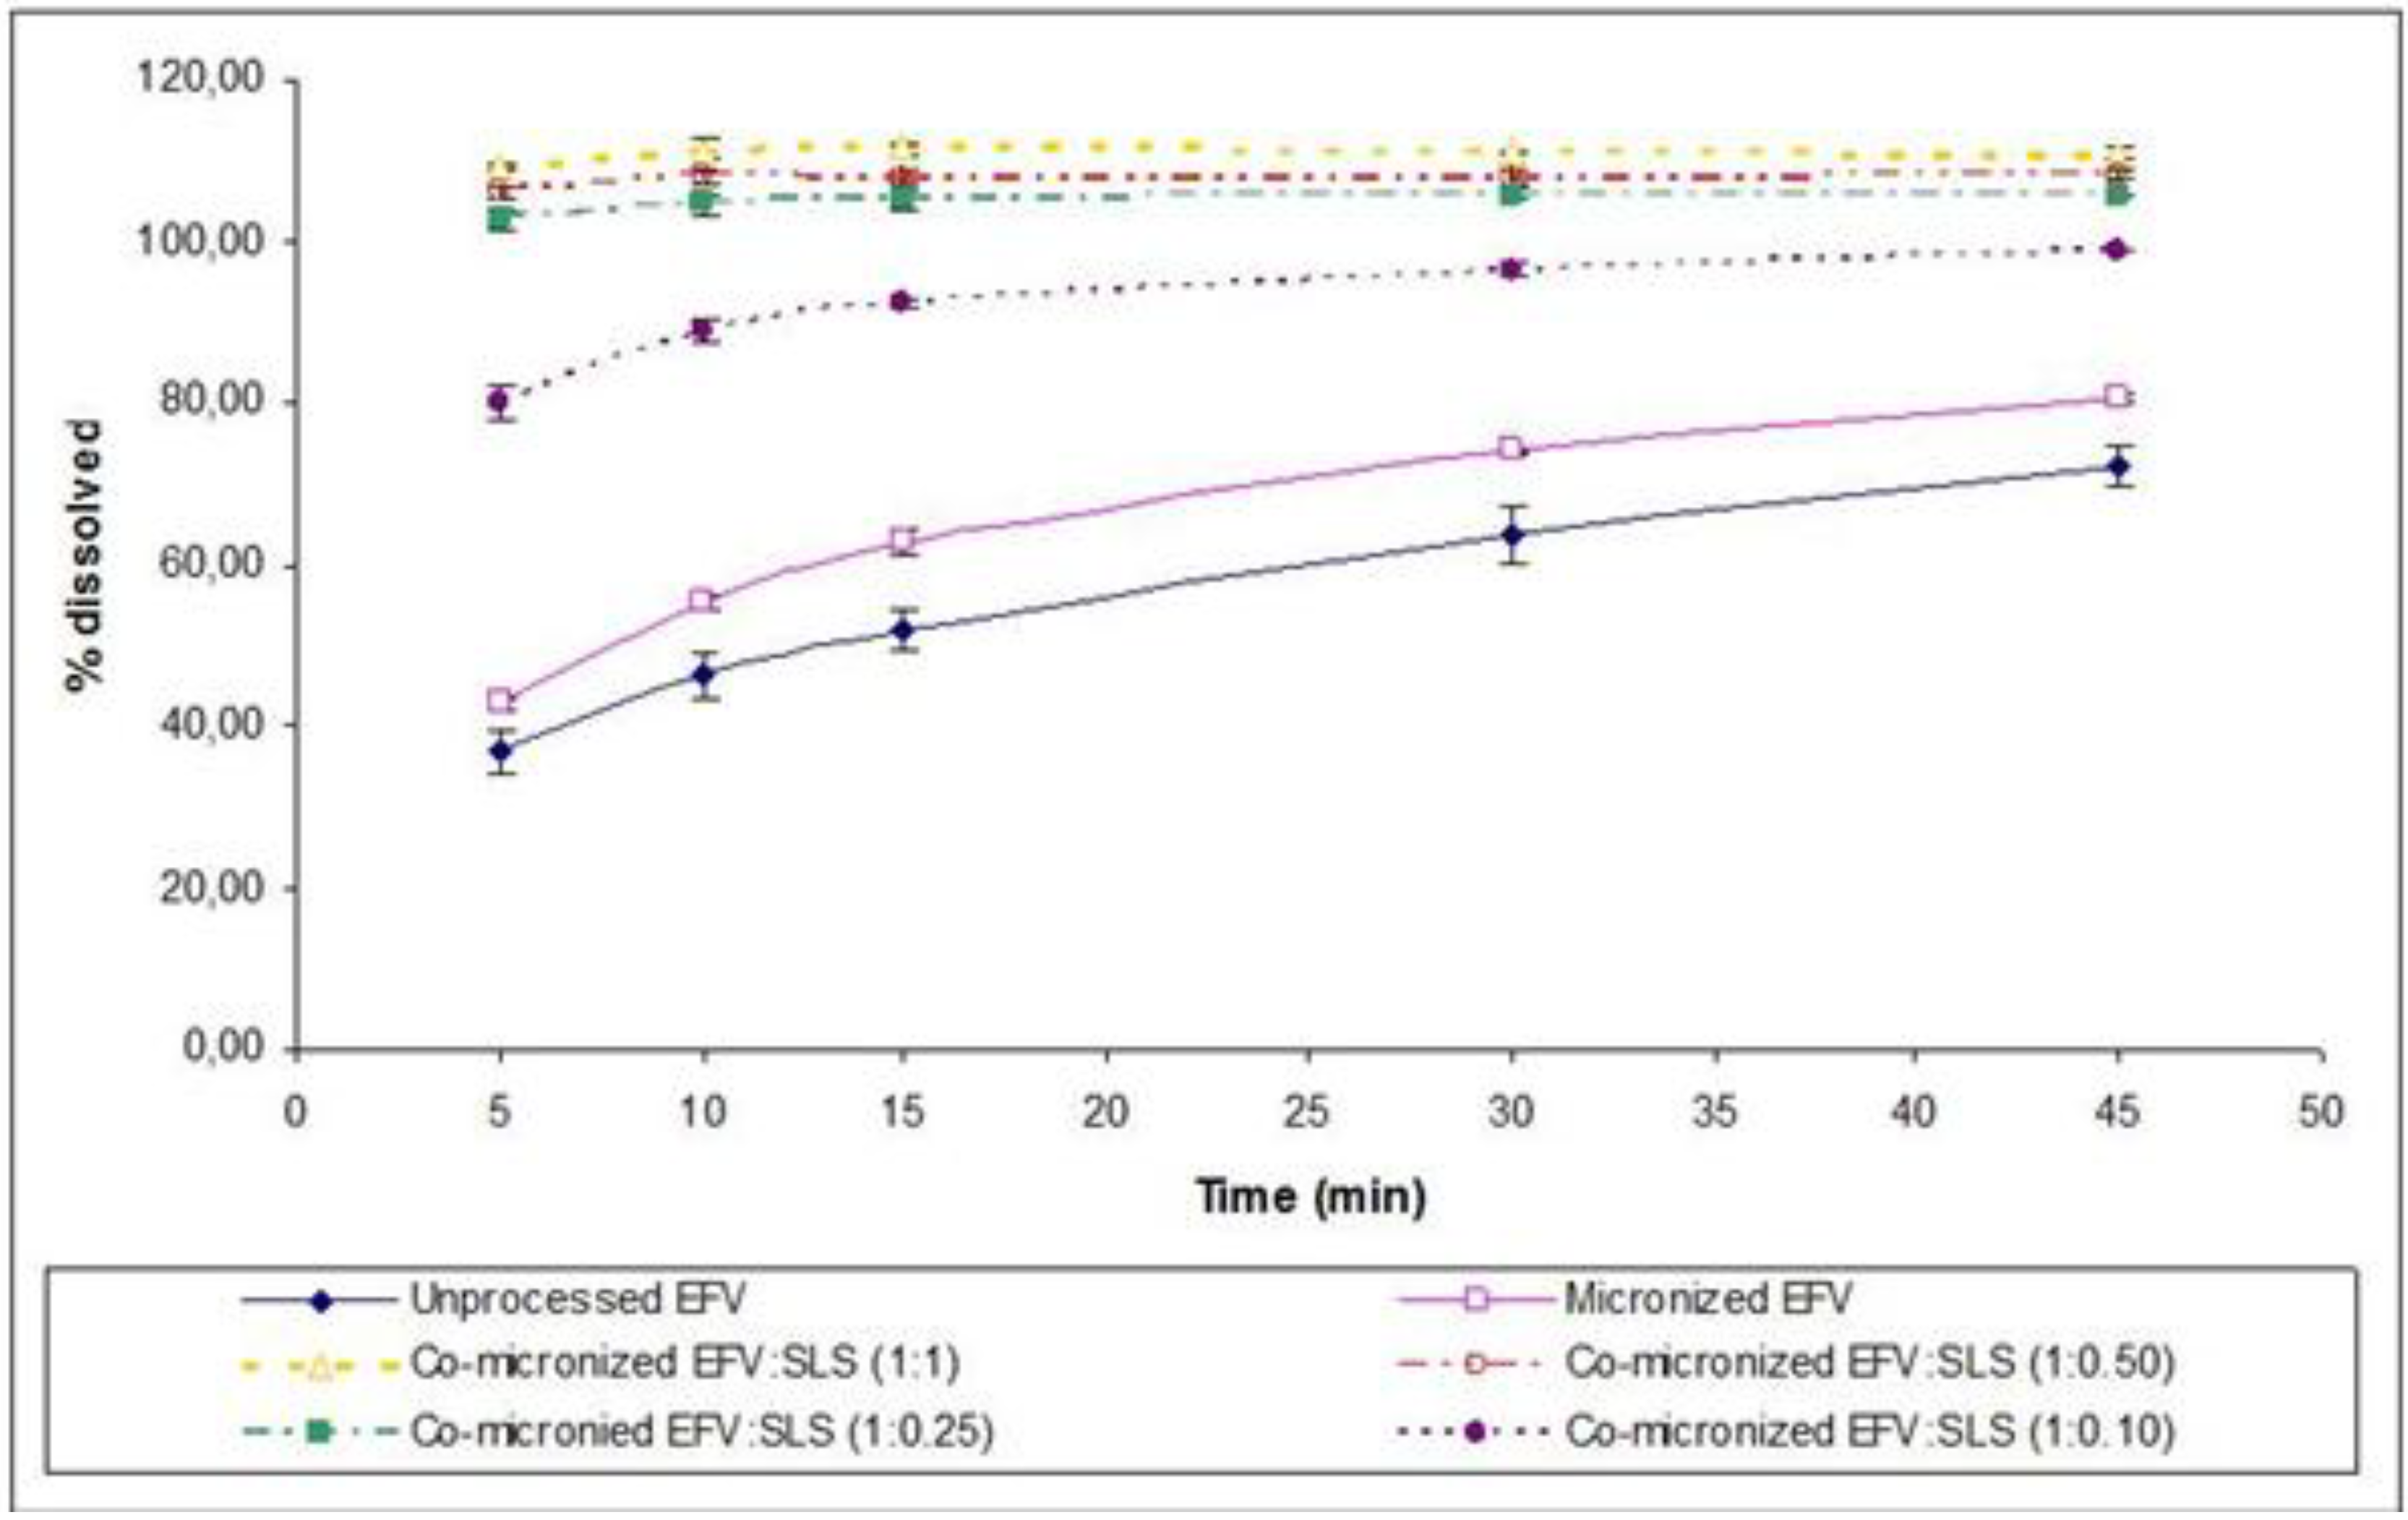
2.7. Powder Dissolution Studies
The co-micronized mixtures presented enhanced dissolution profiles in comparison with those obtained for unprocessed EFV, micronized EFV and physical mixtures, for all proportions assessed. According to the results of difference (
f1) and similarity (
f2) factors, the dissolution profile of co-micronized mixtures can be deemed significantly different to the unprocessed drug profile for all proportions tested (
Table 3). The co-micronized EFV:SLS mixtures also showed significant differences compared to physical mixtures (data not shown). This statement is based on the classification actually considered by regulatory agencies such as Food and Drug Administration (FDA) and European Medicines Agency (EMA).
Table 3.
Values of f1 and f2 found for processed samples compared to the unprocessed drug.
Table 3.
Values of f1 and f2 found for processed samples compared to the unprocessed drug.
| Processed | EFV unprocessed |
|---|
| f1 | f2 |
|---|
| EFV micronized | 16.45 | 51.98 |
| EFV:SLS (1:0.10) | 68.56 | 21.19 |
| EFV:SLS (1:0.25) | 93.45 | 14.25 |
| EFV:SLS (1:0.50) | 98.75 | 13.07 |
| EFV:SLS (1:1) | 104.56 | 11.87 |
| EFV:PVP (1:0.25) | 60.81 | 23.68 |
| EFV:PVP (1:0.50) | 56.48 | 24.64 |
| EFV: PVP (1:1) | 49.17 | 26.94 |
According to the same calculation, the three proposed major proportions showed powder dissolution profiles similar to each other (
Table 4), where proportions of EFV:SLS no higher than (1:0.25) were required for full and fast dissolution of EFV. These powder dissolution profiles are shown in
Figure 14.
Table 4.
Values of f1 and f2 found for EFV:SLS processed samples.
Table 4.
Values of f1 and f2 found for EFV:SLS processed samples.
| Processed | EFV:SLS (1:0.25) |
|---|
| f1 | f2 |
|---|
| EFV:SLS (1:0.50) | 2.74 | 75.49 |
| EFV:SLS (1:1) | 5.74 | 60.59 |
Figure 14.
Powder dissolution profile of EFV in SLS 0.5% (n=3) compared to micronized and unprocessed EFV and co-micronized EFV:SLS mixtures at the proportions (1:0.10), (1:0.25), (1:0.50) and (1:1).
Figure 14.
Powder dissolution profile of EFV in SLS 0.5% (n=3) compared to micronized and unprocessed EFV and co-micronized EFV:SLS mixtures at the proportions (1:0.10), (1:0.25), (1:0.50) and (1:1).
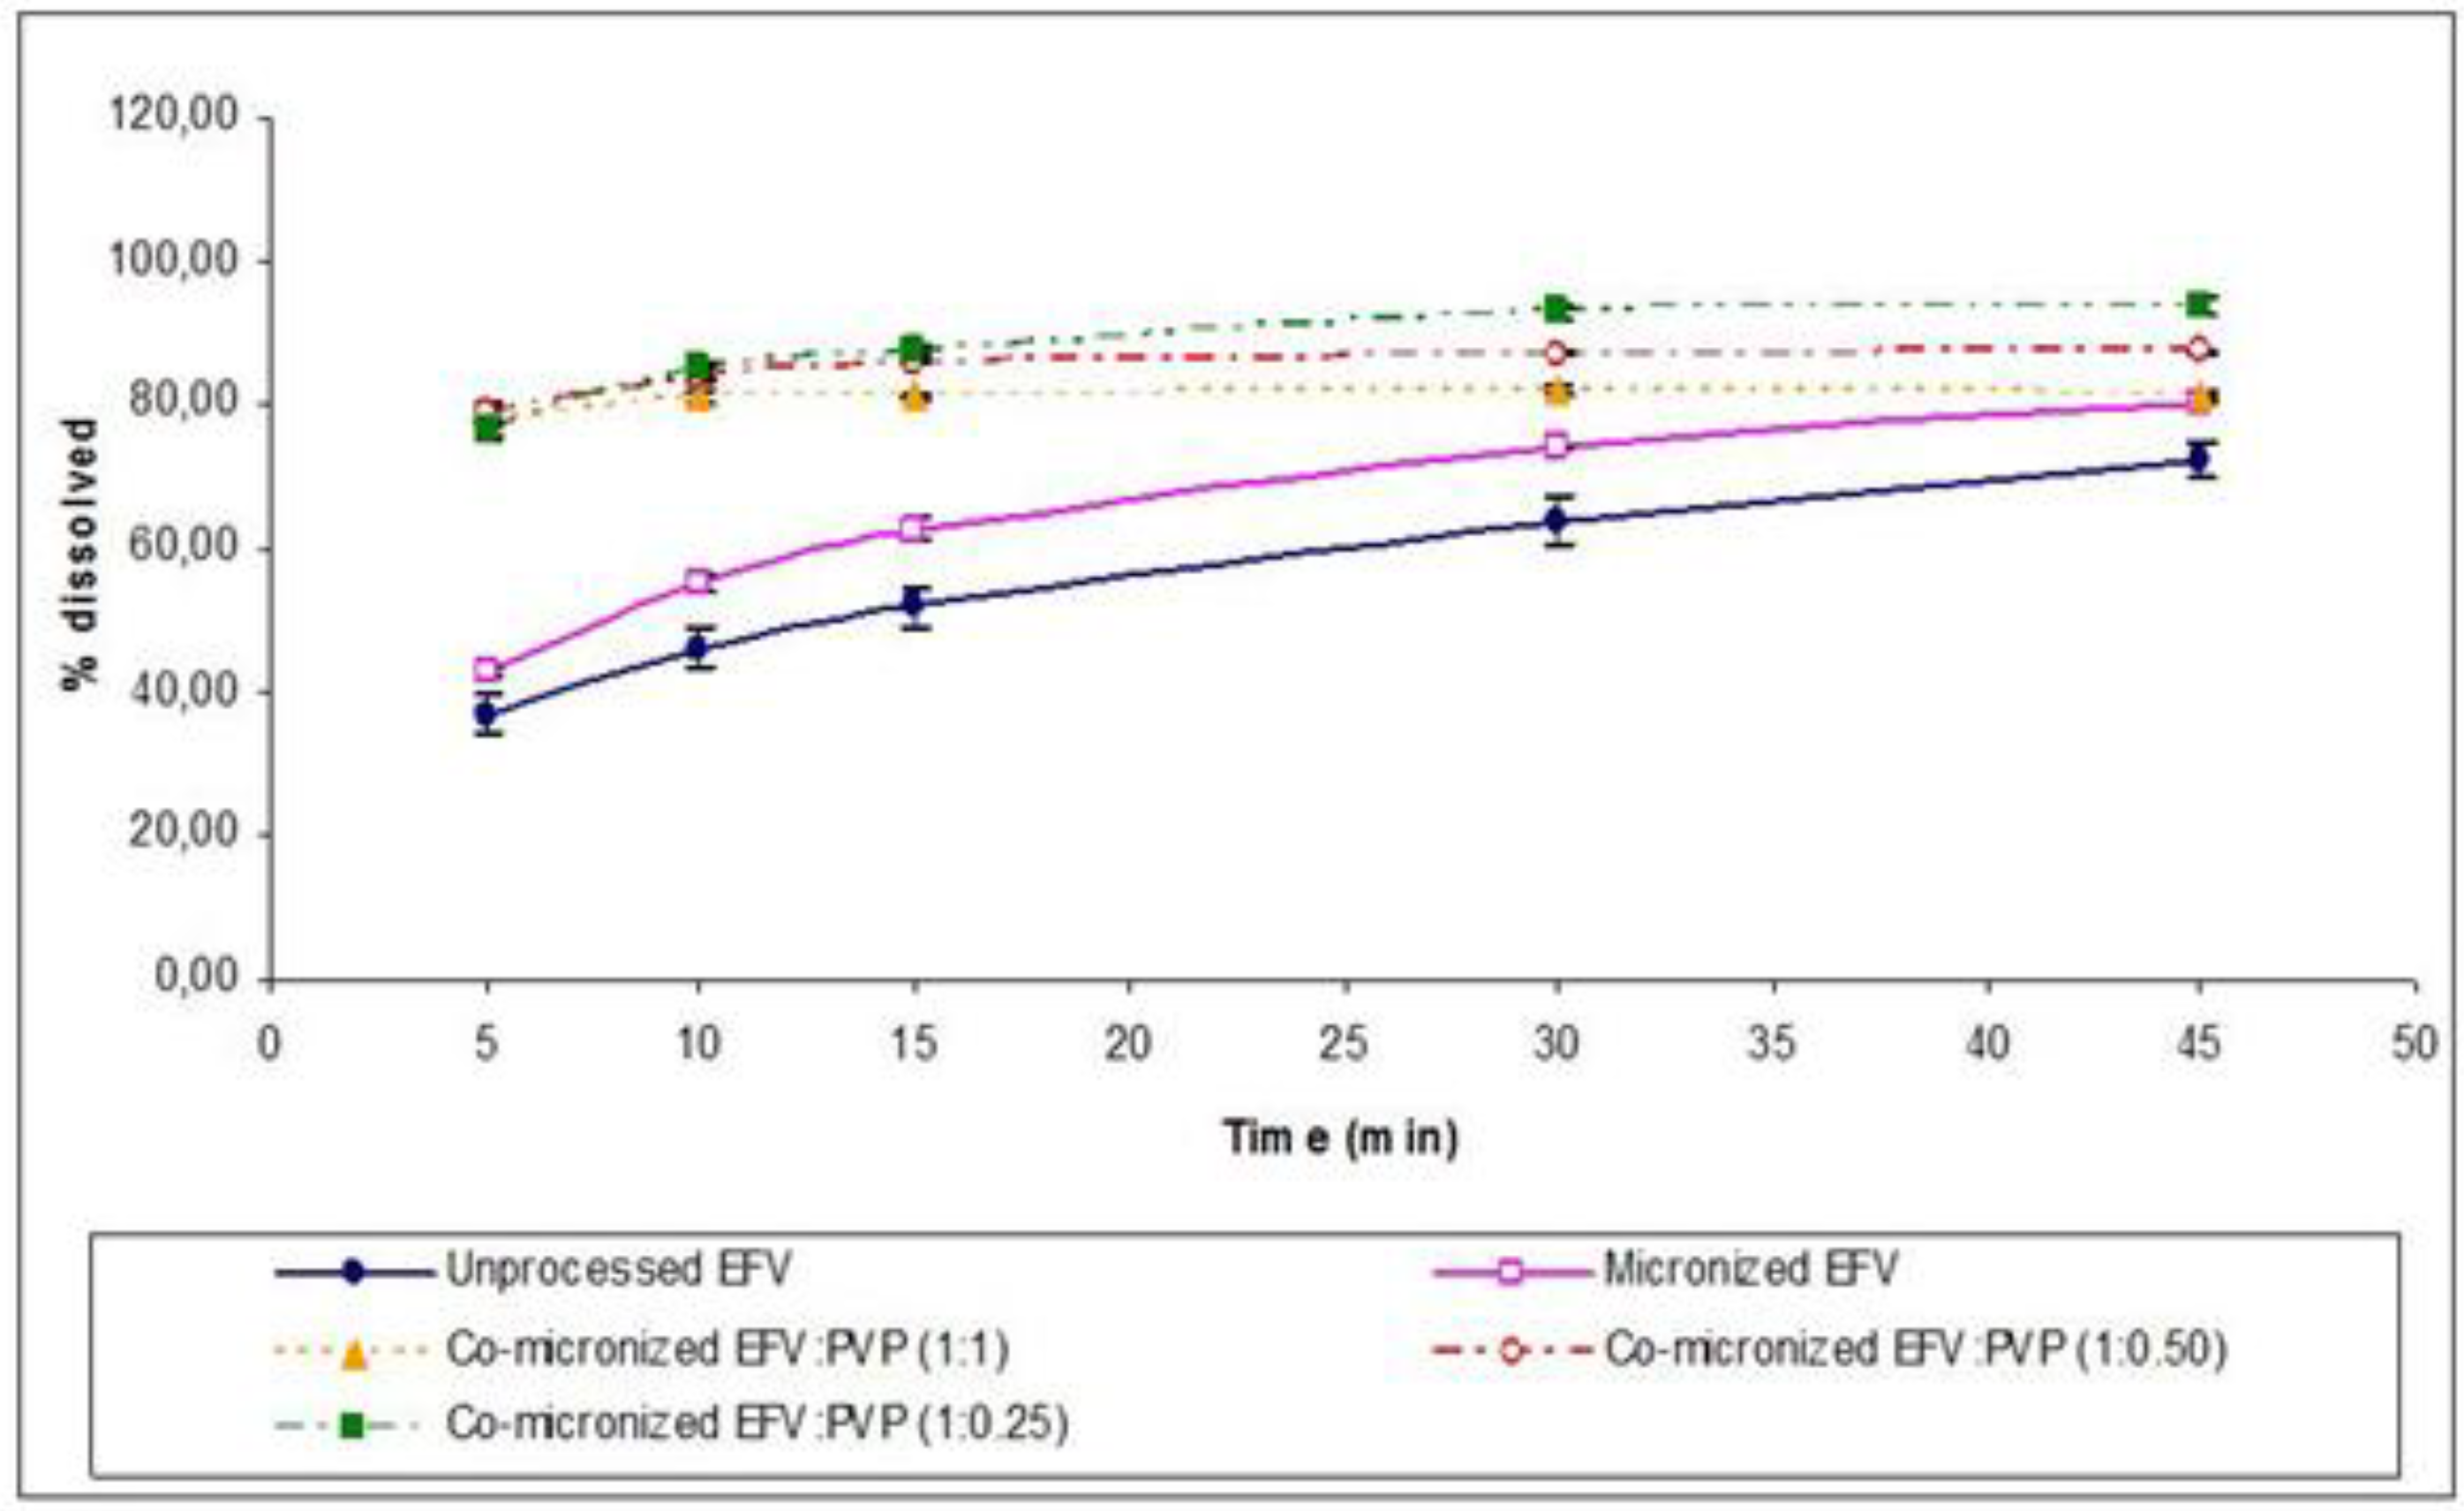
The EFV:PVP co-micronized, as well as EFV:SLS, mixtures showed dissolution profiles which were significantly different to those of the unprocessed drug (
Table 3) and the physical mixtures (data not shown) for all proportions. It is noteworthy that, in the initial points, more rapid dissolution was observed while final values did not show such a significant increase, contrary to that shown in the case of co-micronized EFV:SLS samples.
Figure 15 shows the powder dissolution profile of co-micronized mixtures compared with unprocessed and micronized EFV. The three proportions tested all had similar powder dissolution profiles (
Table 5).
Figure 15.
Powder dissolution profile of EFV in SLS 0.5% (n=3) compared to micronized and unprocessed EFV and co-micronized EFV:PVP mixtures at the proportions (1:0.25), (1:0.50) and (1:1).
Figure 15.
Powder dissolution profile of EFV in SLS 0.5% (n=3) compared to micronized and unprocessed EFV and co-micronized EFV:PVP mixtures at the proportions (1:0.25), (1:0.50) and (1:1).
Table 5.
Values of f1 and f2 found for EFV:PVP processed samples.
Table 5.
Values of f1 and f2 found for EFV:PVP processed samples.
| Processed | EFV:PVP (1:0.25) |
|---|
| f1 | f2 |
|---|
| EFV:PVP (1:0.50) | 3.99 | 68.48 |
| EFV:PVP (1:1) | 7.84 | 54.83 |
The size reduction method has been extensively used because the increase in surface area can enhance dissolution rate, and consequently, the bioavailability of pharmaceutical materials [
27]. Nevertheless, it cannot be asserted that the enhancement obtained in the dissolution profile of the co-micronization mixtures, both with SLS and PVP, was due solely to particle size decrease, in spite of the scanning electronic microscopy analyses showing alterations in particle size after co-processing (
Figure 3). As in the case of results found by Vogt and collaborators [
32], it can be hypothesized that a formed hydrophilic layer surrounds the drug, enhancing wettability and leading to more rapid dissolution of the co-micronized mixture.
The results of powder dissolution of co-micronized mixtures with PVP showed lower values compared to co-micronized mixtures using SLS. All profiles obtained for co-micronized mixtures with SLS differed from those of co-micronized EFV:PVP (
Table 6). Generally, polymers are known to be able to surround fine drug crystals, hindering their recrystallization from solution by reducing the surface area for crystallization on the drug particles, but this effect can also hinder dissolution by forming a barrier against penetration of water molecules [
7]. The profiles obtained for co-micronized EFV:PVP mixtures, predominantly at 45 min, evidenced a reduction in dissolution with increasing PVP concentration. Using SEM, greater homogeneity of particles of co-micronized mixtures with SLS was seen in comparison to co-micronized mixtures with PVP (
Figure 3), which can consequently influence the wettability and dissolution of systems.
Table 6.
Values of f1 and f2 found for EFV:PVP processed samples compared to EFV:SLS proportions.
Table 6.
Values of f1 and f2 found for EFV:PVP processed samples compared to EFV:SLS proportions.
| Processed | EFV:SLS (1:0.25) |
| f1 | f2 |
| EFV:PVP (1:0.25) | 16.88 | 36.71 |
| EFV:PVP (1:0.50) | 19.11 | 34.81 |
| EFV:PVP (1:1) | 22.89 | 30.98 |
| Processed | EFV:SLS (1:0.50) |
| f1 | f2 |
| EFV:PVP (1:0.25) | 19.09 | 33.54 |
| EFV:PVP (1:0.50) | 21.27 | 31.89 |
| EFV:PVP (1:1) | 24.95 | 28.53 |
| Processed | EFV:SLS (1:1) |
| f1 | f2 |
| EFV:PVP (1:0.25) | 21.39 | 30.62 |
| EFV:PVP (1:0.50) | 23.51 | 29.11 |
| EFV:PVP (1:1) | 27.08 | 26.13 |
In order to achieve the lowest possible proportion of carrier in the formulation, on the basis of the excellent results obtained in powder dissolution of the co-micronized mixture, particularly with SLS, a smaller proportion was tested: EFV:SLS (1:0.10). The dissolution profile is depicted in
Figure 14 compared to the unprocessed and micronized drug and all the proportions of co-micronized mixtures with SLS previously tested. The new dissolution profile obtained was lower than the other proportions tested and was considered to be significantly different according to the
f1 and
f2 factors, in spite of being higher than in the unprocessed and micronized drug (
Table 7). The small quantity of carrier may have hindered the formation of the hydrophilic layer at the drug surface. Nevertheless, even a small quantity of carrier co-micronized with EFV was able to provide significant improvement in dissolution, emphasizing the importance of co-micronization. In addition, the results of dissolution of the co-micronized mixtures were higher than those obtained for the physical mixture, thus confirming the merit of the process studied.
Table 7.
Values of f1 and f2 found for processed EFV:SLS (1:0.10) compared to the unprocessed and micronized drug and other EFV:SLS proportions.
Table 7.
Values of f1 and f2 found for processed EFV:SLS (1:0.10) compared to the unprocessed and micronized drug and other EFV:SLS proportions.
| Processed | EFV:SLS (1:0.10) |
|---|
| f1 | f2 |
|---|
| EFV unprocessed | 40.68 | 21.19 |
| EFV micronized | 30.92 | 26.82 |
| EFV:SLS (1:0.25) | 14.77 | 41.85 |
| EFV:SLS (1:0.50) | 17.91 | 37.97 |
| EFV:SLS (1:1) | 21.35 | 34.49 |
Based on these results, co-micronization appears to be an efficient technique for EFV processing to enhance the dissolution profile. It can lead to greater drug bioavailability, as Vogt and colleagues [
7] demonstrated for fenofibrate. According to Mooter
et al. [
34], a lack of crystallinity, increased wettability, and reduced drug particle size, were considered to be predominant factors in controlling dissolution. Barzegar-Jalali and coworkers [
28] proposed that, in addition to these factors, the deaggregation promoted by carriers is the underlying reason for enhanced drug dissolution.
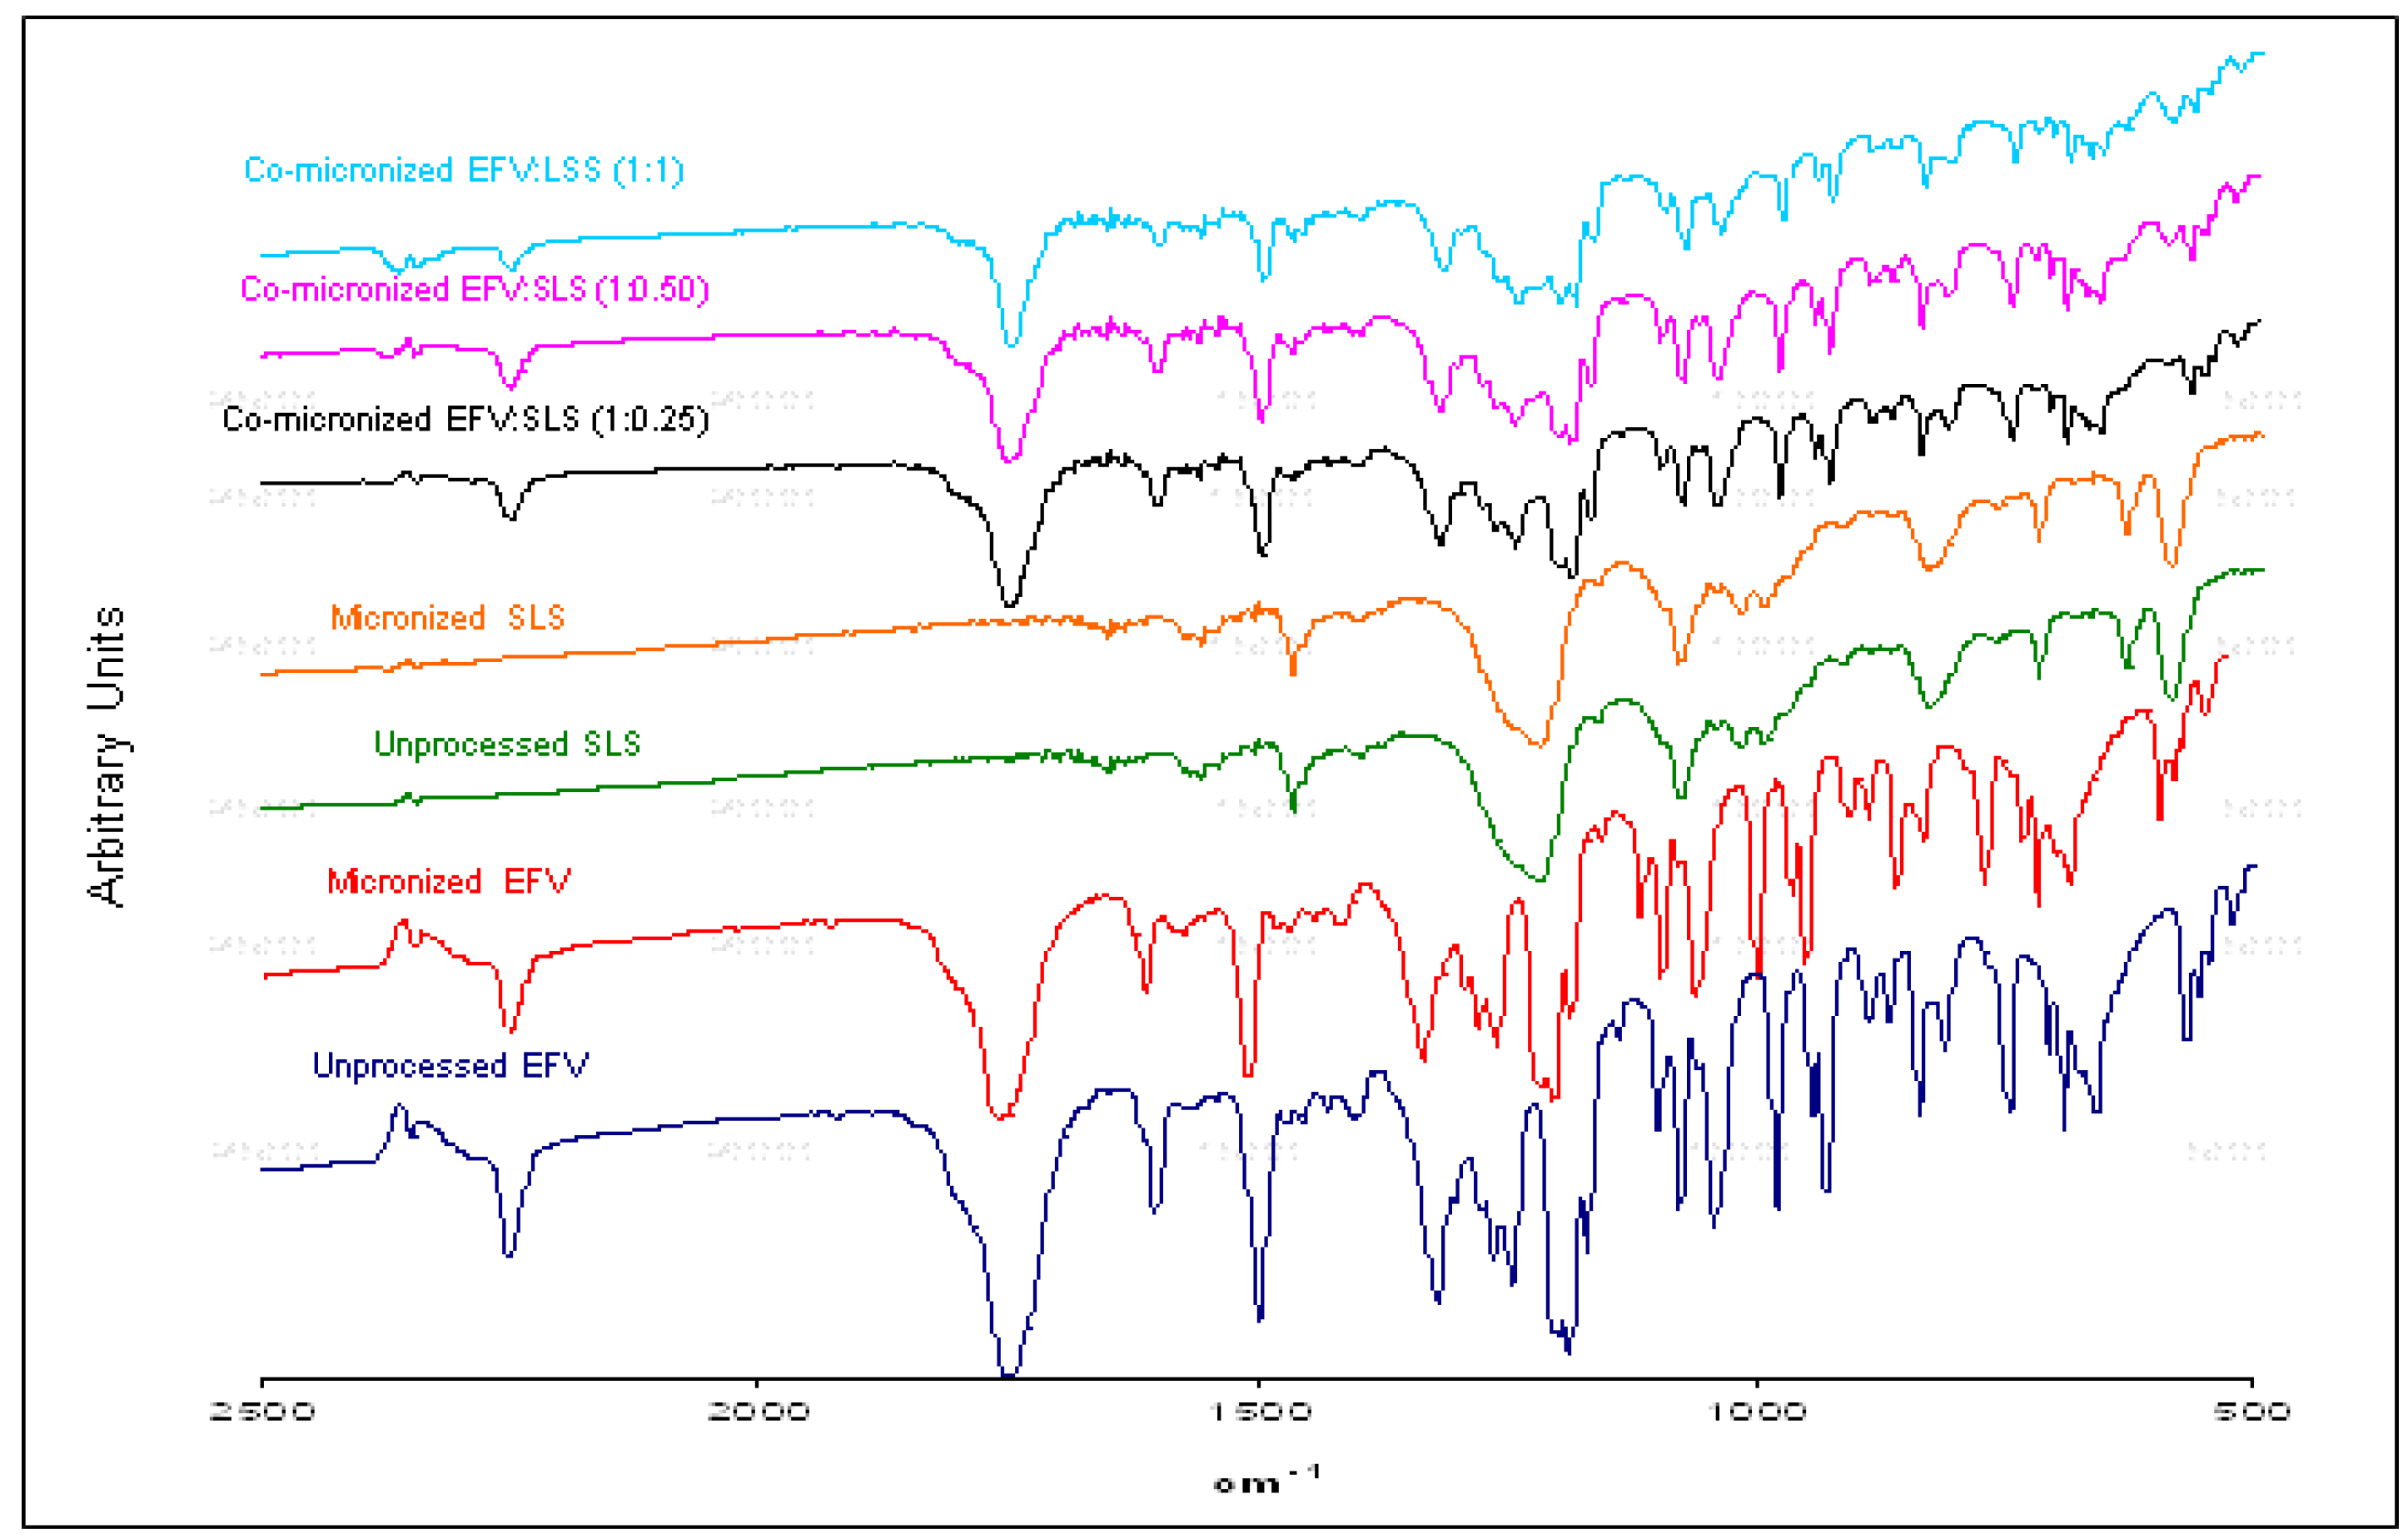
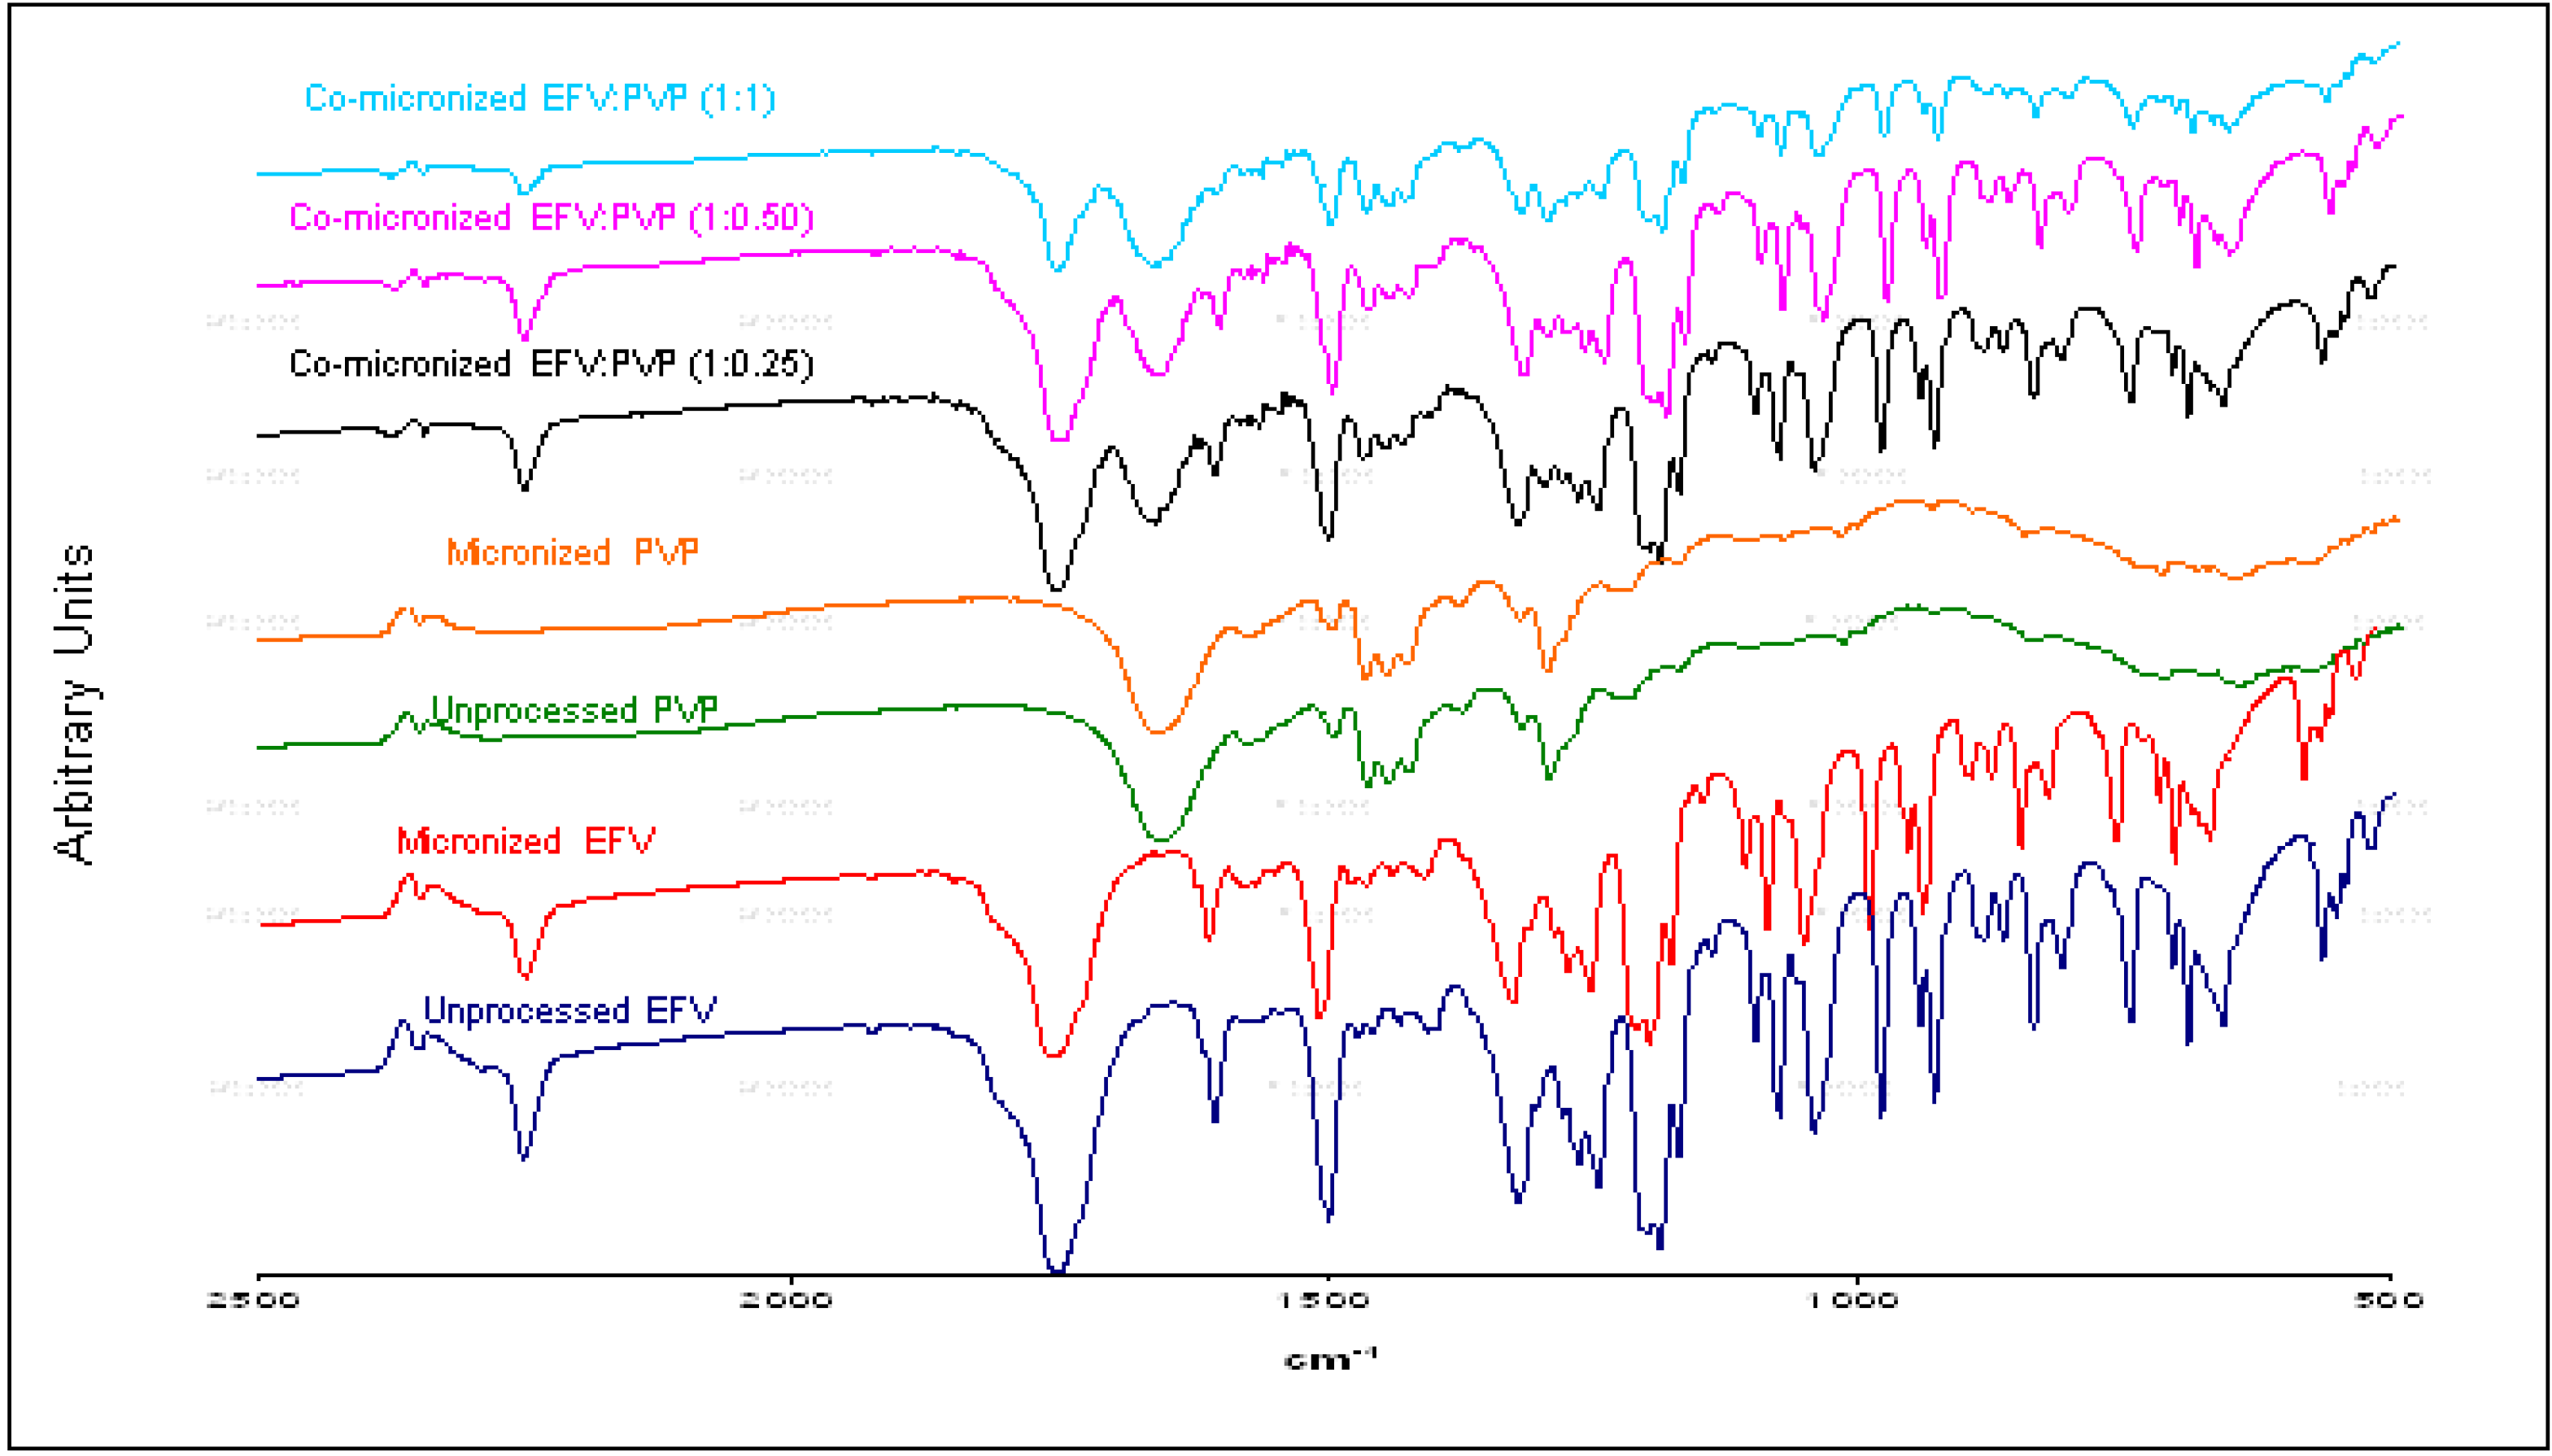
Events related to drug amorphization were not responsible for the improvement in dissolution rate obtained, since the powder X-ray diffraction (DRX) results confirmed crystallinity maintenance. The possibility of interaction at molecular and structural levels was also ruled out given the similarity of infrared spectra obtained from co-processed and physical mixtures for all proportions tested, showing neither band displacement nor enlargement. Particle size reduction was observed in some cases by SEM, which may have influenced the increased dissolution rate of some co-processed samples, especially the co-micronized mixtures containing SLS. This sample attained the highest dissolution results, and presented the lowest particle size. The enhanced wettability, the solubilizing effect of the carrier, the drug dissolution in hydrophilic support and/or a combination of these factors, represent possible hypotheses to explain the enhancement of the powder dissolution profile obtained by co-micronization, but further testing is needed to confirm this theory.

