
Investigation and Evaluation of the Transdermal Delivery of Ibuprofen in Various Characterized Nano-Drug Delivery Systems


Abstract
:
1. Introduction
2. Materials and Methods
2.1. Materials
2.2. Quantification of Ibuprofen
2.3. Examination of Physicochemical Properties of Ibuprofen
2.3.1. Solubility of Ibuprofen in PBS
2.3.2. Solubility of Ibuprofen in N-Octanol
2.3.3. Octanol-Buffer Distribution Coefficient of Ibuprofen
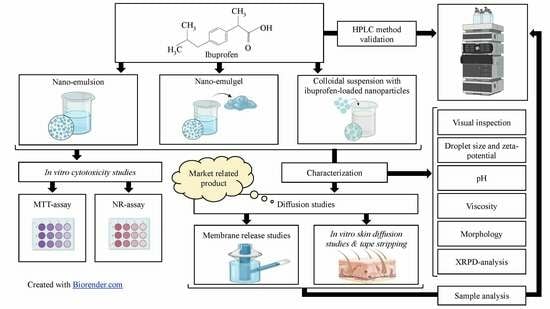
2.4. Formulation of Nano-Drug Delivery Systems
2.4.1. Formulation of a Nano-Emulsion Containing Ibuprofen
2.4.2. Formulation of a Nano-Emulgel Containing Ibuprofen
2.4.3. Formulation of a Colloidal Suspension Containing Ibuprofen-Loaded Nanoparticles
2.5. Characterization of the Drug Delivery Systems
2.5.1. Visual Inspection
2.5.2. pH
2.5.3. Droplet/Particle Size and Distribution
2.5.4. Zeta-Potential
2.5.5. Viscosity
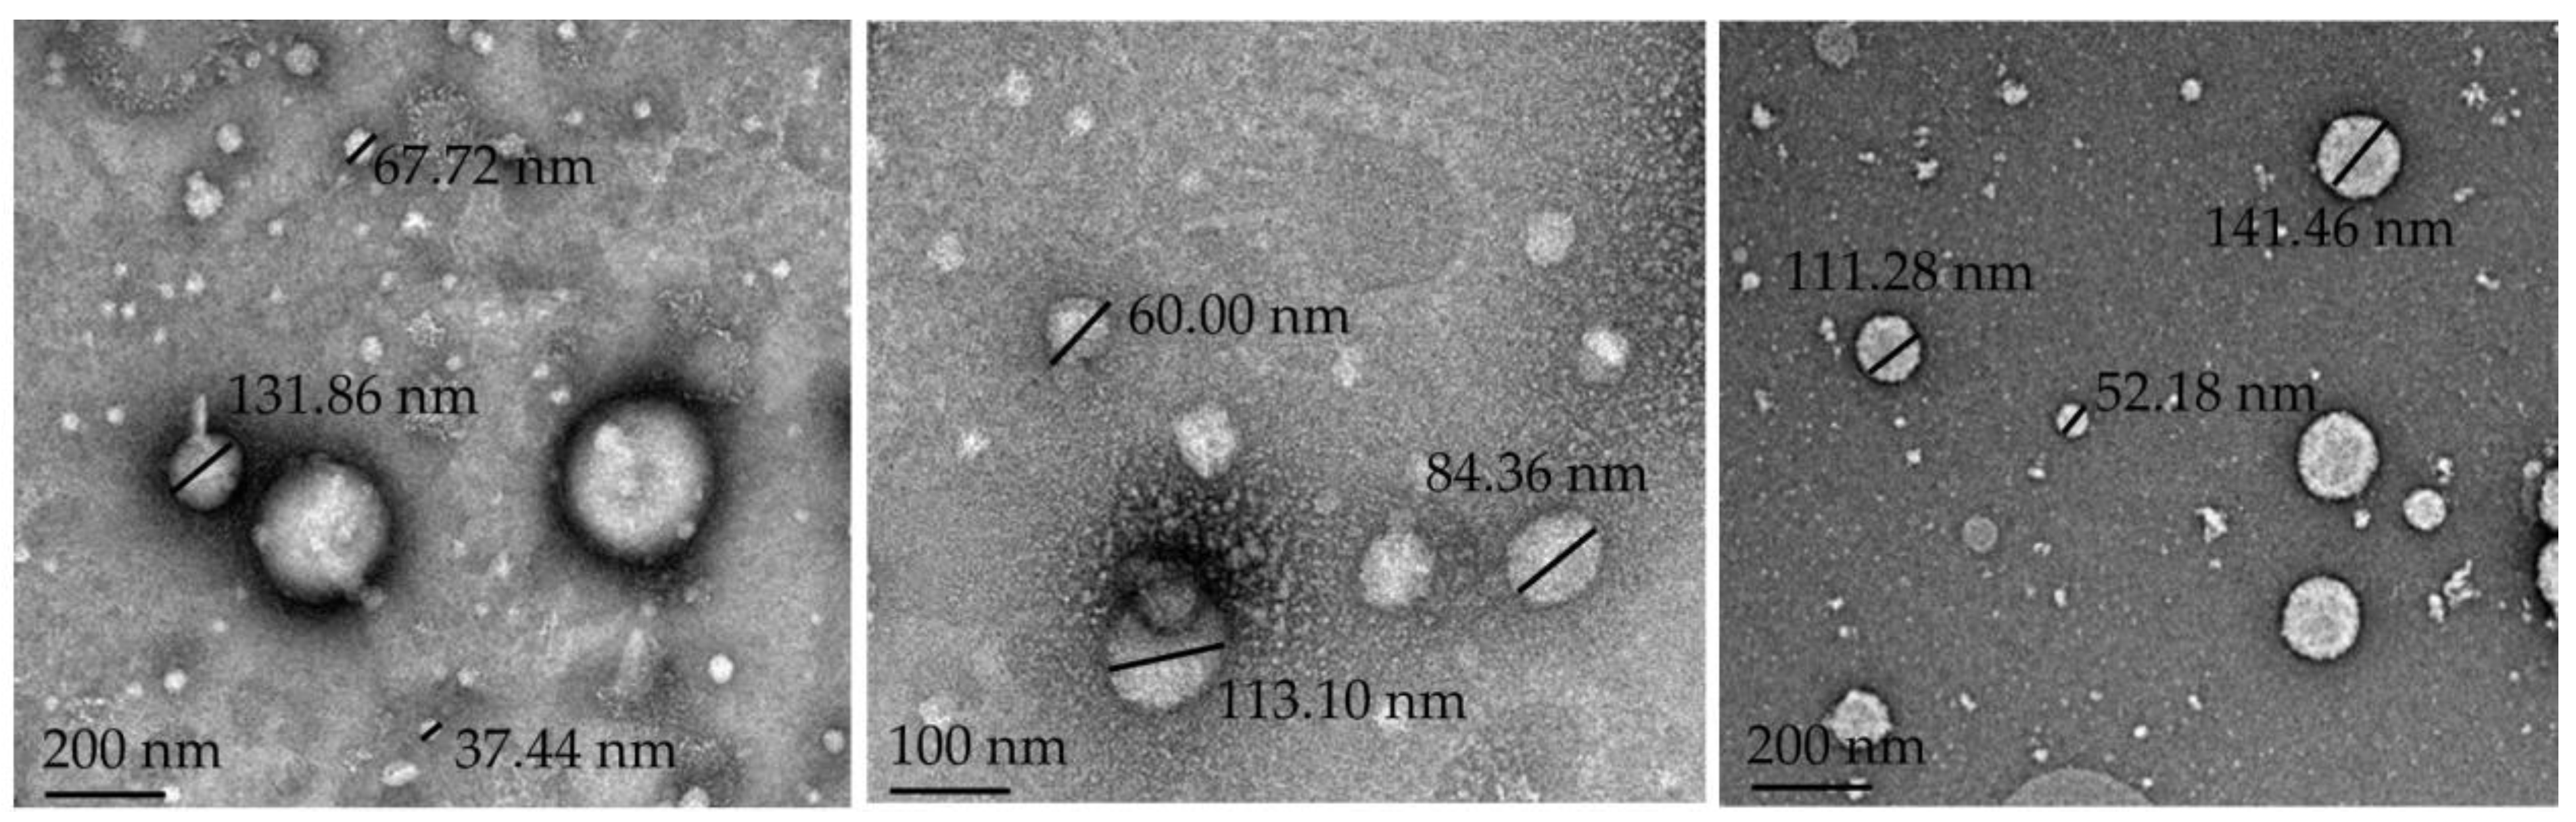
2.5.6. Morphology
2.5.7. XRPD Analysis
2.6. Diffusion Experiments
2.6.1. Membrane Release Studies
2.6.2. Skin Preparation
2.6.3. In Vitro Skin Diffusion Studies
2.6.4. Tape Stripping
2.7. In Vitro Cytotoxicity Assays
2.7.1. Cell Culturing Conditions
2.7.2. MTT-Assay
2.7.3. NR-Assay
2.7.4. Calculation of the IC50 Values
2.8. Statistical Data Analysis
3. Results and Discussion
3.1. Examination of Physicochemical Properties of Ibuprofen
3.1.1. Solubility of Ibuprofen in PBS and N-Octanol
3.1.2. Log D of Ibuprofen
3.2. Characterization of the Drug Delivery Systems
3.3. Diffusion Experiments
3.3.1. Membrane Release Studies
3.3.2. In Vitro Skin Diffusion Studies
3.3.3. Tape Stripping
3.4. In Vitro Cytotoxicity Findings
4. Conclusions
Author Contributions
Funding
Institutional Review Board Statement
Informed Consent Statement
Data Availability Statement
Acknowledgments
Conflicts of Interest
References
- Dahlhamer, J.; Lucas, J.; Zelaya, C.; Nahin, R.; Mackey, S.; DeBar, L.; Kerns, R.; Von Korff, M.; Porter, L.; Helmick, C. Prevalence of Chronic Pain and High-Impact Chronic Pain Among Adults—United States, 2016. Morb. Mortal. Wkly. Rep. 2018, 67, 1001–1006. [Google Scholar] [CrossRef]
- Goldberg, D.S.; McGee, S.J. Pain as a global public health priority. BMC Public Health 2011, 11, 770. [Google Scholar] [CrossRef] [PubMed]
- Mills, S.E.; Nicolson, K.P.; Smith, B.H. Chronic pain: A review of its epidemiology and associated factors in population-based studies. Br. J. Anaesth. 2019, 123, e273–e283. [Google Scholar] [CrossRef] [PubMed]
- Varrassi, G.; Alon, E.; Bagnasco, M.; Lanata, L.; Mayoral-Rojals, V.; Paladini, A.; Pergolizzi, J.V.; Perrot, S.; Scarpignato, C.; Tölle, T. Towards an Effective and Safe Treatment of Inflammatory Pain: A Delphi-Guided Expert Consensus. Adv. Ther. 2019, 36, 2618–2637. [Google Scholar] [CrossRef] [PubMed]
- Kidd, B.; Urban, L. Mechanisms of inflammatory pain. Br. J. Anaesth. 2001, 87, 3–11. [Google Scholar] [CrossRef]
- McHugh, J.M.; McHugh, W.B. Pain: Neuroanatomy, Chemical Mediators, and Clinical Implications. AACN Adv. Crit. Care 2000, 11, 168–178. [Google Scholar] [CrossRef]
- Punchard, N.A.; Whelan, C.J.; Adcock, I. The Journal of Inflammation. J. Inflamm. 2004, 1, 1. [Google Scholar] [CrossRef]
- Brandolini, L.; Grannonico, M.; Bianchini, G.; Colanardi, A.; Sebastiani, P.; Paladini, A.; Piroli, A.; Allegretti, M.; Varrassi, G.; Di Loreto, S. The Novel C5aR Antagonist DF3016A Protects Neurons against Ischemic Neuroinflammatory Injury. Neurotox. Res. 2019, 36, 163–174. [Google Scholar] [CrossRef]
- Fusco, M.; Skaper, S.D.; Coaccioli, S.; Varrassi, G.; Paladini, A. Degenerative Joint Diseases and Neuroinflammation. Pain Pract. 2017, 17, 522–532. [Google Scholar] [CrossRef]
- Ong, C.; Lirk, P.; Tan, C.; Seymour, R. An Evidence-Based Update on Nonsteroidal Anti-Inflammatory Drugs. Clin. Med. Res. 2007, 5, 19–34. [Google Scholar] [CrossRef]
- Manoukian, M.A.C.; Migdal, C.W.; Tembhekar, A.R.; Harris, J.A.; DeMesa, C. Topical Administration of Ibuprofen for Injured Athletes: Considerations, Formulations, and Comparison to Oral Delivery. Sports Med.-Open 2017, 3, 36. [Google Scholar] [CrossRef] [PubMed]
- Botting, R.M. Cyclooxygenase: Past, present and future. A tribute to John R. Vane (1927–2004). J. Therm. Biol. 2006, 31, 208–219. [Google Scholar] [CrossRef]
- Chell, S.; Kadi, A.; Williams, A.C.; Paraskeva, C. Mediators of PGE2 synthesis and signalling downstream of COX-2 represent potential targets for the prevention/treatment of colorectal cancer. Biochim. Biophys. Acta (BBA)-Rev. Cancer 2006, 1766, 104–119. [Google Scholar] [CrossRef] [PubMed]
- Alkilani, A.Z.; McCrudden, M.T.C.; Donnelly, R.F. Transdermal Drug Delivery: Innovative Pharmaceutical Developments Based on Disruption of the Barrier Properties of the Stratum Corneum. Pharmaceutics 2015, 7, 438–470. [Google Scholar] [CrossRef] [PubMed]
- Martini, F.H.; Nath, J.L.; Bartholomew, E.F. The integumentary system. In Fundamentals of Anatomy and Physiology, 10th ed.; Berriman, L., Ed.; Pearson Education Limited: Harlow, UK, 2015; pp. 176–199. [Google Scholar]
- Ali, S.M.; Shabbir, M.; Shahid, N. The Structure of Skin and Transdermal Drug Delivery System-A Review. Res. J. Pharm. Technol. 2015, 8, 103–109. [Google Scholar] [CrossRef]
- Weiss, S.C. Conventional topical delivery systems. Dermatol. Ther. 2011, 24, 471–476. [Google Scholar] [CrossRef]
- Williams, A.C. Topical and transdermal drug delivery. In Aulton’s Pharmaceutics: The Design and Manufacture of Medicines, 4th ed.; Aulton, M.E., Ed.; Churchill Livingstone: London, UK, 2013; pp. 675–697. [Google Scholar]
- Lovelyn, C.; Attama, A.A. Current State of Nanoemulsions in Drug Delivery. J. Biomater. Nanobiotechnol. 2011, 2, 626–639. [Google Scholar] [CrossRef]
- Simonazzi, A.; Cid, A.G.; Villegas, M.; Romero, A.I.; Palma, S.D.; Bermúdez, J.M. Nanotechnology applications in drug controlled release. In Drug Targeting and Stimuli Sensitive Drug Delivery Systems, 1st ed.; Grumezescu, A.M., Ed.; Elsevier: Cambridge, UK, 2018; pp. 81–116. [Google Scholar]
- Timoszuk, M.; Bielawska, K.; Skrzydlewska, E. Evening Primrose (Oenothera biennis) Biological Activity Dependent on Chemical Composition. Antioxidants 2018, 7, 108. [Google Scholar] [CrossRef]
- Tadros, T.; Izquierdo, P.; Esquena, J.; Solans, C. Formation and stability of nano-emulsions. Adv. Colloid Interface Sci. 2004, 108–109, 303–318. [Google Scholar] [CrossRef]
- Gupta, P.; Garg, S. Recent advances in semisolid dosage forms for dermatological application. Pharm. Technol. 2002, 26, 144–163. [Google Scholar]
- Jantrawut, P.; Ruksiriwanich, W. Carbopol®-guar gum gel as a vehicle for topical gel formulation of pectin beads loaded with rutin. Asian J. Pharm. Clin. Res. 2014, 7, 231–236. [Google Scholar]
- Boltachev, G.S.; Ivanov, M.G. Effect of nanoparticle concentration on coagulation rate of colloidal suspensions. Heliyon 2020, 6, e03295. [Google Scholar] [CrossRef]
- Buzea, C.; Pacheco, I.I.; Robbie, K. Nanomaterials and nanoparticles: Sources and toxicity. Biointerphases 2007, 2, MR17–MR71. [Google Scholar] [CrossRef] [PubMed]
- Foldvari, M. Non-invasive administration of drugs through the skin: Challenges in delivery system design. Pharm. Sci. Technol. Today 2000, 3, 417–425. [Google Scholar] [CrossRef] [PubMed]
- Gupta, S.; Bansal, R.; Gupta, S.; Jindal, N.; Jindal, A. Nanocarriers and nanoparticles for skin care and dermatological treatments. Indian Dermatol. Online J. 2013, 4, 267–272. [Google Scholar] [CrossRef] [PubMed]
- Uchechi, O.; Ogbonna, J.D.N.; Attama, A.A. Nanoparticles for Dermal and Transdermal Drug Delivery. Appl. Nanotechnol. Drug Deliv. 2014, 4, 193–235. [Google Scholar] [CrossRef]
- Schneider, M.; Stracke, F.; Hansen, S.; Schaefer, U.F. Nanoparticles and their interactions with the dermal barrier. Derm. Endocrinol. 2009, 1, 197–206. [Google Scholar] [CrossRef]
- Zhang, Q.; Murawsky, M.; LaCount, T.; Hao, J.; Kasting, G.B.; Newman, B.; Ghosh, P.; Raney, S.G.; Li, S.K. Characterization of Temperature Profiles in Skin and Transdermal Delivery System When Exposed to Temperature Gradients In Vivo and In Vitro. Pharm. Res. 2017, 34, 1491–1504. [Google Scholar] [CrossRef]
- Liu, X.; Testa, B.; Fahr, A. Lipophilicity and Its Relationship with Passive Drug Permeation. Pharm. Res. 2011, 28, 962–977. [Google Scholar] [CrossRef]
- Wenlock, M.C.; Potter, T.; Barton, P.; Austin, R.P. A Method for Measuring the Lipophilicity of Compounds in Mixtures. J. Biomol. Screen. 2011, 16, 348–355. [Google Scholar] [CrossRef]
- Sithole, M.N.; Marais, S.; Maree, S.M.; Du Plessis, L.H.; Du Plessis, J.; Gerber, M. Development and characterization of nano-emulsions and nano-emulgels for transdermal delivery of statins. Expert Opin. Drug Deliv. 2021, 18, 789–801. [Google Scholar] [CrossRef] [PubMed]
- Zielińska, A.; Carreiró, F.; Oliveira, A.M.; Neves, A.; Pires, B.; Venkatesh, D.N.; Durazzo, A.; Lucarini, M.; Eder, P.; Silva, A.M.; et al. Polymeric Nanoparticles: Production, Characterization, Toxicology and Ecotoxicology. Molecules 2020, 25, 3731. [Google Scholar] [CrossRef]
- Goyal, R.; Macri, L.K.; Kaplan, H.M.; Kohn, J. Nanoparticles and nanofibers for topical drug delivery. J. Control. Release 2016, 240, 77–92. [Google Scholar] [CrossRef] [PubMed]
- Ndumiso, M.; Buchtová, N.; Husselmann, L.; Mohamed, G.; Klein, A.; Aucamp, M.; Canevet, D.; D’souza, S.; Maphasa, R.E.; Boury, F.; et al. Comparative whole corona fingerprinting and protein adsorption thermodynamics of PLGA and PCL nanoparticles in human serum. Colloids Surf. B Biointerfaces 2020, 188, 110816. [Google Scholar] [CrossRef]
- Louw, E.-V.; Liebenberg, W.; Willers, C.; Dube, A.; Aucamp, M.E.; Gerber, M. Comparative study on the topical and transdermal delivery of diclofenac incorporated in nano-emulsions, nano-emulgels, and a colloidal suspension. Drug Deliv. Transl. Res. 2022, 13, 1372–1389. [Google Scholar] [CrossRef] [PubMed]
- Fouché, M.; Willers, C.; Hamman, S.; Malherbe, C.; Steenekamp, J. Wound Healing Effects of Aloe muth-muth: In Vitro Investigations Using Immortalized Human Keratinocytes (HaCaT). Biology 2020, 9, 350. [Google Scholar] [CrossRef] [PubMed]
- Wentzel, J.F.; Lewies, A.; Bronkhorst, A.J.; van Dyk, E.; du Plessis, L.H.; Pretorius, P.J. Exposure to high levels of fumarate and succinate leads to apoptotic cytotoxicity and altered global DNA methylation profiles in vitro. Biochimie 2017, 135, 28–34. [Google Scholar] [CrossRef] [PubMed]
- Krippendorff, B.-F.; Neuhaus, R.; Lienau, P.; Reichel, A.; Huisinga, W. Mechanism-Based Inhibition: Deriving KI and kinact Directly from Time-Dependent IC50 Values. SLAS Discov. Adv. Sci. Drug Discov. 2009, 14, 913–923. [Google Scholar] [CrossRef]
- Indrayanto, G.; Putra, G.S.; Suhud, F. Validation of in-vitro bioassay methods: Application in herbal drug research. Profiles Drug. Subst. Excip. Relat. 2021, 46, 273–307. [Google Scholar] [CrossRef]
- Kumar, G.V.S.; Sandhya, G.V. Preliminary phytochemical screening, total phenol content and in vitro antioxidant activity of Caralluma Umbellata Haw. J. Glob. Trends Pharm. Sci. 2014, 5, 1603–1611. [Google Scholar]
- Krzywinski, M.; Altman, N. Visualizing samples with box plots. Nat. Methods 2014, 11, 119–120. [Google Scholar] [CrossRef] [PubMed]
- Hamada, C. Statistical analysis for toxicity studies. J. Toxicol. Pathol. 2018, 31, 15–22. [Google Scholar] [CrossRef] [PubMed]
- Concato, J.; Hartigan, J.A. P Values: From Suggestion to Superstition. J. Investig. Med. 2016, 64, 1166–1171. [Google Scholar] [CrossRef]
- Naik, A.; Kalia, Y.N.; Guy, R.H. Transdermal drug delivery: Overcoming the skin’s barrier function. Pharm. Sci. Technol. Today 2000, 3, 318–326. [Google Scholar] [CrossRef]
- Bhal, S.K. LogP—Making Sense of the Value; Advanced Chemistry Development, Inc.: Toronto, ON, Canada, 2007; pp. 1–4. Available online: https://www.acdlabs.com/download/app/physchem/making_sense.pdf (accessed on 6 September 2023).
- N’Da, D.D. Prodrug Strategies for Enhancing the Percutaneous Absorption of Drugs. Molecules 2014, 19, 20780–20807. [Google Scholar] [CrossRef] [PubMed]
- Subedi, R.K.; Oh, S.Y.; Chun, M.-K.; Choi, H.-K. Recent advances in transdermal drug delivery. Arch. Pharm. Res. 2010, 33, 339–351. [Google Scholar] [CrossRef] [PubMed]
- Czyrski, A. Determination of the Lipophilicity of Ibuprofen, Naproxen, Ketoprofen, and Flurbiprofen with Thin-Layer Chromatography. J. Chem. 2019, 2019, 3407091. [Google Scholar] [CrossRef]
- Barry, B.W. Transdermal drug delivery. In Pharmaceutics: The Science of Dosage Form Design, 2nd ed.; Aulton, M.E., Ed.; Churchill Livingstone: London, UK, 2002; pp. 499–533. [Google Scholar]
- Gaber, M.; Medhat, W.; Hany, M.; Saher, N.; Fang, J.-Y.; Elzoghby, A. Protein-lipid nanohybrids as emerging platforms for drug and gene delivery: Challenges and outcomes. J. Control. Release 2017, 254, 75–91. [Google Scholar] [CrossRef]
- Nalini, T.; Kumari, V.S.; Basha, S.K. Novel nanosystems for herbal drug delivery. World J. Pharm. Pharm. Sci. 2017, 6, 1447–1463. [Google Scholar]
- Gaumet, M.; Vargas, A.; Gurny, R.; Delie, F. Nanoparticles for drug delivery: The need for precision in reporting particle size parameters. Eur. J. Pharm. Biopharm. 2008, 69, 1–9. [Google Scholar] [CrossRef]
- Chime, S.A.; Kenechukwu, F.C.; Attama, A.A. Nano-emulsions: Advances in formulation, characterisation and application in drug delivery. In Application of Nanotechnology in Drug Delivery; Sezer, A.D., Ed.; 2014; pp. 77–126. Available online: http://cdn.intechopen.com/pdfs-wm/47116.pdf (accessed on 6 September 2023).
- Eid, A.M.; El-Enshasy, H.A.; Aziz, R. Preparation, Characterization and Anti-Inflammatory Activity of Swietenia macrophylla Nanoemulgel. J. Nanomed. Nanotechnol. 2014, 5, 1–10. [Google Scholar] [CrossRef]
- Marsalek, R. Particle Size and Zeta Potential of ZnO. APCBEE Procedia 2014, 9, 13–17. [Google Scholar] [CrossRef]
- Silva, H.D.; Cerqueira, M.A.; Vicente, A.A. Nanoemulsions for Food Applications: Development and Characterization. Food Bioproc. Technol. 2012, 5, 854–867. [Google Scholar] [CrossRef]
- Malvern Instruments. Zeta Potential—An Introduction in 30 Minutes; Worcestershire, UK, 2015; pp. 1–15. Available online: https://www.research.colostate.edu/wp-content/uploads/2018/11/ZetaPotential-Introduction-in-30min-Malvern.pdf (accessed on 6 September 2023).
- Pund, S.; Pawar, S.; Gangurde, S.; Divate, D. Transcutaneous delivery of leflunomide nanoemulgel: Mechanistic investigation into physicomechanical characteristics, in vitro anti-psoriatic and anti-melanoma activity. Int. J. Pharm. 2015, 487, 148–156. [Google Scholar] [CrossRef] [PubMed]
- Dawson, B.; Trapp, R.G. Basic & Clinical Biostatistics; McGraw-Hill: New York, NY, USA, 2004; p. 30. [Google Scholar]
- Mottaghitalab, F.; Farokhi, M.; Shokrgozar, M.A.; Atyabi, F.; Hosseinkhani, H. Silk fibroin nanoparticle as a novel drug delivery system. J. Control. Release 2015, 206, 161–176. [Google Scholar] [CrossRef] [PubMed]
- Yang, S.; Wang, R.; Wan, G.; Wu, Z.; Guo, S.; Dai, X.; Shi, X.; Qiao, Y. A Multiscale Study on the Penetration Enhancement Mechanism of Menthol to Osthole. J. Chem. Inf. Model. 2016, 56, 2234–2242. [Google Scholar] [CrossRef]
- Haq, A.; Michniak-Kohn, B. Effects of solvents and penetration enhancers on transdermal delivery of thymoquinone: Permeability and skin deposition study. Drug Deliv. 2018, 25, 1943–1949. [Google Scholar] [CrossRef]
- Goebel, K.; Sato, M.E.O.; de Souza, D.F.; Murakami, F.S.; Andreazza, I.F. In vitro release of diclofenac diethylamine from gels: Evaluation of generic semisolid drug products in Brazil. Braz. J. Pharm. Sci. 2013, 49, 211–219. [Google Scholar] [CrossRef]
- Barakat, N.; Fouad, E.; Elmedany, A. Formulation Design of Indomethacin-Loaded Nanoemulsion For Transdermal Delivery. Pharm. Anal. Acta 2011, s2, 2–8. [Google Scholar] [CrossRef]
- Thakur, N.; Garg, G.; Sharma, P.K.; Kumar, N. Nanoemulsion: A new concept of delivery system. Indian J. Pharmacol. 2010, 1, 2–6. [Google Scholar]
- Doshi, A.; Deshpande, S.G. In vivo pharmacokinetic studies of prodrugs of ibuprofen. Indian J. Pharm. Sci. 2007, 69, 824–827. [Google Scholar] [CrossRef]
- Gleeson, M.P.; Hersey, A.; Montanari, D.; Overington, J. Probing the links between in vitro potency, ADMET and physicochemical parameters. Nat. Rev. Drug Discov. 2011, 10, 197–208. [Google Scholar] [CrossRef] [PubMed]
- Consonni, D.; Bertazzi, P.A. Health significance and statistical uncertainty. The value of P-value. Med. Lav. 2017, 108, 327–331. [Google Scholar] [CrossRef] [PubMed]
- Mittal, A.; Raber, A.S.; Schaefer, U.F.; Weissmann, S.; Ebensen, T.; Schulze, K.; Guzmán, C.A.; Lehr, C.-M.; Hansen, S. Non-invasive delivery of nanoparticles to hair follicles: A perspective for transcutaneous immunization. Vaccine 2012, 31, 3442–3451. [Google Scholar] [CrossRef]
- Zoabi, A.; Touitou, E.; Margulis, K. Recent Advances in Nanomaterials for Dermal and Transdermal Applications. Colloids Interfaces 2021, 5, 18. [Google Scholar] [CrossRef]
- Jhawat, V.C.; Saini, V.; Kamboj, S. Transdermal drug delivery systems: Approaches and advancements in drug absorption through skin. Int. J. Pharm. Sci. Rev. Res. 2013, 20, 47–56. [Google Scholar]
- Morrow, D.I.J.; McCarron, P.A.; Woolfson, A.D.; Donnelly, R.F. Innovative Strategies for Enhancing Topical and Transdermal Drug Delivery. Open Drug Deliv. J. 2007, 1, 36–59. [Google Scholar] [CrossRef]
- López-García, J.; Lehocký, M.; Humpolíček, P.; Sáha, P. HaCaT Keratinocytes Response on Antimicrobial Atelocollagen Substrates: Extent of Cytotoxicity, Cell Viability and Proliferation. J. Funct. Biomater. 2014, 5, 43–57. [Google Scholar] [CrossRef]


| Phase | Excipients | Drug Delivery Vehicle (% w/v) | |||
|---|---|---|---|---|---|
| NE | NEG | NP | CS | ||
| Oil | Ibuprofen | 5.00 | 5.00 | – | ** |
| Evening primrose oil | 20.00 | 20.00 | – | – | |
| Span® 60 | 4.00 | 4.00 | – | – | |
| Aqueous | Ultrapure water | 68.00 | 67.40 | 74.24 | – |
| Tween® 80 | 3.00 | 3.00 | – | – | |
| Carbopol® Ultrez 20 | – | 0.60 | – | – | |
| PVA | – | – | 0.74 | – | |
| PBS (pH 7.4) | – | – | – | 87.83 | |
| Cryoprotectant | Sucrose | – | – | 0.03 | – |
| Organic * | Ibuprofen | – | – | 0.12 | – |
| PCL | – | – | 0.12 | – | |
| DCM | – | – | 24.75 | – | |
| Solid * | Ibuprofen-loaded NPs | – | – | – | 12.17 |
| NE | NEG | CS | |
|---|---|---|---|
| Particle/droplet size (nm) | 92.807 ± 0.732 | 48.230 ± 0.803 | 166.433 ± 0.929 |
| PDI | 0.177 ± 0.003 | 0.311 ± 0.250 | 0.279 ± 0.014 |
| Zeta-potential (mV) | −33.367 ± 0.987 | −36.400 ± 0.500 | −25.433 ± 0.651 |
| pH | 5.092 ± 0.016 | 5.054 ± 0.004 | 6.607 ± 0.003 |
| Viscosity (cP) | 54 ± 10 | 38 738 ± 1 069 | - |
| NE | NEG | CS | MP | |
|---|---|---|---|---|
| n | 10 | 10 | 10 | 10 |
| Average %released (%) | 2.812 ± 0.227 | 2.339 ± 0.159 | 7.862 ± 0.325 | 2.159 ± 0.257 |
| Average flux (μg/cm2.h) | 429.26 ± 34.919 | 355.46 ± 24.68 | 546.76 ± 23.61 | 322.38 ± 31.314 |
| Median flux (μg/cm2.h) | 430.715 | 350.925 | 545.165 | 326.460 |
| NE | NEG | CS | MP | |
|---|---|---|---|---|
| n | 10 | 10 | 10 | 9 |
| Average concentration diffused (µg/mL) | 389.31 ± 41.95 | 302.64 ± 35.30 | 202.93 ± 35.70 | 1670.37 ± 104.61 |
| Average %diffused (%) | 0.776 ± 0.08 | 0.605 ± 0.07 | 0.870 ± 0.15 | 3.341 ± 0.21 |
| Average flux 1 (μg/cm2.h) | 58.28 ± 5.40 | 47.88 ± 7.48 | 33.65 ± 6.55 | 527.48 ± 100.17 |
| Average flux 2 (μg/cm2.h) | 61.73 ± 6.77 | 50.22 ± 5.41 | 32.17 ± 5.49 | 228.29 ± 14.55 |
| Median flux 1 (μg/cm2.h) | 56.13 | 50.75 | 34.62 | 541.70 |
| Median flux 2 (μg/cm2.h) | 63.19 | 48.41 | 32.67 | 231.63 |
| NE | NEG | CS | MP | |
|---|---|---|---|---|
| Average concentration in SCE (μg/mL) | 17.028 ± 5.12 | 8.180 ± 2.07 | 23.233 ± 7.84 | 9.727 ± 4.02 |
| Average concentration in ED (μg/mL) | 23.041 ± 22.60 | 14.083 ± 4.63 | 33.036 ± 15.88 | 43.461 ± 15.51 |
| Median concentration in SCE (μg/mL) | 17.04 | 7.50 | 19.75 | 9.05 |
| Median concentration in ED (μg/mL) | 12.50 | 13.47 | 28.44 | 37.88 |
| Treatment Group | IC50 Value (µg/mL) | |
|---|---|---|
| MTT-Assay | NR-Assay | |
| Ibuprofen | 372 | 317 |
| NE | 251 | 70 |
| PNE | 1268 | 730 |
| CS | 574 | 604 |
Disclaimer/Publisher’s Note: The statements, opinions and data contained in all publications are solely those of the individual author(s) and contributor(s) and not of MDPI and/or the editor(s). MDPI and/or the editor(s) disclaim responsibility for any injury to people or property resulting from any ideas, methods, instructions or products referred to in the content. |
© 2023 by the authors. Licensee MDPI, Basel, Switzerland. This article is an open access article distributed under the terms and conditions of the Creative Commons Attribution (CC BY) license (https://creativecommons.org/licenses/by/4.0/).
Share and Cite
Myburgh, J.; Liebenberg, W.; Willers, C.; Dube, A.; Gerber, M. Investigation and Evaluation of the Transdermal Delivery of Ibuprofen in Various Characterized Nano-Drug Delivery Systems. Pharmaceutics 2023, 15, 2413. https://doi.org/10.3390/pharmaceutics15102413
Myburgh J, Liebenberg W, Willers C, Dube A, Gerber M. Investigation and Evaluation of the Transdermal Delivery of Ibuprofen in Various Characterized Nano-Drug Delivery Systems. Pharmaceutics. 2023; 15(10):2413. https://doi.org/10.3390/pharmaceutics15102413
Chicago/Turabian StyleMyburgh, Jeanri, Wilna Liebenberg, Clarissa Willers, Admire Dube, and Minja Gerber. 2023. "Investigation and Evaluation of the Transdermal Delivery of Ibuprofen in Various Characterized Nano-Drug Delivery Systems" Pharmaceutics 15, no. 10: 2413. https://doi.org/10.3390/pharmaceutics15102413