
An Investigation of O-Demethyl Tramadol/Tramadol Ratio for Cytochrome P450 2D6 Phenotyping: The CYTRAM Study
 , , , and
Abstract
:
1. Introduction
2. Methods
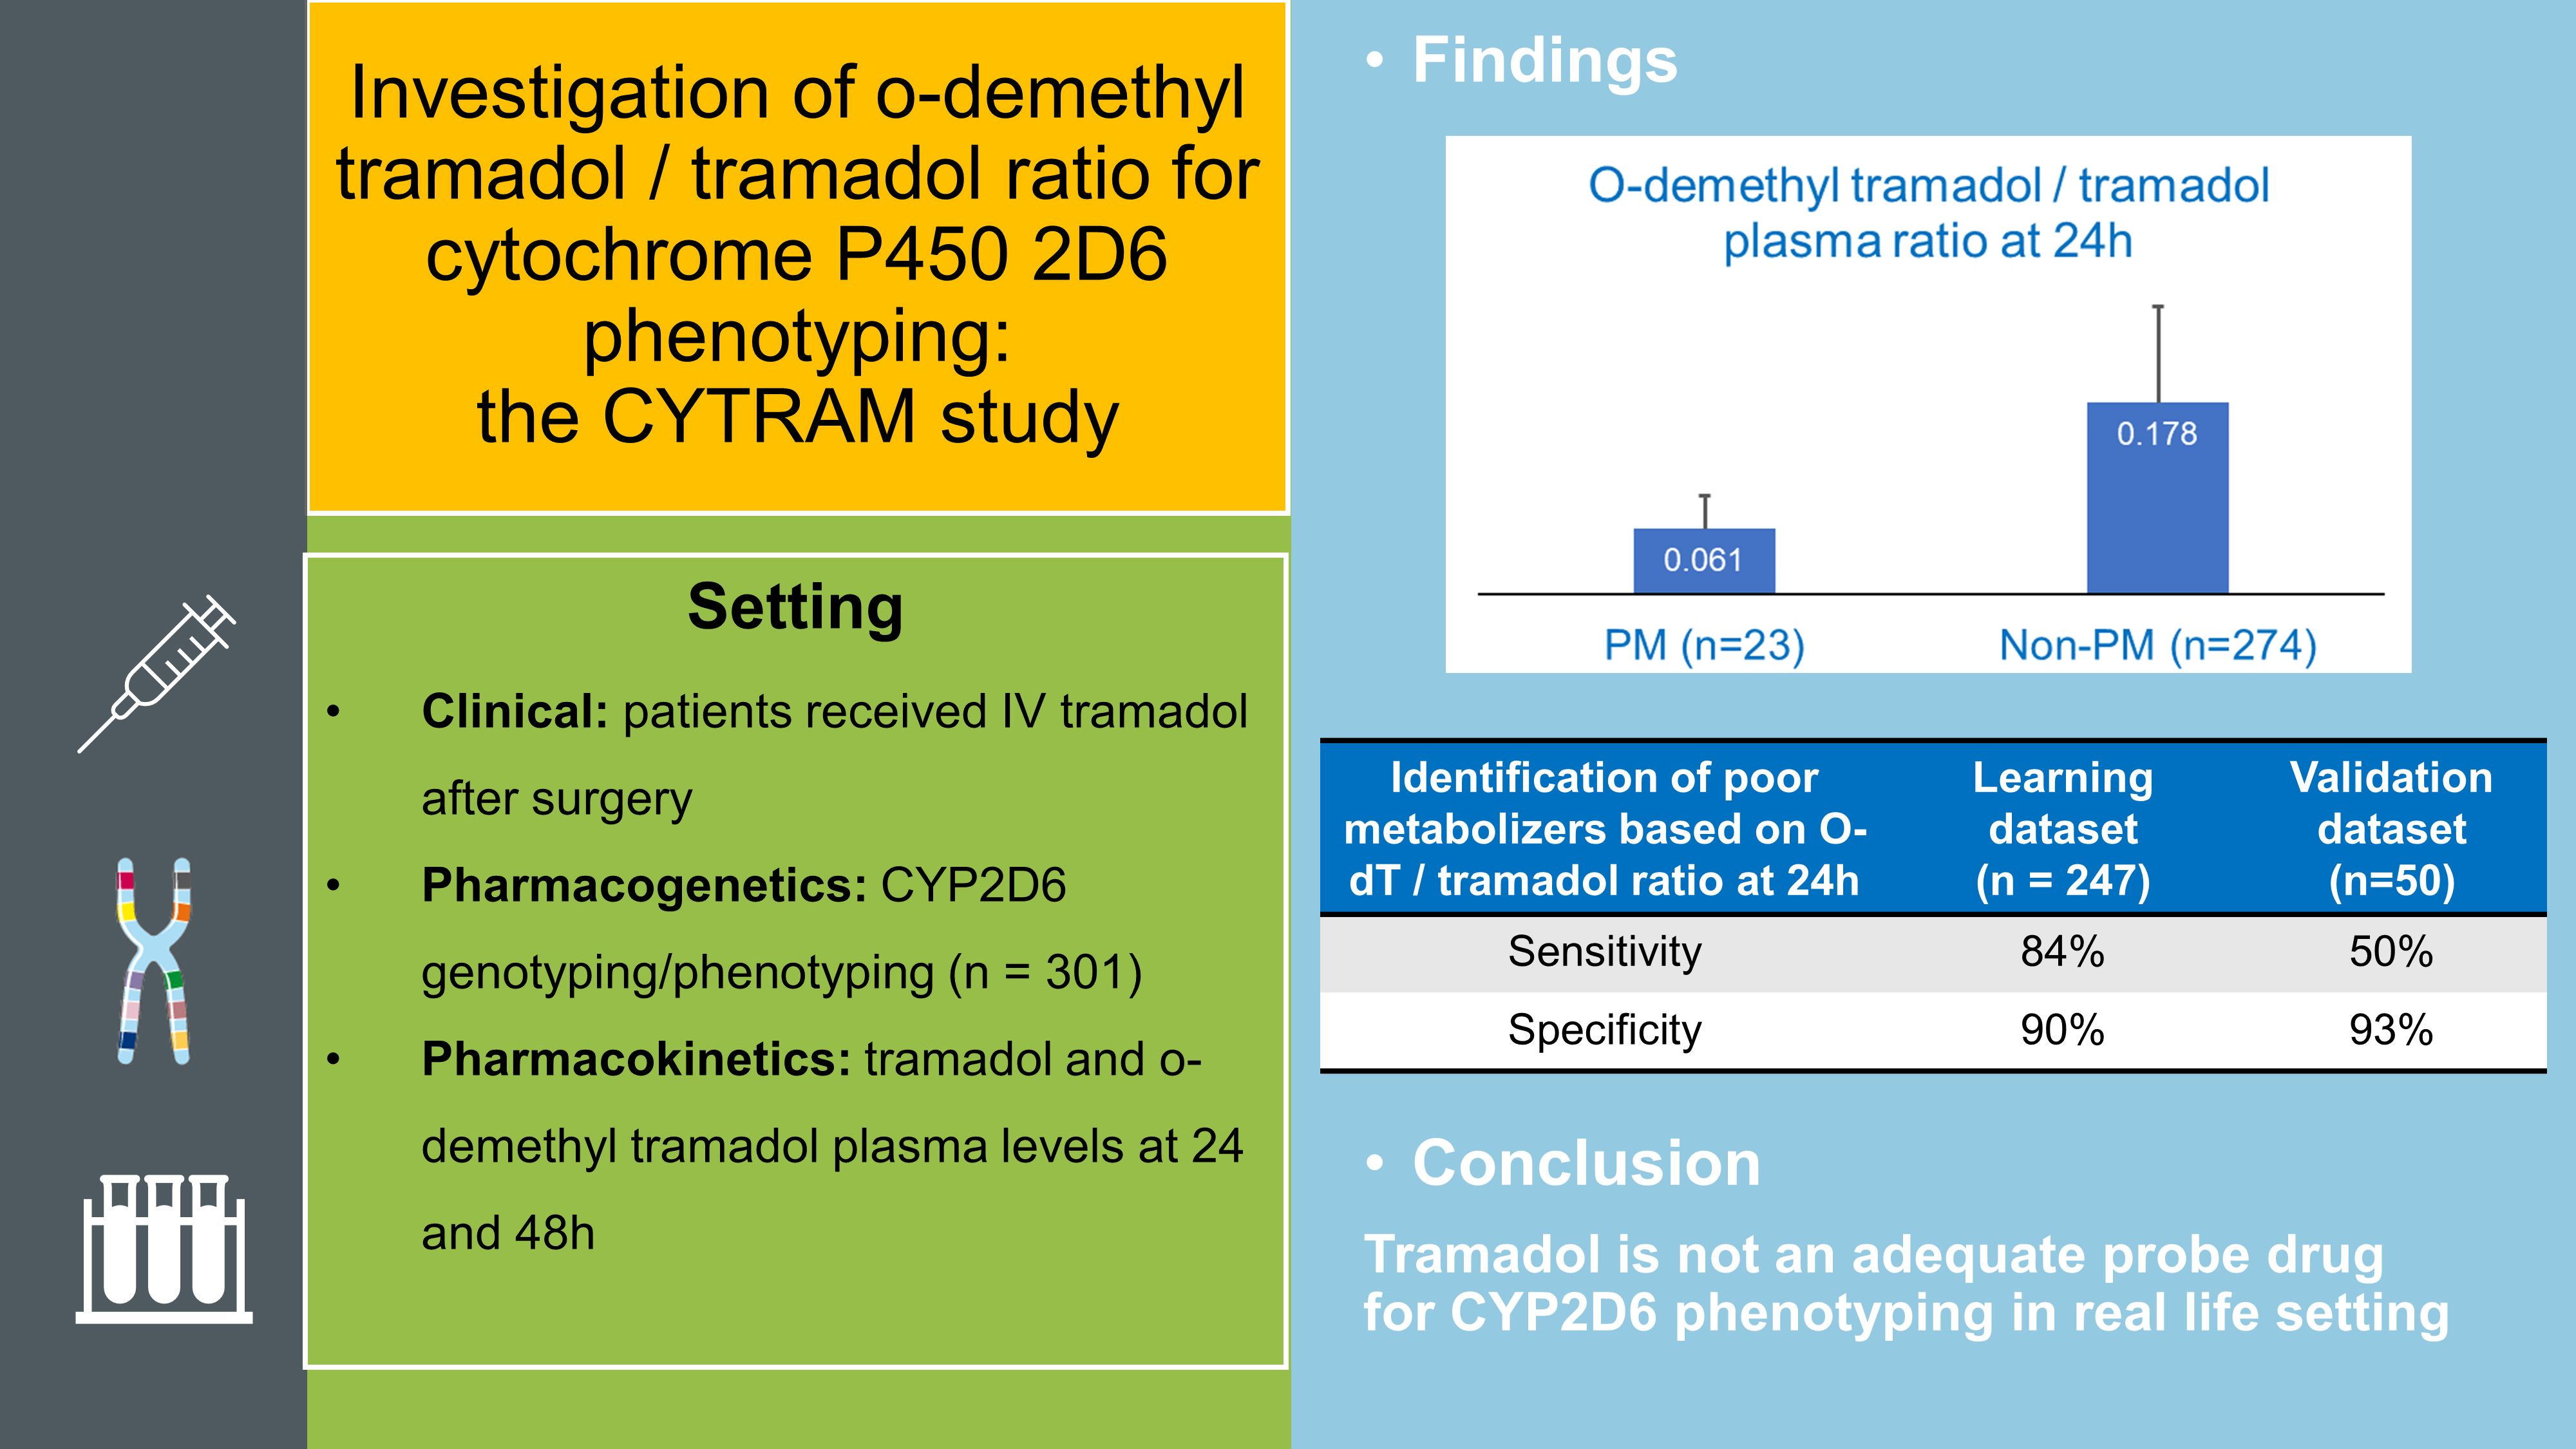
2.1. Patients
2.2. CYP2D6 Genotyping and Phenotyping
2.3. Determination of Tramadol and O-dT Concentrations
2.4. Statistical Analysis
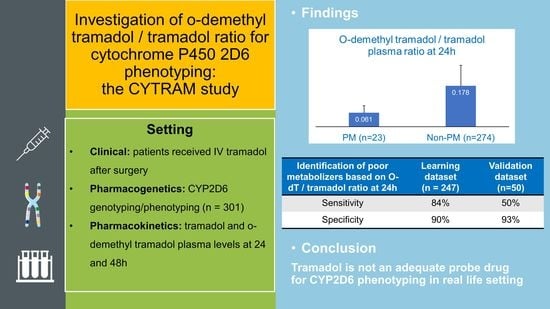
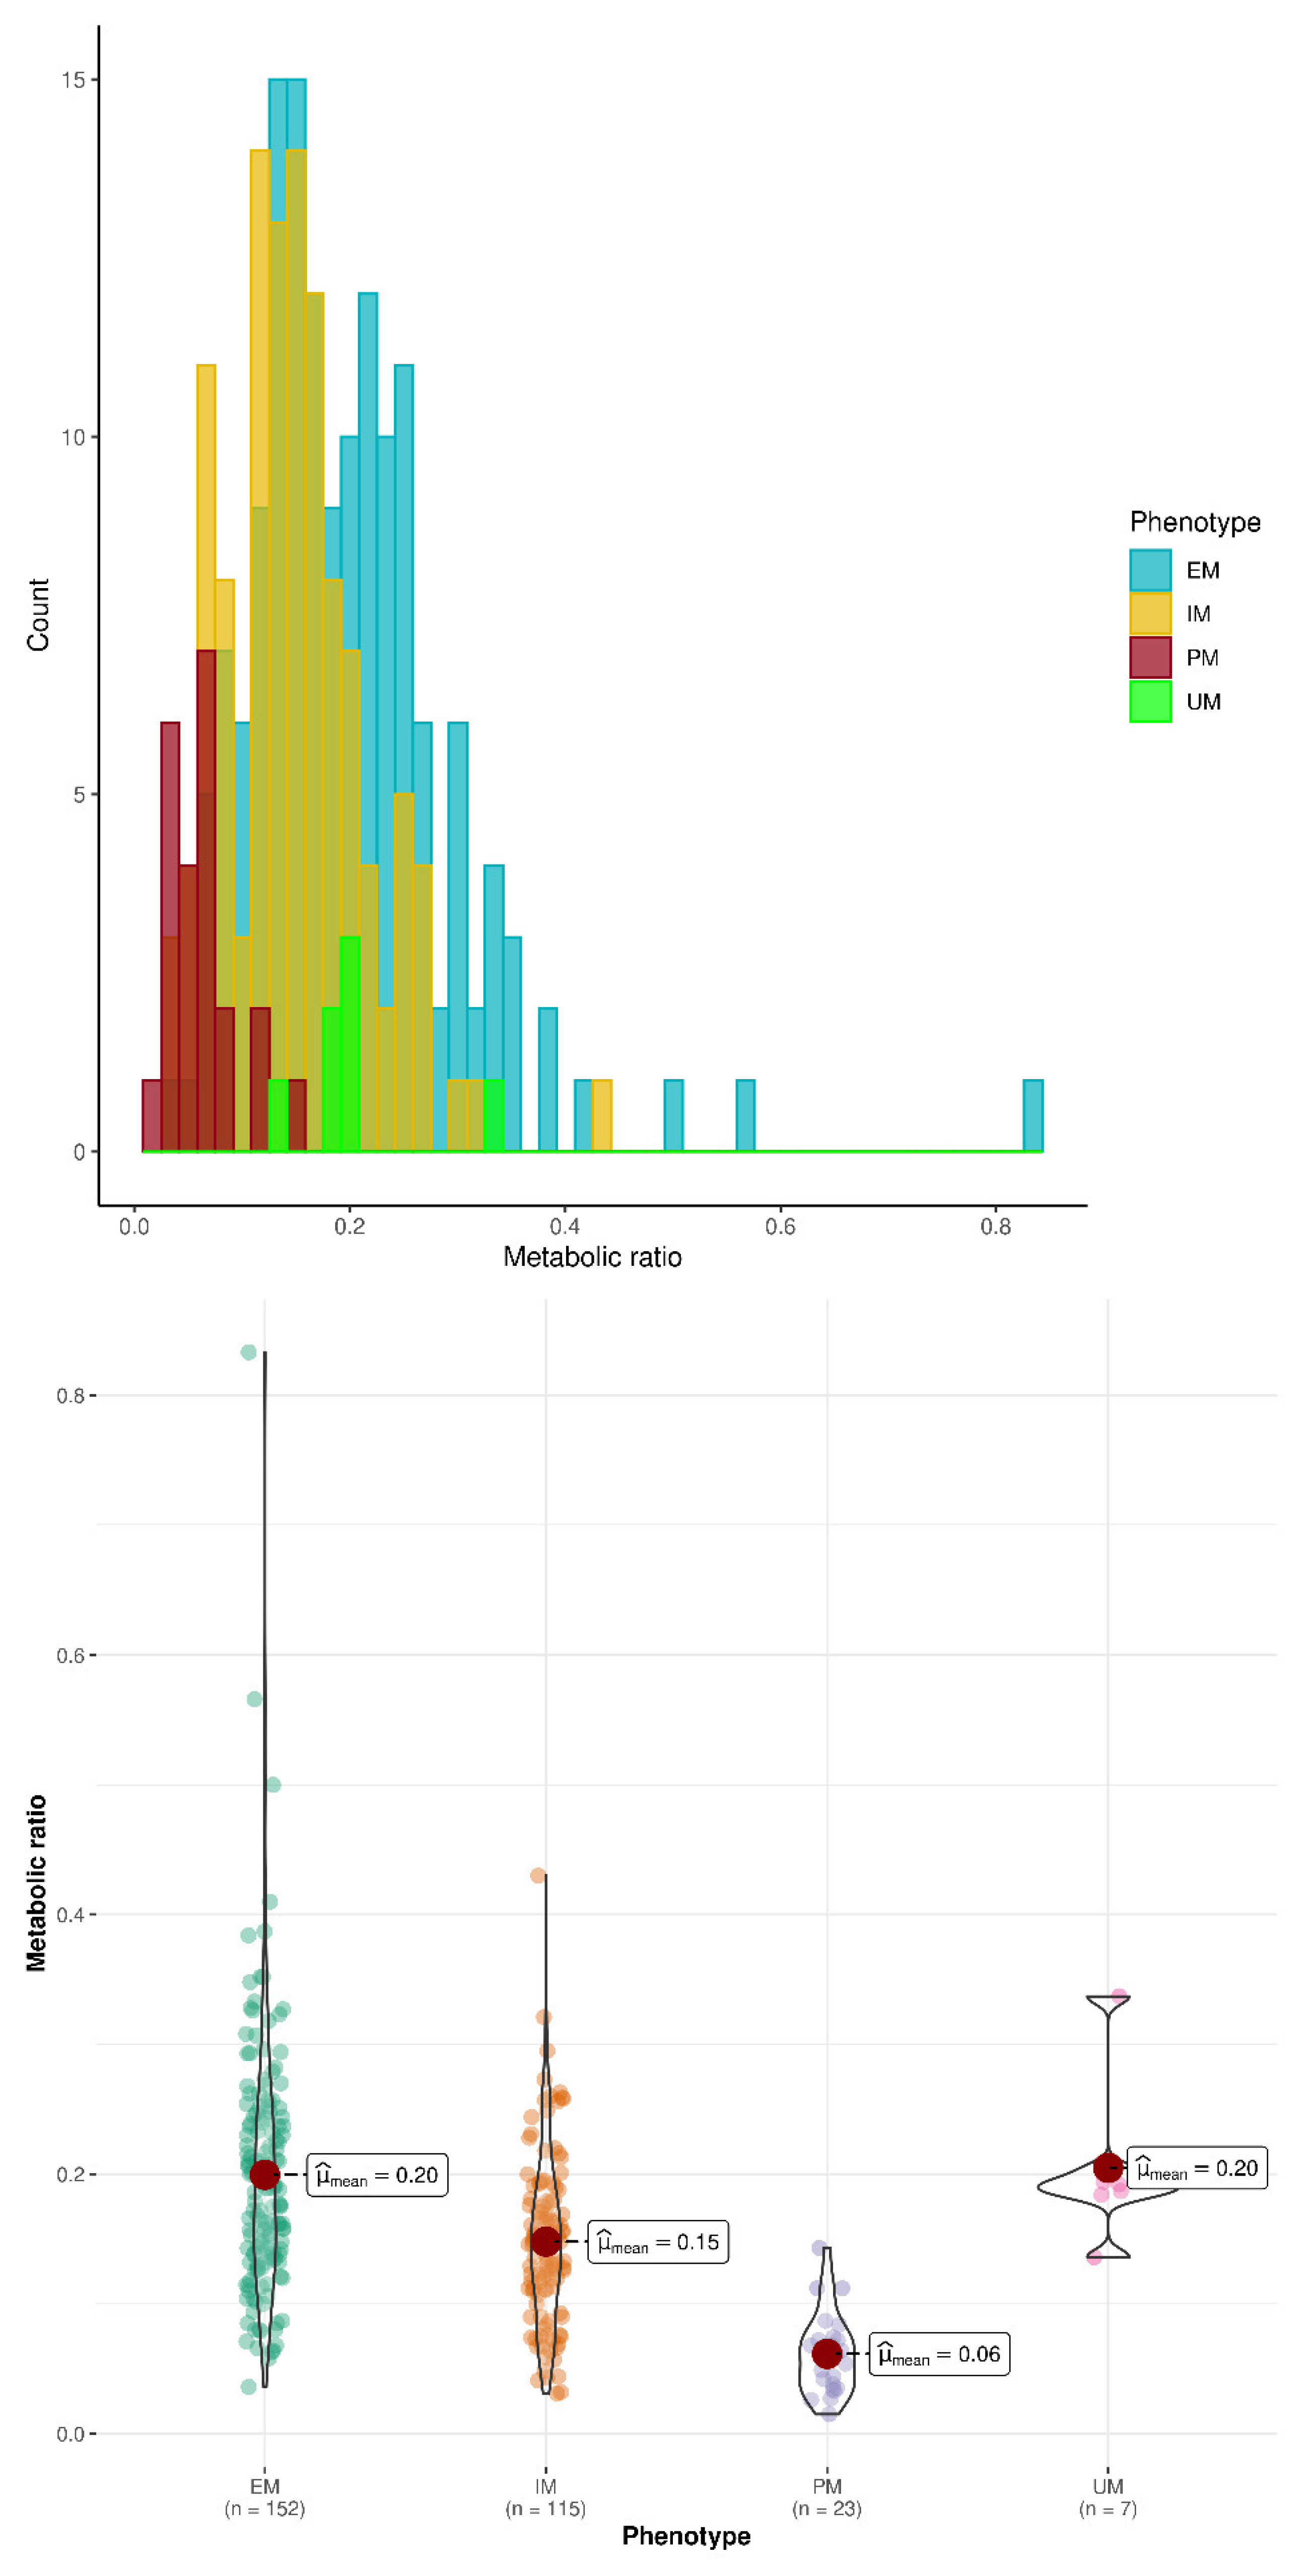
3. Results
3.1. Patients’ Characteristics
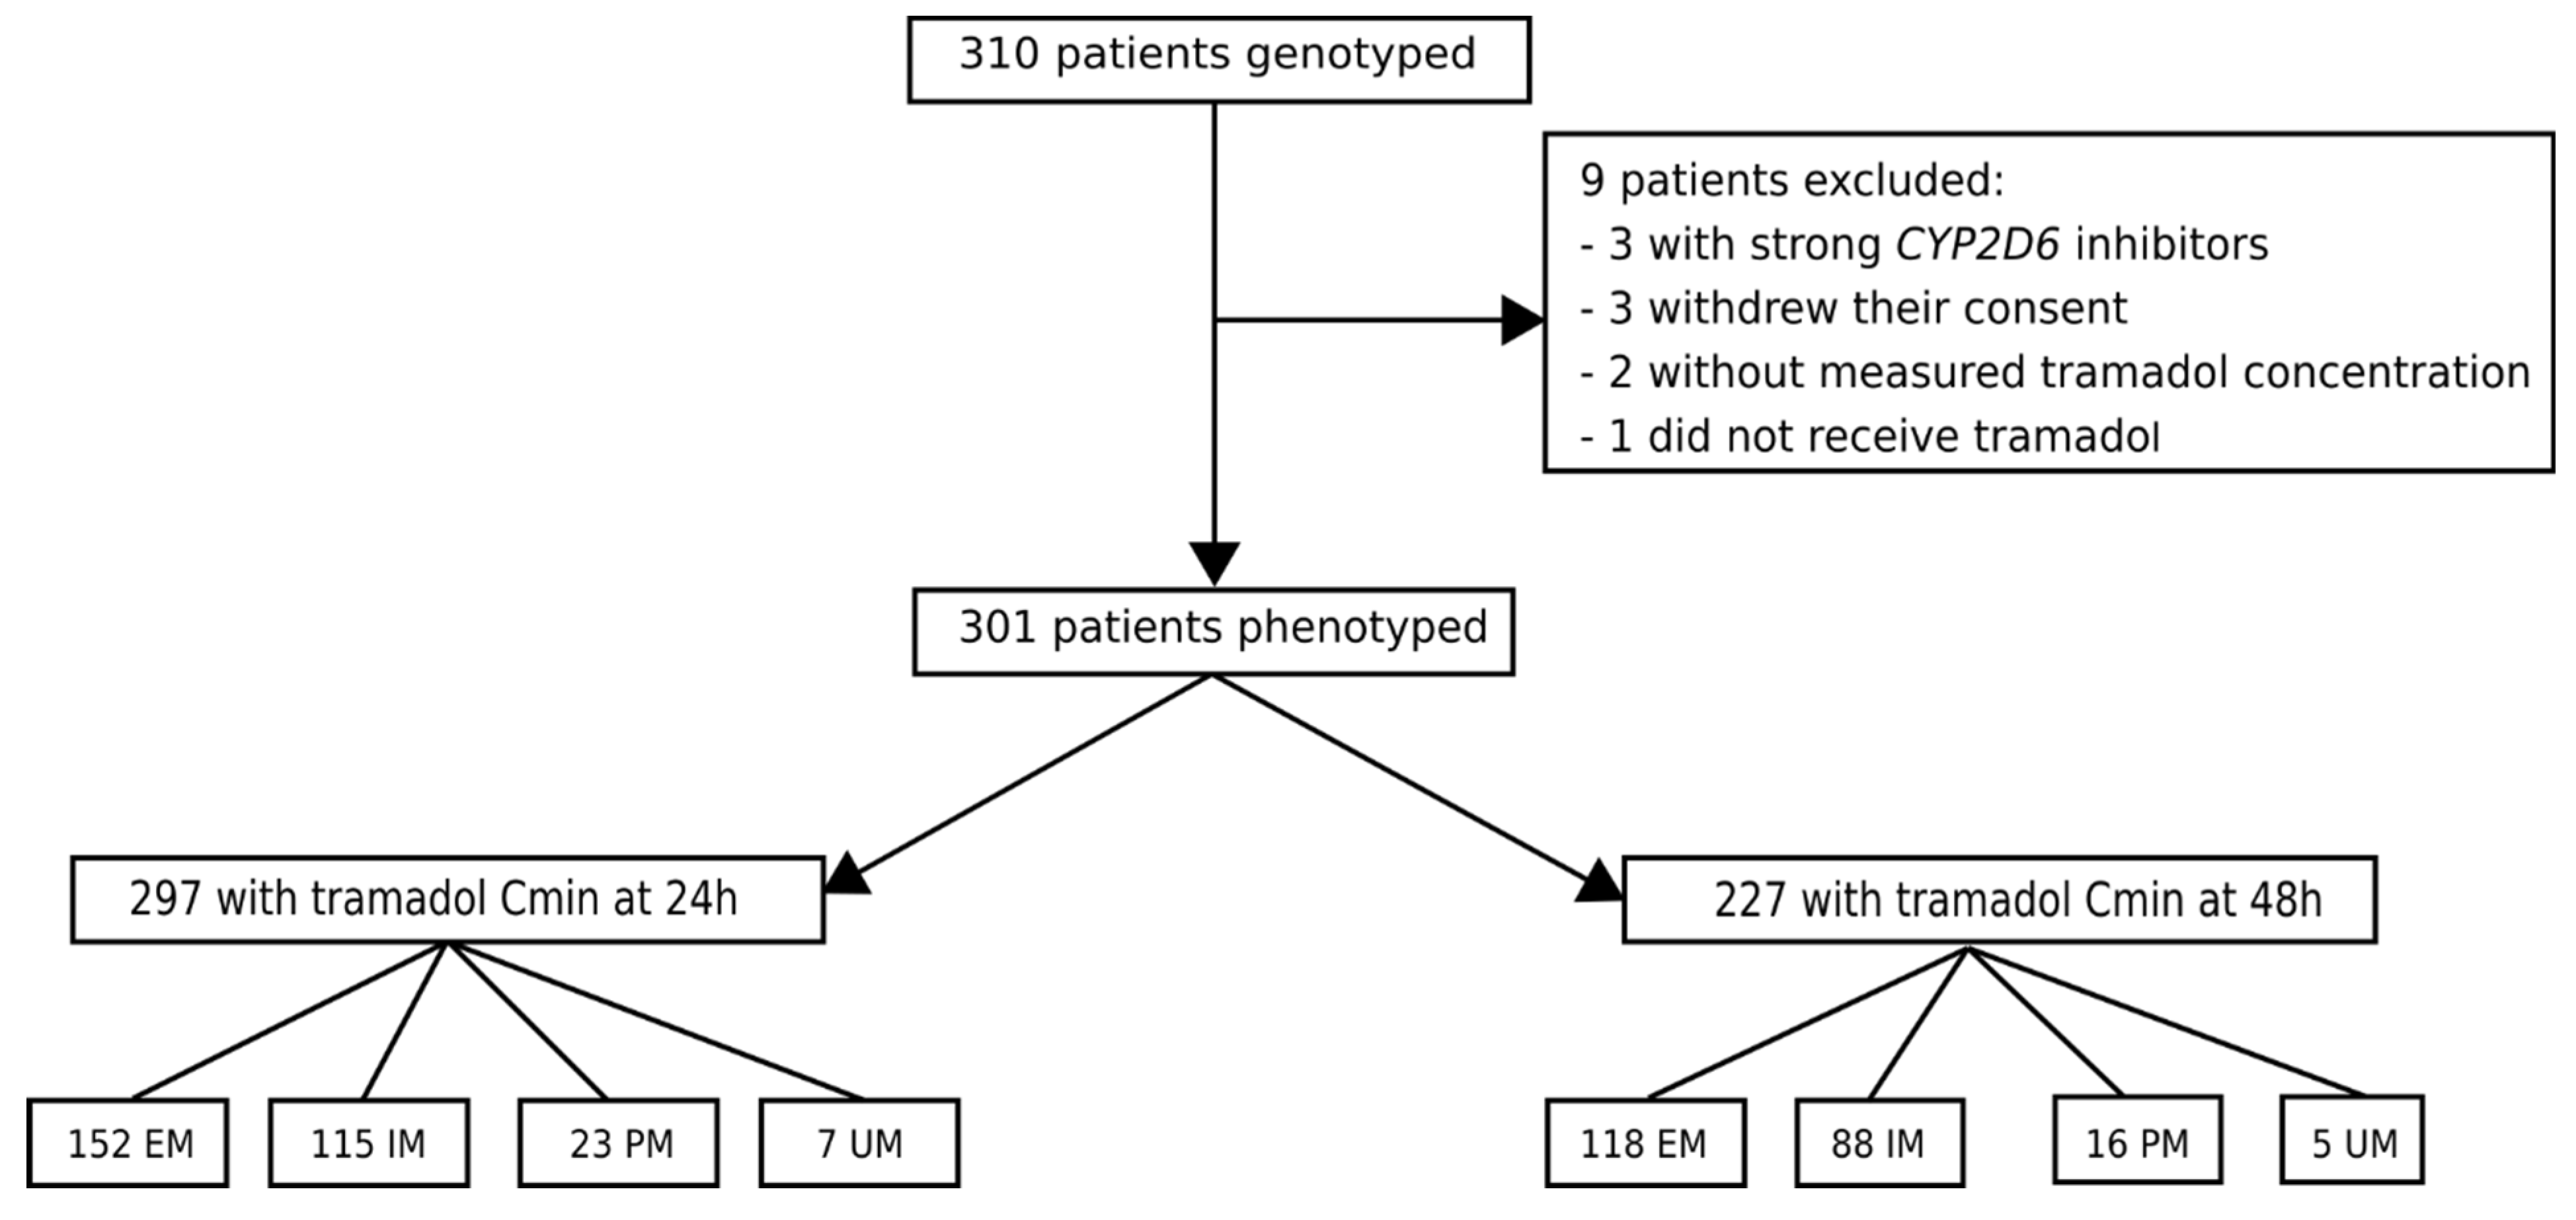
3.2. Prediction of CYP2D6 Phenotype Based on O-dT/T Ratio
4. Discussion
5. Conclusions
Author Contributions
Funding
Institutional Review Board Statement
Informed Consent Statement
Data Availability Statement
Conflicts of Interest
References
- The Pharmacogenomics Knowledgebase (PharmGKB). Very Important Pharmacogene: CYP2D6. Available online: https://www.pharmgkb.org/vip/PA166170264 (accessed on 27 April 2022).
- Nofziger, C.; Turner, A.J.; Sangkuhl, K.; Whirl-Carrillo, M.; Agundez, J.A.G.; Black, J.L.; Dunnenberger, H.M.; Ruano, G.; Kennedy, M.A.; Phillips, M.S.; et al. PharmVar GeneFocus: CYP2D6. Clin. Pharmacol. Ther. 2020, 107, 154–170. [Google Scholar] [CrossRef] [PubMed] [Green Version]
- Caudle, K.E.; Sangkuhl, K.; Whirl-Carrillo, M.; Swen, J.J.; Haidar, C.E.; Klein, T.E.; Gammal, R.S.; Relling, M.V.; Scott, S.A.; Hertz, D.L.; et al. Standardizing CYP2D6 Genotype to Phenotype Translation: Consensus Recommendations from the Clinical Pharmacogenetics Implementation Consortium and Dutch Pharmacogenetics Working Group. Clin. Transl. Sci. 2020, 13, 116–124. [Google Scholar] [CrossRef] [PubMed] [Green Version]
- Zanger, U.M.; Schwab, M. Cytochrome P450 enzymes in drug metabolism: Regulation of gene expression, enzyme activities, and impact of genetic variation. Pharmacol. Ther. 2013, 138, 103–141. [Google Scholar] [CrossRef]
- Ingelman-Sundberg, M.; Sim, S.C.; Gomez, A.; Rodriguez-Antona, C. Influence of cytochrome P450 polymorphisms on drug therapies: Pharmacogenetic, pharmacoepigenetic and clinical aspects. Pharmacol. Ther. 2007, 116, 496–526. [Google Scholar] [CrossRef] [PubMed]
- Zanger, U.M.; Raimundo, S.; Eichelbaum, M. Cytochrome P450 2D6: Overview and update on pharmacology, genetics, biochemistry. Naunyn Schmiedebergs Arch. Pharmacol. 2004, 369, 23–37. [Google Scholar] [CrossRef]
- Gaedigk, A.; Sangkuhl, K.; Whirl-Carrillo, M.; Klein, T.; Leeder, J.S. Prediction of CYP2D6 phenotype from genotype across world populations. Genet. Med. 2017, 19, 69–76. [Google Scholar] [CrossRef] [Green Version]
- Dong, A.N.; Tan, B.H.; Pan, Y.; Ong, C.E. Cytochrome P450 genotype-guided drug therapies: An update on current states. Clin. Exp. Pharmacol. Physiol. 2018, 45, 991–1001. [Google Scholar] [CrossRef] [PubMed] [Green Version]
- Lassen, D.; Damkier, P.; Brosen, K. The Pharmacogenetics of Tramadol. Clin. Pharmacokinet. 2015, 54, 825–836. [Google Scholar] [CrossRef]
- Subedi, M.; Bajaj, S.; Kumar, M.S.; Yc, M. An overview of tramadol and its usage in pain management and future perspective. Biomed Pharm. 2019, 111, 443–451. [Google Scholar] [CrossRef]
- Grond, S.; Sablotzki, A. Clinical pharmacology of tramadol. Clin. Pharmacokinet. 2004, 43, 879–923. [Google Scholar] [CrossRef] [PubMed]
- Stamer, U.M.; Lehnen, K.; Hothker, F.; Bayerer, B.; Wolf, S.; Hoeft, A.; Stuber, F. Impact of CYP2D6 genotype on postoperative tramadol analgesia. Pain 2003, 105, 231–238. [Google Scholar] [CrossRef]
- Crews, K.R.; Monte, A.A.; Huddart, R.; Caudle, K.E.; Kharasch, E.D.; Gaedigk, A.; Dunnenberger, H.M.; Leeder, J.S.; Callaghan, J.T.; Samer, C.F.; et al. Clinical Pharmacogenetics Implementation Consortium Guideline for CYP2D6, OPRM1, and COMT Genotypes and Select Opioid Therapy. Clin. Pharmacol. Ther. 2021, 110, 888–896. [Google Scholar] [CrossRef] [PubMed]
- Paar, W.D.; Poche, S.; Gerloff, J.; Dengler, H.J. Polymorphic CYP2D6 mediates O-demethylation of the opioid analgesic tramadol. Eur. J. Clin. Pharmacol. 1997, 53, 235–239. [Google Scholar] [CrossRef] [PubMed]
- Pedersen, R.S.; Damkier, P.; Brosen, K. Tramadol as a new probe for cytochrome P450 2D6 phenotyping: A population study. Clin. Pharmacol. Ther. 2005, 77, 458–467. [Google Scholar] [CrossRef] [PubMed]
- Garcia Quetglas, E.; Azanza, J.R.; Cardenas, E.; Sadaba, B.; Campanero, M.A. Stereoselective pharmacokinetic analysis of tramadol and its main phase I metabolites in healthy subjects after intravenous and oral administration of racemic tramadol. Biopharm Drug Dispos. 2007, 28, 19–33. [Google Scholar] [CrossRef] [PubMed]
- Chytil, L.; Matouskova, O.; Cerna, O.; Pokorna, P.; Vobruba, V.; Perlik, F.; Slanar, O. Enantiomeric determination of tramadol and O-desmethyltramadol in human plasma by fast liquid chromatographic technique coupled with mass spectrometric detection. J. Chromatogr. B Analyt. Technol. Biomed. Life Sci. 2010, 878, 481–486. [Google Scholar] [CrossRef]
- Li, Q.; Wang, R.; Guo, Y.; Wen, S.; Xu, L.; Wang, S. Relationship of CYP2D6 genetic polymorphisms and the pharmacokinetics of tramadol in Chinese volunteers. J. Clin. Pharm. Ther. 2010, 35, 239–247. [Google Scholar] [CrossRef] [PubMed]
- Levo, A.; Koski, A.; Ojanpera, I.; Vuori, E.; Sajantila, A. Post-mortem SNP analysis of CYP2D6 gene reveals correlation between genotype and opioid drug (tramadol) metabolite ratios in blood. Forensic Sci. Int. 2003, 135, 9–15. [Google Scholar] [CrossRef]
- Tanaka, H.; Naito, T.; Sato, H.; Hiraide, T.; Yamada, Y.; Kawakami, J. Impact of CYP genotype and inflammatory markers on the plasma concentrations of tramadol and its demethylated metabolites and drug tolerability in cancer patients. Eur. J. Clin. Pharmacol. 2018, 74, 1461–1469. [Google Scholar] [CrossRef] [PubMed]
- Owen, R.P.; Sangkuhl, K.; Klein, T.E.; Altman, R.B. Cytochrome P450 2D6. Pharmacogenet. Genom. 2009, 19, 559–562. [Google Scholar] [CrossRef] [PubMed]
- Demsar, J.; Curk, T.; Erjavec, A.; Gorup, C.; Hocevar, T.; Milutinovic, M.; Mozina, M.; Polajnar, M.; Toplak, M.; Staric, A.; et al. Orange: Data mining toolbox in Python. J. Mach. Learn. Res. 2013, 14, 2349–2353. [Google Scholar]
- Coller, J.K.; Michalakas, J.R.; James, H.M.; Farquharson, A.L.; Colvill, J.; White, J.M.; Somogyi, A.A. Inhibition of CYP2D6-mediated tramadol O-demethylation in methadone but not buprenorphine maintenance patients. Br. J. Clin. Pharmacol. 2012, 74, 835–841. [Google Scholar] [CrossRef] [PubMed] [Green Version]
- Allegaert, K.; Holford, N.; Anderson, B.J.; Holford, S.; Stuber, F.; Rochette, A.; Troconiz, I.F.; Beier, H.; de Hoon, J.N.; Pedersen, R.S.; et al. Tramadol and o-desmethyl tramadol clearance maturation and disposition in humans: A pooled pharmacokinetic study. Clin. Pharmacokinet. 2015, 54, 167–178. [Google Scholar] [CrossRef] [PubMed] [Green Version]
- Gong, L.; Stamer, U.M.; Tzvetkov, M.V.; Altman, R.B.; Klein, T.E. PharmGKB summary: Tramadol pathway. Pharmacogenet. Genom. 2014, 24, 374–380. [Google Scholar] [CrossRef] [Green Version]
- Barbosa, J.; Faria, J.; Queiros, O.; Moreira, R.; Carvalho, F.; Dinis-Oliveira, R.J. Comparative metabolism of tramadol and tapentadol: A toxicological perspective. Drug Metab. Rev. 2016, 48, 577–592. [Google Scholar] [CrossRef]
- Vay, M.; Meyer, M.J.; Blank, A.; Skopp, G.; Rose, P.; Tzvetkov, M.V.; Mikus, G. Oral Yohimbine as a New Probe Drug to Predict CYP2D6 Activity: Results of a Fixed-Sequence Phase I Trial. Clin. Pharmacokinet. 2020, 59, 927–939. [Google Scholar] [CrossRef] [Green Version]
- Van der Lee, M.; Kriek, M.; Guchelaar, H.J.; Swen, J.J. Technologies for Pharmacogenomics: A Review. Genes 2020, 11, 1456. [Google Scholar] [CrossRef]


| Extensive Metabolizers. (n = 154) | Poor Metabolizers (n = 23) | Intermediate Metabolizers (n = 117) | Ultra-Rapid Metabolizers (n = 7) |
|---|---|---|---|
| *1–2/*1–2 (n = 112) *1/*41 (n = 42) | *3/*3 (n = 1) *4/*4 (n = 13) *3/*4 (n = 6) *4/*5 (n = 3) | *1–2/*3 (n = 5) *1–2/*4 (n = 96) *1/*5 (n = 13) *1/*6 (n= 1) *1/*7 (n = 2) | *1–2/*1–2 × N (n = 7) |
| PM | Non-PM | IM | EM | UM | PM-IM | EM-UM | All Subjects | |
|---|---|---|---|---|---|---|---|---|
| Number of subjects (number with concentration data at 24 h) | 23 (23) | 278 (274) | 117 (115) | 154 (152) | 7 (7) | 140 (138) | 161 (159) | 301 (297) |
| Sex (% male) | 57 | 55 | 60 | 53 | 71 | 48 | 52 | 56 |
| Age | 60.5 (12.7) | 59.7 (14.5) | 59.5 (13.8) | 60.0 (14.9) | 59.65 (16.4) | 59.7 (13.7) | 60.0 (17.8) | 59.9 (14.3) |
| Digestive surgery | 77.3% | 61.2% | 55.5% | 64.9% | 71.4% | 59.1% | 65.2% | 62.6% |
| Orthopedic surgery | 22.7% | 26.1% | 30.9% | 23.2% | 14.3% | 29.6% | 22.8% | 25.5% |
| Urologic surgery | 0% | 11.2% | 11.8% | 11.3% | 0% | 9.9% | 10.8% | 10.5% |
| Other surgery | 0% | 1.5% | 1.8% | 0.7% | 14.3% | 1.5% | 1.3% | 1.4% |
| Weight (kg) | 74.9 (14.3) | 77.6 (16.9) | 76.9 (17.0) | 78.4 (17.1) | 73.3 (8.7) | 75.9 (16.4) | 78.4 (16.9) | 77.3 (16.7) |
| Serum creatinine (µmol/L) | 77.7 (27.0) | 79.4 (22.2) | 80.8 (23.4) | 78.7 (21.4) | 73.1 (17.2) | 80.4 (24.3) | 78.3 (21.2) | 79.2 (22.7) |
| PT (%) | 97.1 (6.2) | 96.5 (7.1) | 95.4 (8.2) | 97.2 (6.3) | 99.3 (1.8) | 95.7 (7.9) | 97.3 (6.2) | 96.6 (7.1) |
| Mean dose of tramadol at 24 h (mg) | 433 (83) | 430 (78) | 428 (73) | 430 (83) | 457 (50) | 429 (75) | 431 (82) | 430 (79) |
| Mean dose of tramadol at 48 h | 353 (61) | 340 (54) | 336 (54) | 342 (54) | 357 (50) | 338 (55) | 343 (54) | 341 (54) |
| Tramadol concentration (µg/L) at 24 h | 487 (215) | 452 (216) | 452 (213) | 449 (219) | 495 (213) | 458 (214) | 451 (219) | 454 (217) |
| Tramadol concentration (µg/L) at 48 h | 545 (263) | 420 (263) | 389 (268) | 442 (262) | 406 (119) | 414 (278) | 441 (258) | 429 (267) |
| O-dT concentration (µg/L) at 24 h | 31 ab (22) | 76 a (45) | 67 bc (46) | 81 c (43) | 103 (56) | 61 d (45) | 82 d (44) | 72 (46) |
| O-dT concentration (µg/L) at 48 h | 33 ab (24) | 68 a (50) | 60 b (54) | 74 (47) | 71 (32) | 55 (52) | 74 (46) | 66 (50) |
| O-dT/T at 24h Mean (SD) | 0.061 ab (0.031) | 0.178 a (0.090) | 0.145 bc (0.066) | 0.198 c (0.099) | 0.204 (0.058) | 0.134 d (0.070) | 0.200 d (0.098) | 0.172 (0.092) |
| O-dT/T at 48 h Mean (SD) | 0.063 ab (0.032) | 0.182 a (0.109) | 2.407 b (0.121) | 0.189 (0.099) | 0.174 (0.053) | 0.154 (0.119) | 0.191 d (0.098) | 0.177 (0.110) |
| O-dT/T at 24 h Min-Max Median | 0.015–0.143 0.061 | 0.031–0.833 0.163 | 0.031–0.43 0.146 | 0.036–0.833 0.189 | 0.136–0.337 0.192 | 0.015–0.43 0.129 | 0.036–0.833 0.143 | 0.015–0.833 0.157 |
| O-dT/T at 48 h Min-Max Median | 0.025–0.044 0.064 | 0.039–1 0.166 | 0.044–1 0.154 | 0.039–0.8 0.167 | 0.116–0.268 0.165 | 0.025–1 0.186 | 0.039–0.8 0.170 | 0.025–1 0.158 |
| PM vs. Non-PM | PM vs. IM | IM vs. EM | IM vs. EM + UM | EM vs. UM | UM vs. Non-UM | PM-IM vs. EM-UM | |
|---|---|---|---|---|---|---|---|
| O-dT/T ratio at 24 h | |||||||
| O-dT/T ratio cut-off | ≤0.0745 | ≤0.0745 | ≤0.196 | ≤0.196 | ≤0.182 | ≤0.184 | ≤0.132 |
| Sensitivity | 50% (84%) | 50% (84%) | 65% (86%) | 65% (86%) | 0% (100%) | 100% (17%) | 42% (55%) |
| Specificity | 93% (90%) | 85% (86%) | 52% (45%) | 50% (44%) | 60% (17%) | 47% (34%) | 77% (80%) |
| PPV | 40% (42%) | 40% (55%) | 52% (54%) | 50% (53%) | 0% (5%) | 4% (1%) | 63% (70%) |
| NPV | 96% (100%) | 89% (96%) | 65% (81%) | 65% (82%) | 94% (100%) | 100% (94%) | 59% (68%) |
| O-dT/T ratio at 48 h | |||||||
| O-dT/T ratio cut-off | ≤0.076 | ≤0.098 | ≤0.087 | ≤0.098 | ≤0.270 | ≤0.114 | ≤0.087 |
| Sensitivity | 75% (75%) | 75% (92%) | 20% (20%) | 20% (20%) | 100% (20%) | 0% (0%) | 29% (30%) |
| Specificity | 89% (93%) | 75% (78%) | 92% (96%) | 92% (96%) | 12% (50%) | 67% (73%) | 92% (96%) |
| PPV | 43% (81%) | 38% (58%) | 67% (77%) | 67% (77%) | 4% (2%) | 0% (0%) | 78% (86%) |
| NPV | 98% (98%) | 94% (98%) | 59% (62%) | 60% (63%) | 100% (93%) | 97% (97%) | 59% (62%) |
| PM vs. Non-PM | PM vs. IM | IM vs. EM + UM | IM vs. EM | EM vs. UM | UM vs. Non-UM | PM-IM vs. EM-UM | |
|---|---|---|---|---|---|---|---|
| O-dT/T ratio cut-off at 24 h | ≤0.0745 | ≤0.089 | ≤0.196 | ≤0.196 | ≤0.195 | ≤0.183 | ≤0.172 |
| O-dT/T ratio cut-off at 48 h | NA | NA | ≤0.087 | ≤0.087 | NA | NA | ≤0.087 |
| Sensitivity | 75% (83%) | 75% (89%) | 20% (20%) | 20% (20%) | 0% (83%) | 0% (0%) | 29% (29%) |
| Specificity | 91% (90%) | 75% (81%) | 92% (96%) | 92% (96%) | 40% (50%) | 33% (94%) | 92% (96%) |
| PPV | 43% (38%) | 38% (49%) | 67% (76%) | 67% (76%) | 0% (7%) | 0% (37%) | 78% (85%) |
| NPV | 98% (99%) | 94% (97%) | 60% (63%) | 59% (69%) | 88% (98%) | 94% (94%) | 59% (62%) |
Publisher’s Note: MDPI stays neutral with regard to jurisdictional claims in published maps and institutional affiliations. |
© 2022 by the authors. Licensee MDPI, Basel, Switzerland. This article is an open access article distributed under the terms and conditions of the Creative Commons Attribution (CC BY) license (https://creativecommons.org/licenses/by/4.0/).
Share and Cite
De La Gastine, B.; Percevault, S.; Varin, L.; Richard, N.; Fobe, F.; Plaud, B.; Daccache, G.; Compere, V.; Parienti, J.-J.; Coquerel, A.; et al. An Investigation of O-Demethyl Tramadol/Tramadol Ratio for Cytochrome P450 2D6 Phenotyping: The CYTRAM Study. Pharmaceutics 2022, 14, 2177. https://doi.org/10.3390/pharmaceutics14102177
De La Gastine B, Percevault S, Varin L, Richard N, Fobe F, Plaud B, Daccache G, Compere V, Parienti J-J, Coquerel A, et al. An Investigation of O-Demethyl Tramadol/Tramadol Ratio for Cytochrome P450 2D6 Phenotyping: The CYTRAM Study. Pharmaceutics. 2022; 14(10):2177. https://doi.org/10.3390/pharmaceutics14102177
Chicago/Turabian StyleDe La Gastine, Blandine, Soizic Percevault, Laurent Varin, Nicolas Richard, Fabienne Fobe, Benoît Plaud, Georges Daccache, Vincent Compere, Jean-Jacques Parienti, Antoine Coquerel, and et al. 2022. "An Investigation of O-Demethyl Tramadol/Tramadol Ratio for Cytochrome P450 2D6 Phenotyping: The CYTRAM Study" Pharmaceutics 14, no. 10: 2177. https://doi.org/10.3390/pharmaceutics14102177