
Cyclodextrin Complexation as a Way of Increasing the Aqueous Solubility and Stability of Carvedilol

 , , , and
Abstract
:1. Introduction
2. Materials and Methods
2.1. Chemicals
2.2. Ultra High Performance Liquid Chromatography
2.3. Solubility Studies
2.4. Nuclear Magnetic Resonance (NMR) Analyses
2.5. Aggregation Studies
2.6. Complex Stoichiometry
2.7. Isothermal Titration Calorimetry (ITC) Studies
2.8. Mass Spectrometry Studies
2.9. UV Studies
2.10. Photostability Study
3. Results and Discussion
3.1. Solubility Studies
3.2. Aggregation Studies
3.3. Complexation Studies
3.3.1. NMR Studies
3.3.2. ITC Studies
3.4. Photostability Studies
4. Conclusions
Supplementary Materials
Author Contributions
Funding
Institutional Review Board Statement
Informed Consent Statement
Data Availability Statement
Acknowledgments
Conflicts of Interest
References
- Alabed, S.; Sabouni, A.; Al Dakhoul, S.; Bdaiwi, Y. Beta-blockers for congestive heart failure in children. Cochrane Database Syst. Rev. 2020, 7, CD007037. [Google Scholar] [CrossRef]
- European medicines Agency. Inventory of Paediatric Therapeutic Needs—Cardiovascular Diseases. Available online: https://www.ema.europa.eu/en/documents/other/inventory-paediatric-medicines-cardiovascular-therapeutic-area_en.pdf (accessed on 29 April 2021).
- Beattie, K.; Phadke, G.; Novakovic, J. Carvedilol. Profiles Drug Subst. Excip. Relat. Methodol. 2013, 38, 113–157. [Google Scholar] [CrossRef]
- Hamed, R.; Awadallah, A.; Sunoqrot, S.; Tarawneh, O.; Nazzal, S.; AlBaraghthi, T.; Al Sayyad, J.; Abbas, A. pH-Dependent Solubility and Dissolution Behavior of Carvedilol—Case Example of a Weakly Basic BCS Class II Drug. AAPS Pharm. Sci. Tech. 2016, 17, 418–426. [Google Scholar] [CrossRef] [Green Version]
- Mistry, P.; Batchelor, H. Evidence of acceptability of oral paediatric medicines: A review. J. Pharm. Pharmacol. 2017, 69, 361–376. [Google Scholar] [CrossRef] [Green Version]
- Salimi, A.; Zadeh, B.S.M.; Hemati, A.A.; Birgani, S.A. Design and Evaluation of Self-Emulsifying Drug Delivery System (SEDDS) Of Carvedilol to Improve the Oral Absorption. Jundishapur, J. Nat. Pharm. Prod. 2014, 9, e16125. [Google Scholar] [CrossRef] [PubMed] [Green Version]
- Zhang, Y.; Zhi, Z.; Li, X.; Gao, J.; Song, Y. Carboxylated mesoporous carbon microparticles as new approach to improve the oral bioavailability of poorly water-soluble carvedilol. Int. J. Pharm. 2013, 454, 403–411. [Google Scholar] [CrossRef] [PubMed]
- Planinšek, O.; Kovačič, B.; Vrečer, F. Carvedilol dissolution improvement by preparation of solid dispersions with porous silica. Int. J. Pharm. 2011, 406, 41–48. [Google Scholar] [CrossRef] [PubMed]
- Mathiron, D.; Lori, R.; Pilard, S.; Soundara Rajan, T.; Landy, D.; Mazzon, E.; Rollin, P.; Djedaïni-Pilard, F. A Combined Approach of NMR and Mass Spectrometry Techniques Applied to the α-Cyclodextrin/Moringin Complex for a Novel Bioactive Formulation. Molecules 2018, 23, 1714. [Google Scholar] [CrossRef] [PubMed] [Green Version]
- Oliva, E.; Mathiron, D.; Bertaut, E.; Landy, D.; Cailleu, D.; Pilard, S.; Clément, C.; Courot, E.; Bonnet, V.; Djedaïni-Pilard, F. Physico-chemical studies of resveratrol, methyl-jasmonate and cyclodextrin interactions: An approach to resveratrol bioproduction optimization. RSC Adv. 2018, 8, 1528–1538. [Google Scholar] [CrossRef] [Green Version]
- Loftsson, T. Cyclodextrins and the Biopharmaceutics Classification System of Drugs. J. Incl. Phenom. Macrocycl. Chem. 2002, 44, 63–67. [Google Scholar] [CrossRef]
- Savic-Gajic, I.; Savic, I.M.; Nikolic, V.D.; Nikolic, L.B.; Popsavin, M.M.; Kapor, A.J. Study of the solubility, photostability and structure of inclusion complexes of carvedilol with β-cyclodextrin and (2-hydroxypropyl)-β-cyclodextrin. J. Incl. Phenom. Macrocycl. Chem. 2016, 86, 7–17. [Google Scholar] [CrossRef]
- Sharma, A.; Jain, C.P. Carvedilol-β-cyclodextrin Systems: Preparation, Characterization and in vitro Evaluation. Dhaka Univ. J. Pharm. Sci. 2013, 12, 51–58. [Google Scholar] [CrossRef] [Green Version]
- Yuvaraja, K.; Das, S.K.; Khanam, J. Process optimization and characterization of carvedilol solid dispersion with hydroxypropyl-β-cyclodextrin and tartaric acid. Korean J. Chem. Eng. 2015, 32, 132–140. [Google Scholar] [CrossRef]
- Jessie, S.P.; Rachmat, M.; Visi, A.L. Improvement of carvedilol dissolution rate through formation of inclusion complex with B-cyclodextrin. Int. J. Pharm. Pharm. Sci. 2014, 6, 228–233. [Google Scholar]
- Pokharkar, V.; Khanna, A.; Venkatpurwar, V.; Dhar, S.; Mandpe, L. Ternary complexation of carvedilol, β-cyclodextrin and citric acid for mouth-dissolving tablet formulation. Acta Pharm. 2009, 59, 121–132. [Google Scholar] [CrossRef] [Green Version]
- Shewale, B.D.; Sapkal, N.P.; Raut, N.A.; Gaikwad, N.J.; Fursule, R.A. Effect of hydroxylpropyl-b-cyclodextrin on solubility of carvedilol. Indian J. Pharm. Sci. 2008, 70, 255–257. [Google Scholar] [CrossRef] [Green Version]
- Loftsson, T.; Vogensen, S.B.; Desbos, C.; Jansook, P. Carvedilol: Solubilization and cyclodextrin complexation: A technical note. AAPS Pharm. Sci. Tech. 2008, 9, 425–430. [Google Scholar] [CrossRef]
- Djedaïni-Pilard, F.; Nevers, M.-C.; Weisse, S.; Grassi, J.; Perly, B.; Créminon, C. A sensitive and specific enzyme immunoassay for the detection of methyl ether derivatives of cyclomaltoheptaose. Carbohydr. Res. 2003, 338, 2091–2099. [Google Scholar] [CrossRef]
- Sajan, P.G.; Rohith, T.; Santosh, P.; Mantelingu, K.; Rangappa, K.S.; Kumara, M.N. Rapid, Highly efficient and stability indicating RP-UPLC method for the quantitative determination of potential impurities of carvedilol active pharmaceutical ingredient. Int. J. Pharm. Pharm. Sci. 2014, 6, 214–220. [Google Scholar]
- Job, P. Formation and stability complexes in solution. Ann. Chim. 1928, 9, 113–203. [Google Scholar]
- Bertaut, E.; Landy, D. Improving ITC studies of cyclodextrin inclusion compounds by global analysis of conventional and non-conventional experiments. Beilstein, J. Org. Chem. 2014, 10, 2630–2641. [Google Scholar] [CrossRef] [PubMed] [Green Version]
- R Core Team. R: A Language and Environment for Statistical Computing; R Foundation for Statistical Computing: Vienna, Austria, 2017; Available online: https://www.R-project.org/ (accessed on 14 October 2021).
- Enrico, R.; Lajos, S.; Jozsef, S. Drug/cyclodextrin/hydroxy acid multicomponent systems. Properties and pharmaceutical applications. J. Pharm. Sci. 2000, 89, 1–8. [Google Scholar] [CrossRef]
- Fine-Shamir, N.; Beig, A.; Zur, M.; Lindley, D.; Miller, J.M.; Dahan, A. Toward Successful Cyclodextrin Based Solubility-Enabling Formulations for Oral Delivery of Lipophilic Drugs: Solubility-Permeability Trade-Off, Biorelevant Dissolution, and the Unstirred Water Layer. Mol. Pharm. 2017, 14, 2138–2146. [Google Scholar] [CrossRef]
- Food and Drug Administration. US FDA/CFSAN—Approximate pH of Foods and Food Products. Available online: https://www.webpal.org/SAFE/aaarecovery/2_food_storage/Processing/lacf-phs.htm (accessed on 14 October 2021).
- Marçon, F.; Mathiron, D.; Pilard, S.; Lemaire-Hurtel, A.-S.; Dubaele, J.-M.; Djedaini-Pilard, F. Development and formulation of a 0.2% oral solution of midazolam containing gamma-cyclodextrin. Int. J. Pharm. 2009, 379, 244–250. [Google Scholar] [CrossRef]
- Wiseman, T.; Williston, S.; Brandts, J.; Lin, L.-N. Rapid Measurement of Binding Constants and Heats of Binding Using a New Titration Calorimeter. Anal. Biochem. 1988, 179, 131–137. [Google Scholar] [CrossRef]
- Schönbeck, C.; Holm, R. Exploring the Origins of Enthalpy-Entropy Compensation by Calorimetric Studies of Cyclodextrin Complexes. J. Phys. Chem. B 2019, 123, 6686–6693. [Google Scholar] [CrossRef]
- Lanzanova, F.A.; Argenta, D.; Arend, M.Z.; Junior, L.B.; Cardoso, S.G. LC and LC-MS Evaluation of Stress Degradation Behavior of Carvedilol. J. Liq. Chromatogr. Relat. Technol. 2009, 32, 526–543. [Google Scholar] [CrossRef]
- Popielec, A.; Loftsson, T. Effects of cyclodextrins on the chemical stability of drugs. Int. J. Pharm. 2017, 531, 532–542. [Google Scholar] [CrossRef] [PubMed]
- Wouessidjewe, D.; Crassous, A.; Duchêne, D.; Coleman, A.; Rysanek, N.; Tsoucaris, G.; Perly, B.; Djedaini, F. Inclusion of spironolactone in maltoheptaose: A guest affected by the hospitality of the host. Carbohydr. Res. 1989, 192, 313–322. [Google Scholar] [CrossRef]

 ), 0.1 M citrate buffer (pH = pKa2 = 4.7) (
  ), 13 mM HCl (pH ~3.5) (
  ), 0.1 M acetate buffer (pH = pKa = 4.7) (
  ). The rescaled Y axis from (carvedilol) = 0 mM to 2 mM has been included, to show the compound’s solubility in pure water.
), 0.1 M citrate buffer (pH = pKa2 = 4.7) ( ), 13 mM HCl (pH ~3.5) ( ), 0.1 M acetate buffer (pH = pKa = 4.7) ( ). The rescaled Y axis from (carvedilol) = 0 mM to 2 mM has been included, to show the compound’s solubility in pure water.
). The rescaled Y axis from (carvedilol) = 0 mM to 2 mM has been included, to show the compound’s solubility in pure water.
), 0.1 M citrate buffer (pH = pKa2 = 4.7) ( ), 13 mM HCl (pH ~3.5) ( ), 0.1 M acetate buffer (pH = pKa = 4.7) ( ). The rescaled Y axis from (carvedilol) = 0 mM to 2 mM has been included, to show the compound’s solubility in pure water.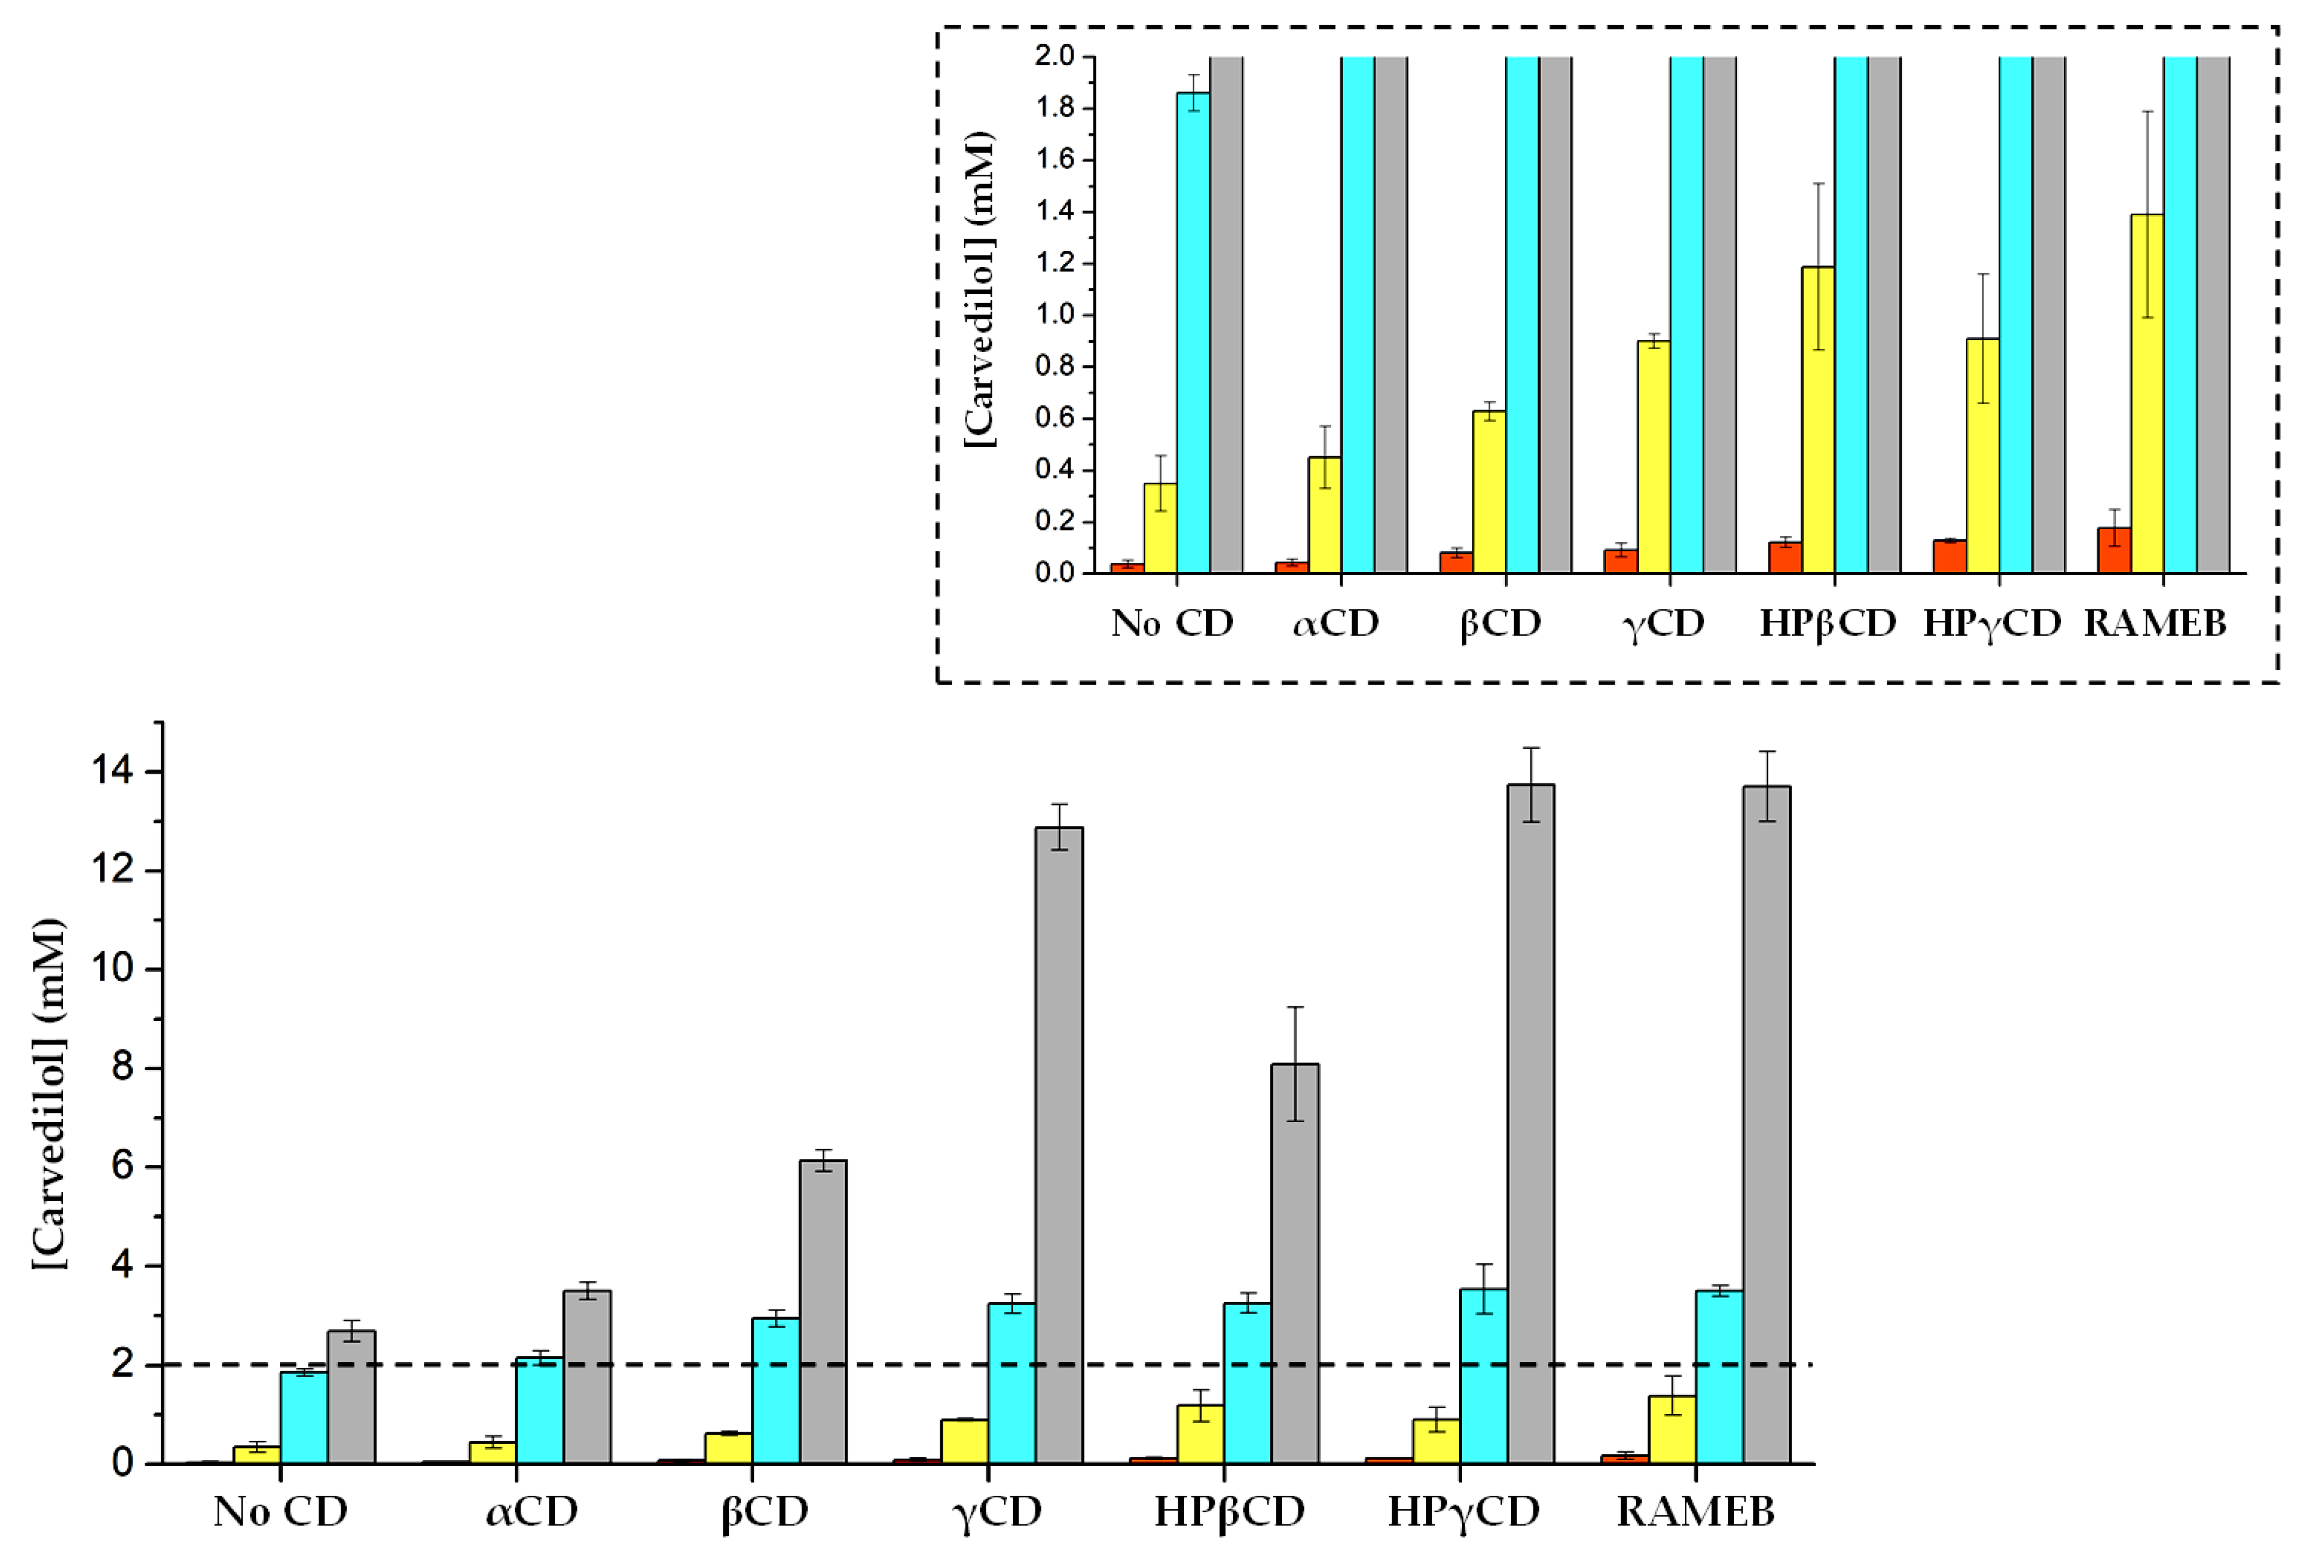
 ), 3.5 mM (
  ), 2.5 mM (
  ), 1.5 mM (
  ) and 0.5 mM(
  ); (a) the aromatic moieties; (b) the aliphatic moiety.
), 3.5 mM ( ), 2.5 mM ( ), 1.5 mM ( ) and 0.5 mM( ); (a) the aromatic moieties; (b) the aliphatic moiety.
); (a) the aromatic moieties; (b) the aliphatic moiety.
), 3.5 mM ( ), 2.5 mM ( ), 1.5 mM ( ) and 0.5 mM( ); (a) the aromatic moieties; (b) the aliphatic moiety.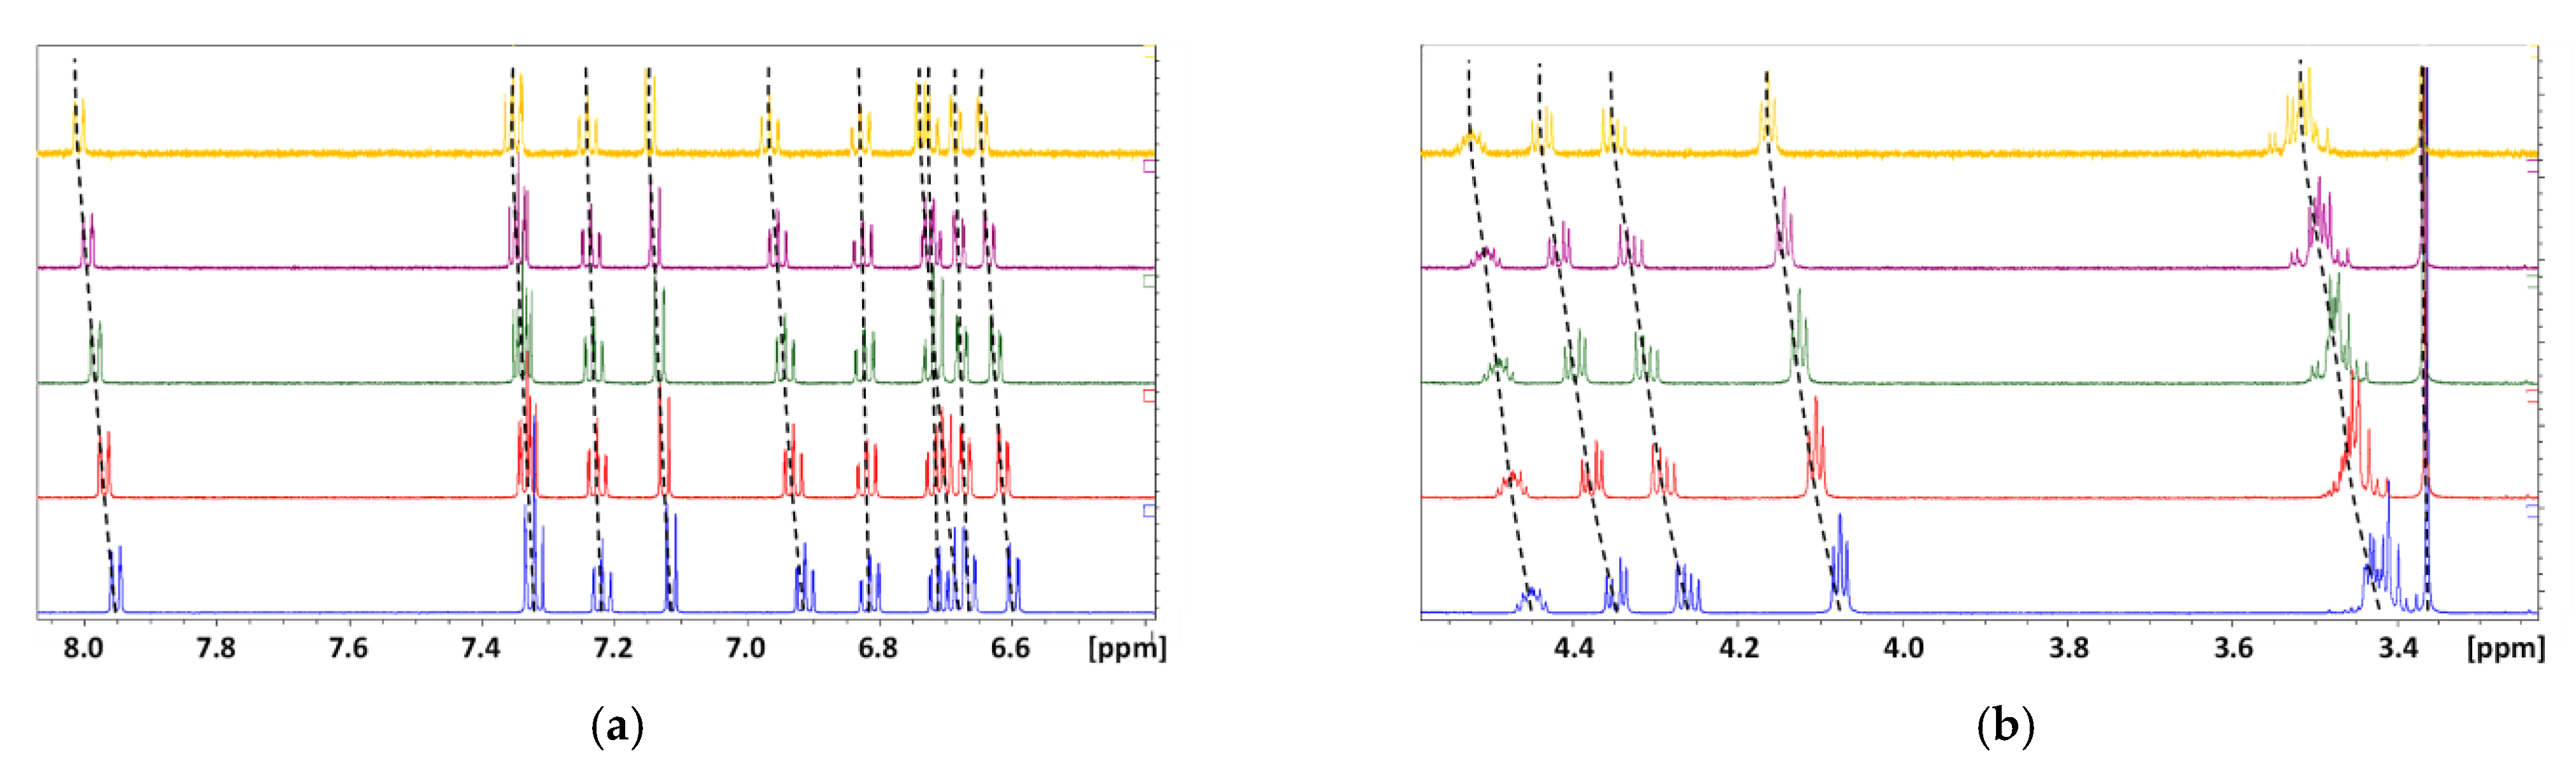
 ) or presence of an equimolar concentration of carvedilol (
  ).
) or presence of an equimolar concentration of carvedilol ( ).
).
) or presence of an equimolar concentration of carvedilol ( ).
 ) or in the presence of an equimolar concentration of αCD (
  ), βCD (
  ), γCD (
  ), HPβCD (
  ), HPγCD (
  ) or DIMEB (
  ).
) or in the presence of an equimolar concentration of αCD ( ), βCD ( ), γCD ( ), HPβCD ( ), HPγCD ( ) or DIMEB ( ).
).
) or in the presence of an equimolar concentration of αCD ( ), βCD ( ), γCD ( ), HPβCD ( ), HPγCD ( ) or DIMEB ( ).
 ) or γCD (
  ) in 0.1 M acetate buffer or DIMEB (
  ) in 13 mM HCl, at different molar fractions. (b) Stacking of partial 1H NMR (600 MHz, 298 K) spectra scaled on H15b of carvedilol, corresponding to experiments with γCD and (c) with DIMEB at the following CD molar fractions: 0.0 (
  ), 0.3 (
  ), 0.6 (
  ), 0.9 (
  ). The gap between the dotted lines corresponds to the 3JH15b-H16.
) or γCD ( ) in 0.1 M acetate buffer or DIMEB ( ) in 13 mM HCl, at different molar fractions. (b) Stacking of partial 1H NMR (600 MHz, 298 K) spectra scaled on H15b of carvedilol, corresponding to experiments with γCD and (c) with DIMEB at the following CD molar fractions: 0.0 ( ), 0.3 ( ), 0.6 ( ), 0.9 ( ). The gap between the dotted lines corresponds to the 3JH15b-H16.
). The gap between the dotted lines corresponds to the 3JH15b-H16.
) or γCD ( ) in 0.1 M acetate buffer or DIMEB ( ) in 13 mM HCl, at different molar fractions. (b) Stacking of partial 1H NMR (600 MHz, 298 K) spectra scaled on H15b of carvedilol, corresponding to experiments with γCD and (c) with DIMEB at the following CD molar fractions: 0.0 ( ), 0.3 ( ), 0.6 ( ), 0.9 ( ). The gap between the dotted lines corresponds to the 3JH15b-H16.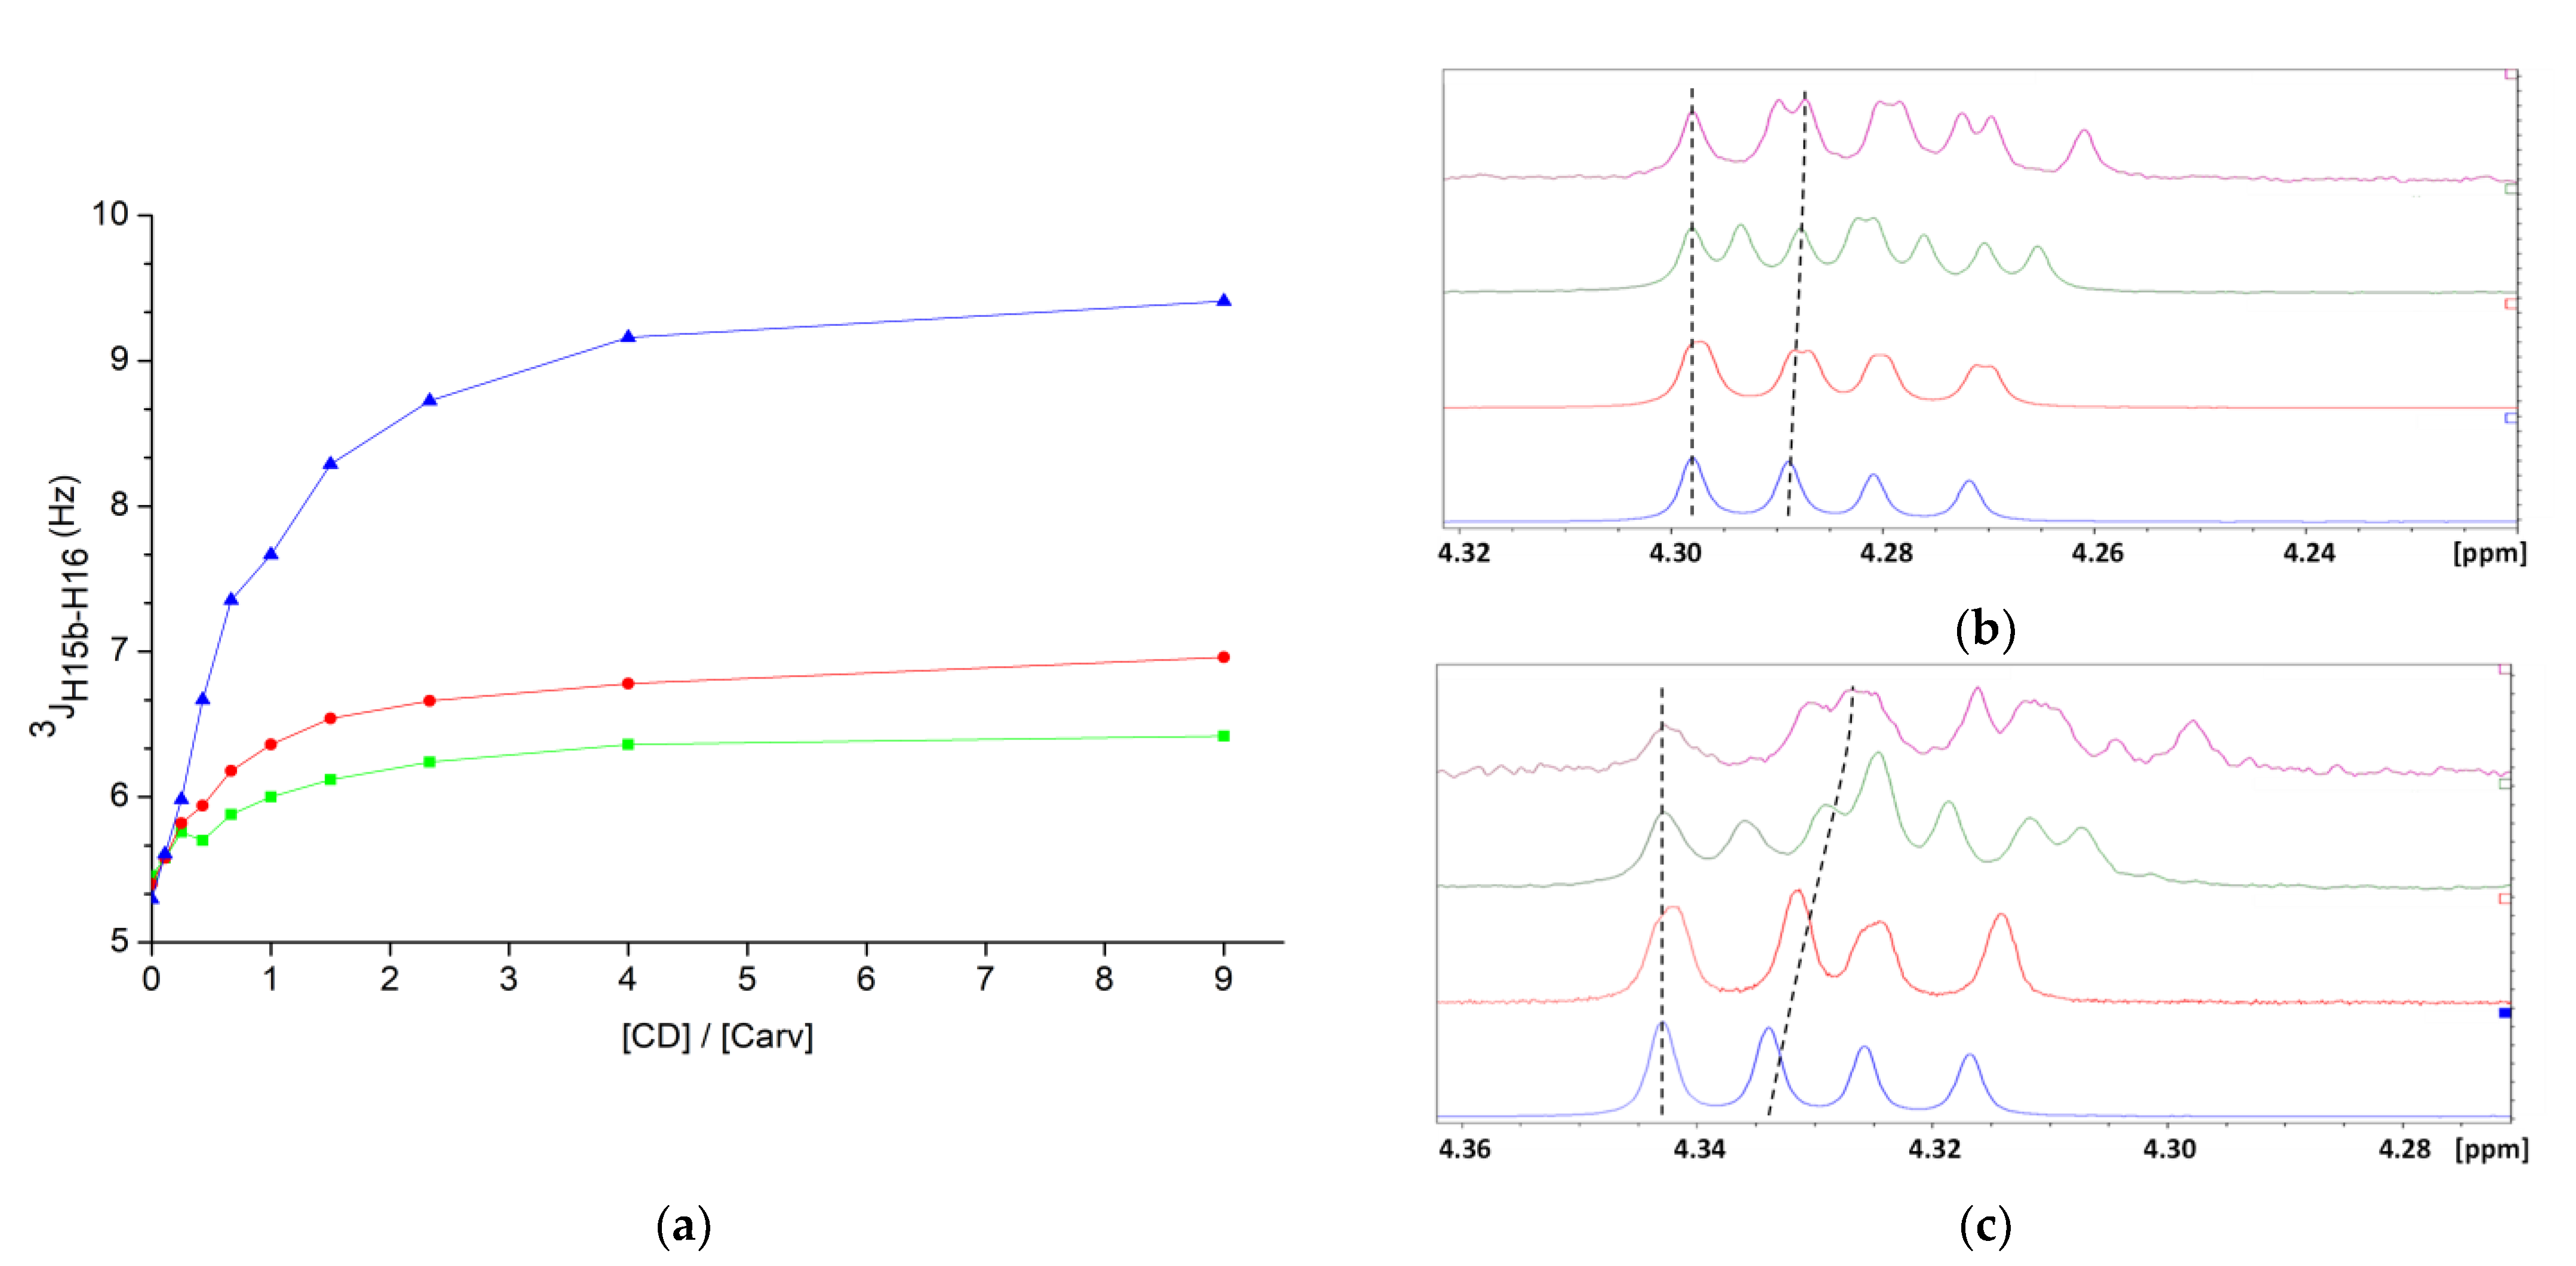
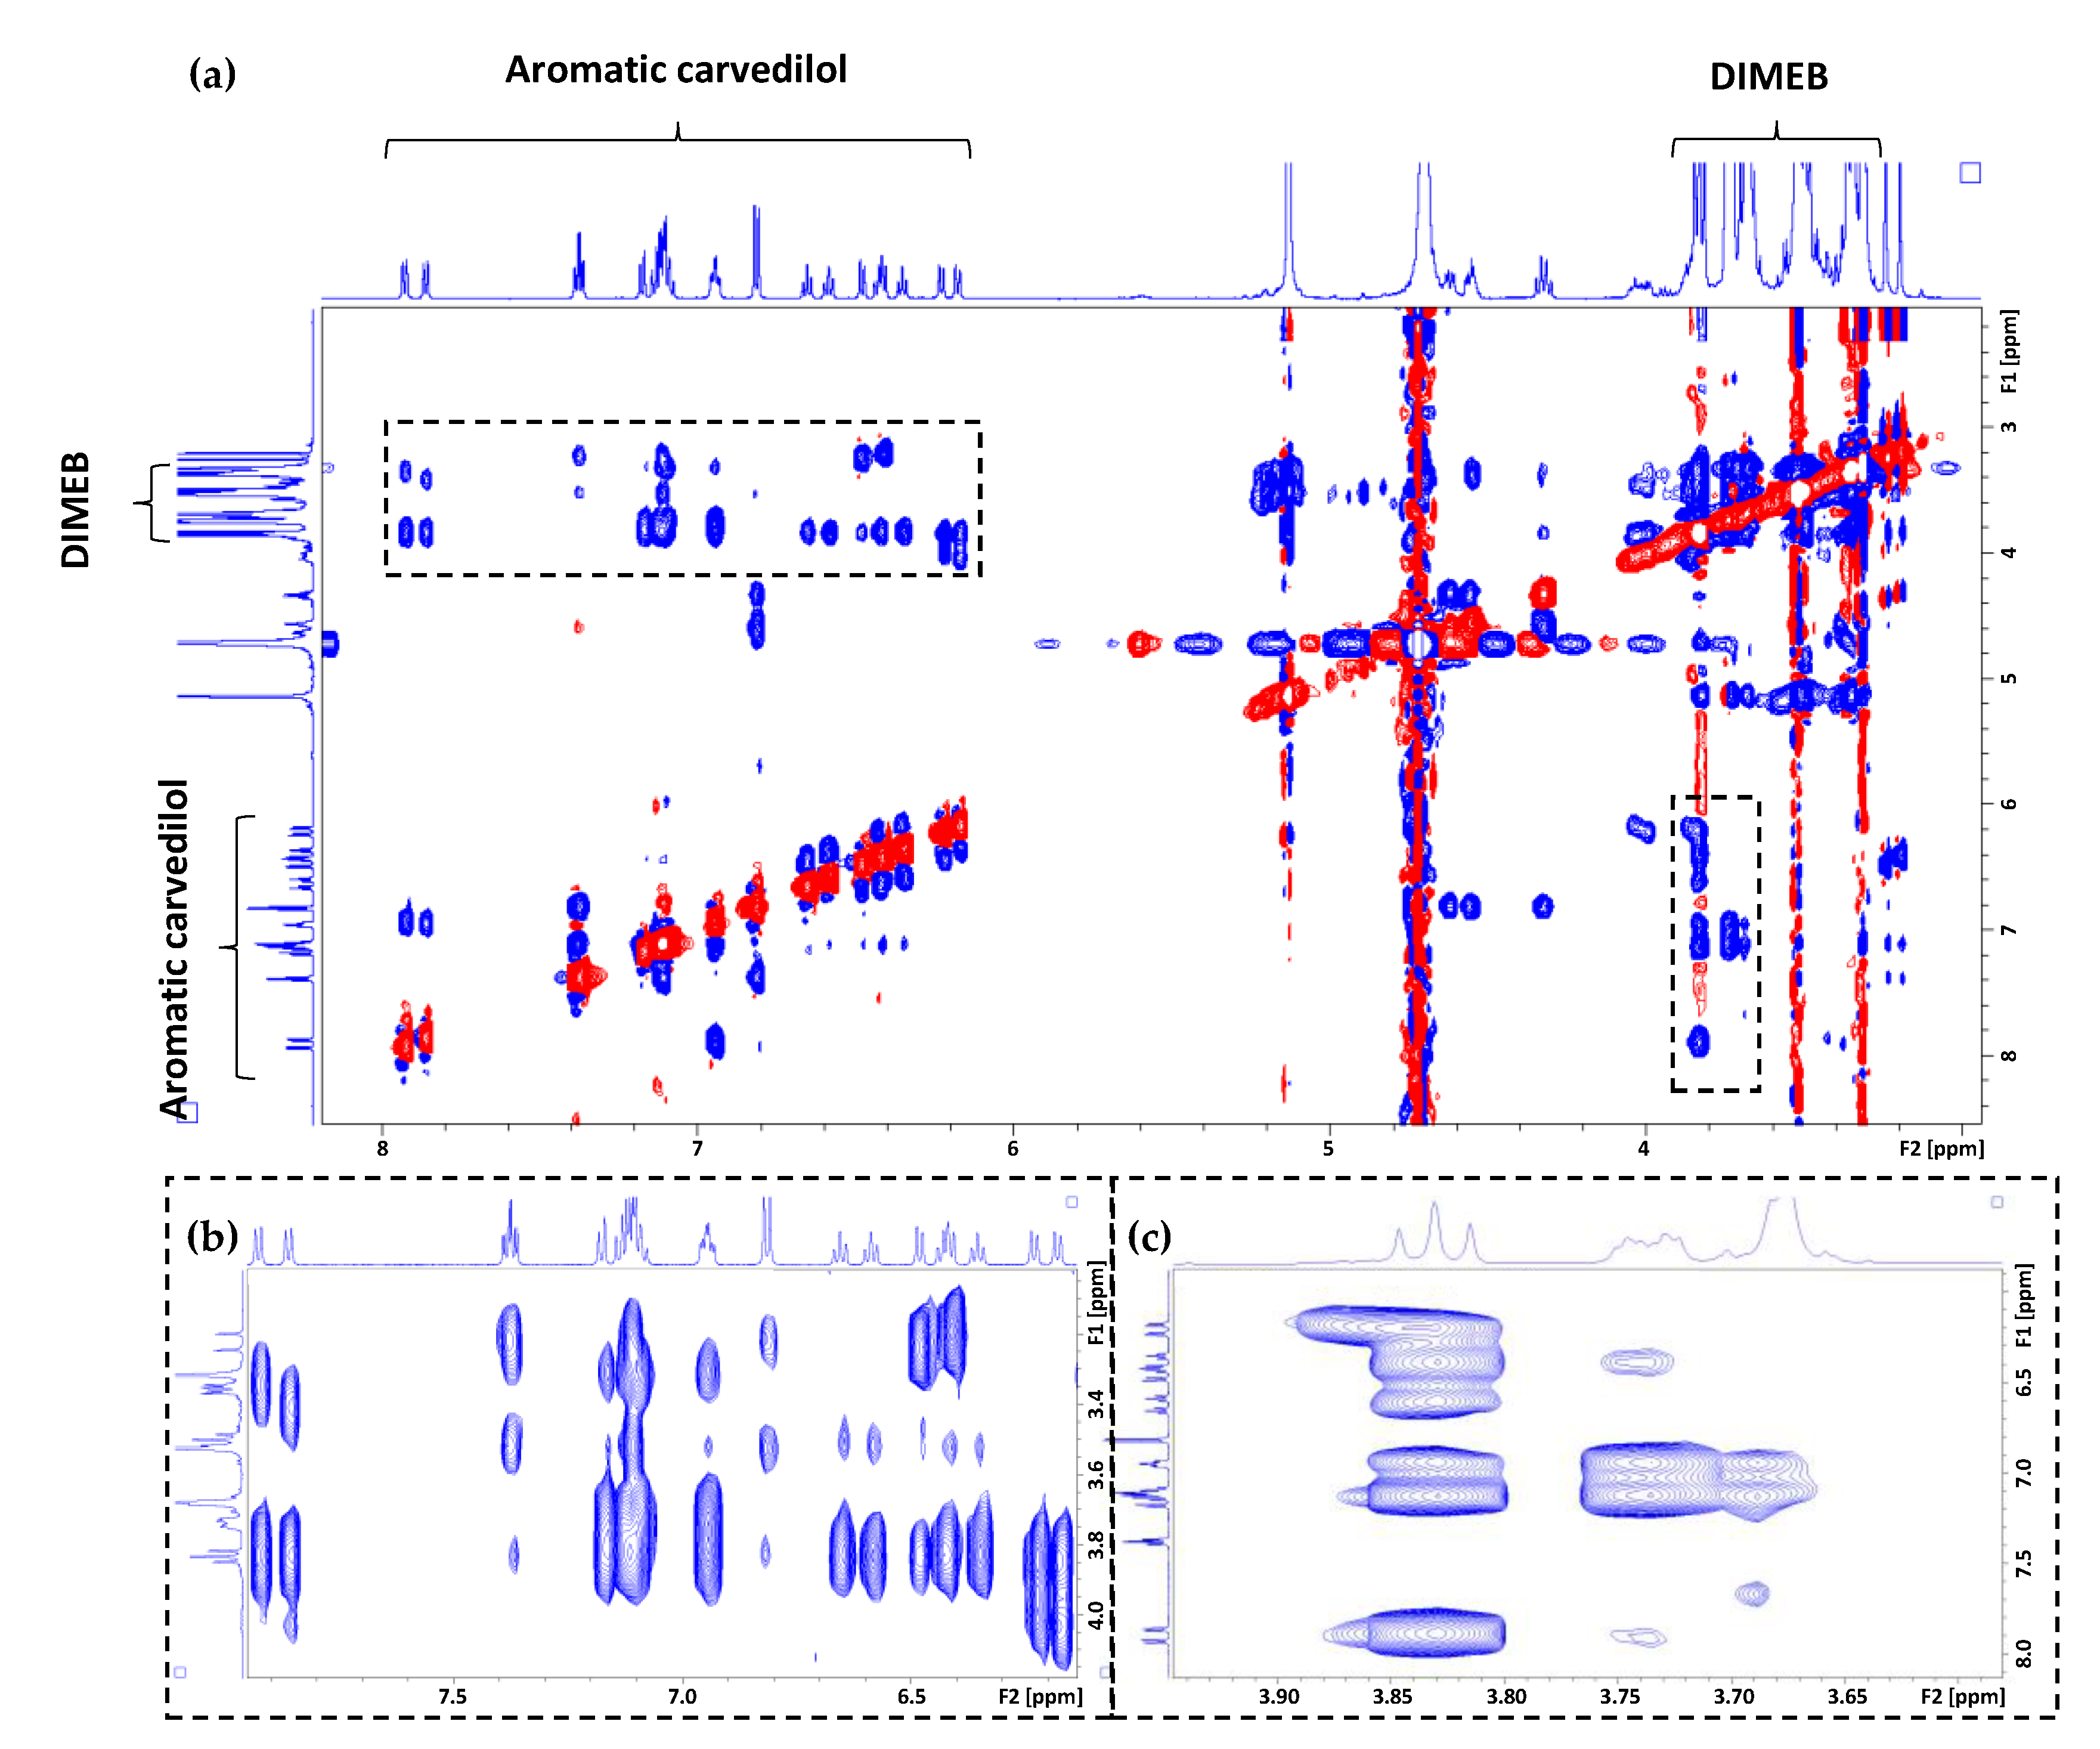
 ) or in the presence of an equimolar concentration of βCD (
  ) or γCD (
  ), as measured in 0.1 M acetate-buffered D2O (pH = pKa = 4.7); (b) the expanded aromatic moiety region of carvedilol; (c) the expanded region of CDs.
) or in the presence of an equimolar concentration of βCD ( ) or γCD ( ), as measured in 0.1 M acetate-buffered D2O (pH = pKa = 4.7); (b) the expanded aromatic moiety region of carvedilol; (c) the expanded region of CDs.
), as measured in 0.1 M acetate-buffered D2O (pH = pKa = 4.7); (b) the expanded aromatic moiety region of carvedilol; (c) the expanded region of CDs.
) or in the presence of an equimolar concentration of βCD ( ) or γCD ( ), as measured in 0.1 M acetate-buffered D2O (pH = pKa = 4.7); (b) the expanded aromatic moiety region of carvedilol; (c) the expanded region of CDs.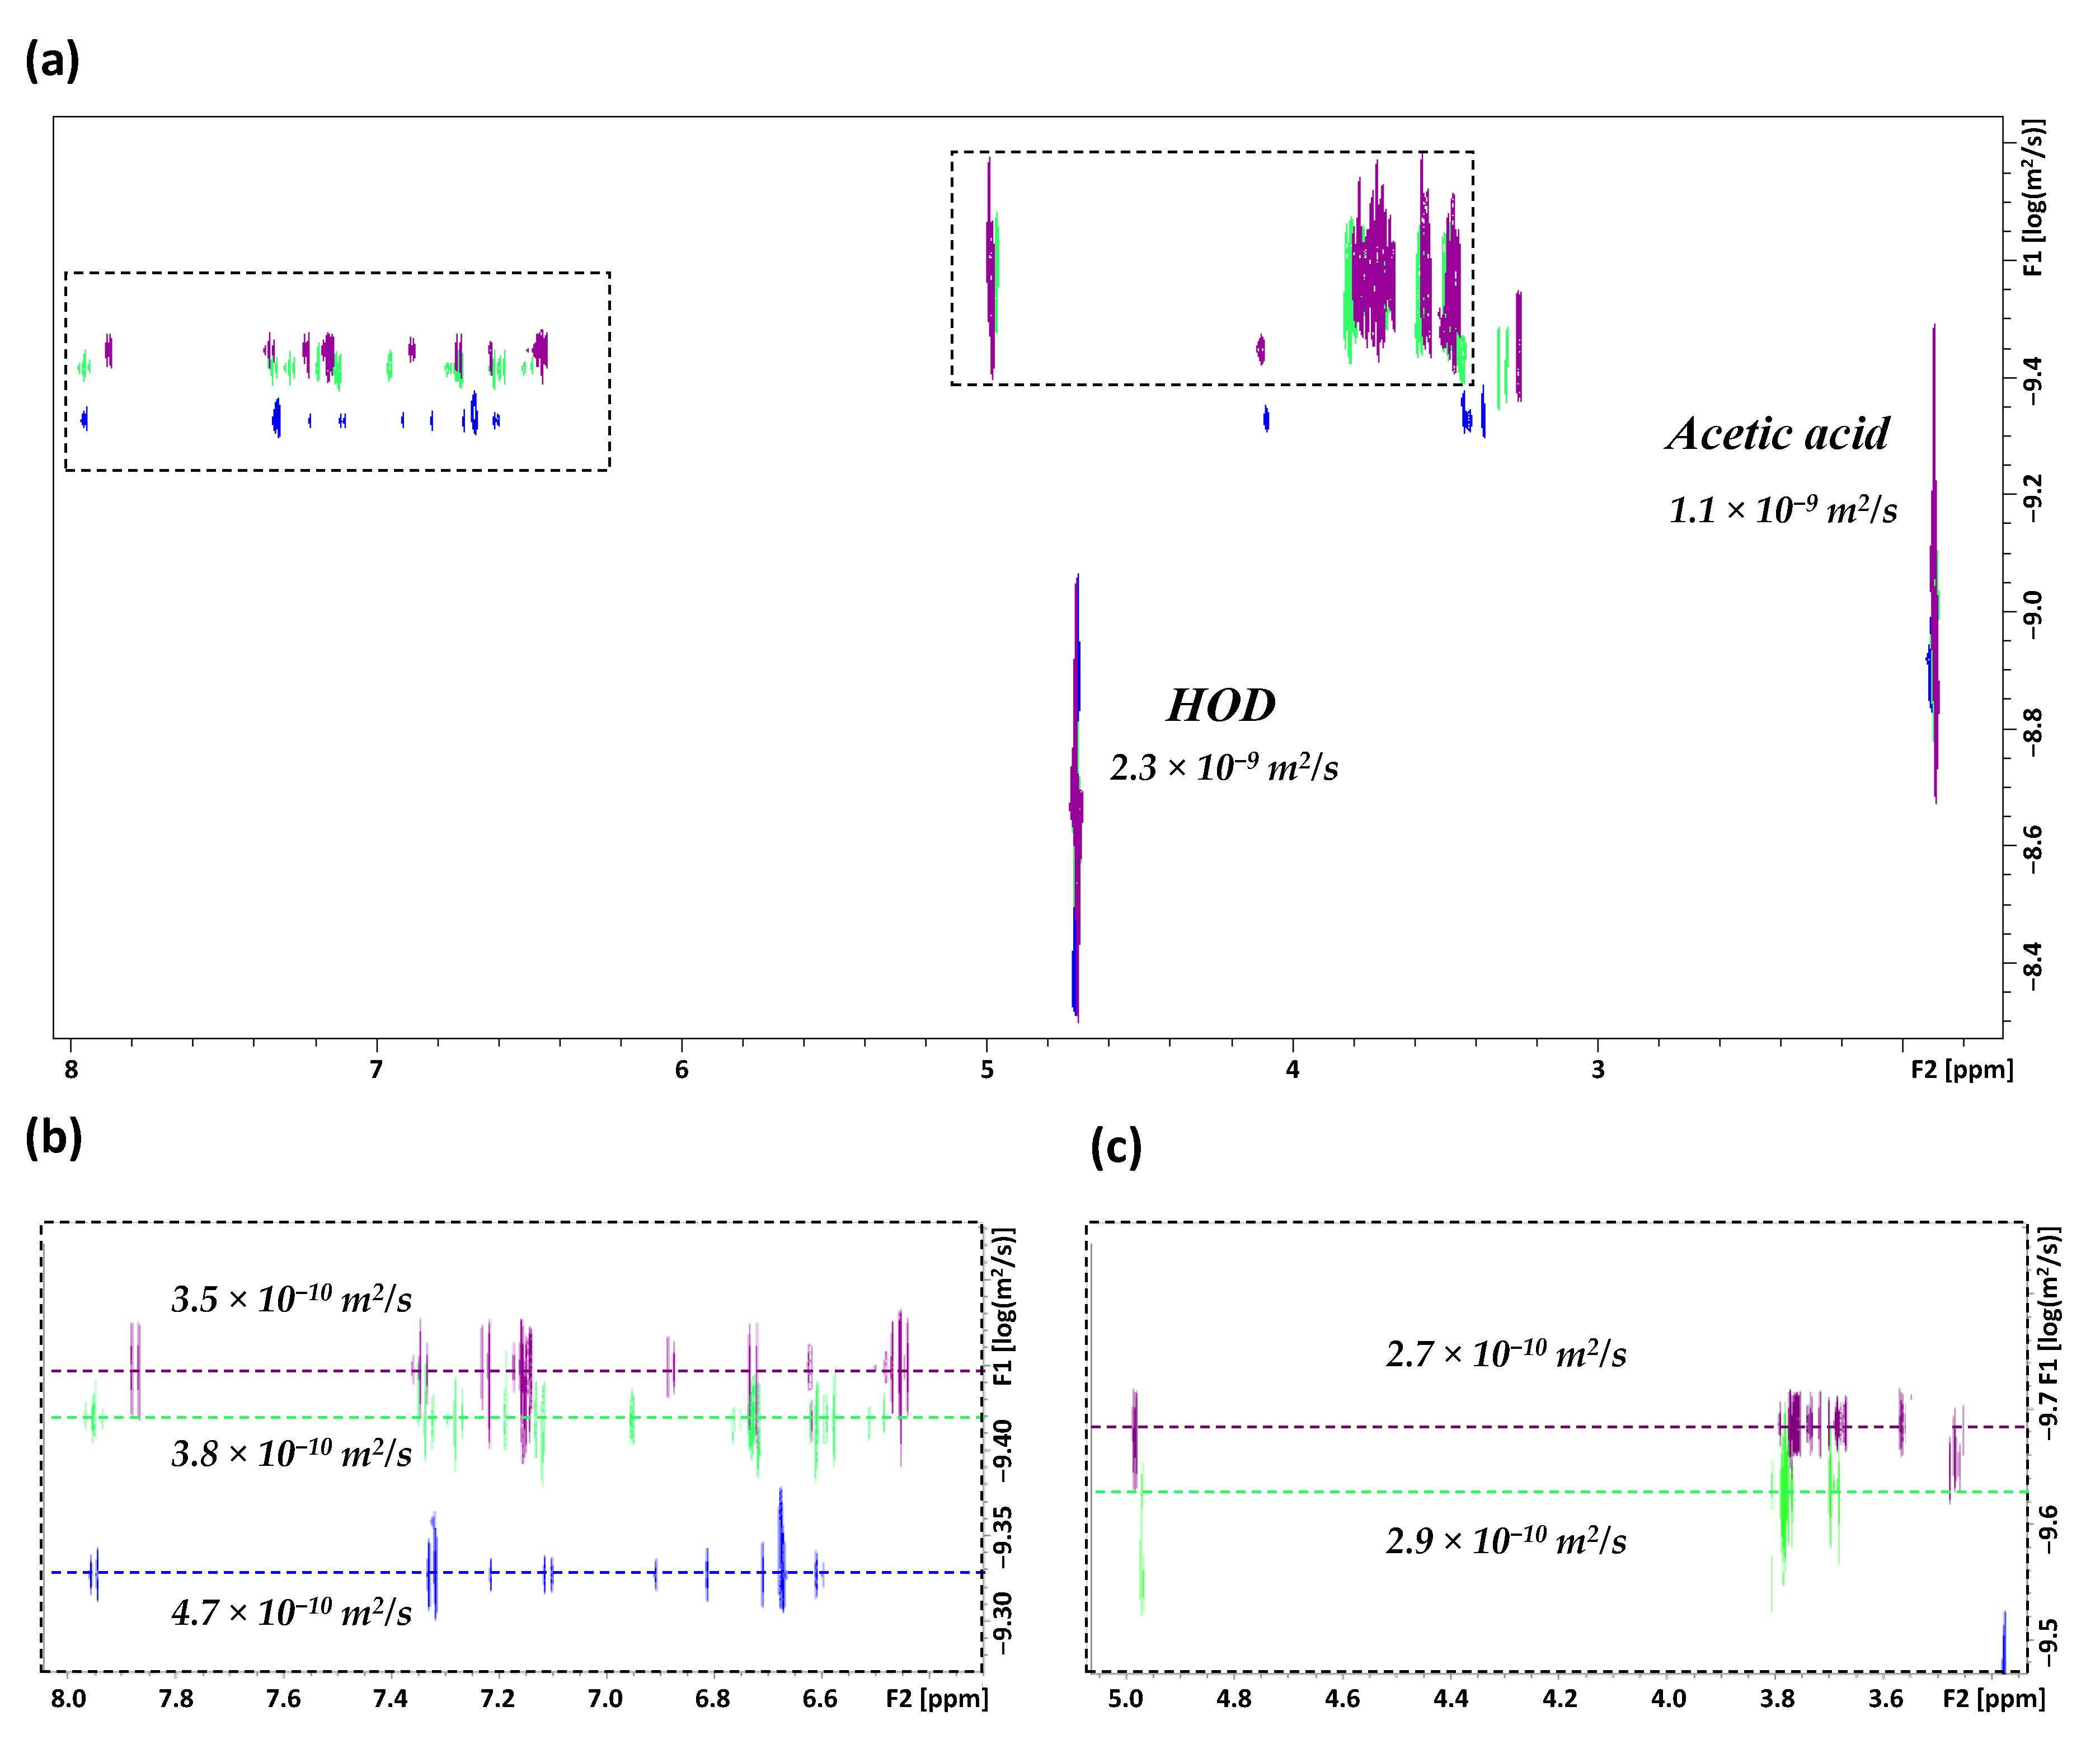

 ), 0.7 (
  ), 0.4 (
  ), 0.1(
  ). (b) A Job plot for a carvedilol/CD mixture obtained from 1H NMR (600 MHz, 298 K). Observation of protons located inside the CD’s cavity: H3 βCD (
  ), H5 βCD (
  ), H3 γCD (
  ), H5 γCD (
  ), H3 DIMEB (
  ), H5 DIMEB (
  ).
), 0.7 ( ), 0.4 ( ), 0.1( ). (b) A Job plot for a carvedilol/CD mixture obtained from 1H NMR (600 MHz, 298 K). Observation of protons located inside the CD’s cavity: H3 βCD ( ), H5 βCD ( ), H3 γCD ( ), H5 γCD ( ), H3 DIMEB ( ), H5 DIMEB ( ).
).
), 0.7 ( ), 0.4 ( ), 0.1( ). (b) A Job plot for a carvedilol/CD mixture obtained from 1H NMR (600 MHz, 298 K). Observation of protons located inside the CD’s cavity: H3 βCD ( ), H5 βCD ( ), H3 γCD ( ), H5 γCD ( ), H3 DIMEB ( ), H5 DIMEB ( ).
 ), B (buffer in the cell and 1 mM carvedilol + 5 mM CD in the syringe,
  ) and C (0.5 mM carvedilol in the cell and 1 mM carvedilol + 5 mM CD in the syringe,
  ).
), B (buffer in the cell and 1 mM carvedilol + 5 mM CD in the syringe, ) and C (0.5 mM carvedilol in the cell and 1 mM carvedilol + 5 mM CD in the syringe, ).
).
), B (buffer in the cell and 1 mM carvedilol + 5 mM CD in the syringe, ) and C (0.5 mM carvedilol in the cell and 1 mM carvedilol + 5 mM CD in the syringe, ).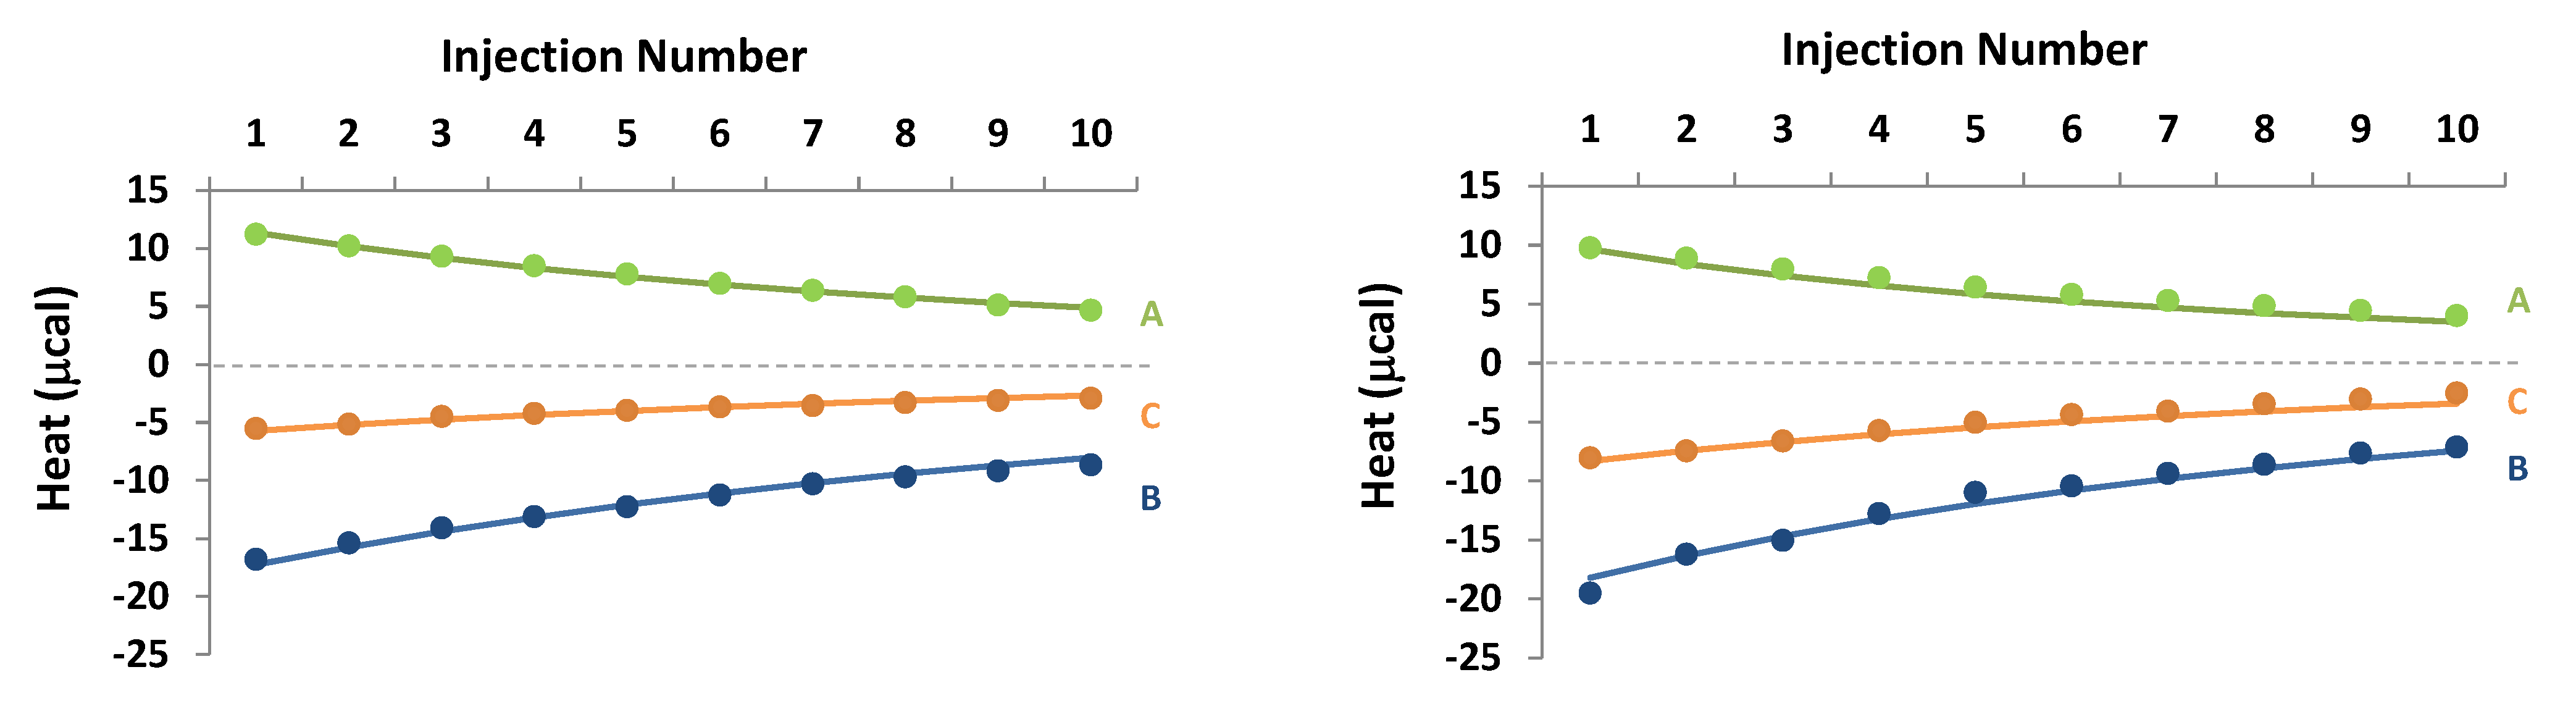
 ), 61.5 mM γCD (
  ) or 61.5 mM RAMEB (
  ). The corresponding first-order kinetic model (solid line) is depicted on each plot. A small shift has been added to error bars to avoid their overlapping.
), 61.5 mM γCD ( ) or 61.5 mM RAMEB ( ). The corresponding first-order kinetic model (solid line) is depicted on each plot. A small shift has been added to error bars to avoid their overlapping.
). The corresponding first-order kinetic model (solid line) is depicted on each plot. A small shift has been added to error bars to avoid their overlapping.
), 61.5 mM γCD ( ) or 61.5 mM RAMEB ( ). The corresponding first-order kinetic model (solid line) is depicted on each plot. A small shift has been added to error bars to avoid their overlapping.

| Pure Water | 0.1 M Acetate Buffer | 0.1 M Citrate Buffer | 13 mM HCl | |||||
|---|---|---|---|---|---|---|---|---|
| S (mM) | R | S (mM) | R | S (mM) | R | S (mM) | R | |
| No CD | 0.039 | - | 2.694 | - | 0.350 | - | 1.861 | - |
| αCD | 0.044 | 1.14 | 3.501 | 1.30 | 0.450 | 1.29 | 2.157 | 1.16 |
| βCD | 0.081 | 2.10 | 6.133 | 2.28 | 0.629 | 1.80 | 2.946 | 1.58 |
| γCD | 0.092 | 2.38 | 12.881 | 4.78 | 0.901 | 2.58 | 3.242 | 1.74 |
| HPβCD | 0.122 | 3.14 | 8.082 | 3.00 | 1.188 | 3.40 | 3.252 | 1.75 |
| HPγCD | 0.128 | 3.30 | 13.734 | 5.10 | 0.910 | 2.60 | 3.527 | 1.89 |
| RAMEB | 0.177 | 4.58 | 13.708 | 5.09 | 1.390 | 3.98 | 3.502 | 1.88 |
| Carbazole | Methoxyphenyl | |||||||||||
|---|---|---|---|---|---|---|---|---|---|---|---|---|
| H1 | H3 | H5 | H6 | H11 | H12 | H13 | H28 | H26 | H24 | H25 | ||
| βCD | H3 | ++ | +++ | ++ | +++ | - | ++ | + | ++ | ++ | ++ | ++ |
| H5 | +++ | + | ++ | +++ | - | - | - | - | + | + | - | |
| γCD | H3 | ++ | +++ | + | + | + | +++ | + | +++ | ++ | + | ND |
| H5 | +++ | ++ | ++ | ++ | - | ND | - | ++ | ++ | ++ | +++ | |
| DIMEB | H3 | ++ | +++ | ++ | ++ | + | ++ | + | ++ | ++ | +++ | +++ |
| H5 | +++ | + | +++ | ++ | - | - | - | + | + | + | - | |
| CH3(2) | + | - | - | - | ++ | ++ | ++ | - | + | + | - | |
| CH3(6) | ++ | - | - | ++ | - | - | - | - | - | - | - | |
| Temperature (K) | K (M−1) | ΔH° (kJ·mol−1) | −TΔS° (J·mol−1·K−1) | ΔG° (kJ·mol−1) | |
|---|---|---|---|---|---|
| carvedilol/γCD | 288 | 296 ± 39 | −18.3 ± 0.4 | 4.7 ± 0.7 | −13.6 ± 0.3 |
| 298 | 225 ± 30 | −21.4 ± 0.5 | 8.4 ± 0.9 | −13.0 ± 0.3 | |
| 308 | 166 ± 22 | −24.4 ± 0.7 | 11.3 ± 1.1 | −13.1 ± 0.3 | |
| carvedilol/RAMEB | 288 | 408 ± 60 | −17.7 ± 0.7 | 3.3 ± 1.0 | −14.4 ± 0.4 |
| 298 | 317 ± 47 | −18.0 ± 0.8 | 3.7 ± 1.2 | −14.3 ± 0.4 | |
| 308 | 250 ± 37 | −18.3 ± 0.9 | 4.1 ± 1.3 | −14.1 ± 0.4 |
Publisher’s Note: MDPI stays neutral with regard to jurisdictional claims in published maps and institutional affiliations. |
© 2021 by the authors. Licensee MDPI, Basel, Switzerland. This article is an open access article distributed under the terms and conditions of the Creative Commons Attribution (CC BY) license (https://creativecommons.org/licenses/by/4.0/).
Share and Cite
Rigaud, S.; Mathiron, D.; Moufawad, T.; Landy, D.; Djedaini-Pilard, F.; Marçon, F. Cyclodextrin Complexation as a Way of Increasing the Aqueous Solubility and Stability of Carvedilol. Pharmaceutics 2021, 13, 1746. https://doi.org/10.3390/pharmaceutics13111746
Rigaud S, Mathiron D, Moufawad T, Landy D, Djedaini-Pilard F, Marçon F. Cyclodextrin Complexation as a Way of Increasing the Aqueous Solubility and Stability of Carvedilol. Pharmaceutics. 2021; 13(11):1746. https://doi.org/10.3390/pharmaceutics13111746
Chicago/Turabian StyleRigaud, Sébastien, David Mathiron, Tarek Moufawad, David Landy, Florence Djedaini-Pilard, and Frédéric Marçon. 2021. "Cyclodextrin Complexation as a Way of Increasing the Aqueous Solubility and Stability of Carvedilol" Pharmaceutics 13, no. 11: 1746. https://doi.org/10.3390/pharmaceutics13111746