Article

Photosynthetic Capacity, Stomatal Behavior and Chloroplast Ultrastructure in Leaves of the Endangered Plant Carpinus putoensis W.C.Cheng during Gaseous NO2 Exposure and after Recovery

1
College of Landscape Architecture, Nanjing Forestry University, Nanjing 210037, China
2
College of Art & Design, College of Landscape Architecture, Nanjing Forestry University, Nanjing 210037, China
*
Author to whom correspondence should be addressed.
Forests 2018, 9(9), 561; https://doi.org/10.3390/f9090561
Submission received: 20 July 2018 / Revised: 2 September 2018 / Accepted: 6 September 2018 / Published: 12 September 2018
(This article belongs to the Section Forest Ecophysiology and Biology)

Abstract

:
Foliar uptake of gaseous NO2 mainly occurs through the stomata and disrupts normal plant growth, but no detailed reports about the physiological responses of plants exposed to NO2 are available. In this study, to study leaf physicochemical responses, stomatal characteristics and chloroplast structure, we observed the leaves of Carpinus putoensis W.C.Cheng after exposure to NO2 (6 μL/L) for five time periods (0, 1, 6, 24, and 72 h) and after 30 days of recovery following NO2 exposure. Our results showed that short-duration exposure to a high concentration of NO2 had significant negative impacts (p < 0.05) on the chlorophyll content, photosynthesis and chloroplast-related physicochemical processes of C. putoensis leaves; with the exception of one hour of NO2 exposure, which was helpful for plant physiological responses. Moreover, NO2 exposure significantly increased the thickness of the palisade/spongy tissue and caused swelling of the thylakoids within the chloroplasts; this thylakoid swelling could be reversed by removing the pollutant from the air flow. Restoration of unpolluted air alleviated the toxic effects of NO2, as indicated by an increased chlorophyll content, net photosynthesis, and PSII maximum quantum yield. These results could support the development of a treatment for roadside trees that are exposed to NO2 as a major road pollutant.

1. Introduction

NO2 is a precursor of harmful secondary air pollutants such as ozone and particulate matter and it plays an important role in the phenomenon of acid rain [1,2]. Plants are influenced by the atmospheric pollutants that they absorb and suffer varying degrees of damage [3].
The harmful effects of NO2 on plants result primarily from its corrosivity and highly oxidative character, which influence various plant physiological and biochemical processes after entering the plants via the stomata [4]. Hiromichi and Ozgur assessed the atmospheric NO2-purifying capabilities of 217 natural plants and screened out the plants with the most powerful purification capabilities—plants that can thrive in the presence of NO2 and use NO2 as their only nitrogen source [5]. Liu treated Arabidopsis thaliana L. with NO2 at 0.48, 8.2, 17.4 and 38.5 μL/L to investigate variations in morphology, chlorophyll, superoxide free radical levels, protective enzyme systems, ascorbic acid levels, and glutathione levels after NO2 stress [6]. They found that A. thaliana initiated stress-resistant protective mechanisms under NO2 stress, during which superoxide free radicals acted as signals to trigger the protective mechanisms of the plant. Pan found that exposure to NO2 at a low concentration (<4 μL/L) for a short duration did not significantly change the relative chlorophyll content in the leaves of Rhodoleia championii Hook. f., Spathodea campanulata Beauv. or Lagerstroemia indica L., whereas NO2 at a high concentration (≥4.0 μL/L) significantly decreased the chlorophyll content in these plants [7].
Chlorophyll (Chl) is the most important plant pigment as it plays a crucial role in photosynthesis [8,9]. In addition, nitrogen is one of the most important elements in Chl molecules. Therefore, Chl content and structure are also important indicators of nitrogen status in plant tissues [10]. Hu found that inhibition of photosynthesis in poplar leaves may be responsible for the suppression of growth by NO2 [11] and another study reported that NO2 caused visible damage to wheat leaves and inhibited photosynthesis and respiration [12].
Stomatal behavior has an indirect influence on plant photosynthesis. Some previous studies have reported the effects of NO2 stress on stomatal behavior and chloroplast ultrastructure. Global reactive N, resulting from atmospheric NO2, and other nitrogen oxides can be incorporated into the foliar N metabolism, at which point it can trigger a series of plant physiological responses [13]. NO2 can cause reductions in growth and the amount and severity of damage suffered by a plant varies according to various factors such as concentration and length of exposure, plant age, edaphic factors, light, and humidity. Symptoms are often divided into ‘visible’ and ‘invisible’ (or hidden) injuries, with the latter describing cases of an overall reduction in growth but no obvious signs of visible damage [14]. Ultrastructural changes associated with an ‘invisible’ injury have often been linked to decreases in transpiration and photosynthesis [15,16] and some ultrastructural changes have been observed in both mitochondria and chloroplasts. In four-year-old spruce trees (Picea abies L.), fumigation with NO2 at 1 μL/L (a low concentration) for three weeks led to swollen thylakoids, reduced numbers of grana stacks, and increased starch contents when compared to the control [17]. In another study, compared to similar tissue exposed to unpolluted air, mature bean tissue exposed to NO2 at 1 or 2 μL/L for 1 or 2 h showed swelling of the thylakoids within the chloroplasts, but no extra-chloroplastic damage and the thylakoid swelling could be reversed by removing the pollutant from the air flow or changing the rate of gas flow within the tissue [18]. Chaparro-Suarez found that NO2 was not absorbed by plants when stomata were closed and that species-dependent differences in uptake rates were clearly related to stomatal behavior [19]. However, the relationships among photosynthesis, stomatal behavior and chloroplast ultrastructure remain to be systematically explored.
In addition, some studies have reported recovery mechanisms after NO2 exposure. Li showed that colonization by the arbuscular mycorrhizal fungus Glomus mosseae or exogenous salicylic acid treatment increased the tolerance to elevated NO2 levels in Avena nuda L. plants [20]. Liu performed a preliminary study in which exogenous salicylic acid altered the response to NO2 stress in wheat [21] and Ma studied the effect of endogenous salicylic acid on NO2 stress in Arabidopsis [22]. However, no reports are available regarding plant physiological responses during natural recovery after NO2 exposure.
Carpinus putoensis W.C.Cheng, a species of deciduous tree in the family Betulaceae, is listed as an endangered plant species and only one strain of this native Chinese tree has survived; specifially on the famous Mount Putuo, which is a Buddhist shrine and state-level scenic location. This tree is a national grade one key protected wild plant in China and its biological characteristics, cultivation and breeding have been studied by the Zhejiang Forestry Science Research Institute [23], where a set of mature germplasm preservation techniques was developed. Previous research on C. putoensis has focused on its seed characteristics [24] and genetic diversity [25]. To the best of our knowledge, no previous studies have addressed its function in protecting against environmental pollution.
For this study, germplasm resources for cultivation were collected in Nanjing, China, where the atmospheric NO2 concentration averaged 0.0275, 0.0223, and 0.0259 μL/L, or 1.38, 1.12 and 1.3 times the national standard of China (0.0199 μL/L), in 2015, 2016, and 2017 respectively. This study assessed C. putoensis and its resistance to, and recovery from, the environmental pollutant NO2. To achieve this aim, the first step was to evaluate the response of photosynthesis and Chl fluorescence in C. putoensis leaves under different NO2 exposure times, in terms of both leaf gas exchange and functional photosynthetic measurements. Chl content, stomatal behavior and chloroplast ultrastructure were simultaneously analyzed to detect possible relationships between leaf photosynthesis and cellular changes under NO2 stress. The underlying hypothesis was that photosynthesis in NO2-stressed C. putoensis is limited by both stomatal and nonstomatal factors that contribute to metabolic alterations at the leaf level. We then observed whether this species could recover normal growth in a greenhouse after 30 days without NO2 exposure. The results of this study may benefit the further conservation of this endangered species by improving its resistance to NO2 exposure as a new type of ornamental roadside tree. In addition, these results may provide useful reference data for the selection of plant species for atmospheric absorption and scientific reference for plant selection for urban gardening and green space development and the construction of areas with natural landscapes.

2. Materials and Methods

2.1. Materials

One-year-old seedlings of C. putoensis were grown from seeds in the Agriculture and Forestry Science Institute of Zhoushan city, Zhejiang, China. They were grown in pots with dimensions of 30 cm (open top) × 15 cm (height) × 20 cm (flat bottom), filled with well-mixed perlite, vermiculite and peat (1:1:1, v/v/v). Based on the rate of water evaporation from the soil [26], the seedlings were watered every 3 days with tap water and each pot was irrigated with 1 L of full-strength Hoagland nutrient solution biweekly. Plants were raised for more than 2 months prior to the beginning of NO2 treatment and physiological reaction measurement. The C. putoensis seedlings were grown in an artificially controlled greenhouse under a room temperature of 25–28 °C, a relative humidity of 60%–70% and 14 h photoperiod at 1000 μmol photons m−2 s−1 of photosynthetically active radiation (PAR).

2.2. NO2 Fumigation

Open-top glass chambers were constructed for NO2 fumigation. Based on a pilot study by the current team, as well as on the literature [27,28,29], 6 μL/L NO2 was chosen as the exposure concentration for observation of the leaf characteristics of C. putoensis. To achieve a steady NO2 concentration of 6 μL/L, NO2 gas was supplied directly from cylinders (400 μL/L NO2, with the velocity of gas flow set at 1 L/min with a gas flow meter). The control group was placed in another climate chamber, which was thoroughly flushed with filtered air (free of NO2) at the same time.
The NO2 concentration was monitored in real time and adjusted via the NO2 transmission device and a gas meter during the experiment. The climate chamber was maintained under a controlled light/dark cycle with a photoperiod of 13 h, a temperature of 25/20 ± 3 °C (day/night), and a relative humidity of 60/50 ± 4% (day/night). The control and NO2-treated seedlings (10 replicates in each treatment) were fumigated for 6 h/day, except in the 1 h NO2 treatment (fumigated for 1 h on the first day).
Leaves exposed to air (1 L/min) served as controls, the NO2 concentration within the climate chamber was monitored by measurement with an NO2 analyzer (Jishunan Technology Co. Ltd., Shenzhen, China). The NO2 concentrations were recorded every 1 h, with all the recorded data being downloaded via a micro-USB onto a PC using specific software (JK50-NO2; Jishunan Technology Co. Ltd., Shenzhen, China).

2.3. Recovery

After exposure to NO2, the C. putoensis seedlings were raised in a natural simulation environment for 30 days in an artificially controlled greenhouse at a room temperature of 25–28 °C, a relative humidity of 60%–70% and a 14 h photoperiod at 1000 μmol photons m−2 s−1 of PAR.

2.4. Photosynthetic Parameters

Photosynthetic photon flux density (PPFD) responses were detected using the LI-6400XT Portable Photosynthesis System (LI-COR, Lincoln, NE, USA). Net photosynthetic rate (Pn), intercellular CO2 concentration (Ci), transpiration rate (Tr), and stomatal conductance (Gs) were measured in fully expanded leaves from 8:00 a.m. to 11:00 a.m. on a clear, cloudless day. To obtain a stable photosynthetic rate, a CO2 concentration of 350 µL/L, an air temperature of 25 °C, and a relative humidity of 65% were maintained with the LI-6400XT automatic control device (LI-COR, Lincoln, NE, USA) for 8 min.
The PPFD increased from 0 to 1400 µmol m−2 s−1 (0, 50, 100, 200, 300, 400, 600, 800, 1000, 1200, and 1400 µmol m−2 s−1) for 20 min per step, with an additional interval of 5 min per step for data collection. Six to 8 fully expanded leaves were selected from the top to the bottom of each seedling and measured repeatedly for all fumigation durations, which were 0, 1, 6, 24, 72 h and recovery.

2.5. Measurement of Chl Fluorescence

Photochemical parameters were measured with a Handy PEA (Hansatech, UK), including the maximum efficiency of PSII photochemistry in the dark-adapted state, Fv/Fm = (Fm − Fo)/Fm, Fo, Fm and performance index (PI) = RC/ABS × [phi(Po)/(1 − phi(Po))][psi(Eo)/(1 − psi(Eo))], where phi (Po) is presented as φPO, psi(Eo) is presented as ψ0, and PI is defined as the ratio of two recently described structure-function indexes (SFIs) [30].

2.6. Measurement of Chl and Carotenoid Contents

The Chl content was determined via a spectrophotometric method. Briefly, fresh leaves were pulverized with distilled water and the homogenate was extracted with 90% ethanol. The absorbance of the supernatant was measured at 665, 649 and 470 nm using a spectrophotometer (759S, Lengguang Tech, Shanghai, China) [31]. Chl and carotenoid contents were expressed as mg/g fresh weight (fw).

2.7. Scanning Electron Microscopy (SEM)

The anatomical features (including the stomata, palisade tissue and spongy tissue) of the control and NO2-treated leaves were analyzed using SEM, according to the literature [32]. Briefly, leaves that were expanded completely were exposed to gaseous NO2 for 0, 1, 12 and 72 h. After collection, they were rinsed with tap water and then cut into pieces (5 mm2). Glutaraldehyde (2.5%) was used for a 6 h fixation. Air extraction was performed to allow the pieces to immerse in the fluid. Then, the samples were subjected to dehydration with an ethanol series, critical-point drying, mounting, and gold coating in a high-vacuum evaporation unit. Finally, SEM (Hitachi S-4800; Hitachi High-Technologies Corp., Tokyo, Japan) was performed for sample examination at an acceleration voltage of 5 kV.

2.8. Transmission Electron Microscopy (TEM)

TEM was performed in accordance with the literature [33]. The plant material was cut into fragments of approximately 1 mm2. Glutaraldehyde (2.5%) was used for a 4 h fixation in 0.1 M sodium cacodylate buffer (pH 7.4). The fragments were washed thrice with cacodylate buffer. Afterwards, a 2 h postfixation was performed in 2% (w/v) osmium tetroxide in the same buffer, which was followed by dehydration with an acetone series and embedding in epoxy resin [34]. Sections at 1 µm were made with an LKB III ultramicrotome (LKB Productur, AB Bromma, Stockholm, Sweden) for light microscopy and at 50 nm for TEM. Staining was performed for ultrathin sections with uranyl acetate and basic lead citrate. Electron microscopy (Hitachi HU 12 A; Hitachi High-Technologies, Tokyo, Japan) was then performed.

2.9. Statistical Analysis

All the results are presented as the means ± S.D. (n = 3). For comparisons among the control, NO2 exposure and post-recovery samples, values of * p < 0.05 and ** p < 0.01 were considered to be statistically significant and highly significant, respectively. Duncan’s multiple range test and one-way analysis of variance (ANOVA) were performed with SPSS 19.0 software.

3. Results

Typical pictures of the plant leaf before and after treatments are shown in Figure 1.

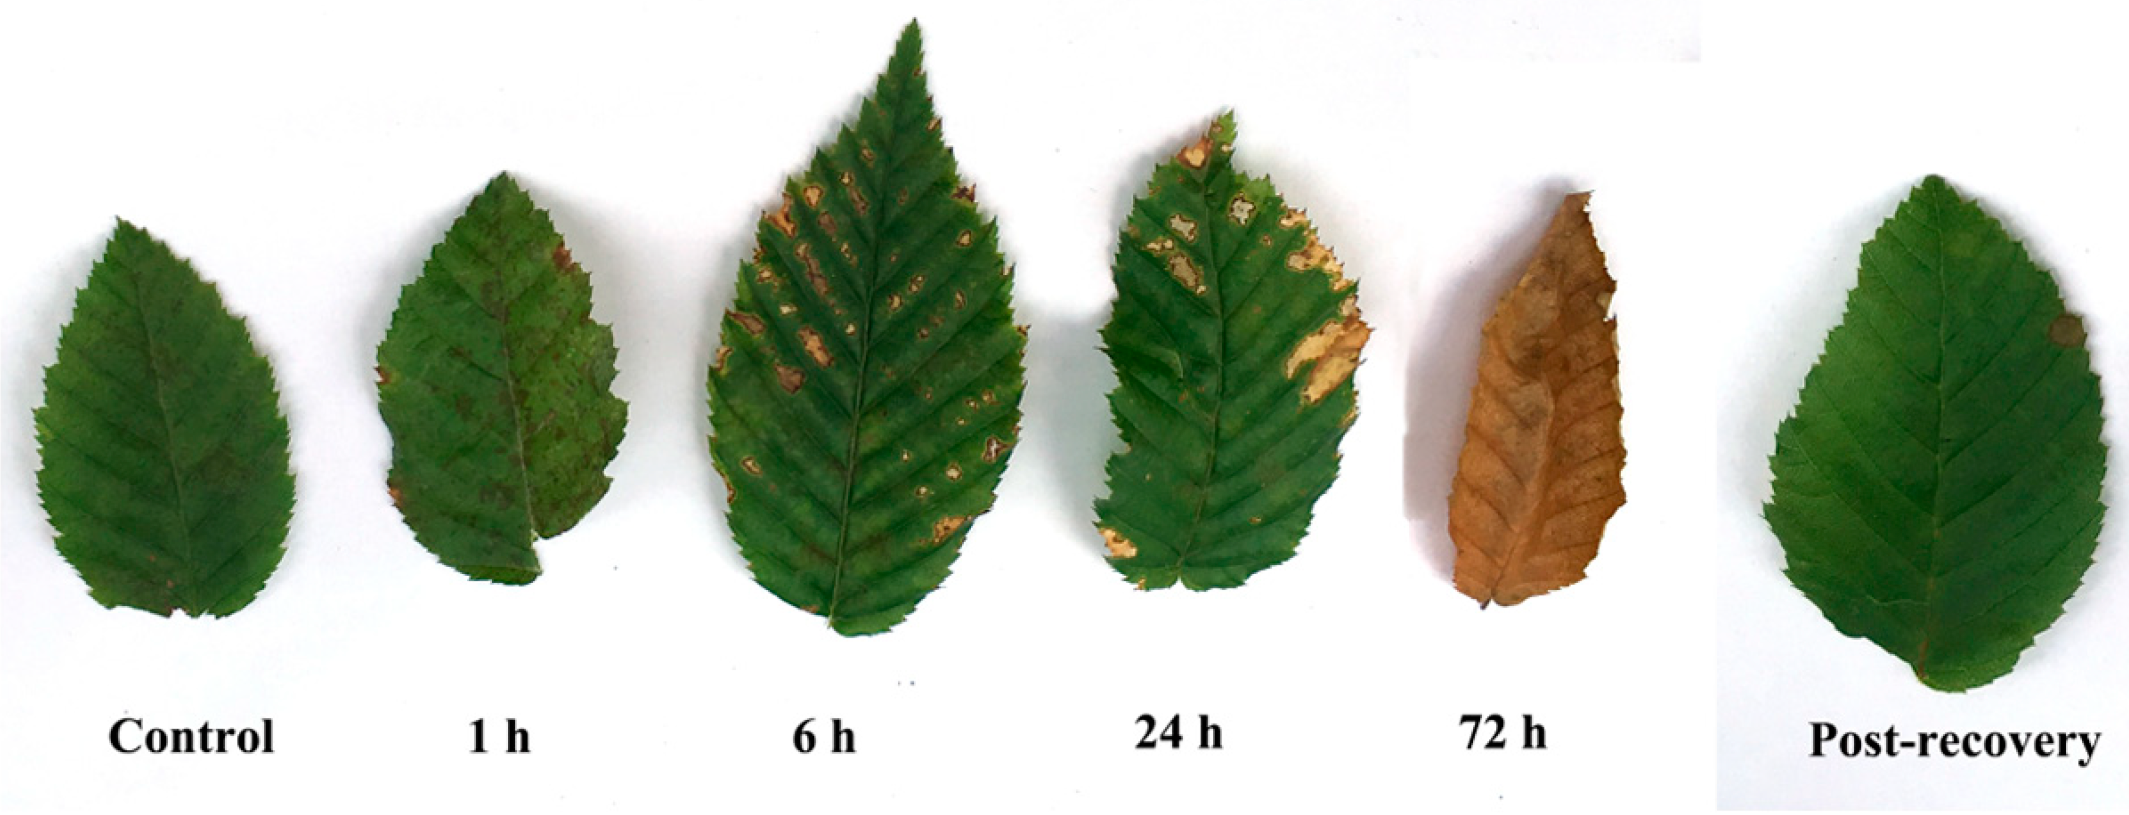
3.1. Changes in Leaf Chl Concentration in NO2-Treated and Post-Recovery Plants
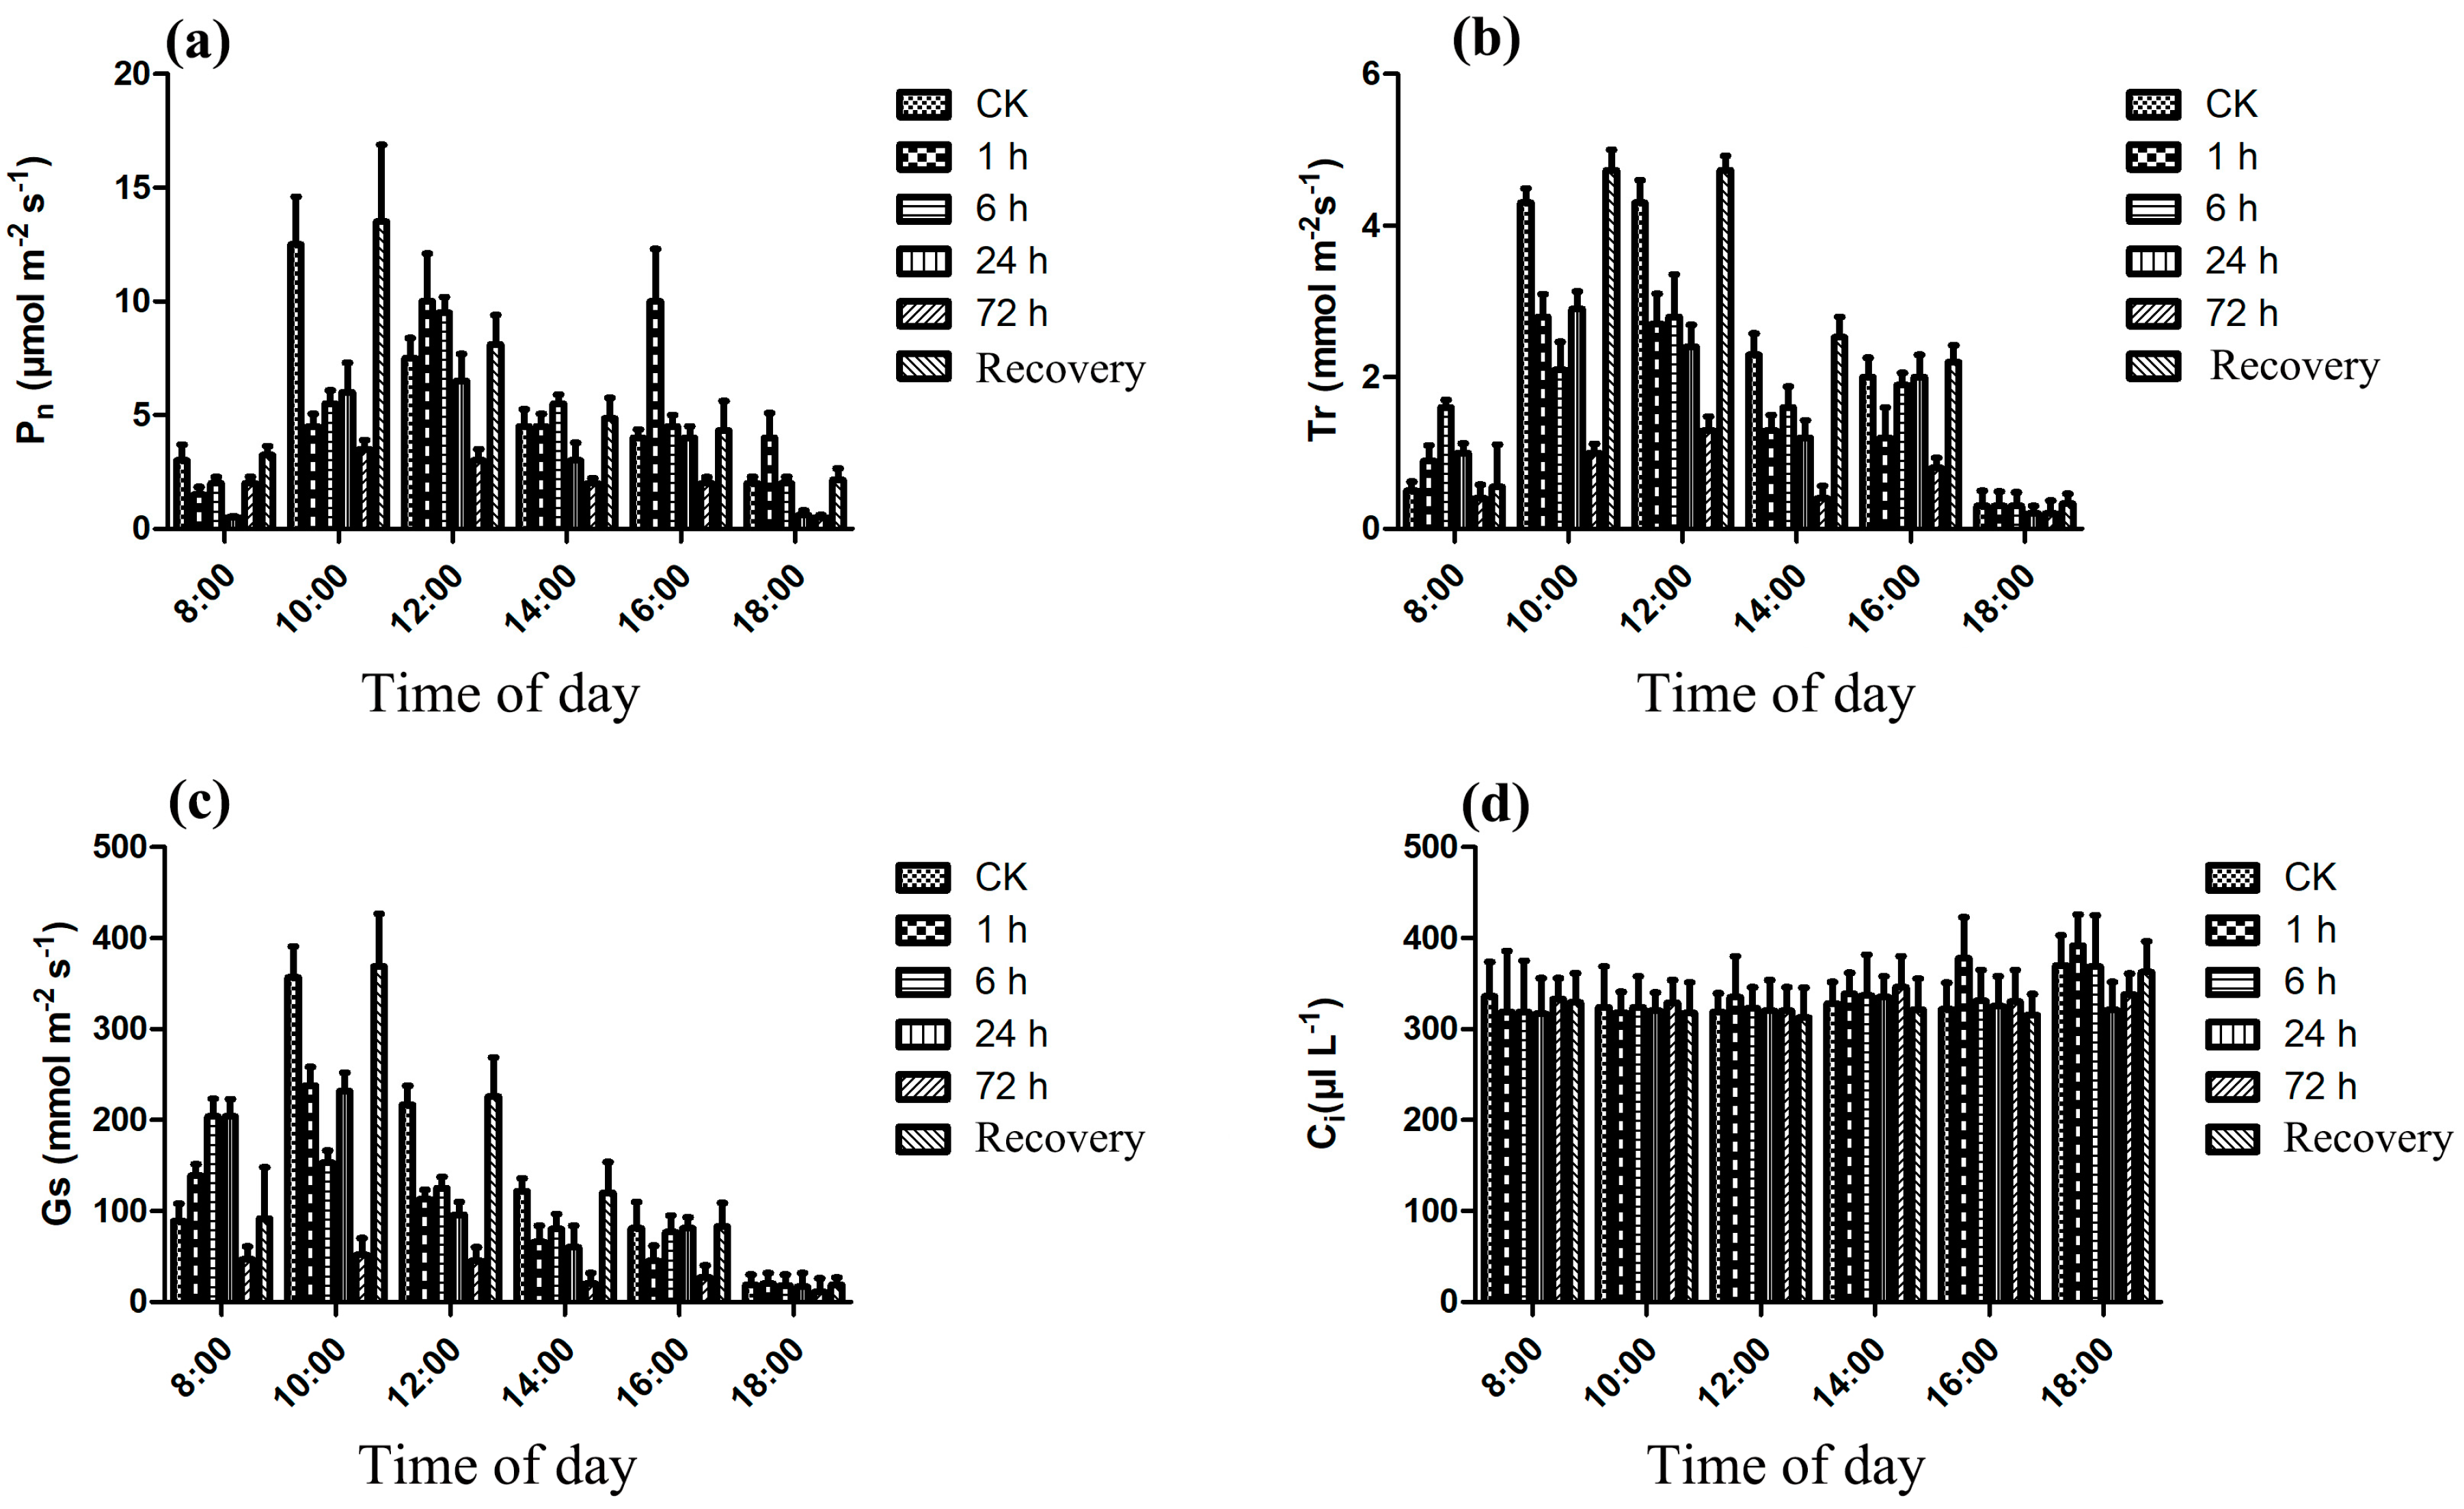
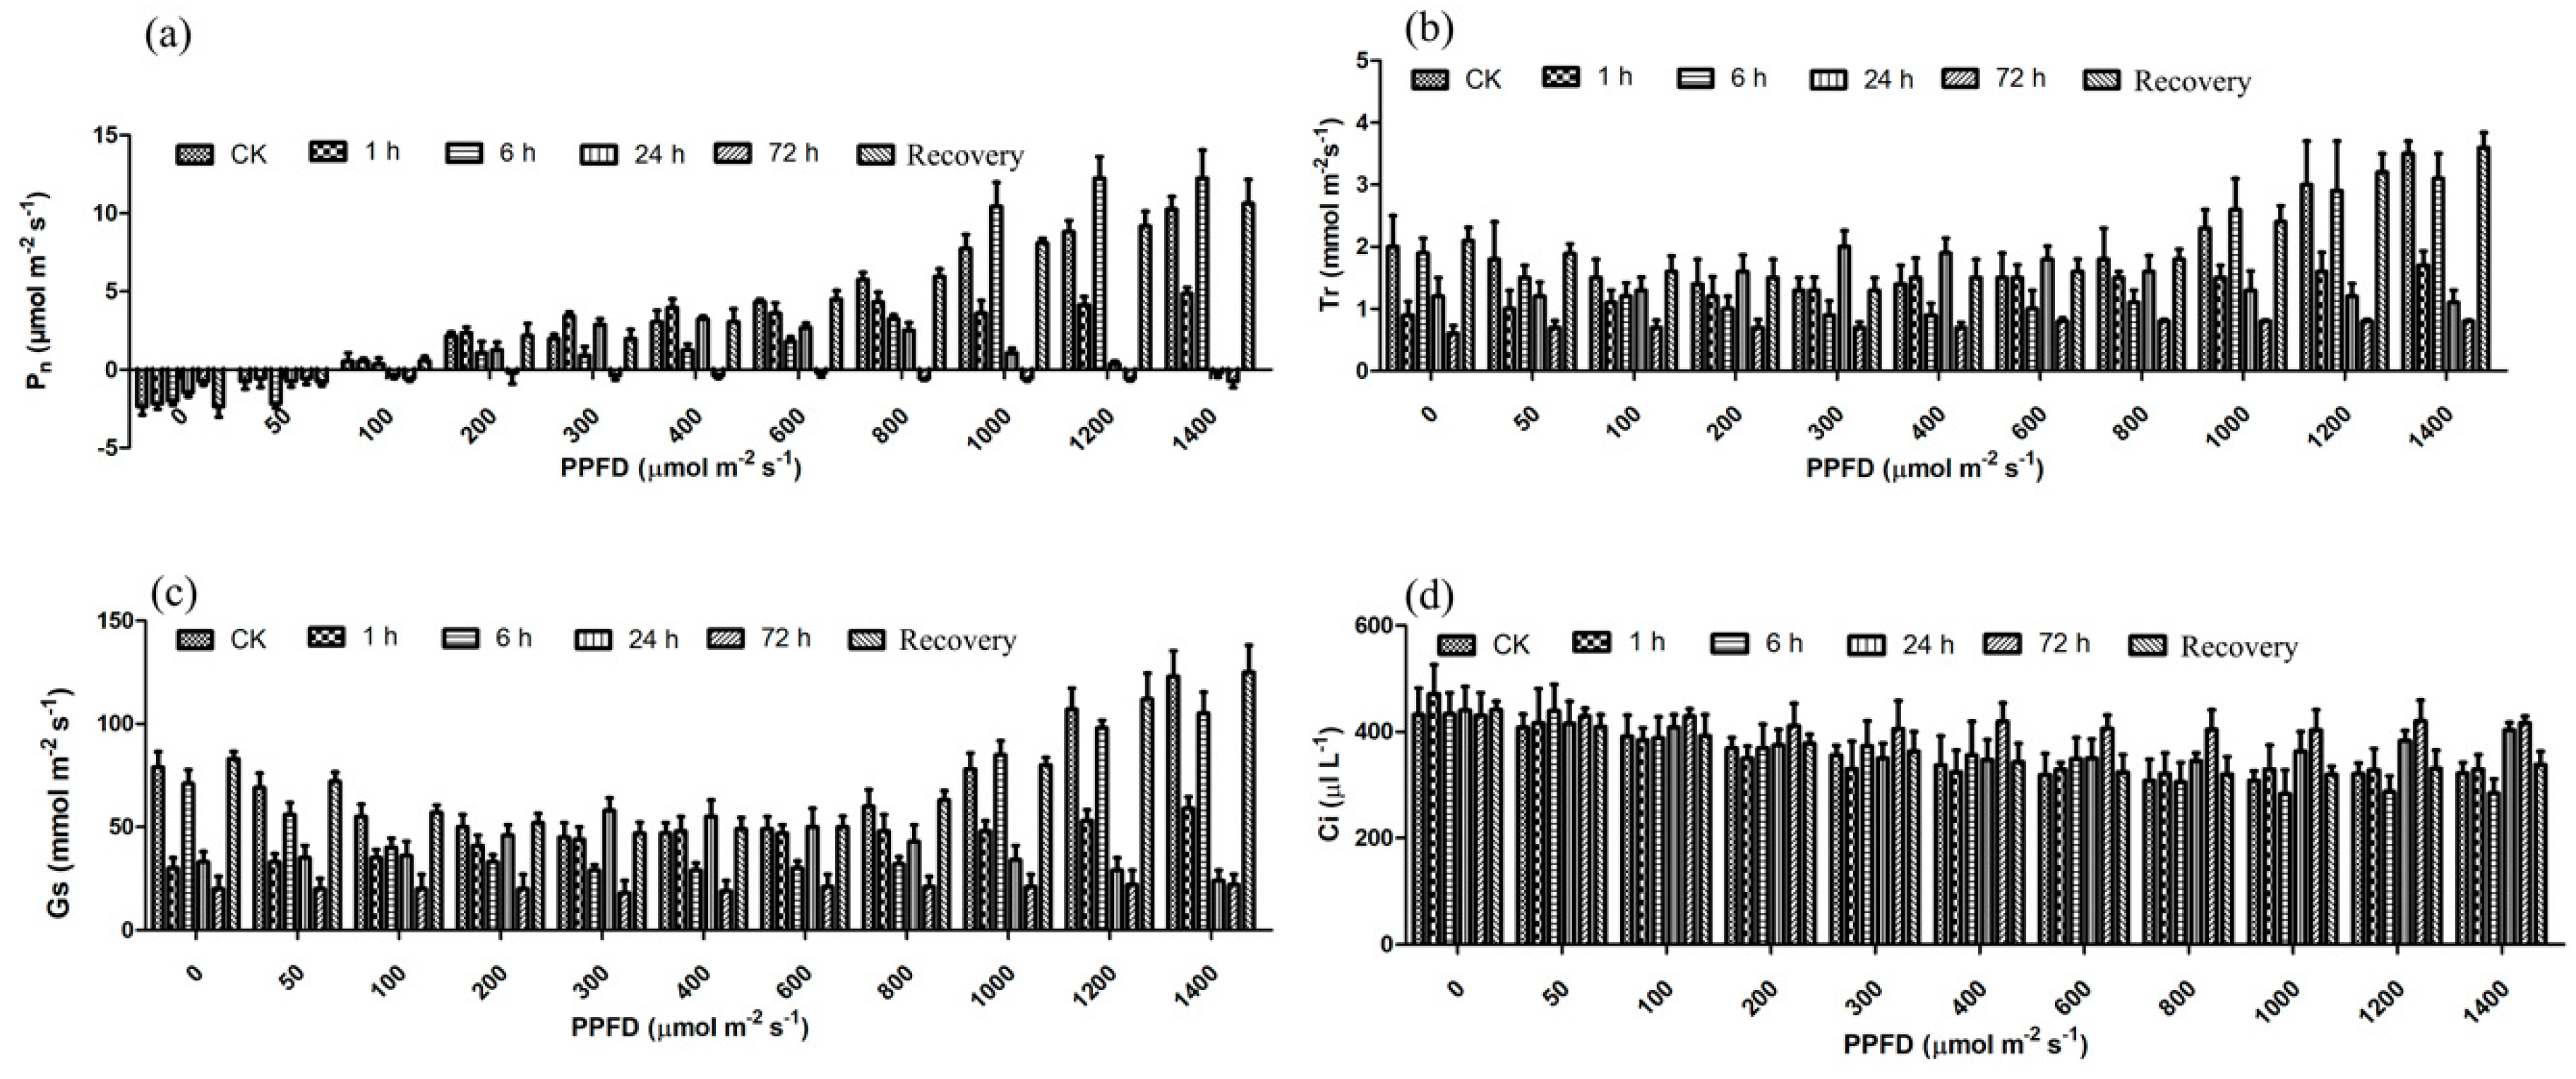
The Chl concentration was significantly affected (p < 0.05) by the different NO2 treatment times (Table 1). Chl a, Chl b, carotenoid and total Chl concentrations in the 1 h NO2 treatment were 20.84 ± 5.3 mg/g fw, 9.95 ± 0.8 mg/g fw, 3.18 ± 0.2 mg/g fw and 30.78 ± 3.2 mg/g fw, respectively, showing significant increases compared with the values in plants from the 0 h NO2 treatment (control). In contrast, the Chl a, Chl b and total Chl concentrations decreased in plants treated for 6 to 72 h. No significant differences between the Chl a, Chl a/Chl b, carotenoids and total Chl concentrations were observed between the control and post-recovery plants.

3.2. Photosynthesis

The net photosynthetic rate of leaves exposed to NO2 was significantly lower than that of the control leaves (CK) (Figure 2a). The Pn values showed one peaks, at 10:00 a.m. in the control and post-recovery groups, which were delayed 2 h in the different NO2 treatment groups. The trend of Pn values was consistent between the control and post-recovery groups. No significant difference was found in the Pn value from 8:00 a.m. to 6:00 p.m. when the leaves were exposed to NO2 for 72 h. For all treatments, the values of Tr showed a trend of first increasing and then decreasing, with the maximum values appearing at 12:00 a.m. Tr values in NO2-treated leaves were also lower than those in the control and post-recovery leaves (Figure 2b). No significant differences between the control and post-recovery groups were present at 10:00 a.m. and 12:00 a.m.
After NO2 exposure, the Gs value changed with the time of day but did not show a consistent trend with increasing NO2 exposure time; the maximum values of Gs appeared at 10:00 a.m. and the values of all NO2-exposed leaves were noticeably lower than those of the control and post-recovery groups (Figure 2c). NO2 exposure for 72 h led to the lowest values of Pn, Tr and Gs among the treatments. No significant changes in Ci occurred from 8:00 a.m.to 2:00 p.m. in leaves exposed to increasing durations of NO2 treatment (Figure 2d); a certain degree of increase was observed after 2:00 p.m. with different NO2 treatment times, but that trend was not significant.
The bar charts of Pn, Gs, Tr and Ci-PPFD responses of the 11 light-intensity treatments are shown in Figure 3. Regardless of the NO2 treatment, the Pn value increased rapidly as PPFD increased to 200 µmol m−2 s−1 and then increased slowly as PPFD increased to 800 µmol m−2 s−1. The Pn value in the 1 h NO2 exposure group increased rapidly to a maximum (12.24 µmol m−2 s−1) at 1200 µmol m−2 s−1, while those of the control and recovery groups increased slowly to a maximum (10.62 µmol m−2 s−1) at 1400 µmol m−2 s−1. The 1 h NO2 exposure group showed consistent increasing trends and maxima appeared (4.86 µmol m−2 s−1) at 1400 µmol m−2 s−1. A trend of first an increase and then a decline was observed in the 24 h group.
The Gs value showed a trend of first an increase and then a decrease in the leaves of the 12 h and 24 h NO2 exposure groups with an increasing PPFD (Figure 3c), while tendencies of first a decline and then an increase were observed in the control, post-recovery and 6 h NO2 exposure groups. The Gs values in the 6 h group were lower than those in the control and post-recovery groups. A slowly increasing trend was observed after 1 h NO2 exposure. The Gs values did not vary significantly with increasing PPFD in the 72 h group. The trends of the Tr values were similar to those of Gs (Figure 3b). Regardless of the NO2 treatment, Ci showed a declining trend with increasing light intensity, except in the 24 h group, which showed an increase after 400 µmol m−2 s−1. No significant changes in the Ci values were found for the 72 h NO2 exposure group (Figure 3d).
The photosynthetic characteristics of C. putoensis leaves exposed to different NO2 exposure times under 6 µL/L and recovery after 30 days are summarized in Table 2. Analysis of the photosynthetic characteristics of C. putoensis leaves exposed to different NO2 exposure times under 6 µL/L and recovery after 30 days showed that the change varied from 0.033 to 0.047, for a range of 0.012. Regarding apparent quantum yield (AQY) values, the different NO2 treatments and recovery were, in order, CK, 1 h, recovery, 6, 72 and 24 h. The light compensation point (LCP) values were significantly higher for the 1 h, CK and recovery groups than for the other NO2 treatments. That is, 1 h, CK and recovery showed a greater ability to make use of weak light than the other NO2 treatments did. The greater the maximum net photosynthetic rate (Pmax) values were, more of the potential energy from light could be used by the plants. The Pmax varied from 1.02–15.26 µmol m−2 s−1 and for the range was 14.24 µmol m−2 s−1. Overall, the photosynthesis potential decreased in the following order: 1 h, recovery, CK, 6, 24, and 72 h. Plant dark respiration is a consumption sensor that mainly affects plant growth status and temperature. The smaller the dark respiration rate is, the greater the energy consumption is likely to be. Significant differences were observed among the different NO2 treatments, which varied from −2.34 µmol m−2 s−1 to −0.52 µmol m−2 s−1 and the range was 1.82 µmol m−2 s−1. Moreover, the dark respiration rate (Rd) values were smallest for the CK and recovery conditions, showing that the stronger the dark respiration rate was, the greater the energy consumption. Similarly, the weakest dark respiration rate, in the 72 h NO2 treatment (−0.52 µmol m−2 s−1), was associated with less energy consumption. The LCP values differed significantly between NO2 treatment and recovery; the values varied from 42.5 µmol m−2 s−1 to 151.2 µmol m−2 s−1, for a range of 108.7 µmol m−2 s−1. The LCP values in the different NO2 treatments and recovery were in the following order: 1 h, CK, recovery, 6, 24, and 72 h. The LCP values of 1 h, CK and recovery were significantly higher than those of the other NO2 treatments. This result shows that 1 h, CK and recovery have a greater ability to make use of weak light than other NO2 treatments, which is consistent with the result for AQY. The light saturation point (LSP) values in the different NO2 treatments ranged from 403.2 µmol m−2 s−1 to 1957.2 µmol m−2 s−1, with the highest LSP value observed in the 1 h NO2 treatment, followed by CK and recovery. The lowest LSP value was observed for the 72 h NO2 treatment and the range was 1554 µmol m−2 s−1. In other words, plants in the 1 h NO2 treatment were better able to make use of bright light compared to plants in the CK and recovery groups. The largest difference between LSP and LCP was 1806 µmol m−2 s−1, in the 1 h NO2 treatment, followed by CK at 1548 µmol m−2 s−1 and recovery at 937.1 µmol m−2 s−1. This result shows that plants subjected to the 1 h NO2 treatment were more adaptable than plants in the CK and recovery groups.

3.3. Chl Fluorescence of NO2-Treated and Post-Recovery Plants

The recordings of the fluorescence parameters showed that the maximum quantum yield of PSII, as revealed by the Fv/Fm ratio, was affected after exposure to NO2 for 1 to 72 h compared to that in the control and post-recovery groups; with a maximum (0.827) in the 1 h NO2 exposure group (Table 3). This effect was paralleled by increases and decreases in the minimum (Fo) and maximum values of basal fluorescence (Fm); the maximum and minimum values of Fo were observed at 24 h and 1 h, respectively. The mean Fv/Fm ratio (0.758) of the NO2 exposure groups was 91.9% of that of the control and the Fv/Fm ratio (0.837) was significantly (p < 0.05) higher for the maximum NO2 exposure than for the control. The maximum PI (2.106), which was 1.186 times the control value (1.775), was observed after 1 h of NO2 exposure. No significant difference was found between the control and post-recovery groups (p > 0.05). The results are summarized in Table 3.

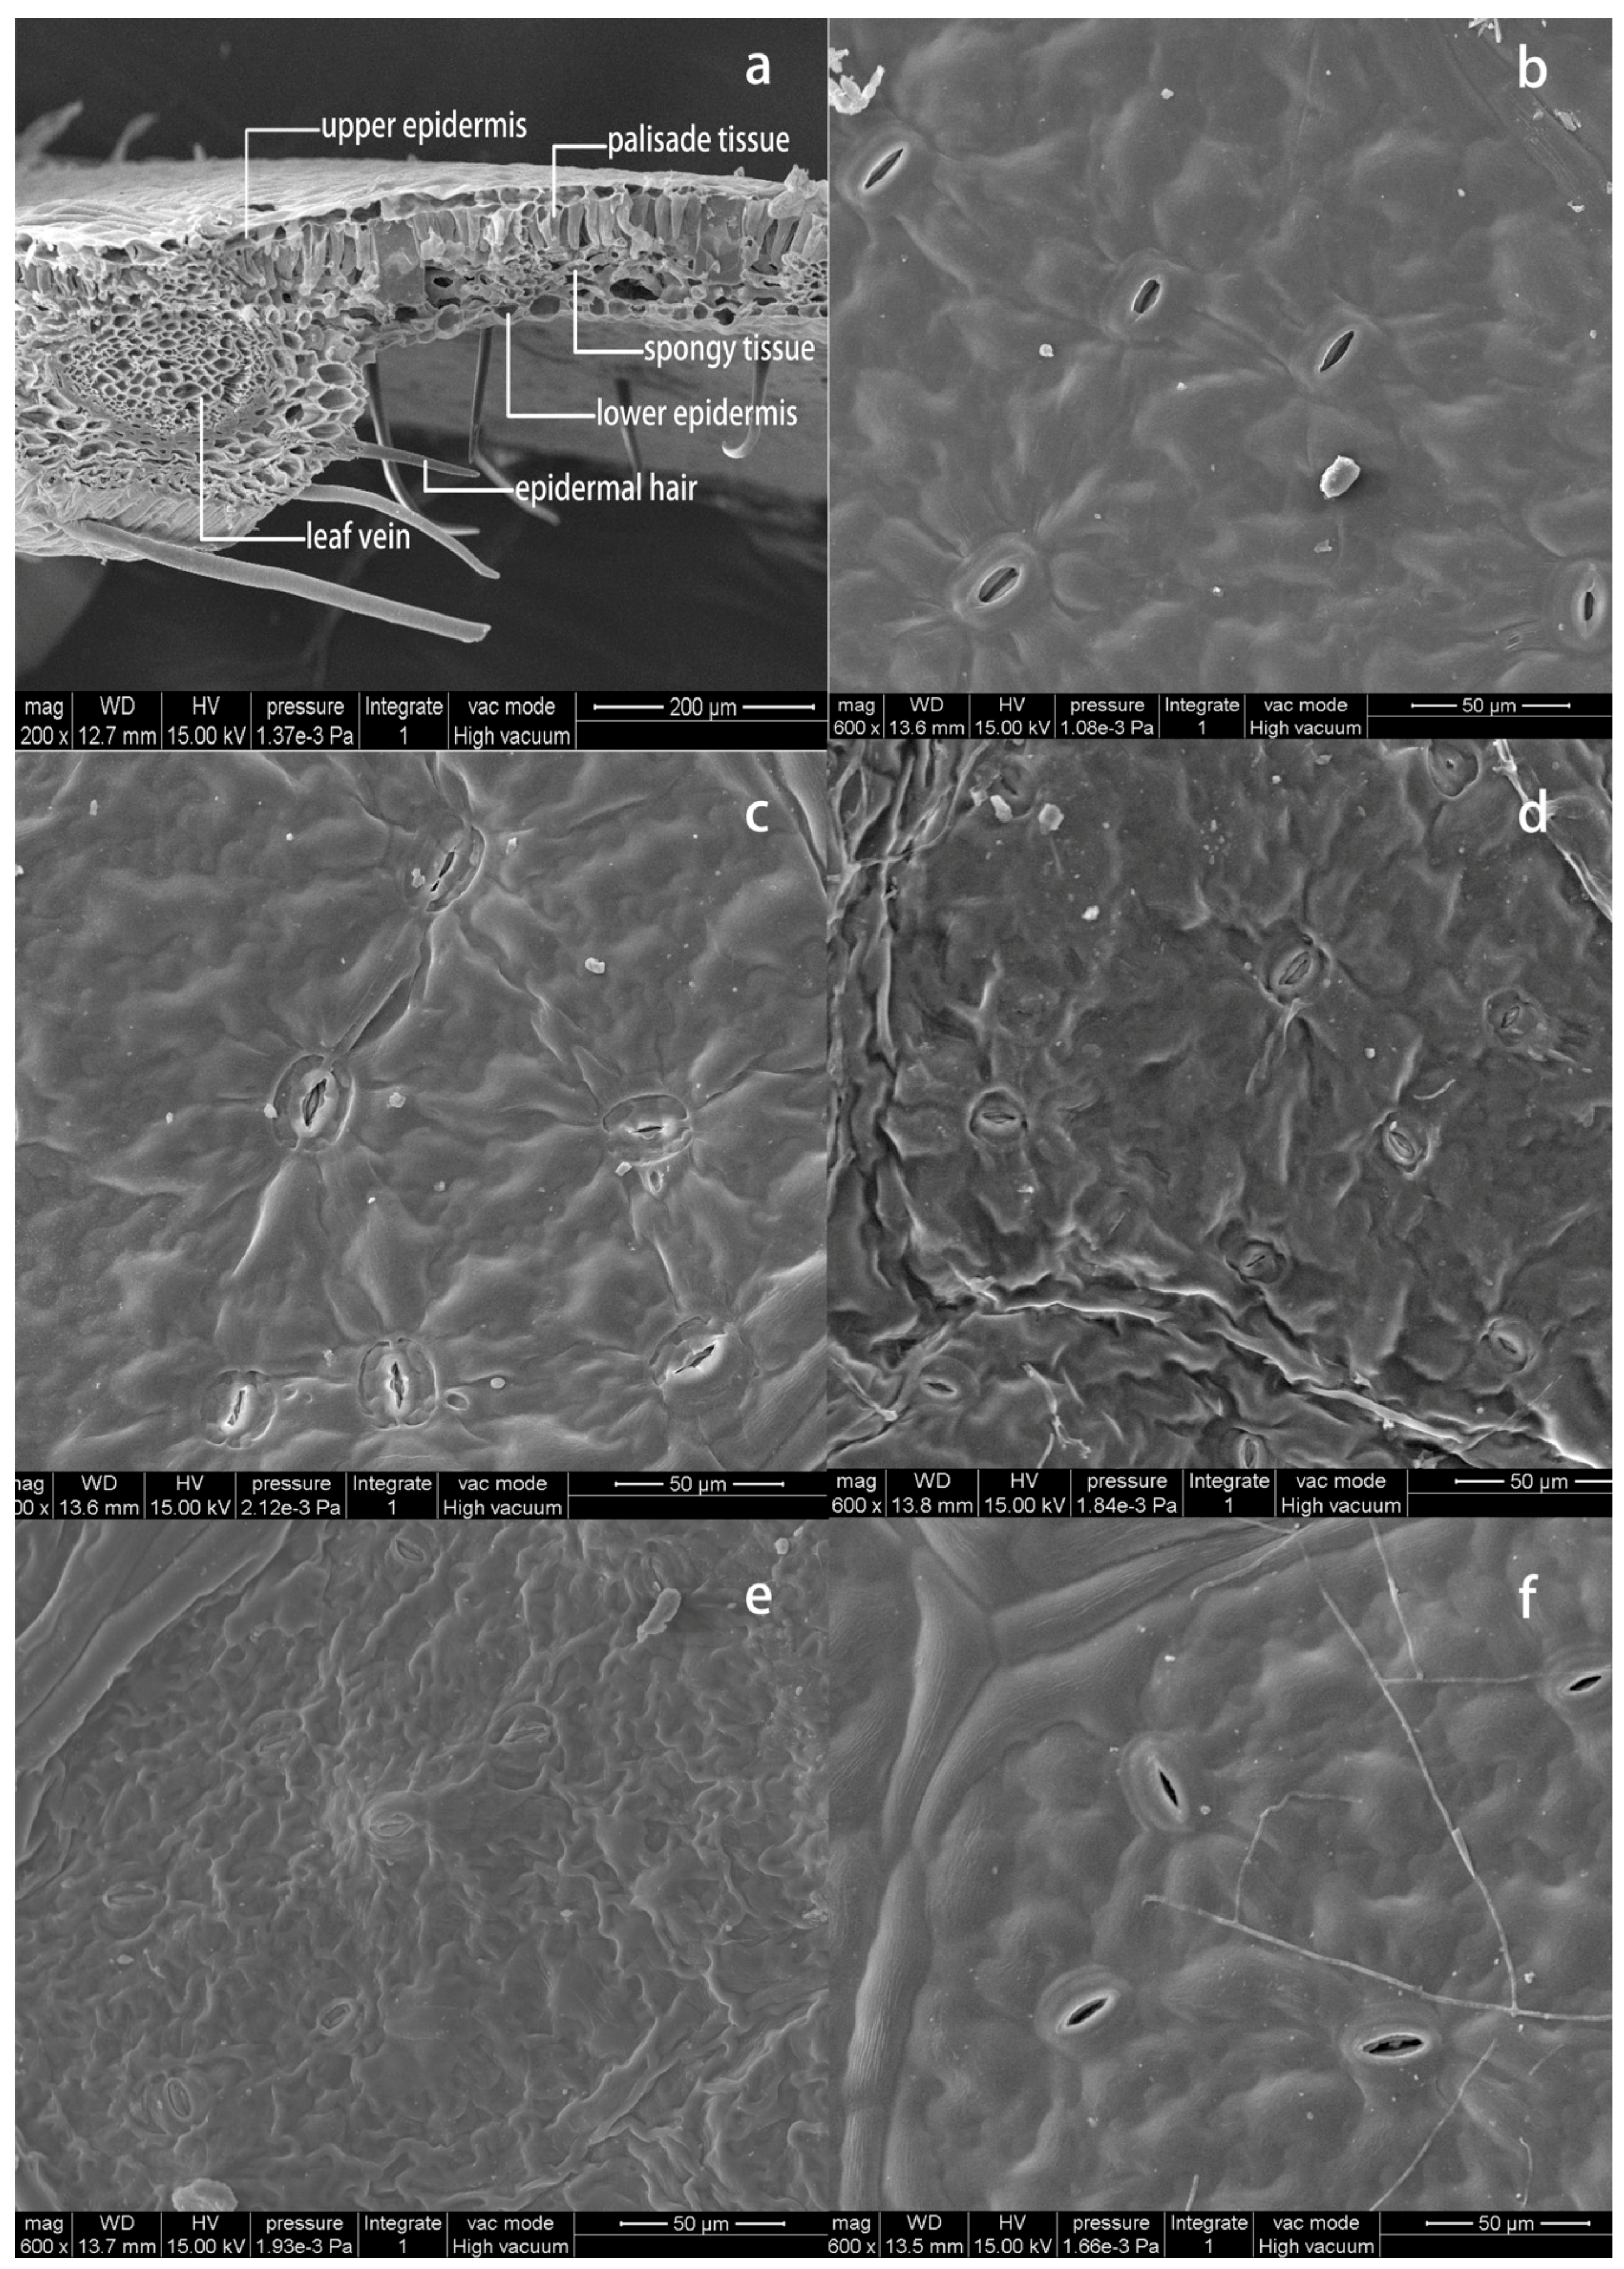
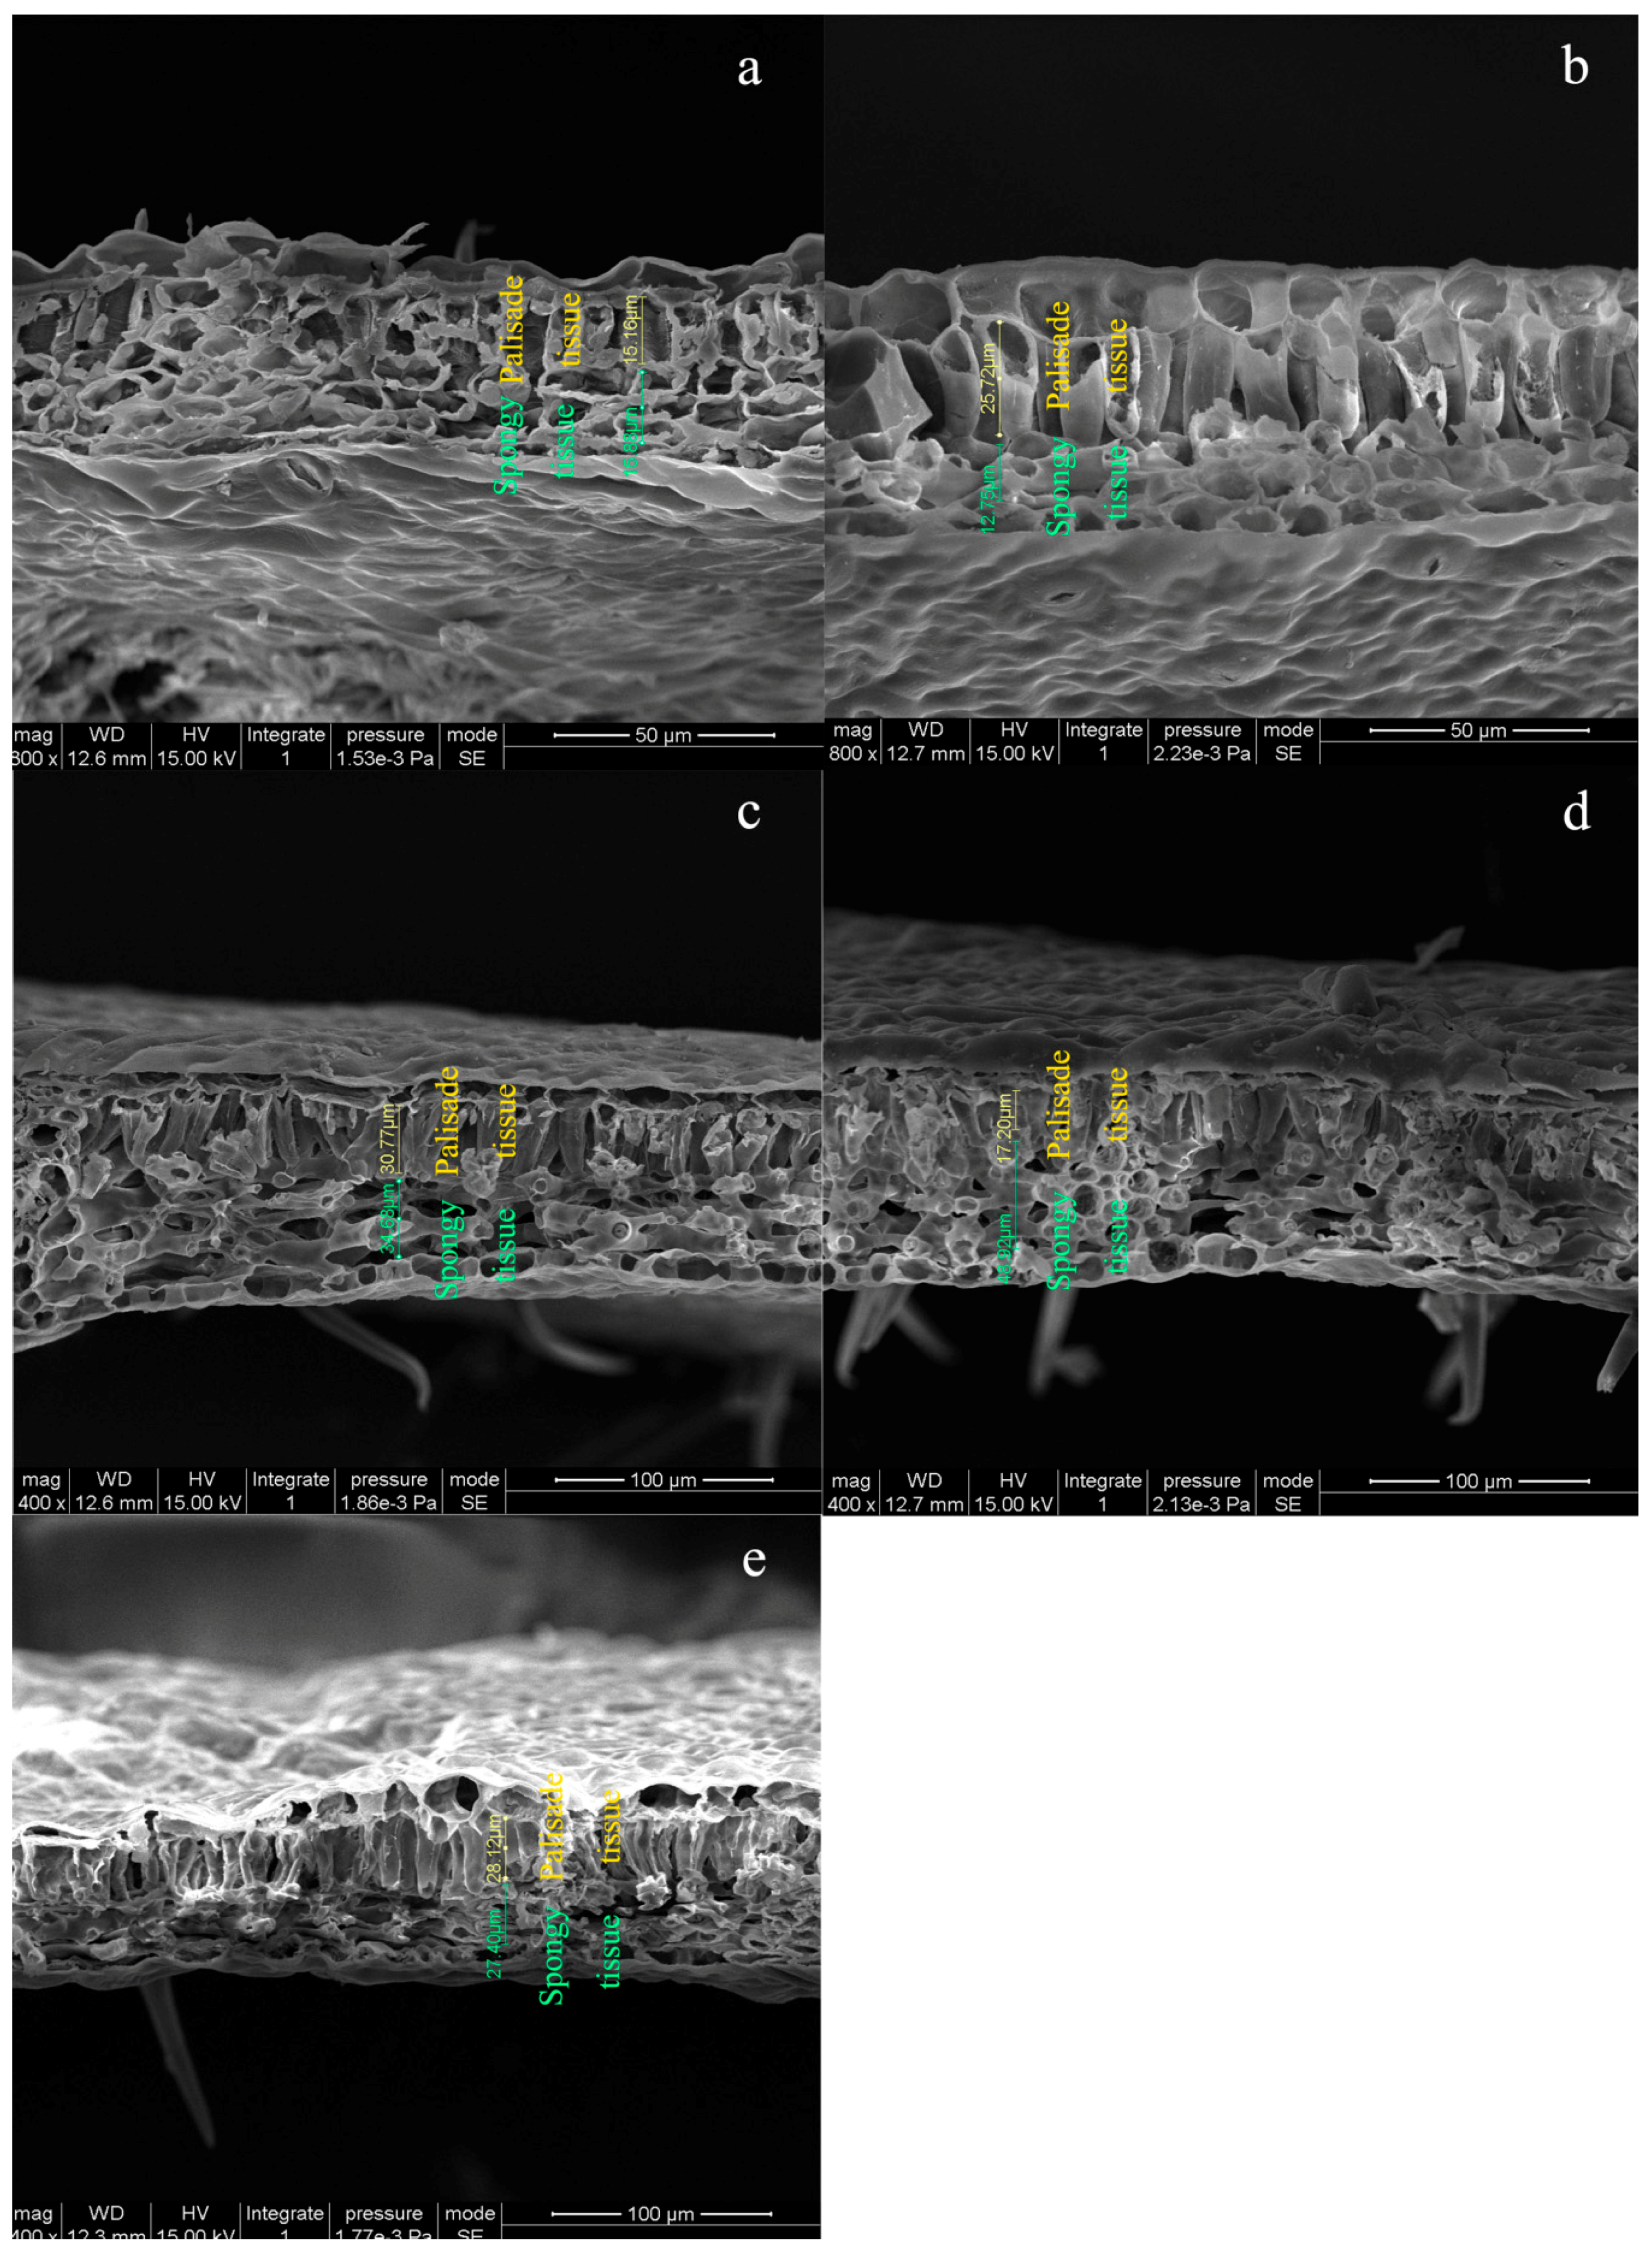
3.4. Leaf Anatomy and Stomatal Morphology in NO2-Treated and Post-Recovery Plants

Figure 4 shows a typical scanning electron micrograph of a C. putoensis leaf, including the upper and lower epidermis, palisade/spongy tissues, leaf vein and epidermal hairs (Figure 4a). Typically, C. putoensis leaves are amphistomatic, with an infrequent stomatal distribution in the adaxial epidermis and a frequent stomatal distribution in the abaxial epidermis; here, stomata were observed on both the abaxial and adaxial leaf surfaces. Noticeable differences in the stomatal size were found in the leaves exposed to 6 µL/L NO2 for 0 h (control), 1, 24, and 72 h and the post-recovery leaves (Figure 4b–f, respectively). The stomatal guard cells had a wrinkled appearance after exposure to NO2 for 1 or 24 h. Under the scanning electron microscope, the stomatal openings became progressively smaller in the leaves with increasing NO2 exposure time, beginning with the 1 h NO2 exposure group; the stomata were closed in the 72 h group. However, after a recovery period of 30 days, the stomata had reopened to their original aperture size.
Figure 5 shows the palisade tissue and spongy tissue of leaves exposed to 6 µL/L NO2 for 0 h (control), 1, 24, and 72 h and the post-recovery leaves (Figure 5a–e, respectively). The thicknesses of the palisade tissue and spongy tissue in the NO2-treated leaves were significantly higher than those in the control leaves, by 23.9%, 110.8% and 113% in the 1, 24 and 72-h groups, respectively. Those in the post-recovery group were 78.8% higher than those in the control group, but the ratio of palisade tissue to spongy tissue did not differ significantly between the control and post-recovery groups. These results indicate the positive effects of recovery on leaf anatomy (p < 0.05).

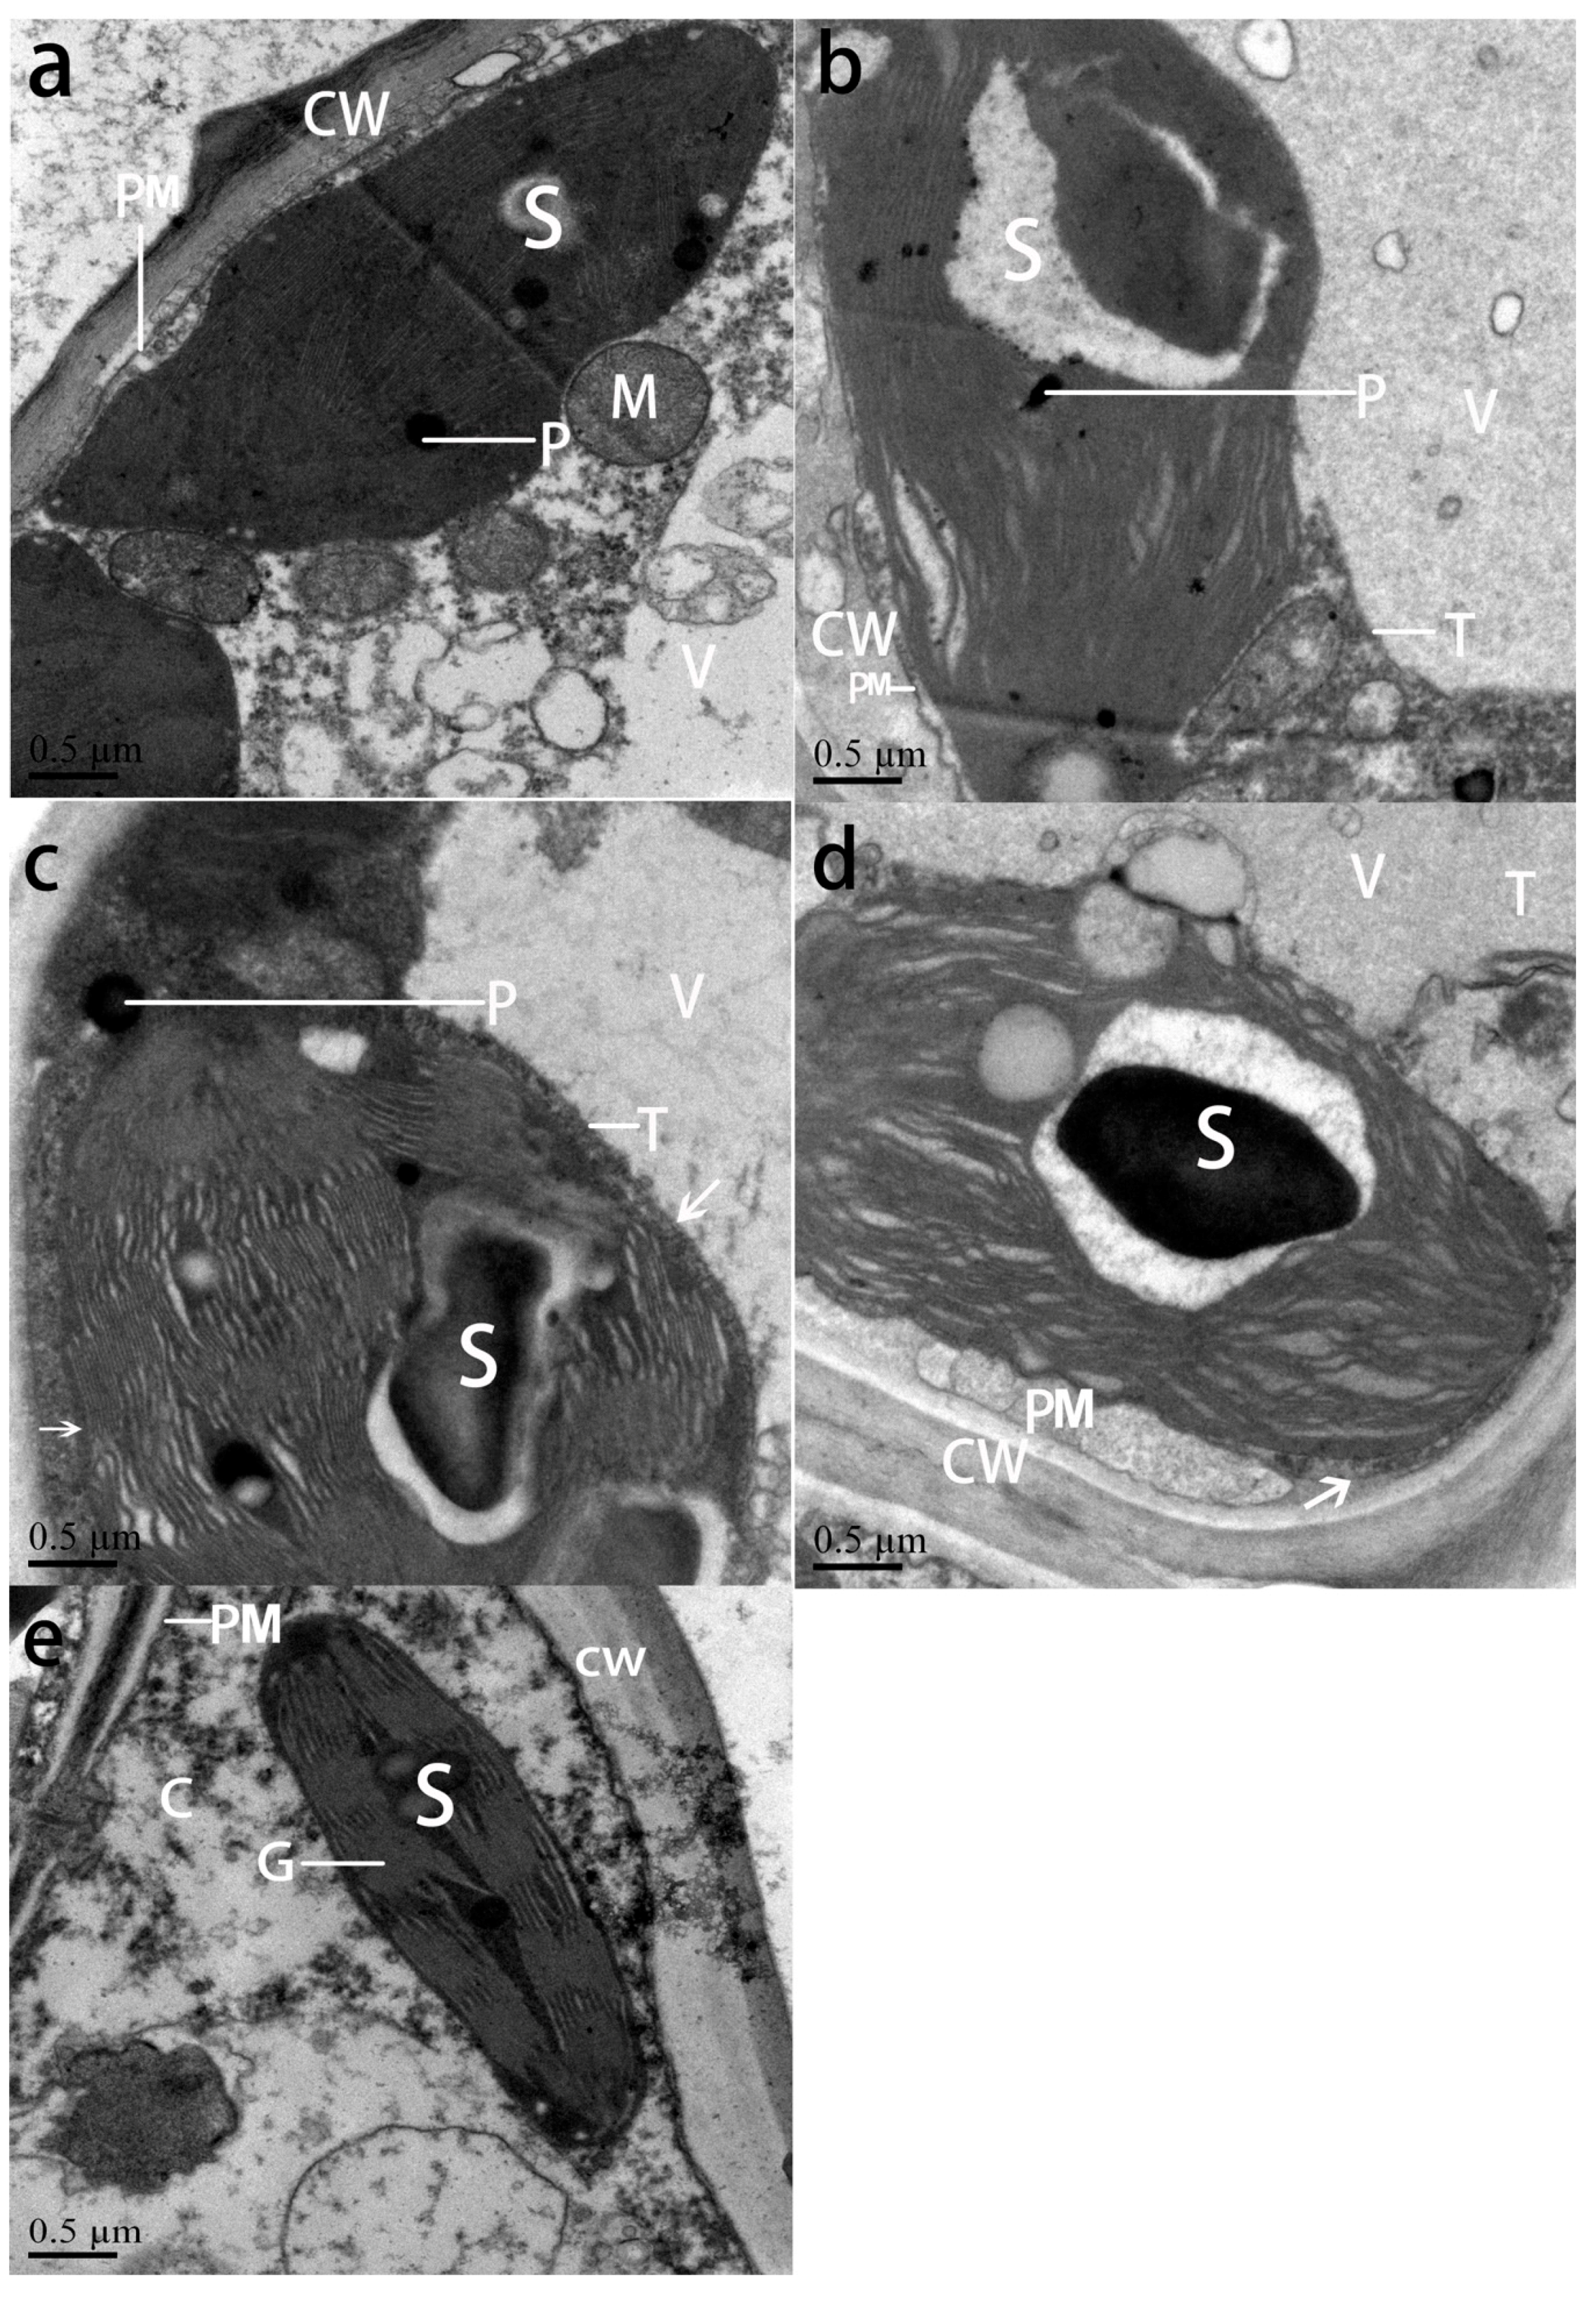
3.5. Ultrastructure of Leaf Chloroplasts in NO2-Treated and Post-Recovery Plants

Figure 6 shows TEM micrographs of leaves in the control group; plants treated with NO2 for 1, 24, and 72 h; and the post-recovery group. The control chloroplasts (Figure 6a) were oval and contained numerous, well-compartmentalized grana stacks. Little starch was present. In the NO2-treated plants (Figure 6b,c), most of the chloroplasts were slightly damaged and swollen chloroplasts were found in some cells (Figure 6c). A small proportion (less than 10%) of the chloroplasts had slightly expanded thylakoids (Figure 6c). Occasionally, the thylakoids were greatly distended (Figure 6d). Plastoglobuli were more numerous in these chloroplasts and the envelope was disrupted. The mitochondria in these cells were also breaking down.
The leaves of the plants in the post-recovery group had discoidal chloroplasts, with abundant starch grains (Figure 6e). After recovery from NO2 treatment, almost all the chloroplasts seemed to recover a normal structure. In every case, starch was present. In some chloroplasts, the thylakoid system was hardly affected. Few differences were found between the plastids of the control group and those of the plants that had recovered from 72 h of NO2 treatment (Figure 6a,e).

4. Discussion

In this study, we explored the changes in photosynthesis, stomatal behavior and chloroplast ultrastructure of C. putoensis under NO2 exposure for various durations. Furthermore, we explored the recovery of these traits after 30 days.
Our results showed that NO2 affected the Chl content in the C. putoensis leaf and its effects varied as a function of exposure time; 1 h NO2 exposure could lead to an increased Chl content. Beckerson and Hofstra found increased leaf amino acids and proteins in radish, cucumber and soybean in response to O3 treatment [35]. The increase in protein-N may be explained by new protein synthesis as the plant attempts to recover from O3 injury [36]. In the case of NO2, NO2 enters the leaf mesophyll tissue through the stomata [37]; it may act as a source of nitrogen and thus result in increased cellular protein [38]. Considering that nitrogen is one of the most important elements in Chl content, the increased Chl content in the present study might be attributable to this nitrogen source, which was sufficient to provide this vital element for Chl synthesis [9]. Such a finding was also proved by Sabaratnam and Gupta [39]. With a prolonged exposure to NO2, however, the Chl content declined, which was consistent with the reduction in total Chl contents of various crop plants, under ambient air pollution, in suburban and rural areas of Varanasi, as reported by Agrawal [40]. Our results also agree with a study that found that the exposure of Arabidopsis shoots to NO2 caused decreased Chl contents at several concentrations (0.9, 2.13, 4.52 and 10 µL/L) [6]. The reduced Chl content in the present study might be attributable to the stomatal entry of NO2 into the leaf mesophyll tissue, where it could combine with water and be converted to nitric acid; this compound burns plant tissue, causing oxidative damage accompanied by changes in the antioxidant defense system and consequently an unbalanced metabolism [28,41,42].
In this study, we found that 6 µL/L NO2 negatively influenced the net photosynthetic rate (Pn), stomatal conductance (Gs) and transpiration rate (Tr) of C. putoensis leaves (Figure 2). Significant declines in Pn, Gs and Tr occurred in leaves exposed to 6 µL/L NO2 for 72 h. Our results agree with those of previous research that showed an inhibitory effect of gaseous NO2 (7.39 µL/L, exposed for 2 h) on the net photosynthetic rate of Populus euramericana leaves [17] and are also consistent with the decline in net photosynthetic rate caused mainly by NO2 treatment when Populus alba × Populus berolinensis hybrid leaves were exposed to 4 µL/L NO2 for 48 h [11].
A decrease in Fv was observed in plants growing with NO2 exposure, which reflects the decrease in the light-quenching capacity of Chl in these plants [9]. The Fv/Fm ratio also showed a significant decline in plants with NO2 exposure, except for the 1 h NO2 treatment group, in which this value increased. The decrease in the Fv/Fm ratio can be directly correlated to the decrease in Pn in NO2-exposed plants. A similar relationship between a decreased Fv/Fm and photoinhibition of Pn has been reported in the leaves of Swietenia, where the Fv/Fm ratio decreased to the same extent as O2 evolution did [43]. Somewhat surprisingly, in the 1 h NO2 treatment group, the Chl content increased, whereas Chl fluorescence intensity, especially the Fo value, decreased compared to the CK group. This finding contradicted the literature [11]. Presumably, this inconsistency was caused by the following factors: (1) A screening effect: Chloroplasts in the upper cell layers prevented the light from reaching those on the other side of the leaf, i.e., those chloroplasts became invisible from a fluorescence emission viewpoint; (2) re-absorption: Fluorescence emitted from the chloroplasts deep in the leave was absorbed by the chloroplasts in the upper cell layers, which reduced the amount of fluorescence detectable with the fluorimeter [44]. Consequently, the leaves failed to be probed completely by the excitation light. Another inconsistency between the fluorescence intensity and Chl content was reported by Hsu, where a change in Chl content effected the fluorescence kinetics, that is, the fluorescence intensity of the J-step increased slightly as the leaves lost more Chl [45].
In this study, we used SEM and TEM techniques to analyze the effects of gaseous NO2 on stomatal behavior and chloroplast ultrastructure, respectively, in C. putoensis leaves. Atmospheric NO2 enters the leaf mainly through the stomata, with a small fraction of cuticular deposition. Our results show that 6 µL/L NO2 resulted in stomatal dysfunction: Partial closure of the stomata (Figure 4) and reduced stomatal conductance (Figure 2 and Figure 3).
Our results demonstrate the significant effects of increasing the duration of exposure to gaseous NO2 on the ultrastructure of mesophyll cells: Swelling and slightly decreased numbers of thylakoids, enhanced translucence of plastoglobuli, reduced length of chloroplasts and starch grains, and an increased number of plastoglobuli. These results agree with those of Holopainen [46], who found that air pollutants (SO2 and NO2) significantly altered the ultrastructure of conifer needles, especially the chloroplasts of the mesophyll cells adjacent to stomata. Our results are also consistent with those of studies showing that gaseous SO2 or NO2 led to swollen thylakoids and a reduction in the number of grana stacks compared with those of controls [17,47].
The effects of NO2 exposure on chloroplast ultrastructure were directly related to Chl content and Chl fluorescence; thus, we speculate that the effects of NO2 on plants are partially attributable to the generation and accumulation of NO2-derived N in the apoplastic and symplastic spaces. Our results indicate that gaseous NO2 leads to a decreased Chl content and Fv/Fm with increasing NO2 exposure, except for the 1 h treatment; C. putoensis leaves exposed to NO2 showed ultrastructural changes in the chloroplasts, causing cell acidification followed by damage to the cell membrane and then chloroplast destruction. The changes in chloroplast ultrastructure observed in the leaves were similar to those described in Ca-stressed plants [33], namely, irregular outlines of the plastids and distortion of the thylakoid system. These changes may be caused, in part, by NO2 altering the semipermeable properties of the plastid envelope. After entering the leaf through the stomata, NO2, a kind of acidic pollutant, could be converted into NO2, by acidification [48]. However, we did not investigate NO2 accumulation in the exposed leaves, so the relationships between increased Chl content, the Fv/Fm ratio, and NO2 accumulation remain unclear.
The effects of natural recovery on plant responses to air pollutants, particularly NO2, have never been reported. We have found that natural recovery increased the thickness of the palisade and spongy tissue, Chl content (Table 1), Fv/Fm (Table 3) and Pn (Figure 2 and Figure 3) in NO2-treated leaves. There were no significant differences between the control and post-recovery groups. These results agreed with the findings of Wellburn [18], who found that thylakoid swelling could be reversed by removing the pollutant from the air flow or changing the rate of gas flow within the tissue. This result could provide a scientific basis for functional landscape design and ecological forest construction.

5. Conclusions

Exposure to high concentrations of NO2 for short durations has significantly negative impacts on the Chl content, photosynthesis and chloroplast-related physicochemical processes of C. putoensis leaves, except for one hour of NO2 exposure, which is helpful for plant physiological responses. Natural recovery helped C. putoensis recover its normal physiological metabolism, possibly by enhancing chloroplast ultrastructure, Chl biosynthesis, the photosynthetic process, and stomatal opening after short-term exposure to high concentrations of NO2. Further work is proposed to analyze the changes in chloroplast gene expression between NO2 exposure and recovery conditions. In addition, an estimation of the photorespiration rate of NO2-exposed leaves with more accurate techniques should be considered.

Author Contributions

Conceptualization, Q.S.; methodology, Q.S. and Z.Z.; software, Q.S.; validation, Q.S. and Z.Z.; formal analysis, Q.S.; Investigation, Q.S.; resources, Z.Z.; data curation, Z.Z.; writing—original draft preparation, Q.S.; writing—review and editing, Z.Z.; visualization, Z.Z.; supervision, Z.Z.; project administration, Z.Z.; funding acquisition, Z.Z.

Funding

This research was funded by National Natural Science Foundation of China [31770752], Jiangsu Province Agricultural Science and Technology Independent Innovation Funds [CX (16)1005-4], Postgraduate Research & Practice Innovation Program of Jiangsu Province, Jiangsu Province Engineering Technology Research Center Projects [BM2013478], Jiangsu Province Six Big Talent Peak Project [NY-029], and Fourth Stage Funded Research Projects of 333 in Jiangsu Province.

Conflicts of Interest

The authors declare no conflicts of interest. The funders had no role in the design of the study; in the collection, analyses, or interpretation of data; in the writing of the manuscript, and in the decision to publish the results.

References

  1. Rahmat, M.; Maulina, W.; Rustami, E.; Azis, M.; Budiarti, D.R.; Seminar, K.B.; Yuwono, A.S.; Alatas, H. Performance in real condition of photonic crystal sensor based NO2 gas monitoring system. Atmos. Environ. 2013, 79, 480–485. [Google Scholar] [CrossRef]
  2. Bermejo-Orduna, R.; McBride, J.R.; Shiraishi, K.; Elustondo, D.; Lasheras, E.; Santamaría, J.M. Biomonitoring of traffic-related nitrogen pollution using Letharia vulpina (L.) Hue in the Sierra Nevada, California. Sci. Total Environ. 2014, 490, 205–212. [Google Scholar] [CrossRef] [PubMed]
  3. Breuninger, C.; Meixner, F.X.; Kesselmeier, J. Field investigations of nitrogen dioxide (NO2) exchange between plants and the atmosphere. Atmos. Chem. Phys. 2013, 13, 773–790. [Google Scholar] [CrossRef]
  4. Lu, M.; Li, Y.J.; Lu, J.P. The study of greening trees on the atmospheric pollutant absorption ability. Urban Environ. Urban Ecol. 2002, 15, 7–9. [Google Scholar]
  5. Morikawa, H.; Erkin, O.C. Basic processes in phytoremediation and some applications to air pollution control. Chemosphere 2003, 52, 1553–1558. [Google Scholar] [CrossRef]
  6. Liu, X.F.; Hou, F.; Li, G.K.; Sang, N. Effects of nitrogen dioxide and its acid mist on reactive oxygen species production and antioxidant enzyme activity in Arabidopsis. J. Environ. Sci. 2015, 34, 93–99. [Google Scholar] [CrossRef] [PubMed]
  7. Pan, W.; Zhang, W.Q.; Zhang, F.Q.; Gan, X.H.; Wang, M.H.; Li, M.S.; Lin, W.; Peng, Z. Resistance of Rhodoleia championii and other plants to sulfur dioxide and nitrogen dioxide. Ecol. Environ. Sci. 2012, 21, 1851–1858. [Google Scholar]
  8. Muñoz-Huerta, R.F.; Guevara-Gonzalez, R.G.; Contreras-Medina, L.M.; Torres-Pacheco, I.; Prado-Olivarez, J.; Ocampo-Velazquez, R.V. A review of methods for sensing the nitrogen status in plants: Advantages, disadvantages and recent advances. Sensors 2013, 13, 10823–10843. [Google Scholar] [CrossRef] [PubMed]
  9. Croft, H.; Chen, J.M.; Luo, X.Z.; Bartlett, P.; Chen, B.; Staebler, R.M. Leaf chlorophyll content as a proxy for leaf photosynthetic capacity. Glob. Chang. Biol. 2017, 23, 3513–3524. [Google Scholar] [CrossRef] [PubMed]
  10. Evans, J.R. Photosynthesis and nitrogen relationships in leaves of C3 plants. Oecologia 1989, 78, 9–19. [Google Scholar] [CrossRef] [PubMed]
  11. Hu, Y.B.; Bellaloui, N.; Tigabu, M.; Wang, J.H.; Diao, J.; Wang, K.; Yang, R.; Sun, G.Y. Gaseous NO2 effects on stomatal behavior, photosynthesis and respiration of hybrid poplar leaves. Acta Physiol. Plant 2015, 37, 39. [Google Scholar] [CrossRef]
  12. Weber, P.; Rennenberg, H. Dependency of Nitrogen Dioxide (NO2) Fluxes to Wheat (Triticum aestivum L.) Leaves from NO2 Concentration, Light Intensity, temperature and Relative Humidity Determined from Controlled Dynamic Chamber Experiments. Atmos. Environ. 1996, 30, 3001–3009. [Google Scholar] [CrossRef]
  13. Sparks, J.P. Ecological ramifications of the direct foliar uptake of nitrogen. Oecologia 2009, 159, 1–13. [Google Scholar] [CrossRef] [PubMed]
  14. Wellburn, A.R. Why are atmospheric oxides of nitrogen usually phytotoxic and not alternative fertilizers? New Phytol. 1990, 115, 395–429. [Google Scholar] [CrossRef]
  15. Huttunen, S.; Soikkeli, S. Effects of various gaseous pollutants on plant cell ultrastructure. In Gaseous Air Pollutants and Plant Metabolism, Proceedings of the 1st International Symposium on Air Pollution and Plant Metabolism, Oxford, UK, 2–5 August 1982; Koziol, M.J., Whatley, F.R., Eds.; Butterworths: London, UK, 1984; pp. 117–127. [Google Scholar]
  16. Fink, S. Histological and cytological changes caused by air pollutants and other abiotic factors. In Air Pollution and Plant Metabolism, Proceedings of the 2nd International Symposium on Air Pollution and Plant Metabolism, Munich, Germany, 6–9 April 1987; Schulte-Hostede, S., Darrall, N.M., Blank, L.W., Wellburn, A.R., Eds.; Elsevier Applied Science: Barking, UK, 1988; pp. 36–54. [Google Scholar]
  17. Furukawa, A. Inhibition of Photosynthesis of Populus euramericana and Helianthus annuus by SO2, NO2 and O3. Ecol. Res. 1991, 6, 79–86. [Google Scholar] [CrossRef]
  18. Schiffgens-Gruber, A.; Lutz, C. Ultrastructure of mesophyll cell chloroplasts of spruce needles exposed to O3, SO2 and NO2 alone and in combination. Environ. Exp. Bot. 1992, 32, 243–254. [Google Scholar] [CrossRef]
  19. Wellburn, A.R.; Majernik, O.; Wellburn, F.A.M. Effects of SO2 and NO2 Polluted air upon the Ultrastructure of Chloroplasts. Environ. Pollut. 1972, 3, 37–49. [Google Scholar] [CrossRef]
  20. Chaparro-Suarez, I.G.; Meixner, F.X.; Kesselmeier, J. Nitrogen dioxide (NO2) uptake by vegetation controlled by atmospheric concentrations and plant stomatal aperture. Atmos. Environ. 2011, 45, 5742–5750. [Google Scholar] [CrossRef]
  21. Li, R.G.; Jiang, Y.G.; Xu, J.; Zhou, B.; Ma, C.; Liu, C.; Yang, C.; Xiao, Y.; Xu, Q.; Hao, L. Synergistic Action of Exogenous Salicylic Acid and Arbuscular Mycorrhizal Fungus Colonization in Avena nuda Seedlings in Response to NO2 Exposure. Bull. Environ. Contam. Toxicol. 2010, 84, 96–100. [Google Scholar] [CrossRef] [PubMed]
  22. Liu, Y.; Ma, Q.F.; Liu, J.Y.; Zhu, Y.; Hao, L. The preliminary study on exogenous salicylic acid adjusting the response of nitrogen dioxide stress in wheat. J. Shenyang Norm. Univ. (Natl. Sci. Ed.) 2016, 34, 83–87. [Google Scholar]
  23. Ma, Q.F. The Adjustment of Endogenous Salicylic Acid on NO2 Stress in Arabidopsis; Shenyang Normal University: Shenyang, China, 2016. [Google Scholar]
  24. Zhang, X.H.; Wang, Z.J.; Li, X.P.; Yu, C.Y.; Chen, Y.P. RAPD analysis of genetic diversity of different progenies from endangered plant Carpinus putoensis. J. Shandong For. Sci. Technol. 2011, 41, 1–5. [Google Scholar]
  25. Zhong, T.L.; Li, G.Y.; Shi, B.L. Comparison of gas exchange and chlorophyll fluorescence parameters in three endangered species of Zhejiang Province. J. Shanghai Jiaotong Univ. Agric. Sci. 2009, 27, 149–152. [Google Scholar]
  26. Chen, B.B.; Li, W.P.; Zhou, J.; Wang, A.L. The cloning and analysis of ITS sequences on the four kind of plants of Carpinus genus in Tiantai Mountain. Acta Agric. Zhejiangensis 2011, 23, 1107–1112. [Google Scholar]
  27. Chen, J.; Wu, F.H.; Liu, T.W.; Chen, L.; Xiao, Q.; Dong, X.J.; He, J.X.; Pei, Z.M.; Zheng, H.L. Emissions of nitric oxide from 79 plant species in response to simulated nitrogen deposition. Environ. Pollut. 2012, 160, 192–200. [Google Scholar] [CrossRef] [PubMed]
  28. Ma, C.Y.; Xu, X.; Hao, L. The response to NO2 and the regulation of H2O2 in the seedlings of Chinese Cabbage. China’s Agric. Sci. 2007, 40, 2556–2561. [Google Scholar]
  29. Chen, Z.M.; Chen, Y.X.; Du, G.J.; Wu, X.L.; Li, F. Effects of 60-day NO2 fumigation on growth, oxidative stress and antioxidative response in Cinnamomum camphora seedlings. J. Zhejiang Univ. Sci. B 2010, 11, 190–199. [Google Scholar] [CrossRef] [PubMed]
  30. Clark, A.J.; Landolt, W.; Bucher, J.B.; Strasser, R.J. Ozone exposure response of beech quanti®ed with a chlorophyll āuores-cence performance index. In Critical Levels for Ozone Ð Level II. Environmental Documentation 115; Fuhrer, J., Achermann, B., Eds.; Swiss Agency for the Environment, Forests and Land-Scape: Bern, Switzerland, 1999; pp. 177–180. [Google Scholar]
  31. Lichtenthaler, H.K. Chlorophylls and Carotenoids: Pigments of Photosynthetic Biomembranes. Methods in Enzymology; Academic Press: Orlando, FL, USA, 1987; Volume 148, pp. 183–350. [Google Scholar]
  32. Teng, S.Y.; Chen, Z.M.; Du, G.J. The effect of NO2 exposure on nitrate reductase activity and nitrogen accumulation in Cinnamomum camphora seedlings. Zhejiang For. Sci. Technol. 2010, 20, 70–72. [Google Scholar]
  33. Hu, Y.; Bellaloui, N.; Sun, G.; Tigabu, M.; Wang, J. Exogenous sodium sulfide improves morphological and physiological responses of a hybrid Populus species to nitrogen dioxide. J. Plant Physiol. 2014, 171, 868–875. [Google Scholar] [CrossRef] [PubMed]
  34. Barcelo, J.; Vazquez, M.D.; Poschenrieder, C.H. Structural and ultrastructureal disorders in cadmium-treated bush bean plants (Phaseolous vulgaris L.). New Phytol. 1988, 108, 37–49. [Google Scholar] [CrossRef]
  35. Beckerson, D.W.; Hofstra, G. Response of leaf diffusive resistance of radish, cucumber and soybean exposed to O3 and SO2 singly or in combination. Atmos. Environ. 1979, 13, 1263–1268. [Google Scholar] [CrossRef]
  36. Craker, L.E.; Starbuck, J.S. Metabolic injury associated with O3 injury of bean leaves. Can. J. Plant Sci. 1972, 52, 589–597. [Google Scholar] [CrossRef]
  37. Spurr, A.R. A low-viscosity epoxy resin embedding medium for electron microscopy. J. Ultrastruct. Res. 1969, 6, 31–43. [Google Scholar] [CrossRef]
  38. Koziol, M.J.; Whatley, F.R. Gaseous Air Pollutants and Plant Metabolism; Butterworths: London, UK, 1984; pp. 147–168. [Google Scholar]
  39. Sabaratnam, S.; Gupta, G. Effects of nitrogen dioxide on leaf chlorophyll and nitrogen content of soybean. Environ. Pollut. 1988, 51, 113–120. [Google Scholar] [CrossRef]
  40. Teklemariam, T.A.; Sparks, J.P. Leaf fluxes of NO and NO2 in four herbaceous plant species: The role of scorbic acid. Atmos. Environ. 2006, 40, 2235–2244. [Google Scholar] [CrossRef]
  41. Agrawal, M.; Singh, B.; Rajput, M.; Marshall, F.; Bell, J.N.B. Effects of air pollution on peri urban agriculture: A case study. Environ. Pollut. 2003, 126, 323–329. [Google Scholar] [CrossRef]
  42. Li, D.S.; Sun, X.H.; Li, R.H.; Liu, A.H.; Wang, X.L. Analysis of resistance to sulfur dioxide and nitrate dioxide of economic forest seedling. J. Tianjin Univ. Technol. 2007, 23, 44–46. [Google Scholar]
  43. Miao, Y.M.; Chen, Z.M.; Chen, Y.F.; Du, G.J. Resistance to and absorbency of gaseous NO2 for 38 young landscaping plants in Zhengjiang Province. J. Zhengjiang Coll. 2008, 25, 765–771. [Google Scholar]
  44. Dinc, E.; Ceppi, M.G.; Toth, S.Z.; Bottka, S.; Schansker, G. The chl a fluorescence intensity is remarkably insensitive to changes in the chlorophyll content of the leaf as long as the chl a/b ratio remains unaffected. Biochim. Biophys. Acta 1817, 2012, 770–779. [Google Scholar]
  45. Hsu, B.D.; Leu, K.L. A possible origin of the middle phase of polyphasic chlorophyll fluorescence transient. Funct. Plant Biol. 2003, 30, 571–576. [Google Scholar] [CrossRef]
  46. Krause, G.H.; Virgo, A.; Winter, K. High susceptibility to photoinhibition of young leaves of tropical forest trees. Planta 1995, 197, 583–591. [Google Scholar] [CrossRef]
  47. Holopainen, T.; Anttonen, S.; Wulff, A.; Palomaki, V.; Kärentampi, L. Comparative evaluation of effects of gaseous pollutants, acidic deposition and mineral deficiencies: Structural changes in the cells of forest plants. Agric. Ecosyst. Environ. 1992, 42, 365–398. [Google Scholar] [CrossRef]
  48. Grunwald, C. Foliar fatty acids and sterols of soybean field fumigated with SO2. Plant Physiol. 1981, 68, 868–871. [Google Scholar] [CrossRef] [PubMed]
Figure 1. Typical pictures of plant leaf before and after NO2 treatment.
Forests 09 00561 g001
Figure 2. Bar charts showing diurnal changes in photosynthesis in the leaves of C. putoensis grown with exposure to 6 µL/L NO2 for 0, 1, 6, 24 and 72 h and after a recovery period; (a) net photosynthesis (Pn), (b) stomatal conductance (Gs), (c) transpiration rate (Tr) and (d) intercellular CO2 concentration (Ci).
Forests 09 00561 g002
Figure 3. Bar charts of the photosynthesis-irradiance (PAR) responses from the leaves of C. putoensis grown with exposure to 6 µL/L NO2 for 0, 1, 6, 24 and 72 h and after a recovery period. (a) net photosynthesis (Pn). (b) stomatal conductance (Gs). (c) transpiration rate (Tr). (d) intercellular CO2 concentration (Ci).
Forests 09 00561 g003
Figure 4. Scanning electronic microscopy (SEM) images of a leaf cross-section view (a) and leaf stomata in the control group (b), NO2-treated groups exposed to 6 µL/L NO2 for 1, 24 and 72 h (ce), and the post-recovery group (f). Scale bars, 50 and 200 µm.
Forests 09 00561 g004
Figure 5. Scanning electron microscopy (SEM) images of leaf palisade tissue and spongy tissue in the control group (a), NO2-treated groups exposed to 6 µL/L NO2 for 1, 24 and 72 h (bd), and the post-recovery group (e). Scale bars, 50 and 100 µm.
Forests 09 00561 g005
Figure 6. Transmission electron microscopy (TEM) images of chloroplasts from the primary leaf of control (a), NO2-treated (bd) and post-recovery (e) plants. (a) Control plant with a discoidal chloroplast containing abundant, well-compartmentalized grana. (b) A slightly altered chloroplast in an NO2-treated plant showing plastoglobuli and dilated thylakoid membranes. (c) Details of an extensively damaged chloroplast from an NO2-treated plant showing disruption to the outer envelope (arrows) and grossly distended thylakoids (between arrows). (d) A disintegrating chloroplast from an NO2-treated plant. Abbreviations: C, cytoplasm; M, mitochondria; P, plastoglobuli; PM, plasma membrane; S, starch grain; T, tonoplast; V, vacuole; CW, cell wall, G, grana stack.
Forests 09 00561 g006
Table 1. The typical values of leaf Chl a concentration, Chl b concentration, Chl a/Chl b ratio, carotenoid concentration and total chlorophyll concentration after different durations of exposure to 6 µL/L NO2 and recovery after 30 days (means ± S.D.).
Chlorophyll a Concentration (mg/g fw)Chlorophyll b Concentration (mg/g fw)Chl a/Chl bCarotenoid Concentration (mg/g fw)Total Chlorophyll Concentration (mg/g fw)
CK17.08 ± 1.17.73 ± 0.62.21 ± 0.21.43 ± 0.324.81 ± 2.1
1 h20.84 ± 5.3 *9.95 ± 0.8 *2.09 ± 0.1 *3.18 ± 0.2 **30.78 ± 3.2 *
6 h11.31 ± 1.34.63 ± 0.22.44 ± 0.31.1 ± 0.0215.94 ± 1.2
24 h11.60 ± 1.25.31 ± 0.52.18 ± 0.21.05 ± 0.116.91 ± 1.2
72 h8.67 ± 0.7 **4.24 ± 0.3 **2.04 ± 0.2 *1.91 ± 0.1 **12.92 ± 1.3 **
Recovery17.59 ± 1.57.97 ± 0.52.27 ± 0.21.47 ± 0.125.56 ± 2.3
Data are means ± S.D. for at least 3 individual measurements of C. putoensis. Values of * p < 0.05 and ** p < 0.01 were considered to indicate statistically significant and highly significant differences among different NO2 treatment durations.
Table 2. The photosynthetic characteristics of C. putoensis leaves after different durations of exposure to 6 µL/L NO2 and recovery after 30 days (means ± S.D.).
AQYPmax (µmol m−2 s−1)Rd (µmol m−2 s−1)LCP (µmol m−2 s−1)LSP (µmol m−2 s−1)
CK0.047 ± 0.00213.38 ± 0.781−2.34 ± 0.771137.2 ± 36.6101685.6 ± 95.525
1 h0.035 ± 0.0016.44 ± 0.217−2.16 ± 0.82364.4 ± 15.609498.4 ± 36.912
6 h0.045 ± 0.00215.26 ± 0.452−1.98 ± 0.521151.2 ± 35.4311957.2 ± 97.654
24 h0.031 ± 0.0033.42 ± 0.145−1.44 ± 0.43347.6 ± 8.868380.8 ± 14.438
72 h0.033 ± 0.0011.02 ± 0.157−0.52 ± 0.21740 ± 10.813403.2 ± 18.652
Recovery0.043 ± 0.00214.87 ± 0.521−2.34 ± 0.683106.4 ± 24.2551043.5 ± 113.931
AQY, apparent quantum yield; Pmax, maximum net photosynthetic rate; Rd, dark respiration rate; LCP, light compensation point; LSP, light saturation point.
Table 3. Typical values of leaf Chl fluorescence in plants exposed to 6 μL/L NO2 for different durations and after 30 days of recovery.
FoFmFv/FmPI
CK428.0 ± 342429.0 ± 1640.824 ± 0.1001.775 ± 0.051
1 h402.5 ± 562330.6 ± 1210.827 ± 0.125 *2.106 ± 0.197 **
6 h542.0 ± 322442.0 ± 1970.778 ± 0.0260.763 ± 0.098
24 h577.7 ± 382190.0 ± 1760.736 ± 0.0680.582 ± 0.045
72 h560.0 ± 202039.0 ± 1620.725 ± 0.057 **0.605 ± 0.031
Recovery400 ± 322180 ± 1970.817 ± 0.0691.667 ± 0.189
The NO2 exposure treatments used 6 μL/L NO2, and recovery was assessed after 30 days in a natural air environment. Fo, minimum fluorescence value; Fv/Fm, PSII maximum quantum yield; PI, performance index. Values are means ± S.D. for C. putoensis. Values of * p < 0.05 and ** p < 0.01 were considered to indicate statistically significant and highly significant differences among the different NO2 treatment times.

