Landscape Diversity for Reduced Risk of Insect Damage: A Case Study of Spruce Bud Scale in Latvia


1
Latvian State Forest Research Institute “Silava”, Rīgas str. 111, LV–2169 Salaspils, Latvia
2
Faculty of Biology, University of Latvia, Jelgavas str. 1, LV–1004 Rīga, Latvia
*
Author to whom correspondence should be addressed.
Forests 2018, 9(9), 545; https://doi.org/10.3390/f9090545
Submission received: 6 August 2018
/
Revised: 24 August 2018
/
Accepted: 4 September 2018
/
Published: 5 September 2018
(This article belongs to the Special Issue Adaptive Forest Management and Decision Making Models under Climate Change (Risk and Uncertainty))
Abstract
:Spruce bud scale (Physokermes piceae (Schrnk.)) has gained attention due to recent outbreaks in the eastern Baltic Sea region—Poland, Lithuania, and Latvia. In the spring of 2010, it spread rapidly across Latvia, affecting large areas of Norway spruce stands. Therefore, the aim of our study was to assess the effects of landscape heterogeneity on the damage caused by spruce bud scale in Norway spruce stands. In this study, we evaluated landscape metrics for middle-aged (40 to 70 years old) Norway spruce-dominated stands (>70% of stand’s basal area) in four of the most affected forest massifs and two unaffected forest massifs. We used a binary logistic generalized linear mixed effects model (GLMMs) to assess the effect of environmental factors on the abundance of the spruce bud scale. Our results show that increased local diversity within 100 m of a forest patch apparently reduced the probability of spruce bud scale presence. We also found that the diversity within 1000 m of a patch was associated with an increased probability of spruce bud scale damage. A quantitative analysis of landscape metrics in our study indicated that greater landscape-scale diversity of stands may reduce insect damages.
1. Introduction
Norway spruce (Picea abies (L.) Karst.) is highly susceptible to both abiotic and biotic disturbances such as windthrow, drought and outbreaks of pests due to tree architecture [1,2,3]. Norway spruce in the hemiboreal and boreal forests could potentially lead to difficulties with growth and particularly regeneration under most scenarios of predicted climate changes [2,4,5]. Consecutive drought events in combination with high temperatures in Norway spruce stands across Europe (from Scandinavia to Western Europe) can affect tree water relations and hence resistance to pests [2,3,6]. In recent decades, the intensity and spatial extent of pest outbreaks in forests throughout the Northern Hemisphere have already increased due to climate change impacts [7].
Previous studies in the hemi-boreal and boreal zones have focused primarily on the damage to Norway spruce caused by spruce bark beetles [8,9], whereas little is known about other insect pests, e.g., bud scale [10,11]. The effects of bud scale have mostly been limited. However, scale insects are known as one of the most successful invaders of new environments [12], and the historical distribution of this species has been rather limited to the north (e.g., a range limit of 48–50° N latitude, [13]). Severe damage to Norway spruce stands by scale insects has previously been reported from Lithuania [14] and eastern Poland [15].
Spruce bud scale (abbreviated as SBS) was quite rare in the hemiboreal zone and the propagation and infestation of this pest has caused problems in this climate zone, primarily in urban areas, e.g., parks and gardens [16,17] until an outbreak occurred in 2010 [11,18]. However, beginning in the spring of 2010, the dispersal of Physokermes piceae (Schrnk.) across Latvia [19,20], Lithuania [21,22], and southern Sweden [23] as well as an unspecified Physokermes sp. in Germany and Poland [10] and Physokermes inopinatus in Sweden [11,18] has resulted in a rapid spread across the hemiboreal zone. Furthermore, considering predicted climate changes, this northward shift of scale insects could potentially accelerate and lead to even more frequent and severe damages, such as major outbreaks [24].
The distribution of pests is influenced by landscape heterogeneity [25]. The spread of pests may be enhanced or retarded by heterogeneity across multiple spatial scales [26,27]. Moreover, pest distribution is affected by individual responses to variation in spatial extent within their environment [28]. This is often reflected in forest structure patterns at the local and landscape scales [29]. Therefore, understanding the patterns of a species’ movement at different spatial scales may clarify the drivers of species diversity [30].
The relationship between landscape structure and species distribution is determined by a number of factors, including landscape characteristics, habitat diversity (e.g., configuration and composition), and predator-prey interactions [4,31]. These are major factors that may influence the ability of a species to disperse as well as to survive, reproduce successfully, or establish a population [31]. These factors can be studied in terms of forests stands and their characteristics, such as landscape metrics [32,33].
Landscape structure plays an important role in the risk of forest damage from insects and disease [26,34]. The effect of environmental complexity (spatial heterogeneity) affects both the spread of disturbances over the landscape [26] and resilience at the landscape scale [35]. Various reports have indicated that with insect pests, more serious problems arise in areas with a homogeneous landscape spatial pattern e.g., from silvicultural practices, especially forest even-aged monocultures and pure coniferous stands, especially in areas with unsuitable site conditions [36,37]. Candau and Fleming [38], describing large–scale patterns in defoliation frequency, found that the most important forest characteristics (e.g., stands age, basal area) were reflected in species composition.
The integration of landscape ecology into resource management by quantifying it in terms of landscape metrics has not been easy [24]. Although, the effects of landscape diversity on insect outbreaks in Norway spruce stands have previously been studied extensively in the temperate and boreal climate zones, there is a lack of studies of spatial diversity in the prevailing conditions of the hemiboreal zone [2]. Therefore, the aim of this study was to examine the influence of forest landscape diversity on SBS infested Norway spruce stands following the 2010 outbreak in the hemiboreal forests of Latvia. We hypothesize that insect pest damages will be lower in patches with higher forest structural diversity.
2. Materials and Methods
2.1. Study Area
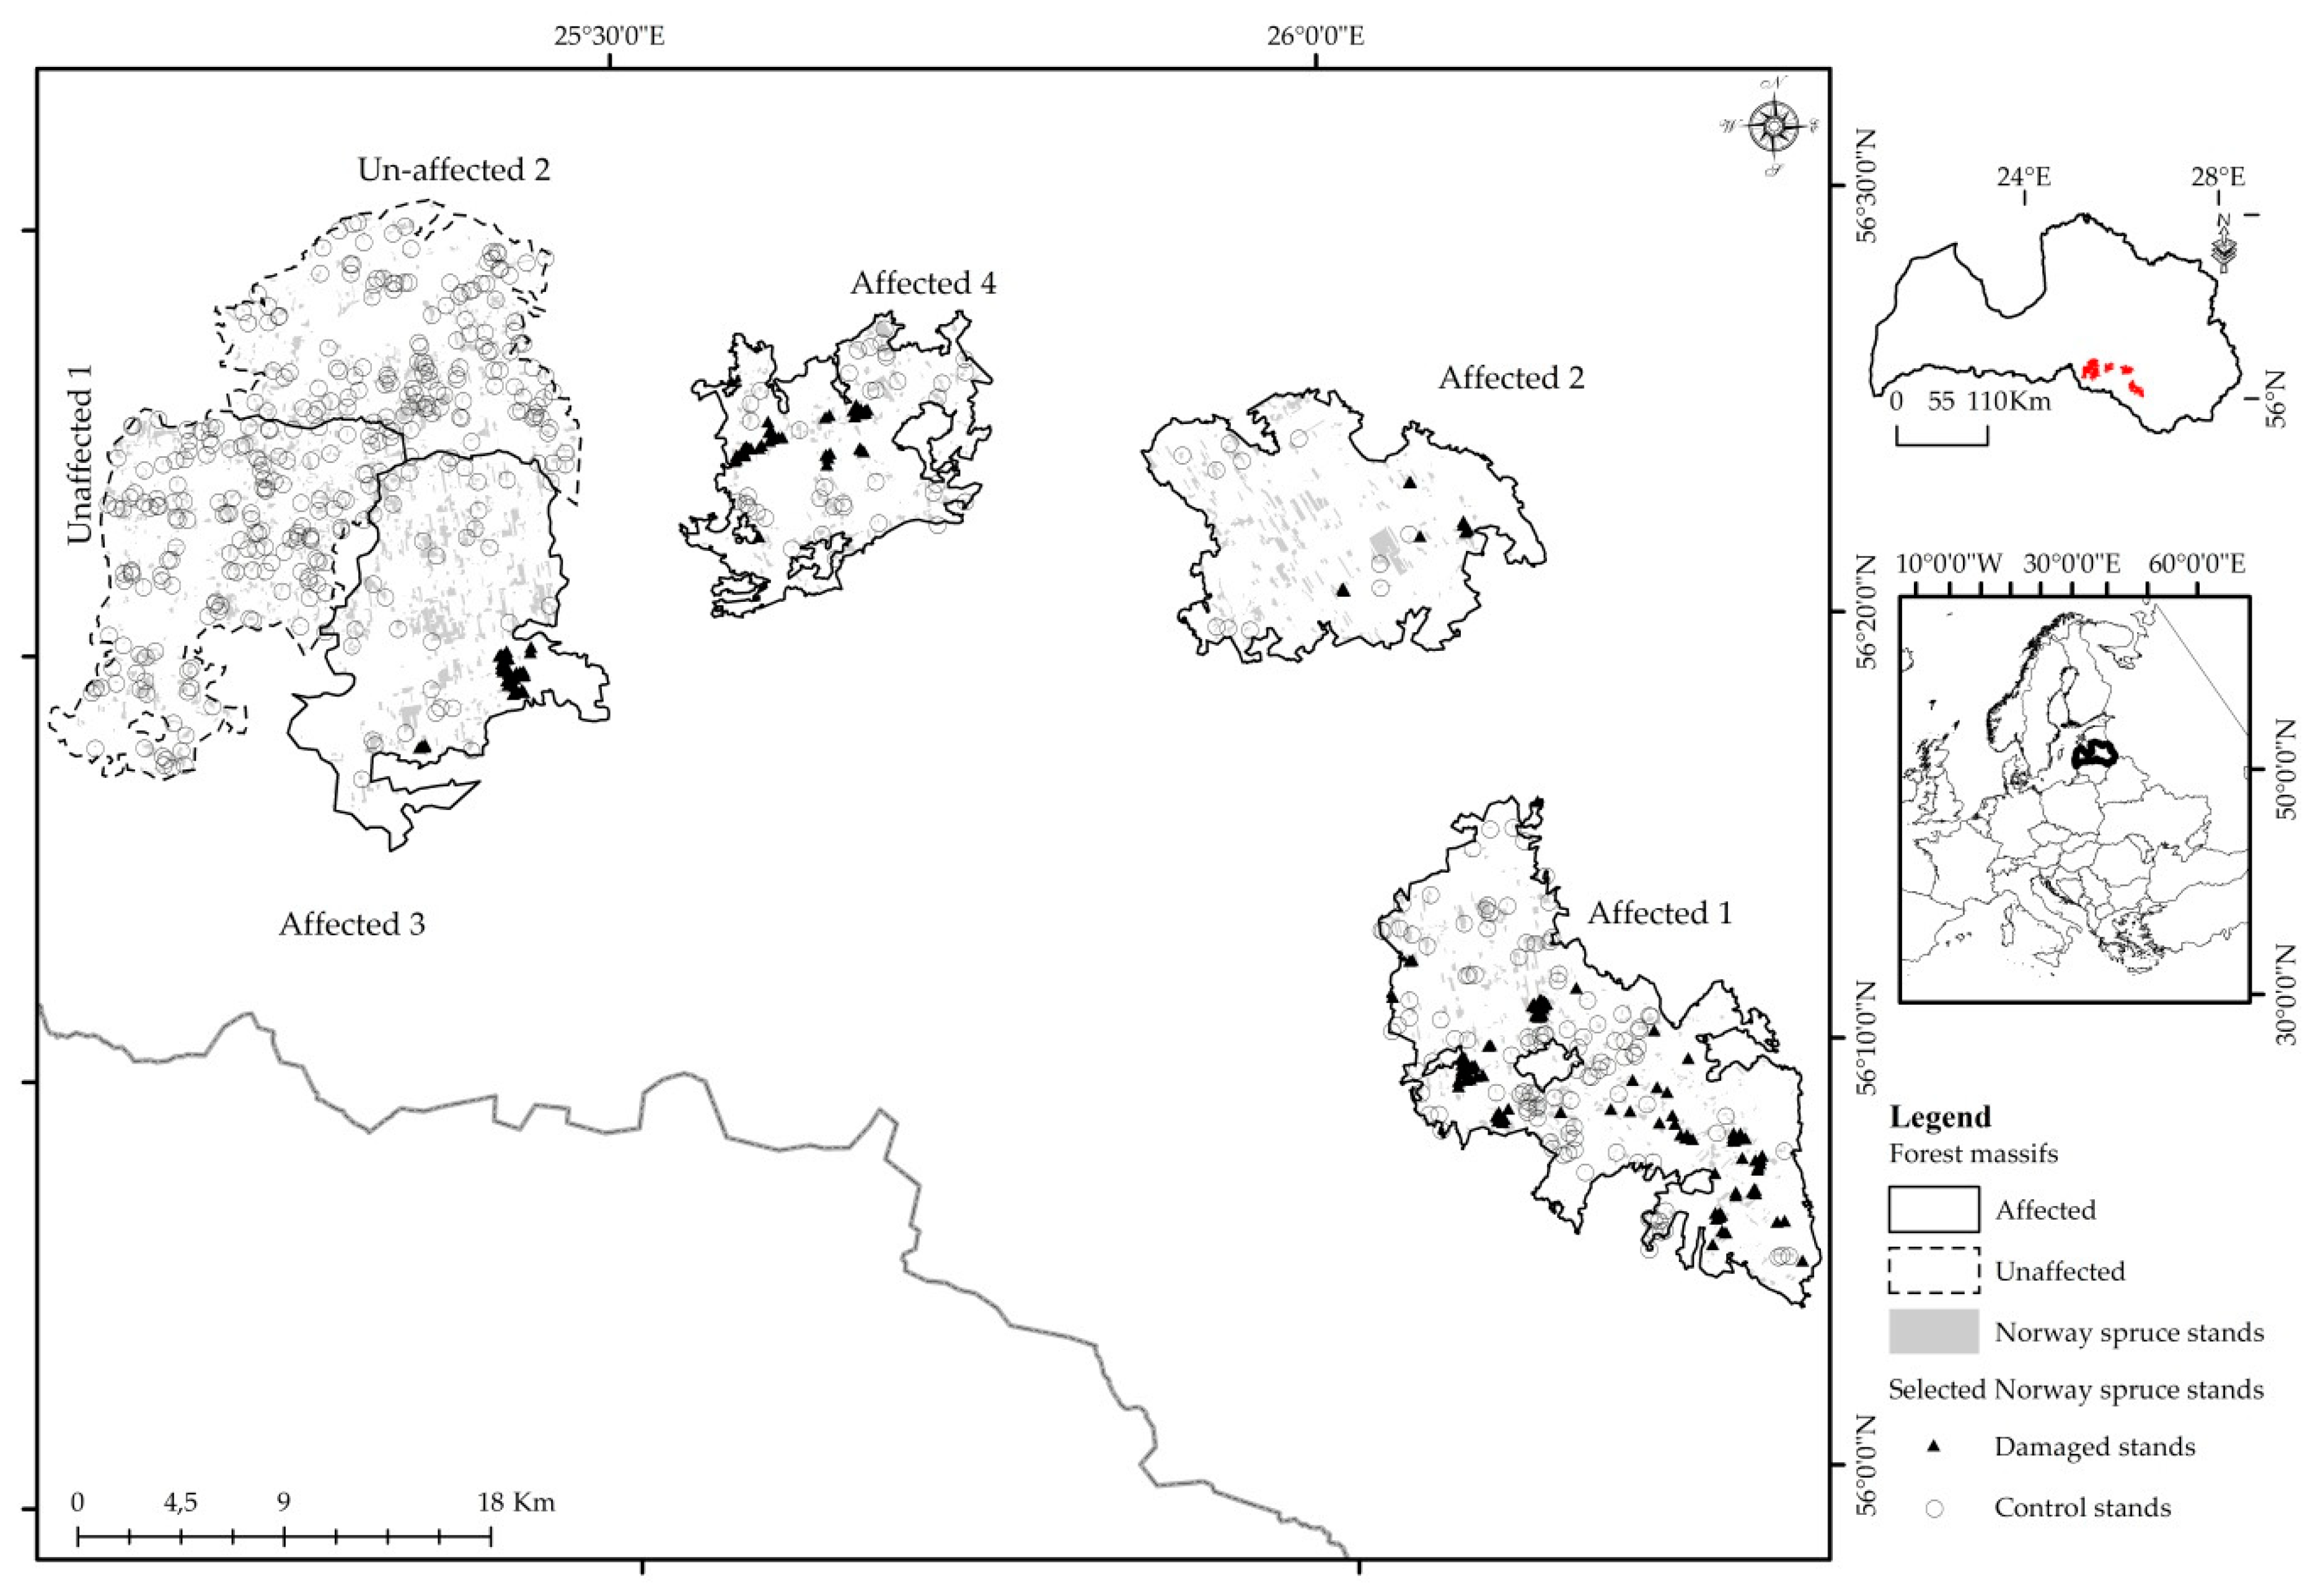
The study was conducted in forest massifs that were disturbed by spruce bud scale (Physokermes piceae (Schrnk.)) infestation in 2010. The study area is located in Latvia between 56°4′ N and 56°28′ N and 25°19′ E and 26°41′ E in the hemiboreal forest zone (Figure 1). The landscape in this region was shaped by traditional agriculture (farmland, abandoned farmland), forests, meadows, peatlands, lakes, rivers and localities that led to a complex mosaic with almost 40% forested area. Forest trees comprise pure evergreen (Scots pine (Pinus sylvestris), Norway spruce (Picea abies L. Karst.)) and deciduous (birch (Betula spp.), aspen (Populus tremula L.), black alder (Alnus glutinosa)) stands, as well as mixed stands. Norway spruce represents 13.1% of forest cover.
The climate is moist with moderate winters. The mean annual precipitation is 713 mm (min 533 mm to max 854 mm), and the annual mean temperature is 5.9 °C, with monthly mean temperatures in May and June over a 30-year period of 11.74 °C and 15.3 °C, respectively. The active vegetation period (daily mean air temperature > 5 °C) normally lasts for 192 to 200 days [39]. The topography in the study area is relatively flat with an elevation of 160 m above sea level. Stagnic luvisols, gleyic luvisols, hapalic podzols and eutirc gleysols are the prevailing (86.5%) soil types [40].
2.2. Data Source
Study sites were located within six forest massifs, including four affected by the 2010 SBS outbreak (Affected 1–Affected 4) and two control forest massifs (Unaffected 1 and Unaffected 2) where no damages were registered (Figure 1). To provide a systematic and uniform approach, the largest forest massif was split into smaller sub-massifs (similar by size), Affected 3, Unaffected 1 and Unaffected 2, according to natural borders such as highways, rivers or bogse, based on information that spruce bud scale migrates over short distances (from tree to tree, by contact of tree crowns, and in some cases by wind [41]).
We obtained spatial data (polygon shapefile) from the Latvia State Forest Service on the stands felled in sanitary clear-cuts due to the outbreak of SBS in 2010. Additionally, for each polygon within the studied forest massifs, we obtained the available digitized inventory data up to 2010. Next, forest stands were grouped into 16 forest land cover/use categories based on forest inventory data of 2010 (Table 1).
Additionally, to deal with edge effect, we generated a buffer with a distance of 1000 m (as a greatest buffer size around patches) outside of the forest massifs to avoid bias that may affect results, as we were missing data on the land cover/use categories outside of the forest massifs. The generated buffer area was added to the vector layer of forest stands with the given land cover/use category defined as “non-forest area”.
The damaged stands within the affected forest massifs were subsampled using three main criteria. We selected only those stands where Norway spruce was more than 70% of basal area, the stand age ranged between 40 and 70 years, and a sanitary clear-cut was performed. We analyzed 194 damaged pure Norway spruce stands that met the selection criteria with a total area of 460.3 ha. The area of individual stands ranged from 0.09 to 13.5 ha. To eliminate sampling biases, we used the Sampling Design Tool for ArcGIS 10 to create a subset of undamaged Norway spruce stands (called “control stands”) within the affected and unaffected forest massifs that were similar in composition and structure to the damaged stands [42,43]. A minimum distance of 500 m was set between damaged stands and control stands to avoid biased results due to possibly incomplete observation of insect damages in 2010. In total, 194 control stands within affected and 300 control stands within unaffected forest massifs, were randomly selected.
2.3. Data Processing
Landscape metrics were calculated according to the categories described below using the Patch Analyst extension in ArcGIS 10.2 [44]. The landscape metrics were selected based on previous research and their presumed ecological significance because of high multicollinearity with each other [45,46]. In this study, we selected 12 landscape metrics for class-level analysis: Class percentage of landscape—PLAND (%); mean patch size—MPS (ha); core area—CA (ha); core area index—CAI (percentage of the patch more than 20 m from patch edge); mean shape index—MSI (when MSI = 1, the shape of the patch is compact, such as a perfect circle or square); mean perimeter area ratio—MPAR; mean patch edge—MPE (m); edge density—ED (m ha−1); patch density—PD (number of patches per 100 ha); mean fractal dimensions—FRAC MN; interspersion and juxtaposition index—IJI; and mean contiguity index—CONTIG (for a detailed description, see [30]).
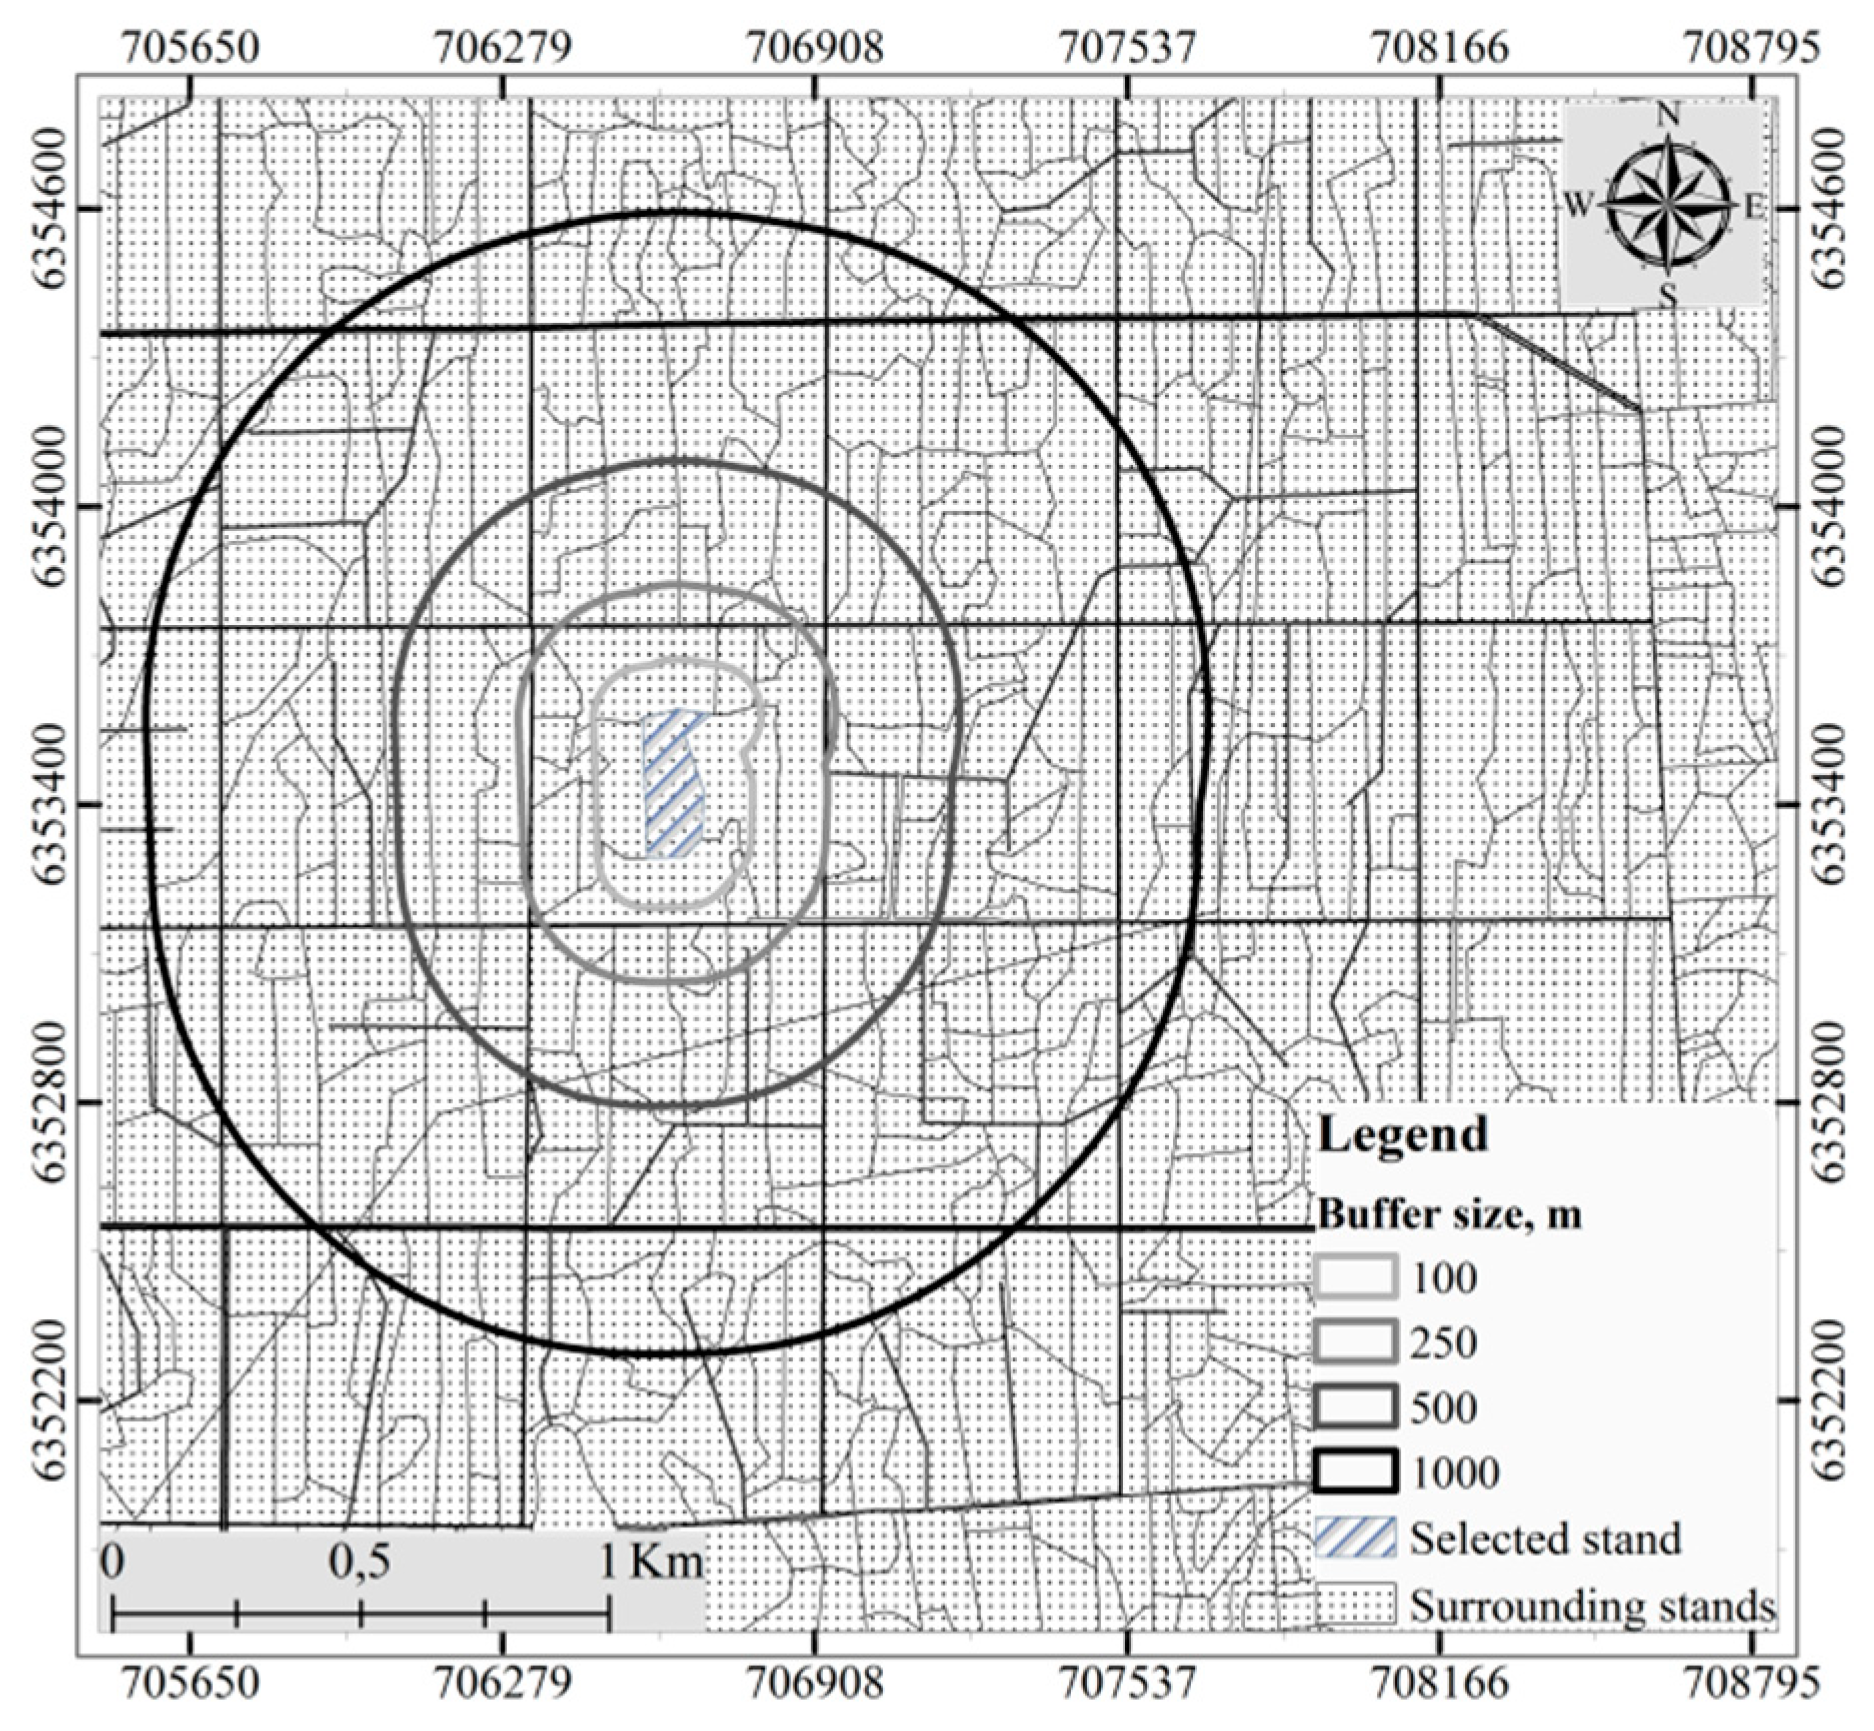
To assess the effect of local diversity, initially we tested the effect of abundance of each of land cover/use group. Furthermore, the Shannon diversity index (H) was calculated for each of the damaged stands and control stands (polygons) based on the proportion of land cover/use categories within the outer buffer areas of 100, 250, 500 and 1000 m (Figure 2). To highlight landscape heterogeneity, the land cover/use categories were split by forest type, where applicable. The calculation was performed in two steps. First, to calculate the proportions of the land cover/use category areas, the intersection between the forest stands (class data) and the buffer zones (zone data) was performed using the “Tabulate intersection” geoprocessing tool in ArcGIS 10.2.1 (Figure 2). Second, to quantify H for each polygon of the damaged stands and control stands, we used the “diversity” function in the “vegan” library in R [47]. H is defined by , where p_i is the proportion of the land cover/use category area of the patch within the area of the patch buffer, S is the count of land cover/use categories and b is the base of the logarithm.
2.4. Statistical Analyses
Spatial autocorrelation was tested to assess whether damaged stands or control stands in affected forest massifs had come from a hypothetical random distribution based on both feature locations and attribute values using the Global Moran’s I statistic [48]. Spatial statistical analyses were performed using the Spatial Statistics toolbox in ArcGIS 10.2 [43].
The homogeneity of variances among the mean values of landscape metrics for the selected Norway spruce stands (we combined both damaged and control stands in affected forest massifs) between the affected and unaffected forest massifs were analyzed using Kruskal-Wallis test with χ2 approximation, and the level of significance was p < 0.05. Data were first checked for normal distribution using the Shapiro-Wilk test.
The differences in the relative abundance of land cover/use categories within a forest massif were investigated using the χ2 test. We tested only the most abundant land cover/use categories within a forest massif, such as soft broadleaves mixed woodlands, pure Scots pine stands, pure soft broadleaves stands, pure Norway spruce stands (Non-target stands), and pure Norway spruce stands (including a subset of the selected Norway spruce stands). A comparison of the spatial patterns around patches of damaged stands and control stands (including adjacent patches) created by different land cover/use categories was computed using the χ2 test. We also investigated the difference between damaged stands and control stands with respect to the length (m) of the shared border with neighboring stands, including Norway spruce, in their composition using the χ2 test.
We used a Bayesian binary logistic generalized linear mixed effects model (GLMM) as implemented in the software R 3.5.0 [49] library brms [50] to assess the effect of landscape metrics on the probability of SBS presence in the stand. The generalized linear mixed-effects model was built based on data on the damaged stands and control stands in affected forest massifs. Forest massif was used as a random effect to account for possible correlation of stands coming from the same massif and to deal with pseudo-replication. To account for spatial dependence between observations, spatial conditional autoregressive correlation structure was added to the model. The number of iterations was set to 12,000 for each of four chains; the thinning rate was set to 8. Convergence of the model was assessed by Rhat values (all values between 1.00 and 1.04). Before constructing the GLMM, multicollinearity amongst all predictor variables was checked based on variance inflation factors (VIF) and by analyzing paired correlations (only factors with VIF < 3 were included in the model). From all landscape metrics, only five variables were included in the model: H 100, H 1000, MSI, MPAR and core area. The predictor variables were scaled to avoid failure of model convergence.
3. Results
3.1. SBS Distribution in Forest Areas
The spatial patterns of distribution of the land cover/use categories differed significantly (χ2 test, p < 0.001) among forest massifs (Table 2). The patches of damaged stands in Affected forest massifs exhibited clustered distributions in the Affected 1, Affected 2 and Affected 4 forest massifs, while in the Affected 3 forest massif, the distribution of damaged stands was considered random. We found that in all forest massifs, the control stands exhibited a clustered pattern. The IJI indicated that the patch interspersion of selected Norway spruce stands distributed quite similarly among available patch categories in both affected (combining both damaged stands and control stands) and unaffected forest massifs (70.9% and 68.17%, respectively).
The area of damaged stands varied among forest massifs. The greatest presence of the SBS damaged stands (112 stands with total class area (PLAND) of 234.0 ha, or 1.36% of the total forest massif area) was reported in the forest massif Affected 1. The lowest presence of the SBS-affected stands (13 stands with total class area of 21.5 ha or 0.18%) was reported within the Affected 2 forest massif. The class area of selected control stands in affected forest massifs varied similarly from 0.16% to 1.04% (67.8 ha to 181.5 ha) of the total forest massif area (Table 2).
3.2. Habitat Characterisation with Landscape Metrics at Class Level
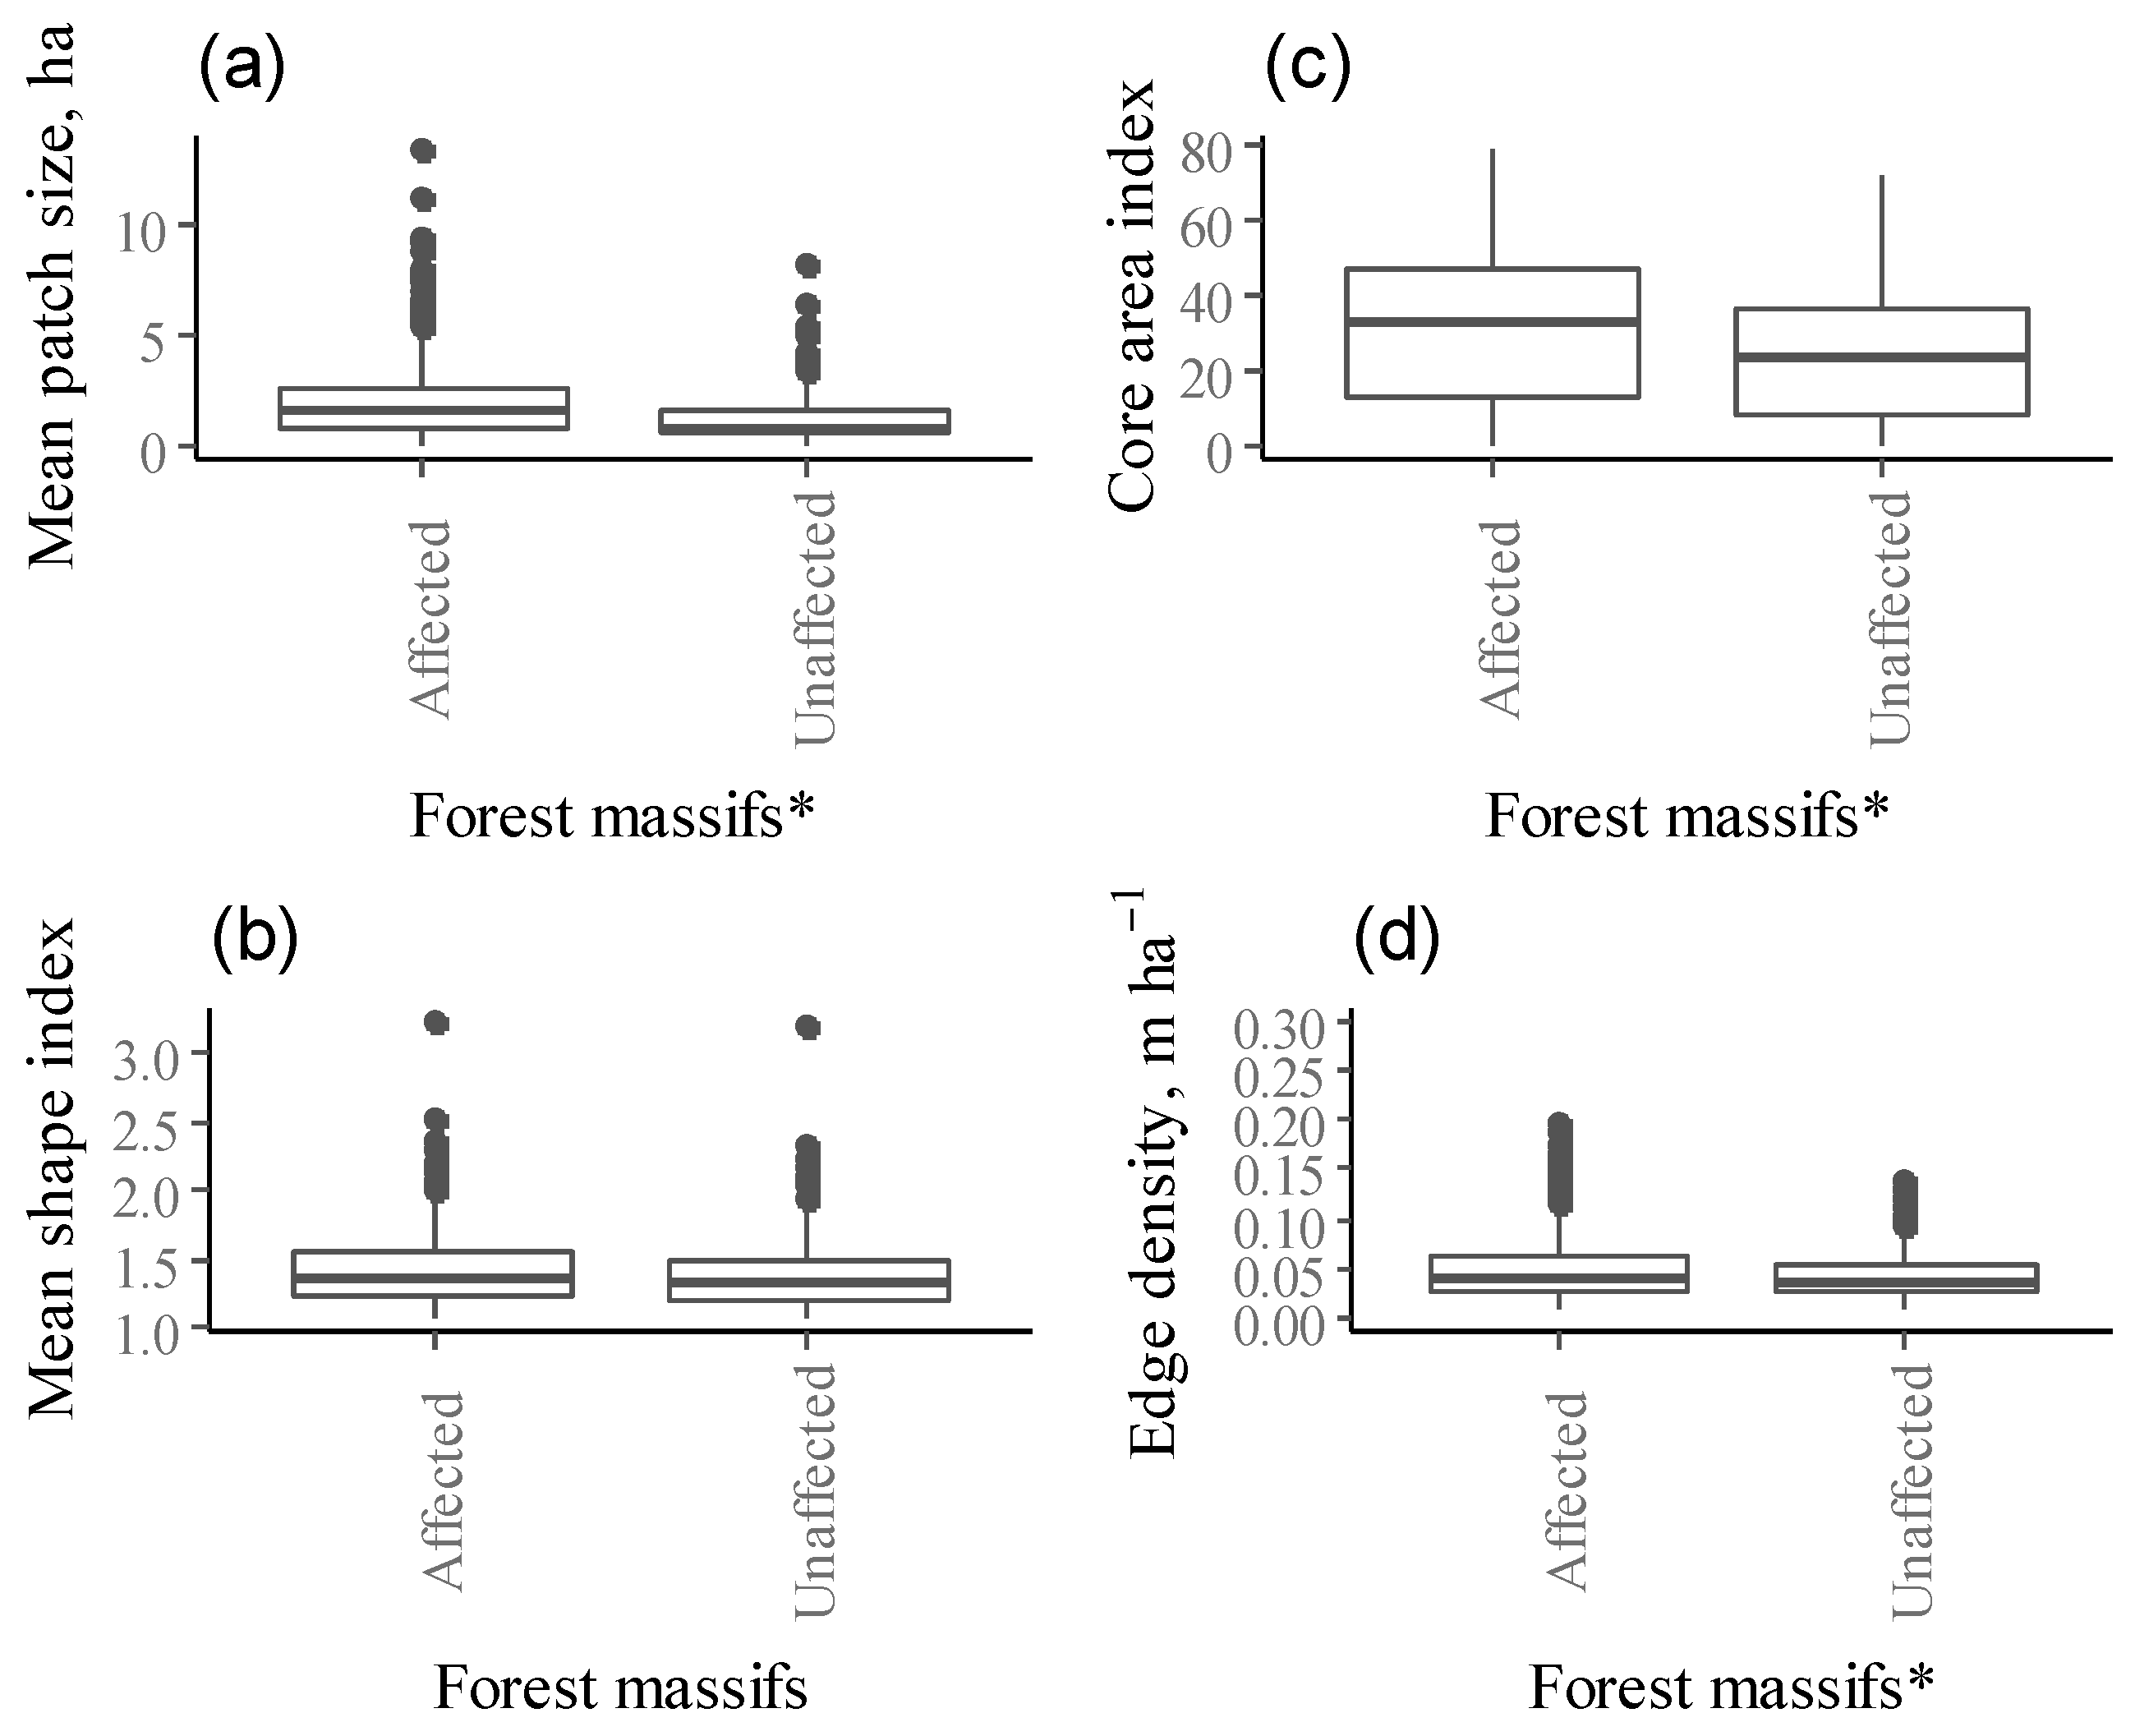
Landscape metrics of the selected Norway spruce stands varied among affected and unaffected forest massifs (Kruskal Wallis test, p < 0.05). Patch size (MPS) differed significantly among forest massifs (χ2 = 36.766, df = 1, p-value < 0.001, Figure 3a). Affected forests have larger patches of selected Norway spruce stands (combining both damaged and control stands) compared to unaffected forest massifs, with average patch sizes of 2.19 ± 0.19 (confidence interval (CI)) and 1.32 ± 0.13 ha, respectively. Patch mean core area also differed among forest massifs (χ2 = 33.674, df = 1, p-value < 0.001). The core area (CA) of selected Norway spruce stands within unaffected forest massif was smaller and more edge-influenced than within affected forest massifs (0.47 ± 0.8 ha and 0.98 ± 0.13 ha, respectively). The percentage of the patch that is comprised of core area (CAI) was greater for affected forest massifs (30.7%) than for unaffected forest massifs (23.8%, p < 0.001, Figure 3b). Patch shape (MSI) was relatively simple and did not differ significantly between affected and unaffected forest massifs for selected Norway spruce stands (1.43 for affected and 1.40 for unaffected forest massifs, respectively (Figure 3c).
Patches with significantly higher-edge density were found in affected forest massifs compared to unaffected forest massifs (χ2 = 32.808, df = 1, p-value < 0.001), whereas the mean length of all edge segments relative to the landscape area (ED) for patches of selected Norway spruce stands did not differ among affected and unaffected forest massifs (Figure 3d).
Significantly smaller contiguous patches of selected Norway spruce stands were found in unaffected forest massifs than in affected forest massifs (χ2 = 33.674, df = 1, p-value < 0.001, 0.81 ± 0.01 and 0.84 ± 0.01, respectively).
3.3. Spatial Heterogeneity of Pest-Damaged Stands
We found no differences (p > 0.05) between damaged and control stands in the length of the shared border with neighboring stands with compositions including Norway spruce. Within forest massifs, the surroundings of damaged stands and control stands (apart in affected and unaffected forest massifs) were significantly different (χ2 = 2785.9, p < 0.001, Figure 4). The damaged stands were embedded in a landscape dominated by birch (41% of total area of surrounding stands), Norway spruce (33%) and Scots pine (16%) stands. In contrast, the neighboring area around control stands in affected forest massiffs was composed of Norway spruce (39%), birch (29%) and Scots pine (11%) dominated stands; additionally, almost 12% of the cover of surrounding stands was formed by black alder and aspen stands. We found that in the unaffected forest massifs, the areas surrounding the selected Norway spruce stands were dominated by Norway spruce (31%), birch (26%), Scots pine (24%) and black alder stands (9%); see Figure 4.
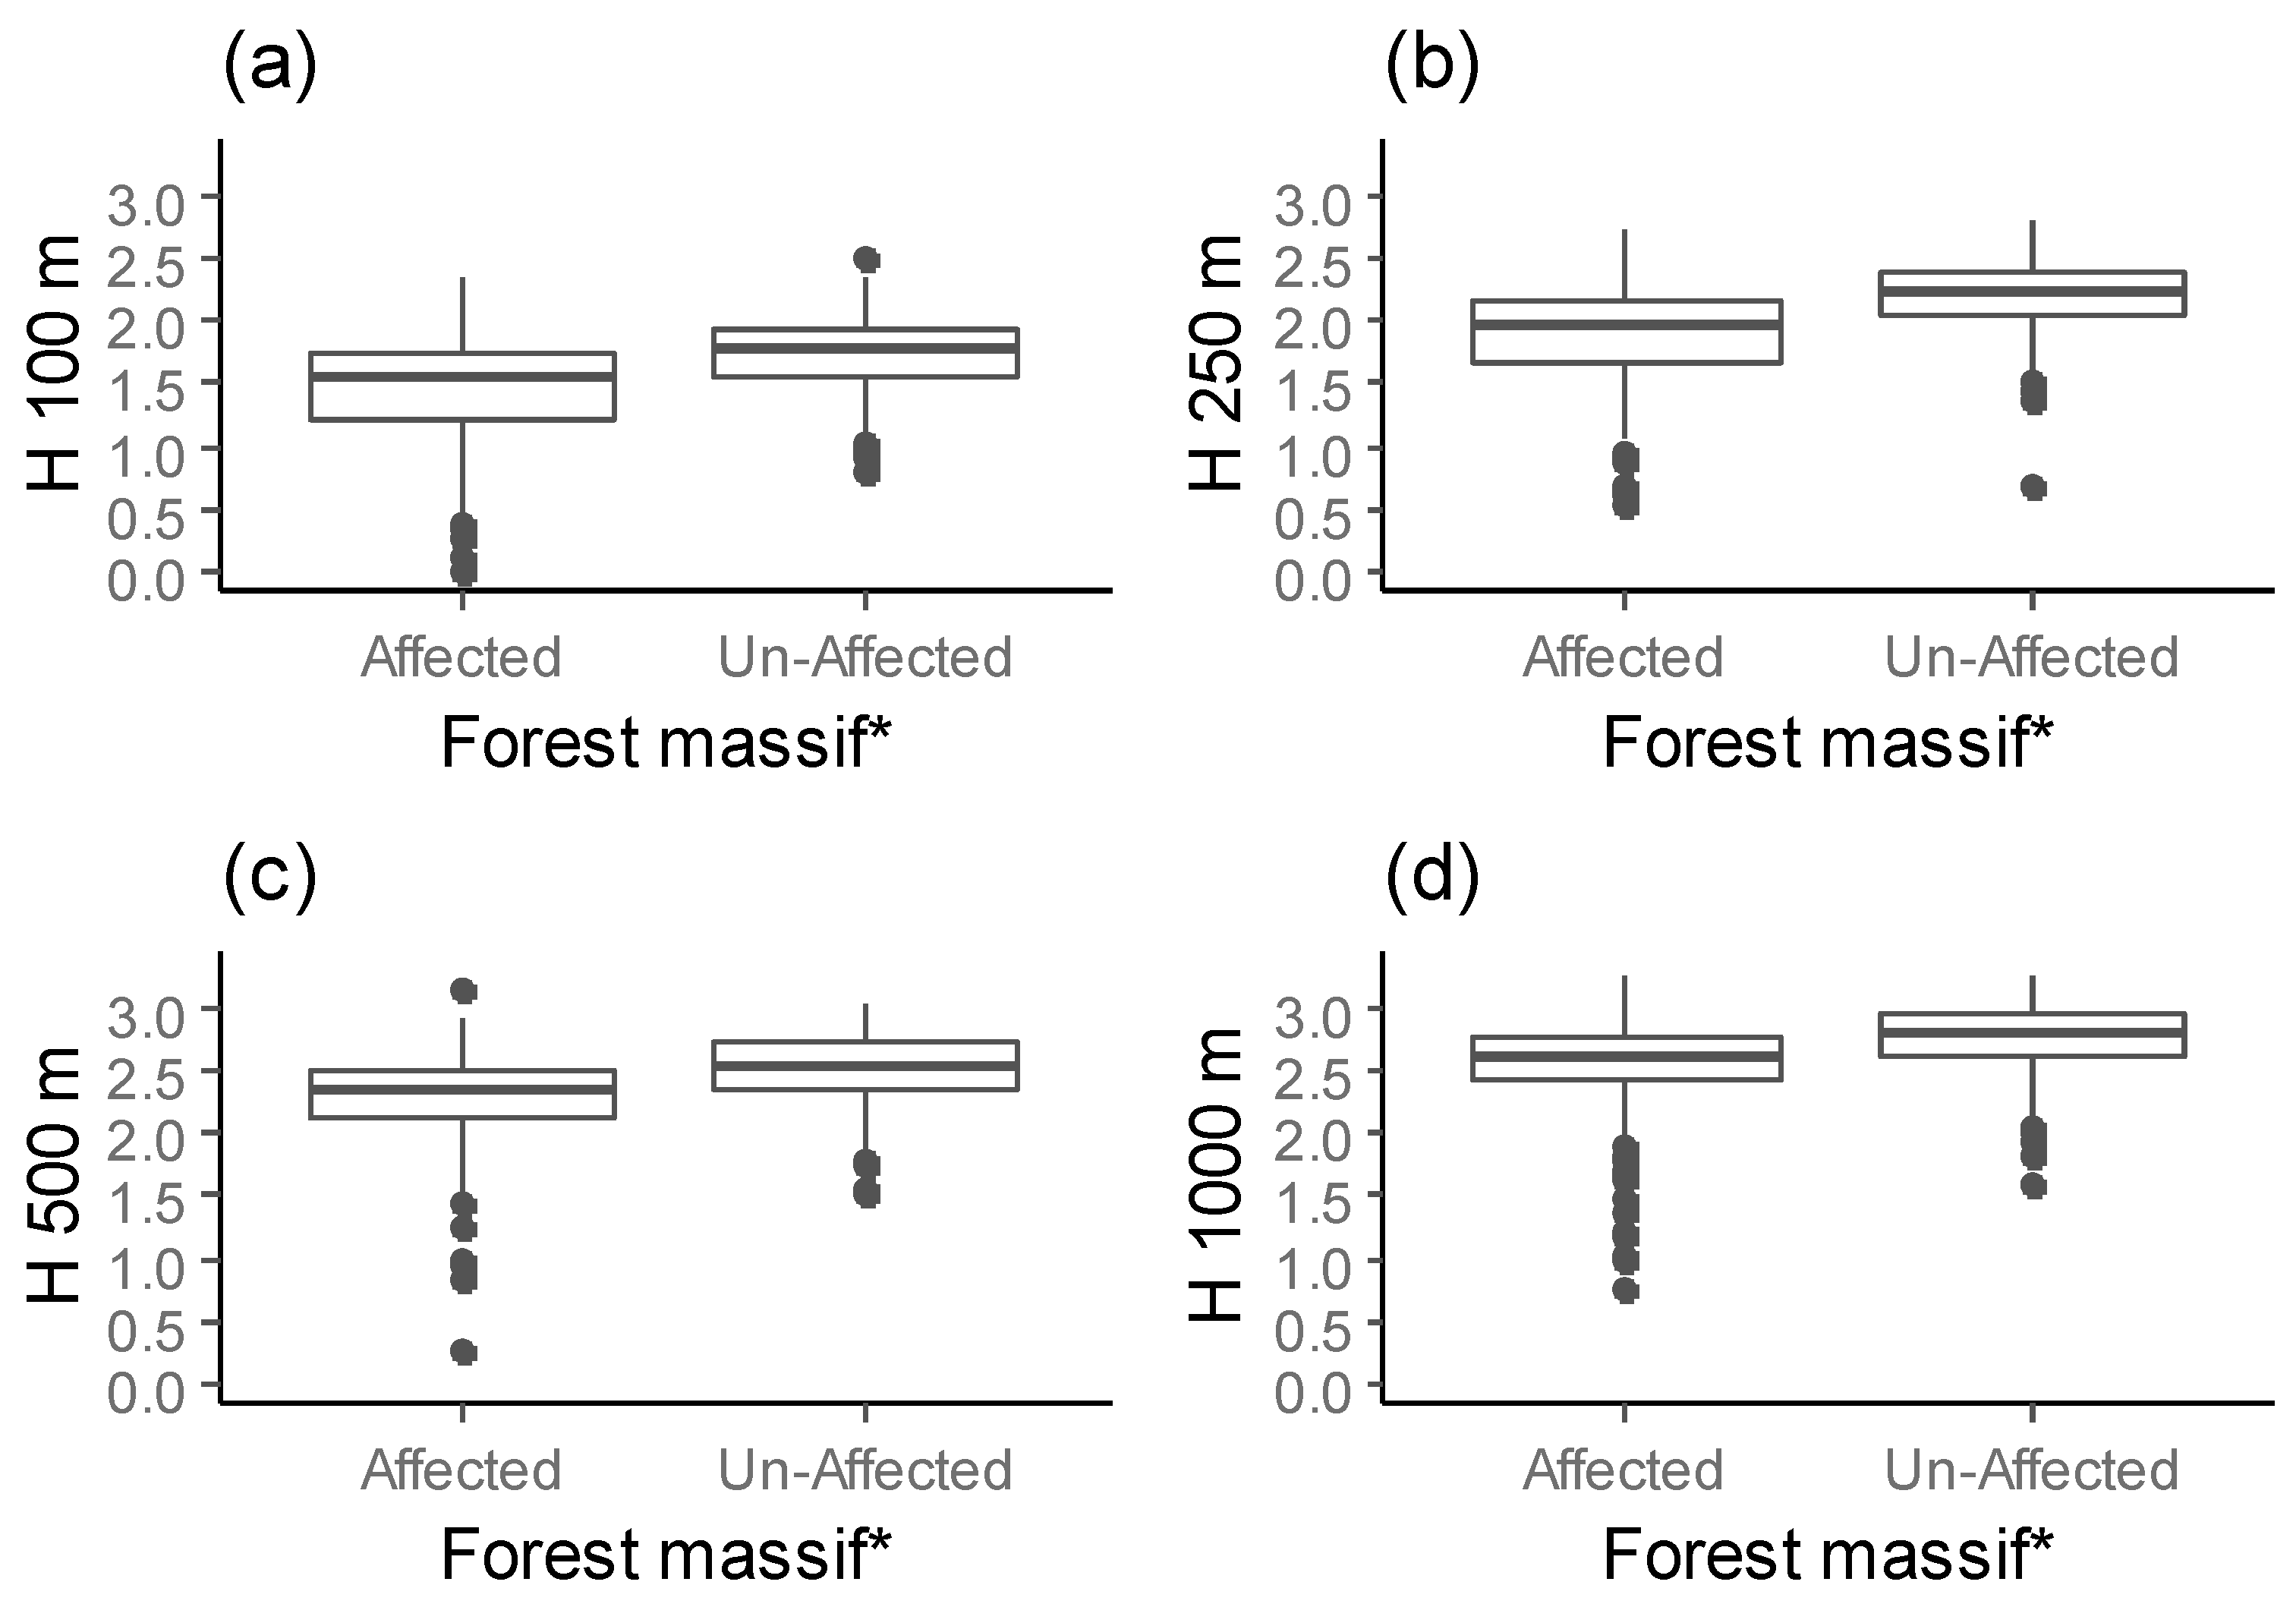
Measures of the landscape heterogeneity surrounding the selected Norway spruce stands varied among forest massifs and were not consistent across different buffer radii (Figure 5). At the 100 m scale, the forest diversity (H 100) around selected Norway spruce stands in affected forest massifs was lower than in unaffected forest massifs (χ2 = 88.228, df = 1, p-value < 0.001).
Similar, we found lower spatial diversity within 250 m of selected Norway spruce stands (H 250) in affected forest massifs than in unaffected forest massifs (χ2 = 108.03, df = 1, p-value < 0.001). At the 500 m scale (H 500), however, the forest diversity around selected stands in affected forest massifs was higher than in unaffected forest massifs (χ2 = 92.937, df = 1, p-value < 0.001). At the 1000 m buffer radius (H 1000), the surrounding environment was more diverse in unaffected forest massifs than in affected forest massifs (χ2 = 56.705, df = 1, p-value < 0.001).
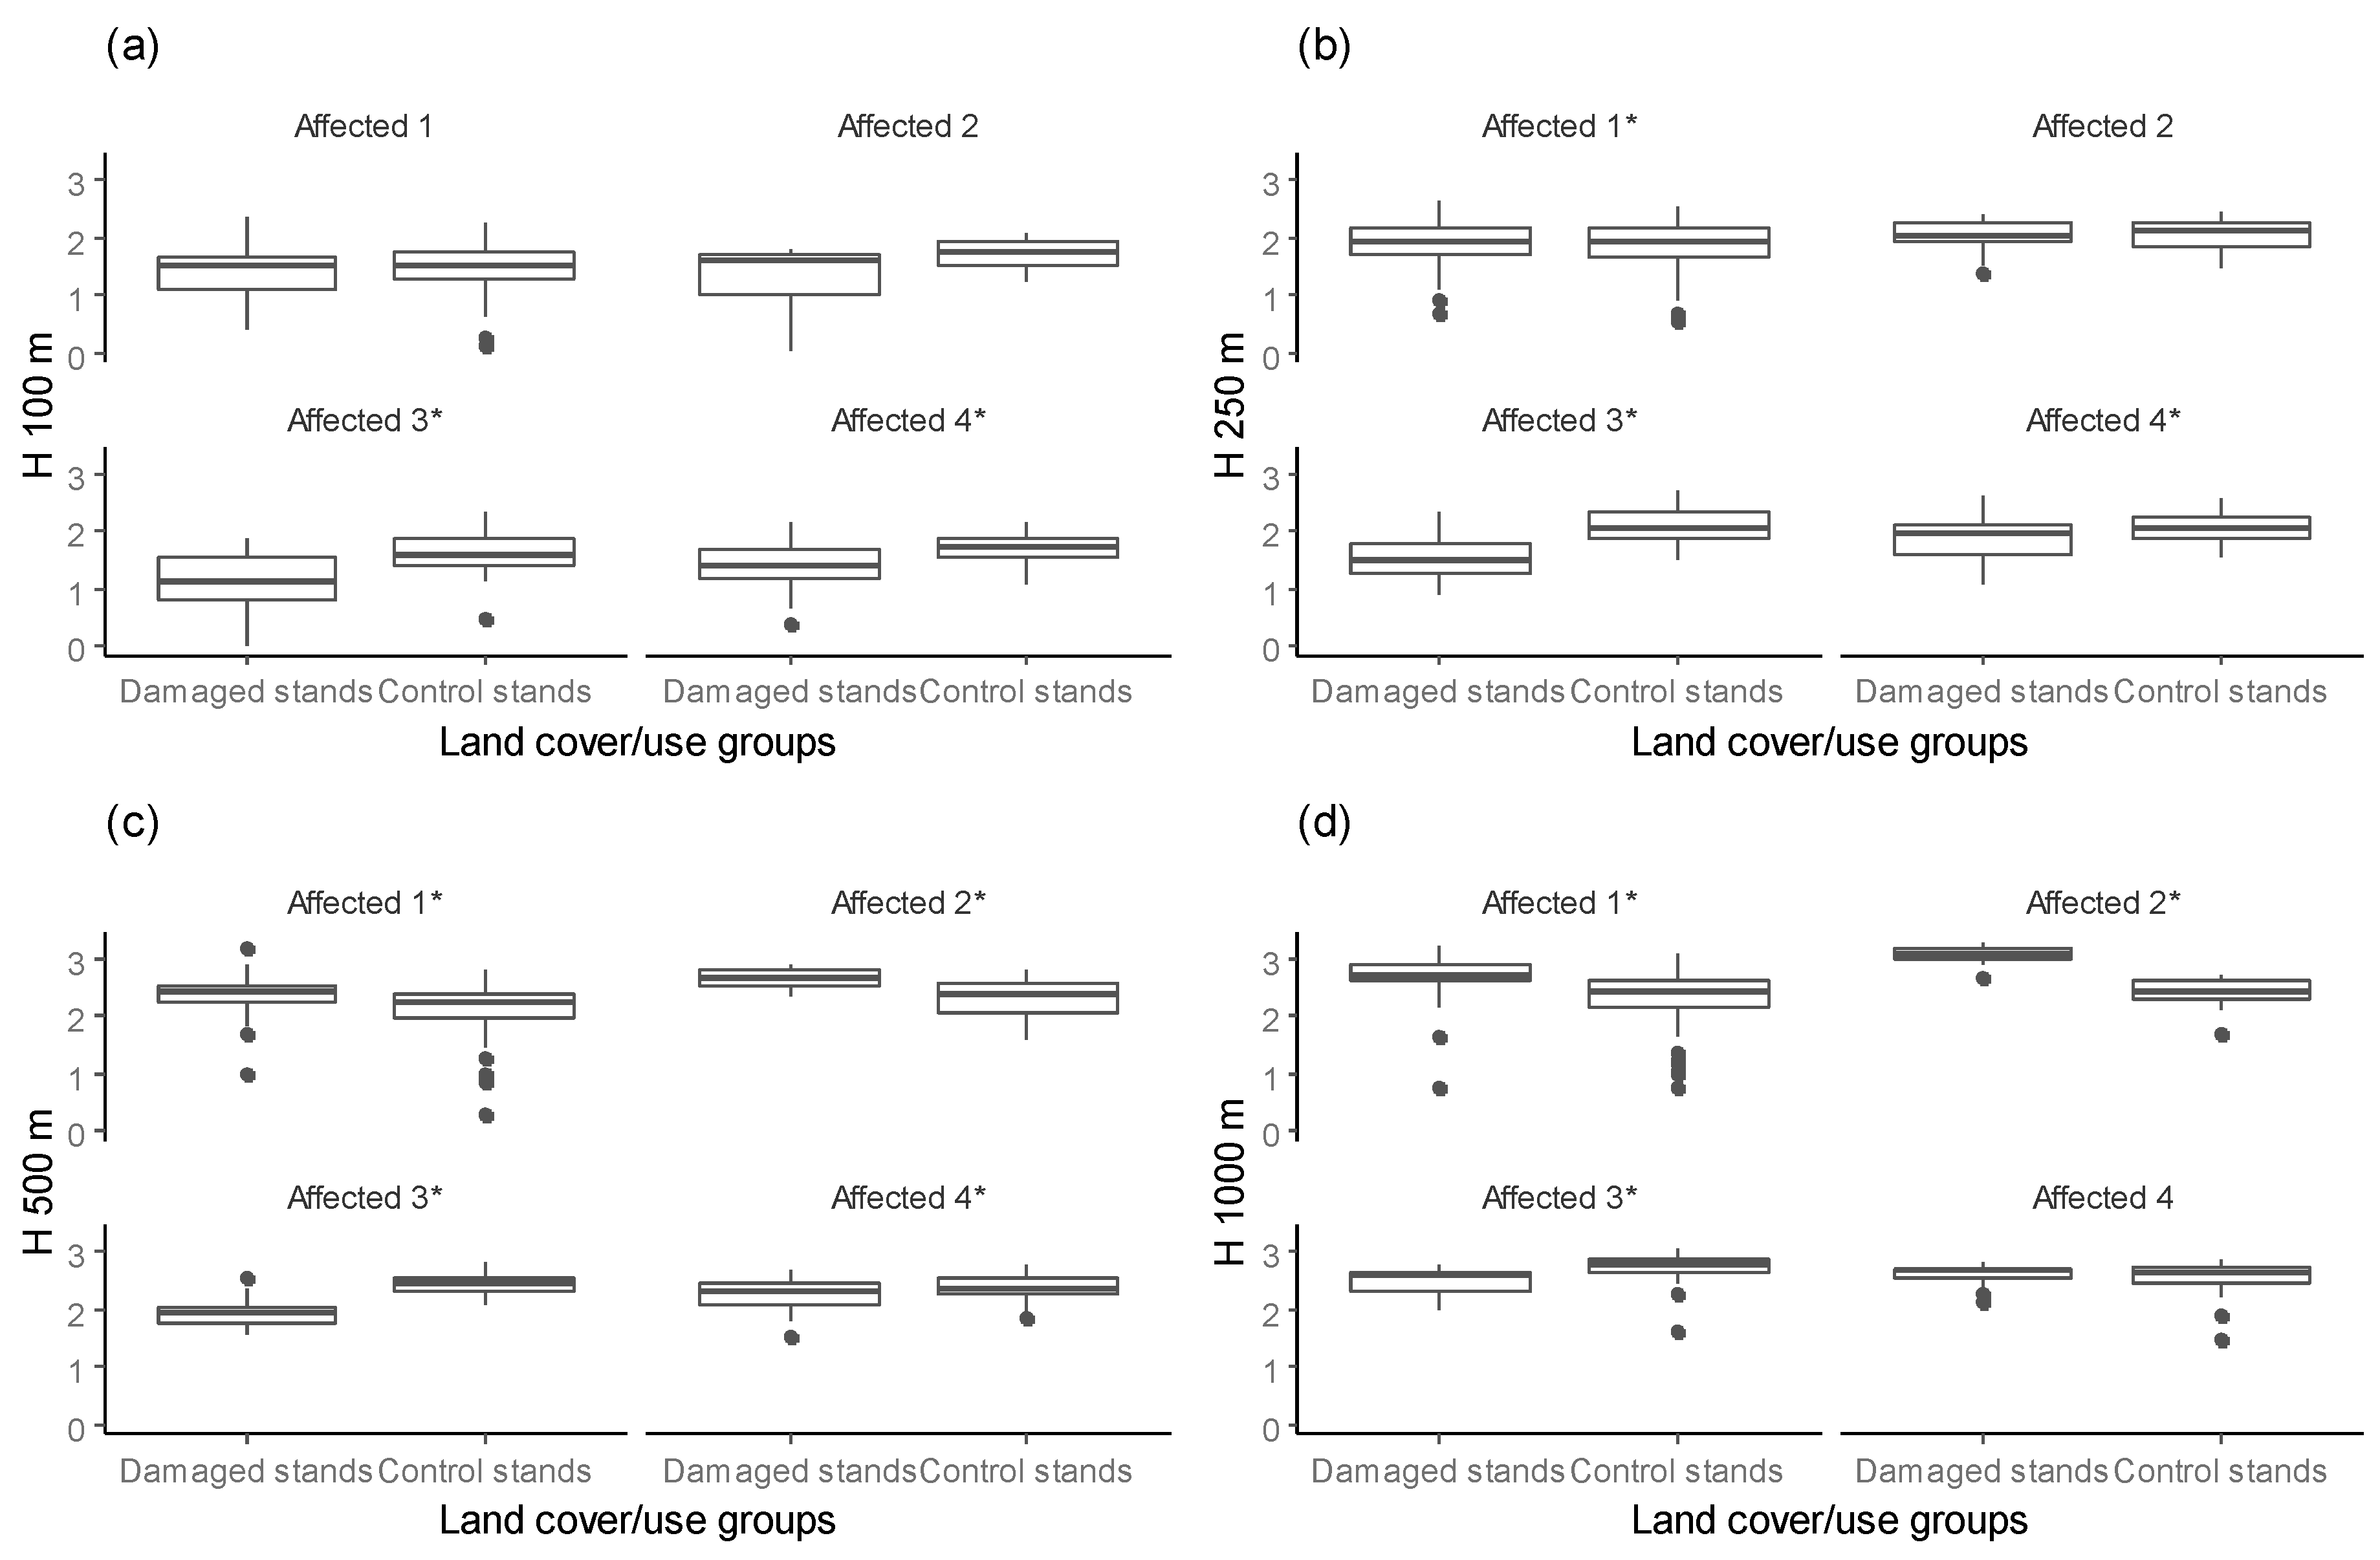
Our results highlight the influence of spatial scale on SBS damages within affected forest massifs. We found that the difference in surrounding forest diversity between damaged stands and control stands in affected forest massifs varied with buffer distance. For buffer radii up to 250 m in the affected forest massifs, the forest diversity was higher surrounding control stands than damaged stands. In contrast, for a 500 m or greater buffer size in affected forest massifs, higher forest diversity of surroundings was found for damaged stands than for control stands (Figure 6). However, a high correlation (r = 0.60, p < 0.001) with similar distances was estimated, i.e., H 100 vs. H 250 and H 500 vs. H 1000.
3.4. Habitat Modelling of Spatial Distribution of Predicted Spruce Stand Damage by Spruce Bud Scale
The binary logistic GLMM analysis indicated that there was no significant effect of mean patch size (MPS) (estimate −0.03, Credibility interval −2.83 to 2.50), MSI (estimate −0.57, CI −2.80 to 1.64) or core area (estimate 2.53, CI −0.24 to 6.19) on the probability of SBS presence (Table 3). The diversity around patches within 1000 m (H 1000) (estimate 5.82, CI 2.15 to 10.32) was associated with an increased probability of SBS presence. In contrast, we found that increased local diversity around patches within 100 m (H 100) (estimate −4.24, CI −7.86 to −1.72) reduced the probability of SBS presence. Model results showed that variation (standard deviation) for random effect was 5.80 (CI 0.19 to 18.65) and estimate for car (correlation structure) was 0.98 (CI 0.95 to 1.00).
4. Discussion
The relationships between landscape characteristics and pest distribution could be associated with factors such as habitat diversity, patch size and shape, edge effect, and the connectivity and diversity of stands across the landscape [51,52]. The 2010 outbreak of SBS was evaluated through the interrelated analysis of landscape metrics for patches of selected Norway spruce stands among affected and unaffected forest massifs. The dispersal and movement of SBS indicated the influence of landscape characteristics. The abundance of different insect populations and their movement between habitat patches are affected by patch size and isolation. For example, a population could exist at a higher density in larger-sized patches than in small patches [53]. In our study, the patch size of the selected Norway spruce stands was more relevant in the affected forest massifs (Figure 3a). In contrast, a previous study in Lithuania found no effect of forest stand area on SBS invasion [54].
Previous studies that have investigated the effects of landscape heterogeneity on forest insects have focused on three related aspects of landscape structure: abundance of host species, edge effects and fragmentation [45]. Although, the probability of insect dispersal will increase with favorable conditions and a high abundance of host species [55], we found high clustering between selected Norway spruce stands in affected forest massifs, implying that SBS tends to colonize such/similar habitat islands in the forest massif. The study of Physokermes inopinatos [17] in Sweden suggests that in spring 2010, bud scales were able to spread to surrounding spruce stands from those areas that were already affected in 2009. This is supported by findings in other studies that SBS spreads to surrounding stands in 1 to 2 years [56]. Moreover, the SBS migrates mainly short distances via contact of the infested tree’s crown with its neighbors [20,41]. Consequently, SBS is generally concentrated in core areas, and subsequent damages originate from these areas [17]. Our findings support this fact, suggesting that core areas of selected Norway spruce stands were greatest in the affected forest massifs. In contrast, an insufficient interior area of Norway spruce forest in un-affected forest massifs indicates that a smaller interior forest area may limit the dispersal of SBS populations.
Insect movement rates can vary markedly based on forest configuration features such as patch edges compared to interiors, due to altered environmental conditions [57]. The SBS reproduce and grow in sunny and dry places [56]. The results suggest that significantly shorter edge lengths for selected Norway spruce stands were more relevant within unaffected forest massifs. Although, caution should be exercised, as forest edge may also be a suitable habitat for predator species; additionally, species richness at patch edges could increase as these areas contain properties of both adjacent patches [55]. In some cases, the edge effects may vary in relation to the nature of the edge. For example, a coniferous surrounded by other coniferous stands contrast to a much-lower extent with its adjacent land covers than a similar coniferous patch surrounded by hardwood species [58]; this also enhanced the dispersal abilities of SBS among patches.
Each component in a landscape could be associated to a certain ecological function. It may also reflect the behavior of species in relation to spatial heterogeneity. For example, irregular patch shape corresponds to higher edge effects [59]. Therefore, the relationship between patch shape complexity and edges can significantly affect the population dynamics of insects [57]. In the study, polygon shapes were simplified, and mean shape index of polygons was relatively low in both landscapes (Figure 3c). This may be explained by extensive forest management and land use intensification, leading to relative simplification of the shapes of patches [60].
The forest composition at different spatial scales (such as local neighborhood and/or a regional scale) may serve as a key factor in the movement of insect populations [34,59,61]. The movement of species across a landscape is associated with a certain connectivity value [53] and can be described by an index of patch boundary configurations and thus patch shape [62]. In the study, affected and unaffected forest landscapes showed the same level of patch adjacencies (IJI). Specifically, within both affected and unaffected forest massifs, patches of selected Norway spruce stands were well adjacent to each other and distributed approximately 70% of the possible equitable distribution within forest massifs. The IJI quantifies the level of patch isolation by focusing solely on the edges and is maximum when each category represented in a landscape shares a common border with each of the others [63].
The capacity of SBS to disperse apparently was not affected by the neighboring stands if Norway spruce was found in the neighboring stands’ composition. This suggests that—apart from “habitat islands”—the observed aggregation of patches of selected Norway spruce stands within both affected and unaffected forest massifs was also related to other factors (see Figure 3). Bergeron et al. [64], in studies of spruce budworm, found that coniferous stands embedded in a matrix dominated by deciduous stands were less vulnerable than large expanses of coniferous forest. Findings of the authors indicate a significant difference in the spatial patterns of the surroundings of damaged and control stands. However, the impact of deciduous tree cover on the probability of the presence of SBS insects in this study still remains unclear due to a high proportion of deciduous tree cover that was present in the surroundings of both damaged and control stands. Moreover, the high proportion of pure Scots pine stands in unaffected forest massifs indicates a predation interaction effect on community dynamics, as it is widely acknowledged that Scots pine is a host tree for Anthribus nebulosus, a predator of spruce bud scale. Research in Serbia suggests that the predatory species Anthribus nebulosus reduced the population of scales by 68%–80% [16]. In Germany, the corresponding reduction of the population of spruce bud scales was 38%–59% [65], and in Lithuania, Anthribus nebulosus was considered to have high efficacy at reducing this pest [54]. The spatial scale of the heterogeneity of forest stands in large fragments might be another factor explaining the presence of a species-area relationship [66]. A complex landscape pattern in combination with effective forest management may reduce insect outbreaks in the future [28]. Consequently, changes in forest structure elements, such as smaller patches, higher edge densities, and decrease in interior area, leading to a more complex patch structure caused by forest management, may lead to a decreased risk of pest presence [30,32]. Thus, in forested landscapes, the role of mixed forest composition or configuration is related to ecological processes affecting the occurrence and spread of insect outbreaks [45]. We found that the Shannon diversity index of the land cover surrounding damaged and control stands in affected forest massifs varied among different habitat scales. This indicates that the SBS infections might be related to effects of a significant scale and high spatial variability. We determined that with an increased buffer size, the H diversity around damaged stands became more diverse than around control stands. This indicates that spreading of this pest could potentially be related to diversity at larger spatial scales, not only to local habitat diversity. The same appears to apply to other relatively mobile invertebrates [67]. Moreover, the model suggests that the probability of the presence of SBS decreases with greater local diversity surrounding a stand, while a higher probability of the presence of SBS is related to increased diversity within 1000 m (H 1000) and a larger patch size.
5. Conclusions
This study indicates that higher forest structural diversity has an impact on spruce bud scale presence at different spatial scales that can be characterized by landscape metrics. In addition, the predicted probability of the presence of spruce bud scale increases with certain landscape characteristics. Two apparently contradictory patterns in the effect of landscape diversity on presence of spruce bud scale were determined. Higher spatial heterogeneity at the local scale correlates to lower probability of spruce bud scale presence and greater resistance to damage by this pest species. This suggests that increased local diversity around patches results in decreased presence of spruce bud scale. However, more complex spatial structure will not guarantee effective pest regulation, especially since the pest’s presence in Norway spruce stands may be positively associated with higher diversity at a broader scale (i.e., within a buffer of 1000 m around the patch). These investigations could help identify effective pest-control mechanisms for forest management. Hence, this may facilitate the planning process for forest owners in order to reduce the risk of pest outbreaks in the future. However, there is still incomplete understanding of the different interactions between landscape metrics and the presence of these new pests in hemiboreal forests. Thus, more detailed studies are needed to specify the interrelations between abiotic and biotic factors and dispersal at local and regional scales in forested landscapes.
Author Contributions
Conceptualization, Ā.J. and E.B.; Methodology, E.B., R.M. and D.E.; E.B. and I.D. data collection. E.B., D.E. analyzed the data, E.B. wrote the paper, R.M advice and review of the data and edit the paper.
Funding
Study was carried in the framework of the project “Support for the implementation of post-doctoral research, agreement Nr.1.1.1.2/16/I/001” funded by the European Regional Development Fund contract Nr. 1.1.1.2/VIAA/1/16/120. Also study was supported by ERA-NET Sumforest project “Mixed species forest management. Lowering risk, increasing resilience” (REFORM).
Acknowledgments
We are most grateful to Laura Kenina for comments and suggestions to improve quality of the manuscript.
Conflicts of Interest
The authors declare no conflict of interest.
References
- Schelhaas, M.J.; Nabuurs, G.J.; Schuck, A. Natural disturbances in the European forests in the 19th and 20th centuries. Glob. Chang. Biol. 2003, 9, 1620–1633. [Google Scholar] [CrossRef]
- Seidl, R.; Rammer, W.; Jager, D.; Lexer, M.J. Impact of bark beetle (Ips typographus L.) disturbance on timber production and carbon sequestration in different management strategies under climate change. For. Ecol. Manag. 2008, 256, 209–220. [Google Scholar] [CrossRef]
- Netherer, S.; Matthews, B.; Katzensteiner, K.; Blackwell, E.; Henschke, P.; Hietz, P.; Pennerstorfer, J.; Rosner, S.; Kikuta, S.; Schume, H.; et al. Do water-limiting conditions predispose Norway spruce to bark beetle attack? New Phytol. 2015, 205, 1128–1141. [Google Scholar] [CrossRef] [PubMed]
- Mäkinen, H.; Nöjd, P.; Mielikäinen, K. Climatic signal in annual growth variation in damaged and healthy stands of Norway spruce [Picea abies (L.) Karst.] in Southern Finland. Trees 2001, 15, 177–185. [Google Scholar] [CrossRef]
- Linnakoski, R.; de Beer, Z.W.; Niemelä, P.; Wingfield, M.J. Associations of Conifer-Infesting Bark Beetles and Fungi in Fennoscandia. Insects 2012, 3, 200–227. [Google Scholar] [CrossRef] [PubMed]
- Wermelinger, B. Ecology and management of the spruce bark beetle, Ips typographus—A review of recent research. For. Ecol. Manag. 2004, 202, 67–82. [Google Scholar] [CrossRef]
- Lindner, M.; Fitzgerald, J.B.; Zimmermann, N.E.; Reyer, C.; Delzon, S.; van der Maaten, E.; Hanewinkel, M. Climate change and European forests: What do we know, what are the uncertainties, and what are the implications for forest management? J. Environ. Manag. 2014, 146, 69–83. [Google Scholar] [CrossRef] [PubMed]
- Eriksson, M.; Pouttu, A.; Roininen, H. The influence of windthrow area and timber characteristics on colonization of wind-felled spruces by Ips typographus (L.). For. Ecol. Manag. 2005, 216, 105–116. [Google Scholar] [CrossRef]
- Långström, B.; Lindelöw, Å.; Schroeder, M.; Björklund, N.; Öhrn, P. The spruce bark beetle outbreak in Sweden following the January-storms in 2005 and 2007. In Proceedings of the IUFRO Forest Insect and Disease Survey in Central Europe, Štrbské Pleso, Slovakia, 15–19 September 2008; pp. 13–19. [Google Scholar]
- Gertsson, C.A. A zoogeographical analysis of the scale insect (Hemiptera, Coccoidea) fauna of Fennoscandia and Denmark. Nor. J. Entomol. 2013, 60, 81–89. [Google Scholar]
- Gertsson, C.A.; Isacsson, G. The Hungarian spruce Scale, Physokermes inopinatus Danzig & Kozar (Hemiptera: Coccoidea: Coccidae) in Sweden. Acta Zool. Bulg. 2014, 66, 83–86. [Google Scholar]
- Pellizzari, G.; Dalla Montá, L. 1945–1995: Fifty years of incidental insect pest introductions to Italy. Acta Phytopathol. Entomol. Hung. 1997, 32, 171–183. [Google Scholar]
- Kozár, F. Geographical segregation of scale—Insects (Homoptera: Coccoidea) on fruit trees and the role of host plant ranges. Acta Zool. Acad. Sci. Hung. 1995, 41, 315–325. [Google Scholar]
- Malumphy, C.; Ostrauskas, H.; Pye, D. A provisional Catalogue of scale insects (Hemiptera, Coccoidea) of Lithuania. Acta Zool. Litu. 2008, 18, 108–121. [Google Scholar] [CrossRef]
- Łagowska, B. Scale insects (Homoptera, Coccinea) of Roztocze and the Lublin Upland. Bull. Entomol. Pol. 1986, 56, 475–478. [Google Scholar]
- Graora, D.; Spasić, R.; Mihajlović, L. Bionomy of spruce bud scale, Physokermes piceae (Schrank.) (Hemiptera: Coccidae) in the Belgrade area, Serbia. Arch. Biol. Sci. 2012, 64, 337–343. [Google Scholar] [CrossRef]
- Olsson, P.O.; Jönsson, A.M.; Eklundh, L. A new invasive insect in Sweden—Physokermes inopinatus: Tracing forest damage with satellite based remote sensing. For. Ecol. Manag. 2012, 285, 29–37. [Google Scholar] [CrossRef]
- Winde, I.; Anderbrant, O.; Jönsson, A.M. Tree recovery during the aftermath of an outbreak episode of the Hungarian spruce scale in southern Sweden. Scand. J. For. Res. 2018, 33, 313–319. [Google Scholar] [CrossRef]
- Lazdiņš, A.; Miezite, O.; Bārdule, A. Characterizations of severe damages of spruce (Picea abies Karst.) stands in relation to soil properties. In Proceedings of the Research for Rural Development 2011. Annual 17th International Scientific Conference, Jelgava, LLU, Latvia, May 2011; pp. 22–28. Available online: http://llufb.llu.lv/conference/Research-for-Rural-Development/2011/LatviaResearchRuralDevel17th_volume2.pdf (accessed on 4 September 2018).
- Miezite, O.; Okmanis, M.; Indriksons, A.; Ruba, J.; Polmanis, K.; Freimane, L. Assessment of sanitary condition in stands of Norway spruce (Picea abies Karst.) damaged by spruce bud scale (Physokermes piceae Schrnk.). iForest 2013, 6, 73–78. [Google Scholar] [CrossRef]
- Gedminas, A.; Lynikienë, J.; Marčiulynas, A.; Povilaitienë, A. Effect of Physokermes piceae Schrank. on Shoot and Needle Growth in Norway Spruce stands in Lithuania. Balt. For. 2015, 21, 162–169. [Google Scholar]
- Menkis, A.; Marčiulynas, A.; Gedminas, A.; Lynikienė, J.; Povilaitienė, A. High-Throughput Sequencing Reveals Drastic Changes in Fungal Communities in the Phyllosphere of Norway Spruce (Picea abies) Following Invasion of the spruce Bud Scale (Physokermes piceae). Microb. Ecol. 2015, 70, 904–911. [Google Scholar] [CrossRef] [PubMed]
- Gertsson, C.A.; Isacsson, G. Spruce-bud Scales (Hemiptera, Coccoidea, genus Physokermes) in south Sweden. Entomol. Tidskr. 2012, 133, 121–128, (In Swedish, English summary). [Google Scholar]
- Santini, A.; Ghelardini, L.; De Pace, C.; Desprez-Loustau, M.L.; Capretti, P.; Chandelier, A.; Cech, T.; Chira, D.; Diamandis, S.; Gaitniekis, T.; et al. Biogeographical patterns and determinants of invasion by forest pathogens in Europe. New Phytol. 2013, 197, 238–250. [Google Scholar] [CrossRef] [PubMed]
- Gustafson, E.J. Quantifying landscape spatial pattern: What is the state of the art? Ecosystems 1998, 1, 143–156. [Google Scholar] [CrossRef]
- Turner, M.G.; Gardner, R.H.; O’Neill, R.V. Landscape disturbance dynamics. In Landscape Ecology in Theory and Practice; Springer: New York, NY, USA, 2001; pp. 157–199. ISBN 978-0-387-21694-2. [Google Scholar]
- Kuuluvainen, T. Natural variability of forests as a reference for restoring and managing biological diversity in boreal Fennoscandia. Silva Fenn. 2002, 36, 97–125. [Google Scholar] [CrossRef]
- Turner, M.G.; O’Neill, R.V.; Gardner, R.H.; Milne, B.T. Effects of changing spatial scale on the analysis of landscape pattern. Landsc. Ecol. 1989, 3, 153–162. [Google Scholar] [CrossRef]
- Peterson, C.J.; Pickett, S.T. Patch type influences on regeneration in a western Pennsylvania, USA, catastrophic windthrow. Oikos 2000, 90, 489–500. [Google Scholar] [CrossRef]
- Hunter, M.D. Landscape structure, habitat fragmentation, and the ecology of insects. Agric. For. Entomol. 2002, 4, 159–166. [Google Scholar] [CrossRef] [Green Version]
- Kumar, S.; Stohlgren, T.J.; Chong, G.W. Spatial heterogeneity influences native and nonnative plant species richness. Ecology 2006, 87, 3186–3199. [Google Scholar] [CrossRef]
- McGarigal, K.; Marks, B.J. FRAGSTATS: Spatial Analysis Program for Quantifying Landscape Structure; USDA Technical Report PNWGTR-351 for Forest Service General; USDA Forest Service, Pacific Northwest Research Station: Portland, OR, USA, 1995. [Google Scholar]
- Hernandez-Stefanoni, J.L. Relationships between landscape patterns and species richness of trees shrubs and vines in a tropical forest. Plant Ecol. 2005, 179, 53–65. [Google Scholar] [CrossRef]
- Jactel, H.; Brockerhoff, E.; Duelli, P. A test of the biodiversity-stability theory: Meta-analysis of tree species diversity effects on insect pest infestations, re-examination of responsible factors. In Forest Diversity and Function: Temperate and Boreal Systems; Scherer-Lorenzen, M., Körner, C., Schulze, E.D., Eds.; Springer: Berlin, Germany, 2005; pp. 235–262. ISBN 978-3-540-22191-3. [Google Scholar]
- Johnstone, J.F.; McIntire, E.J.B.; Pedersen, E.J.; King, G.; Pisaric, M.J.F. A sensitive slope: Estimating landscape patterns of forest resilience in a changing climate. Ecosphere 2010, 1, 1–21. [Google Scholar] [CrossRef]
- Su, Q.; McLean, D.A.; Needham, T.D. The influence of hardwood content on balsam fir defoliation by spruce budworm. Can. J. For. Res. 1996, 26, 1620–1628. [Google Scholar] [CrossRef]
- Jäkel, A.; Roth, M. Conversion of single-layered Scots pine monocultures into close-to-nature mixed hardwood forests: Effects on parasitoid wasps as pest antagonists. Eur. J. For. Res. 2004, 123, 203–212. [Google Scholar] [CrossRef]
- Candau, J.N.; Fleming, R.A. Landscape-scale spatial distribution of spruce budworm defoliation in relation to bioclimatic conditions. Can. J. For. Res. 2005, 35, 2218–2232. [Google Scholar] [CrossRef]
- Lizuma, L.; Kļaviņš, M.; Briede, A.; Rodinovs, V. Long-term changes of air temperature in Latvia. In Climate Change in Latvia; Kļaviņš, M., Ed.; UL Publishing House: Riga, Latvia, 2007; pp. 11–20. [Google Scholar]
- FAO. Guidelines for Soil Description, 4th ed.; Food and Agriculture Organization of the United Nations: Rome, Italy, 2006; 97p, ISBN 92-5-105521-1. [Google Scholar]
- Smits, A.; (Latvian State Forest Research Institue “Silava”, Salaspils, Latvia). Personal communication, 2018.
- Buja, K.; Menza, C. Sampling Design Tool for ArcGIS; National Oceanic and Atmospheric Administration Biogeography Branch, Silver Spring: Montgomery County, MD, USA, 2013. [Google Scholar]
- ESRI. ArcGIS Desktop: Release 10; Environmental Systems Research Institute: Redlands, CA, USA, 2014. [Google Scholar]
- Rempel, R.S.; Carr, A.; Elkie, P. Patch Analyst and Patch Analyst (Grid) Function Reference; Centre for Northern Forest Ecosystem Research, Ontario Ministry of Natural Resources, Lakehead University: Thunder Bay, ON, Canada, 1999. [Google Scholar]
- Radeloff, V.C.; Mladenoff, D.J.; Boyce, M.S. The changing relation of landscape patterns and jack pine budworm populations during an outbreak. Oikos 2000, 90, 417–430. [Google Scholar] [CrossRef]
- Uuemaa, E.; Antrop, M.; Roosaare, J.; Marja, R.; Mander, Ü. Landscape metrics and indices: An overview of their use in landscape research. Living Rev. Landsc. Res. 2009, 3, 1–28. [Google Scholar] [CrossRef]
- Oksanen, J.; Guillaume, F.; Kindt, R.; Legendre, P.; O’Hara, R.B.; Simpson, G.L. Vegan: Community Ecology Package Version 1.17-6, 2011. Available online: http://CRAN.R-project.org/package=vegan (accessed on 4 September 2018).
- Mitchell, A. The ESRI Guide to GIS Analysis, 2nd ed.; ESRI Press: Redlands, CA, USA, 2005; p. 252. ISBN 9781589481169. [Google Scholar]
- R Core Team. A Language and Environment for Statistical Computing; R Foundation for Statistical Computing: Vienna, Austria, 2018. [Google Scholar]
- Bürkner, P.-C. brms: An R package for Bayesian multilevel models using Stan. J. Stat. Softw. 2017, 80, 1–28. [Google Scholar] [CrossRef]
- Szaro, R.C.; Johnson, D.W. Biodiversity in Managed Landscapes: Theory and Practice; Oxford University Press: New York, NY, USA, 1996; ISBN 978-0195079586. [Google Scholar]
- Pasitschniak alk-Arts, M.; Clark, R.G.; Messier, F. Duck nesting success in a fragmented prairie landscape: Is edge effect important? Biol. Conserv. 1998, 85, 55–62. [Google Scholar] [CrossRef]
- Kindlmann, P.; Burel, F. Connectivity measures: A review. Landsc. Ecol. 2008, 23, 879–890. [Google Scholar] [CrossRef]
- Marčiulynas, A. Biology and Significance of the spruce Bud Scale (Physokermes Piceae Schrank.) to Sanitary Condition of Norway Spruce (Picea Abies (L.) H. Karst.) in Lithuania. Ph.D. Thesis, Alexander Stulginski University, Kaunas, Lithuania, March 2016. [Google Scholar]
- Cappuccino, N.; Lavertu, D.; Bergeron, Y.; Regniere, J. Spruce budworm impact, abundance and parasitism rate in a patchy landscape. Oecologia 1998, 114, 236–242. [Google Scholar] [CrossRef] [PubMed]
- Turguter, S.; Ülgentürk, S. Physokermes piceae (Schrank) (Yumrulu Ladin Koşnili) (Hemiptera: Coccidae)’nin Biyolojik Özellikleri. Tarim Bilim. Derg. 2006, 12, 44–50. [Google Scholar] [CrossRef]
- Filgueiras, B.K.C.; Tabarelli, M.; Leal, I.R.; Vaz-de-Mello, F.Z.; Peres, C.A.; Iannuzzi, L. Spatial replacement of dung beetles in edge-affected habitats: Biotic homogenization or divergence in fragmented tropical forest landscapes? Divers. Distrib. 2016, 22, 400–409. [Google Scholar] [CrossRef]
- Berry, J.K. Map Analysis: Understanding Spatial Patterns and Relationships; GeoTec Media: San Francisco, CA, USA, 2007; 224p, ISBN 9780974861319. [Google Scholar]
- Li, H.; Reynolds, J.F. A Simulation Experiment to Quantify Spatial Heterogeneity in Categorical Maps Habin. Ecology 1994, 75, 2446–2455. [Google Scholar] [CrossRef]
- Mandelbrot, B.B. The Fractal Geometry of Nature; W.H. Freeman and Company: New York, NY, USA, 1983; 468p, ISBN 9780716711865. [Google Scholar]
- Setiawan, N.N.; Vanhellemont, M.; Baeten, L.; Dillen, M.; Verheyen, K. The effects of local neighbourhood diversity on pest and disease damage of trees in a young experimental forest. For. Ecol. Manag. 2014, 334, 1–9. [Google Scholar] [CrossRef]
- LaGro, J., Jr. Assessing patch shape in landscape mosaics. Photogramm. Eng. Remote Sens. 1991, 57, 285–293. [Google Scholar]
- Wiens, J.A.; Schooely, R.L.; Weeks, R.D., Jr. Patchy landscapes and animal movements: Do beetles per- colate? Oikos 1997, 78, 257–264. [Google Scholar] [CrossRef]
- Bergeron, Y.; Leduc, A.; Morin, H.; Joyal, C. Balsam fir mortality following the last spruce budworm outbreak in northwestern Quebec. Can. J. For. Res. 1995, 25, 1375–1384. [Google Scholar] [CrossRef]
- Kosztarab, M.; Kozár, F. Introduction of Anthribus nebulosus (Coleoptera: Anthribidae) in Virginia control of scale insects. Va. J. Sci. 1983, 34, 223–236. [Google Scholar]
- Rosenzweig, M.L. Species Diversity in Space and Time; Cambridge University Press: Cambridge, UK, 1995; 436p, ISBN 9780521499521. [Google Scholar]
- Oxbrough, A.; Irwin, S.; Kelly, T.C.; O’Halloran, J. Ground-dwelling invertebrates in reforested conifer plantations. For. Ecol. Manag. 2010, 259, 2111–2121. [Google Scholar] [CrossRef] [Green Version]
Figure 1.
Locations of selected forest massifs in Latvia and spatial distribution of P. piceae (Schrnk.) affected stands.
Figure 1.
Locations of selected forest massifs in Latvia and spatial distribution of P. piceae (Schrnk.) affected stands.

Figure 2.
The selected stand surrounded by other stands in the forest massif overlaid with a layer of buffer areas used for calculation of the Shannon diversity index.
Figure 2.
The selected stand surrounded by other stands in the forest massif overlaid with a layer of buffer areas used for calculation of the Shannon diversity index.

Figure 3.
Mean landscape metrics ((a) mean patch size, (b) core area index, (c) mean shape index, (d) edge density) for selected Norway spruce stands (we combined both damaged and control stands in affected forest massifs) between the affected and unaffected forest massifs (* indicate significant difference using Kruskal-Wallis test; overall significance level = 0.05).

Figure 4.
The distribution of dominant tree cover in the areas surrounding damaged stands, control stands in affected forest massifs and control stands in unaffected forest massifs (±95% confidence interval).
Figure 4.
The distribution of dominant tree cover in the areas surrounding damaged stands, control stands in affected forest massifs and control stands in unaffected forest massifs (±95% confidence interval).
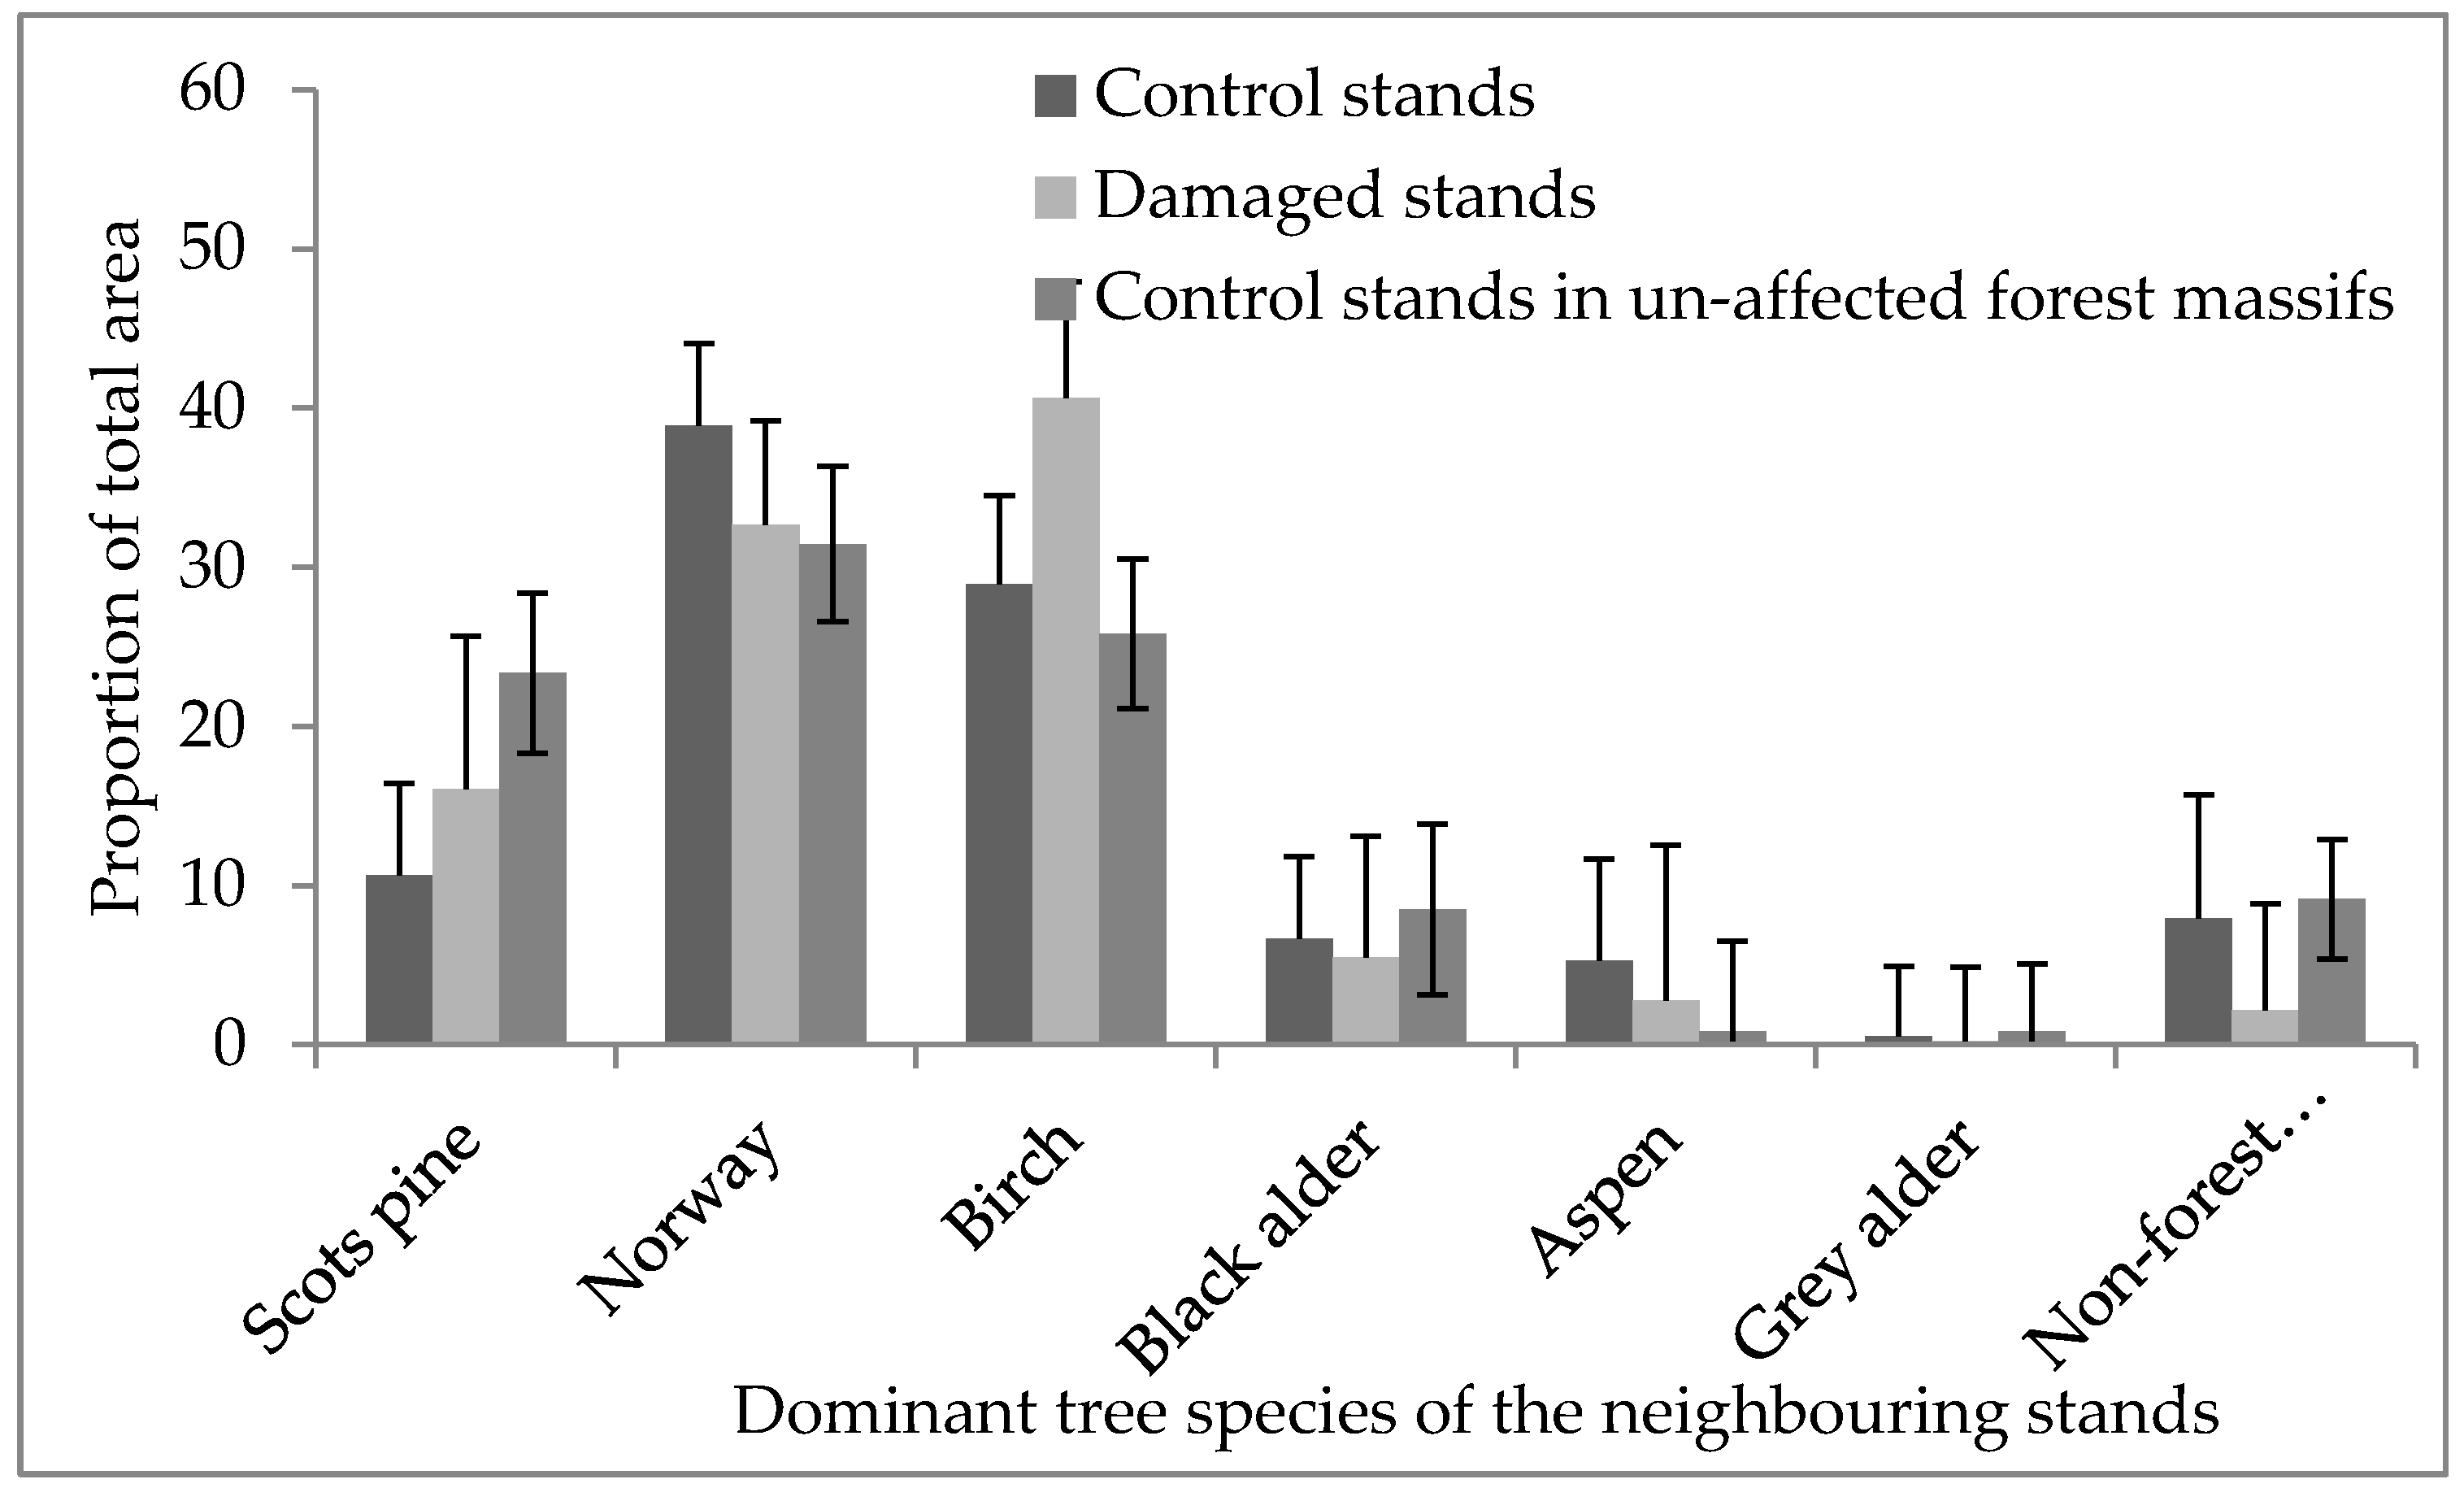
Figure 5.
The forest diversity surrounding selected Norway spruce stands within different buffer radii ((a) H 100, (b) H 250, (c) H 500, (d) H 1000) for affected and unaffected forest massifs (* indicate significant difference using Kruskal-Wallis test; overall significance level = 0.05).
Figure 5.
The forest diversity surrounding selected Norway spruce stands within different buffer radii ((a) H 100, (b) H 250, (c) H 500, (d) H 1000) for affected and unaffected forest massifs (* indicate significant difference using Kruskal-Wallis test; overall significance level = 0.05).

Figure 6.
The Shannon diversity index (H) for forest cover types surrounding damaged and control stands within different buffer distances ((a) H 100, (b) H 250, (c) H 500, (d) H 1000) in affected forest massifs (* indicate significant difference using Kruskal-Wallis test; overall significance level = 0.05).


Table 1.
List of the forest land cover/use classification categories.
| Defined Forest Land Cover/Use Categories | Description |
|---|---|
| Damaged stands | Norway spruce stands where sanitary clear-cut occurred after SBS infestation in 2010 |
| Scots pine pure stands 1 | Scots pine pure stands |
| Scots pine mixed woodland 2 | Scots pine mixed with Norway spruce, birch or aspen |
| Norway spruce control stands 3 | Norway spruce pure stands from 40 to 70 years in age |
| Norway spruce mixed woodland | Norway spruce mixed with scots pine, birch, black alder, grey alder, aspen or ash |
| Norway spruce pure stands | Norway spruce pure stands younger than 40 years or older than 70 years |
| Non-forest land | Agricultural land, farmland, the buffer area outside the boundaries of the forest massif |
| Soft broadleaves pure stands | Pure birch, black alder, grey alder or aspen stands |
| Soft broadleaves mixed woodland | Mixed birch, black alder, grey alder or aspen stands |
| Hard broadleaves stands | Common oak, ash, wych elm, linden or maple stands |
| Other damages | Any species stands damaged by windthrows, snow damages, other insect outbreaks or browsing damages |
| Infrastructure | Infrastructure such as roads, forest roads, power lines, buildings or crossrides |
| Glade | A forest opening of less than 0.2 ha |
| Wetlands | Includes mangroves, rivers, lakes, ditches or seasonally inundated areas |
| Clear-cut | Any species stands felled in a clear-cut |
| Bogs | Low, transition or high swamps |
1 pure stand- the proportion of the dominant species in pure stands was greater than 70% of overstory basal area, 2 mixed stands are a combination of two species where the proportion of one species is not greater than 70% of overstory basal area. 3 the category Norway spruce “Target stands” contains those stands that were subsampled for detailed comparison analysis.
Table 2.
Proportions of the forest massif area of the different land cover/use categories.
| Row Labels | Affected 1 | Affected 2 | Affected 3 | Affected 4 | Unaffected 1 | Unaffected 2 |
|---|---|---|---|---|---|---|
| Other damages | 0.0 | 0.0 | 0.0 | 0.0 | 0.0 | 0.0 |
| Bogs | 0.1 | 2.4 | 0.5 | 11.3 | 2.0 | 2.9 |
| Wetlands | 0.4 | 0.2 | 0.3 | 0.3 | 0.3 | 0.2 |
| Infrastructure | 0.4 | 0.8 | 0.6 | 0.6 | 1.5 | 2.6 |
| Hard broadleaves | 0.4 | 0.1 | 0.9 | 0.5 | 0.3 | 0.1 |
| Selected Norway spruce control stands * | 1.0 | 0.2 | 0.5 | 1.0 | 1.6 | 1.6 |
| Damaged stands ** | 1.4 | 0.2 | 0.7 | 1.3 | 0.0 | 0.0 |
| Glade | 1.5 | 1.3 | 1.1 | 0.9 | 0.8 | 1.2 |
| Non-forest | 1.9 | 5.2 | 2.6 | 2.8 | 1.9 | 2.2 |
| Scots pine mixed woodland | 2.4 | 3.1 | 1.8 | 2.6 | 4.2 | 4.9 |
| Clear-cut | 4.5 | 4.3 | 5.0 | 2.6 | 3.0 | 4.7 |
| Norway spruce mixed woodland | 5.1 | 5.8 | 4.1 | 3.7 | 4.4 | 3.9 |
| Norway spruce Target stands | 7.3 | 9.1 | 13.0 | 6.8 | 9.9 | 8.5 |
| Norway spruce stands (Non-target stands) | 8.1 | 9.7 | 6.4 | 9.4 | 4.7 | 4.5 |
| Soft broadleaves | 9.6 | 9.7 | 13.9 | 10.5 | 10.4 | 7.1 |
| Scots pine pure stands | 18.5 | 10.6 | 12.0 | 16.7 | 28.4 | 29.0 |
| Soft broadleaves mixed woodland | 37.4 | 37.4 | 36.6 | 28.9 | 26.6 | 26.7 |
* subset of Norway spruce Target stands for detailed analysis. ** subset of Norway spruce Target stands where clear-cut was conducted after SBS infestation.
Table 3.
The model for predicting the effect of landscape heterogeneity on SBS spread in a forested landscape (l-95% CI—lower 95% credibility interval, u-95% CI—upper 95% credibility interval).
Table 3.
The model for predicting the effect of landscape heterogeneity on SBS spread in a forested landscape (l-95% CI—lower 95% credibility interval, u-95% CI—upper 95% credibility interval).
| Parameter | Estimate | Est. Error | l-95% CI | u-95% CI |
|---|---|---|---|---|
| (Intercept) | 2.14 | 5.81 | –9.09 | 14.19 |
| H 100 | −4.24 | 1.58 | –7.86 | −1.72 |
| H 1000 | 5.82 | 2.09 | 2.15 | 10.32 |
| MSI | −0.57 | 1.10 | –2.80 | 1.64 |
| MPS | −0.03 | 1.33 | –2.83 | 2.50 |
| Core area | 2.53 | 1.63 | −0.24 | 6.19 |
© 2018 by the authors. Licensee MDPI, Basel, Switzerland. This article is an open access article distributed under the terms and conditions of the Creative Commons Attribution (CC BY) license (http://creativecommons.org/licenses/by/4.0/).
Share and Cite
MDPI and ACS Style
Bāders, E.; Jansons, Ā.; Matisons, R.; Elferts, D.; Desaine, I. Landscape Diversity for Reduced Risk of Insect Damage: A Case Study of Spruce Bud Scale in Latvia. Forests 2018, 9, 545. https://doi.org/10.3390/f9090545
AMA Style
Bāders E, Jansons Ā, Matisons R, Elferts D, Desaine I. Landscape Diversity for Reduced Risk of Insect Damage: A Case Study of Spruce Bud Scale in Latvia. Forests. 2018; 9(9):545. https://doi.org/10.3390/f9090545
Chicago/Turabian StyleBāders, Endijs, Āris Jansons, Roberts Matisons, Didzis Elferts, and Iveta Desaine. 2018. "Landscape Diversity for Reduced Risk of Insect Damage: A Case Study of Spruce Bud Scale in Latvia" Forests 9, no. 9: 545. https://doi.org/10.3390/f9090545
Note that from the first issue of 2016, this journal uses article numbers instead of page numbers. See further details here.