Article

Predicting Potential Distribution and Evaluating Suitable Soil Condition of Oil Tea Camellia in China

1
Research Institute of Economic Forest and Fruit (Research Institute of Oil Tea Camellia), Hunan Academy of Forestry, Shaoshan South Road, No. 658, Changsha 410004, China
2
National Engineering Research Center for Oil Tea Camellia, Changsha 410004, China
*
Author to whom correspondence should be addressed.
Forests 2018, 9(8), 487; https://doi.org/10.3390/f9080487
Submission received: 3 July 2018 / Revised: 3 August 2018 / Accepted: 3 August 2018 / Published: 10 August 2018
(This article belongs to the Section Forest Ecology and Management)

Abstract

:
Oil tea Camellia, as a major cash and oil crop, has a high status in the forestry cultivation systems in China. To meet the current market demand for oil tea Camellia, its potential distribution and suitable soil condition was researched, to instruct its cultivation and popularization. The potential distribution of oil tea Camellia in China was predicted by the maximum entropy model, using global environmental and soil databases. Then, we collected 10-year literature data about oil tea Camellia soil and applied multiple imputation and factor modeling for an in-depth analysis of soil suitability for growing of oil tea Camellia. The prediction indicated that oil tea Camellia was mainly distributed in Hunan, Jiangxi, Zhejiang, Hainan, East Hubei, Southwest Anhui and most of Guangdong. Climatic factors were more influential than soil factors. The minimum temperature of the coldest month, mean temperature of the coldest quarter and annual precipitation were the most significant contributors to the habitat suitability distribution. In the cultivated area of oil tea Camellia, soil fertility was poor, organic matter was the most significant factor for the soil conditions. Based on climatic and soil factor analyses, our data suggest there is a great potential to spread the oil tea Camellia cultivation industry.

1. Introduction

Tea oil, also known as “eastern olive oil” refers to the oil extracted from the seeds of oil tea Camellia which contain 20%–70% oil, with high oleic acid content [1]. It has been used as a fine cooking oil in China for hundreds of years [2]. Besides oleic acid, the oil is rich in palmitic, stearic, linoleic, and linolenic acids, and its consumption significantly contributes to reducing the risk of cardiovascular disease, enhancing immunity, lowering cholesterol levels, and preventing and treating hypertension [2,3,4]. Oil tea Camellia is considered as one of the four major woody oil crops in the world, together with oil palm, olive, and coconut [5]. Camellia oleifera Abel. is the most widely distributed and the main source of commercial production of the oil, but C. reticulate Lindl., C. chekangoleosa Hu, C. yuhsiensis Hu, C. meiocarpa Hu and C. vietnamensis T. C. Huang ex Hu are also well dispersed. According to previous studies, all parts of oil tea Camellia are valuable, and its byproducts also have great economic potential in agriculture, industry, and medicine [6,7,8]. Besides its economic value, oil tea Camellia has also demonstrated a role in water and soil conservation, biological fireproofing, and the improvement of ecological environments [9].
At present, oil tea Camellia is widely distributed in southern China, and the forestland covers 18 provinces/municipalities/autonomous regions [10]. The cultivated area of oil tea Camellia in China is about 3.33 million ha [11]. However, there is a common problem of inferior quality and low yield in oil tea Camellia forestland, which is caused by improper planting sites and a lack of scientific guidance [12]. A recent change in the Chinese government’s policy has encouraged farmers to plant more oil seeds instead of corn. Moreover, according to the “National Oilseed Development Plan (2016–2020)” published by China’s National Development and Reform Commission (NDRC), in collaboration with China’s Ministry of Agriculture (MOA) and the State Forestry Administration, China’s total planted area for oil seed production is predicted to increase by 1.4% to 23.3 million hectares (Mha2). The plan also sets a target for total oil seed production that the present output of 56.25 million tons will be increased to 59.8 million tons by 2020 [13]. To satisfy the requirement of the industrial development, it is valuable and necessary to understand the potential distribution of oil tea Camellia.
With the development of advanced statistical methods and geo-information science, ecological niche modeling has been a valuable tool to assess the potential geographical distribution of species, which is applied to several fields of research, such as ecology, biogeography, and evolution [14,15]. The maximum entropy model (MaxEnt) has many advantages, such as avoiding commission errors, which makes it quite applicable to species distribution modeling [16,17,18]. The method makes use of known occurrences, and pseudo-absence data resampled from the set of pixels where the species in question is not known to occur [19].
On the basis of suitable environmental conditions, the suitability of soil is still worth studying. In research of suitable soil conditions for oil tea Camellia, soil quality assessment is widely concerned, as it is the main reference to forecast distribution areas [20]. However, the evaluation system established based on soil physical, chemical, and biological indicators are complicated, and there is subjectivity involved in selecting soil quality indicators according to the soil functions of interest [21,22]. Moreover, testing a large number of indicators demands considerable labor, financial and material resources, and the results of studies evaluating one soil type are difficult to extrapolate to others, even in adjacent areas [23,24]. In this study, the basic nutrient indicators were focused to increase the feasibility of universal use. The aims of this study were to: (i) ascertain the potential distribution of oil tea Camellia in China by the MaxEnt model, using global environmental and soil databases, and (ii) collect the related literature data from the last 10 years to find the basic nutrient suitable conditions for the growth of oil tea Camellia. In the predicted suitable region, the feasibility of the cultivation and popularization can be determined by testing of soil conditions.

2. Materials and Methods

2.1. Databases

The environmental data layers were obtained from the WorldClim dataset (http://www.worldclim.org) in the grid format (30 arc-seconds). The data cover the years 1960–1990, including 19 yearly environment variables (Table 1). The soil data were obtained from the Harmonized World Soil Database (HWSD), which includes 36 soil-based indicators (Table 2). The Chinese Virtual Herbarium (http://www.cvh.ac.cn/) and related literature were used to extract the locations of oil tea Camellia. Finally, 355 points (of which 270 points were C. oleifera, and the remaining were C. chekangoleosa, C. meiocarpa, C. vietnamensis and C. reticulate) were selected to use as records of species presence.
A database of oil tea Camellia soil conditions was compiled, by surveying the peer-reviewed publications in Web of Science and China National Knowledge Infrastructure Database (CNKI), using subjective words “Camellia oleifera/oil tea” and “soil”. All searches were conducted on 31 December 2017 and spanned 10 years (2008–2017). In total, 518 articles in CNKI and 83 in Web of Science were selected. Furthermore, the following criteria were applied to select the papers and data for review: (i) research articles and dissertations only, (ii) the data were not repeated in other articles, and (iii) a detailed description of the experimental place and soil was provided. Finally, 160 groups of effective soil data were obtained and analyzed.

2.2. Modeling Procedure

The Maximum Entropy Species Distribution Modeling (MaxEnt, version 3.4.1, Princeton University, Princeton, NJ, USA) was used, which employed a set of four possibilities, including logistic regression, bioclimatic rules, range rules and negated range rules. The algorithm runs either 500 iterations of these processes or until convergence. This model produced prediction values ranging from 0 to 100, representing cumulative probabilities of occurrence. According to the natural discontinuity method, the prediction values above 62 were defined for high suitability and values below 36 were defined for low suitability and unsuitable. Different colors corresponded to different fitting indices in the potential distribution map.
The Jackknife test was used to inform us about the importance of individual variables for MaxEnt predictions. The receiver operating characteristic (ROC) area under the curve (AUC) analysis is widely employed for comparing the performances of MaxEnt species distribution models [16,17,18,25]. The ROC plots the sensitivity values and the false-positive fraction for all available probability thresholds. The AUC provides a single measure of model performance, independent of any particular choice of threshold, allowing to evaluate the accuracy of prediction.

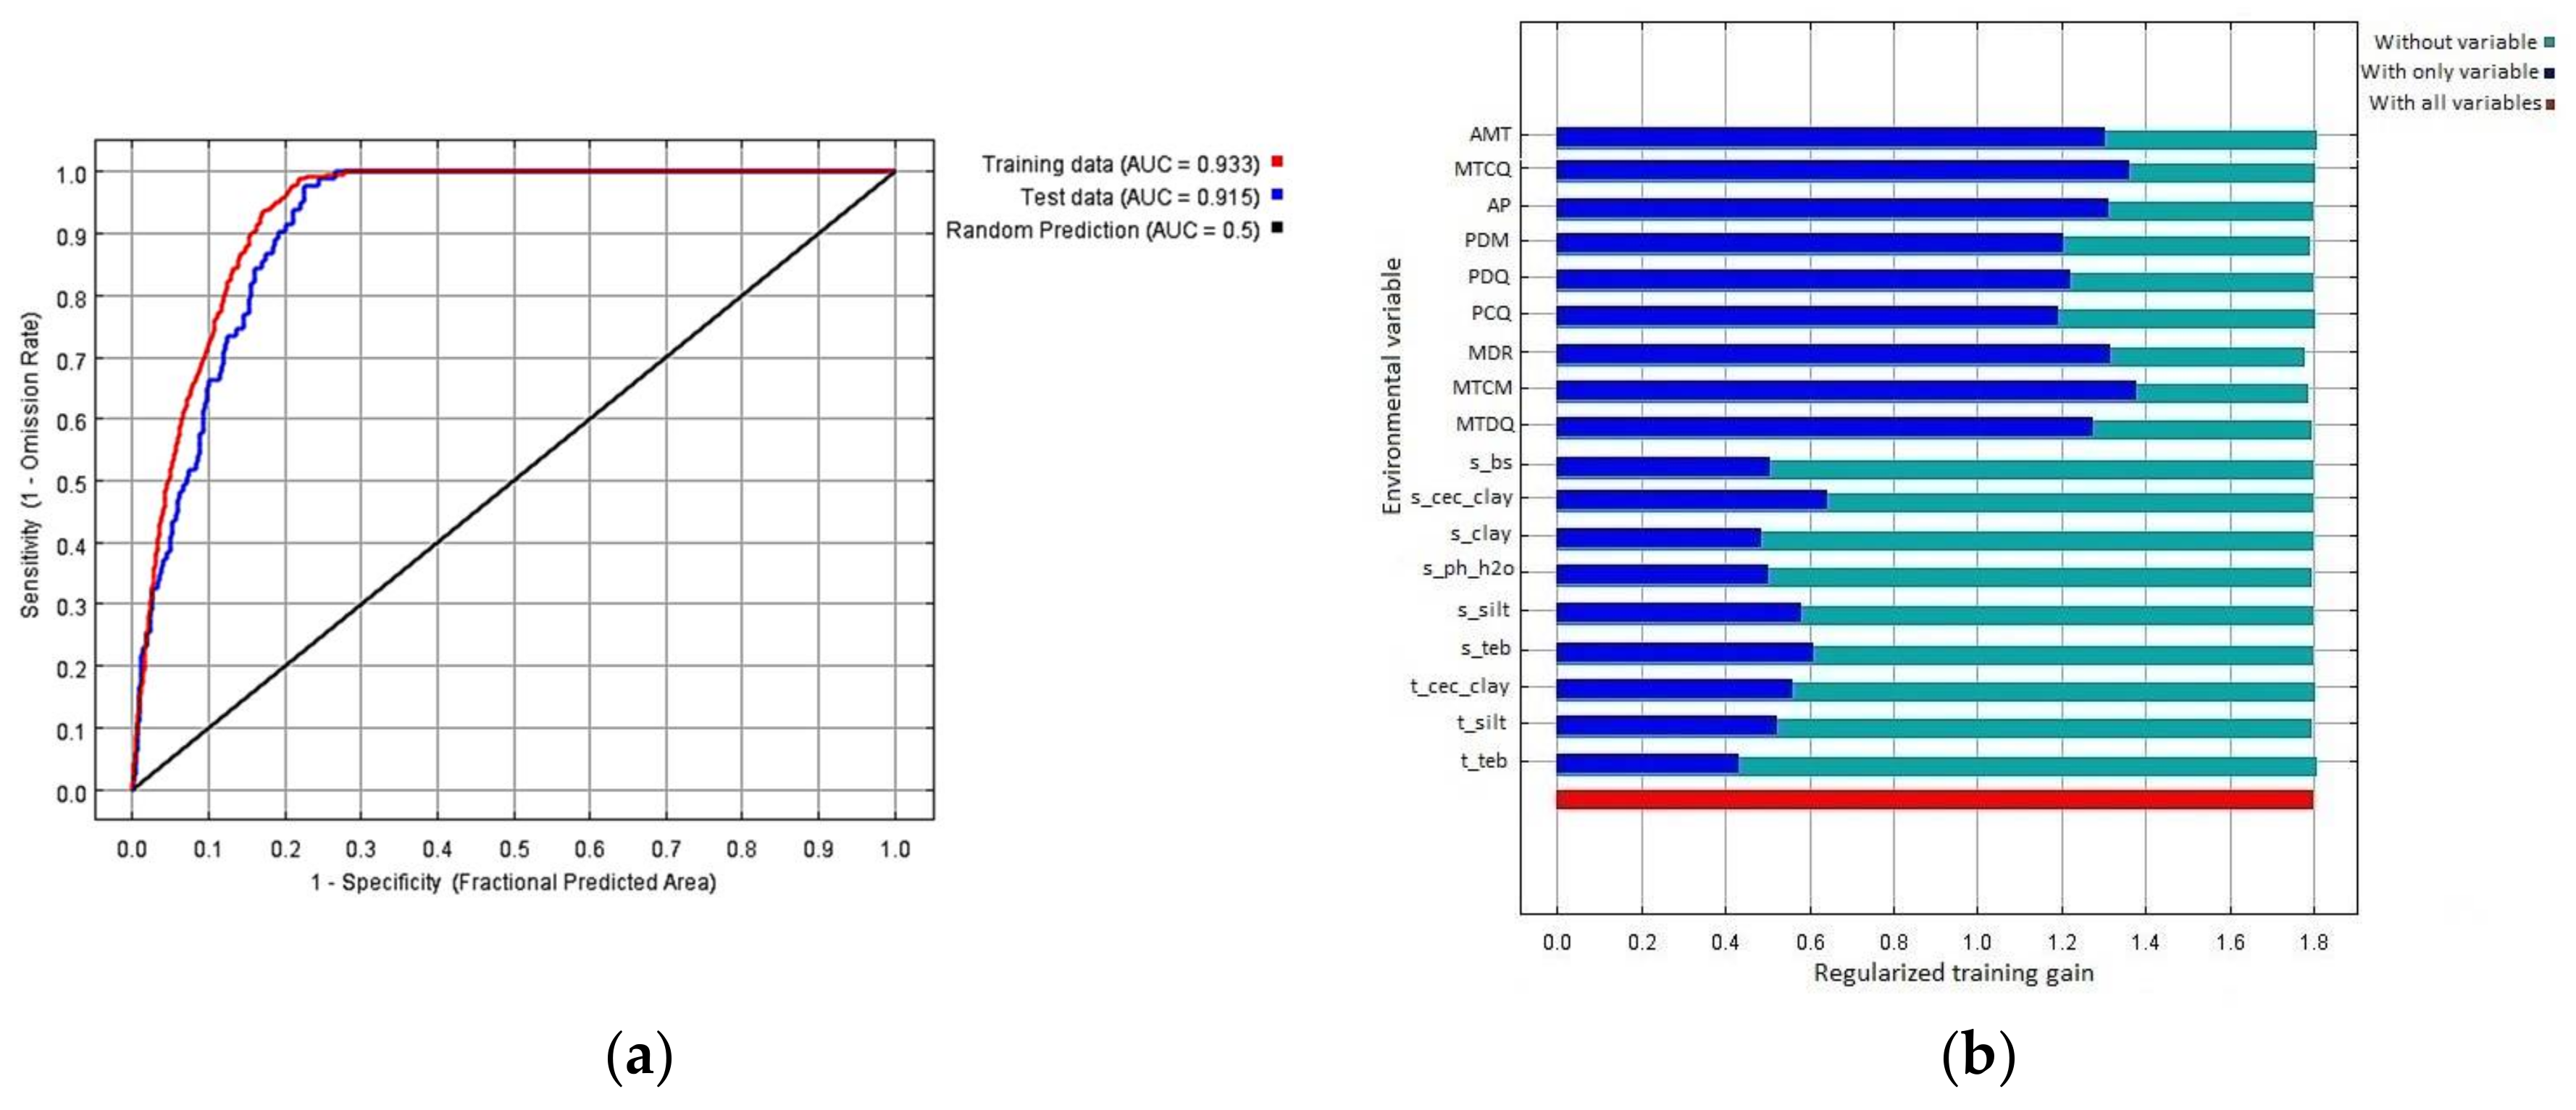
2.3. Statistical Analysis

Missing data is a common problem in the collection of literature data. In this study, the multiple imputation by chain equation (MICE) method was used to estimate the missing values. Soil indicators of oil tea Camellia were analyzed using principal component analysis, correlation analysis, data redundancy analysis and regression analysis, by SPSS 20.0 (IBM, Chicago, IL, USA) and the R-project (https://www.r-project.org). Both layer superposition and area calculation were achieved by ArcGIS 10.5 (ESRI, Redlands, CA, USA).

3. Result

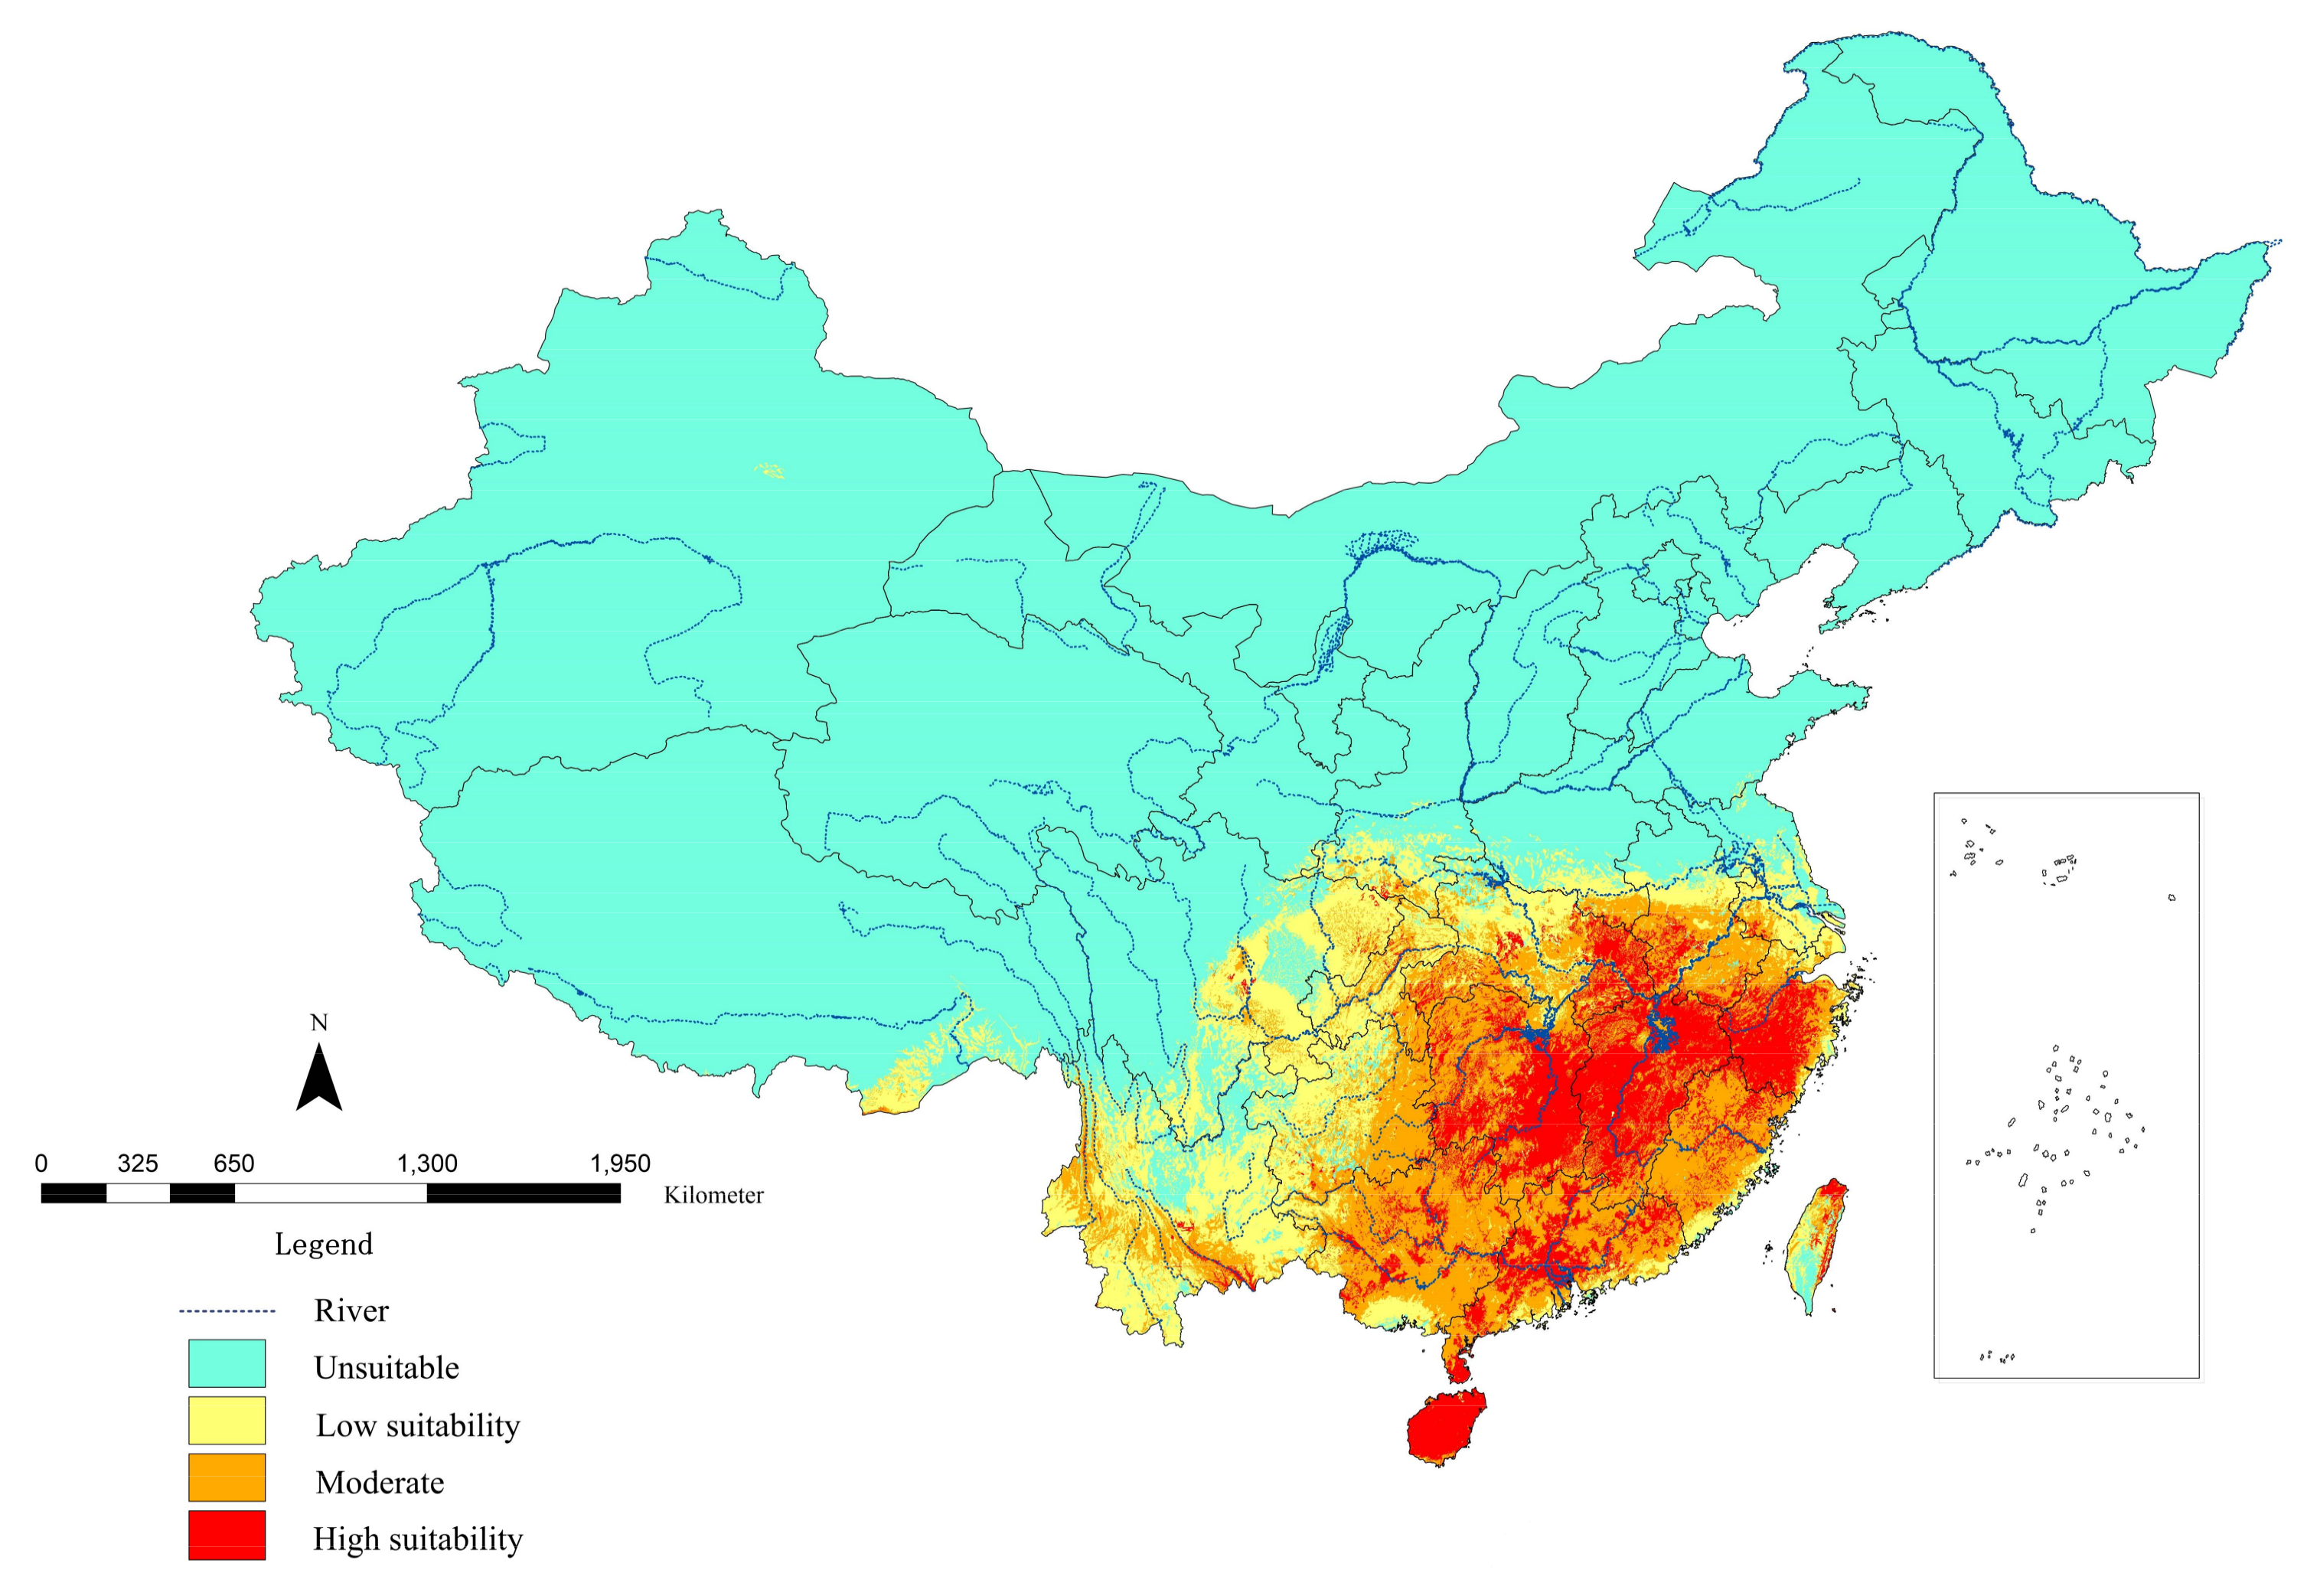
3.1. Predicted Potential Geographical Distribution of C. Oleifera

Figure 1 indicated that 8.25% of the area was moderately suitable, followed by 7.97% in the low suitability class, and only 4.94% corresponded to high habitat suitability. The land area of China is 9.32641 million square kilometers. Among the most suitable area for oil tea Camellia predicted by MaxEnt, was about 0.461 million square kilometers, which was mainly distributed in Hunan, Jiangxi, Zhejiang, Hainan, East Hubei, Southwest Anhui, and most of Guangdong. Areas, such as Guangxi, Fujian, East Guizhou, Northwest Hunan, and south of Hubei and Anhui were moderate growing areas for oil tea Camellia. In addition, parts of Yunnan and Chongqing, East Sichuan, Central Anhui, and south of Shanxi, Henan and Jiangsu were also potential growing regions.
The AUC scores for the training and test data were 0.933 and 0.915, respectively, indicating a high level of accuracy in the model prediction (Figure 2a). The Jackknife test revealed that among the 55 variables used for the model development, 10 climatic factors and 10 soil factors with greater influence on their distribution were selected according to the degree of influence (Figure 2b). Overall, the climatic factors were more influential than the soil factors. The minimum temperature of the coldest month (MTCM), mean temperature of the coldest quarter (MTCQ), and annual precipitation (AP) were the most significant contributors to the habitat suitability distribution. This result showed that low temperature and moisture were the main factors limiting the distribution of oil tea Camellia. Among the soil variables, subsoil (30–100 cm) properties were more important than topsoil (0–30 cm) attributes. Clay cation exchange capacity (s-cec-clay and t-cec-clay), total exchangeable bases (s-teb) and silt fraction (s-silt) of the subsoil were the most significant contributors to the habitat suitability distribution.

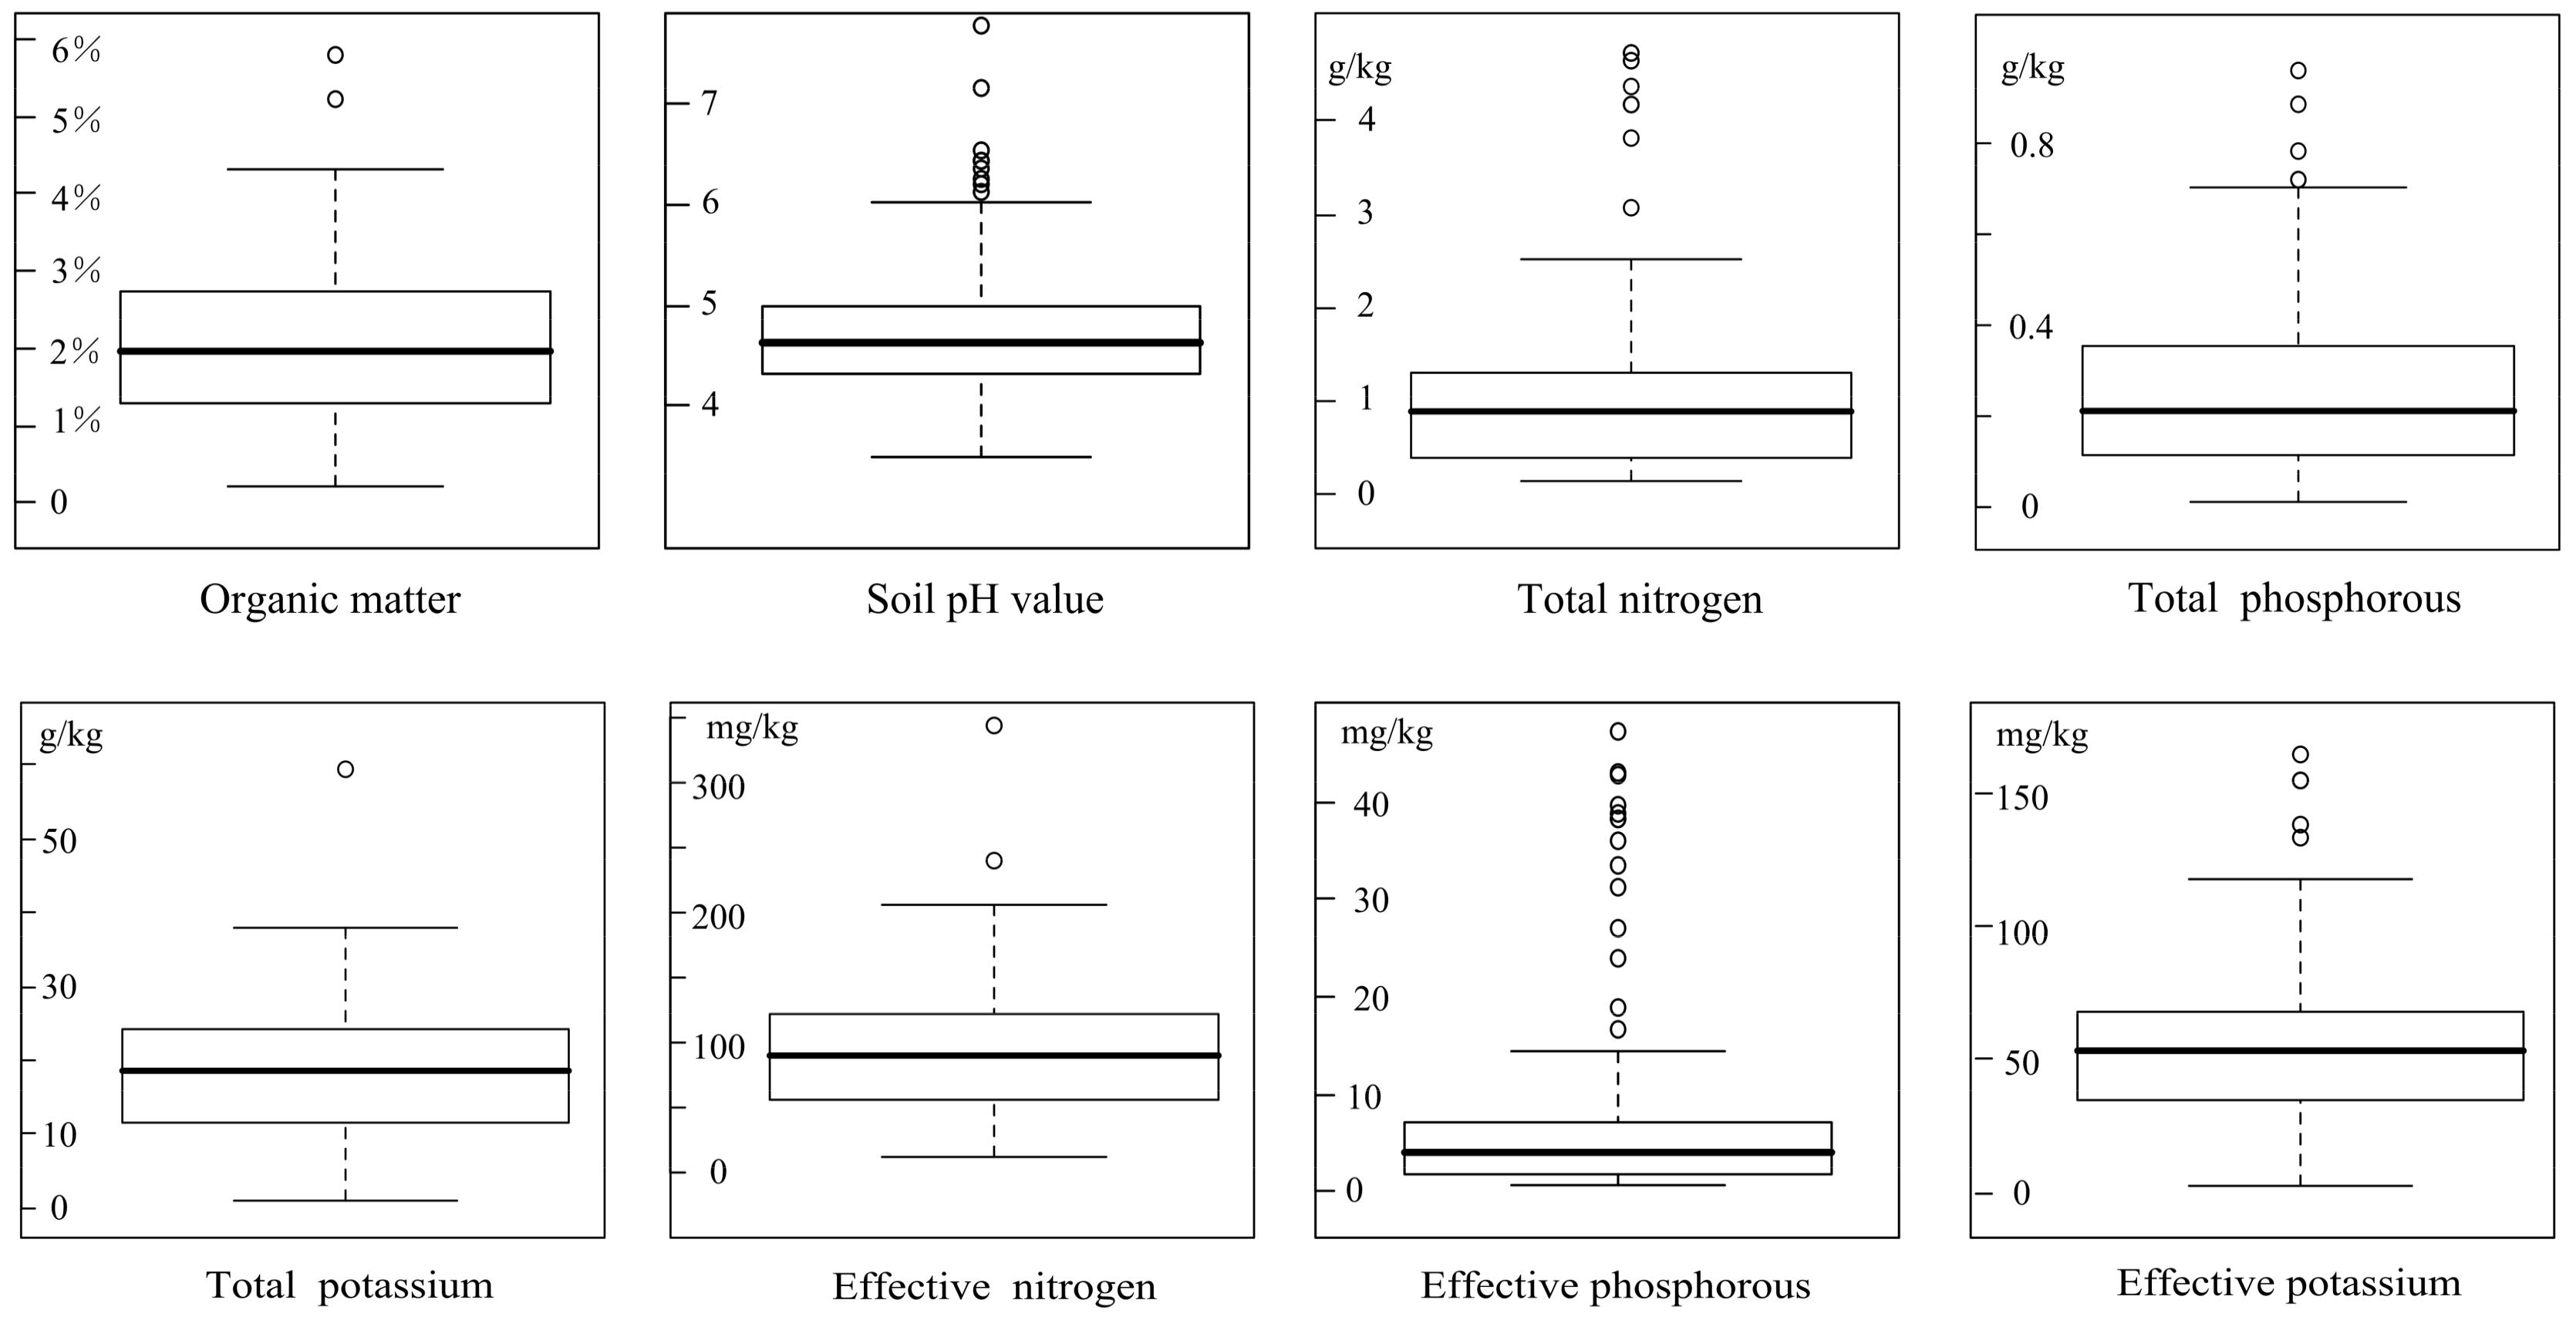
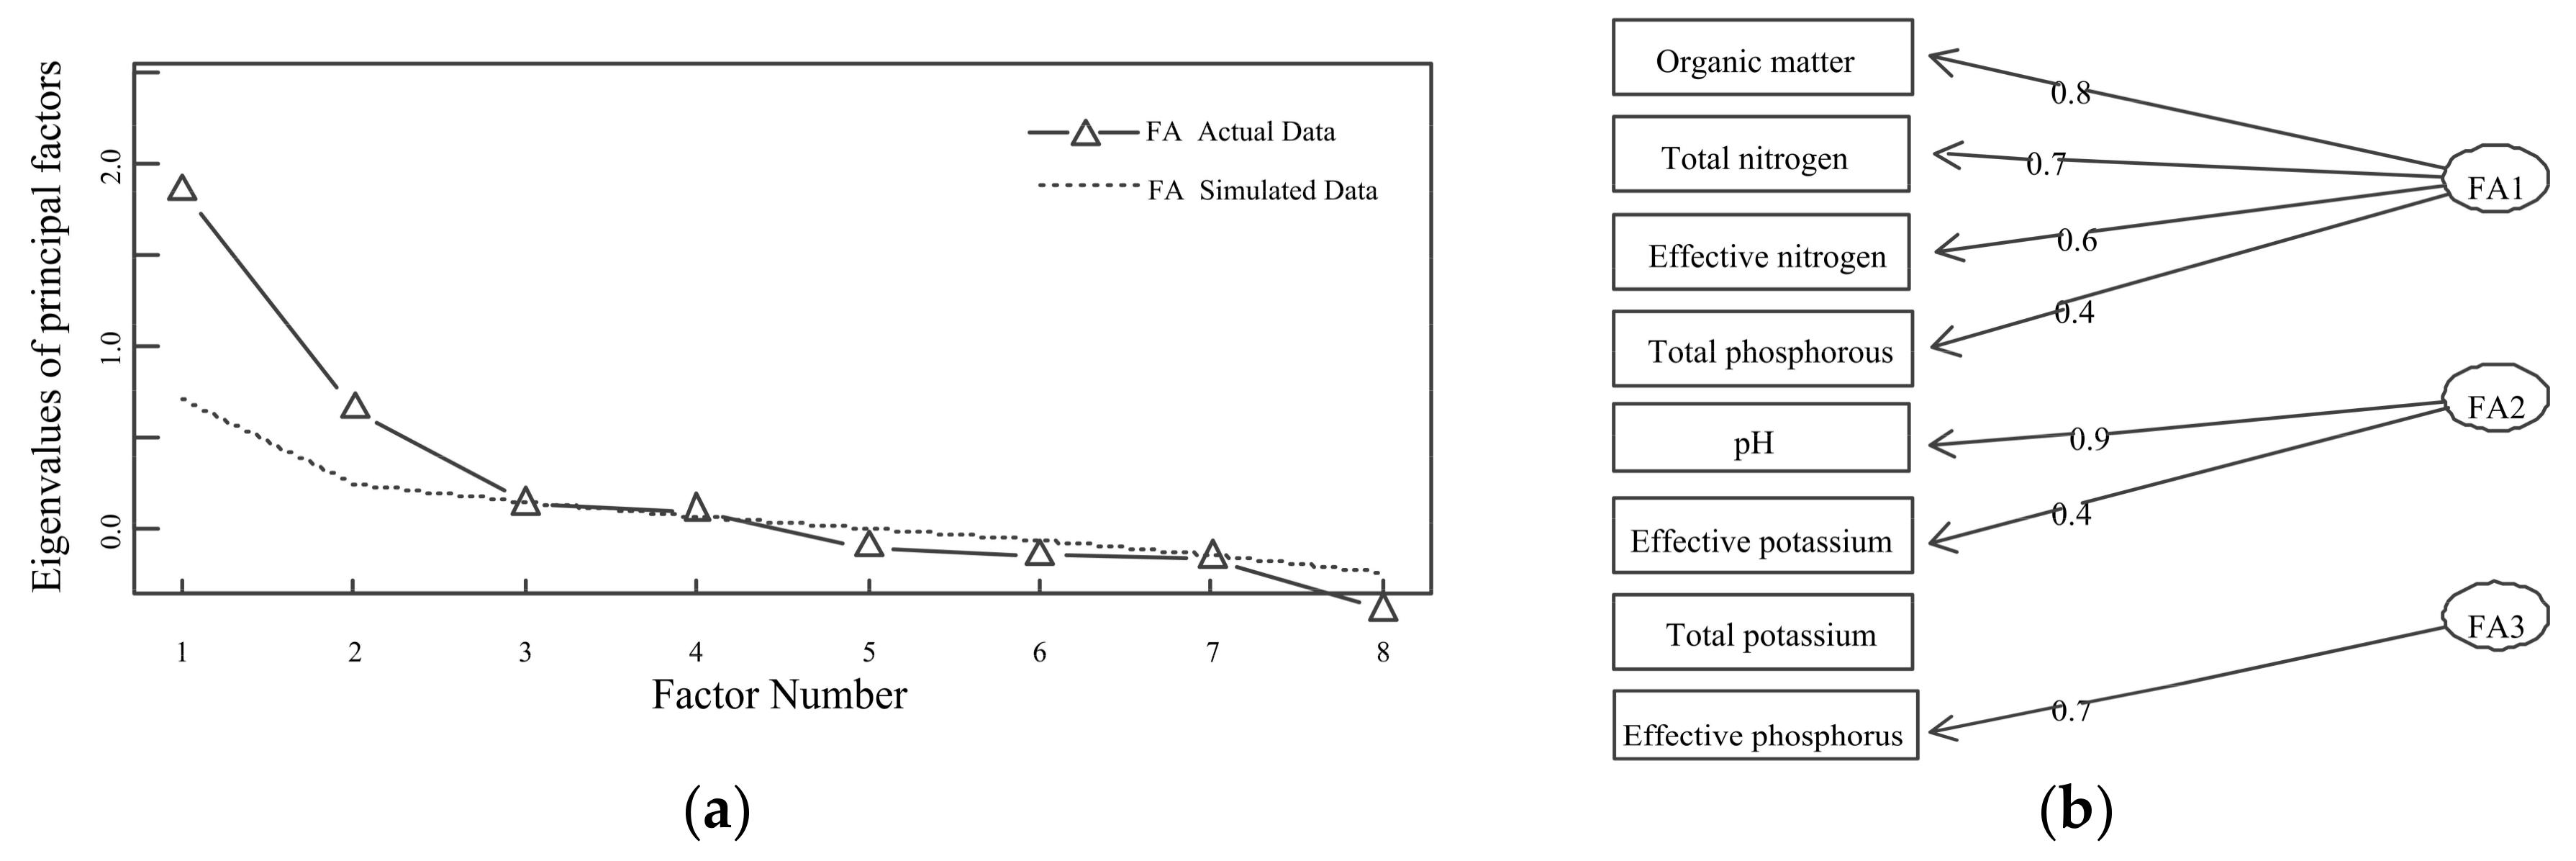
3.2. Suitable Soil Conditions of Oil Tea Camellia

In the collected literature data, soil organic matter, soil pH, total nitrogen, phosphorous, and potassium, and effective nitrogen, phosphorous, and potassium were soil indicators, which were the most commonly reported. Figure 3 indicated the numerical distribution range of each soil indicator, in which there were many abnormal values in effective phosphorous and total nitrogen. The main distribution ranges were soil organic matter 1.29%–2.75%, soil pH 4.30–5.00, total nitrogen 0.41–1.25 g·kg−1, total phosphorous 0.11–0.35 g·kg−1, total potassium 12.24–24.82 g·kg−1, effective nitrogen 58.33–124.60 mg·kg−1, effective phosphorous 2.51–7.56 mg·kg−1, and effective potassium 33.27–68.51 mg·kg−1 According to the classification data of China's second soil survey, the soil fertility of oil tea Camellia was poor. In addition to some uncharacteristically high levels of total potassium and effective nitrogen, all other soil attribute values were considered low.
Factor analysis was conducted on the soil data collected from the literature. Figure 4 showed that three common factors could largely explain the soil conditions. FA1 (factor 1) was closely related to the organic matter, total nitrogen, total phosphorous, and effective nitrogen. Moreover, there was a strong positive correlation between FA1 and organic matter. Also, the correlation coefficient of FA2 and pH of soil reached up to 0.9. FA3 was only related to effective phosphorous. The factor score was y = 0.436 × FA1 + 0.307 × FA2 + 0.128 × FA3. According to the factor score of the samples, the soil conditions of Hainan were the most suitable for growing oil tea Camellia. Next, a comprehensive evaluation of the soil conditions was undertaken, which identified that organic matter and total nitrogen were the most significant factors for the soil conditions, whereas, total potassium had little effect.

4. Discussion

4.1. Comparison of the Potential Distribution and Previous Prediction

Cui applied MaxEnt and the genetic algorithm for rule set production (GARP) models to research the potential distribution of wild C. oleifera [10]. It was shown that the highly suitable growing regions were around Wuyi Mountain, Nanling Mountain, and Wuling Mountain. In this study, we focused on the cultivated oil tea Camellia and predicted the highly suitable growing region was larger than that previously determined. Meanwhile, this study indicated that climatic factors were more important than soil factors on the distribution of oil tea Camellia, which was in agreement with Zhu and Zhuang [26,27]. Furthermore, our study demonstrated that minimum temperature and precipitation were the main restrictive factors on potential distribution. Similarly, Cui suggested that the major environmental factors affecting the distribution of wild C. oleifera were mean monthly diurnal temperature range, and precipitation during the driest and warmest quarters, respectively [10]. In addition, Hu and Yin proposed that the minimum temperature of the coldest month has the greatest influence on the geographical distribution of Liaodong oak (Quercus wutaishanica Mayr) and Indian sandalwood (Santalum album L.) [28,29]. These conclusions all showed that minimum temperature and precipitation were key restrictive factors for the distribution of various plants.

4.2. Difference Between the Potential Distribution and the Actual Planting Area

At present, the cultivated area of oil tea Camellia in China is about 3.33 Mha2 [11]. The main producing areas are Hunan, Jiangxi, and Fujian, which are among the top three provinces. In this study, the high suitability area was predicted to be about 46.07 Mha2, of which agricultural acreage was around 15.72 Mha2. Therefore, it is conservatively estimated that at least 27.02 Mha2 of non-forest land is suitable for planting oil tea Camellia, which is 8.11-fold more than the current cultivated area. Adequate cultivated areas are a reliable guarantee for the development of oil tea Camellia cultivation industry.
In this study, Hainan was highly suitable for planting oil tea Camellia in our prediction, yet it was not mentioned in China’s government report of “The planning of national C. oleifera industry development (2009–2020) [30]. Zheng considered that there were wild and cultivated resources of oil-tea Camellia in Hainan, intensively distributed among 38 townships of nine cities and comprising an approximate area of 1167.3 ha2 [31]. The reason for its small area maybe that the climate of Hainan is suitable for the growth of many kinds of plants, and the species diversity is high, so the area of a certain forest is relatively small. Another explanation is that in Hainan, oil-tea Camellia dispersedly grows in the understory or on the margin of rubber tree (Hevea brasiliensis Müll. Arg.), betel nut (Areca catechu L.), and secondary shrub forests, but few on the sloping land as pure forest. In general, it was consistent with the previous researches, in which the planting area of oil tea Camellia was mainly limited to three boundaries and nine regions [30]. However, the difference was that Shandong and Tibet had few places with low suitability. Fang demonstrated that Southeast Tibet had a tropical or subtropical monsoon climate, where the forest coverage rate was 46.1%, and the climate was very suitable for plant growth [32].

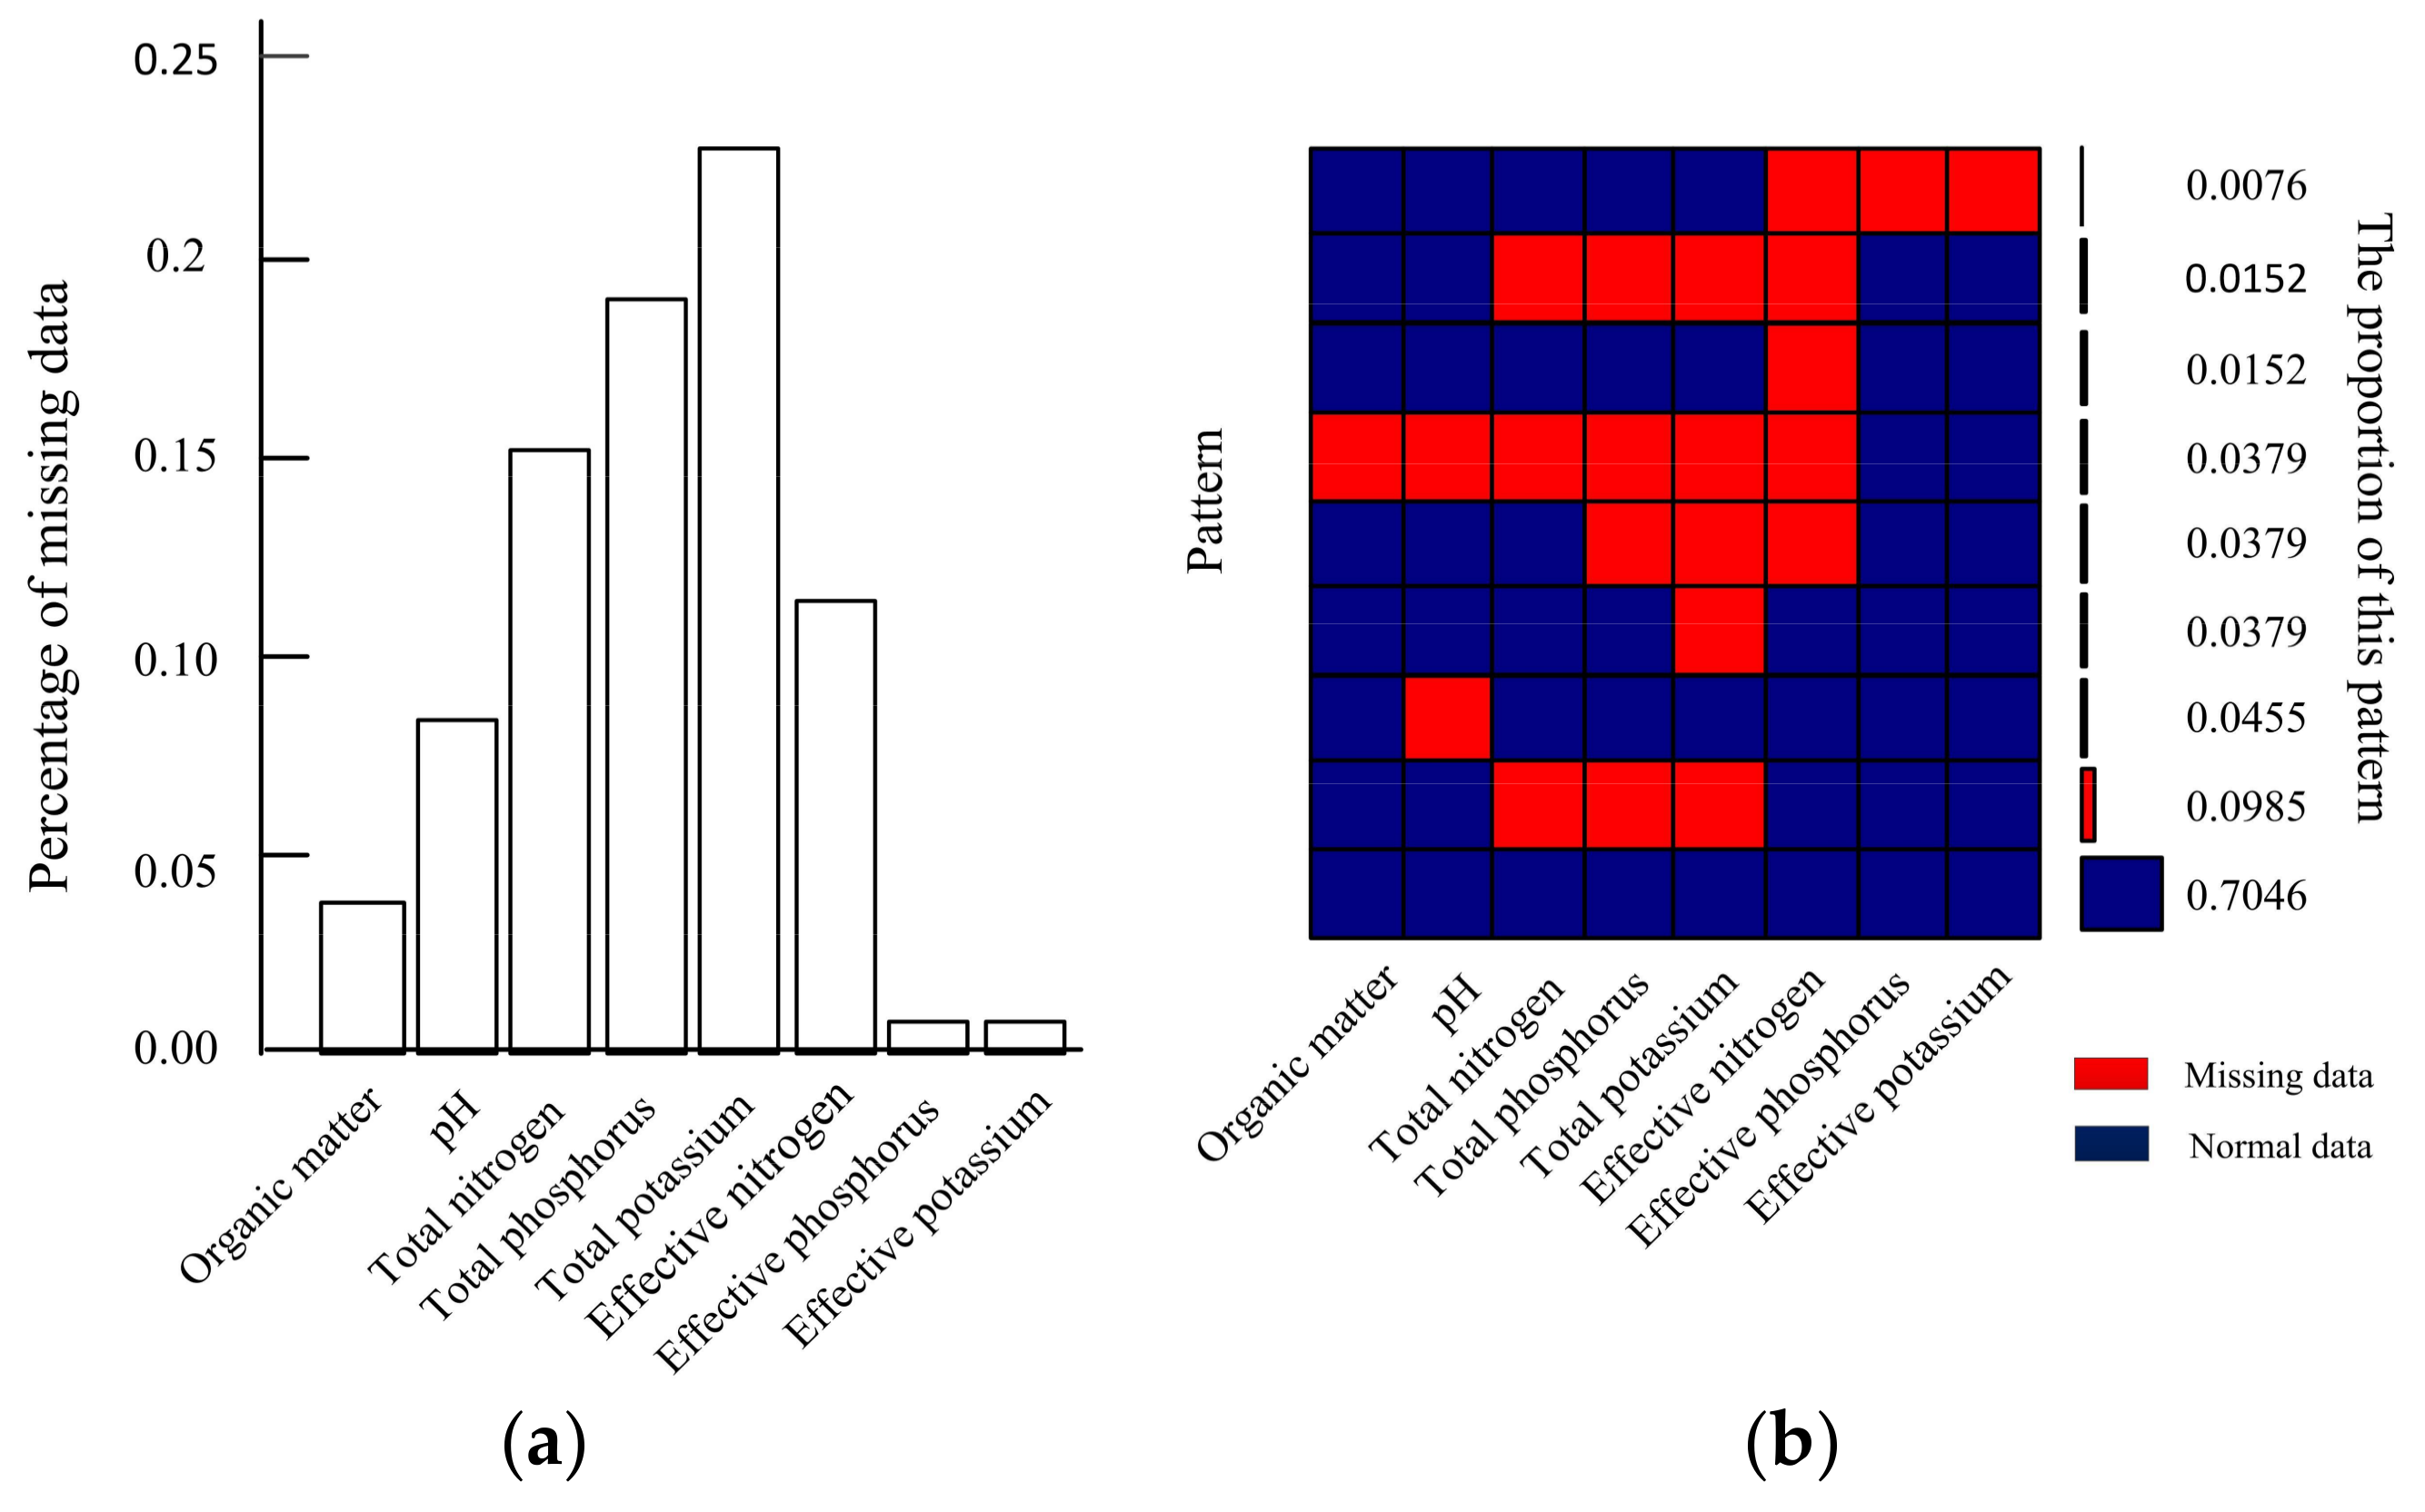
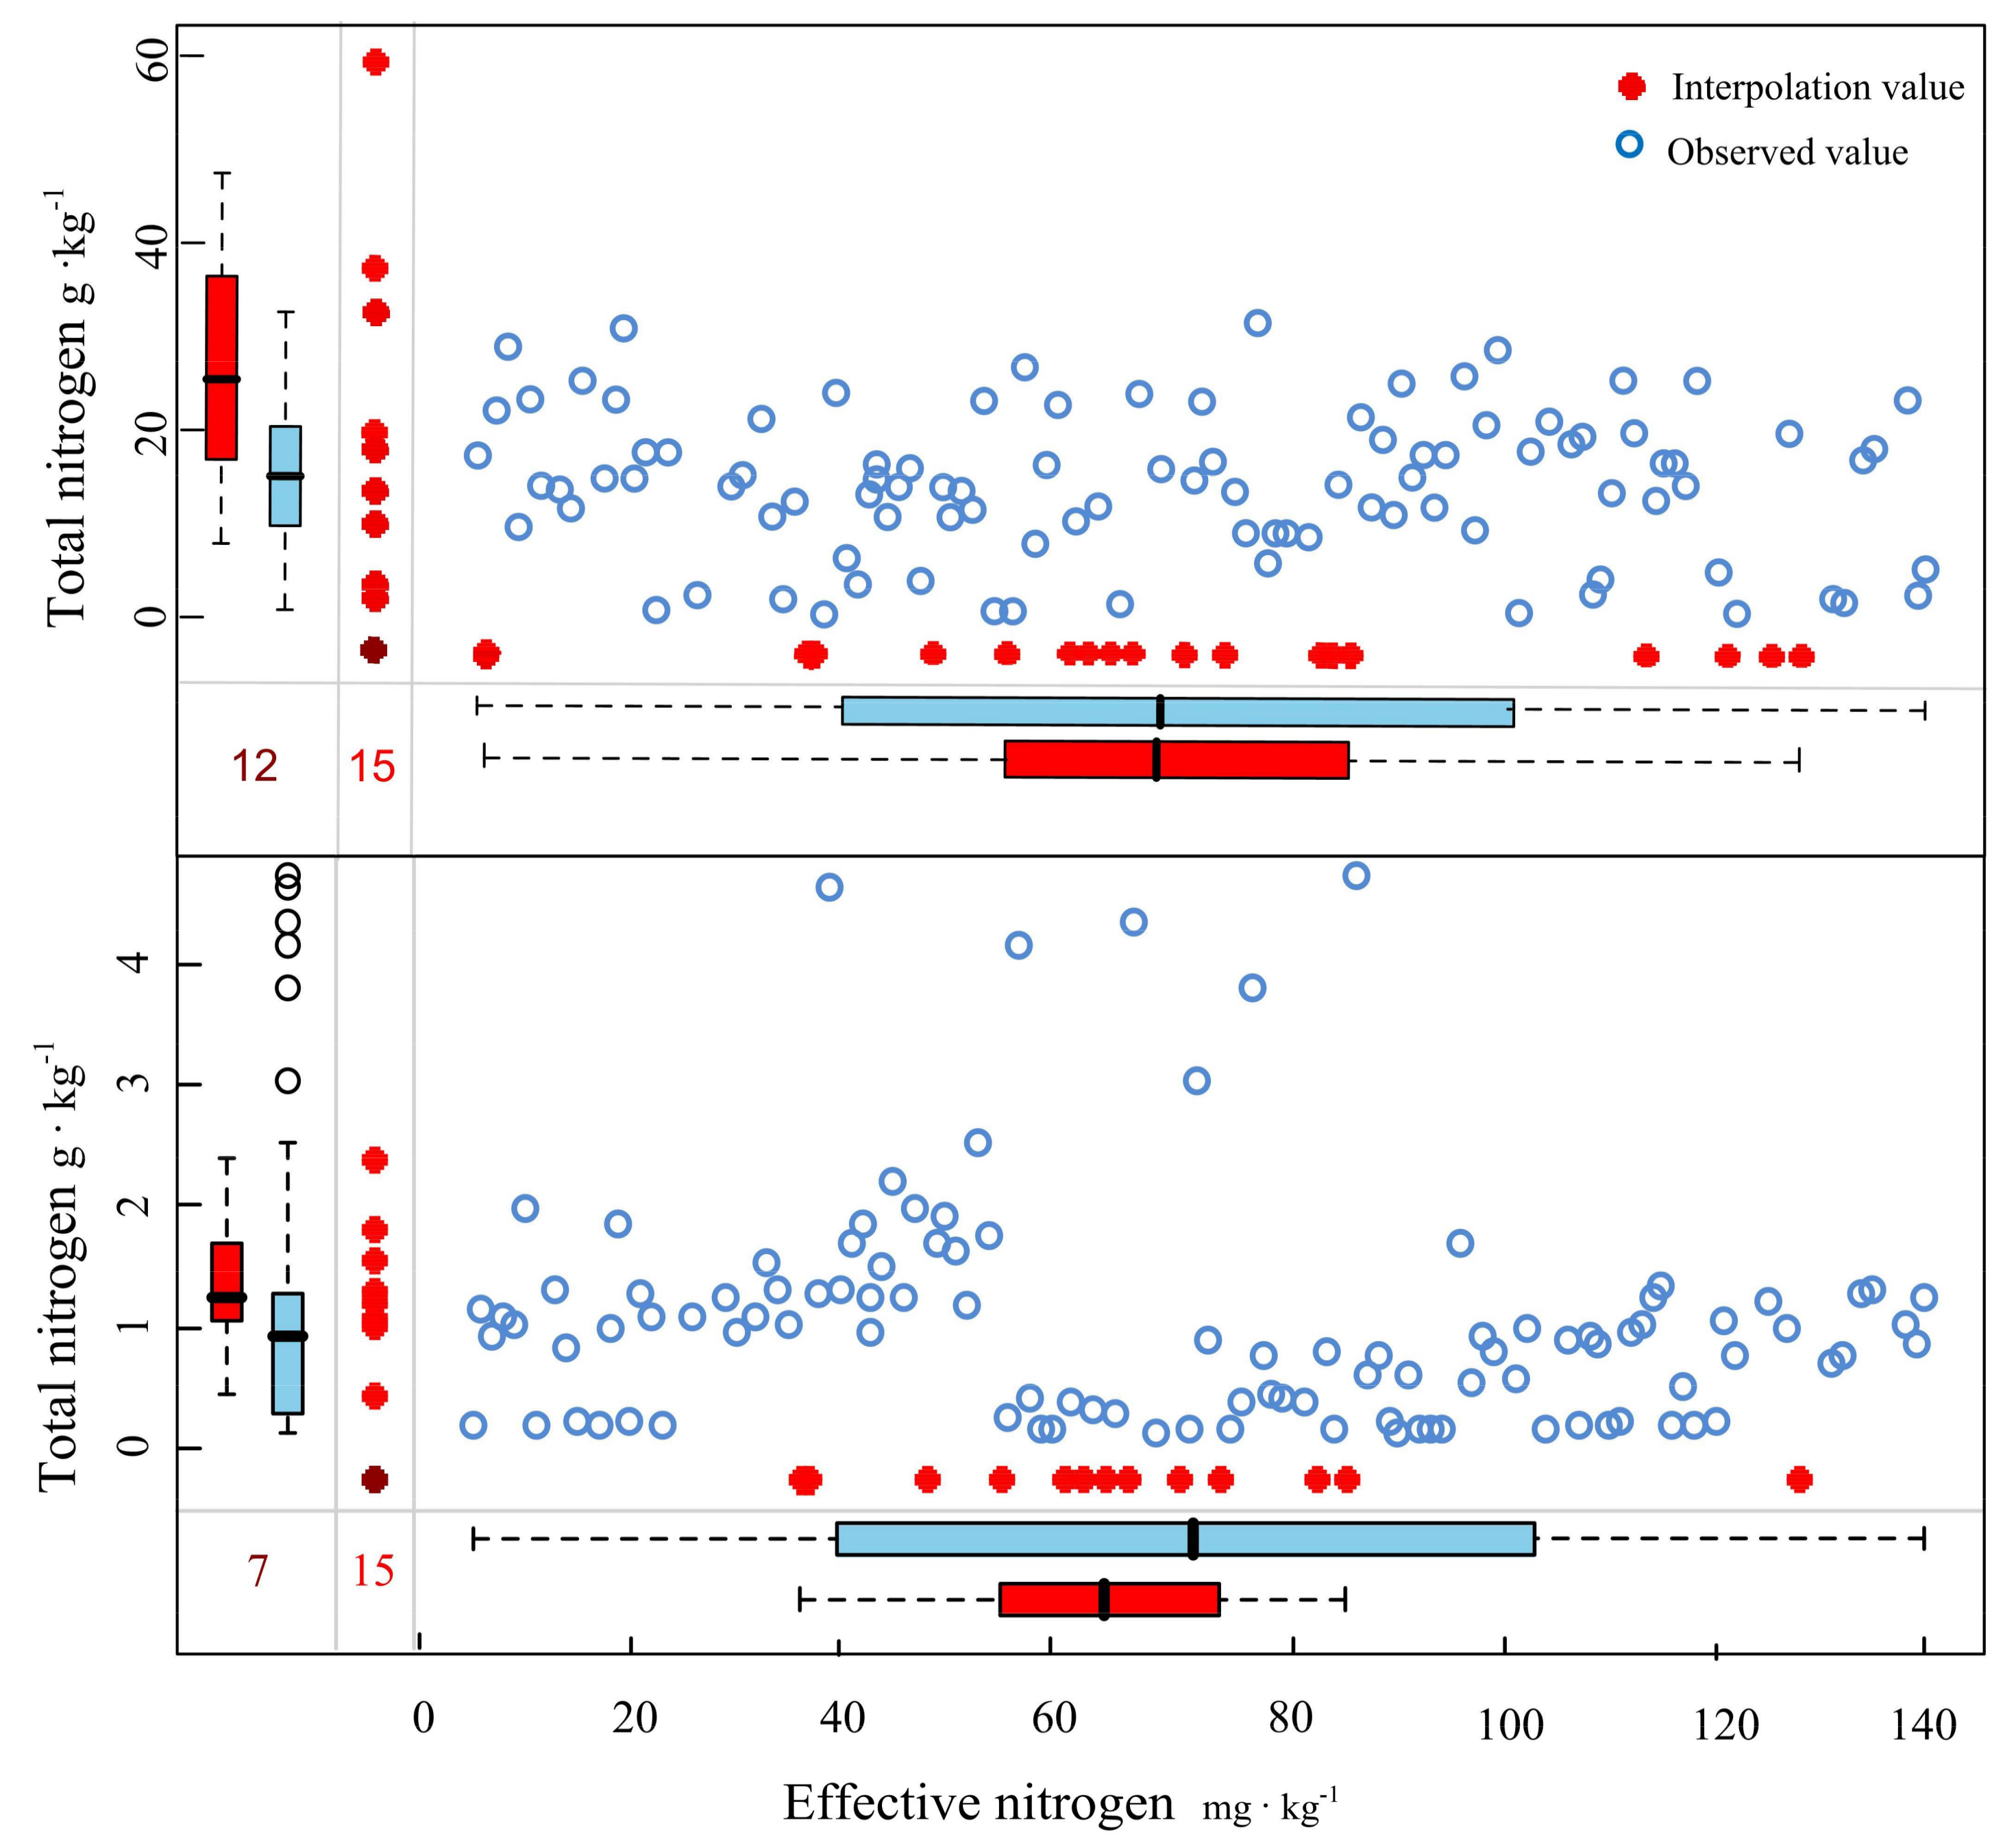
4.3. Supplement and Evaluation of Missing Data

Missing data is the most common problem in data mining analysis [33]. The predictive mean matching method of multiple imputation was used in this study. Figure 5b highlighted that no missing data contributed to 70.46% of all data, and the most missing variable was total potassium (Figure 5a). The amount of information contained in the data essentially met the statistical requirements. A comparison of the distribution of the initial and interpolated data indicated that the trend in the interpolation value well-matched the observed values, namely, the interpolation value approximated the actual value (Figure 6).

5. Conclusions

In our report, we predicted the potential geographical area of oil tea Camellia in China. Although the predicted region was consistent with the existing main production region, the potential cultivable area was much larger. Minimum temperature and precipitation were the most significant contributors to the habitat suitability distribution. The nutrient content of oil tea Camellia soil was poor, and organic matter and total nitrogen were the most significant soil factors in the cultivable area of oil tea Camellia. Finally, based on our results, our data affirm a great potential to extend the oil tea Camellia cultivation industry in China.

Author Contributions

Conceptualization, C.L. and Y.C.; Methodology, L.C. and N.D.; Software, C.L. and N.D.; Validation, L.C. and M.L.; Investigation, W.T. and S.P.; Data Curation, C.L. and S.P.; Writing-Original Draft Preparation, C.L. and L.C.; Writing-Review & Editing, W.T.; Supervision, Y.C.; Project Administration, L.C.; Funding Acquisition, L.C.

Funding

This research was funded by National Key R&D Program of China, grant number 2017YFC0505503.

Acknowledgments

All authors are thanks for WorldClim dataset, Harmonized World Soil Database and Chinese Virtual Herbarium to provide the data. Meanwhile, we wish to thank the National Key R&D Program of China to offer the research funding.

Conflicts of Interest

The authors declare no conflicts of interest.

References

  1. Chen, Y.Z.; Wang, B.M.; Chen, J.J.; Wang, X.N.; Wang, R.; Peng, S.F.; Chen, L.S.; Ma, L.; Luo, J. Identification of Rubisco rbcL and rbcS in Camellia oleifera and their potential as molecular markers for selection of high tea oil cultivars. Front. Plant. Sci. 2015, 6, 189. [Google Scholar] [CrossRef] [PubMed]
  2. Dong, B.; Wu, B.; Hong, W.H.; Li, X.P.; Li, Z.; Xue, L.; Huang, Y.F. Transcriptome analysis of the tea oil Camellia (Camellia oleifera) reveals candidate drought stress genes. PLoS ONE 2017, 12, e0181835. [Google Scholar] [CrossRef] [PubMed]
  3. Ma, J.L.; Ye, H.; Rui, Y.K.; Chen, G.C.; Zhang, N.Y. Fatty acid composition of Camellia oleifera, oil. J. Verbrauch. Lebensm. 2011, 6, 9–12. [Google Scholar] [CrossRef]
  4. Xia, E.H.; Jiang, J.J.; Huang, H.; Zhang, L.P.; Zhang, H.B.; Gao, L.Z. Transcriptome analysis of the oil-rich tea plant, Camellia oleifera, reveals candidate genes related to lipid metabolism. PLoS ONE 2014, 9, e104150. [Google Scholar] [CrossRef] [PubMed]
  5. Lee, C.P.; Yen, G.C. Antioxidant activity and bioactive compounds of tea seed (Camellia oleifera Abel.) oil. J. Agric. Food Chem. 2006, 54, 779–784. [Google Scholar] [CrossRef] [PubMed]
  6. Cheng, Y.T.; Wu, S.L.; Ho, C.Y.; Huang, S.M.; Cheng, C.L.; Yen, G.C. Beneficial effects of camellia oil (Camellia oleifera Abel.) on ketoprofen-induced gastrointestinal mucosal damage through upregulation of HO-1 and VEGF. J. Agric. Food Chem. 2014, 62, 642–650. [Google Scholar] [CrossRef] [PubMed]
  7. Ye, Y.; Xing, H.T.; Li, Y. Nanoencapsulation of the sasanquasaponin from Camellia oleifera, its photo responsiveness and neuroprotective effects. Int. J. Nanomed. 2014, 9, 4475–4484. [Google Scholar] [CrossRef] [PubMed]
  8. Zhang, X.F.; Yang, S.L.; Han, Y.Y.; Zhao, L.; Lu, G.L.; Xia, T.; Gao, L.P. Qualitative and quantitative analysis of triterpene saponins from tea seed pomace (Camellia oleifera Abel.) and their activities against bacteria and fungi. Molecules 2014, 19, 7568–7580. [Google Scholar] [CrossRef] [PubMed]
  9. Hu, J.J.; Wu, W.; Cao, Z.H.; Shu, Q.L.; Fu, S.L. Morphological, physiological and biochemical responses of Camellia oleifera to low-temperature stress. Pak. J. Bot. 2016, 48, 899–905. [Google Scholar]
  10. Cui, X.Y.; Wang, W.J.; Yang, X.Q.; Li, X.; Qin, S.Y. Potential distribution of wild Camellia oleifera based on ecological niche modeling. Biodivers. Sci. 2016, 24, 1117–1128. (In Chinese) [Google Scholar] [CrossRef]
  11. Chen, Y.Z. Oil Tea Camellia Superior Germplasm Resources; China Forestry Publishing House: Beijing, China, 2008; pp. 14–15. (In Chinese) [Google Scholar]
  12. Liu, J.; Wu, L.C.; Chen, D.; Li, M.; Wei, C.J. Soil quality assessment of different Camellia oleifera, stands in mid-subtropical China. Appl. Soil Ecol. 2017, 113, 29–35. [Google Scholar] [CrossRef]
  13. Clever, J. China: Oilseeds and Products Annual. United States Department of Agriculture Foreign Agriculture Service. Available online: https://www.fas.usda.gov/data/china-oilseeds-and-products-annual-1 (accessed on 1 June 2018).
  14. Elith, J.; Graham, C.H.; Anderson, R.P.; Dudik, M.; Ferrier, S.; Guisan, A.; Hijmans, R.J.; Huettmann, F.; Leathwick, J.R.; Lehmann, A.; et al. Novel methods improve prediction of species’ distributions from occurrence data. Ecography 2006, 29, 129–151. [Google Scholar] [CrossRef] [Green Version]
  15. Pearson, R.G.; Raxworthy, C.J.; Nakamura, M.; Peterson, A.T. Original article: Predicting species distributions from small numbers of occurrence records: A test case using cryptic geckos in Madagascar. J. Biogeogr. 2007, 34, 102–117. [Google Scholar] [CrossRef]
  16. Hernandez, P.A.; Franke, I.; Herzog, S.K.; Pacheco, V.; Paniagua, L.; Quintana, H.L.; Soto, A.; Swenson, J.J.; Tovar, C.; Valqui, T.H.; et al. Predicting species distributions in poorly-studied landscapes. Biodivers. Conserv. 2008, 17, 1353–1366. [Google Scholar] [CrossRef]
  17. Townsend Peterson, A.; Papeş, M.; Eaton, M. Transferability and model evaluation in ecological niche modeling: A comparison of GARP and Maxent. Ecography 2017, 30, 550–560. [Google Scholar] [CrossRef]
  18. Remya, K.; Ramachandran, A.; Jayakumar, S. Predicting the current and future suitable habitat distribution of Myristica dactyloides Gaertn. using MaxEnt model in the Eastern Ghats, India. Ecol Eng. 2015, 82, 184–188. [Google Scholar] [CrossRef]
  19. Wang, Y.S.; Xie, B.Y.; Wan, F.H.; Xiao, Q.M.; Dai, L.Y. The potential geographic distribution of Radopholus similis in China. Agric. Sci. China 2007, 6, 1444–1449. [Google Scholar] [CrossRef]
  20. Liu, J.; Wu, L.C.; Chen, D.; Yu, Z.G.; Wei, C.J. Development of a soil quality index for Camellia oleifera forestland yield under three different parent materials in Southern China. Soil Till. Res. 2018, 176, 45–50. [Google Scholar] [CrossRef]
  21. Andrews, S.S.; Karlen, D.L.; Mitchell, J.P. A comparison of soil quality indexing methods for vegetable production systems in Northern California. Agric. Ecosyst. Environ. 2002, 90, 25–45. [Google Scholar] [CrossRef]
  22. Ngo-Mbogba, M.; Yemefack, M.; Nyeck, B. Assessing soil quality under different land cover types within shifting agriculture in South Cameroon. Soil Till. Res. 2015, 150, 124–131. [Google Scholar] [CrossRef]
  23. Imaz, M.J.; Virto, I.; Bescansa, P.; Enrique, A.; Fernandez-Ugalde, O.; Karlen, D.L. Soil quality indicator response to tillage and residue management on semi-arid mediterranean cropland. Soil Till. Res. 2010, 107, 17–25. [Google Scholar] [CrossRef]
  24. Nortcliff, S. Standardisation of soil quality attributes. Agric. Ecosyst. Environ. 2002, 88, 161–168. [Google Scholar] [CrossRef] [Green Version]
  25. Babar, S.; Amarnath, G.; Reddy, C.S.; Jentsch, A.; Sudhakar, S. Species distribution models: ecological explanation and prediction of an endemic and endangered plant species (Pterocarpus santalinus L.f.). Curr. Sci. 2012, 102, 1157–1165. [Google Scholar]
  26. Zhu, G.P.; Liu, Q.A.; Gao, Y.B. Improving ecological niche model transferability to predict the potential distribution of invasive exotic species. Biodivers. Sci. 2014, 22, 223–230. [Google Scholar]
  27. Zhuang, R.L. Oil-tea Camellia in China, 2nd ed.; China Forestry Publishing House: Beijing, China, 2012; pp. 42–78. (In Chinese) [Google Scholar]
  28. Hu, X.; Wu, F.C.; Guo, W.; Liu, N. Identification of potential cultivation region for Santalum album in China by the MaxEnt ecologic niche model. Sci. Silvae Sinicae 2014, 50, 27–33. (In Chinese) [Google Scholar]
  29. Yin, X.J.; Zhou, G.S.; Sui, X.H.; He, Q.J.; Li, R.P. Potential geographical distribution of Quercus wutaishanica forest and its dominant factors. Sci. Silvae Sinicae 2013, 49, 10–14. (In Chinese) [Google Scholar]
  30. State Forestry Bureau. The Planning of National Camellia oleifera Industry Development. 2009. Available online: http://wenku.baidu.com/view/a386ccc10c22590102029d8d.html (accessed on 2 July 2018).
  31. Zheng, D.J.; Pan, X.Z.; Zhang, D.M.; Xie, L.S.; Zeng, J.H.; Zhang, Z.L.; Ye, H. Survey and analysis on tea-oil Camellia resource in Hainan. J. Northwest For. Univ. 2016, 1, 130–135. (In Chinese) [Google Scholar]
  32. Fang, J.P. A Study of Structure and Functions in a Primary Picea likiangensis var. linzhiensis Forest Ecosystem in Tibet. Ph.D. Thesis, Central South University of Forestry and Technology, Changsha, China, 2010. (In Chinese). [Google Scholar]
  33. Sessa, J.; Syed, D. Techniques to deal with missing data. In Proceedings of the International Conference on Electronic Devices, Systems and Applications, Busan, Korea, 8 December 2016. [Google Scholar]
Figure 1. The potential geographical distribution of oil tea Camellia in China using the maximum entropy species distribution modeling (MaxEnt).
Forests 09 00487 g001
Figure 2. Evaluation of model and the importance of variables. (a) Roc of MaxEnt modelling; (b) Jackknife test for variable importance of oil tea Camellia habitat suitability distribution.
Forests 09 00487 g002
Figure 3. The numerical distribution range of each soil indicators.
Forests 09 00487 g003
Figure 4. Factor analysis of soil conditions. (a) Eigenvalues of principal factors; (b) Coefficient of factor loading.
Forests 09 00487 g004
Figure 5. Description of the missing data. (a) Histogram of missing data; (b) pattern and proportion of missing data.
Forests 09 00487 g005
Figure 6. Comparison of interpolated data and missing data.
Forests 09 00487 g006
Table 1. Indicators of bioclime data.
FieldDescriptionFieldDescription
AMTAnnual Mean TemperatureMTCQMean Temperature of Coldest Quarter
MDRMean Diurnal RangeAPAnnual Precipitation
ISOIsothermalityPWMPrecipitation of Wettest Month
TSTemperature SeasonalityPDMPrecipitation of Driest Month
MTWMMax Temperature of Warmest MonthPSPrecipitation Seasonality
MTCMMin Temperature of Coldest MonthPWQPrecipitation of Wettest Quarter
TARTemperature Annual RangePDQPrecipitation of Driest Quarter
MTWQMean Temperature of Wettest QuarterPWAQPrecipitation of Warmest Quarter
MTDQMean Temperature of Driest QuarterPCQPrecipitation of Coldest Quarter
MTWAQMean Temperature of Warmest Quarter
Table 2. Indicators of soil data.
FieldDescriptionFieldDescription
issoilSoil or non-soil unitt-caco3Topsoil Calcium Carbonate
sharpShare in Soil Mapping Unitt-caso4Topsoil Gypsum
ref-depthReference Soil Deptht-espTopsoil Sodicity (ESP)
drainageDrainage classt-eceTopsoil Salinity (Elco)
awc-classAWC Ranges-gravelSubsoil Gravel Content
seqSequences-sandSubsoil Sand Fraction
phase1PHASE1s-siltSubsoil Silt Fraction
phase2PHASE2s-claySubsoil Clay Fraction
add-propOther properties (gelic, vertic, petric)s-ocSubsoil Organic Carbon
t-gravelTopsoil Gravel Contents-ph-h2oSubsoil pH (H2O)
t-sandTopsoil Sand Fractions-cec-claySubsoil CEC (clay)
t-siltTopsoil Silt Fractions-cec-soilSubsoil CEC (soil)
t-clayTopsoil Clay Fractions-bsSubsoil Base Saturation
t-ocTopsoil Organic Carbons-tebSubsoil TEB
t-ph-h2oTopsoil pH (H2O)s-caco3Subsoil Calcium Carbonate
t-cec-clayTopsoil CEC (clay)s-caso4Subsoil Gypsum
t-cec-soilTopsoil CEC (soil)s-espSubsoil Sodicity (ESP)
t-bsTopsoil Base Saturations-eceSubsoil Salinity (Elco)
t-tebTopsoil TEB

