Qualitative Assessment of Forest Ecosystem Services: The Stakeholders’ Point of View in Support of Landscape Planning


1
CREA, Research Centre for Agriculture and Environment, 50125 Firenze, Italy
2
Department of Civil, Environmental and Mechanical Engineering, University of Trento, 38123 Trento, Italy
3
CREA, Research Centre for Forestry and Wood, 52100 Arezzo, Italy
*
Author to whom correspondence should be addressed.
Forests 2018, 9(8), 465; https://doi.org/10.3390/f9080465
Submission received: 4 July 2018
/
Revised: 24 July 2018
/
Accepted: 30 July 2018
/
Published: 1 August 2018
(This article belongs to the Special Issue Participatory Forestry: Involvement, Information and Science)
Abstract
:In the last decades, the ecosystem services (ES) concept has become one of the main challenges of study and discussion in the scientific community. The quantitative and qualitative assessment of ES is as a tool to address forest management planning on a local scale. Forest landscape management planning is the most suitable level for integrating social needs and demands in the enhancement of different forest ES. Some regions in Italy have developed forest landscape management plans taking into account the social preferences for the different ES. In this paper, we refer to five case studies in three pilot areas in Italy. A survey collected and analyzed the opinions and preferences, from 362 stakeholders, for ten ES included in three categories (provisioning, regulating and cultural services). The main aim of this study is to understand what type of variables (study area, the groups of interest and socio-demographic characteristics of respondents) most influence stakeholder preferences for ES. The results show that for the sample of stakeholders involved in the survey, the most important ES category is regulating services followed by cultural services. In addition, the results show that the group of stakeholders’ interest is the most important variable influencing their preferences for ES.
1. Introduction
Following the United Nations Conference on the Human Environment held in Stockholm in 1972, the scientific community started to focus on the importance of the benefits provided by natural ecosystems for human society [1]. At that time, a growing number of authors stressed the role of natural ecosystems for human well-being in order to increase society’s interest in biodiversity conservation. This utilitarian approach aimed at improving policy decisions and was mainly focused on raising public interest in biodiversity conservation, highlighting the fact that loss of biodiversity directly affects benefits provided by natural ecosystems to society [2,3,4].
About two decades later, the concept of ecosystem services (ES) was definitively and firmly placed into the policy agenda by the Millennium Ecosystem Assessment (MEA) [5]. The MEA [5] defines ecosystem services as “the benefits people obtain from ecosystems”, focusing on human dependency on ecosystem services and on the importance of biodiversity and ecological processes for human well-being [6,7]. MEA classified ecosystem services into four categories: (1) Provisioning, (2) regulating, (3) cultural, and (4) supporting services. The first three categories directly affect people and human well-being, whereas supporting services are the underlying ecosystem processes that maintain the others [8,9].
The Economics of Ecosystems and Biodiversity (TEEB) classification [10] substituted supporting services with habitat services, which include lifecycle maintenance and gene pool protection. Subsequently, ES have been reclassified into three categories (provisioning, regulating and maintaining, cultural), adopting the Common International Classification of Ecosystem Services (CICES) [11]. The CICES classification is widely used when ecosystems and economic accounts have to be linked, and is useful when the outputs of ecosystems have to be turned into benefits for human well-being. Moreover, the CICES classification is able to overcome ‘double counting’ problems in valuation studies [11], and it can be considered a suitable approach for integrating ES into analytical models that support landscape planning [12].
Many other definitions and classifications of ES have also since been provided with the aim of integrating the concept or to analyze it from a different point of view [13,14].
With regard to the forest sector, forests generate a variety of important ES for human well-being, such as timber and non-timber forest products among provisioning services; water regulation, protection from natural hazards and carbon sequestration among regulating services; and, scenic beauty and recreation opportunities among cultural services [15,16].
In order to maintain and improve the ES available from natural, semi-natural or planted forests, the assessment of the ES provided by forests at different spatial and temporal scales is required. These data are fundamental in order to define priorities and forest management strategies. In the literature, there are two main approaches aimed to assess the ES [17,18,19]: The first approach is based on a quantitative assessment of ES provided by forests through field measurements of biophysical outcomes; the second approach is based on a qualitative assessment of ES using expert or stakeholders’ opinions [20]. In some studies, the biophysical assessment of ES is integrated with a monetary evaluation in order to provide policy makers with information and to facilitate communication with public opinion and citizens [21].
Recently, policy makers have also emphasized the importance of forest ES at local and global levels, taking into account the documents and prescriptions provided by the scientific community in the previous period. In 2013, the European Commission (EC) in “A new EU Forest Strategy: For forests and the forest-based sector” included in the main social objectives of Sustainable Forest Management (SFM), the protection of forest ecosystems in order to maintain and improve the ES. This new EU Forest Strategy considers forest management plans as the main instrument for implementing the principles of SFM and increasing the supply of multiple forest ES.
In “European Forests 2020”—elaborated during the 6th Ministerial Conference on the Protection of Forests in Europe (MCPFE) held in Oslo in 2011—the role of ES provided by European forests is repeatedly emphasized. The first two goals of “European Forests 2020” are focused on sustainable management of European forests to enhance lasting provision of goods and services and on their role in contributing to a green economy, including increased provision of timber, other forest products and ecosystem services from sustainable sources. Subsequently, the Madrid Ministerial Resolution 1 (MCPFE, Madrid, 20–21 October 2015) emphasizes the importance of promoting a forest sector and its related value chain that provides society with increasing opportunities for green jobs, which ideally should be connected to the management and use of forests, and to environmentally friendly production processes, based on goods and services from sustainably managed forests. The regulations of European policy makers have been implemented in Italy in two main political documents: The new Italian Forest Law (Testo Unico per le Foreste 2018) and the Italian Bio-economy Strategy (2017). Recently, the Action Plan of the Italian Bio-economy Strategy considers as a priority moving from the existing economy to a sustainable bio-economy valorizing the provision of ES [22].
The new Italian Forest Law emphasizes the importance of protecting the forest by promoting actions to prevent natural and anthropogenic risks, to contrast biotic and abiotic adversities, and to assure hydrogeological and forest fire protection, adaptation to climate change, recovery of degraded or damaged areas, carbon sequestration and the provision of other ES generated by SFM. In addition, the regions can promote systems for the Payment for Ecosystem Services (PES) generated by SFM activities [23].
Despite the huge literature on ES and all the applications at the policy level, there is still a lack of research and knowledge in how to integrate the concept of ES in planning and management and especially at the level of decision making [6,24,25,26,27]. Various studies contribute to the integration of the concept of ES into landscape scale planning and provide information about the spatial distribution of ES and their value. These studies help to improve the understanding of the effect of planning decisions on ES and to avoid resulting trade-offs when planning focuses on only one ES at time [28], and has proved useful when decision-making processes are concerned with environmental matters at a regional level [6,29,30,31].
Regarding the forest sector, it is important to define the proper scale when considering the relationship between forest planning and ES assessment. The Forest Unit Management Plan (FUMP), which refers to a forest area managed on a medium/short-term basis, takes into consideration the technical and managerial aspects of each individual forest ownership [32]. When considering ES provision, the fact of focusing on individual forest ownership can lead to trade-offs or cause the undervaluation of synergies between ES, because ES transcend borders between different ownerships [33,34,35]. The need for taking into account the multiple ES in forest planning has led to a profound revision of Italian forest planning [32,36,37,38] and a hierarchical approach has been consolidated, which moves from a detailed level of planning (FUMP) to a medium scale. At medium scale, the Forest Landscape Management Plan (FLMP) has been introduced. The FLMP has the main scope of providing management guidelines for the subordinate FUMP, and integrating and coordinating with other types of plans [32,37,39,40,41].
FLMP is based on the principles of SFM and public participation, and this scale is the most suitable for taking into account ES assessment issues and for developing management guidelines that consider the sustainability of the relationship between the local community and nearby forests [42,43,44,45,46]. However, while implementing FLMPs, concerns are being raised as to how to consider stakeholders’ preferences. Indeed, various groups of stakeholders have different needs and social demands concerning the various forest ES that must be included in the objectives and actions of the FLMP [32,47].
Starting from these preliminary considerations, the main aim of this study was to analyze stakeholders’ opinions and preferences for different categories of forest ES. The secondary objective was to identify which variables influence the stakeholders’ point of view in the qualitative evaluation of forest ES. The study was applied in three pilot areas in Central and Southern Italy (Matese, Arci-Grighine and Alto Agri forest districts) where we identified five case studies characterized by marked differences from an environmental, socio-economic and cultural point of view.
2. Materials and Methods
2.1. Study Areas
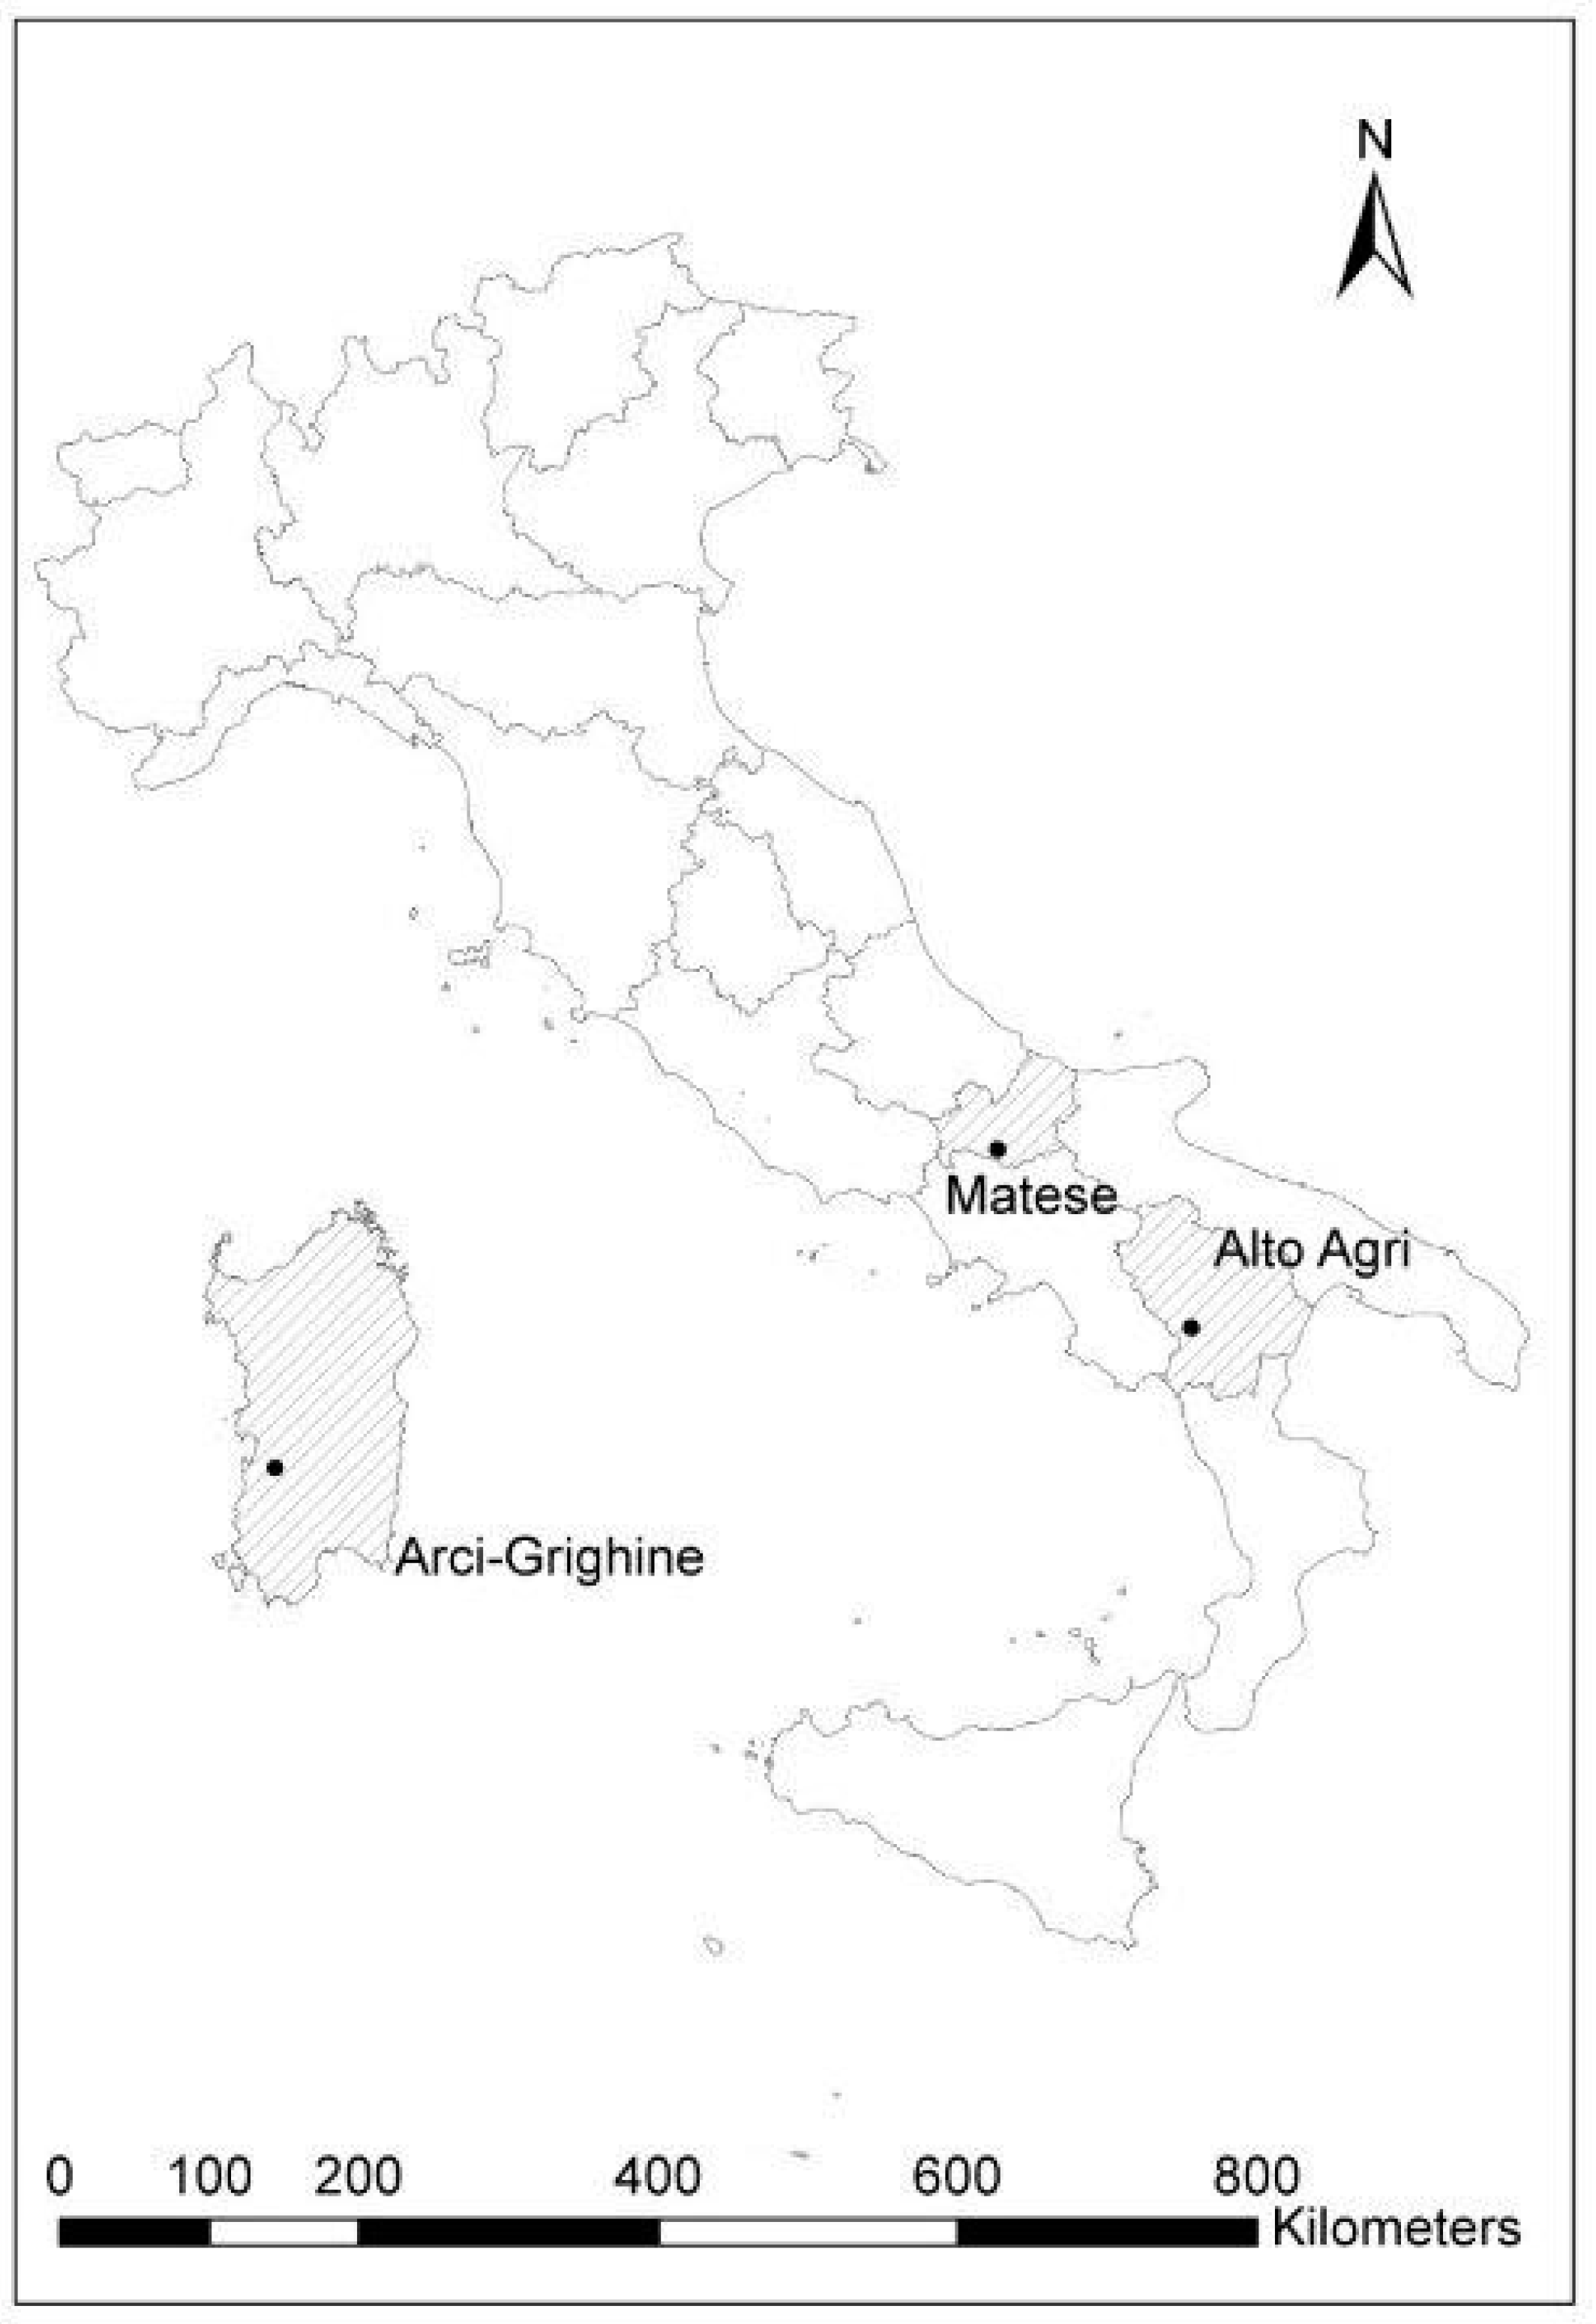
The research was developed in three pilot areas where FLMPs were carried out. They are located in three Italian regions (Molise, Sardinia and Basilicata), which are rural areas with similar socio-economic features but different ecological characteristics [32] (Figure 1).
From a geographic point of view, the Matese district (41°29′12″ N, 14°28′26″ E), located in central Italy, in the Molise region, covers about 365 km2. It has a population of 21,022 inhabitants and a density of 58 inhabitants per km2. The Arci-Grighine district (39°42′7″ N, 8°42′4″ E), located in the central-eastern area of the island of Sardinia, covers a land area of 552 km2. It has a population of 26,207, with a density of about 47 inhabitants per km2. The Alto Agri district (40°20′25″ N, 15°53′52″ E) is located in southern Italy (Basilicata region) and occupies a land area of 726 km2, with a resident population of 33,739 inhabitants (a population density of 46.5 inhabitants per km2). The pilot areas are characterized by very low population densities compared to the national situation (201 inhabitants per km2), the result of slowly declining populations, which started in the 1950s and has continued to present times, driven by mass unemployment and, in the 1990s, by young adults moving away from rural areas to find work elsewhere [48,49].
The forest surface covers 44.1% of the territory in the Matese district, 51.2% in Arci-Grighine and 58.4% in Alto Agri. Other main land uses are agriculture and grazing. Regarding ownership, most of the forests are privately owned in the Matese and Alto Agri districts (66% and 73%, respectively). In Arci-Grighine, privately owned forests comprise approximately 34%; there is an important percentage of common forests (53%), whereas the remaining 13% are public forests. These differences in ownership have important effects on forest management strategies [32,40].
In the Matese and Alto Agri districts, the main forest types are Turkey oak (Quercus cerris L.) and European beech (Fagus sylvatica L.) forests, mainly coppices. Other forest types are mixed broadleaved formations and both evergreen and broadleaved plantations [40,50]. In these districts, forests are characterized by a high level of multifunctionality. Conversely, Arci-Grighine is characterized by a high vocation in terms of non-timber forest products (cork and myrtle). In this district, the major forest types are Mediterranean forests (Ericoarboreae-Arbutetumunedonis and Pistaciolentisci-Calicotometumvillosae associations) and evergreen forests with holm oak (Quercus ilex L.) and cork oak (Quercus suber L.).
The agricultural sector plays an essential role in the economic structure of the three districts; conversely, the industrial sector is, in general, weak, and the infrastructure is poor [51].
In Alto Agri, 66% of the study area is located in protected areas (part in a national park and part in the Natura 2000 sites, which partially overlap) [40,52]. For this reason, we decided to consider two different case studies within the Alto Agri district. In fact, the sector which does not fall into protected areas has to deal with the economic and management problems typical of rural areas, while the national park is faced mainly with nature conservation and recreation issues. For different reasons we also considered separately data concerning Arci and Grighine, within the Sardinian district. Actually, Grighine has an agricultural connotation and a vocation for agri-forestry activities, in particular cork production, whereas Arci is characterized by a forested landscape and, more importantly, forestry activities.
2.2. Survey Methodology
The survey in the three FLMPs was conducted by means of a two-stage approach. Such an approach was based on a preliminary stakeholder analysis followed by the investigation of stakeholders’ opinions and preferences through the administration of questionnaires.
In the FLMPs, a three-step model of stakeholder analysis was adopted [32] to identify the key stakeholders, their roles and their relationships. This approach is based on an iterative process: In the first step, some stakeholders are identified based on information from institutional actors and experts, and then, in the second step, based on the indications of this first group, also previously unknown stakeholders are identified. In the third step, after being identified, the stakeholders are categorized not only on the basis of their power (the ability of a stakeholder in a relationship to exert influence on another stakeholder in order to obtain the expected outcomes), but also considering their proximity to the issues and interests at stake, and their capacity to control information and to influence the decision-making process. The result of this step is a classification into three types of stakeholders [32,53]: (a) Key stakeholders—the main actors in terms of social role and power, and actively involved in the decision process; (b) primary stakeholders—the beneficiaries of the FLMP, only partly involved in the decision process; and, (c) secondary stakeholders—the public at large, marginally involved in the issue but constantly kept informed. In each study area, approximately 20% of total stakeholders were classified as key stakeholders, 30% as primary stakeholders, and the remaining 50% as secondary stakeholders. Key and primary stakeholders were involved in the present survey (FLMPs consultation), while secondary stakeholders were simply informed about the planning process.
In the present survey, 380 stakeholders were identified as key and primary stakeholders in the three study areas. The non-response rate was equal to 5%, mainly concentrated in the Matese district. Ultimately, 362 stakeholders completed the questionnaire. The distribution of the sample by study area is as follows: 39 stakeholders in the Matese district (Molise); 212 stakeholders in the Alto Agri district (Basilicata); and, 111 stakeholders in the Arci-Grighine district (Sardinia).
In addition, four groups of interest were identified: (i) Public administrations (i.e., regions, provinces, municipalities or other public agencies); (ii) actors of the forestry industry (private forest owners, forest enterprises, and sawmills); (iii) representatives of environmental Non-Governmental Organizations (NGOs); and, (iv) actors of the tourism sector (i.e., tourism promotion bodies and hotel owners). The group of environmental NGOs includes a broad range of associations with different aims such as the World Wide Fund for Nature (WWF), Legambiente and Greenpeace, but also small local associations with restricted and specific objectives. With regard to the distribution of the stakeholders by groups of interest, 168 are representatives of public administrations, 131 are actors of the forestry industry, 44 are actors of the tourism sector and the remaining 19 are representatives of environmental NGOs.
The differences in the number of stakeholders and their distribution in the case studies are due in part to the different extension of the areas, in part to the specific socio-economic features and in part to the diversity of forest contexts, in particular concerning the different relevance of forest resources among the study areas. Matese is the smallest study area (36,500 ha) and has a limited number of stakeholders with regard to the other areas. The number of stakeholders is the highest in Alto Agri, which has an area twice that of Arci-Grighine.
During the development of FLMPs, the stakeholders were firstly contacted by telephone to set up a location and a time for a face-to-face interview based on a semi-structured questionnaire. Before conducting the interview, informed consent was obtained. Consenting stakeholders participated in this interview, which lasted an average of 30 min to 90 min.
The final version of the questionnaire was produced after a test phase on a sample of stakeholders used to verify question effectiveness, clarity of the language and completeness of the information required; then, the final questionnaire was administered through personal interviews with the 362 stakeholders. As generally reported in questionnaire-type approaches, the questionnaire was divided into thematic sections in order to maintain a high level of attention in the interviewees [54].
During the interviews, respondents were given the opportunity to expand the conversation and besides ticking the given answer, there was discussion and exchange of information. The time for discussion was also important in order to support some respondents who found the significance of some concepts or technical words difficult to understand.
The questionnaires were firstly used to investigate individual preferences attributed by stakeholders to forest ES. They were also used to consider other aspects of the social perception of forests, which could be usefully employed to support decision making in forest planning and to define the priority actions of the FLMP.
In the present study, we have analyzed data from the section of the questionnaire regarding the forest ES and the main forest goods and services. Indeed, the main objective of the study was to determine stakeholders’ preferences for ES so that forest management priorities—in terms of forest ES—can be aligned based on the values expressed by respondents from different study areas or groups of stakeholders. Respondents were asked questions about the importance of the various ES. They had to express their opinion about the importance of each ecosystem service, on a five-point Likert scale format, ranging from 0 = “very low importance” to 4 = “very high importance”. The forest ES considered were: Timber production, fuelwood production, grazing and non-timber forest products (NTFP) for the provisioning services; natural hazard protection, water and air quality, and nature conservation for the regulating services; and, hunting, sporting and tourism recreation for the cultural services. The attribution of the ES to the different categories follows the main internationally acknowledged classifications. With regard to hunting, according to Balkan and Kahn (1988) [55], Forster (1989) [56], and Bissell et al. (1998) [57], hunting was considered a cultural service, while the products obtained by hunting (i.e., meat, trophy and skin) that are provisioning services have not been considered.
2.3. Data Processing
The survey responses were analyzed statistically with respect to the following variables: Study area, group of interest, and socio-demographic characteristics of respondents (gender, age and level of education). The main descriptive statistics (mean, standard deviation, min. and max.) were provided for all ES and the chi-square (χ2) test–using the standard α = 0.01 cutoff—was used to test the differences between the groups of respondents based on the above-mentioned variables. All statistical analyses were carried out using R software (R version 3.4.4—“Someone to Lean On” Copyright ©2018 The R Foundation for Statistical Computing; R Studio Version 1.1.442—©2009–2018 RStudio, Inc., Vienna, Austria).
3. Results
The socio-demographic characteristics of the sample show that the majority of respondents are males (91.4%), whereas only 8.6% are females. With regard to age, the results show that the majority of the respondents are between 35 and 55 years old (67.7%), while the distribution of respondents in other age groups are the following: 9.9% of respondents are less than 35 years old, 19.1% are between 55 and 65 years old and the remaining 3.3% are more than 65 years old. Concerning the level of education, the respondents with a high school qualification comprise 43.4%, while the respondents with a university and post-university degree comprise 28.2%. The remaining 28.5% are respondents with an elementary school certificate.
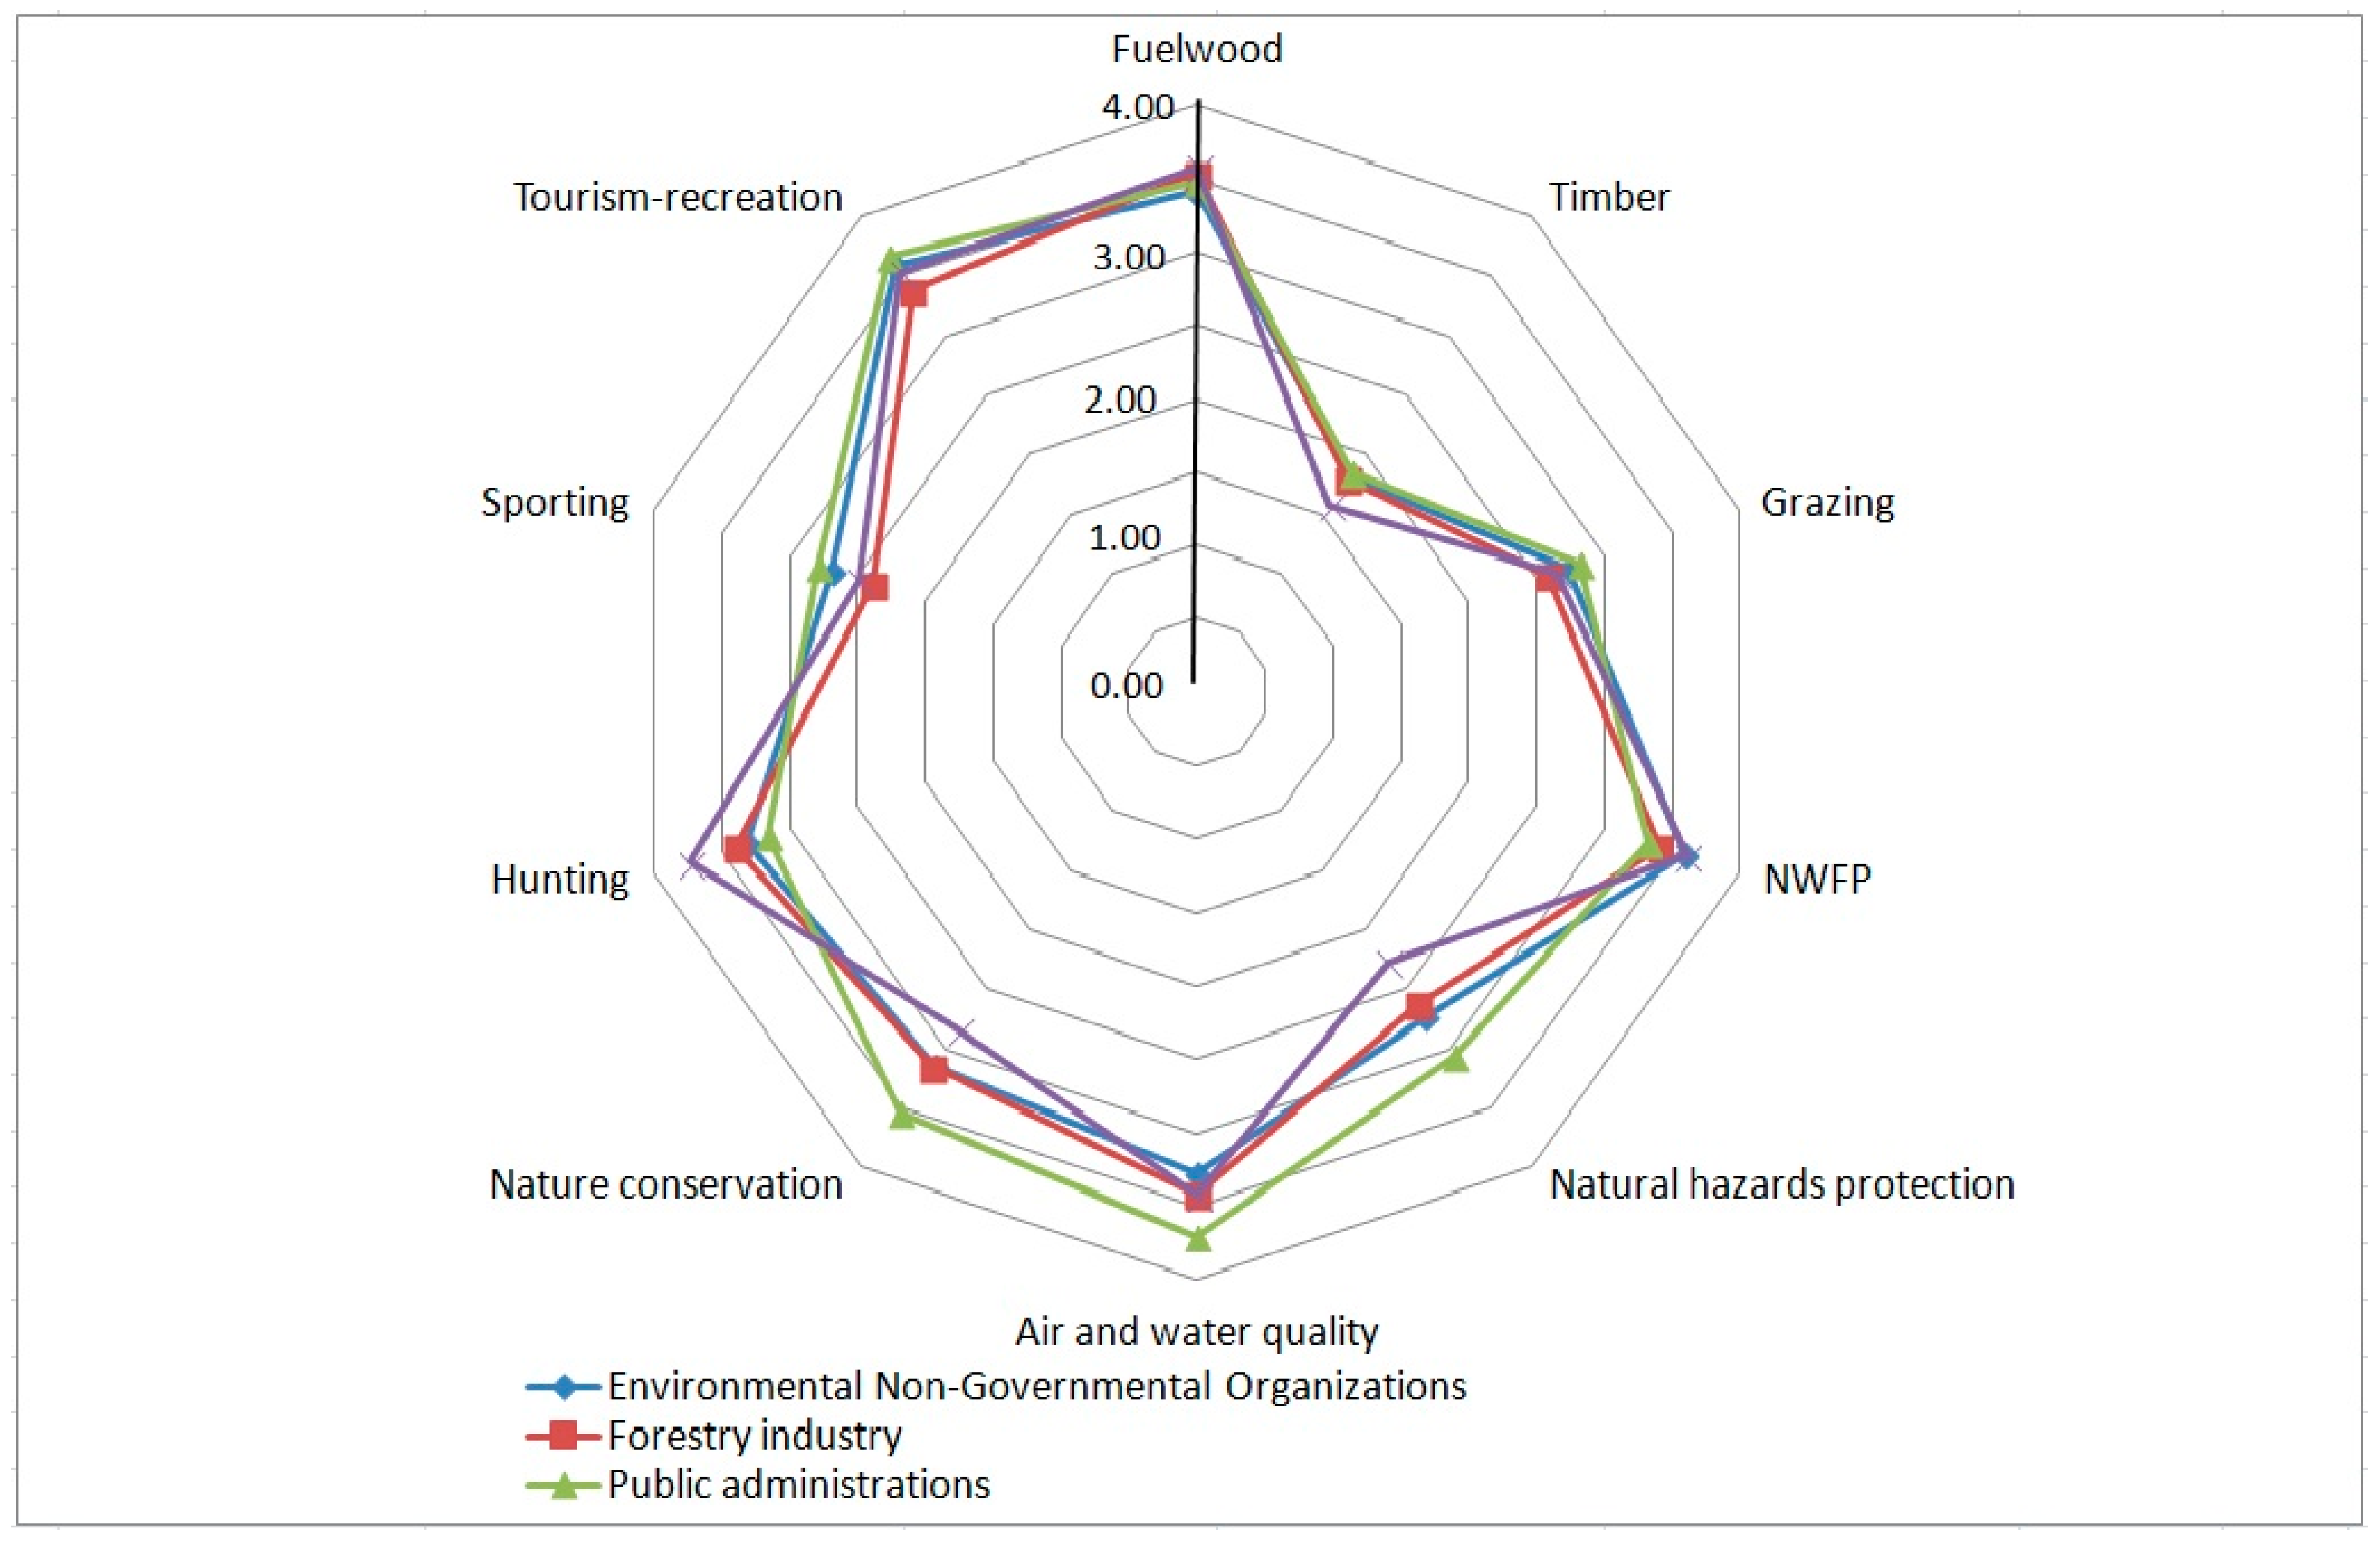
The results show that for our sample of stakeholders the three most important ES are: Air and water quality (mean value = 3.54), tourism/recreation (mean value = 3.54) and fuelwood production (mean value = 3.52). Conversely, timber production has a marginal role for the stakeholders involved in the survey (mean value = 1.80) (Figure 2). Such a result is strictly related to the forest stand characteristics (mainly coppices) and potential wood assortments (mainly poles or woodchips) of the five case studies involved in the survey.
The ranking of importance for the three ES categories assigned by stakeholders was the following: Regulating services (mean value = 3.21) > cultural services (mean value = 3.16) > provisioning services (mean value = 2.85).
Below we illustrate the results of the analysis carried out in order to understand the influence of the different variables on stakeholders’ preferences.
3.1. Study Areas
As we highlighted in Section 2, for two of the three pilot areas (Alto Agri and Arci-Grighine districts), we analyzed the data keeping separate the two different case studies for each pilot area. Concerning the Alto Agri district, we distinguished Alto Agri (with 113 stakeholders) and the National Park Apennines Lucano-Val d’Agri-Lagonegrese (with 99 stakeholders). Concerning the Arci-Grighine district, we considered separately Arci (with 72 stakeholders) and Grighine (with 39 stakeholders).
The results show that the ranking of importance for ES changes from case study to case study. Hunting is considered the most important ES in two cases (Arci and Grighine), fuelwood production in one case (Matese), air and water quality in one case (National Park Apennines Lucano-Val d’Agri-Lagonegrese), and NTFPs in another case (Alto Agri) (Table 1).
NTFPs are considered important not only in Alto Agri but also in two other cases (Arci and Grighine in the region of Sardinia). However, it is interesting to note that in Alto Agri the main NTFPs are mushrooms and black truffles, while in Arci and Grighine the most important NTFPs are the cork extracted from cork oak (Quercus suber L.) and the myrtle fruit (Myrtus communis L.) used for the preparation of a local liqueur.
Tourism-recreation activities are of particular importance in the protected area of the National Park Lucano-Val d’Agri-Lagonegrese (third position in the ranking with a mean value of 3.77) and in the two Sardinian cases.
In accordance with the characteristics and peculiarities of the study area, the stakeholders of the National Park Lucano-Val d’Agri-Lagonegrese emphasize the role of this protected area for nature conservation (second position in the ranking of importance). Also, in the Matese district, the stakeholders highlight the relevance of nature conservation. Such a result is probably due to the fact that in this territory there are six areas falling into the Natura 2000 network. This, over time, has increased sensitivity, at least in some local actors, towards issues of nature conservation.
Observing the results by ES category (Table 2), in three case studies (Alto Agri, Arci and Grighine) the most important ES category is cultural services with 3.00, 3.56 and 3.40, respectively, as mean values. Conversely, in the National Park Apennines Lucano-Val d’Agri-Lagonegrese and in the Matese district, the stakeholders consider regulating services as a more important ES category (with mean values of 3.79 and 3.50, respectively).
The chi-square test shows no statistically significant differences for all ES categories. Despite this, it is highlighted that in Grighine and Alto Agri the regulating services category has less importance than in the other three case studies (National Park Apennines Lucano-Val d’Agri-Lagonegrese, Arci and Matese).
3.2. Groups of Interest
The results show that two groups of interest (actors of the forestry industry and actors of the tourism sector) have a similar order of priorities in the ranking of importance for the ES. The three most important ES for these two groups of interest are the following (Table 3): Hunting (ranked first by actors of the tourism sector and ranked third by actors of the forestry industry); NTFP (placed in third position by actors of the forestry industry and in second position by actors of the tourism sector); and, fuelwood (in first position for actors of the forestry industry and third position for actors of the tourism sector). The only substantial difference is that actors of the forestry industry emphasize the importance of air and water quality, while for the actors of the tourism sector this ES is only in fifth position.
The representatives of environmental NGOs emphasize the relevance of fuelwood production and NTFP, but they consider tourism-recreation in forests in first position in the ranking of importance, with a mean value of 3.59.
For the representatives of public administrations, the three most important forest ES are air and water quality (first position with a mean value of 3.71), tourism-recreation in forests (second position with a mean value of 3.67), and nature conservation (third position with a mean value of 3.53). This ES ranking should not be surprising if we consider that public administration has as its objective the valorization of common goods such as environmental externalities. Consequently, the productive aspects with positive effects in the private sphere—e.g., timber and fuelwood production, NTFP—have a secondary importance for public administrations.
Observing data by ES categories (Table 4), the results show that for public administrations the most important category of ES is regulating services (mean value = 3.44), emphasizing the importance of nature conservation and the quality of air and water. This fact is presumably due to the public administrations’ aim to pursue the well-being of their community; consequently, the valorization of the air, water and environment quality is a point of strategic importance. For the other three groups of interest (environmental NGOs, actors of the forestry industry and actors of the tourism sector) the most important category of ES is cultural services, with mean values of 3.20, 3.06 and 3.25, respectively. It is interesting to highlight that the high value assigned to cultural services is due to different preferences for single ES by group of interest: Actors of forestry industry and tourism emphasize the importance of hunting, while the representatives of environmental NGOs and public administrations assign a high importance to tourism-recreation. In addition, all groups of interest, apart from the actors of the tourism sector, consider provisioning services as the least important ES category with the following mean values: 2.89 for the environmental NGOs, 2.83 for the actors of the forestry industry, 2.87 for the public administrations.
The chi-square test shows statistically significant differences for the following ES categories: Regulating services for representatives of actors of the tourism sector (p-value = 0.0080) and cultural services always for actors of the tourism sector (p-value < 0.00004).
3.3. Socio-Demographic Characteristics of Respondents
The results show that socio-demographic characteristics of respondents have an influence on preferences for some ES with special regard to two ES categories (Table 5 and Table 6): Regulating services and cultural services.
With regard to age, it is interesting to highlight that for one ES (i.e., hunting) the level of importance increases with the age of respondents (from respondents who are less than 45 years old to respondents more than 65 years old: 3.24 < 3.27 < 3.39 < 3.75). In addition, respondents over 65 consider cultural services more important than respondents under 65 (mean values of 3.25 and 3.50, respectively); conversely, respondents below 65 assign a higher value to regulating services than respondents above 65 (mean values of 3.25 and 2.89, respectively).
The chi-square test shows a statistically significant difference for regulating services regarding respondents younger than 35 (p-value = 0.0044).
Observing the data by gender, the results show that females consider natural hazards protection more important than males (mean values of 2.89 for females and 2.82 for males). The stakeholders’ preferences for ES categories confirm that males assign the highest value to all three categories, but the chi-square test shows no statistically significant differences.
With regard to the level of education, respondents with a lower level assign a higher importance to one ES than respondents with a higher level, i.e., hunting (mean values of 3.49 for respondents with an elementary school certificate, 3.26 for respondents with a high school degree, and 3.14 for respondents with a university or post-university degree). In contrast, respondents with a higher level of education assign a higher importance to four ES than respondents with a lower level of education (mean values from elementary school certificate to university degree): Timber production (1.69 < 1.75 < 1.98); grazing (2.56 < 2.74 < 2.84); natural hazards protection (2.49 < 2.87 < 3.10); and, air and water quality (3.38 < 3.61 < 3.72). The chi-square test shows statistically significant differences only for two ES: Grazing for persons with a university degree (p-value < 0.0009) and Natural hazards protection for persons with a high school degree (p-value < 0.008). Considering the ES categories, the results show that respondents with a higher level of education prefer two of these (provisioning services and regulating services), while respondents with a lower level of education prefer cultural services provided by forests. However, the chi-square test shows no statistically significant differences between ES categories.
4. Discussion
The results of the present study provide evidence of the preferences of stakeholders for ten forest ES and three main ES categories. Results show the preferences considering both the various stakeholders’ groups of interest and the socio-demographic characteristics of the respondents. The information collected during the interviews is usually used in the next phase of the FLMP for the definition of objectives and priority actions. In particular, the overall ranking can be used to identify a priority order of actions to be implemented to enhance the most important forest ES. In addition, the rankings of each group of interest can be used in order to take into account all interests. Our experience shows that the ES concept is very useful in forest planning, despite being developed in a much wider context than the forest sector itself. It allows the integration of different actors in the decision-making process related to natural resources management and makes it possible to also take into account the new needs that are being expressed by society towards ecosystems. It provides decision makers useful information to be incorporated into the planning process and a common language that facilitates communication with and between researchers/technicians, decision makers, stakeholders and the public at large, placing at the center of all considerations a discourse regarding quality of life.
In our research, we constantly faced two important questions: At what scale can the whole range of ES be appropriately taken into account, and what is the best approach for ES identification?
In forest planning the missing link was actually the landscape-scale planning. This scale proved to be the most suitable for taking into account issues of public interest, such as soil protection or nature, and landscape conservation and, at the same time, harmonizing them with needs and targets expressed by the different local actors. Once the objectives and the management strategies to realize them have been identified, the FUMP can acknowledge them and contextualize them on the territory.
As for the approach to identify ES, the qualitative assessment experimented by means of our case studies have given satisfactory and promising results.
We had a challenge of stakeholders’ identification and categorization, which was successfully overcome, thanks to the three-step model of stakeholders’ analysis we adopted [32]. After that, the administration of questionnaires, by means of face-to-face interviews, allowed for the fruitful involvement of stakeholders. In particular, the relaxed and informal atmosphere intentionally created during the interviews, not only permitted one to elicit people’s needs and opinions, but also allowed for a climate of trust and reciprocal understanding. Inclusiveness is actually acknowledged as a critical requisite for an effective participatory planning process. When planning in rural areas, it may be especially difficult to involve those stakeholders from the primary sector who often have a marginal role in the social system, despite being directly in charge of the management of local natural resources. Such a situation may entail two main consequences: The loss of valuable information during the elaboration of the plan and the origination of possible conflicts during the implementation stage [42]. Strictly connected to the issue of inclusiveness is the need for a large and effective representation of different views and interests in the planning process [58,59]. Indeed, a fair and balanced representation is difficult to attain. Since we were aware of this problem, in our case studies we made great efforts in order to give different voices the chance to be heard and to represent different interests in a satisfactory way, focusing in particular on both the key and primary stakeholders.
When observing the results of the ES assessment in our case studies, we are faced with some expected and predictable outcomes, but also some surprising ones. As to regulating services, it is evident that in Mediterranean areas we find less attention is paid to natural hazards compared to alpine or mountainous regions. It is striking, on the other hand, to find a keen sensitivity towards issues such as air and water quality and nature conservation, which one would not expect in highly rural areas, such as the districts investigated. It is a clear sign that people’s perception is changing and this may be in part due to the existence of protected areas which, despite having initially caused conflicts with local populations, are now producing a slight evolution of their awareness [60].
Concerning provisioning services, it is interesting to note that not only fuelwood production, but also NTFP, are considered very important. This means that it is not just the forest that provides people with goods, but the entire landscape, in all its components. The fact that timber is considered less important is largely due to the prevalence of coppices. However, factors related to local traditions play an important role, as has been also highlighted in other European studies [61,62,63]. The Matese district may be considered emblematic in this regard: Here, in fact, despite beech high forests being present, which are also potentially very productive, most of the wood production is utilized for energy purposes. Actually, many of the present high forests previously were coppices intensively utilized for fire-wood production and systematically subjected to grazing. Today we do not find in this territory a well-structured forestry industry, able to suitably valorize the wood assortments coming from high forests. This is a typical problem that has to be dealt with at the FLMP scale. Considering the importance of the primary sector in the districts investigated, we would expect greater importance attributed to grazing in line with what has emerged in other studies carried out for the realization of other FLMPs in southern Italy [32,64]. This is probably a sign of the socio-economic change in progress in the territories of the districts investigated, which affects the priorities expressed towards the ES.
With regard to cultural services, the results of this study show that in various contexts tourism-recreation is considered an important ecosystem service. In this sense, several authors have highlighted that key forest attributes to increase recreational attractiveness are naturalness of forest landscape, tree species composition (e.g., mixed forests vs. pure broadleaved of conifer forests), horizontal and vertical stand structure, and tourism facilities (e.g., hiking paths, parking and picnic facilities) [65,66,67]. In addition, Czajkowski et al. [68] highlighted that according to public opinion the most important biodiversity and recreation attributes of Polish forests are the amount of litter (garbage and rubbish) in forests, and the level of recreational infrastructure. Concerning the aesthetic aspects of tourism-recreation, De Valck et al. [69] investigated people’s preferences for nature restoration scenarios showing that the conversion of forest plantations can increase landscape diversity and species richness. Similarly, Valasiuk et al. [67] showed that Swedish and Norwegian citizens are willing to pay for forest landscape restoration of the transboundary Fulufjället National Parks.
Concerning hunting, we placed it in the cultural services category, following most acknowledged classifications. However, considering the highly rural context, we could have included it in the category of provisioning services. In fact, the actors of the forestry industry attribute a high value to cultural services also due to the fact that hunting has been included in this category. This should lead us to reflect on the importance of considering specific local contexts in categorizing ES. Speaking more generally, as highlighted also for alpine areas, the role of some specific ES should be analyzed and clarified better [29].
Taking into account the influence of the groups of interest variable, it is apparent that there is certain sensitivity on the part of the actors of the forestry industry towards regulating services. A further interesting aspect is that the actors of the forestry industry and those of the tourism sector have a similar order of priorities in the ranking of importance for the ES. In particular, the actors from the tourist sector show great interest in some provisioning services. All this opens up to interesting prospects related to opportunities of making the most of synergies between different ES. Furthermore, positive interaction could be stimulated between local actors that would enable a sustainable and self-propelling development of areas long considered economically marginal. Obviously this would necessitate being adequately supported during the implementation stage of the plan.
5. Conclusions
The present study analyzed stakeholders’ opinions and preferences for different categories of forest ES in order to provide new information to the decision makers (forest planners and managers). The data were collected through the face-to-face administration of a semi-structured questionnaire. This method has the main advantage of being able to collect a large number of standardized information in a short time. In addition, the data are an overview of social preferences to be included in the landscape planning in accordance with the principles of FLMP. Conversely, the main disadvantage is that the method is not able to deepen the data collected with qualitative information. The future steps of the study are to collect also qualitative information through in-depth interviews with a sub-sample of stakeholders. Besides, stakeholders’ preferences for ES and categories of ES should be mapped in order to facilitate the inclusion of social preferences in forest planning and management choices.
Finally, we think the exercise we made in the present research—to support landscape planning with stakeholders’ point of view—can help design the handling of a FLMP, where multiple stakeholders and conflicting criteria could be involved. We are also conscious that a lot of work still remains, because preferences for ES are influenced by a combination of factors deeply rooted in the local context and related to places and people (including attitudes; cultural, social, and human values; and biophysical differences in forest features).
Author Contributions
Conceptualization, I.D.M., A.P., F.F. and M.G.C.; Data curation, A.P. and F.F.; Formal analysis, A.P.; Investigation, I.D.M. and F.F.; Methodology, I.D.M., A.P., F.F. and M.G.C.; Software, F.F.; Supervision, A.P.; Writing—original draft, A.P.; Writing—review and editing, I.D.M. and M.G.C.
Funding
The Alto-Agri research was coordinated by the National Institute of Agricultural Economics Research (INEA) Basilicata Head-quarters, with the financial support of the Basilicata Region—“Operational Programme Val d’Agri Melandro-Sauro-Camastra” and the National Park of Lucano Apennine-Val d’Agri-Lagonegrese. The Matese research was funded by the Region of Molise (Accordo di programma quadro pluriennale per attività di ricerca e sviluppo nel settore forestale) and by Progetto Collezioni E-A-OR MIPAF (Ministry for Agricultural, Food and Forestry Policies). The Arci-Grighine research was funded by the Regione Autonoma della Sardegna, Assessorato della Difesa dell’Ambiente, Servizio Tutela del suolo e Politiche Forestali and by Progetto Collezioni E-A-OR MIPAF (Ministry for Agricultural, Food and Forestry Policies).
Acknowledgments
The authors wish to acknowledge the participation and collaboration of the stakeholders who provided useful information and suggestions.
Conflicts of Interest
The authors declare no conflict of interest.
References
- Daily, G.C. Nature’s Services: Societal Dependence on Natural Ecosystems; Island Press: Washington, DC, USA, 1997. [Google Scholar]
- Westman, W. How much are nature’s services worth. Science 1977, 197, 960–964. [Google Scholar] [CrossRef] [PubMed]
- Ehrlich, P.R.; Ehrlich, A. Extinction: The Causes and Consequences of the Disappearance of Species; Random House: New York, NY, USA, 1981. [Google Scholar]
- De Groot, R.S. Environmental Functions as a Unifying Concept for Ecology and Economics. Environmentalist 1987, 7, 105–109. [Google Scholar] [CrossRef]
- MEA. Millennium Ecosystem Assessment Ecosystems and Human Well-Being: Biodiversity Synthesis; World Resources Institute: Washington, DC, USA, 2005. [Google Scholar]
- De Groot, R.S.; Alkemade, R.; Braat, L.; Hein, L.; Willemen, L. Challenges in integrating the concept of ecosystem services and values in landscape planning, management and decision making. Ecol. Complex. 2010, 7, 260–272. [Google Scholar] [CrossRef]
- Gómez-Baggethun, E.; De Groot, R.; Lomas, P.L.; Montes, C. The history of ecosystem services in economic theory and practice: From early notions to markets and payment schemes. Ecol. Econ. 2010, 69, 1209–1218. [Google Scholar] [CrossRef]
- Brauman, K.A.; Daily, G.C.; Duarte, T.K.E.; Mooney, H.A. The nature and value of ecosystem services: An overview highlighting hydrologic services. Annu. Rev. Environ. Resour. 2007, 32, 67–98. [Google Scholar] [CrossRef]
- Dominati, E.; Patterson, M.; Mackay, A. A framework for classifying and quantifying the natural capital and ecosystem services of soils. Ecol. Econ. 2010, 69, 1858–1868. [Google Scholar] [CrossRef]
- TEEB. The Economics of Ecosystems and Biodiversity: Mainstreaming the Economics of Nature: A Synthesis of the Approach, Conclusions and Recommendations of TEEB; The Economics of Ecosystems and Biodiversity: Geneva, Switzerland, 2010. [Google Scholar]
- Haines-Young, R.; Potschin, M. Proposal for a Common International Classification of Ecosystem Goods and Services (CICES) for Integrated Environmental and Economic Accounting; EEA: Copenhagen, Denmark, 2010. [Google Scholar]
- Antognelli, S.; Vizzari, M. Ecosystem and urban services for landscape liveability: A model for quantification of stakeholders’ perceived importance. Land Use Policy 2016, 50, 277–292. [Google Scholar] [CrossRef]
- Boyd, J.; Banzhaf, S. What are ecosystem services? The need for standardized environmental accounting units. Ecol. Econ. 2007, 63, 616–626. [Google Scholar] [CrossRef]
- Costanza, R. Ecosystem services: Multiple classification systems are needed. Biol. Conserv. 2008, 141, 350–352. [Google Scholar] [CrossRef]
- Busch, M.; La Notte, A.; Laporte, V.; Erhard, M. Potentials of quantitative and qualitative approaches to assessing ecosystem services. Ecol. Indic. 2012, 21, 89–103. [Google Scholar] [CrossRef]
- Deal, R.L.; White, R. Integrating forest products with ecosystem services: A global perspective. For. Policy Econ. 2012, 17, 1–2. [Google Scholar] [CrossRef]
- Baral, H.; Guariguata, M.R.; Keenan, R.J. A proposed framework for assessing ecosystem goods and services from planted forests. Ecosyst. Serv. 2016, 22, 260–268. [Google Scholar] [CrossRef]
- Burkhard, B.; Kroll, F.; Nedkov, S.; Müller, F. Mapping ecosystem service supply, demand and budgets. Ecol. Indic. 2012, 21, 17–29. [Google Scholar] [CrossRef]
- Campagne, S.C.; Roche, P.K. May the matrix be with you! Guidelines for the application of expert-based matrix approach for ecosystem services assessment and mapping. One Ecosyst. 2018, 3, e24134. [Google Scholar] [CrossRef] [Green Version]
- Paudyal, K.; Baral, H.; Burkhard, B.; Bhandari, S.P.; Keenan, R.J. Participatory assessment and mapping of ecosystem services in a data-poor region: Case study of community-managed forests in central Nepal. Ecosyst. Serv. 2015, 13, 81–92. [Google Scholar] [CrossRef]
- Häyhä, T.; Franzese, P.P.; Paletto, A.; Faath, B.D. Assessing, valuing, and mapping ecosystem services in Alpine forests. Ecosyst. Serv. 2015, 14, 12–23. [Google Scholar] [CrossRef]
- Paletto, A.; Giacovelli, G.; Pastorella, F. Stakeholders’ opinions and expectations for the forest-based sector: A regional case study in Italy. Int. For. Rev. 2017, 19, 68–78. [Google Scholar] [CrossRef]
- Gatto, P.; Pettenella, D.; Secco, L. Payments for forest environmental services: Organisational models and related experiences in Italy. iForest 2009, 2, 133–139. [Google Scholar] [CrossRef]
- Egoh, B.; Reyers, B.; Rouget, M.; Richardson, D.M.; Le Maitre, D.C.; van Jaarsveld, A.S. Mapping ecosystem services for planning and management. Agric. Ecosyst. Environ. 2008, 127, 135–140. [Google Scholar] [CrossRef]
- Geneletti, D. Reasons and options for integrating ecosystem services in strategic environmental assessment of spatial planning. Int. J. Biodivers. Sci. Ecosyst. Serv. Manag. 2011, 7, 143–149. [Google Scholar] [CrossRef] [Green Version]
- Hauck, J.; Görg, C.; Varjopuro, R.; Ratamäki, O.; Maes, J.; Wittmer, H.; Jax, K. “Maps have an air of authority”: Potential benefits and challenges of ecosystem service maps at different levels of decision making. Ecosyst. Serv. 2013, 4, 25–32. [Google Scholar] [CrossRef]
- Von Haaren, C.; Albert, C. Integrating ecosystem services and environmental planning: Limitations and synergies. Int. J. Biodivers. Sci. Ecosyst. Serv. Manag. 2011, 7, 150–167. [Google Scholar] [CrossRef]
- Bennett, E.M.; Peterson, G.D.; Gordon, L.J. Understanding relationships among multiple ecosystem services. Ecol. Lett. 2009, 12, 1–11. [Google Scholar] [CrossRef] [PubMed]
- Cantiani, M.G.; Geitner, C.; Haida, C.; Maino, F.; Tattoni, C.; Vettorato, D.; Ciolli, M. Balancing economic development and environmental conservation for a new governance of Alpine areas. Sustainability 2016, 8, 802. [Google Scholar] [CrossRef]
- Grêt-Regamey, A.; Walz, A.; Bebi, P. Valuing Ecosystem Services for Sustainable Landscape Planning in Alpine regions. Mt. Res. Dev. 2008, 28, 156–165. [Google Scholar] [CrossRef]
- Hermann, A.; Schleifer, S.; Wrbka, T. The Concept of Ecosystem Services regarding Landscape Research: A review. Living Rev. Landsc. Res. 2011, 5, 1–26. [Google Scholar] [CrossRef]
- Paletto, A.; Cantiani, M.G.; De Meo, I. Public Participation in Forest Landscape Management Planning (FLMP) in Italy. J. Sustain. For. 2015, 34, 465–482. [Google Scholar] [CrossRef]
- Howe, C.; Suich, H.; Vira, B.; Mace, G.M. Creating win-wins from trade-offs? Ecosystem services for human well-being: A meta-analysis of ecosystem service trade-offs and synergies in the real world. Global Environ. Chang. 2014, 28, 263–275. [Google Scholar] [CrossRef]
- Goldman, R.L.; Thompson, B.H.; Daily, G.C. Institutional incentives for managing the landscape: Inducing cooperation for the production of ecosystem services. Ecol. Econ. 2007, 64, 333–343. [Google Scholar] [CrossRef]
- Hendee, J.; Flint, C.G. Incorporating Cultural Ecosystem Services into Forest Management Strategies for Private Landowners: An Illinois Case Study. For. Sci. 2014, 60, 1172–1179. [Google Scholar] [CrossRef]
- Cantiani, P.; De Meo, I.; Ferretti, F.; Paletto, A. Forest functions evaluation to support forest landscape management planning. For. Ideas 2010, 16, 44–51. [Google Scholar]
- Ferretti, F.; Di Bari, C.; De Meo, I.; Cantiani, P.; Bianchi, M. ProgettoBosco: A Data-Driven Decision Support System for forest planning. Int. J. Math. Comput. For. Nat.-Resour. Sci. 2011, 3, 27–35. [Google Scholar]
- Paletto, A.; Ferretti, F.; Cantiani, P.; De Meo, I. Multifunctional approach in forest management land plan: An application in Southern Italy. For. Syst. 2011, 2, 66–80. [Google Scholar]
- Bettinger, P.; Lennette, M.; Johnson, K.N.; Spies, T.A. A hierarchical spatial framework for forest landscape planning. Ecol. Model. 2005, 182, 25–48. [Google Scholar] [CrossRef]
- De Meo, I.; Ferretti, F.; Frattegiani, M.; Lora, C.; Paletto, A. Public participation GIS to support a bottom-up approach in forest landscape planning. iForest 2013, 6, 347–352. [Google Scholar] [CrossRef] [Green Version]
- De Meo, I.; Ferretti, F.; Paletto, A.; Cantiani, M.G. An approach to public involvement in forest landscape planning in Italy: A case study and its evaluation. Ann. Silvicul. Res. 2017, 41, 54–66. [Google Scholar]
- Cantiani, M.G. Forest planning and public participation: A possible methodological approach. iForest 2012, 5, 72–82. [Google Scholar] [CrossRef]
- Kant, S. Extending the boundaries of forest economics. For. Policy Econ. 2003, 5, 39–56. [Google Scholar] [CrossRef]
- Focacci, M.; Ferretti, F.; De Meo, I.; Paletto, A.; Costantini, G. Integrating Stakeholders’ Preferences in Participatory Forest Planning: A Pairwise Comparison Approach from Southern Italy. Int. For. Rev. 2017, 19, 413–422. [Google Scholar] [CrossRef]
- Cubbage, F.; Harou, P.; Sillsa, E. Policy instruments to enhance multi-functional forest management. For. Policy Econ. 2007, 9, 83–85. [Google Scholar] [CrossRef]
- Schmithüsen, F. Multifunctional forestry practices as a land use strategy to meet increasing private and public demands in modern societies. J. For. Sci. 2007, 53, 290–298. [Google Scholar] [CrossRef]
- Paletto, A.; Hamunen, K.; De Meo, I. Social network analysis to support stakeholder analysis in participatory forest planning. Soc. Nat. Resour. 2015, 28, 1108–1125. [Google Scholar] [CrossRef]
- Paletto, A.; Giacovelli, G.; Grilli, G.; Balest, J.; De Meo, I. Stakeholders’ preferences and the assessment of forest ecosystem services: A comparative analysis in Italy. J. For. Sci. 2014, 60, 472–483. [Google Scholar] [CrossRef]
- Kelly, C.; Ferrara, A.; Wilson, G.A.; Ripullone, F.; Nolè, A.; Harmer, N.; Salvati, L. Community resilience and land degradation in forest and shrubland socio-ecological systems: Evidence from Gorgoglione, Basilicata, Italy. Land Use Policy 2015, 46, 11–20. [Google Scholar] [CrossRef]
- Di Salvatore, U.; Ferretti, F.; Cantiani, P.; Paletto, A.; De Meo, I.; Chiavetta, U. Multifunctionality assessment in forest planning at landscape level. The study case of Matese Mountain Community (Italy). Ann. Silvicul. Res. 2013, 37, 45–54. [Google Scholar]
- Paletto, A.; De Meo, I.; Ferretti, F. Social network analysis to support the forest landscape planning: An application in Arci-Grighine, Sardinia (Italy). For. Ideas 2010, 1, 28–35. [Google Scholar]
- Paletto, A.; Ferretti, F.; De Meo, I. The role of social networks in forest landscape planning. For. Policy Econ. 2012, 15, 132–139. [Google Scholar] [CrossRef]
- Reed, M.S.; Graves, A.; Dandy, N.; Posthumus, H.; Hubacek, K.; Morris, J.; Prell, C.; Quinn, C.H.; Stringer, L.C. Who’s in and why? A typology of stakeholder analysis methods for natural resource management. J. Environ. Manag. 2009, 90, 1933–1949. [Google Scholar] [CrossRef] [PubMed]
- Adamowicz, W.L.; Louviere, J.; Swait, J. Introduction to Attribute-Based Stated Choice Methods; NOAA—National Oceanic Atmospheric Administration: Washington, DC, USA, 1998. [Google Scholar]
- Balkan, E.; Kahn, J.R. The value of changes in deer hunting quality: A travel cost approach. Appl. Econ. 1988, 20, 533–539. [Google Scholar] [CrossRef]
- Forster, B.A. Valuing Outdoor Recreational Activity: A Methodological Survey. J. Leis. Res. 1989, 21, 181–201. [Google Scholar] [CrossRef]
- Bissell, S.J.; Duda, M.D.; Young, K.C. Recent studies on hunting and fishing participation in the United States. Hum. Dimensions Wildl. 1998, 3, 75–80. [Google Scholar] [CrossRef]
- McCool, S.F.; Guthrie, K. Mapping the dimensions of successful public participation in messy natural resources management situations. Soc. Nat. Resour. 2001, 14, 309–323. [Google Scholar]
- Bruña-García, X.; Marey-Pérez, M.F. The Challenge of Diffusion in Forest Plans: A Methodological Proposal and Case Study. Forests 2018, 9, 240. [Google Scholar] [CrossRef]
- De Meo, I.; Brescancin, F.; Graziani, A.; Paletto, A. Management of Natura 2000 sites in Italy: An exploratory study on stakeholders’ opinions. J. For. Sci. 2016, 62, 511–520. [Google Scholar] [CrossRef] [Green Version]
- Dhubháin, Á.N.; Fléchard, M.C.; Moloney, R.; O’Connor, D. Stakeholders’ perceptions of forestry in rural areas—Two case studies in Ireland. Land Use Policy 2009, 26, 695–703. [Google Scholar] [CrossRef]
- Hiedanpää, J. The edges of conflict and consensus: A case for creativity in regional forest policy in Southwest Finland. Ecol. Econ. 2005, 55, 485–498. [Google Scholar] [CrossRef]
- Matilainen, A.; Koch, M.; Zivojinovic, I.; Lähdesmäki, M.; Lidestav, G.; Karppinen, H.; Didolot, F.; Jarsky, V.; Põllumäe, P.; Colson, V.; et al. Perceptions of ownership among new forest owners—A qualitative study in European context. For. Policy Econ. 2018, in press. [Google Scholar] [CrossRef]
- De Meo, I.; Cantiani, M.G.; Ferretti, F.; Paletto, A. Stakeholders’ perception as support for forest landscape planning. Int. J. Ecol. 2011, 1, 1–8. [Google Scholar] [CrossRef]
- Paletto, A.; De Meo, I.; Cantiani, M.G.; Maino, F. Social perceptions and forest management strategies in an Italian Alpine community. Mt. Res. Dev. 2013, 33, 152–160. [Google Scholar] [CrossRef]
- Abildtrup, J.; Garcia, S.; Olsen, S.B.; Stenger, A. Spatial preference heterogeneity in forest recreation. Ecol. Econ. 2013, 92, 67–77. [Google Scholar] [CrossRef]
- Valasiuk, S.; Czajkowski, M.; Giergiczny, M.; Żylicz, T.; Veisten, K.; Landa Mata, I.; Halse, A.H.; Elbakidze, M.; Angelstam, P. Is forest landscape restoration socially desirable? A discrete choice experiment applied to the Scandinavian transboundary Fulufjället National Park Area. Restor. Ecol. 2018, 26, 370–380. [Google Scholar] [CrossRef]
- Czajkowski, M.; Budzinski, W.; Campbell, D.; Giergiczny, M.; Hanley, N. Spatial Heterogeneity of Willingness to Pay for Forest Management. Environ. Resour. Econ. 2017, 68, 705–727. [Google Scholar] [CrossRef] [Green Version]
- De Valck, J.; Vlaeminck, P.; Broekx, S.; Liekens, I.; Aertsens, J.; Chen, W.; Vranken, L. Benefits of clearing forest plantations to restore nature? Evidence from a discrete choice experiment in Flanders, Belgium. Landsc. Urban Plan. 2014, 125, 65–75. [Google Scholar] [CrossRef]
Figure 1.
Location of study areas in Italy.

Figure 2.
Stakeholders’ preferences for ten ecosystem services (ES) by group of interest (mean value).
Figure 2.
Stakeholders’ preferences for ten ecosystem services (ES) by group of interest (mean value).


Table 1.
Stakeholders’ preferences for ten ES by study area (mean value).
| ES/Study Area | Alto Agri (n = 113) | NP Lucano-Val d’Agri-Lagonegrese (n = 99) | Arci (n = 72) | Grighine (n = 39) | Matese (n = 39) |
|---|---|---|---|---|---|
| Provisioning services | |||||
| Fuelwood | 3.49 ± 0.78 | 3.42 ± 0.82 | 3.64 ± 0.63 | 3.56 ± 0.64 | 3.59 ± 0.72 |
| Timber | 1.98 ± 0.77 | 2.42 ± 0.94 | 1.13 ± 0.41 | 1.10 ± 0.31 | 1.59 ± 0.72 |
| Grazing | 2.73 ± 0.89 | 2.85 ± 0.71 | 2.67 ± 1.03 | 2.51 ± 0.88 | 2.56 ± 1.05 |
| Non-timber forest products (NTFP) | 3.62 ± 0.57 | 2.87 ± 0.69 | 3.78 ± 0.48 | 3.64 ± 0.54 | 3.18 ± 0.79 |
| Regulating services | |||||
| Natural hazards protection | 2.32 ± 1.08 | 3.69 ± 0.58 | 2.25 ± 1.21 | 2.21 ± 1.15 | 3.46 ± 0.85 |
| Air and water quality | 3.38 ± 0.83 | 3.86 ± 0.38 | 3.60 ± 0.73 | 3.13 ± 0.95 | 3.51 ± 0.79 |
| Nature conservation | 2.93 ± 1.01 | 3.83 ± 0.41 | 3.14 ± 1.03 | 2.97 ± 1.01 | 3.51 ± 0.79 |
| Cultural services | |||||
| Hunting | 3.60 ± 0.70 | 2.57 ± 0.98 | 3.90 ± 0.34 | 3.92 ± 0.27 | 2.72 ± 0.97 |
| Sporting | 2.06 ± 0.97 | 2.98 ± 0.89 | 3.03 ± 0.90 | 2.64 ± 0.87 | 2.26 ± 0.99 |
| Tourism-recreation | 3.35 ± 0.72 | 3.77 ± 0.47 | 3.76 ± 0.49 | 3.64 ± 0.54 | 3.03 ± 0.96 |
In bold are the three most important ES by study area.
Table 2.
Stakeholders’ preferences for three ES categories by study area (mean value).
| ES Category/Study Area | Alto Agri (n = 113) | NP Lucano-Val d’Agri-Lagonegrese (n = 99) | Arci (n = 72) | Grighine (n = 39) | Matese (n = 39) |
|---|---|---|---|---|---|
| Provisioning services | 2.96 ± 0.38 | 2.89 ± 0.52 | 2.80 ± 0.36 | 2.71 ± 0.32 | 2.73 ± 0.51 |
| Regulating services | 2.88 ± 0.80 | 3.79 ± 0.36 | 3.00 ± 0.66 | 2.77 ± 0.86 | 3.50 ± 0.73 |
| Cultural services | 3.00 ± 0.52 | 3.10 ± 0.57 | 3.56 ± 0.42 | 3.40 ± 0.38 | 2.67 ± 0.61 |
In bold is the most important ES category by study area.
Table 3.
Stakeholders’ preferences for ten ES by groups of interest (mean value).
| ES/Group of Interest | Environmental NGOs (n = 19) | Forestry Industry Actors (n = 131) | Public Administrations (n = 168) | Tourism Actors (n = 44) |
|---|---|---|---|---|
| Provisioning services | ||||
| Fuelwood | 3.41 ± 0.80 | 3.54 ± 0.70 | 3.49 ± 0.81 | 3.58 ± 0.62 |
| Timber | 1.82 ± 0.66 | 1.80 ± 0.90 | 1.84 ± 0.90 | 1.58 ± 0.81 |
| Grazing | 2.73 ± 1.08 | 2.58 ± 0.95 | 2.82 ± 0.81 | 2.64 ± 0.96 |
| Non-timber forest products (NTFP) | 3.59 ± 0.73 | 3.40 ± 0.72 | 3.32 ± 0.72 | 3.60 ± 0.58 |
| Regulating services | ||||
| Natural hazards protection | 2.73 ± 1.20 | 2.63 ± 1.24 | 3.07 ± 1.09 | 2.27 ± 1.05 |
| Air and water quality | 3.27 ± 0.98 | 3.42 ± 0.82 | 3.71 ± 0.63 | 3.42 ± 1.03 |
| Nature conservation | 3.14 ± 0.99 | 3.15 ± 1.03 | 3.53 ± 0.78 | 2.84 ± 1.09 |
| Cultural services | ||||
| Hunting | 3.32 ± 0.89 | 3.40 ± 0.84 | 3.16 ± 1.01 | 3.73 ± 0.69 |
| Sporting | 2.68 ± 1.13 | 2.38 ± 0.95 | 2.79 ± 0.97 | 2.49 ± 1.10 |
| Tourism-recreation | 3.59 ± 0.50 | 3.39 ± 0.75 | 3.67 ± 0.56 | 3.53 ± 0.76 |
In bold are the three most important ES by groups of interest.
Table 4.
Stakeholders’ preferences for three ES categories by groups of interest (mean value).
| ES Category/Group of Interest | Environmental NGOs (n = 19) | Forestry Industry Actors (n = 131) | Public Administrations (n = 168) | Tourism Actors (n = 44) |
|---|---|---|---|---|
| Provisioning services | 2.89 ± 0.56 | 2.83 ± 0.41 | 2.87 ± 0.45 | 2.85 ± 0.41 |
| Regulating services | 3.05 ± 0.77 | 3.06 ± 0.79 | 3.44 ± 0.70 | 2.84 ± 0.84 |
| Cultural services | 3.20 ± 0.54 | 3.06 ± 0.61 | 3.21 ± 0.54 | 3.25 ± 0.62 |
In bold are the most important ES by groups of interest.
Table 5.
Stakeholders’ preferences for ten ES by socio-demographic characteristics of respondents (mean value).
Table 5.
Stakeholders’ preferences for ten ES by socio-demographic characteristics of respondents (mean value).
| Socio-Demographic Characteristics/ES | Fuelwood | Timber | Grazing | NTFP | Natural Hazards Protection | Air and Water Quality | Nature Conservation | Hunting | Sporting | Tourism -Recreation |
|---|---|---|---|---|---|---|---|---|---|---|
| Age | ||||||||||
| Less than 35 years old | 3.53 ± 0.81 | 1.65 ± 0.82 | 2.71 ± 0.88 | 3.47 ± 0.56 | 2.71 ± 1.27 | 3.56 ± 0.81 | 3.32 ± 1.12 | 3.21 ± 0.94 | 2.79 ± 1.00 | 3.53 ± 0.65 |
| 36–45 years old | 3.61 ± 0.65 | 1.85 ± 0.98 | 2.65 ± 0.91 | 3.39 ± 0.74 | 2.80 ± 1.18 | 3.52 ± 0.87 | 3.18 ± 1.03 | 3.24 ± 1.02 | 2.55 ± 1.04 | 3.52 ± 0.74 |
| 46–55 years old | 3.45 ± 0.78 | 1.91 ± 0.84 | 2.76 ± 0.87 | 3.35 ± 0.73 | 2.92 ± 1.16 | 3.66 ± 0.61 | 3.45 ± 0.84 | 3.27 ± 0.89 | 2.55 ± 0.99 | 3.54 ± 0.66 |
| 56–65 years old | 3.44 ± 0.74 | 1.56 ± 0.74 | 2.80 ± 0.93 | 3.38 ± 0.71 | 2.88 ± 1.14 | 3.53 ± 0.88 | 3.35 ± 0.90 | 3.39 ± 0.86 | 2.68 ± 1.03 | 3.67 ± 0.60 |
| More than 65 years old | 3.58 ± 0.79 | 1.83 ± 1.19 | 2.33 ± 0.78 | 3.75 ± 0.62 | 2.17 ± 1.34 | 3.42 ± 1.00 | 3.08 ± 1.16 | 3.75 ± 0.62 | 3.17 ± 0.72 | 3.58 ± 0.79 |
| Gender | ||||||||||
| Male | 3.51 ± 0.74 | 1.82 ± 0.90 | 2.72 ± 0.89 | 3.40 ± 0.72 | 2.82 ± 1.17 | 3.58 ± 0.75 | 3.34 ± 0.92 | 3.31 ± 0.93 | 2.63 ± 1.00 | 3.56 ± 0.66 |
| Female | 3.47 ± 0.67 | 1.47 ± 0.67 | 2.63 ± 0.88 | 3.32 ± 0.68 | 2.89 ± 1.26 | 3.53 ± 1.07 | 3.05 ± 1.21 | 3.115 ± 0.85 | 2.47 ± 1.04 | 3.42 ± 0.74 |
| Level of education | ||||||||||
| Elementary school | 3.58 ± 0.63 | 1.69 ± 0.92 | 2.56 ± 0.85 | 3.40 ± 0.76 | 2.49 ± 1.24 | 3.38 ± 0.90 | 3.06 ± 1.01 | 3.49 ± 0.81 | 2.61 ± 1.00 | 3.50 ± 0.73 |
| High school | 3.44 ± 0.84 | 1.75 ± 0.85 | 2.74 ± 0.89 | 3.41 ± 0.68 | 2.87 ± 1.11 | 3.61 ± 0.77 | 3.41 ± 0.91 | 3.26 ± 0.96 | 2.63 ± 1.05 | 3.59 ± 0.63 |
| University or post-University degree | 3.55 ± 0.67 | 1.98 ± 0.89 | 2.84 ± 0.91 | 3.35 ± 0.71 | 3.10 ± 1.17 | 3.72 ± 0.64 | 3.44 ± 0.94 | 3.14 ± 0.96 | 2.62 ± 0.97 | 3.57 ± 0.68 |
Table 6.
Stakeholders’ preferences for categories of ES by socio-demographic characteristics of respondents (mean value).
Table 6.
Stakeholders’ preferences for categories of ES by socio-demographic characteristics of respondents (mean value).
| Socio-Demographic Characteristics/Category of ES | Provisioning Services | Regulating Services | Cultural Services |
|---|---|---|---|
| Age | |||
| Less than 35 years old | 2.84 ± 0.44 | 3.20 ± 0.89 | 3.18 ± 0.56 |
| 36–45 years old | 2.88 ± 0.51 | 3.16 ± 0.89 | 3.10 ± 0.63 |
| 46–55 years old | 2.87 ± 0.40 | 3.34 ± 0.69 | 3.12 ± 0.55 |
| 56–65 years old | 2.80 ± 0.37 | 3.25 ± 0.71 | 3.25 ± 0.56 |
| More than 65 years old | 2.88 ± 0.42 | 2.89 ± 0.72 | 3.50 ± 0.50 |
| Gender | |||
| Male | 2.86 ± 0.44 | 3.24 ± 0.75 | 3.17 ± 0.58 |
| Female | 2.72 ± 0.35 | 3.16 ± 1.02 | 3.00 ± 0.53 |
| Level of education | |||
| Elementary school | 2.81 ± 0.39 | 2.96 ± 0.81 | 3.19 ± 0.65 |
| High school | 2.84 ± 0.44 | 3.27 ± 0.76 | 3.16 ± 0.54 |
| University or post-University degree | 2.92 ± 0.47 | 3.35 ± 0.76 | 3.12 ± 0.56 |
© 2018 by the authors. Licensee MDPI, Basel, Switzerland. This article is an open access article distributed under the terms and conditions of the Creative Commons Attribution (CC BY) license (http://creativecommons.org/licenses/by/4.0/).
Share and Cite
MDPI and ACS Style
De Meo, I.; Cantiani, M.G.; Ferretti, F.; Paletto, A. Qualitative Assessment of Forest Ecosystem Services: The Stakeholders’ Point of View in Support of Landscape Planning. Forests 2018, 9, 465. https://doi.org/10.3390/f9080465
AMA Style
De Meo I, Cantiani MG, Ferretti F, Paletto A. Qualitative Assessment of Forest Ecosystem Services: The Stakeholders’ Point of View in Support of Landscape Planning. Forests. 2018; 9(8):465. https://doi.org/10.3390/f9080465
Chicago/Turabian StyleDe Meo, Isabella, Maria Giulia Cantiani, Fabrizio Ferretti, and Alessandro Paletto. 2018. "Qualitative Assessment of Forest Ecosystem Services: The Stakeholders’ Point of View in Support of Landscape Planning" Forests 9, no. 8: 465. https://doi.org/10.3390/f9080465
Note that from the first issue of 2016, this journal uses article numbers instead of page numbers. See further details here.