Article

Multiple Factors Drive Variation of Forest Root Biomass in Southwestern China

1
Key Laboratory of Agro-Ecological Processes in Subtropical Region, Institute of Subtropical Agriculture, Chinese Academy of Sciences, Changsha 410125, Hunan, China
2
Huanjiang Observation and Research Station for Karst Ecosystem, Chinese Academy of Sciences, Huanjiang 547100, Guangxi, China
3
College of Agricultural Sciences and Natural Resources, University of Nebraska-Lincoln, Lincoln, NE 68583, USA
4
Xiangtan Real Estate Registration Center, Xiangtan 411100, Hunan, China
*
Author to whom correspondence should be addressed.
Forests 2018, 9(8), 456; https://doi.org/10.3390/f9080456
Submission received: 12 May 2018 / Revised: 8 July 2018 / Accepted: 25 July 2018 / Published: 27 July 2018
(This article belongs to the Section Forest Ecology and Management)

Abstract

:
The roots linking the above-ground organs and soil are key components for estimating net primary productivity and carbon sequestration of forests. The patterns and drivers of root biomass in forest have not been examined well at the regional scale, especially for the widely distributed forest ecosystems in southwestern China. We attempted to determine the spatial patterns of root biomass (RB, Mg/ha), annual increment root biomass (AIRB, Mg/ha/year), ratio of root and above-ground (RRA), and the relative contributions of abiotic and biotic factors that drive the variation of root biomass. Forest biomass and multiple factors (climate, soil, forest types, and stand characteristics) of 318 plots in this region (790,000 km2) were analyzed in this research. The AB (the mean values for forest aboveground biomass per ha, Mg/ha), RB, AIRB, and RRA were 126 Mg/ha, 28 Mg/ha, 0.69 Mg/ha and 0.22, respectively. AB, RB, AIRB, and RRA varied across all the plots and forest types. Both RB and AIRB showed significant spatial patterns of distribution, while RRA did not show any spatial patterns of distribution. Up to 28.4% of variation in total of RB, AIRB, and RRA can be attributed to the climate, soil, and stand characteristics. The explained or contribution rates of climate, soil, and stand characteristics for variation of whole forest root biomass were 6.7%, 16.9%, and 10.9%, respectively. Path analysis in structural equation model (SEM) indicated the direct influence of stand age on RB. AIRB was greater than that of the other factors. Climate, soil and stand characteristics in different forest types could explain 9.7%–96.1%, 15.4%–96.4%, and 36.7%–99.4% of variations in RB, AIRB, and RRA, respectively, which suggests that the multiple factors may be important in explaining the variations in forest root biomass. The results of the analysis of root biomass per ha, annual increment of root biomass per ha, and ratio of root and above-ground in the seven forest types categorized by climate, soil, and stand characteristics may be used for accurately determining C sequestration by the forest root and estimating forest biomass in this region.

1. Introduction

The whole terrestrial ecosystem is an important part of the global carbon sink and plays a key role in reducing greenhouse gas concentrations [1,2,3]. Forestland area accounts for 30% of the total land surface, stores 283 Gt carbon (C) in forest ecosystem biomass at a global scale and regulates the main C store in the land system [4,5,6,7]. Biomass allocation between root and aboveground is a functional indicator of stand forest and reflects the material flow, energy flow, and primary production process [8]. At the individual and ecosystem level, stand forest biomass allocation is usually characterized by the ratio of root dry mass to above-ground dry mass (root/shoot ratio) [9]. The opaque nature of the soil and the difficulties to extract and quantify tree roots have resulted in fewer studies on root biomass compared to studies on above-ground biomass [10,11,12]. The lack of long-term and high-quality root biomass data in the past decades has also limited the study of the effect of light and CO2 on forestland ecosystem carbon cycle, balance between water and nutrition in the soil layer, and plant adaptation strategy under different environmental stresses [13,14]. With a continuous improvement in the methodology of root biomass measurement, studies have identified a strong relationship between the underground and above-ground organs [15,16]. Meanwhile, there has been an increase in studies of biomass distribution in underground organs of forestland ecosystems under conditions of climate change [7,15,17].
Previous studies have shown the need for the development of indirect methods for the determination of root biomass, which is laborious given the unavailability of digging root methods [18,19,20,21]. For example, allometric models have been successfully used to estimate the root biomass for different geographical regions and vegetation species [22,23]. Moreover, the allometric models between the root biomass and above-ground biomass vary with climate factor, soil type, and plant species, and the validity of the results is still debated [24,25]. The isometric allocation theory (IAT) showed that root biomass scales isometrically with above-ground biomass across different plant species, geographical conditions, and soil conditions [23,26]. Nevertheless, optimal partitioning theory (OPT) suggests that allometric models to study the root biomass and above-ground biomass may be regulated by different climatic factors, soil properties, topographical conditions, and species characteristics [27,28,29,30,31]. These controversies implied that the relationship between biomass allocation and the multiple variables was still unclear. In addition, plant root biomass may be the result of a combination of multiple factors, which could include stand characteristics, climatic factors, and soil properties [12,13,25,32,33]. This means that the root biomass for different geographical regions may be determined by local forest type, stand characteristics, and local environmental factors.
The second largest forest region in China occurs in the southwest. It comprises about 23% of the total forestland area and 25% of the national timber production in the country [33,34]. This is also the largest karst region in China, known for the special geochemical properties of rock, low carrying capacity of local environment, and high sensitivity to human disturbance [35,36]. In the past decade, the forest biomass in this region has been influenced by excessive felling and deforestation. Meanwhile, large-scale tree plantation was carried out under the Grain for Green Program (GGP) to restore degraded vegetation and maintain the C balance [37,38]. Although there have been some studies on the relationship between forest biomass and climate variation, topographic factors, soil properties, and stand characteristics in southwestern China [34,39], it is still unclear how forest root biomass varies with environmental factors and stand characteristics across different forest types at a regional scale.
Our group clarified how environmental factors and stand characteristics affected the forest biomass and biomass allocation at the national and regional scales [40,41,42]. Until now, the lack of knowledge about forest root biomass in southwestern China hampered the understanding of C pool dynamics. In this study, we examined the multiple factors responsible for driving large-scale root biomass patterns and variation based on data from 318 field plots covering seven forest types across southwestern China. Our objectives were (1) to explore the biogeographical patterns of forest root biomass at a regional scale; (2) to model the variation of forest root biomass, annual increment of root biomass, and root biomass/above-ground biomass using different stand characteristics and environmental variables; and (3) to examine the relationship between root biomass variation and multiple factors across the different forest types.

2. Material and Methods
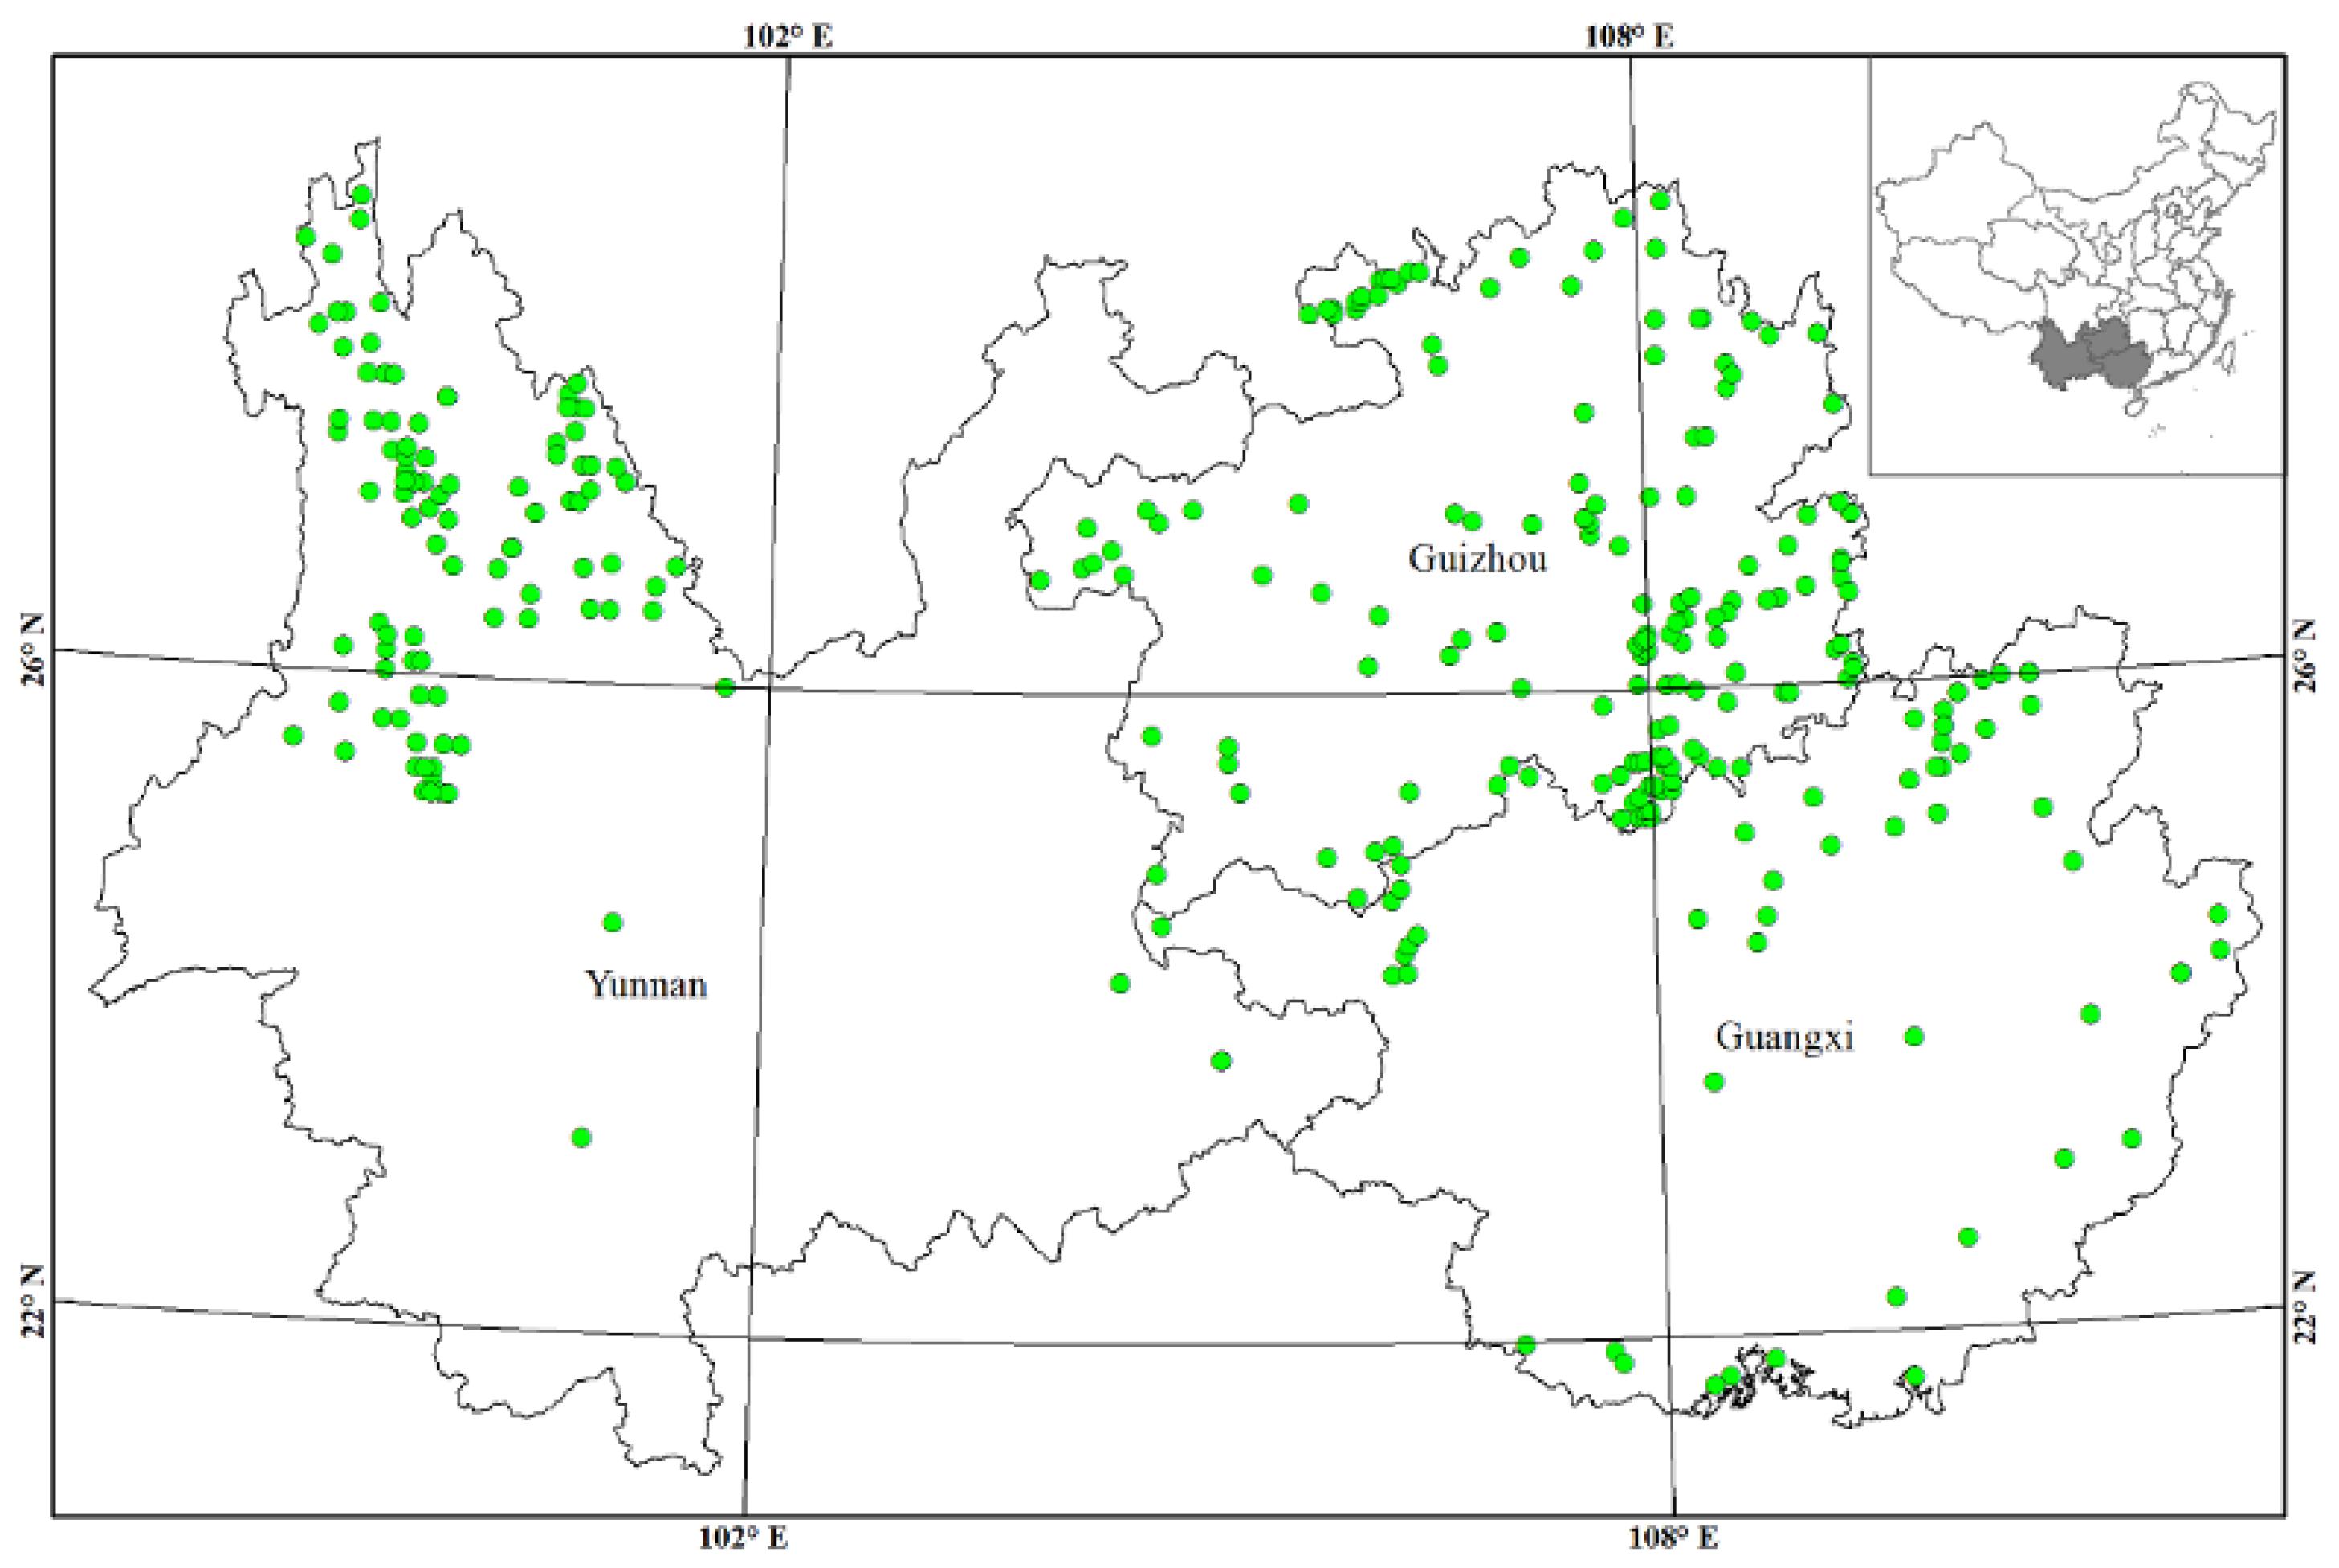
2.1. Study Site

The research was conducted in southwest China that includes Yunnan, Guizhou, and Guangxi provinces. This research region belongs to the Yungui plateau and covers an area of ca. 790,000 km2. Mean annual precipitation is 1000–1300 mm/year, with a dry season (from October to April) and rainy season (from May to September). The average annual temperature is 17.3 °C. The forest is located on the karst dominated region, with heterogeneous topography, red soil (limestone soil) & yellow soil, and rich nutrients in the top soil. The mean depth of forest soil ranged from 0.2 m to 1.9 m. Generally, the major forest types include boreal/alpine Picea-Abies forest (BAPF), subtropical montane Pinus yunnanensis and Pinus kesiya forest (SPPF), subtropical Pinus massoniana forest (SPMF), subtropical montane Pinus armandii, Pinus taiwanensis, and Pinus densata forest (SPPPF), subtropical Cunninghamia lanceolata forest (SCLF), subtropical evergreen broadleaved forest (SEBF), and tropical rainforest and monsoon forest (TRMF).

2.2. Forest Biomass Data

318 forest field plots in southwest China were established (Figure 1), of which 256 plots were obtained from the national forest inventory (2004–2008) and 62 plots were maintained by our group (2011–2012). Each plot data information includes site conditions (i.e., longitude, latitude, altitude), tree components biomass (i.e., leaf, branch, stem, root), stand factors (i.e., stand age (3–200 years), stand density (89–9057 no./ha)) and climate factors (i.e., mean annual temperature (MAT), mean annual precipitation (MAP)) (Table S1). Above-ground biomass was the total biomass of the leaf, stem, and branch biomass. Annual increment of root biomass was the ratio of root biomass per ha (including dying roots) and stand age. Ratio of root biomass and above-ground biomass (RRA) was calculated by root biomass/above-ground biomass.
The standards of the Centre for Tropical Forest Science were used in the field survey of our group and the national forest inventory [43]. Each plot (20 m × 50 m) was divided into ten subplots (10 m × 10 m). In each subplot, we recorded the total number of trees, and diameter at breast height (DBH) of each tree. Five to seven trees for each species with different (from low to high) DBH were selected as ‘standard trees’ for weighing fresh biomass of the leaves, stems, branches, and root. The roots of the tree in 1.5–3.5 m radius depending on the tree size were dug up, washed, separated by hand into coarse roots (>2 mm) and fine roots (≤2 mm), and weighed for fresh total biomass. The root sampling depth was determined by the root depth and spatial distribution of each sample tree. Total component biomass of each plot was calculated as the sum of each tree component in each plot. The samples of the leaves, branches, stems, and roots of standard trees were collected and taken to the laboratory. These samples were dried at 65 °C to a constant weight and used for calculation of the ratio of dry and fresh weights. Tree-ring method was used to measure the stand age for the trees above 5 m. The stand age of trees below 5 m was determined by the time since the stand was first created.

2.3. Climatic Variables and Soil Data

The MAT (°C) and MAP (mm) were selected as the indicators of climate variables in this study and could be extracted from the climatic maps of China interpolated from 680 climatic stations for 2001–2010 [44]. The MAT and MAP data for each plot were also connected with the latitude, longitude, and altitude. Soil pH, total nitrogen (TN), and total phosphate (TP) data of 0–50 cm depth in the national second soil survey were extracted from the national soil nutrient map and the other plots were in our field measurements.

2.4. Statistical Analysis

SPSS 13.0 (SPSS Inc., Chicago, IL, USA) was used to analyze all the data. Spatial interpolation of root biomass by means of Kriging method was conducted with GIS 10.0 (ESRI Inc., Redlands, California, USA) [36]. Correlation analyses and multivariate stepwise regression was selected to determine the variation of root biomass with environmental variables (MAT, MAP, longitude, latitude, altitude, soil pH, soil TN, and soil TP) and stand characteristics (stand age and density). The variation partitioning (R2) of environmental factors and stand characteristics in accounting for the root biomass variation was analyzed by the R (X64 3.4.4) software (University of Auckland, Auckland, New Zealand). In addition, we also developed one structural equation model (SEM) to evaluate the influence of environmental variables and stand characteristics on the forest root biomass. This model can take the indirect and direct effects and correlations among variables into account and test whether the overall model is statistically accepted. The SEM was performed using the sem function of the lavaan package [45,46]. The reduced major axis (RMA) regression was used to estimate the relationship between the root biomass and aboveground biomass in different forest types [26].

3. Results

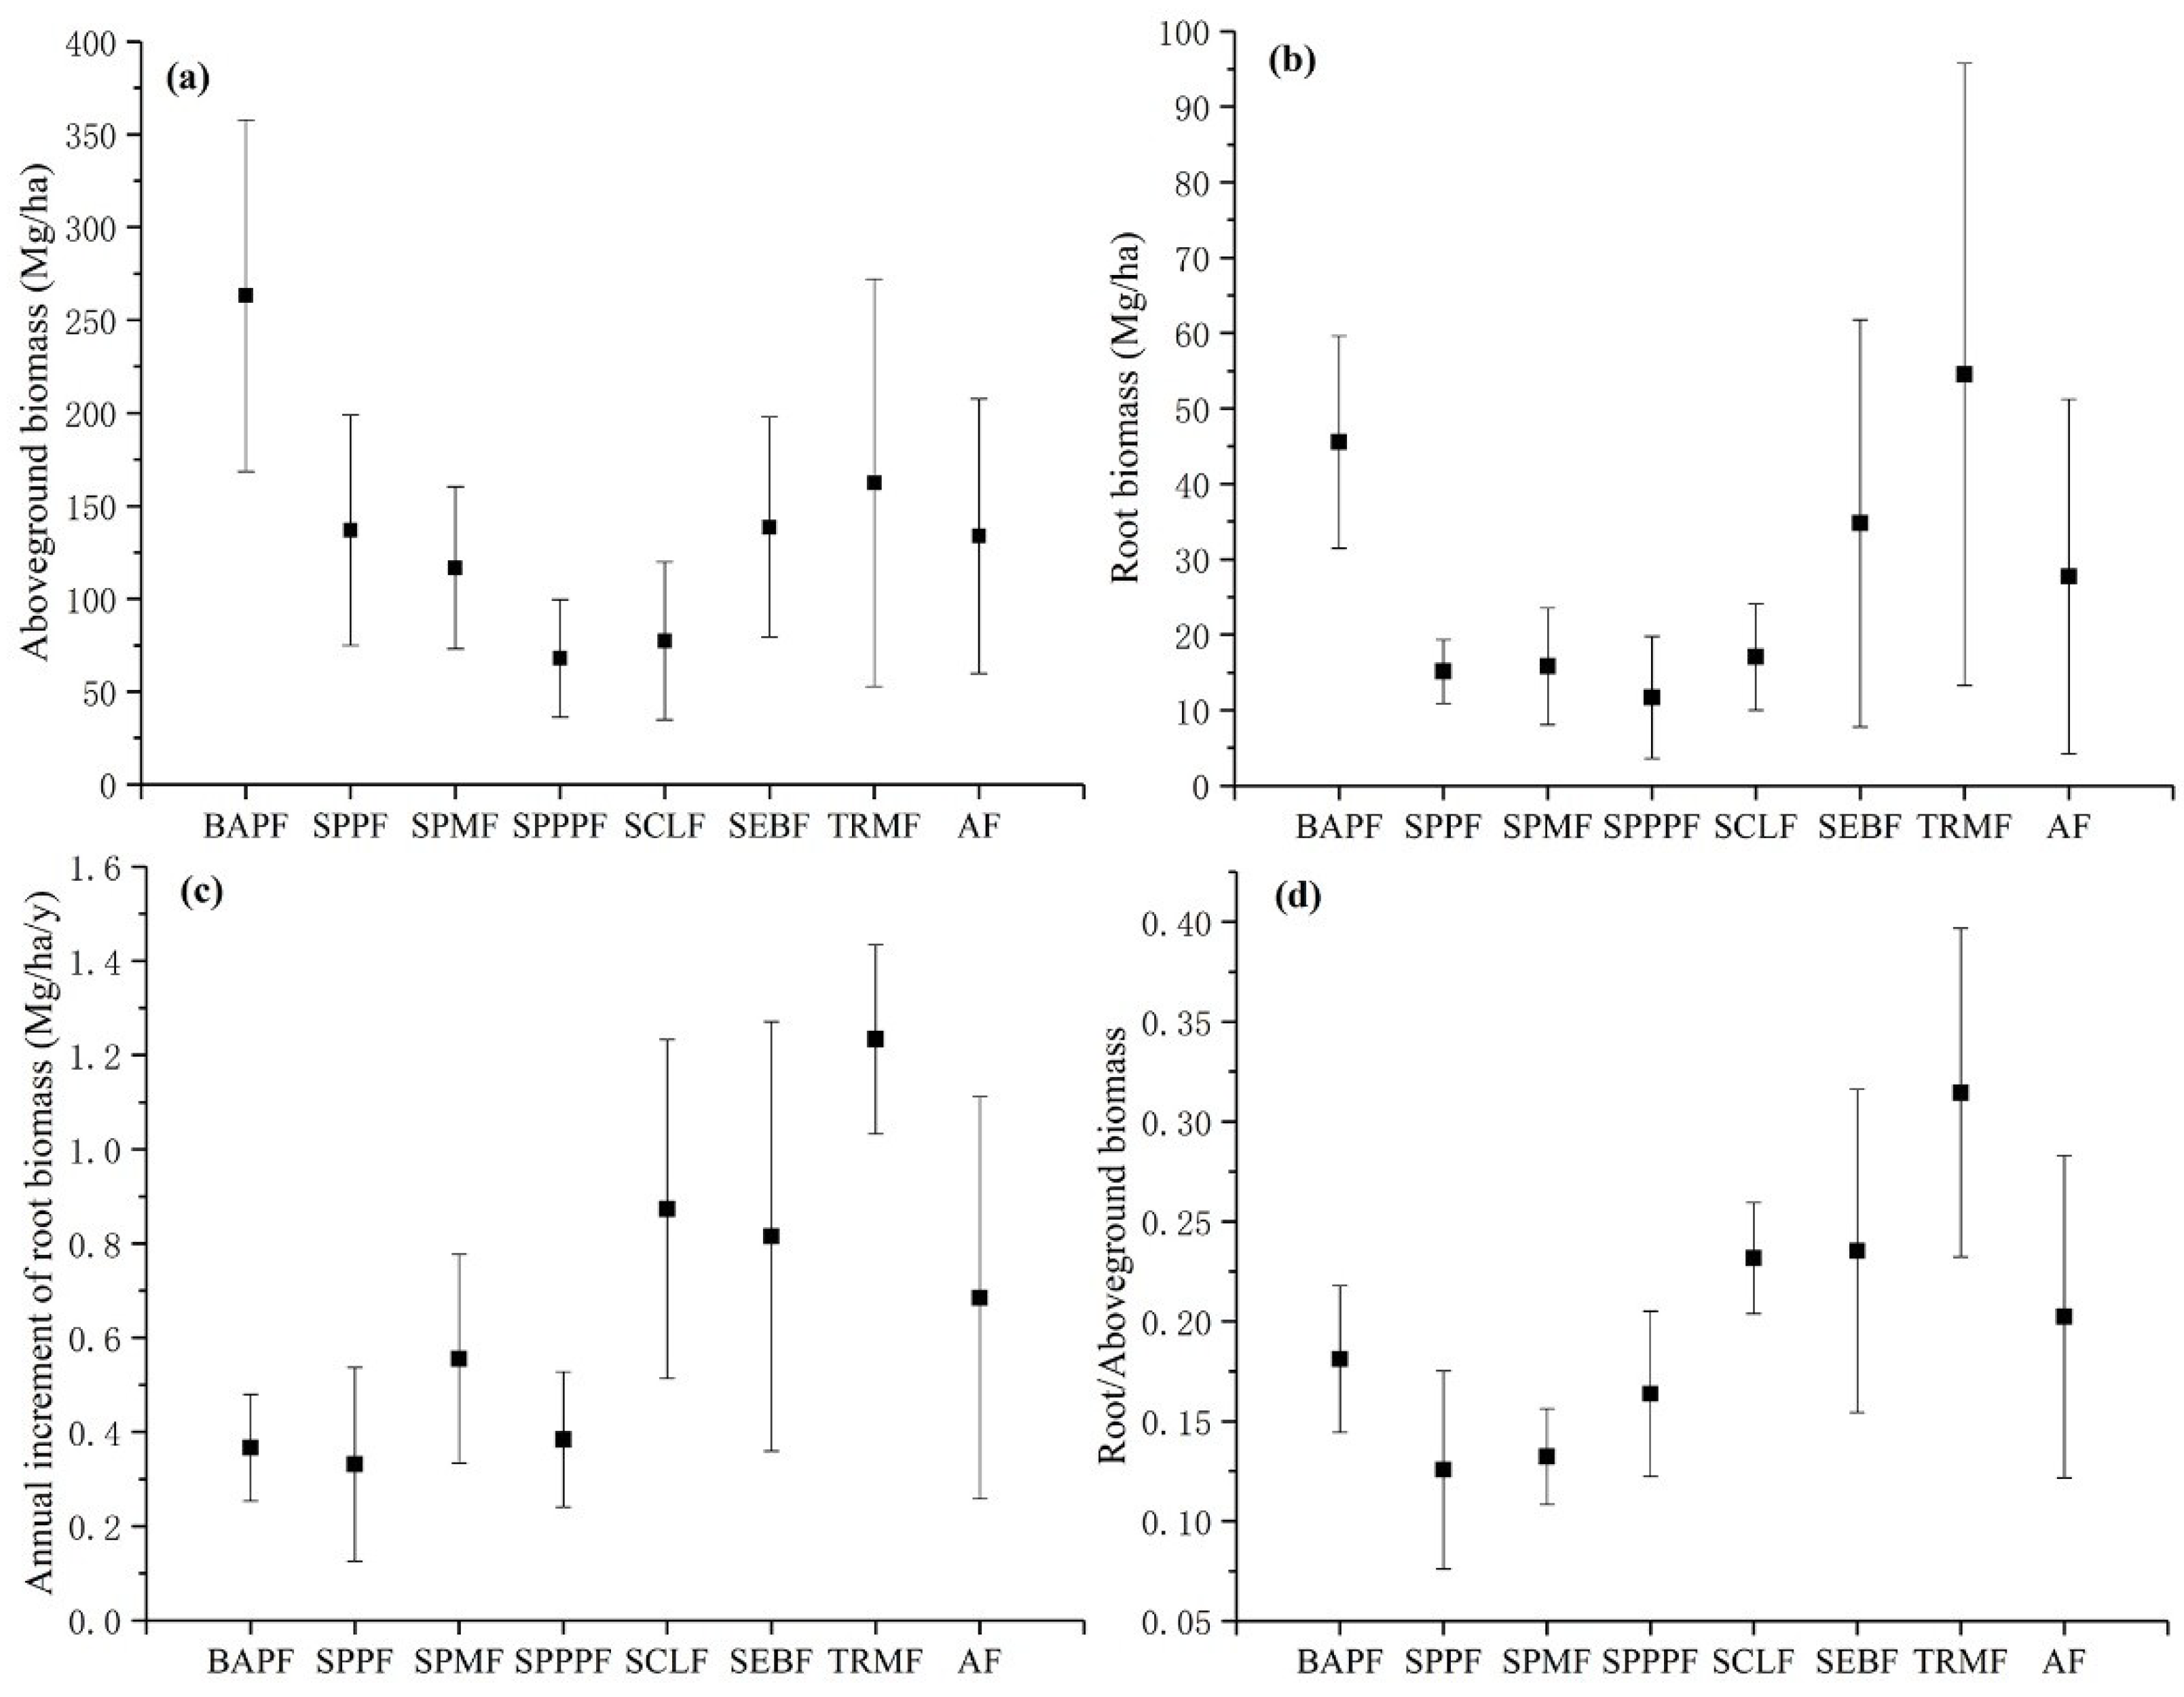
3.1. Statistical and Spatial Patterns of Forest Root Biomass

The mean values for forest aboveground biomass per ha (AB, Mg/ha), root biomass per ha (RB, Mg/ha), annual increment root biomass per ha (AIRB, Mg/ha/year) and ratio of root biomass per ha and aboveground biomass per ha (RRA) were 126 Mg/ha, 27.7 Mg/ha, 0.69 Mg/ha and 0.22, respectively (Figure 2). All the AB, RB, AIRB and RRA varied in seven forest types (Figure 2). RB and AIRB showed significantly negative and positive longitudinal trends, respectively (p < 0.01; Table 1). RB increased significantly with increasing altitudinal gradient, while AIRB decreased significantly along increasing altitudinal gradient (p < 0.01; Table 1). Compared with RB and AIRB, the RRA demonstrated no significant spatial pattern of distribution (Table 1).
AB, RB, AIRB, and RRA all had large variations across all the plots, which ranged from 26.1 to 362.5 Mg/ha for AB, 4.6–95.4 Mg/ha for RB, 0.12–1.42 Mg/ha for AIRB, and 0.06–0.41 for RRA (Figure 2). The average values for RB, AIRB, and RRA also significantly differed amongst the seven forest types. For RB, the mean value ranged from 12.5 Mg/ha (SPPPF) to 54.9 Mg/ha (TRMF), while that of AIRB was from 0.33 (SPPF) to 1.25 (TRMF). RRA also significantly varied among the different forest types, ranging from 0.13 (SPPF) to 0.32 (TRMF).

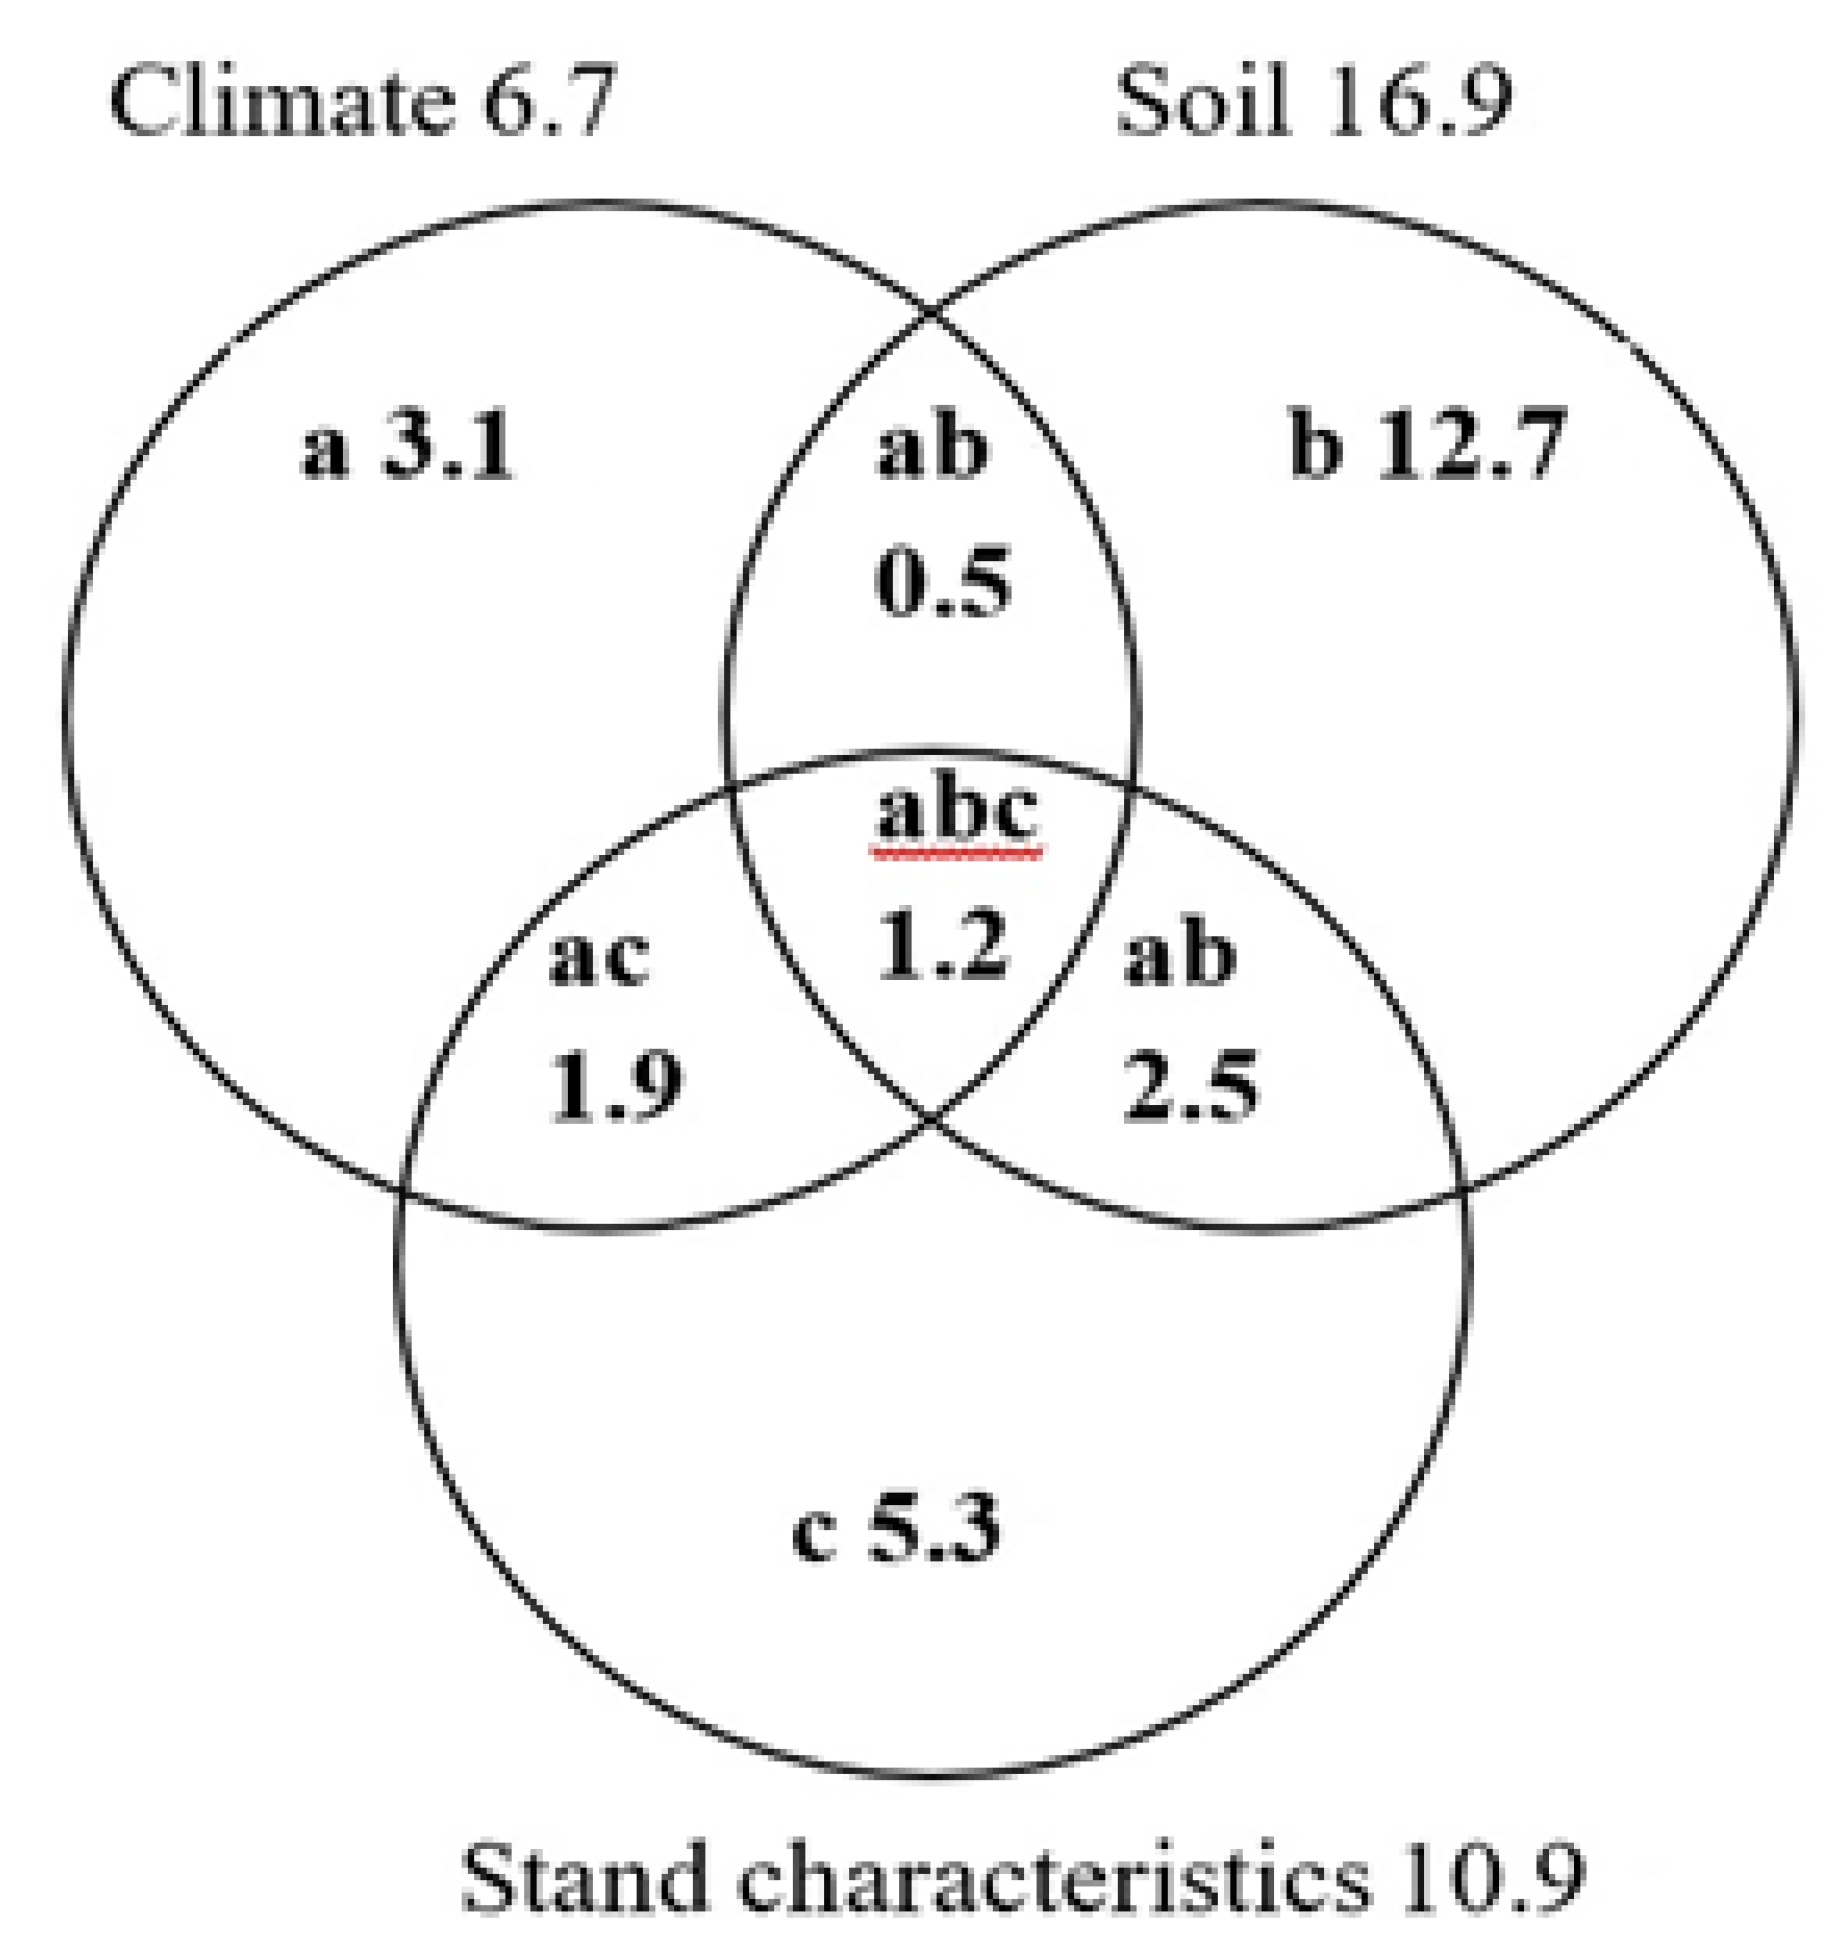
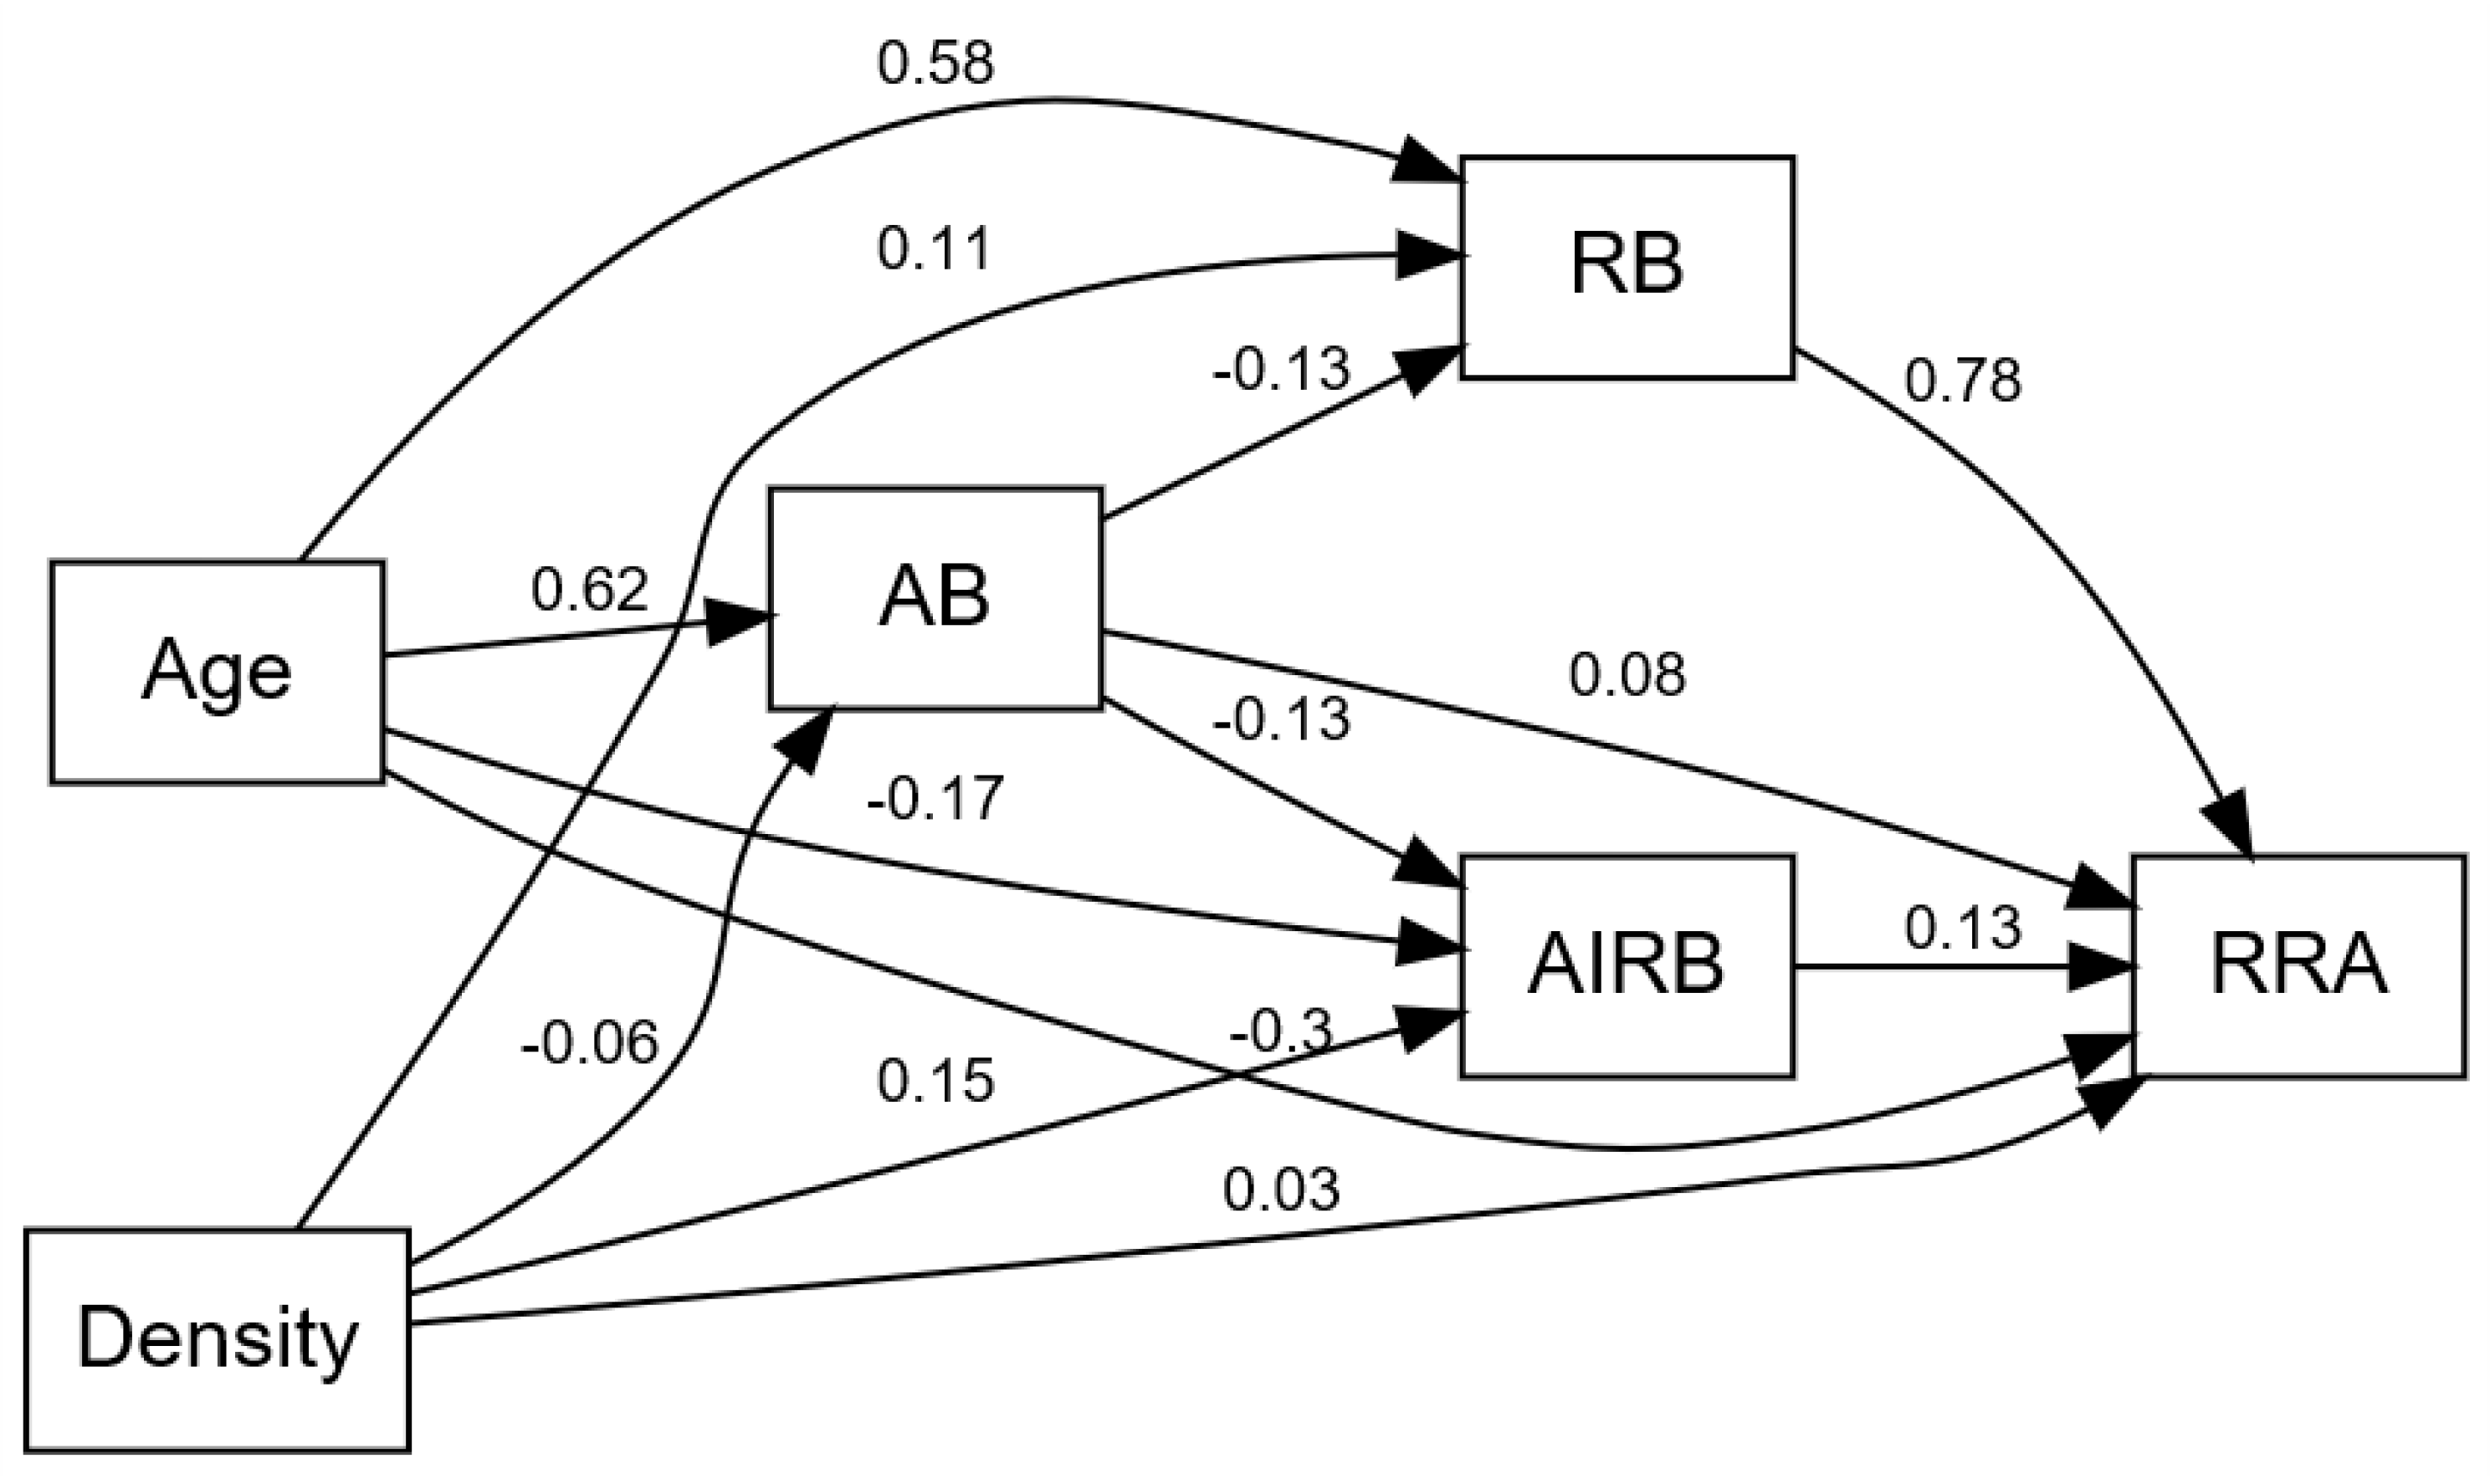
3.2. Factors Influencing Variation in Forest Root Biomass

The climate, soil and stand characteristics accounted for 28.4% of total of RB, AIRB, and RRA variation. In detail, the explained rate of climate, soil and stand characteristics for variation of root biomass were 6.7, 16.9 and 10.9%, respectively. There were obviously parts of the variation in forest root biomass accounted for by the interactions between climate, soil, and stand characteristics (Figure 3).
Path analysis in SEM indicated that the direct effects of stand age were greater on RB and AIRB in comparison to other factors for RB and AIRB (Figure 4). The direct path coefficients of stand age on the RB and AIRB were 0.58 and −0.64, respectively. Similarly, the direct path coefficients of RB on the AIRB and RRA were 0.81 and 0.78, respectively. This proves stand age has strong interactions with other factors in explaining the variation in forest root biomass. Nevertheless, the absolute values of direct path coefficients of stand density on biomass were smaller than those of stand age (Figure 4). Moreover, the absolute values of indirect path coefficient of multi-factors on RB, AIRB and RRA were very small, which suggests that the interactive effects of multi-factors on forest root biomass were not obvious. Stand age had a significantly positive effect on RB (p < 0.05; Table 2). Stand age could explain 21.5% of variation in RB. When stand age, stand density and latitude were combined, 26.5% of the variation in RB could be explained (Table 2). Similarly, AIRB was positively and significantly correlated with MAT, which explained 9.8% of variation in AIRB; while 17.3% of variation in AIRB could be explained by the combination of MAT, stand density, MAP, stand age and TP (Table 2). On the contrary, no obvious factors could explain the variations observed in RRA.

3.3. Factors Influencing Variation in Forest Root Biomass in Different Forest Types

The factors leading to differences in forest root biomass varied depending on the forest type (Table 3). RB was found to be significantly correlated to stand density, stand age and TN in BAPF, while in SPPF it was significantly correlated to stand density and TP. All RB in SPMF, SPPPF, SEBF, and TRMF were significantly correlated to stand age, but different factors also regulate RB depending on the forest type. AIRB in SPMF, SCLF and TRMF were significantly correlated to MAT, stand density, and AB, respectively. Except for SPPPF, the AIRB in the other four forest types were affected by more than two different factors (Table 3). Both, AIRB and RRA in SPPPF were not significantly correlated to these factors. The RRA in SCLF was significantly correlated to MAT, while that in the other forest types (except for SCLF) was found to be correlated with two or more factors. Moreover, the scaling exponents (slopes) of the allometric scaling between RB and AB showed significant differences among the seven forest types (Figure 5), which suggests that the variation of root biomass was also regulated by the forest types.

4. Discussion

4.1. Variation in Forest Root Biomass in Southwestern China

Our results show variations in forest root biomass at a regional scale. The RB for forest stand in southwestern China (27.7 Mg/ha) was lower than that of forest stand in the northeastern region (28.0 Mg/ha) [27] and was also different from that of the average value in China (18.5 Mg/ha), the United States (35.0 Mg/ha), and the entire world (22.5 Mg/ha) [13,25,47]. These differences could be attributed to variations in the forest type or mean species composition, stand age, climate, soil property, and data collection methodology [19,20]. To our knowledge, few studies have examined the forest root increment rate. In this study, the RRA for the forests in our research area (0.22) varied from that reported for the whole of China (0.24), the United States (0.20), and the global value (0.28) [13,47]. Considering the different forest types, our data was similar with the results of previous studies, which have shown that compared to coniferous forests, broadleaved forests have a higher RRA [27].
The root biomass of forest in our study showed a significant spatial pattern of distribution (Figure 2). These results were similar with the results of previous studies on the biogeographic patterns of forest, shrub, and grass biomass allocation [21,28]. Considering that the moisture/warm conditions, soil characteristics, and forest type shift from the longitudinal to latitudinal gradients, it is implied that root biomass and increment rate of root biomass in forest may be shaped by these factors. Compared with RB and AIRB, the RRA has no significant spatial pattern of distribution, which is consistent with the results of Hui et al. [13].

4.2. Factors Influencing Variations in Forest Root Biomass

Previous studies have analyzed the abiotic and biotic factors that regulate vegetation biomass allocation at different regional scales [13,22,40]. At the global scale, climatic factors were observed to have no significant effect on the root biomass of forest stands in one study [4]. However, some studies indicate variation in root biomass with change in temperature and precipitation [6,11], which is similar with our data of AIRB increasing with increase in MAT and MAP. Our results also show that RB is not dominated by climatic factors, which is consistent with the results of previous studies at the global scale [4]. Moreover, the RRA was influenced by abiotic and biotic factors at a different (from individual to regional) research scale [11,25]. Nevertheless, our data showed that except for soil pH, there was no significant effects of climatic, soil, and stand characteristics on RRA, suggesting an isometric relationship between above-ground biomass and root biomass in southwestern China [23]. Soil factors were also tested for their effects on forest biomass at the regional scale, and our data suggest that only soil pH was positively correlated with RRA, which is different from the results derived at the community scale [3,28].
Here, we also demonstrate that RB and AIRB increases with stand age and stand density in southwestern China (Table 2). Our previous study also showed that forest root biomass increased with increasing stand age at the national scale [40,41], which is similar with our results at the regional scale. Some studies have also indicated that stand density may influence forest biomass because of changes in soil nutrient, soil water content, light utilization, and competition among trees [48,49]. Below an optimal stand density, the forest biomass can increase with increasing stand density. Once it exceeds the limited stand density, the forest biomass may decrease due to self-thinning and excessive light or competition for soil nutrients or water [19].
About 60% of forest biomass variance in northeastern China can be explained by forest type, forest origin, and climate factors [27]. In this study, ca. 26.5%, 17.3%, and 6.2% of variance in RB, AIRB, and RRA could be explained by multiple factors (i.e., climate, soil, and stand characteristics), respectively. Among these factors, climate could explain 6.7% of variation in the forest root biomass, whereas stand characteristics and soil factors could explain 10.9% and 16.9%, respectively (Figure 3). Without regard to forest type, the explained rate of variation in forest root biomass by climate, soil, and stand characteristics is lower than that of previous studies [27]. However, multiple factors (i.e., climate, soil and stand characteristics) could explain 9.7%–96.1%, 15.4%–96.4%, and 36.7%–99.4% of variation in RB, AIRB, and RRA, respectively (Table 3), suggesting that the forest type may play an important role in accounting for the variation in forest root biomass. This difference may be specific to each forest type located in a different climatic region with different soil properties, tree species and stand characteristics [50].

4.3. Potential of Forest Root Biomass on C Sequestration in Southwestern China

At the regional scale, C sequestration and biomass of forest is usually estimated by means of satellite remote sensing technology [51,52]. The root biomass fraction (root biomass/total biomass) was used to determine the forest C sequestration by root biomass [53]. In southwestern China, because of the differences in root biomass fractions in response to the environmental factors, it is necessary to model the forest root biomass using survey data and environmental data [33]. In this study, the root biomass, annual root increment biomass and ratio of root/aboveground biomass in the seven forest types were estimated via climate, soil, and stand characteristics, which may be used for improving the calculation accuracy of C sequestration by forest roots. Moreover, to address the rock desert or bare stone conditions in karst regions, serious soil erosion, and vegetation degradation problems, the government has implemented a large-scale Grain for Green Program (GGP) [35,37,38]. As the assessment of C sequestration by GGP is labor-intensive, costly, and time-consuming, our data and models in this study may aid for the estimation of forest biomass in the restoration region. In this study, we have developed root biomass models by using the multiple factors, and the integration of these models and remote sensing data at a large scale into the ecological models (i.e., century model) will be used to accurately assess the forest restoration and C sequestration in future research.

5. Conclusions

Both spatial patterns of root biomass per ha (RB) and annual increment root biomass per ha (AIRB) showed significant spatial patterns of distribution in southwestern China, while ratio of root biomass and above-ground biomass (RRA) did not show any spatial patterns of distribution. Up to 28.4% of variation in total of RB, AIRB, and RRA can be attributed to the climate, soil, and stand characteristics. The explained or contribution rates of climate, soil, and stand characteristics for variation of whole forest root biomass were 6.7%, 16.9%, and 10.9%, respectively. Moreover, climate, soil and stand characteristics in different forest types could explain 9.7%–96.1%, 15.4%–96.4%, and 36.7%–99.4% of variations in RB, AIRB, and RRA, respectively. The results of this research suggest that the multiple factors may be important in explaining the variations in forest root biomass and could be used for accurately determining C sequestration by the forest root biomass in this region.

Supplementary Materials

The following are available online at https://www.mdpi.com/1999-4907/9/8/456/s1, Table S1: Original data.

Author Contributions

H.Z. conducted the literature search, the field investigations, and the statistical analysis for the manuscript as well as writing and editing the majority of the manuscript. K.W. organized the research collaboration, conducted the field investigation, critically read the manuscript, and contributed to the writing. Z.Z. (Zhaoxia Zeng), Z.Z. (Zhigang Zou) and Y.X. contributed to writing and editing of the manuscript. F.Z. designed the field survey method.

Funding

This research was funded by the National Key Research and Development Program (2016YFC0502505, 2016YFC0502400); Major State Basic Research Development Program of China (2015CB452703); National Science and Technology Support Plan (2015BAD06B04); the National Natural Science Foundation of China (Nos. 31070425); the Western Light Program of Talent Cultivation of the Chinese Academy of Sciences and Guangxi Provincial Program of Distinguished Experts in China.

Acknowledgments

The authors thank two anonymous reviewers for reading this manuscript and providing valuable advice. We also thank Hong-guang Zhu, Li-jun Zhao, You Nong, Jia-yan Wang, Tao Long, Wen-bo Li, Bei-si OuYang, De-xing Yuan, Guan-yi Qin, Wen-qing Dai, Li-su Wu, Yu Liu, Jia-hui Liao, Dan-hong Zhao, and Shu-yang Lin for help with data collection in the field.

Conflicts of Interest

The authors declare no conflict of interest. The funding sponsors had no role in the design of the study; in the collection, analyses, or interpretation of data; in the writing of the manuscript, and in the decision to publish the results.

References

  1. Houghton, R.A.; Hackler, J.L.; Lawrence, K.T. The U.S. Carbon budget: Contributions from land-use change. Science 1999, 285, 574–578. [Google Scholar] [CrossRef] [PubMed]
  2. Ni, J. Carbon storage in terrestrial ecosystems of China: Estimates at different spatial resolutions and their responses to climate change. Clim. Chang. 2001, 49, 339–358. [Google Scholar] [CrossRef]
  3. Fang, J.Y.; Guo, Z.D.; Piao, S.L.; Chen, A.P. Terrestrial vegetation carbon sinks in China, 1981–2000. Sci. China Ser. D Earth Sci. 2007, 50, 1341–1350. [Google Scholar] [CrossRef]
  4. Cairns, M.; Brown, S.; Helmer, E.; Baumgardner, G. Root biomass allocation in the world’s upland forests. Oecologia 1997, 111, 1–11. [Google Scholar] [CrossRef] [PubMed]
  5. Fang, J.Y.; Chen, A.P.; Peng, C.H.; Zhao, S.Q.; Ci, L.J. Changes in forest biomass carbon storage in China between 1949 and 1998. Science 2001, 292, 2320–2322. [Google Scholar] [CrossRef] [PubMed]
  6. Niklas, K.J. Modeling below- and above-ground biomass for non-woody and woody plants. Ann. Bot. 2005, 95, 315–321. [Google Scholar] [CrossRef] [PubMed]
  7. Piao, S.; Fang, J.; Zhu, B.; Tan, K. Forest biomass carbon stocks in China over the past 2 decades: Estimation based on integrated inventory and satellite data. J. Geophys. Res. 2005, 110. [Google Scholar] [CrossRef] [Green Version]
  8. Tang, X.; Zhao, X.; Bai, Y.; Tang, Z.; Wang, W.; Zhao, Y.; Wan, H.; Xie, Z.; Shi, X.; Wu, B. Carbon pools in China’s terrestrial ecosystems: New estimates based on an intensive field survey. Proc. Natl. Acad. Sci. USA 2018, 115, 4021–4026. [Google Scholar] [CrossRef] [PubMed] [Green Version]
  9. Poorter, H.; Jagodzinski, A.M.; Ruiz-Peinado, R.; Kuyah, S.; Luo, Y.; Oleksyn, J.; Usoltsev, V.A.; Buckley, T.N.; Reich, P.B.; Sack, L. How does biomass distribution change with size and differ among species? An analysis for 1200 plant species from five continents. New Phytol. 2015, 208, 736–749. [Google Scholar] [CrossRef] [PubMed] [Green Version]
  10. Enquist, B.J.; Niklas, K.J. Global allocation rules for patterns of biomass partitioning across seed plants. Science 2002, 295, 1517–1520. [Google Scholar] [CrossRef] [PubMed]
  11. Hui, D.F.; Jackson, R.B. Geographical and interannual variability in biomass partitioning in grassland ecosystems: A synthesis of field data. New Phytol. 2006, 169, 85–93. [Google Scholar] [CrossRef] [PubMed]
  12. Jagodzinski, A.M.; Ziółkowski, J.; Warnkowska, A.; Prais, H. Tree age effects on fine root biomass and morphology over chronosequences of Fagus sylvatica, Quercus robur and Alnus glutinosa stands. PLoS ONE 2016, 11, e0148668. [Google Scholar] [CrossRef] [PubMed]
  13. Hui, D.; Wang, J.; Le, X.; Shen, W.; Ren, H. Influences of biotic and abiotic factors on the relationship between tree productivity and biomass in China. For. Ecol. Manag. 2012, 264, 72–80. [Google Scholar] [CrossRef]
  14. Guo, Z.; Hu, H.; Li, P.; Li, N.; Fang, J. Spatio-temporal changes in biomass carbon sinks in China’s forests from 1977 to 2008. Sci. China Life Sci. 2013, 56, 661–671. [Google Scholar] [CrossRef] [PubMed]
  15. Luo, Y.; Wang, X.; Zhang, X.; Booth, T.H.; Lu, F. Root: Shoot ratios across China’s forests: Forest type and climatic effects. For. Ecol. Manag. 2012, 269, 19–25. [Google Scholar] [CrossRef]
  16. Hararuk, O.; Smith, M.J.; Luo, Y. Microbial models with data-driven parameters predict stronger soil carbon responses to climate change. Glob. Chang. Biol. 2015, 21, 2439–2453. [Google Scholar] [CrossRef] [PubMed]
  17. Luo, Y.J.; Wang, X.K.; Zhang, X.Q.; Ren, Y.; Poorter, H. Variation in biomass expansion factors for China’s forests in relation to forest type, climate, and stand development. Ann. For. Sci. 2013, 70, 589–599. [Google Scholar] [CrossRef]
  18. Jackson, R.B.; Canadell, J.; Ehleringer, J.R.; Mooney, H.A.; Sala, O.E.; Schulze, E.D. A global analysis of root distributions for terrestrial biomes. Oecologia 1996, 108, 389–411. [Google Scholar] [CrossRef] [PubMed]
  19. Poorter, H.; Nagel, O. The role of biomass allocation in the growth response of plants to different levels of light, CO2, nutrients and water: A quantitative review. Aust. J. Plant Physiol. 2000, 27, 595–607. [Google Scholar] [CrossRef]
  20. Poorter, H.; Niklas, K.J.; Reich, P.B.; Oleksyn, J.; Poot, P.; Mommer, L. Biomass allocation to leaves, stems and roots: Meta-analyses of interspecific variation and environmental control. New Phytol. 2012, 193, 30–50. [Google Scholar] [CrossRef] [PubMed]
  21. Wang, L.; Li, L.; Chen, X.; Tian, X.; Wang, X.; Ren, Y. Biomass allocation patterns across China’s terrestrial biomes. PLoS ONE 2014, 9, e93566. [Google Scholar] [CrossRef] [PubMed]
  22. Niklas, K.J.; Enquist, B.J. Invariant scaling relationships for interspecific plant biomass production rates and body size. Proc. Natl. Acad. Sci. USA 2001, 98, 2922–2927. [Google Scholar] [CrossRef] [PubMed] [Green Version]
  23. Cheng, D.; Niklas, K. Above- and below-ground biomass relationships across 1543 forested communities. Ann. Bot. 2007, 99, 95–102. [Google Scholar] [CrossRef] [PubMed]
  24. McConnaughay, K.D.M.; Coleman, J.S. Biomass allocation in plants: Ontogeny or optimality? A test along three resource gradients. Ecology 1999, 80, 2581–2593. [Google Scholar] [CrossRef]
  25. Mokany, K.; Raison, R.J.; Prokushkin, A.S. Critical analysis of root: Shoot ratios in terrestrial biomes. Glob. Chang. Biol. 2006, 12, 84–96. [Google Scholar] [CrossRef]
  26. Cheng, D.; Zhong, Q.; Niklas, K.J.; Ma, Y.; Yang, Y.; Zhang, J. Isometric scaling of above- and below-ground biomass at the individual and community levels in the understorey of a sub-tropical forest. Ann. Bot. 2015, 115, 303–313. [Google Scholar] [CrossRef] [PubMed] [Green Version]
  27. Wang, X.; Fang, J.; Zhu, B. Forest biomass and root-shoot allocation in northeast China. For. Ecol. Manag. 2008, 255, 4007–4020. [Google Scholar] [CrossRef]
  28. Yang, Y.H.; Fang, J.Y.; Ji, C.J.; Han, W.X. Above- and belowground biomass allocation in Tibetan grasslands. J. Veg. Sci. 2009, 20, 177–184. [Google Scholar] [CrossRef]
  29. Bruun, H.H.; Moen, J.; Virtanen, R.; Grytnes, J.A.; Oksanen, L.; Angerbjörn, A. Effects of altitude and topography on species richness of vascular plants, bryophytes and lichens in alpine communities. J. Veg. Sci. 2006, 17, 37–46. [Google Scholar] [CrossRef]
  30. Burkes, E.C.; Will, R.E.; Barron-Gafford, G.A.; Teskey, R.O.; Shiver, B. Biomass partitioning and growth efficiency of intensively managed Pinus taeda and Pinus elliottii stands of different planting densities. For. Sci. 2003, 49, 224–234. [Google Scholar]
  31. Ruiz-Robleto, J.; Villar, R. Relative growth rate and biomass allocation in ten woody species with different leaf longevity using phylogenetic independent contrasts (PICs). Plant Biol. 2005, 7, 484–494. [Google Scholar] [CrossRef] [PubMed]
  32. Majdi, H.; Ohrvik, J. Interactive effects of soil warming and fertilization on root production, mortality, and longevity in a Norway spruce stand in Northern Sweden. Glob. Chang. Biol. 2004, 10, 182–188. [Google Scholar] [CrossRef]
  33. Zhang, H.; Song, T.Q.; Wang, K.L.; Yang, H.; Yue, Y.M.; Zeng, Z.X.; Peng, W.X.; Zeng, F.P. Influences of stand characteristics and environmental factors on forest biomass and root-shoot allocation in southwest China. Ecol. Eng. 2016, 91, 7–15. [Google Scholar] [CrossRef]
  34. Zhang, H.; Song, T.Q.; Wang, K.L.; Du, H.; Yue, Y.M.; Wang, G.X.; Zeng, F.P. Biomass and carbon storage in an age-sequence of Cyclobalanopsis glauca plantations in southwest China. Ecol. Eng. 2014, 73, 184–191. [Google Scholar] [CrossRef]
  35. Yuan, D.X. The geology environment and hydro-ecological problem of karst region. Land Res. South China 2003, 1, 21–25. [Google Scholar]
  36. Du, H.; Wang, K.L.; Peng, W.X.; Zeng, F.P.; Song, T.Q.; Zhang, H.; Lu, S.Y. Spatial heterogeneity of soil mineral oxide components in depression between karst hills, Southwest China. Chin. Geogr. Sci. 2014, 24, 163–179. [Google Scholar] [CrossRef]
  37. Cheng, J.Z.; Lee, X.Q.; Theng, B.K.G.; Zhang, L.K.; Fang, B.; Li, F.S. Biomass accumulation and carbon sequestration in an age-sequence of Zanthoxylum bungeanum plantations under the Grain for Green Program in karst regions, Guizhou province. Agric. For. Meteorol. 2015, 203, 88–95. [Google Scholar] [CrossRef]
  38. Zhang, H.; Wang, K.L.; Zeng, Z.X.; Du, H.; Zeng, F.P. Biomass and carbon storage across a chronosequence of Juglans regia plantations in the karst region, southwest China. Forests 2017, 8, 103. [Google Scholar] [CrossRef]
  39. Peng, W.X.; Wang, K.L.; Song, T.Q.; Zeng, F.P.; Wang, J.R. Controlling and restoration models of complex degradation vulnerable Karst ecosystem. Acta Ecol. Sin. 2008, 28, 811–820. [Google Scholar]
  40. Zhang, H.; Wang, K.L.; Xu, X.L.; Song, T.Q.; Xu, Y.F.; Zeng, F.P. Biogeographical patterns of biomass allocation in leaves, stems and roots in China’s forests. Sci. Rep. 2015, 5, 15997. [Google Scholar] [CrossRef] [PubMed]
  41. Zhang, H.; Song, T.Q.; Wang, K.L.; Wang, G.X.; Liao, J.X.; Xu, G.H.; Zeng, F.P. Biogeographical patterns of biomass allocation vary with climate, soil and forest characteristics in China. Environ. Res. Lett. 2015, 10, 044014. [Google Scholar] [CrossRef]
  42. Tan, Q.J.; Wang, W.L.; Chen, H.S.; Qin, Z.S.; Zheng, S.F.; Zhang, H.; Du, H.; Song, T.Q. Coupling relationships between plant community and soil characteristics in canyon karst region in south-west China. Bangladesh J. Bot. 2017, 46, 1117–1127. [Google Scholar]
  43. Condit, R. Research in large, long-term tropical forest plots. Trends Ecol. Evol. 1995, 10, 18–22. [Google Scholar] [CrossRef] [Green Version]
  44. Han, W.X.; Fang, J.Y.; Reich, P.B.; Ian Woodward, F.; Wang, Z.H. Biogeography and variability of eleven mineral elements in plant leaves across gradients of climate, soil and plant functional type in China. Ecol. Lett. 2011, 14, 788–796. [Google Scholar] [CrossRef] [PubMed]
  45. Jonsson, M.; Wardle, D.A. Structural equation modelling reveals plant-community drivers of carbon storage in boreal forest ecosystems. Biol. Lett. 2010, 6, 116–119. [Google Scholar] [CrossRef] [PubMed] [Green Version]
  46. Rosseel, Y. Lavaan: An R package for structural equation modelling. J. Stat. Softw. 2012, 48, 1–36. [Google Scholar] [CrossRef]
  47. Keeling, H.C.; Phillips, O.L. The global relationship between forest productivity and biomass. Glob. Ecol. Biogeogr. 2007, 16, 618–631. [Google Scholar] [CrossRef]
  48. Jagodziński, A.M.; Oleksyn, J. Ecological consequences of silviculture at variable stand densities. I. Stand growth and development. Sylwan 2009, 153, 75–85. [Google Scholar]
  49. Jagodziński, A.M.; Oleksyn, J. Ecological consequences of silviculture at variable stand densities. II. Biomass production and allocation, nutrient retention. Sylwan 2009, 153, 147–157. [Google Scholar]
  50. Castaneda-Moya, E.; Twilley, R.R.; Rivera-Monroy, V.H. Allocation of biomass and net primary productivity of mangrove forests along environmental gradients in the Florida coastal everglades, USA. For. Ecol. Manag. 2013, 307, 226–241. [Google Scholar] [CrossRef]
  51. Austin, J.M.; Mackey, B.G.; Van Niel, K.P. Estimating forest biomass using satellite radar: An exploratory study in a temperate Australian Eucalyptus forest. For. Ecol. Manag. 2003, 176, 575–583. [Google Scholar] [CrossRef]
  52. Carreiras, J.M.B.; Pereira, J.M.C.; Campagnolo, M.L.; Shimabukuro, Y.E. Assessing the extent of agriculture/pasture and secondary succession forest in the Brazilian Legal Amazon using SPOT VEGETATION data. Remote Sens. Environ. 2006, 101, 283–298. [Google Scholar] [CrossRef]
  53. Guo, Z.D.; Hu, H.F.; Pan, Y.D.; Birdsey, R.A.; Fang, J.Y. Increasing biomass carbon stocks in trees outside forests in China over the last three decades. Biogeoscienes 2014, 11, 4115–4122. [Google Scholar] [CrossRef]
Figure 1. Locations of the 318 sampling plots across the southwest of China.
Forests 09 00456 g001
Figure 2. Mean values ± SE of (a) aboveground biomass per ha (AB, Mg/ha); (b) forest root biomass per ha (RB, Mg/ha); (c) annual increment of root biomass per ha (AIRB, Mg/ha/year); and (d) ratio of root biomass per ha and aboveground biomass per ha (RRA) in southwest China. AF: all forest types.
Forests 09 00456 g002
Figure 3. Variation partitioning of environmental factors and stand characteristics in accounting for the root biomass variation across forests in southwest China. The symbols a, b, c represent the independent effects of climate, soil, and stand characteristics, respectively; ab is the interactive effect of climate and soil; ac-, the interactive effect of climate and stand characteristics, bc-, the interactive effect of soil and stand characteristics, and abc-, the interactive effect of climate, soil and stand characteristics.
Forests 09 00456 g003
Figure 4. Structural equation models (SEM) of stand age, stand density, AB on RB, AIRB and RRA. Standardized coefficients are listed beside each pathway. AB aboveground biomass per ha (Mg/ha), RB forest root biomass per ha (Mg/ha), AIRB annual increment of root biomass per ha (Mg/ha/year), RRA ratio of root biomass per ha and aboveground biomass per ha.
Forests 09 00456 g004
Figure 5. Reduced major axis (RMA) regression slopes of the relationships between forest root biomass per ha (RB, Mg/ha) and aboveground biomass per ha (AB, Mg/ha) for different forest types in southwest China. Lowercase letters represent 95% significant differences. BAPF: boreal/alpine Picea abies forest, SPPF: subtropical montane Pinus yunnanensis and P. khasya forest, SPMF: subtropical Pinus massoniana forest, SPPPF: subtropical montane Pinus armandii, P. taiwanensis and P. densada forest, SCLF: subtropical Cunninghamia lanceolata forest, SEBF: subtropical evergreen broadleaved forest, TRMF: tropical rainforest and monsoon forest.
Forests 09 00456 g005
Table 1. Pearson correlations between forest root biomass per ha (RB, Mg/ha), annual growth increment of root biomass per ha (AIRB, Mg/ha/year), ratio of root biomass per ha and aboveground biomass per ha (RRA) and site conditions, for forests stands in southwest China.
Site ConditionsRB (Mg/ha)AIRB (Mg/ha/year)RRA
Longitude (E, °C)−0.227 **0.277 **−0.011
Latitude (N, °C)−0.062−0.267 **−0.093
Altitude (m)0.218 **−0.287 **0.008
Note: * and ** indicate p < 0.05 and p < 0.01 respectively.
Table 2. Stepwise multiple regressions (SMR) between forest root biomass per ha (RB, Mg/ha), annual increment of root biomass per ha (AIRB, Mg/ha/year), ratio of root biomass per ha and aboveground biomass per ha (RRA) with stand characteristics and environmental factors in southwest China.
Root ParametersModelsEquationspR2
RB (Mg/ha)1RB = 0.313AGE + 12.956<0.0010.215
2RB = 0.348AGE − 2.993LAT + 89.689<0.0010.252
3RB = 0.378AGE − 3.040LAT + 0.002 DEN + 85.859<0.0010.265
AIRB (Mg/ha/year)1AIRB =0.031MAT + 0.241<0.0010.098
2AIRB = 0.028MAT + 0.00007DEN + 0.183<0.0010.137
3AIRB = 0.020MAT + 0.00067DEN + 0.000245MAP − 0.014<0.0010.151
4AIRB = 0.013MAT + 0.00005DEN + 0.000242MAP − 0.002AGE + 0.188<0.0010.163
5AIRB = 0.017MAT + 0.00006DEN + 0.000284MAP − 0.002AGE + 0.146TP + 0.188<0.0010.173
RRA1RRA = 0.023PH + 0.071<0.0040.062
AGE: stand age, DEN: stand density, LAT: Latitude, MAT: mean annual temperature, MAP: mean annual precipitation, PH: soil pH, TP: total phosphate (g/kg) in soil.
Table 3. Stepwise multiple regressions (SMR) between stand forest root biomass (RB, Mg/ha), annual increment of root biomass (AIRB, Mg/ha/year), ratio of root biomass per ha and aboveground biomass per ha (RRA) with environmental factors and stand characteristics across different forest types in southwest China.
BAFsForest TypesEquationspR2
RB (Mg/ha)BAPFRB = 0.024DEN + 0.263AGE − 33.613TN + 77.663<0.0010.663
SPPFRB = 0.001DEN − 6.071TP + 20.255<0.0010.301
SPMFRB = −0.01ALT + 0.232AGE + 14.998<0.0010.460
SPPPFRB = 0.627AGE + 2.025LON − 216.558<0.0010.666
SCLFRB = 0.003DEN + 10.801<0.0500.097
SEBFRB = 0.545AGE − 4.369LAT − 1.780LON + 314.346<0.0010.416
TRMFRB = 1.378AGE + 3.552MAT + 0.923LON − 187.721<0.0010.961
AIRB (Mg/ha/year)BAPFAIRB = −0.343TN + 0.000184 + 1.071<0.0010.575
SPPFAIRB = 0.000073DEN − 0.003AGE − 0.012MAT + 0.580<0.0010.831
SPMFAIRB = 0.039MAT − 0.145<0.0010.308
SPPPF
SCLFAIRB = 0.000208DEN + 0.470<0.0120.154
SEBFAIRB = 0.540TP − 0.06AGE + 0.001MAP + 0.101<0.0010.173
TRMFAIRB = − 0.001AB + 1.362<0.0010.964
RRABAPFRRA = 0.000082DEN − 0.001AGE + 0.54TN<0.0010.838
SPPFRRA = 0.000013DEN − 0.001AGE + 0.015LAT − 0.259<0.0010.515
SPMFRRA = 0.004MAT + 0.000016DEN + 0.046<0.0010.493
SPPPF
SCLFRRA = −0.006MAT + 0.329<0.0010.367
SEBFRRA = −0.010LON + 0.001AGE − 0.12LAT − 0.000012DEN + 1.607<0.0010.487
TRMFRRA = 0.000026DEN − 0.000179AB + 0.001AGE + 0.254<0.0010.994
Note: (1) BAFs: root items, BAPF: boreal/alpine Picea abies forest, SPPF: subtropical montane Pinus yunnanensis and P. khasya forest, SPMF: subtropical Pinus massoniana forest, SPPPF: subtropical montane Pinus armandii, P. taiwanensis and P. densada forest, SCLF: subtropical Cunninghamia lanceolata forest, SEBF: subtropical evergreen broadleaved forest, TRMF: tropical rainforest and monsoon forest. (2) AB: aboveground biomass, AGE: stand age, DEN: stand density, LAT: latitude, LON: Longitude, MAT: mean annual temperature, MAP: mean annual precipitation, TN: total nitrogen (g/kg) in soil, TP: total phosphate (g/kg) in soil. (3) “―” denotes no proper fitting model.

