Forest Ecosystem Services: An Analysis of Worldwide Research
by
 , ,
, ,
José A. Aznar-Sánchez
* ,
,
Luis J. Belmonte-Ureña
,
María J. López-Serrano
and
Juan F. Velasco-Muñoz
Department of Economics and Business, Research Centre CAESCG and CIAIMBITAL, University of Almería, 04120 Almería, Spain
*
Author to whom correspondence should be addressed.
Forests 2018, 9(8), 453; https://doi.org/10.3390/f9080453
Submission received: 12 June 2018
/
Revised: 18 July 2018
/
Accepted: 23 July 2018
/
Published: 26 July 2018
(This article belongs to the Section Forest Ecology and Management)
Abstract
:The relevance of forests to sustain human well-being and the serious threats they face have led to a notable increase of research works on forest ecosystem services during the last few years. This paper analyses the worldwide research dynamics on forest ecosystem services in the period from 1998 to 2017. A bibliometric analysis of 4284 articles was conducted. The results showed that the number of published research articles has especially increased during the last five years. In total, 68.63% of the articles were published in this period. This research line experiences a growing trend superior to the general publishing trend on forest research. In spite of this increase, its relative significance within the forest research is still limited. The most productive subject areas corresponded to Environmental Science, Agricultural and Biological Sciences and Social Sciences Economic topics are understudied. The scientific production is published in a wide range of journals. The three first publishing countries are United States, China and the United Kingdom. The most productive authors are attached to diverse research centres and their contributions are relatively recent. A high level of international cooperation has been observed between countries, institutions and authors. The findings of this study are useful for researchers since they give them an overview of the worldwide research trends on forest ecosystem services.
1. Introduction
Ecosystem services are the direct and indirect contributions to human well-being by ecosystems and these benefits mainly refer to provisioning, regulating, cultural and supporting services needed to maintain other services [1,2]. Firstly, provisioning services refer to all economic activities derived from physical goods provided by an ecosystem like food, raw materials and drinking water. Secondly, regulating services refer to the indirect benefits provided by an ecosystem like climate regulation, prevention of soil erosion and air purification. Thirdly, cultural services refer to the non-material services resulting from experiences, providing personal and cultural enrichment. And finally, supporting services refer to the rest of functions that make the ecosystems possible to provide all above-mentioned benefits [3]. These diverse services are interrelated in many different ways, ranging from synergistic to tolerant, conflictive and mutually exclusionary ones. The concept of ecosystem services is multidisciplinary by nature and exhaustive analyses require collaboration between different disciplines, inherently combining the natural and social sciences [4].
The field of ecosystem services began to grow following studies by Daily [5] and Costanza et al. [6]. Initiatives such as the Millennium Ecosystem Assessment project [1], the Economics of Ecosystems and Biodiversity study [7] and the Intergovernmental Science-Policy Platform on Biodiversity and Ecosystem Services [8] are milestones that turned the concept into a political instrument to achieve the sustainable use of natural resources [9]. The evaluation of ecosystem services is aimed at providing useful knowledge for policy-making, defining strategies and managing ecosystems by stakeholders [10]. Regions that are highly susceptible to the supply of ecosystem services and human well-being need to be informed of all aspects of trends in the flow of ecosystem services, including the impact of government intervention and social and ecological pressures [11]. The theoretical framework of ecosystem services has the potential to support informed decision-making with evidence-based knowledge. At the time, it contributes to face up challenges to ensure sustainability [10] and it can be applied within forest ecosystems.
Forests are widely acknowledged as being principle ecosystem service providers [12]. Some national classifications consider up to 100 different forest services, including food, timber and fuel production; water conservation and regulation; nutrient retention; carbon sequestration; biodiversity protection; climate regulation; ecotourism; and spiritual and traditional values [1,13]. There are several drivers of change that threaten worldwide forest system sustainability. Among them, we should highlight the expansion of farming land and urbanization areas, as well as the adverse effects of climate change. Food security is a global concern due to the continuously growing population, particularly in disadvantaged areas [14,15]. Economic development and the expansion of cultivation surfaces are the principal factors driving changes in forest land use in the last decade. The 2016 FAO State of the World’s Forests Report [16] estimated the total area of global forests to be 30.74% of the planet’s surface. Between 2000 and 2010, the net deforestation registered 7 million hectares annually in tropical countries and a 6 million hectares net increase in the agricultural land per year. Often land managers consider farming and forest uses as rivals. Further ways of sustainable and complementary management of land are hereby ignored. It must be acknowledged that adequate forest system management, such as forestry and multifunctional systems, not only directly contributes to human well-being in the form of provisioning services but also produces synergies with agricultural systems capable of increasing food production and other complementary services [17]. As complementary services we understand pollination services, biological control of pests and prevention of soil erosion.
Climate change threatens forests and their service flow. Some of the consequences of global climate change are expected to be long-term droughts and imbalances in water supplies; a decrease in carbon sequestering capabilities; soil erosion, loss of soil fertility; desertification, reduction in food production capacity; and the threat posed by the prevalence of certain species and communities [18,19]. An increase in arid land, principally due to the decrease of precipitation but also due to higher temperatures, is one of the main threats to diversity and the survival of certain forests [19]. All this can generate a wide range of large-scale and difficult impacts, which can be costly or irreversible for ecosystems and biodiversity [20,21]. This would reduce the ability to mitigate adverse effects and, consequently, reduce human wellbeing, particularly for the poorest populations of low-income countries and arid climate regions [14,22].
The bibliometric analysis has been implemented to study the diverse research fields related to forests. Malesios and Arabatzis [23] assess journals on forestry; Aleixandre-Benavent et al. [24] analyse research trends on worldwide deforestation; Song and Zhao [25] make use of the bibliometric method to analyse the global research on forestry ecology in a 10 year-period. Regarding ecosystem services, the bibliometric analysis has also been implemented. For instance, Zhang et al. [26] assess the global research on ecosystem services and Tancoigne et al. [27] analyse the role of Agricultural Sciences in the study of ecosystem services. However, no bibliometric studies were found for forest ecosystem services.
The bibliometric analysis pursues the identification, organization and analysis of the main components within a specific research area [28]. Garfield was a forerunner of this methodology in the mid-twentieth century [29]. The application of this method has been extended to areas like medicine, engineering, biology and administration [30]. Bibliometry is based on statistical and mathematic analysing tools. Thanks to them the evolution and research trends of a topic can be studied, as well as the relevance of its publications [31]. Furthermore, this methodology allows the identification of the main driving forces of a study field, that is, authors, journals, institutions and countries [32].
As traditional approaches in the bibliometric analysis we can find co-occurrence analysis, co-quotation and bibliographic coupling applied to database metadata. These metadata usually refer to the year of publication, authors’ names, institutions and countries, topic categories, article citations and keywords [33]. The technical evolution in recent years has given rise to the development of viewing tools through text extraction and data mining [34], development of analysis frames to assess innovation [35], overlaying maps and variable associations [36], tool developments based on routine types of automatized software [33] and methods to identify and view evolution ways of specific scientific topics within a time segment [37].
Durieux and Gevenois [38] defined diverse types of indicators within the bibliometric analysis. Such indicators refer to productivity, quality and structure of scientific production. Productivity indicators show the amount of works published on a field and can also be applied to authors, journals and institutions. As far as qualitative indicators are concerned, some of them like the number of citations, H-index and impact factor-based journal rankings are well known. Structure indicators measure established links between agents. It has a special relevance in those areas where international cooperation is required by the own research topic.
The obtained results by the bibliometric analysis are very useful for diverse users. It may help junior researchers approach a topic, get to know the main research lines within a topic, identify the most productive agents and learn about future researching trends. Senior researchers can, at the time, keep updated about a specific subject [34]. The bibliometric analysis of rapidly growing areas related to the development of new technologies and innovations may also show investment options for analysts and business agents [35]. Furthermore, data compilation on the evolution and new trends of subjects related to the management of natural resources and ecosystems, environmental protection, climate change or sustainability can be very useful for research agencies, government institutions and private research centres when trying to understand collaboration strategies and identify key collaborators to strengthen up potential weaknesses [39].
The consequences of climate change, the deterioration of the environment and the demands of an increasing world population are the driving factors behind this increase of publications on forest ecosystem service research. All this has generated a new and growing corpus of scientific literature which needs to be analysed, organized and systematized. However, there is no knowledge of studies devoted to the dynamic analysis of this global research field. This study aims to fill this knowledge gap through the analysis of the worldwide dynamics of research on forest ecosystem services during last 20 years. The main objective of this work is to identify the evolution of this research line and assess the relative significance of studies devoted to ecosystem services within the forest research area.
2. Methodology
2.1. The Bibliometric Method
The current work aims at showing an overview of the general research dynamics and the state of art regarding forests ecosystem services. Hence, we have preferred to apply a traditional approach based on co-occurrence including the three types of mentioned indicators (productivity, quality and structure). In this way, we will identify authors with the highest number of published articles on forest ecosystem services; as well as the most productive journals, institutions and countries. Quality indicators, especially those related to journals, are very interesting for researchers since a way to assess their work refers to the relevance level of the journal which publish their research results [23]. In our work, we have taken into account some quality indicators: the number of citations, the H-index and the Scimago Journal Rank (SJR) impact factor of journals. The H index is the h number of documents (Np) that has at least h citations in each one [23]. SJR is an indicator to classify scientific journals generated by Scimago. It corresponds to a pondered measure of the received citations which considered the topic and the journal prestige where the citation took place [40]. Through the use of mapping tools, we aim at showing the linking network between active agents in this research field [41]. Moreover, the mapping techniques are also applied to keywords in order to identify research trends.
2.2. Data Processing
There are two databases which are mostly used for a bibliometric analysis: Scopus and Web of Science (WoS). When selecting our article sample we first had to answer the question of which database are suited to our purposes. To solve this question, we considered previous works which assess both databases in terms of comparability and statistical stability. According to the results by Mongeon and Paul-Hus [42], WoS includes a lower number of indexed journals than Scopus. Furthermore, while 84.00% of the WoS-indexed titles can be found in Scopus, only a 54.00% of the Scopus indexed publications are comprised by WoS [43]. In this sense, Scopus allows us to minimize the risk of losing documents during the search. On the other hand, Scopus is considered the biggest repository of peer reviewed literature. It is easily accessible and offers some tools for data viewing and analysis, as well as the option to download contents in different formats [44]. Taking into account all these advantages, we have opted for Scopus to select our sample unlike other forest bibliometric studies which have been based on WoS [24].
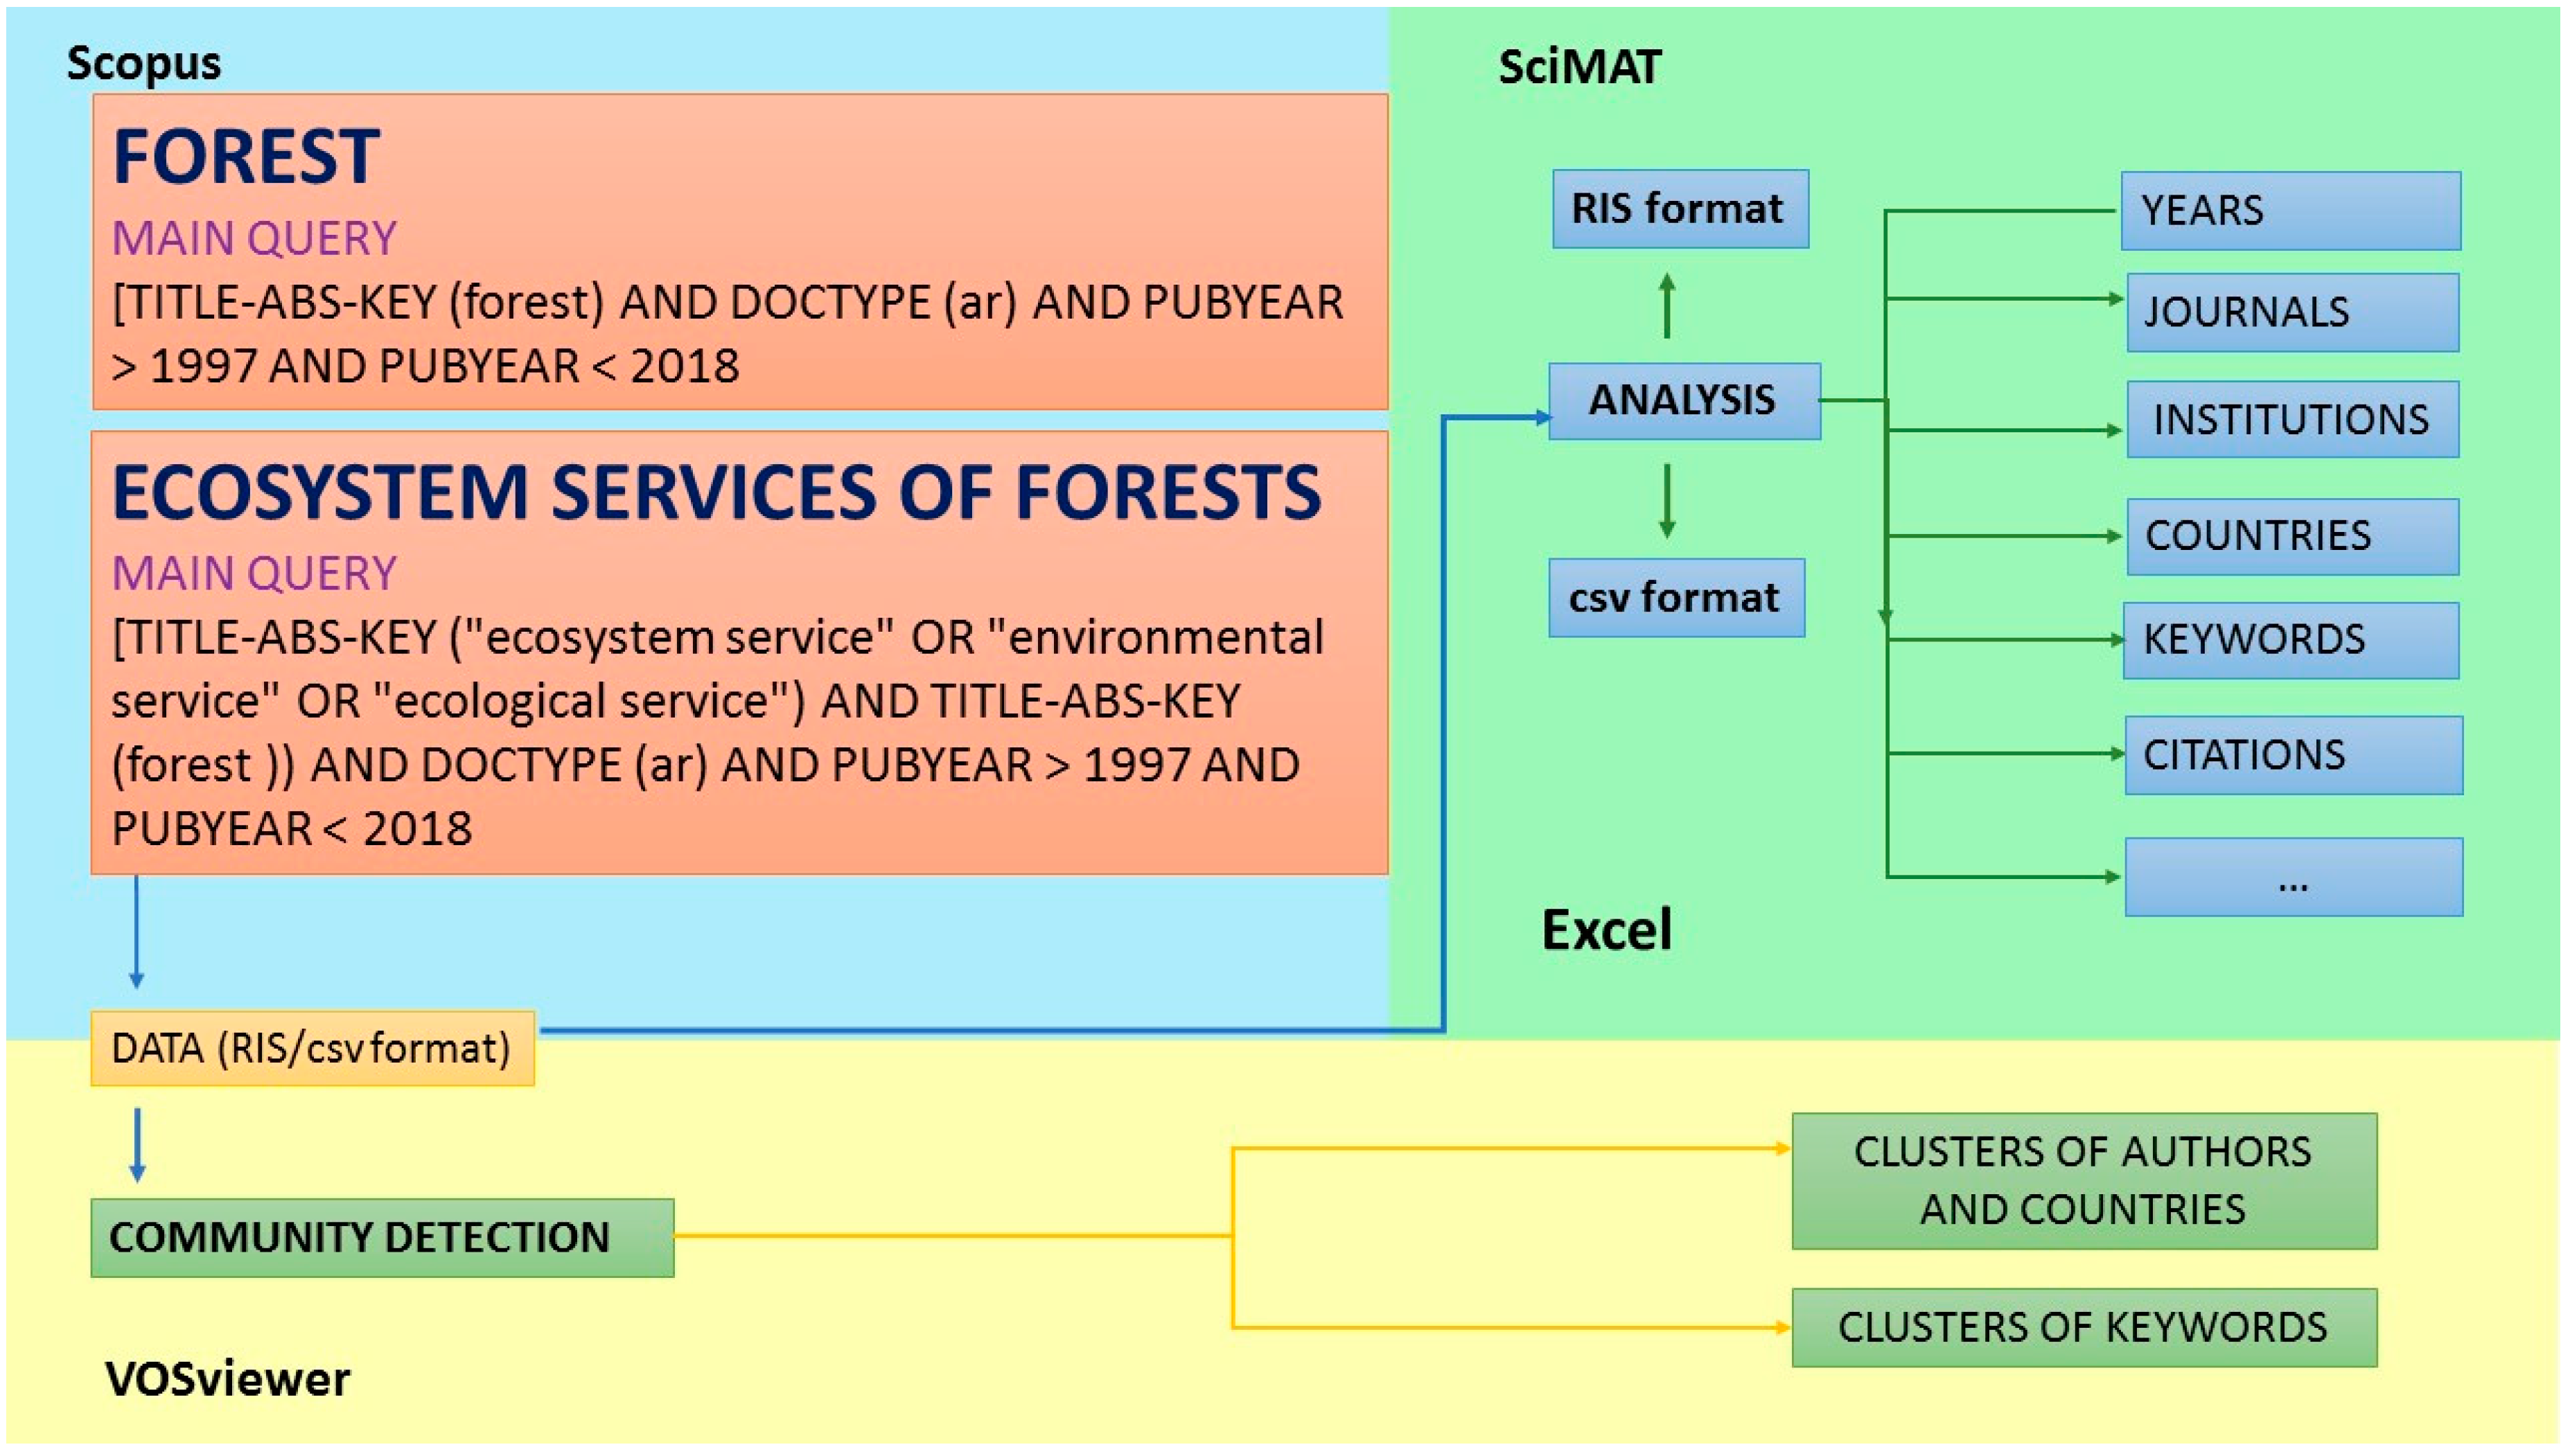
We used the following parameters for this search: “TITLE-ABSTRACT-KEYWORD (“ecosystem service” OR “environmental service” OR “ecological services”) AND TITLE-ABSTRACT-KEYWORD (forest).” The ecosystem service concept has evolved during last decades with the development of the Framework of Ecosystem Services. The parameters used in our work are the most used terms by the studies included in this Framework and are similar to the terms used in other articles like Tancoigne et al. [27]. The search was performed in February 2018, the selected study period was from 1998 to 2017 since we believe that this topic research was born after 1997 with the researches by Daily [5] and Constanza [6], among others. Only papers up to 2017 were included in order to compare complete 12-month periods. The sample was limited to articles in order to prevent duplicates of analysed works [45]. It must be taken into account that different search parameters would give different results. In this way, the analysis sample of this study was made up of 4284 articles. We have also carried out a general search of articles on forest indexed by Scopus during the same period, in order to compare our research field with the general forest research trend. Figure 1 shows the conducted searches and the applied methodology in our research work.
The analysed variables were the number of articles published per year, the author, institution, country, subject area, journal and keyword. After downloading this information in RIS and CSV formats, duplicates were eliminated. After the corresponding data processing, different tables and figures were drawn up in order to view and analyse the data. For these tasks, we have used Excel (version 2016, Microsoft, Redmond, WA, USA) and SciMAT (v1.1.04, Universidad de Granada, Granada, Spain). VOSviewer (version 1.6.7, Leiden University, Leiden, The Netherlands) was used for network maps due to its wide use in this kind of study [46]. A study of the keywords to be analysed was carried out within the research trends in forest ecosystem services. A regrouping of terms was used to eliminate duplications due to plurals, hyphenations, words in upper case and so forth.
3. Results and Discussion
3.1. Evolution of Scientific Production
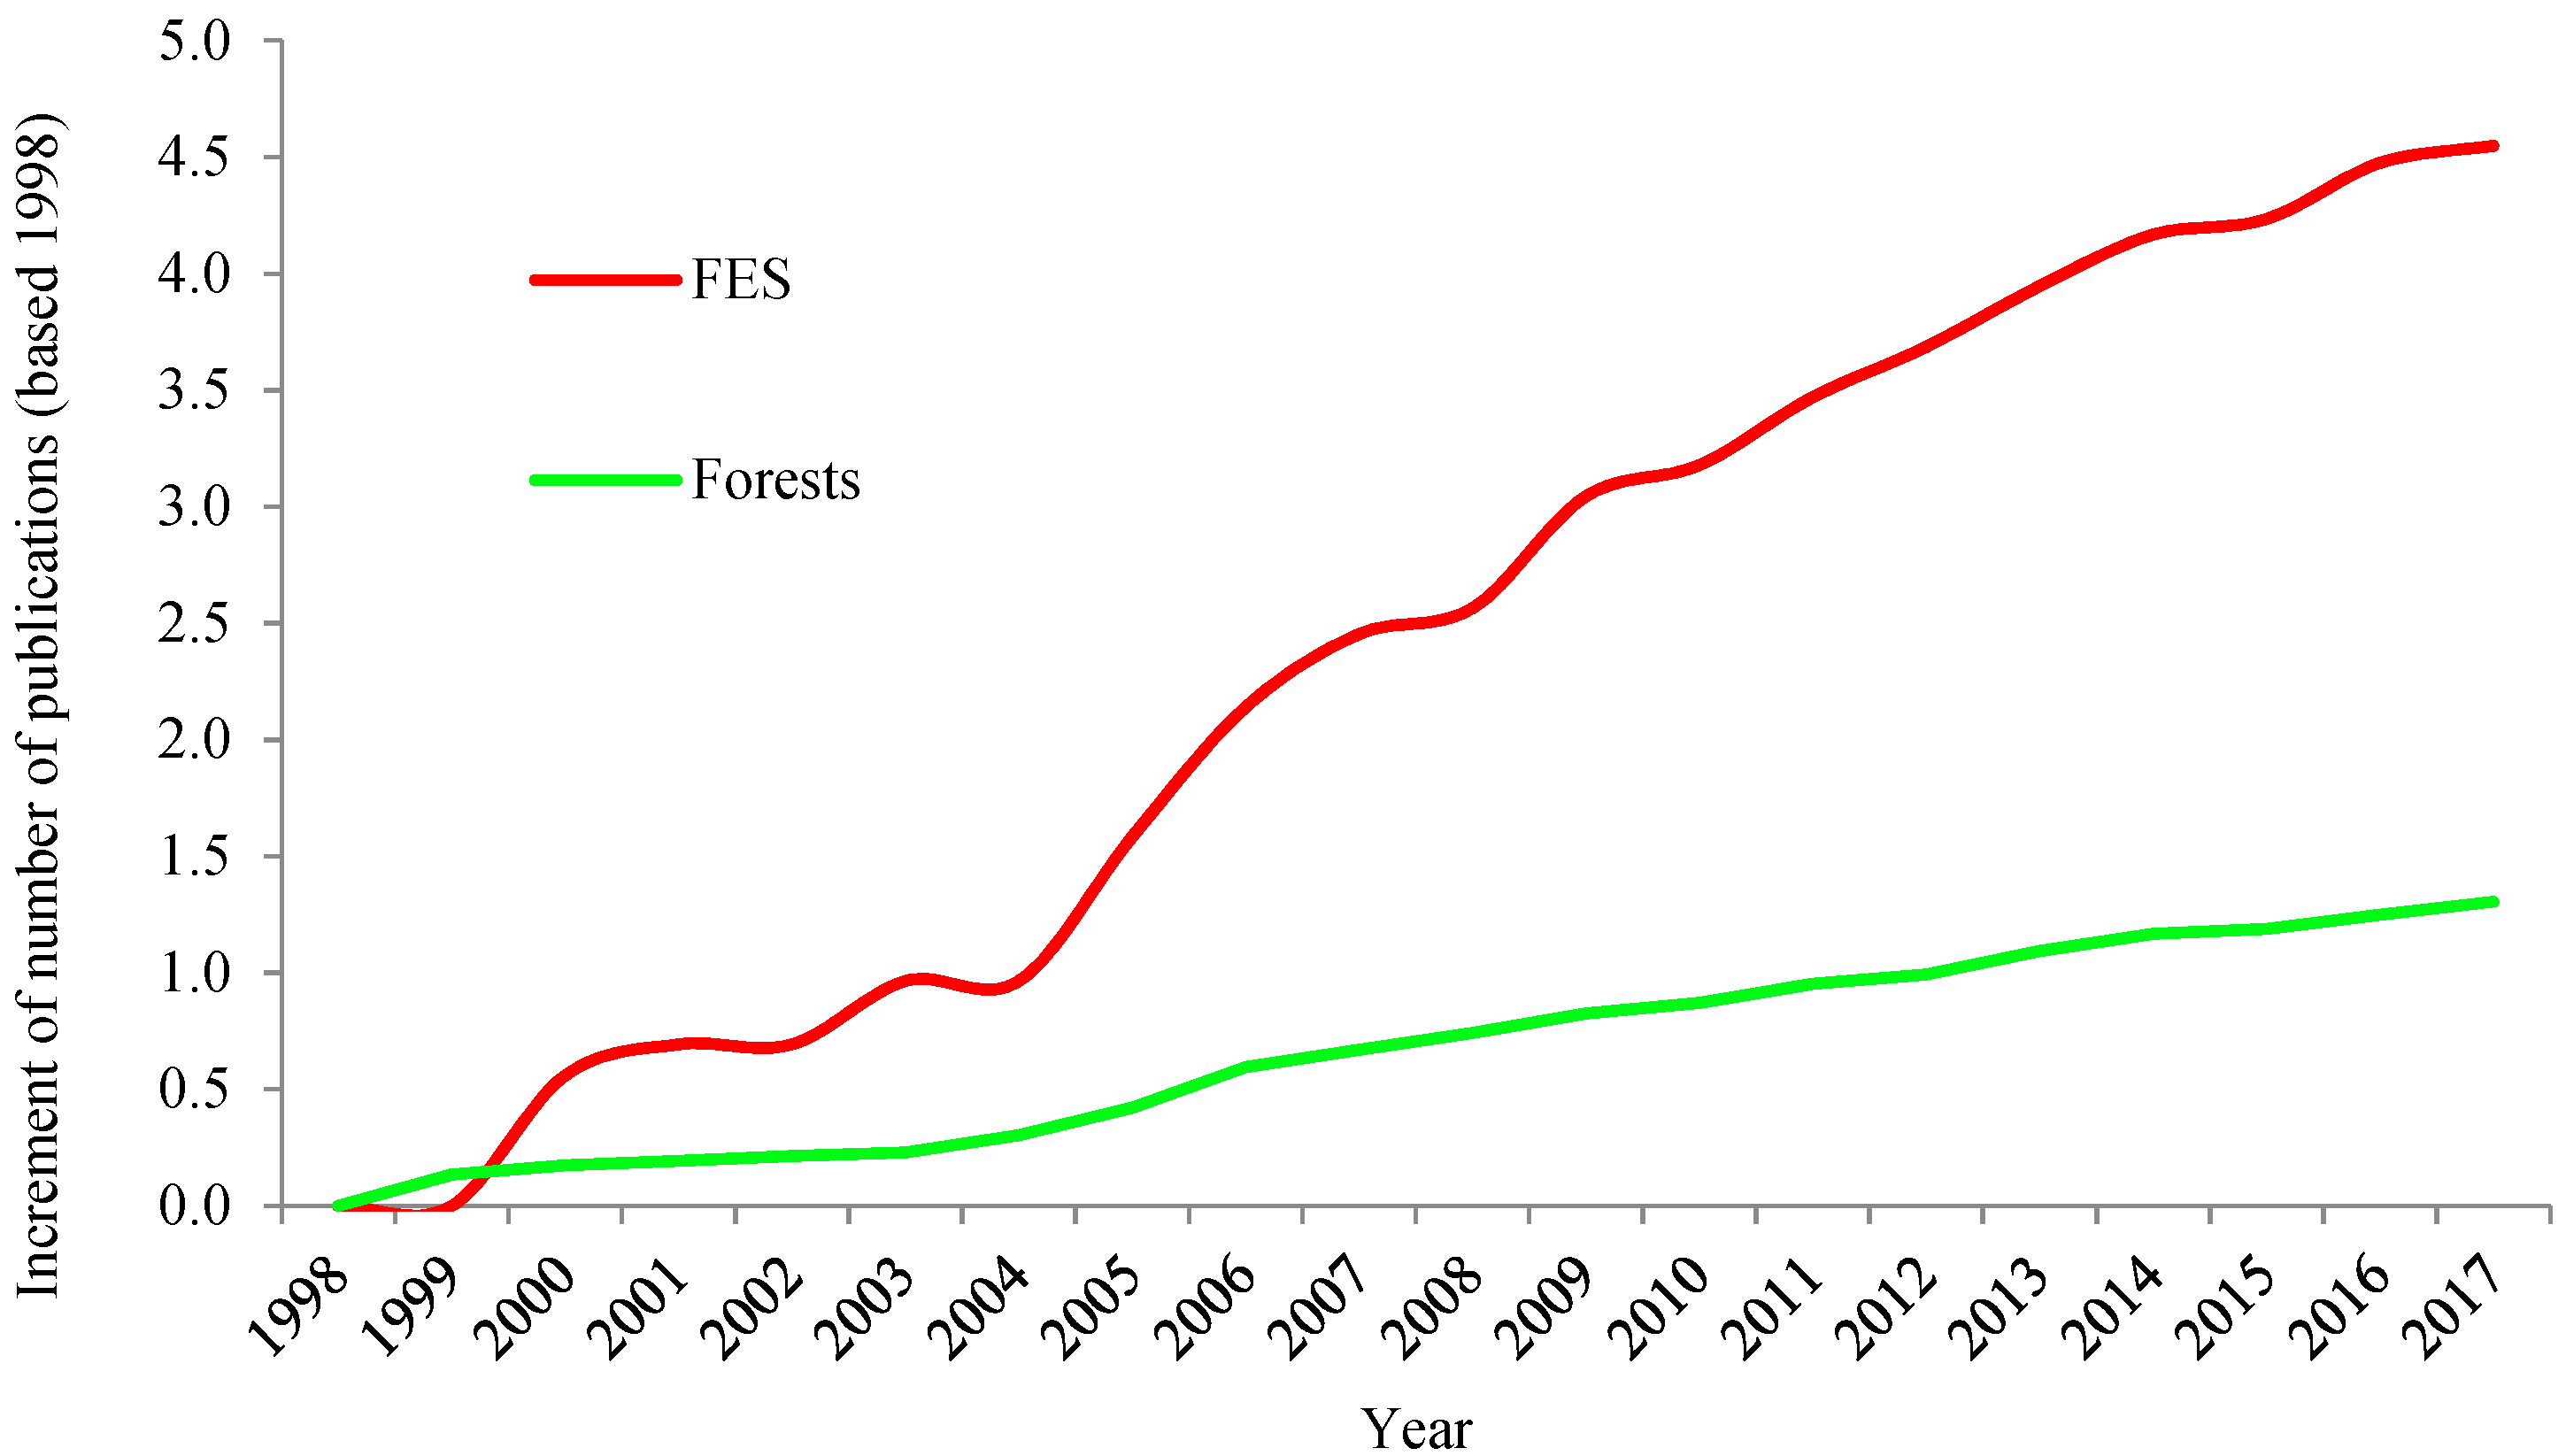
Table 1 shows the evolution of the main characteristics of articles on forest ecosystem services (FES) published from 1998 until 2017 (articles, references, authors, citations, journals and countries). The number of articles published on FES (A) has grown almost exponentially over the last 20 years. It has increased from eight in 1998, to 756 in 2017. The majority of articles (68.62%) were published in the last five years (2013–2017). The FES/F column shows the annual number of FES articles divided by the total number of articles published on forest, as a percentage. The article presence on FES has grown from 0.14% in 1998 to 3.71% in 2017. Figure 2 shows a comparison between the increased number of published research on FES and on forests in general. Logarithms were used to homogenize the time series. In order to compare the growth in the number of articles within each line of research, the average accumulated annual growth rate was calculated. Taking 1998 as a baseline, the average annual growth of articles on forests was 7.11%, while that of FES increased to 27.05%. Therefore, this line of research showed a growing trend in the last 20 years, greater than the trend in forest research. Bojovic et al. [47] analysed a set of journals during the 2006–2010 period in order to identify research trends of forestry journals. 16,258 documents from 42 journals were classified in 22 sub-disciplines. None of these categories were linked to ecosystem services. Nowadays, there are over 4000 research articles on ecosystem services. It can be stated that this topic is gaining more and more relevance within the forest research. Nevertheless, data also show that this boost is still recent. It should be considered that this growth is conditioned by the applied sample selection method. Those works which analyse services but do not use the ecosystem service terminology have not been included in our sample. This paper shows therefore the dynamics followed by articles which have implemented the ecosystem service framework in the forest research.
The number of references (NR) included in the articles has grown constantly, resulting in the number of references per article (NR/A) rising from 37.25 in 1998 to 49.82 in 2017. The average number of citations per article (TC/TA) has increased constantly, from 0.13 in 1998, to 3.86 in 2017. The average number of authors per article (AU/A), has more than doubled during this time, from 1.88 to 4.45. The number of journals (J) that published at least 1 article on FES in a specific year has increased from 8 in 1998, to 276 in 2017. This fact indicates that FES research is positively received in an ever-growing group of journals. Finally, the number of countries (C) publishing articles on FES has increased rapidly during this period, from five in 1988, to 94 in 2017. The fact that such a wide range of countries is involved in FES research shows that it is a research line that has received growing attention worldwide.
3.2. Distribution of Scientific Production by Subject Categories and Journals
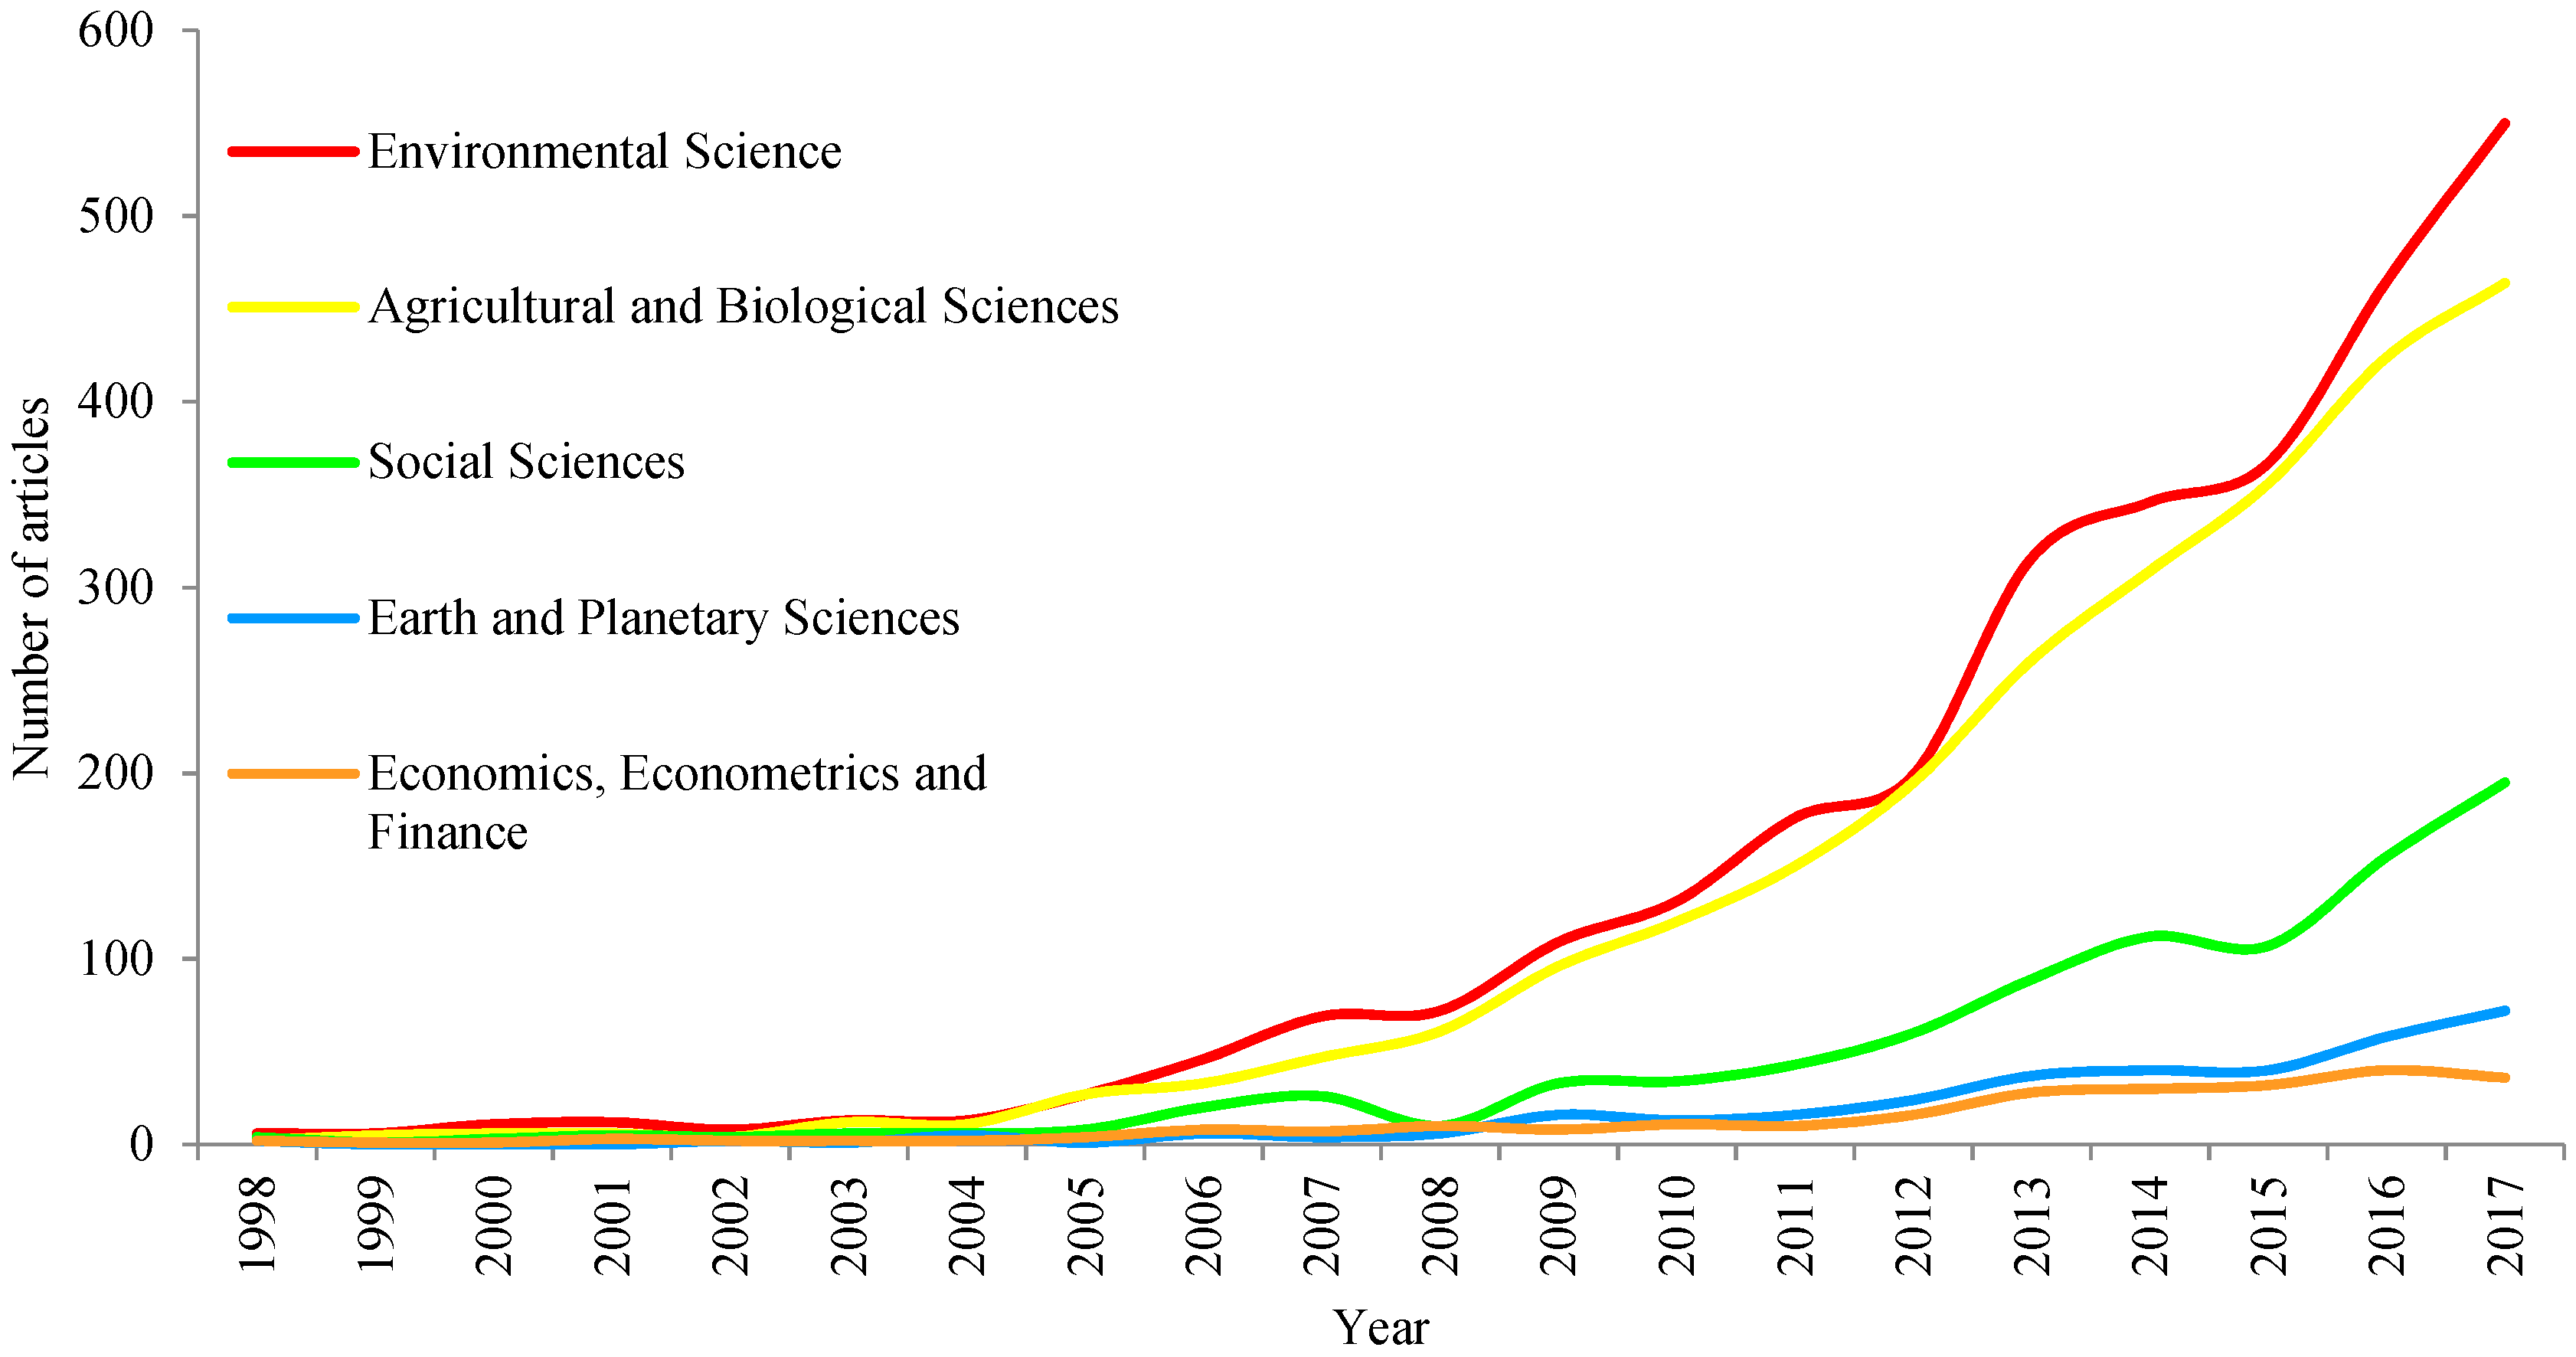
Figure 3 shows the evolution of the principal subject categories under which Scopus classifies articles on FES. Note that one article may be simultaneously included in more than one category. Throughout practically the whole period analysed, 68.67% of the published articles were classified under Environmental Science, 60.43% in Agricultural and Biological Sciences, 20.59% Social Sciences, 7.67% Earth and Planetary Sciences and 6.13% under Economics, Econometrics and Finance. The remaining categories did not account for 5% of published articles. Dobbertin and Nobis [48] reviewed the publications of 6 journals on forests during the 1979–2008 period. As a result, they highlighted that the titles of forest(ry) publications increasingly include topics from Natural Sciences but Economic and Social Sciences topics are still underrepresented. This deficiency has also been pointed out by Aleixandre-Benavent et al. [24] regarding deforestation. They concluded that social and economic topics are understudied. However, in our work we could observe that in the FES studies there is a relevant presence of Social Sciences while the Economic presence is still limited.
Table 2 shows the 10 journals with the most publications on FES from 1988 to 2017. To facilitate the analysis of the dynamics during the period analysed, four sub-periods of five years were distinguished. The most productive journal in this field was Forest Ecology and Management, with a total of 166 articles. This journal’s first article on FES (1st A) appeared in 2001, however, it did not take first place in the number of articles published until 2009. It is also the journal with the most citations, the largest SJR index and the second largest average number of citations per article (36.89). This journal was already highlighted by Bojovic et al. [47] within the forest research. This indicates that it has opted for publications on FES. This journal is also a reference publication in the forest sciences. This decision seems to be right since its published articles on FES reached higher citation records than the rest. The second journal with the largest number of published articles is Shengtai Xuebao Acta Ecologica Sinica, with a total of 113 articles. This journal publishes many articles but its SJR index is low, being the only top ten journal in the fourth quartile. Ecosystem Services is in third place with 109 articles. It is the most recent publication to join this field of research, publishing its first article on FES in 2013. Despite this, it takes the lead in the number of articles published in the most recent period, 2013–2017 and has the highest SJR index (1.935). It should be noted that the journals with the highest number of articles on FES are of the highest quality. All of them but one were found to be within the first quartile according to their SJR. Ecological Economics has the largest average number of citations per article, with 48.45 citations. These 10 journals comprise of only 22.08% of the total number of articles published, which indicates that scientific articles on FES are published in a very wide range of journals.
Table 2 also shows the percentage of forest articles which deal with ecosystem services per journal ((FES/F: number of articles on forest ecosystem services/number of published articles on forests) × 100). The analysis period of each journal begins with its first publication on FES. The journal with the highest percentage of articles on FES is Ecological Economics with 22.45%, followed by Land Use Policy with 19.95%, Ecology and Society with 18.48% and Agriculture, Ecosystems and Environment with 12.45%. The case of Ecosystem Services is special since it is precisely devoted to ecosystem services. That is why no data are offered. This set of journals reach a higher citation level when publishing on ecosystem services than when publishing on forest (17.59 versus 15.08).
3.3. Countries, Institutions and Authors
Table 3 shows the evolution in the number of articles for FES in the top 10 countries with the most articles published from 1998 to 2017. The United States placed first, followed by China, the United Kingdom, Germany and Brazil. The United States maintained the first position throughout this period, with no notable changes in the last decade. The table also shows the number of articles published per million inhabitants of each country (APC: the number of articles per 1 million inhabitants). If this variable is considered, Australia comes first before the United Kingdom, Canada, Germany and Spain. The United States had the largest number of total citations, followed by the United Kingdom, Canada, Germany and Australia. However, considering the number of citations per article, Spain took first place with 34.10, followed by Canada with 31.65, Australia with 30.90, France with 27.67 and the United States with 26.08. These figures are an indicator of the greater standing of these countries’ publications based on the number of citations. By contrast, China had the least number of citations relative to the number of articles published (12.36).
The countries in this group are also considered to act as the 10 main research drivers in the forest research, except for Italy. Moreover, the leading countries on FES scientific production are the same ones as those identified by Song and Zhao [25] in Forestry Ecology. The United Kingdom is the country with the highest article percentage on FES if we consider its publications on forests 3.19%, followed by Italy with 3.04%, Germany with 2.48% and Spain with 2.40%. Germany, the United Kingdom and the United States are the countries with less FES citations compared to those on forest. Spain is the country with the biggest difference between the citations of FES articles compared to those on Forest.
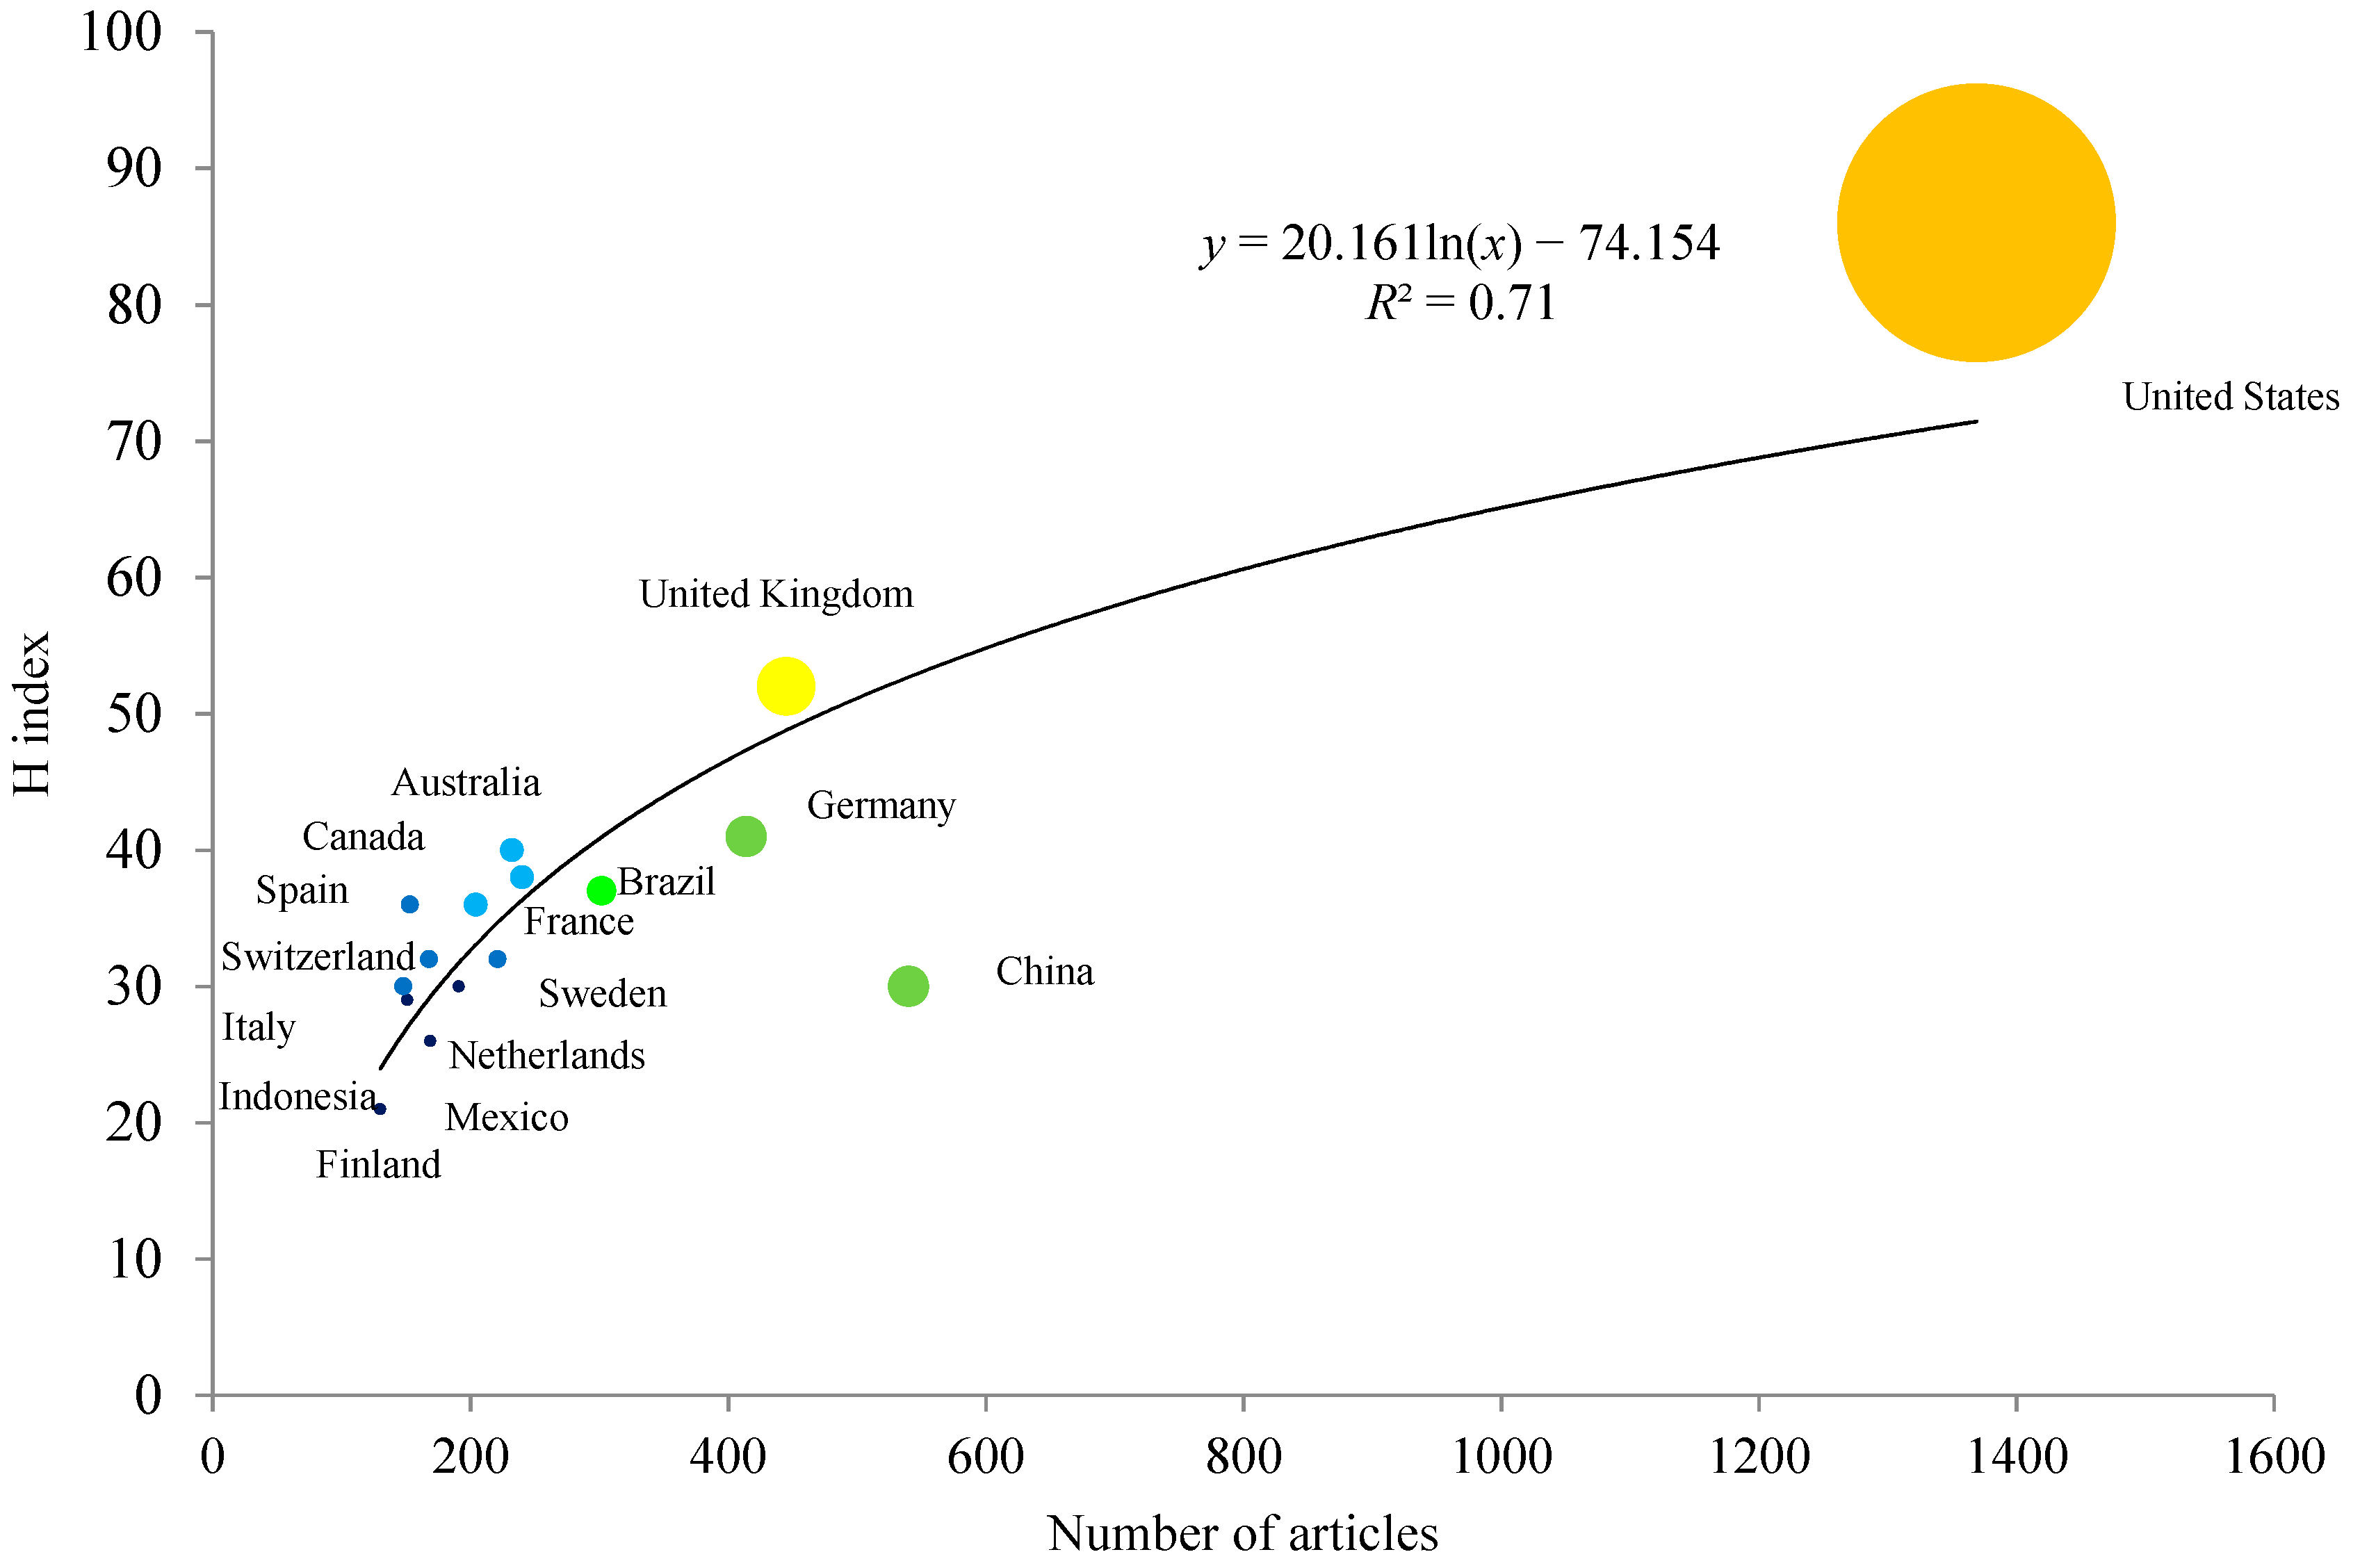
Figure 4 shows the correlation between the H index and the total number of articles. An exponential model has been used to simulate the rise of the H index in correlation with the rise in the total number of articles for each country during the 20-year period analysed. A high correlation can be observed (R2 = 0.71).
Table 4 indicates the percentage of articles that each country produced in collaboration with another (IC), the number of countries with which such collaborations occurred (NC) and the top 5 collaborating countries (main collaborators). Spain had the largest percentage of articles produced in collaboration (77.94% of the total), followed by the United Kingdom (76.41%), France (74.66%) and Germany (71.74%). The United States had the largest number of collaborations with a total of 104 countries, foremost among them was the United Kingdom, followed by China, Brazil, Canada and Australia. The United Kingdom was the second country with the most international collaborators, with 96 countries, principally with the United States, followed by Australia, Brazil, Germany and the Netherlands. The United States and the United Kingdom are also in the group of most collaborative countries among the top 10. The United States is the foremost collaborator with 8 countries (China, the United Kingdom, Germany, Brazil, Canada, Australia, France and Italy). Articles produced in collaboration with other countries (IC) obtain a greater number of citations compared to articles produced with no collaboration (NIC). These figures indicate the greater impact of articles published in collaboration with other countries.
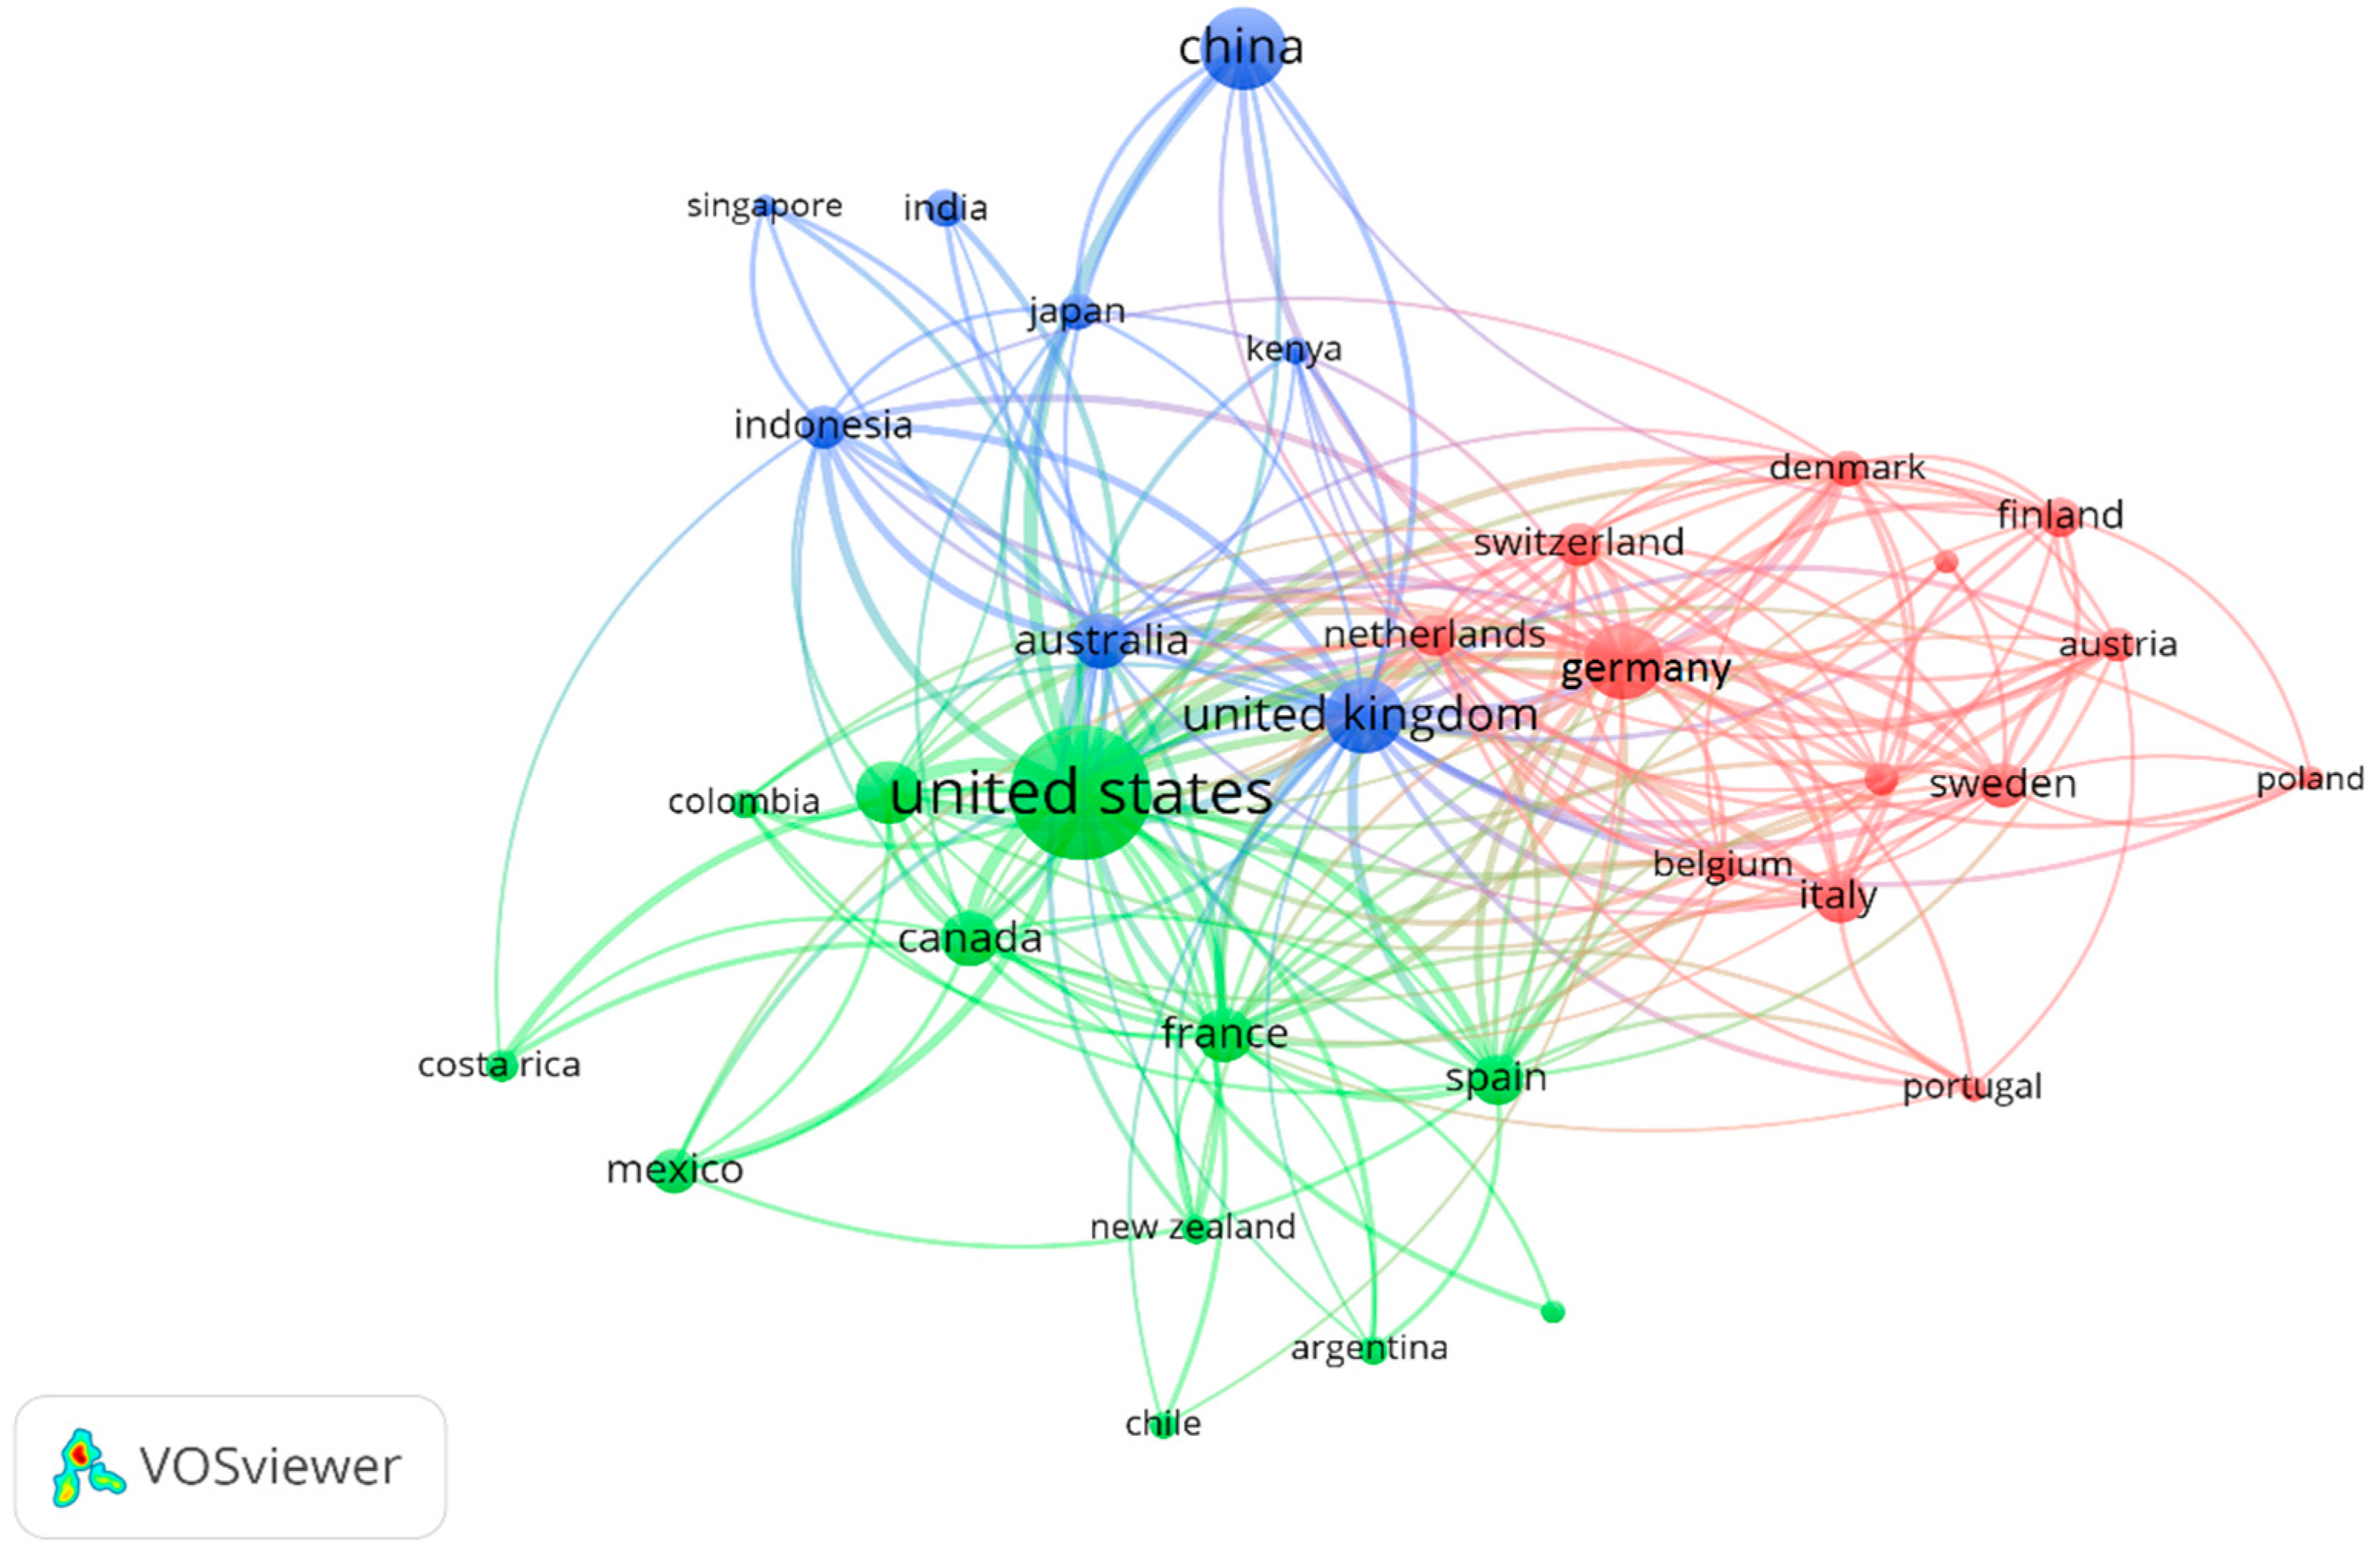
Figure 5 shows a network illustrating the international collaboration between the principal publishing countries. The size of the circle varies with the number of articles published by each country, whereas the colour corresponds to the cluster formed by the different groups of countries. Three groups can be distinguished. The first group (blue) is led by China with a strong collaborative link to the main Asian countries, Australia and the United Kingdom. The second cluster (green) is led by the United States. In this cluster, the main collaborating countries are those of the North American continent, France and Spain. The third group (red) is led by Germany. This cluster shows collaborations between the remaining European countries (Italy, Denmark, Finland, Sweden, the Netherlands and so forth).
The principal characteristics of the 10 most productive institutions on FES are displayed in Table 5. These institutions are to be found in eight countries. Only China and the United States have two centres in the top 10. The Chinese Academy of Sciences takes the first position with 220 articles. It ranks first as the most productive institution since 2005. This is followed by the USDA Forest Service and the Universidad Nacional Autónoma de Mexico, with 184 and 85 articles, respectively. The USDA Forest Service has the most citations and greatest H index. The Wageningen University and Research Center (the Netherlands) has the largest average number of citations per article (33.44). The Center for International Forestry Research in Indonesia has the largest proportion of research in international collaboration, with 97.53% of the total, followed by the Kobenhavns Universitet (Denmark) with 86.96% and the Wageningen University and Research Centre with 86.25%. In all institutions, except the German Universität Göttingen, the articles written in international collaboration had a higher number of citations per article than those not written in collaboration. These data show that international cooperation links between research centres contribute to increasing the impact of published articles.
Four of these institutions are the same ones as those indicated by Song and Zhao [25]: Chinese Academy of Sciences, the USDA Forest Service, the University of Florida and the Universität Gottingen. This difference may be due to the time gap between both studies and the different analysed forest topics. The percentage of FES articles compared to the percentage of forest publications per institution shows a great disparity. The Research Center for Eco-Environmental Sciences and the Center for International Forestry Research reach the highest percentages with 14.92% and 13.15% respectively. The Center for International Forestry Research, the Wageningen University and Research Centre, the USDA Forest Service and the Research Center for Eco-Environmental Sciences are the institutions which reach a higher impact of their FES articles.
Table 6 shows the 15 authors with the largest number of FES articles published. Most of these authors published their first articles on this subject (1st A) in the first decade of the 21st century and they all continued working in this field of research, given that their most recent articles on FES (Last A) have all appeared in the last two years (2016 and 2017). These results show that this field of research is in a period of consolidation. The wide range of origins of these authors is also notable, representing 12 different institutions. The author with the largest number of publications was Zhiyun Ouyang of the Research Center for Eco-Environmental Sciences, with 28 articles with 284 citations, an H index of 10 and an average of 10.14 citations per article. The authors with the most accumulated citations were Sven Wunder, Harald K. M. Bugmann, Teja Tscharntke and Gretchen C. Daily. The authors with the greatest number of citations per article were Harald K.M. Bugmann, Sven Wunder and Gretchen C. Daily. Marco Marchetti was the most recent researcher to join these ranks, publishing his first article on FES in 2012.
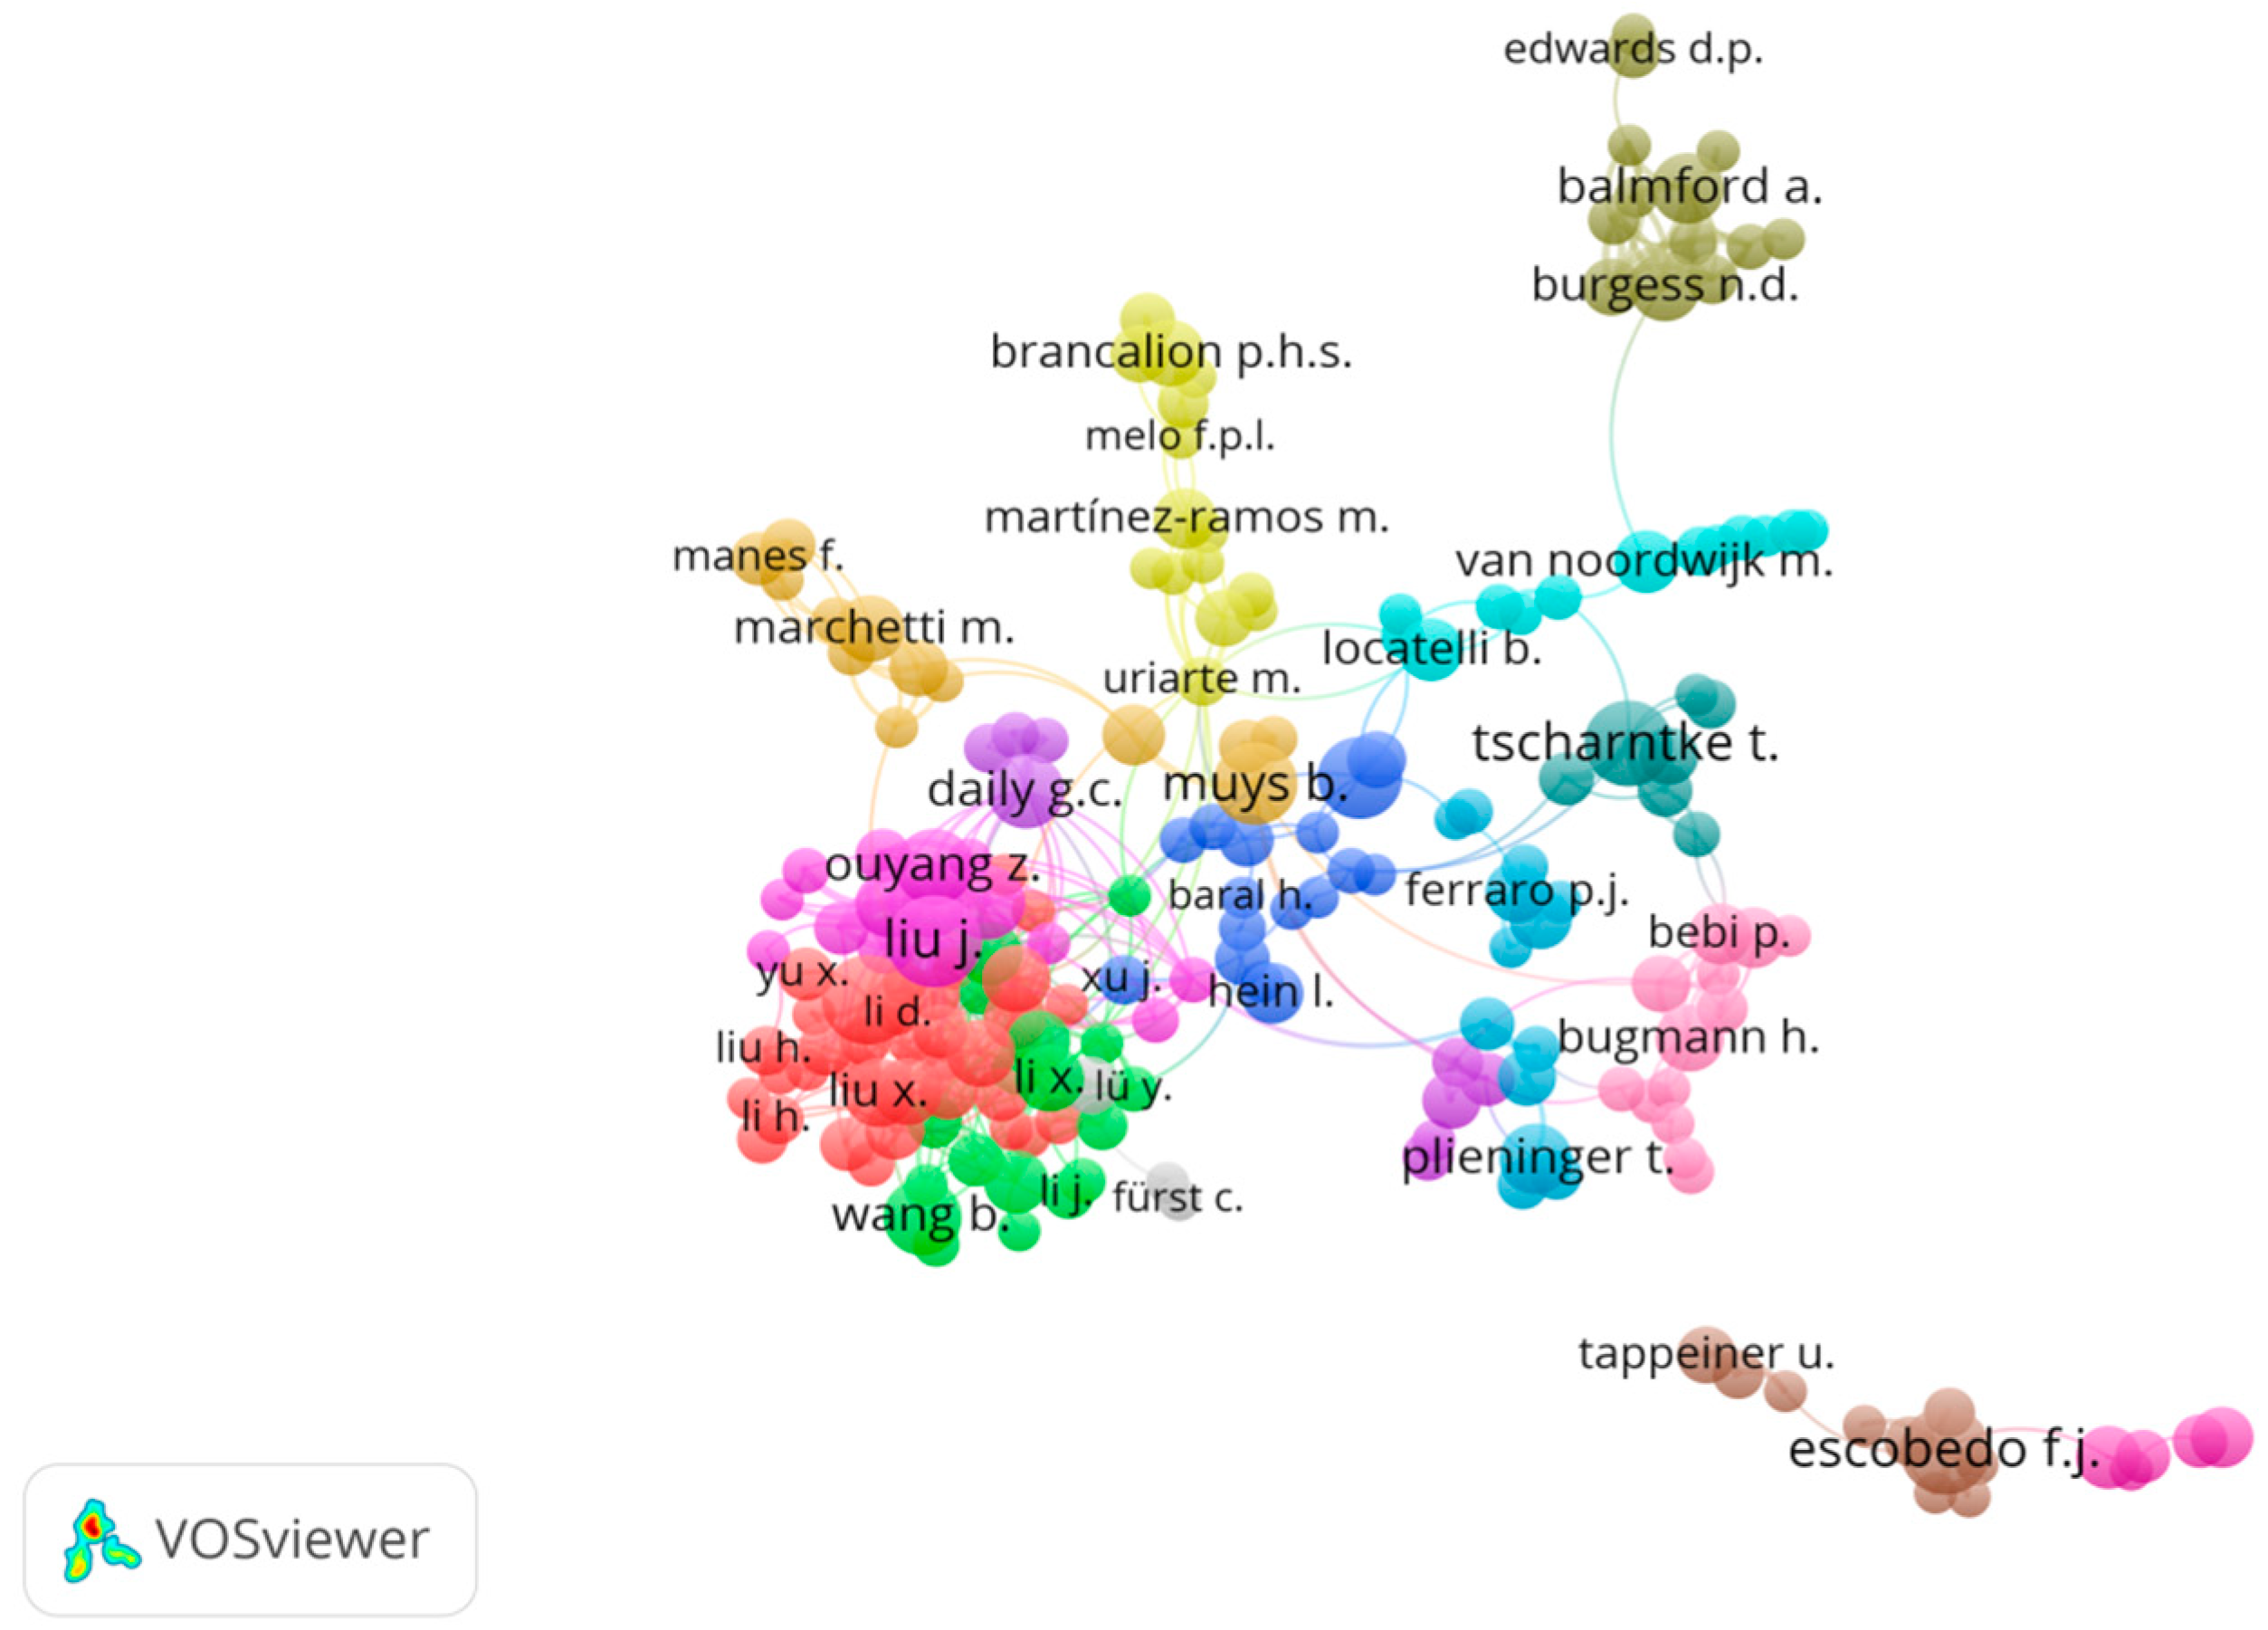
Figure 6 shows a network map illustrating the collaborative relationships of co-authorship, where the colours refer to the clusters formed by different authors. From the obtained results, the most interrelated set is shown. A highly complex and atomized collaboration network is observed, although a nucleus of different clusters can be pointed out, made up of mainly Chinese authors, including Zhiyun Ouyang. Among the clusters representing the most intense collaborations, those of Francisco J. Escobedo and Bart Muys stand out.
3.4. Keywords
The 20 most frequently used keywords during the period of 1998 to 2017 are shown in Table 7 in four different 5-year sub-periods. These keywords represent the hotspots in FES research. As expected, the term most used during the entire study period was Ecosystem Service. A series of 23 keywords that contain or reference this term such as Forest Ecosystem Service or Ecological Service have been grouped and counted separately.
The evolution of keywords shows the preference for certain terminology. During 1998 to 2002 there were terms relating to management such as Forest Management, Ecosystem Management and Environmental Management; different specific problems related to forest ecosystems such as Biodiversity, Deforestation, Carbon Sequestration and Land Use; and three different approaches: Environmental Protection, Ecosystem Function and Environmental Economics. This period was influenced by publications that became milestones in research into ecosystem services. Foremost among these was Daily’s book [5] that embraces the definitions, history, economic valuation and general services such as climate, biodiversity and specific biomass services. Additionally, the article by Costanza et al. [6] on the value of services on a global scale is also important. From that point, numerous articles were published on the valuation of ecosystem services.
Among the most used terms during the following five years (2003–2007) were those which illustrated the growing concern with environmental conservation and climate change: Sustainable Development, Climate Change, Conservation and Conservation of Natural Resources. The term World appeared for the first time, emphasizing the global nature of the analysis into this field of research.
The terms Tropical Forest, Reforestation and Land Use Change appeared among the most used terms for the first time during 2008 to 2012. Among the different proposals, The Economics of Ecosystems and Biodiversity [7] stands out for being an international initiative emphasizing the services provided by ecosystems and biodiversity. It also stated the need to place a value on these in order to slow environmental degradation, as well as integrate the fields of science, economics and politics, when the implementation of measures is needed.
The last period, 2013–2017, shows a continuity without any great changes. It is interesting to point out that terms such as Ecology and Climate Change gained relevance and were among the top 10 most used in this period. The Intergovernmental Science-Policy Platform on Biodiversity and Ecosystem Services [8] was established during this period. This independent, intergovernmental organisation, was created to strengthen relations between science and policy in matters of biodiversity and ecosystem services. Its aim is to ensure the conservation and sustainable use of biodiversity, long-term human wellbeing and sustainable development.
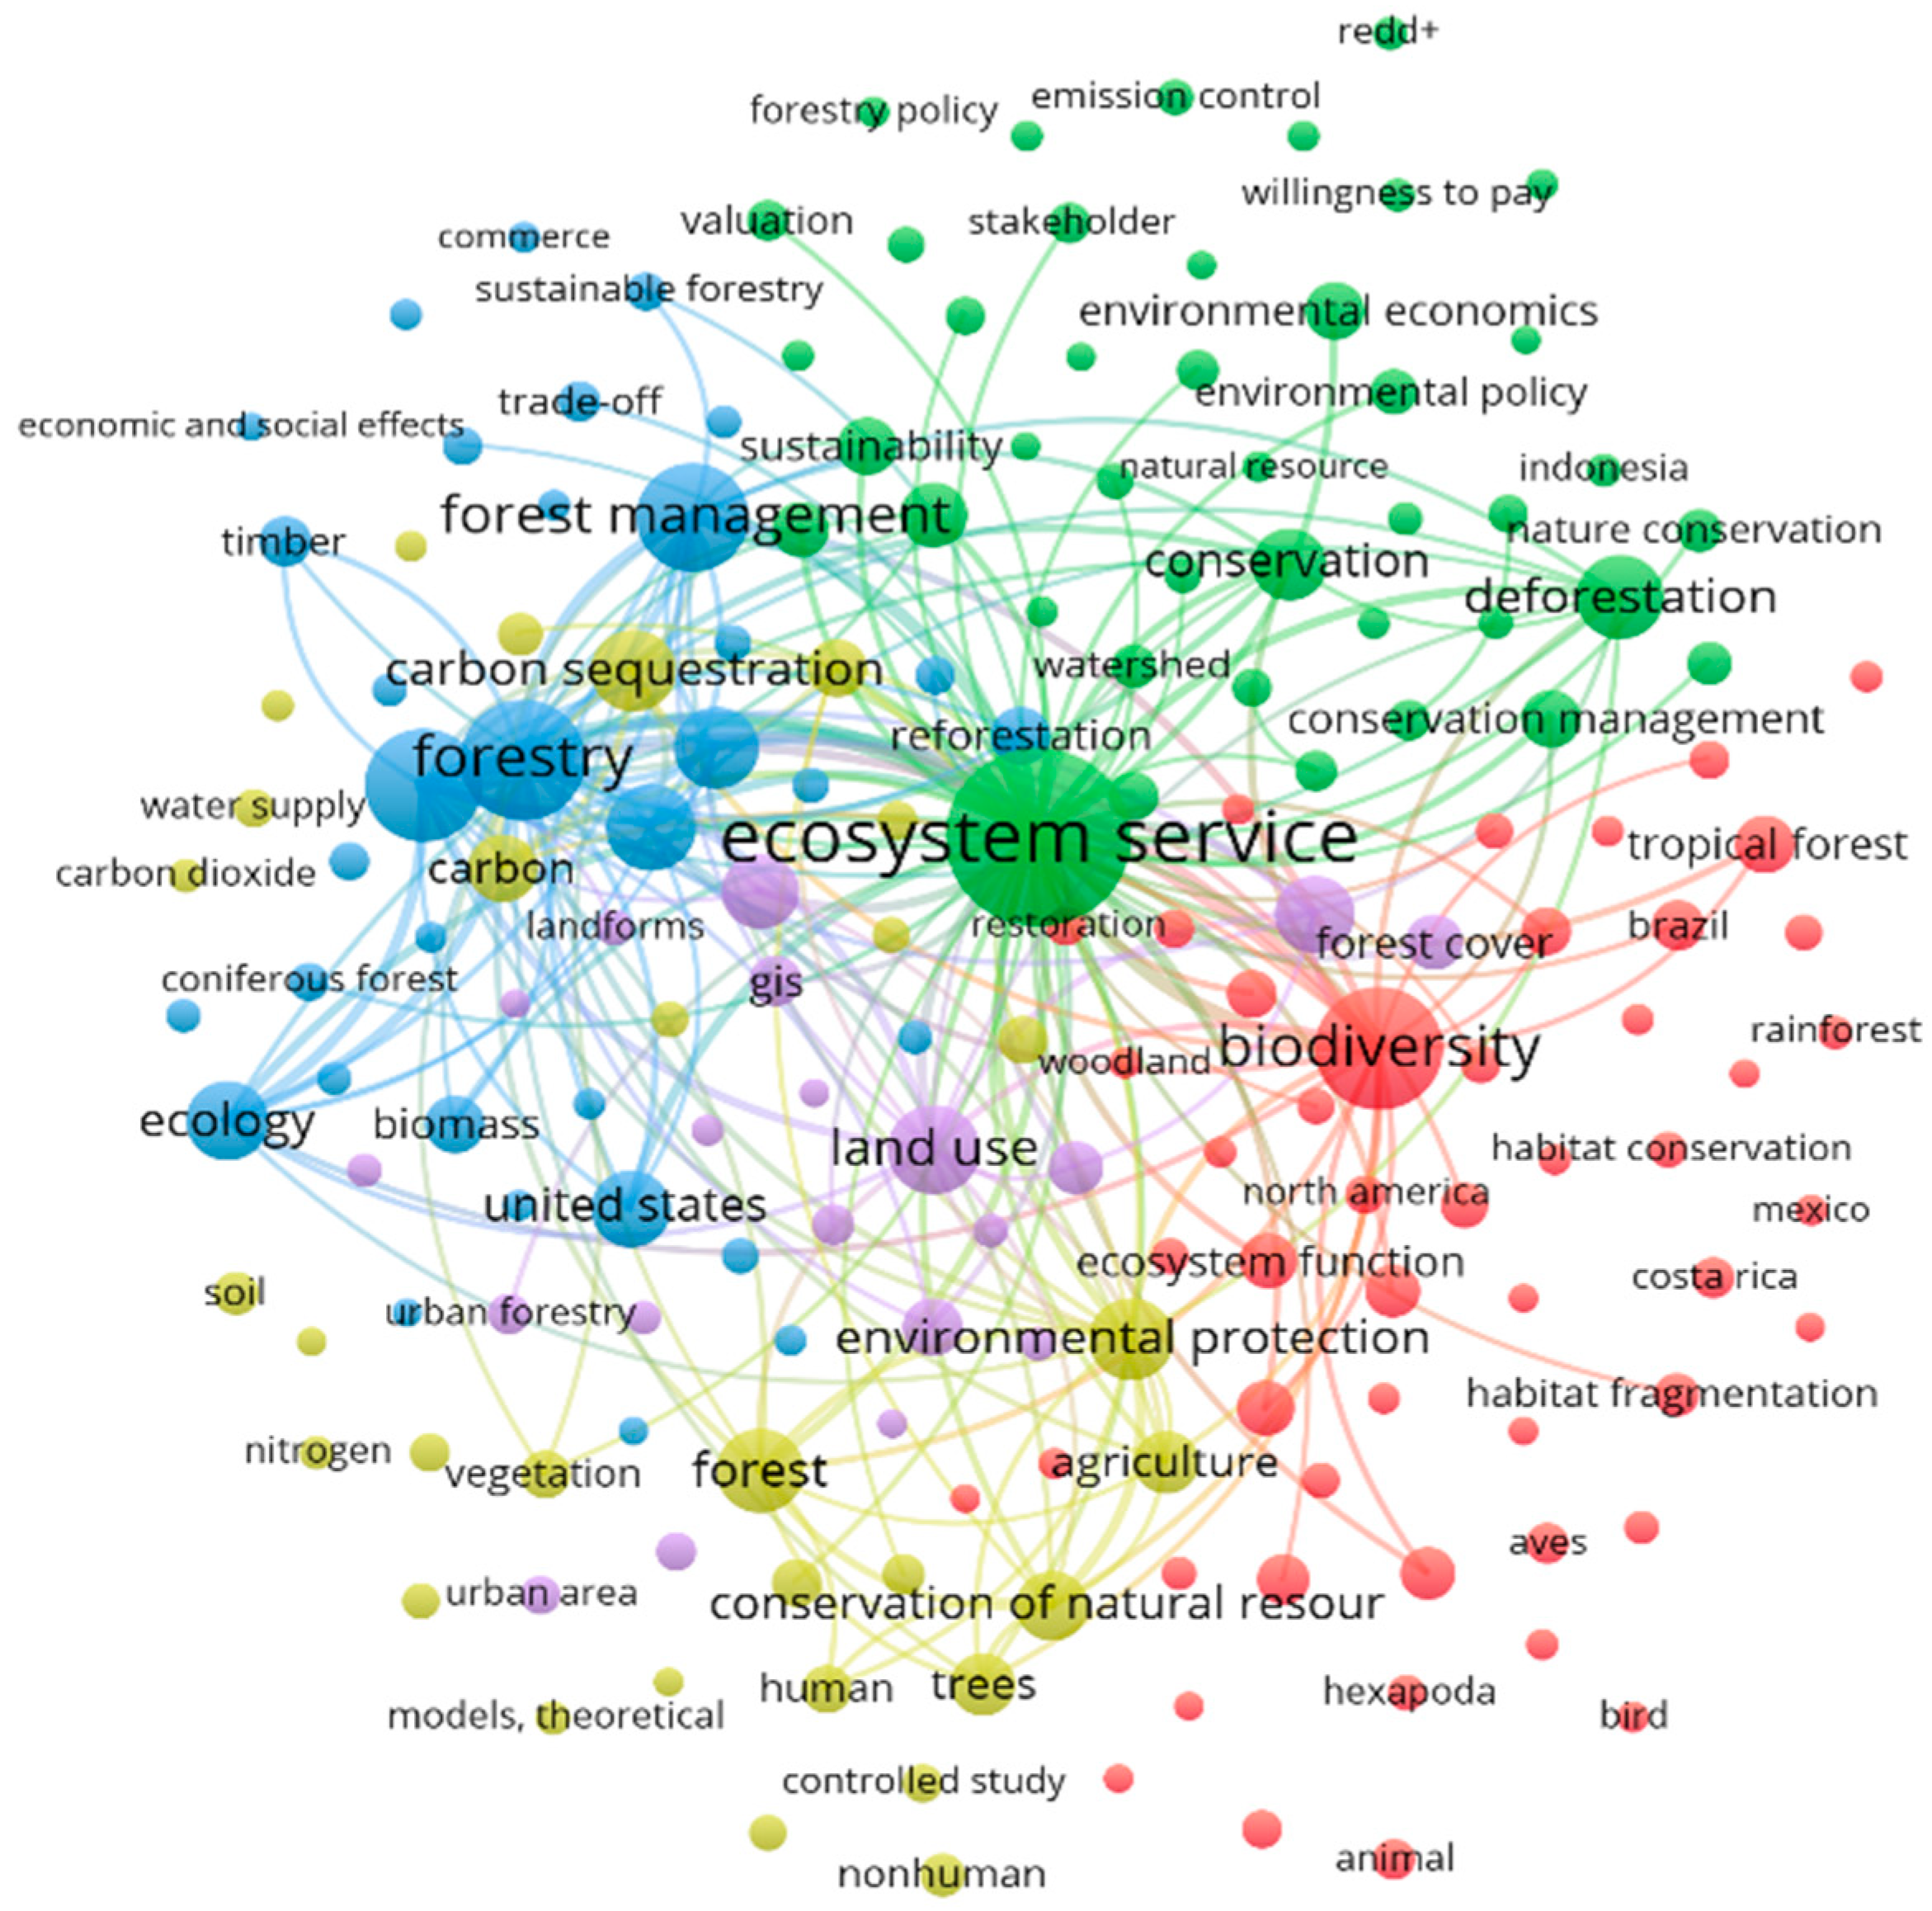
Figure 7 shows a network map of the co-occurrence of the main keywords with the greatest number of ties and those that coincided a minimum of 50 times. The most popular words appear in the largest circles. The map shows the link between those considered to be hotspots within the field. Three main clusters can be observed in different colours. The first cluster (green) falls under the term Ecosystem Services, representing the management and decision-making perspective. Of the possible focus areas in ecosystem research, this cluster leans towards the field of Social Sciences. The second cluster (blue) has as its main keyword, Forest Management and represents the agronomic perspective with terms relating to forest management oriented towards production services, particularly provisioning. In the third cluster (red), the most frequent term is Biodiversity, representing the biophysics of forest services. This cluster predominantly contains terms relating to regulation and support of forest ecosystem services.
The violet and yellow coloured clusters were considered secondary for two reasons: firstly, because they contain fewer keywords than the other three clusters and secondly because the most significant terms in both of them are different methodologies for analysing services that may be used individually or together. The violet cluster includes sociocultural tools, while remote sensing stands out in the yellow cluster. These are, therefore, two cross-disciplinary clusters that support the other three.
4. Conclusions
This paper analyses the dynamics of research into forest ecosystem services during the last 20 years and its relative significance within the forest research field. A bibliometric analysis of 4284 articles were completed. The implemented methodology has allowed us to identify the most productive authors, institutions and countries within the study of ecosystem services provided by forests. The citation counts, the H-index and the SJR impact factor showed which studies are the most relevant in this research field. Furthermore, the network mappings show the relationship structure established between the agents involved in the FES research. The results of the bibliometric analysis indicated that the number of articles per year on FES has increased steadily, growing from eight articles published in 1988 to 756 in 2017. There was a particularly sharp increase in the last five years in which more than 68.63% of articles were published. Our results indicated that articles on ecosystem services occupy a growing percentage within the forest research, although their weight is still limited. As far as the evolution of the article characteristics is concerned, an increasing number of journals are publishing researches on FES and international collaborations in this field are growing. This indicates that forest ecosystem services have become an increasingly important research line worldwide.
The three most important categories were Environmental Science, Agricultural and Biological Sciences and Social Sciences. Unlike the rest of research areas on forests, in those works dealing with forest ecosystem services there is a relevant presence of Social Sciences but not of Economics. This peculiarity is due to the multidisciplinary character of the ecosystem service concept, which make this research area also comprise these subjects. The journal with the highest number of published articles was Forest Ecology and Management. However, it is the journal with the lower percentage of publications on ecosystem services compared to the percentage of forest articles. This journal obtains on average a higher citation number of ecosystem service articles compared to forest articles. It is followed by Shengtai Xuebao Acta Ecologica Sinica and Ecosystem Services. The country with the highest number of articles published was the United States, followed by China, the United Kingdom, Germany and Brazil. These countries are also the main research drivers in the forest research field. Considering the publications per capita, Australia took first place, followed by the United Kingdom, Canada, Germany and Spain. The order changed when considering the average number of citations per article: Spain, Canada, Australia, France and the United States. The countries with the largest percentage of articles written with international collaboration were Spain, the United Kingdom, France and Germany. The Chinese Academy of Sciences, the USDA Forest Service and the Universidad Autónoma de México were the top three research institutions. The authors with the most published articles on FES belonged to a wide variety of institutions and their contributions were relatively recent, which indicates that this field is in a process of consolidation.
The most frequently used keywords in the sample analysed were Ecosystem Service, Ecosystem, Biodiversity, Forestry, Forest Management, Forest, Land Use, Climate Change, Ecology and Forest Ecosystem. The map of co-occurrence of keywords distinguished three principal clusters which may be considered the hotspots within this line of research: Ecosystem Services, dealing with management and decision-making; Forest Management, dealing with agronomy; and Biodiversity, dealing with biophysics.
As a final conclusion, it can be stated that the provision of forest ecosystem services is a research field which shows an increasing level of interest worldwide but its relative significance is still limited within the forest research. Nevertheless, the increasing demand of information regarding the capacity of forest ecosystems to sustain the welfare of current population and future generations will certainly boost this line of research.
The applied analysis in the current work can show some limitations. The ecosystem service concept has evolved during last decades so that we can find different terms for the same concept. This could mean a limitation of the present work since the selection of keywords can directly condition the results. The consulted database could also mean a limitation since the article sample may differ if a different database is used. Finally, our analysis has a quantitative character. This work could be extended with a qualitative analysis of the articles.
Author Contributions
The four authors have equally contributed to this paper. All authors have revised and approved the final manuscript.
Funding
This research received no external funding.
Acknowledgments
This work has been partially supported by the Spanish Ministry of Economy and Competitiveness and the European Regional Development Fund by means of the research project ECO2017-82347-P and by the Research Plan of the University of Almería through a Predoctoral Contract to Juan F. Velasco Muñoz. This paper was developed during the research stay by José A. Aznar-Sánchez at the Humboldt-Universität zu Berlin.
Conflicts of Interest
The authors declare no conflict of interest.
References
- Millennnium Ecosystem Assessment (MA)—Ecosystems and Human Well-Being; Biodiversity Synthesis World Resources Institute: Washington, DC, USA, 2005.
- Tian, N.; Poudyal, N.C.; Hodges, D.G.; Young, T.M.; Hoyt, K.P. Understanding the Factors Influencing Nonindustrial Private Forest Landowner Interest in Supplying Ecosystem Services in Cumberland Plateau, Tennessee. Forests 2015, 6, 3985–4000. [Google Scholar] [CrossRef] [Green Version]
- Martín-López, B.; Montes, C. Funciones y servicios de los ecosistemas: Una herramienta para la gestión de los espacios naturales. In Guía Científica de Urdaibai; UNESCO, Dirección de Biodiversidad y Participación Ambiental del Gobierno Vasco: Madrid, España, 2010. [Google Scholar]
- McDonough, K.; Hutchinson, S.; Moore, T.; Hutchinson, J.M.S. Analysis of publication trends in ecosystem services research. Ecosyst. Serv. 2017, 25, 82–88. [Google Scholar] [CrossRef]
- Daily, G.C. Nature’s Services: Societal Dependence on Natural Ecosystems; Island Press: Washington, DC, USA, 1997. [Google Scholar]
- Costanza, R.; d’Arge, R.; De Groot, R.; Farber, S.; Grasso, M.; Hannon, B.; Limburg, K.; Naeem, S.; Oneill, R.V.; Paruelo, J.; et al. The value of the world’s ecosystem services and natural capital. Nature 1997, 387, 253–260. [Google Scholar] [CrossRef]
- Kumar, P. (Ed.) The Economics of Ecosystems and Biodiversity (TEEB) Ecological and Economic Foundations; Routledge: Oxford, UK, 2010. [Google Scholar]
- Intergovernmental Science-Policy Platform on Biodiversity and Ecosystem Services. IPBES | Science and Policy for People and Nature. Available online: https://www.ipbes.net/ 2011 (accessed on 12 March 2018).
- Seppelt, R.; Dormann, C.F.; Eppink, F.V.; Lautenbach, S.; Schmidt, S. A quantitative review of ecosystem service studies: Approaches, shortcomings and the road ahead. J. Appl. Ecol. 2011, 48, 630–636. [Google Scholar] [CrossRef]
- Nieto-Romero, M.; Oteros-Rozas, E.; González, J.A.; Martín-López, B. Exploring the knowledge landscape of ecosystem services assessments in Mediterranean agroecosystems: Insights for future research. Environ. Sci. Policy 2014, 37, 121–133. [Google Scholar] [CrossRef]
- Geijzendorffer, I.R.; Cohen-Shacham, E.; Cord, A.F.; Cramer, W.; Guerra, C.; Martín-López, B. Ecosystem services in global sustainability policies. Environ. Sci. Policy 2017, 74, 40–48. [Google Scholar] [CrossRef] [Green Version]
- Pohjanmies, T.; Triviño, M.; Le Tortorec, E.; Mazziotta, A.; Snäll, T.; Mönkkönen, M. Impacts of forestry on boreal forests: An ecosystem services perspective. Ambio 2017, 46, 743–755. [Google Scholar] [CrossRef] [PubMed]
- Martín-López, B.; Oteros-Rozas, E.; Cohen-Shacham, E.; Santos-Martín, F.; Nieto-Romero, M.; Carvalho-Santos, C.; González, J.A.; García-Llorente, M.; Klass, K.; Geijzendorffer, I.; et al. Ecosystem Services Supplied by Mediterranean Basin Ecosystems. In Handbook of Ecosystem Services; Potschin, M., Haines-Young, R., Fish, R., Turner, K., Eds.; Routledge: New York, NY, USA, 2016; pp. 405–414. [Google Scholar]
- Damkjaer, S.; Taylor, R. The measurement of water scarcity: Defining a meaningful indicator. Ambio 2017, 46, 513–531. [Google Scholar] [CrossRef] [PubMed]
- Hossain, M.S.; Pogue, S.J.; Trenchard, L.; Van Oudenhoven, A.P.E.; Washbourne, C.L.; Muiruri, E.W.; Tomczyk, A.M.; García-Llorente, M.; Hale, R.; Hevia, V.; et al. Identifying future research directions for biodiversity, ecosystem services and sustainability: Perspectives from early-career researchers. Int. J. Sustain. Dev. World Ecol. 2018, 25, 249–261. [Google Scholar] [CrossRef]
- Food and Agriculture Organization of the United Nations (FAO). The State of the World’s Forests 2016; FAO: Rome, Italy, 2017. [Google Scholar]
- Abson, D.J.; von Wehrden, H.; Baumgärtner, S.; Fischer, J.; Hanspach, J.; Härdtle, W.; Heinrichs, H.; Klein, A.M.; Lang, D.J.; Martens, P.; et al. Ecosystem services as a boundary object for sustainability. Ecol. Econ. 2014, 103, 29–37. [Google Scholar] [CrossRef]
- May, N.; Guenther, E.; Haller, P. Environmental indicators for the evaluation of wood products in consideration of site-dependent aspects: A review and integrated approach. Sustainability 2017, 9, 1897. [Google Scholar] [CrossRef]
- Peñuelas, J.; Sardans, J.; Filella, I.; Estiarte, M.; Llusià, J.; Ogaya, R.; Carnicer, J.; Bartrons, M.; Rivas-Ubach, A.; Grau, O.; et al. Impacts of global change on Mediterranean forests and their services. Forests 2017, 8, 463. [Google Scholar] [CrossRef]
- Chitsaz, N.; Azarnivand, A. Water scarcity management in arid regions based on an extended multiple criteria technique. Water Resour. Manag. 2017, 31, 233–250. [Google Scholar] [CrossRef]
- Mitrică, B.; Mitrică, E.; Enciu, P.; Mocanu, I. An approach for forecasting of public water scarcity at the end of the 21st century, in the Timiş Plain of Romania. Technol. Forecast. Soc. Chang. 2017, 118, 258–269. [Google Scholar] [CrossRef]
- Kotta, J.; Aps, R.; Orav-Kotta, H. Bayesian inference for predicting ecological water quality under different climate change scenarios. WIT Trans. Ecol. Environ. 2009, 127, 173–184. [Google Scholar] [CrossRef] [Green Version]
- Malesios, C.; Arabatzis, G. An evaluation of forestry journals using bibliometric indices. Ann. For. Res. 2012, 55, 147–164. [Google Scholar]
- Aleixandre-Benavent, R.; Aleixandre-Tudó, J.L.; Castelló-Cogollos, L.; Aleixandre, J.L. Trends in global research in deforestation—A bibliometric analysis. Land Use Policy 2018, 72, 293–302. [Google Scholar] [CrossRef]
- Song, Y.; Zhao, T. A bibliometric analysis of global forest ecology research during 2002–2011. SpringerPlus 2013, 2, 204. [Google Scholar] [CrossRef] [PubMed] [Green Version]
- Zhang, L.L.; Gong, J.; Zhang, Y. A review of ecosystem services: A bibliometric analysis based on web of science. Acta Ecol. Sin. 2016, 36, 5967–5977. [Google Scholar] [CrossRef]
- Tancoigne, E.; Barbier, M.; Cointet, J.P.; Richard, G. The place of agricultural sciences in the literature on ecosystem services. Ecosyst. Serv. 2014, 10, 35–48. [Google Scholar] [CrossRef] [Green Version]
- Zhang, Y.; Zhang, Y.; Shi, K.; Yao, X. Research development, current hotspots and future directions of water research based on MODIS images: A critical review with a bibliometric analysis. Environ. Sci. Pollut. Res. Int. 2017, 24, 15226–15239. [Google Scholar] [CrossRef] [PubMed]
- Huang, L.; Zhang, Y.; Guo, Y.; Zhu, D.; Porter, A.L. Four dimensional science and technology planning: A new approach based on bibliometrics and technology roadmapping. Technol. Forecast. Soc. Chang. 2014, 81, 39–48. [Google Scholar] [CrossRef]
- Gusmão-Caiado, R.G.; de Freitas-Dias, R.; Veiga-Mattos, L.; Gonçalves-Quelhas, O.L.; Leal-Filho, W. Towards sustainable development through the perspective of eco-efficiency—A systematic literature review. J. Clean. Prod. 2017, 165, 890–904. [Google Scholar] [CrossRef]
- Zhong, S.; Geng, Y.; Liu, W.; Gao, C.; Chen, W. A bibliometric review on natural resource accounting during 1995–2014. J. Clean. Prod. 2016, 139, 122–132. [Google Scholar] [CrossRef]
- Li, W.; Zhao, Y. Bibliometric analysis of global environmental assessment research in a 20-year period. Environ. Impact Assess. Rev. 2015, 50, 158–166. [Google Scholar] [CrossRef]
- Suominen, A.; Toivanen, H. Map of science with topic modeling: Comparison of unsupervised learning and human-assigned subject classification. J. Assoc. Inf. Sci. Technol. 2016, 67, 2464–2476. [Google Scholar] [CrossRef]
- Zhang, Y.; Chen, H.; Lu, J.; Zhang, G. Detecting and predicting the topic change of Knowledge-based Systems: A topic-based bibliometric analysis from 1991 to 2016. Knowl.-Based Syst. 2017, 133, 255–268. [Google Scholar] [CrossRef]
- Robinson, D.K.; Huang, L.; Guo, Y.; Porter, A.L. Forecasting Innovation Pathways (FIP) for new and emerging science and technologies. Technol. Forecast. Soc. Chang. 2013, 80, 267–285. [Google Scholar] [CrossRef]
- Rafols, I.; Porter, A.L.; Leydesdorff, L. Science overlay maps: A new tool for research policy and library management. J. Am. Soc. Inf. Sci. Technol. 2010, 61, 1871–1887. [Google Scholar] [CrossRef] [Green Version]
- Zhang, Y.; Zhang, G.; Zhu, D.; Lu, J. Science evolutionary pathways: Identifying and visualizing relationships for scientific topics. J. Assoc. Inf. Sci. Technol. 2017, 68, 1925–1939. [Google Scholar] [CrossRef]
- Durieux, V.; Gevenois, P.A. Bibliometric Indicators: Quality Measurements of Scientific Publication. Radiology 2010, 255, 342–351. [Google Scholar] [CrossRef] [PubMed]
- Hassan, S.U.; Haddawy, P.; Zhu, J. A bibliometric study of the world’s research activity in sustainable development and its sub-areas using scientific literature. Scientometrics 2014, 99, 549–579. [Google Scholar] [CrossRef]
- ELSEVIER. Available online: https://www.elsevier.com (accessed on 18 March 2018).
- Waltman, L.; van Eck, N.J.; Noyons, E.C. A unified approach to mapping and clustering of bibliometric networks. J. Informetr. 2010, 4, 629–635. [Google Scholar] [CrossRef] [Green Version]
- Mongeon, P.; Paul-Hus, A. The journal coverage of Web of Science and Scopus: A comparative analysis. Scientometrics 2016, 106, 213–228. [Google Scholar] [CrossRef]
- Gavel, Y.; Iselid, L. Web of Science and Scopus: A journal title overlap study. Online Inf. Rev. 2008, 32, 8–21. [Google Scholar] [CrossRef]
- Velasco-Muñoz, J.V.; Aznar-Sánchez, J.A.; Belmonte-Ureña, L.J.; Román-Sánchez, I.M. Sustainable water use in agriculture: A review of worldwide research. Sustainability 2018, 10, 1084. [Google Scholar] [CrossRef]
- Cossarini, D.M.; MacDonald, B.H.; Wells, P.G. Communicating marine environmental information to decision makers: Enablers and barriers to use of publications (grey literature) of the Gulf of Maine Council on the Marine Environment. Ocean Coast. Manag. 2014, 96, 163–172. [Google Scholar] [CrossRef]
- Velasco-Muñoz, J.F.; Aznar-Sánchez, J.A.; Belmonte-Ureña, L.J.; López-Serrano, M.J. Advances in water use efficiency in agriculture: A bibliometric analysis. Water 2018, 10, 377. [Google Scholar] [CrossRef]
- Bojović, S.; Matić, R.; Popović, Z.; Smiljanić, M.; Stefanović, M.; Vidaković, V. An overview of forestry journals in the period 2006–2010 as basis for ascertaining research trends. Scientometrics 2014, 98, 1331–1346. [Google Scholar] [CrossRef]
- Dobbertin, M.K.; Nobis, M.P. Exploring research issues in selected forest journals 1979–2008. Ann. For. Res. 2010, 67, 800. [Google Scholar] [CrossRef]
Figure 1.
Methodology Scheme.

Figure 2.
Comparative trends in the research fields of Forests and forest ecosystem services (FES) from 1998 to 2017.
Figure 2.
Comparative trends in the research fields of Forests and forest ecosystem services (FES) from 1998 to 2017.

Figure 3.
The trend in the subject categories on FES articles published from 1998 to 2017.

Figure 4.
The H index and the total number of articles by country for FES research from 1998 to 2017.
Figure 4.
The H index and the total number of articles by country for FES research from 1998 to 2017.

Figure 5.
Network of the co-authorship-based cooperation between countries from 1998 to 2017.

Figure 6.
The network of the cooperation based on co-authorship between authors from 1998 to 2017.

Figure 7.
The network of the main keyword co-occurrences in FES research from 1998 to 2017.


Table 1.
The characteristics of the articles on forest ecosystem services (FES) from 1998 to 2017.
| Year | A | FES/F | NR | NR/A | TC | TC/CA | AU | AU/A | J | C |
|---|---|---|---|---|---|---|---|---|---|---|
| 1998 | 8 | 0.14 | 298 | 37.25 | 1 | 0.13 | 15 | 1.88 | 8 | 5 |
| 1999 | 8 | 0.13 | 341 | 42.63 | 5 | 0.31 | 22 | 2.75 | 8 | 8 |
| 2000 | 14 | 0.21 | 387 | 27.64 | 16 | 0.53 | 28 | 2.00 | 12 | 12 |
| 2001 | 16 | 0.24 | 716 | 44.75 | 40 | 0.87 | 39 | 2.44 | 13 | 11 |
| 2002 | 16 | 0.23 | 733 | 45.81 | 69 | 1.11 | 51 | 3.19 | 14 | 9 |
| 2003 | 21 | 0.30 | 671 | 31.95 | 107 | 1.29 | 60 | 2.86 | 15 | 9 |
| 2004 | 21 | 0.28 | 721 | 34.33 | 131 | 1.26 | 63 | 3.00 | 20 | 15 |
| 2005 | 39 | 0.46 | 1148 | 29.44 | 234 | 1.64 | 167 | 4.28 | 27 | 23 |
| 2006 | 68 | 0.68 | 2654 | 39.03 | 395 | 1.87 | 197 | 2.90 | 47 | 25 |
| 2007 | 93 | 0.86 | 3491 | 37.54 | 688 | 2.26 | 299 | 3.22 | 61 | 38 |
| 2008 | 104 | 0.90 | 4921 | 47.32 | 928 | 2.27 | 335 | 3.22 | 63 | 32 |
| 2009 | 168 | 1.33 | 7176 | 42.71 | 1583 | 2.75 | 651 | 3.88 | 103 | 58 |
| 2010 | 192 | 1.45 | 9291 | 48.39 | 2292 | 2.98 | 808 | 4.21 | 120 | 69 |
| 2011 | 257 | 1.79 | 11,932 | 46.43 | 3036 | 2.96 | 1019 | 3.96 | 149 | 62 |
| 2012 | 319 | 2.14 | 15,270 | 47.87 | 4494 | 3.34 | 1224 | 3.84 | 187 | 61 |
| 2013 | 414 | 2.51 | 18,962 | 45.80 | 6502 | 3.70 | 1552 | 3.75 | 177 | 75 |
| 2014 | 516 | 2.91 | 24,912 | 48.28 | 8326 | 3.66 | 2085 | 4.04 | 223 | 84 |
| 2015 | 552 | 3.05 | 26,161 | 47.39 | 10,457 | 3.70 | 2396 | 4.34 | 229 | 82 |
| 2016 | 702 | 3.65 | 33,607 | 47.87 | 13,200 | 3.74 | 3259 | 4.64 | 279 | 95 |
| 2017 | 756 | 3.71 | 37,662 | 49.82 | 16,532 | 3.86 | 3362 | 4.45 | 276 | 94 |
A: annual number of articles published about FES; FES/F: percentage of articles on FES within forest publications; NR: total number of references for all articles; NR/A: annual number of references per article; TC: annual number of citations; TC/CA: average number of citations per article (citation total since 1998/total of articles since 1998); AU: annual number of authors; AU/A: average number of authors per article; J: annual number of journals that published at least 1 article about FES in a specific year; C: annual number of countries.
Table 2.
The top 10 most productive journals in FES research from 1998 to 2017.
| Journal | A | FES/F | SJR | C | TC | TC/A | 1st A | R (A) | ||||
|---|---|---|---|---|---|---|---|---|---|---|---|---|
| FES | F | 1998–2002 | 2003–2007 | 2008–2012 | 2013–2017 | |||||||
| Forest, Ecology and Management | 166 | 2.25 | 1.615 (Q1) | the Netherlands | 6124 | 36.89 | 24.47 | 2001 | 14 (1) | 3 (7) | 1 (55) | 2 (103) |
| Acta Ecologica Sinica | 113 | 6.04 | 0.177 (Q4) | China | 237 | 2.10 | 2.42 | 2008 | 0 | 0 | 2 (36) | 4 (77) |
| Ecosystem Services | 109 | ND | 1.935 (Q1) | the Netherlands | 810 | 7.43 | ND | 2013 | 0 | 0 | 0 | 1 (109) |
| PLoS One | 104 | 3.60 | 1.201 (Q1) | USA | 1451 | 13.95 | 11.44 | 2008 | 0 | 0 | 4 (17) | 3 (87) |
| Ecological Economics | 88 | 22.45 | 1.712 (Q1) | the Netherlands | 4264 | 48.45 | 31.86 | 1999 | 1 (4) | 1 (14) | 3 (22) | 10 (48) |
| Forest Policy and Economics | 83 | 7.71 | 1.060 (Q1) | the Netherlands | 716 | 8.63 | 12.57 | 2004 | 0 | 11 (4) | 7 (15) | 7 (64) |
| Forests | 79 | 7.36 | 0.679 (Q1) | Switzerland | 447 | 5.66 | 4.05 | 2011 | 0 | 0 | 22 (9) | 5 (70) |
| Land Use Policy | 77 | 19.95 | 1.376 (Q1) | the Netherlands | 730 | 9.48 | 11.95 | 2009 | 0 | 0 | 28 (8) | 6 (69) |
| Ecology and Society | 68 | 18.48 | 1.805 (Q1) | Canada | 1614 | 23.74 | 23.90 | 1999 | 2 (3) | 8 (5) | 7 (15) | 11 (45) |
| Agriculture, Ecosystems and Environment | 58 | 12.45 | 1.612 (Q1) | the Netherlands | 1135 | 19.57 | 28.11 | 1999 | 14 (1) | 11 (4) | 14 (11) | 12 (42) |
A: annual number of total articles; FES/F: percentage of articles on FES within forest publications; SJR: Scopus Journal Ranking; Q1: first quartile; Q4: fourth quartile. C: country; TC: annual number of citations for all articles; TC/A: number of citations by article; 1st A: first article of FES research by journal; R: ranking position.
Table 3.
The top 10 most productive countries in FES research from 1998 to 2017.
| Country | A | FES/F | APC | TC | TC/A | R (A) | ||||
|---|---|---|---|---|---|---|---|---|---|---|
| FES | F | 1998–2002 | 2003–2007 | 2008–2012 | 2013–2017 | |||||
| United States | 1369 | 2.15 | 4.24 | 35,706 | 26.08 | 27.46 | 1 (22) | 1 (95) | 1 (377) | 1 (875) |
| China | 540 | 2.33 | 0.39 | 6677 | 12.36 | 8.68 | 3 (6) | 2 (41) | 2 (143) | 2 (350) |
| United Kingdom | 445 | 3.19 | 6.78 | 11,475 | 25.79 | 27.77 | 6 (4) | 3 (16) | 3 (111) | 3 (314) |
| Germany | 414 | 2.48 | 5.02 | 7372 | 17.81 | 23.44 | 6 (4) | 5 (13) | 4 (92) | 4 (305) |
| Brazil | 302 | 1.53 | 1.45 | 5907 | 19.56 | 13.47 | 11 (2) | 10 (9) | 5 (72) | 5 (219) |
| Canada | 240 | 1.45 | 6.62 | 7597 | 31.65 | 24.17 | 14(1) | 4 (15) | 6 (55) | 7 (169) |
| Australia | 232 | 2.22 | 9.58 | 7168 | 30.90 | 22.38 | 4 (5) | 5 (13) | 11 (42) | 6 (172) |
| France | 221 | 2.09 | 3.30 | 6116 | 27.67 | 23.64 | 0 | 7 (12) | 7 (54) | 8 (155) |
| Spain | 204 | 2.40 | 4.39 | 6956 | 34.10 | 19.42 | 14(1) | 11 (7) | 9 (48) | 9 (148) |
| Italy | 191 | 3.04 | 3.15 | 4487 | 23.49 | 23.22 | 11 (2) | 20 (3) | 12 (38) | 9 (148) |
A: annual number of total articles; FES/F: percentage of articles on FES within forest publications; APC: number of articles per 1 million inhabitants; TC: annual number of citations for all articles; TC/A: number of citations by article. R: ranking position.
Table 4.
The international collaboration between countries on FES research from 1998 to 2017.
| Country | IC (%) | NC | Main Collaborators | TC/A | |
|---|---|---|---|---|---|
| IC | NIC | ||||
| United States | 46.46 | 104 | UK, China, Brazil, Canada, Australia | 34.18 | 21.97 |
| China | 28.89 | 58 | USA, Germany, UK, Canada, Japan | 28.82 | 13.98 |
| United Kingdom | 76.41 | 96 | USA, Australia, Brazil, Germany, the Netherlands | 27.55 | 6.20 |
| Germany | 71.74 | 82 | USA, Switzerland, UK, Sweden, Austria | 20.15 | 4.67 |
| Brazil | 58.28 | 63 | USA, UK, Germany, France, Canada | 28.13 | 5.44 |
| Canada | 62.08 | 62 | USA, Australia, Germany, UK, Brazil | 43.36 | 7.62 |
| Australia | 68.97 | 75 | USA, UK, Indonesia, France, Germany | 37.56 | 7.24 |
| France | 74.66 | 76 | USA, UK, Germany, Switzerland, Spain | 34.79 | 2.28 |
| Spain | 77.94 | 68 | UK, USA, Germany, France, Switzerland | 39.74 | 4.01 |
| Italy | 66.49 | 72 | USA, UK, Germany, Austria, France | 31.76 | 3.57 |
IC: international collaborations; NC: total number of international collaborators; TC/A: total citations per article; NIC: no international collaborations.
Table 5.
The 10 most productive institutions in FES research from 1998 to 2017.
| Institution | C | A | FES/F | TC | TC/A | H Index * | IC (%) | TC/A | ||
|---|---|---|---|---|---|---|---|---|---|---|
| FES | F | IC | NIC | |||||||
| Chinese Academy of Sciences | China | 220 | 2.69 | 2637 | 11.99 | 12.15 | 24 | 30.91 | 22.78 | 7.16 |
| USDA Forest Service | USA | 184 | 2.79 | 5407 | 29.39 | 27.88 | 34 | 27.17 | 69.42 | 14.45 |
| Universidad Nacional Autonoma de Mexico | Mexico | 85 | 4.42 | 963 | 11.33 | 15.47 | 20 | 48.24 | 17.00 | 6.05 |
| Sveriges Lantbruks Universitet | Sweden | 81 | 2.44 | 1273 | 15.72 | 27.20 | 18 | 56.79 | 20.70 | 9.17 |
| Center for International Forestry Research, West Java | Indonesia | 81 | 13.15 | 1955 | 24.14 | 0.49 | 24 | 97.53 | 24.19 | 22.00 |
| Wageningen University and Research Centre | the Netherlands | 80 | 4.54 | 2675 | 33.44 | 31.87 | 24 | 86.25 | 37.04 | 10.82 |
| Research Center for Eco-Environmental Sciences | China | 74 | 14.92 | 1024 | 13.84 | 13.48 | 14 | 22.97 | 31.59 | 8.54 |
| University of Florida | USA | 69 | 3.61 | 1582 | 22.93 | 27.24 | 21 | 52.17 | 33.06 | 11.88 |
| Kobenhavns Universitet | Denmark | 69 | 6.04 | 1033 | 14.97 | 22.11 | 20 | 86.96 | 15.67 | 10.33 |
| Universitat Gottingen | Germany | 63 | 3.14 | 1398 | 22.19 | 22.86 | 20 | 65.08 | 19.98 | 26.32 |
*: Only sample items. C: country; A: annual number of total articles; FES/F: percentage of articles on FES within forest publications; TC: annual number of citations in total articles; TC/A: number of citations by article; IC: international collaborations; NIC: no international collaborations.
Table 6.
The most productive authors in FES research from 1998 to 2017.
| Author | A | TC | TC/A | H Index * | C | Affiliation | 1st A | Last A |
|---|---|---|---|---|---|---|---|---|
| Ouyang, Zhiyun | 28 | 284 | 10.14 | 10 | China | Research Center for Eco-Environmental Sciences | 2004 | 2017 |
| Escobedo, Francisco J. | 24 | 575 | 23.96 | 13 | Colombia | Colegio Mayor de Nuestra Senora del Rosario | 2008 | 2017 |
| Tscharntke, Teja | 21 | 831 | 39.57 | 14 | Germany | Universitat Gottingen, Gottingen | 2002 | 2017 |
| Muys, Bart | 18 | 220 | 12.22 | 10 | Belgium | Katholieke Universiteit Leuven | 2010 | 2016 |
| Wunder, Sven | 18 | 1064 | 59.11 | 12 | Peru | Center for International Forestry Research (CIFOR) | 2006 | 2016 |
| Brancalion, P.H.S. | 17 | 464 | 27.29 | 11 | Brazil | Universidade de Sao Paulo - USP | 2011 | 2017 |
| Bugmann, Harald K.M. | 17 | 1030 | 60.59 | 8 | Switzerland | ETH Zurich, Institute of Terrestrial Ecosystems | 2005 | 2017 |
| Zheng, Hua | 17 | 150 | 8.82 | 7 | China | Research Center for Eco-Environmental Sciences | 2005 | 2017 |
| Daily, Gretchen C. | 15 | 790 | 52.67 | 10 | United States | Stanford University | 2004 | 2016 |
| Lexer, Manfred Josef | 14 | 301 | 21.50 | 6 | Austria | Universitat fur Bodenkultur Wien | 2010 | 2017 |
| Marchetti, Marco | 14 | 85 | 6.07 | 6 | Italy | Universita degli Studi del Molise | 2012 | 2017 |
| Nowak, David J. | 14 | 637 | 45.50 | 9 | United States | USDA Forest Service | 2005 | 2017 |
| Plieninger, Tobias | 14 | 287 | 20.50 | 11 | Germany | Universitat Gottingen | 2011 | 2015 |
| Van Noordwijk, Meine | 14 | 324 | 23.14 | 10 | the Netherlands | Wageningen University and Research Centre | 2002 | 2017 |
| Burgess, Neil D. | 13 | 337 | 25.92 | 9 | United States | UN Environment World Conservation Monitoring Centre | 2011 | 2016 |
*: Only sample items. A: annual number of total articles; TC: annual number of citations in total articles; TC/A: number of cites by article; C: country.
Table 7.
The top 20 most frequently used keywords in FES research from 1998 to 2017.
| Keywords | 1998–2017 | 1998–2002 | 2003–2007 | 2008–2012 | 2013–2017 | |||||
|---|---|---|---|---|---|---|---|---|---|---|
| A | % | R (A) | % | R (A) | % | R (A) | % | R (A) | % | |
| Ecosystem Service | 2595 | 60.57 | 1 (15) | 24.19 | 1 (85) | 35.12 | 1 (685) | 65.87 | 1 (1810) | 61.56 |
| Ecosystems | 1235 | 28.83 | 5 (9) | 14.52 | 2 (65) | 26.86 | 2 (284) | 27.31 | 2 (877) | 29.83 |
| Biodiversity | 1002 | 23.39 | 2 (10) | 16.13 | 4 (57) | 23.55 | 3 (248) | 23.85 | 4 (687) | 23.37 |
| Forestry | 993 | 23.18 | 8 (8) | 12.90 | 3 (61) | 25.21 | 4 (210) | 20.19 | 3 (714) | 24.29 |
| Forest Management | 769 | 17.95 | 5 (9) | 14.52 | 5 (56) | 23.14 | 5 (203) | 19.52 | 5 (501) | 17.04 |
| Forest | 643 | 15.01 | 8 (8) | 12.90 | 23 (20) | 8.26 | 8 (130) | 12.50 | 6 (485) | 16.50 |
| Land Use | 546 | 12.75 | 2 (10) | 16.13 | 9 (35) | 14.46 | 7 (133) | 12.79 | 9 (368) | 12.52 |
| Climate Change | 529 | 12.35 | 15 (4) | 6.45 | 27 (17) | 7.02 | 14 (110) | 10.58 | 8 (398) | 13.54 |
| Ecology | 517 | 12.07 | 36 (2) | 3.23 | 25 (18) | 7.44 | 46 (46) | 4.42 | 7 (451) | 15.34 |
| Forest Ecosystem | 474 | 11.06 | 15 (4) | 6.45 | 11 (27) | 11.16 | 9 (124) | 11.92 | 10 (319) | 10.85 |
| Environmental Protection | 441 | 10.29 | 2 (10) | 16.13 | 10 (30) | 12.40 | 10 (120) | 11.54 | 15 (281) | 9.56 |
| Carbon Sequestration | 432 | 10.08 | 15 (4) | 6.45 | 17 (23) | 9.50 | 11 (119) | 11.44 | 14 (286) | 9.73 |
| Deforestation | 427 | 9.97 | 10 (7) | 11.29 | 11 (27) | 11.16 | 15 (103) | 9.90 | 12 (290) | 9.86 |
| Land Use Change | 425 | 9.92 | 88 (1) | 1.61 | 19 (22) | 9.09 | 13 (112) | 10.77 | 12 (290) | 9.86 |
| Conservation | 368 | 8.59 | 15 (4) | 6.45 | 23 (20) | 8.26 | 16 (100) | 9.62 | 18 (244) | 8.30 |
| Tree | 313 | 7.31 | 15 (4) | 6.45 | 19 (22) | 9.09 | 18 (88) | 8.46 | 21 (199) | 6.77 |
| Conservation of Natural Resources | 312 | 7.28 | 0 | 0.00 | 21 (21) | 8.68 | 19 (80) | 7.69 | 19 (210) | 7.14 |
| Carbon | 290 | 6.77 | 36 (2) | 3.23 | 32 (16) | 6.61 | 24 (69) | 6.63 | 20 (203) | 6.90 |
| Sustainable Development | 281 | 6.56 | 15 (4) | 6.45 | 11 (27) | 11.16 | 20 (74) | 7.12 | 23 (176) | 5.99 |
| Agriculture | 260 | 6.07 | 36 (2) | 3.23 | 33 (15) | 6.20 | 29 (59) | 5.67 | 22 (184) | 6.26 |
A: the annual number of total articles; R: ranking position.
© 2018 by the authors. Licensee MDPI, Basel, Switzerland. This article is an open access article distributed under the terms and conditions of the Creative Commons Attribution (CC BY) license (http://creativecommons.org/licenses/by/4.0/).
Share and Cite
MDPI and ACS Style
Aznar-Sánchez, J.A.; Belmonte-Ureña, L.J.; López-Serrano, M.J.; Velasco-Muñoz, J.F. Forest Ecosystem Services: An Analysis of Worldwide Research. Forests 2018, 9, 453. https://doi.org/10.3390/f9080453
AMA Style
Aznar-Sánchez JA, Belmonte-Ureña LJ, López-Serrano MJ, Velasco-Muñoz JF. Forest Ecosystem Services: An Analysis of Worldwide Research. Forests. 2018; 9(8):453. https://doi.org/10.3390/f9080453
Chicago/Turabian StyleAznar-Sánchez, José A., Luis J. Belmonte-Ureña, María J. López-Serrano, and Juan F. Velasco-Muñoz. 2018. "Forest Ecosystem Services: An Analysis of Worldwide Research" Forests 9, no. 8: 453. https://doi.org/10.3390/f9080453
Note that from the first issue of 2016, this journal uses article numbers instead of page numbers. See further details here.