Article

Transcriptome and Small RNA Sequencing Analysis Revealed Roles of PaWB-Related miRNAs and Genes in Paulownia fortunei

1
Institute of Paulownia, Henan Agricultural University, 95 Wenhua Road, Jinshui District, Zhengzhou 450002, China
2
Forestry Academy of Henan, Zhengzhou 450002, China
3
College of Forestry, Henan Agricultural University, 95 Wenhua Road, Jinshui District, Zhengzhou 450002, China
*
Author to whom correspondence should be addressed.
Forests 2018, 9(7), 397; https://doi.org/10.3390/f9070397
Submission received: 9 June 2018 / Revised: 29 June 2018 / Accepted: 3 July 2018 / Published: 4 July 2018
(This article belongs to the Section Forest Ecophysiology and Biology)

Abstract

:
Paulownia witches’ broom (PaWB) is an epidemic disease caused by phytoplasmas infection, which is responsible for large production and economic losses. The study of PaWB has made significant progress, but the specific molecular mechanisms associated with PaWB remain unclear. To clearly know the gene expression profiles of plantlets infected with phytoplasmas, in this study, we used high-throughput sequencing technology to generate an integrated analysis of the transcriptome and microRNAs (miRNAs) of Paulownia fortunei (seem.) Hemsl. plantlets, and to obtain a comprehensive resource for the relationship between vital miRNA-target gene pairs and PaWB. A total of 756 genes, and 45 conserved and 22 new miRNAs were identified associated with PaWB. In addition, 635 target genes were predicted for the 67 DERs (Differentially expressed miRNAs). An interaction network of these miRNAs and their target genes was constructed. Gene ontology (GO) and KEGG pathway analysis of these target genes indicated that genes encoding transcription factors (TFs), including auxin response factors (ARF), WRKY, NAC (NAM, ATAF1/2 and CUC2), and MYB (v-myb avian myeloblastosis viral oncogene homolog), and genes encoding superoxide dismutase (SOD), as well as alternative splicing were related directly or indirectly to PaWB. Our results shed light on the possible roles of genes and miRNAs in PaWB-infected plantlets, which will enhance the understanding of the PaWB mechanism in Paulownia plants.

Graphical Abstract

1. Introduction

As an important member in Scrophulariaceae family, the genus Paulownia contains some fast growing tree species [1]. Up to now, Paulownia has been introduced to many countries and areas, such as Japan, Southeast Asia, Australia, and Brazil [2]. Taking advantage of its excellent characteristics such as high-quality, even texture, strong resistance to water stress and saline alkali, Paulownia was widely utilized in building construction, furniture, musical instruments, various craft products, and even for soil conservation, windbreak, and sand fixation [3,4].
Nevertheless, the production of Paulownia would suffer severe or even fatal loss when it is infected with phytoplasmas [5]. Phytoplasmas are single-cell prokaryotic organisms without a cell wall, which can infect more than 1000 plant species such as jujube [6], Paulownia [7], mulberry [8], peanut [9] and sweet potato [10]. As obligate parasites, they live and multiply not only in the intestinal tract, lymph, salivary glands and other tissues of insects, but also in the phloem cells of plants [11,12]. The host plants of phytoplasmas exhibit mainly stem section shortening, leaf chlorosis, phyllody, and witches’ broom [13,14]. The symptoms in phytoplasmas-infected plants might be caused by nutrient consumption, which was directly related to the activity of effector proteins secreted by phytoplasmas [15]. Since phytoplasmas have no cell wall, they can directly interact with their host plants by exposing their membrane proteins or effectors to plant cytoplasm [16]. Previous research indicated that phytoplasmas can regulate the gene expression levels by secreting the effector proteins TENGU, SAP11, and SAP54 to induce typical symptoms in host plants [17,18]. In order to defend pathogen invasion, the corresponding immune responses were subsequently launched in host plants. So far, two immune responses against pathogen have been reported in host plants, i.e., effector-triggered immunity (ETI) and pathogen-associated molecular pattern (PAMP)-triggered immunity (PTI) [19]. During the past few decades, some proteins, metabolites, miRNAs and genes related to plant hormone signal transduction, secondary metabolism, and photosynthesis have been found to be involved in Paulownia witches’ broom (PaWB) [20,21,22,23,24], while the interaction between phytoplasmas and infected plants is not yet clearly known.
The gene expression network is usually regulated by multiple factors at transcriptional levels. Among all these regulatory factors, microRNAs (miRNAs, a kind of small noncoding RNAs (21–24 (nucleotides) nt) that are derived from pre-miRNA (50–350 nt)) play vital roles in gene expression regulation. Generally, miRNAs inhibit the translation process by binding to the 3′ untranslated regions of their target genes [25,26]. In addition, miRNAs are also reported to influence many biological processes in biotic/abiotic stress responses [27,28]. For instance, miRNA393 was found to help the host plant cells to recognize the characteristics of pathogens, and then triggered a series of defensive responses such as rapid gene expression changes, and phytohormone and metabolite induction [29,30]. MiR156 and miR164 were induced in response to virus infection in Nicotiana tabacum Linn. [31] and Arabidopsis thaliana Heyn [32]. At the same time, miR156, miR159 and miR172 were differentially expressed in phytoplasmas infection, which played critical roles in Jujube witches’-broom (JWB) disease [6].
Advances in high-throughput sequencing technologies have made the integrated analysis on small RNAs and transcriptome sequencing easier. Moreover, the availability of the Paulownia fortunei (P. fortunei) genome information has enhanced the accuracy of gene annotations in Paulownia. In this study, we combined transcriptome and small RNA (sRNA) sequencings to conduct a comprehensive analysis on the immunity mechanisms of PaWB in P. fortunei, and attempt to elucidate a miRNA-target gene interaction network related to PaWB. Overall, our results provide a platform to better understand the interaction of pathogen–host in Paulownia and other tree species.

2. Materials and Methods

2.1. Plant Materials

Healthy P. fortunei (PF) and PaWB-infected P. fortunei (PFI) plantlets were obtained from the Institute of Paulownia, Henan Agricultural University, China (34° N, 113° E). The tissue culture plants of PF and PFI were grown in 1/2 Murashige and Skoog (1/2 MS) medium in 350 mL plastic culture flasks for 30 days. The cultivation conditions in the phytotron were as follows: temperature, 25 ± 2 °C, light intensity, 130 µL·m−2·s−1, and photoperiod, 16 h light/8 h dark. The apical buds of PF and PFI (30 apical buds were mixed into one sample) were collected when they grew to 1.5 cm. The mixed samples were placed immediately in liquid nitrogen and stored at −80 °C for RNA extraction. Three biological replicates were used for transcriptome and sRNA sequencing of PF and PFI. Principal component analysis (PCA) [33] was utilized to perform biological replicates analysis.

2.2. Transcriptome Sequencing and Data Analysis

Total RNA of PF and PFI was isolated using Trizol reagent (Invitrogen, Carlsbad, CA, USA) and the ribosomal RNAs were removed. RNA pollution and disintegration were evaluated by 1% agarose gel electrophoresis. The integrity and purity of the RNA samples were detected using a Bioanalyzer 2100 (Agilent, Santa Clara, CA, USA) and RNA 6000 Nano LabChip Kit (Agilent). After purification, the poly (A)− or poly (A)+ RNAs were cleaved into fractions by fragmentation buffer. The cDNAs were synthesized according to the previous published report [34]. Then, paired-end sequencing of PF and PFI was performed on an Illumina HiSeq 4000 platform (LC-BIO, Hangzhou, China) following the manufacturer’s instructions. Low-quality reads that contained poly (N) and adapter sequences were removed from the raw reads using the Illumina Pipeline to obtain high-quality valid reads. The valid reads were mapped to the reference genome (http://paulownia.genomics.cn/page/species/index.jsp) by SOAP2 software (Version 2.21, http://soap.genomics.org.cn/). Then, the mapped reads were searched against NCBI’s (National Center for Biotechnology Information) non-redundant protein sequence (NR) database (http://www.ncbi.nlm.nih.gov) [35], Swiss-Prot protein database (http://www.uniprot.org/), Clusters of Orthologous Groups (COG) database (http://www.ncbi.nlm.nih.gov/COG), gene ontology (GO) database (http://www.geneontology.org/), and Kyoto Encyclopedia of Genes and Genomes (KEGG) pathway database (http://www.genome.jp/kegg) by BLASTX (e value < 10-5) for functional annotation.
In order to identify the reads that were related to PaWB, the PF and PFI libraries were compared according to Audic et al., and fragments per kilo base of transcript per million mapped reads (FPKM) were used to measure the expression levels of the transcript [36]. The critical p-values in multi-hypothesis testing and analysis were confirmed by the false discovery rate (FDR). Differentially expressed genes (DEGs) were identified by |log2 fold change| ≥ 1 and FDR ≤ 0.001 [37]. The pathways were enriched by in-house software.

2.3. Construction, Sequencing, and Identification of sRNAs

Total RNA samples were used for the construction of PF and PFI sRNA libraries. The sRNA fractions were segregated by polyacrylamide gel electrophoresis (PAGE). The 18–30 nt fractions were used to produce the libraries, and T4 RNA ligase was used to connect 5′ and 3′ adapters. After a series of reverse transcription and PCR processes, single-end sequencing was performed on the PCR-amplified products using an Illumina HiSeq 2500 platform at the LC-BIO (Hangzhou, China). The adapter, pollution, low-quality reads, and the reads <18 nt were removed from the raw reads. The valid reads were mapped to the genome using the SOAP2 software [38]. The mapped reads were further filtered using a proprietary pipeline script, ACGT101-miR v4.2 (LC Science, Houston, TX, USA), to remove rRNAs, tRNAs, and snRNAs. The remaining unique reads were matched to miRBase Release 21.0 (http://www.mirbase.org/) using BLAST to identify known miRNAs (aligned sequence should contain <2 mismatches). The remaining reads that cannot match to miRBase were examined using MIREAP (Version: 0.2, http://sourceforge.net/projects/mireap/) and RNAfold (Version: 3.8, http://rna.tbi.univie.ac.at/cgibin/RNAfold.cgi) [39] to predict the typical stem-loop hairpin structures to obtain candidate novel miRNAs. In addition, the criteria for novel miRNAs screening were formulated by Meyers et al. [40].

2.4. DERs Identification and Target Genes Prediction

DERs were predicted as Han et al. described [41]. To better understand the molecular function of the miRNAs that related to PaWB, TargetFinder software (Copyright: 2007–2010, http://jcclab.science.oregonstate.edu/node/view/56334, computational target prediction algorithms) was used to identify the miRNA binding sites in the mRNAs to predict the target gene of the DERs. The BLASTX algorithm and GO analysis were used to search and annotate the target genes in the NCBI database (http:www.ncbi.nih.gov/gene/data/GO).

2.5. Construction of the miRNA-Target Gene Interaction Network

A miRNA-target gene interaction network was constructed based on the PaWB-related DERs and their target genes. The relationship between DERs and genes were identified using the STRING database v10.5 (https://string-db.org/). Finally, the interaction network of DERs and genes was constructed by Cytoscape software v2.8.3 (http://chianti.ucsd.edu/Cyto-2_8_3/) [42,43].

2.6. qRT (Quantificational Real-Time Polymerase)-PCR Validation

PCR was performed to verify the high-throughput sequencing and target gene predictions results. The RNA samples used for the qRT-PCR were the same as the samples that used for sequencing. The cDNAs of the miRNAs and mRNAs were synthesized with a SYBR® PrimeScriptTM miRNA RT-PCR Kit (TaKaRa, Dalian, China) and a Superscript III First-Strand Synthesis system. The primers of miRNAs were designed basing on the corresponding mature miRNA sequences, and the primers of the target genes were designed using Primer 5 program (Applied Biosystems, Foster City, CA, USA). The qRT-PCR was performed with a SYBR® Premix Ex TaqTM Kit (TaKaRa, Dalian, China) and a SYBR® PrimeScriptTM miRNA RT-PCR Kit (TaKaRa, Dalian, China). The parameters in the PCR amplification program were set as: 95 °C for 1 min; 40 cycles of 95 °C for 10 s, and 55 °C for 15 s. 18S rRNA and U6 were selected as the internal reference genes for the miRNAs and mRNAs, respectively. The primers used for the qRT-PCRs are listed in Table 1.

3. Results

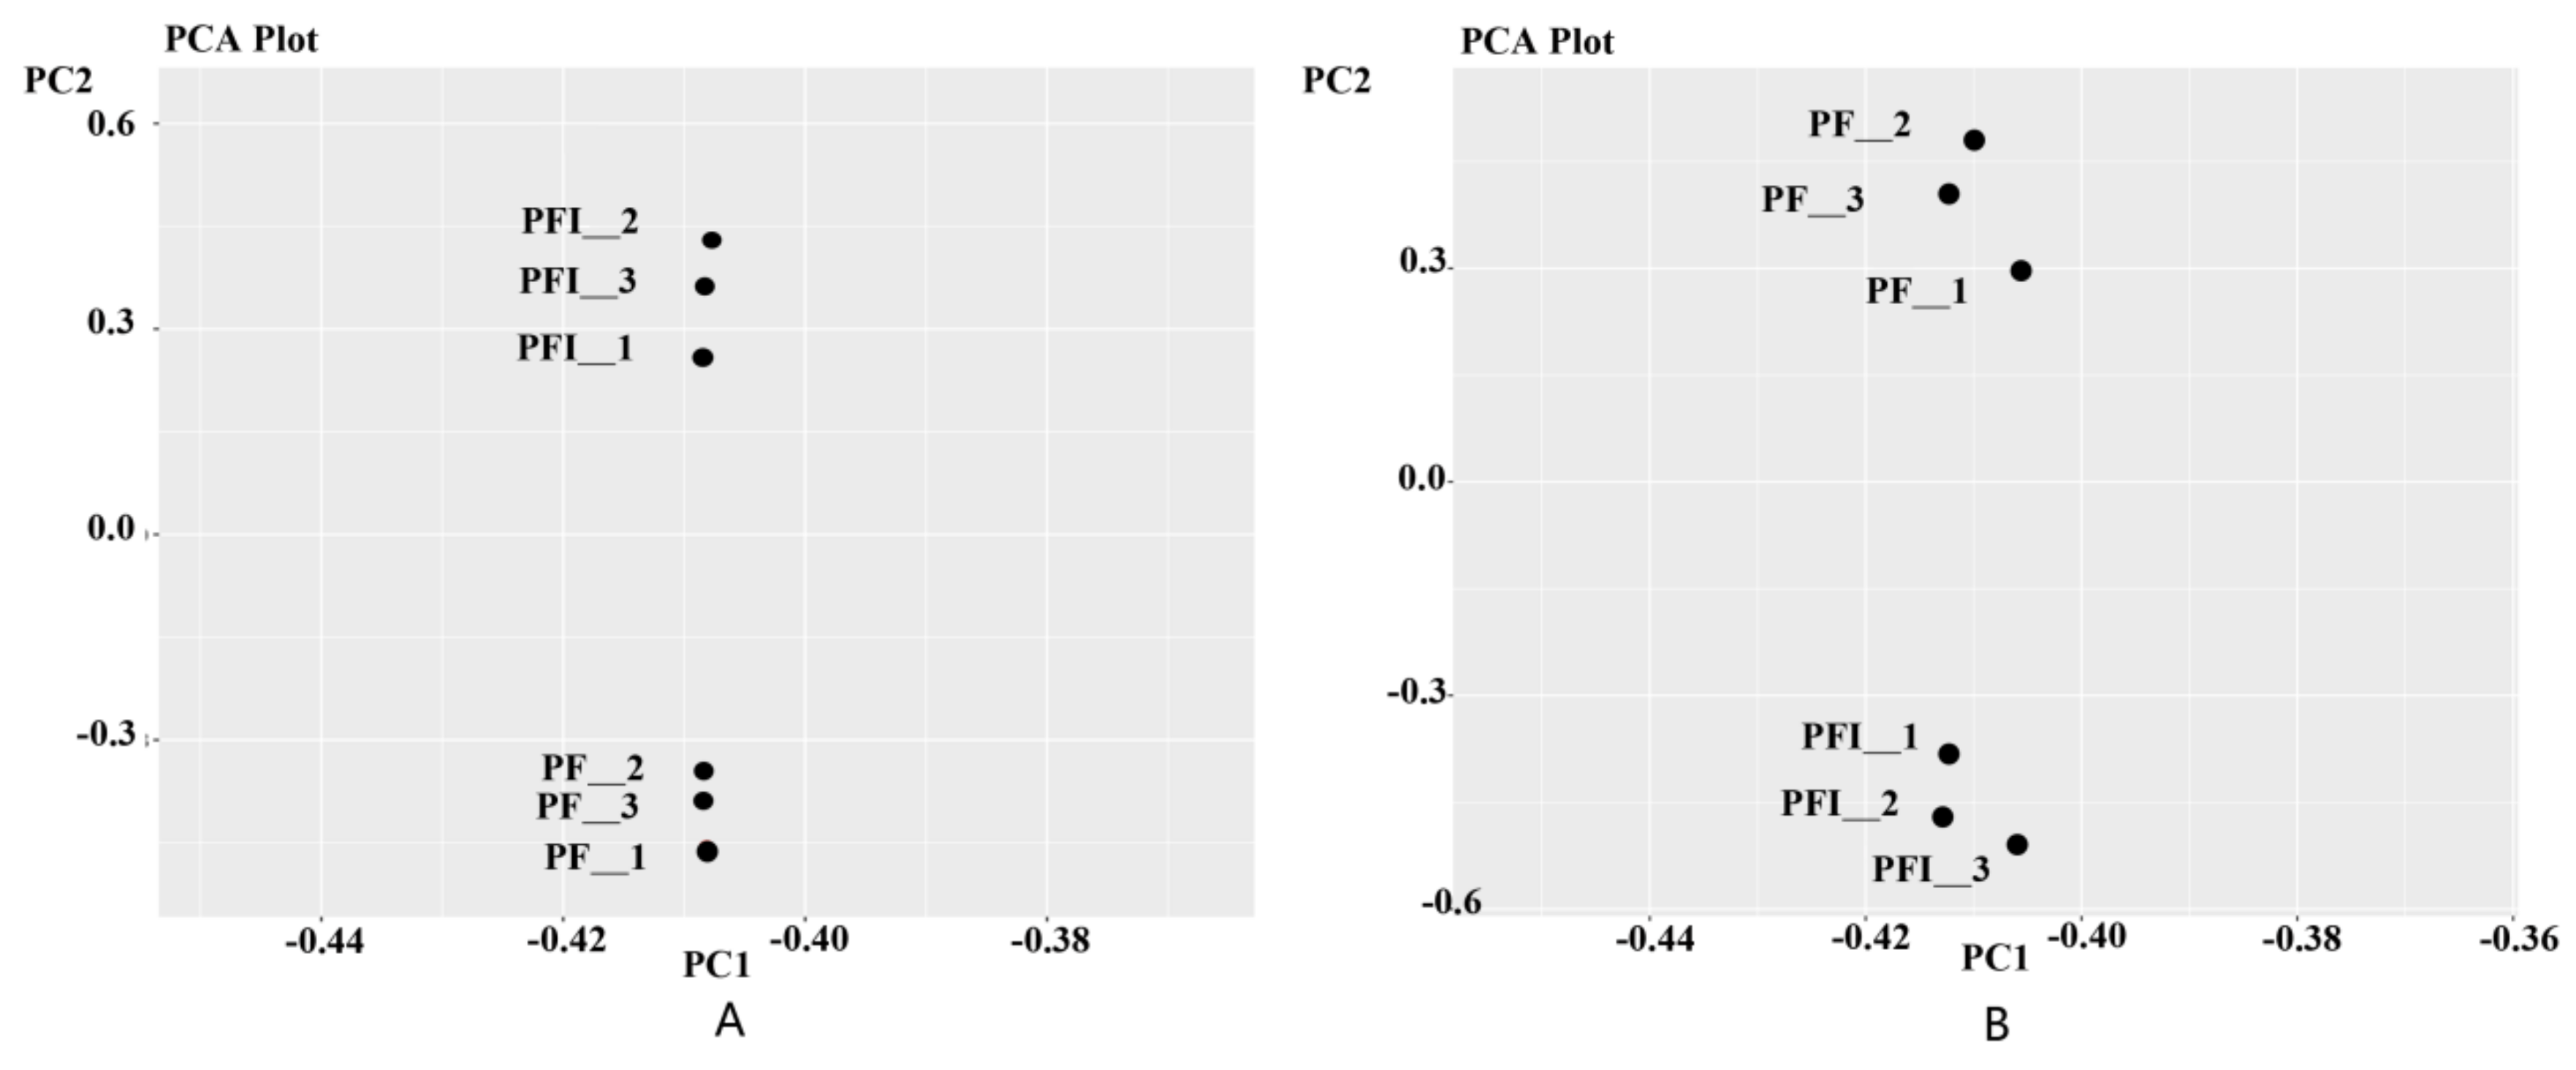
3.1. Transcriptome Sequencing Analysis

To detect the genes that were related to PaWB, transcriptome sequencing (with three biological replicates) of PF and PFI libraries was performed. The PCA results of the three biological replicates showed the data have good reproducibility (Figure 1A). A total of 131,903,380 and 141,209,455 raw reads were obtained from the PF and PFI mRNA libraries, respectively. After filtering out low-quality reads, 118,789,530 and 134,197,596 valid reads were obtained (Table 2). The valid reads that can map to the P. fortunei reference genome were shown in Table 3. To investigate the expression levels of all the genes, a FPKM boxplot was drawn, and this also provided a preliminarily indication of the repeatability of the samples (Figure S1).
In order to annotate the gene functions, NR, Swiss-Prot, KEGG, COG, and GO databases were searched (E < 10−5). According to the DEG criteria, 756 DEGs that may be related to PaWB were detected (Table S1). To better understand the functions and classifications of the 756 DEGs, the GO and KEGG databases were used to perform gene annotation. The GO functional analysis indicated that most of the DEGs were mainly involved in these terms, such as the oxidation–reduction process, nucleus and protein binding. According to the KEGG pathway enrichment analysis, most of the DEGs were enriched in the glycolysis/gluconeogenesis, glycerolipid metabolism, and flavonoid biosynthesis pathways (Figures S2–S4).
Among the 756 DEGs, a total of 100 Transcription Factors (TFs)-encoding genes were detected. These TF genes can be classified into 24 families, including the WRKY (18%), NAC (16%), and bHLH (basic helix-loop-helix) (14%) families (Figure 2). Thus, in the PFI plants, the genes encoding WRKY, bHLH, NAC, ARF, and MYB TFs were differentially expressed.

3.2. PaWB-Related Alternative Splicing (AS) Analysis

AS is an important regulatory mechanism that plays a vital role in gene expression [44]. In a plant database (http://www.plantgdb.org/ASIP/Download/) of AS genes, genes related to the stress response tended to undergo more AS events than other genes, indicating that AS may be involved in the biotic and abiotic stress response processes [45]. In the present study, we used AS analysis software (Version: 1.0, http://ccb.jhu.edu/software/ASprofile/) to classify the predicted AS events for the mRNA transcripts into 12 categories: alternative exon ends (AE), approximate AE (XAE), intron retention (IR), approximate IR (XIR), multi-IR (MIR), approximate MIR (XMIR), multi-exon SKIP (MSKIP), approximate MSKIP (XMSKIP), skipped exon (SKIP), approximate SKIP (XSKIP), transcription start site (TSS), and transcription terminal site (TTS) (Table 4).

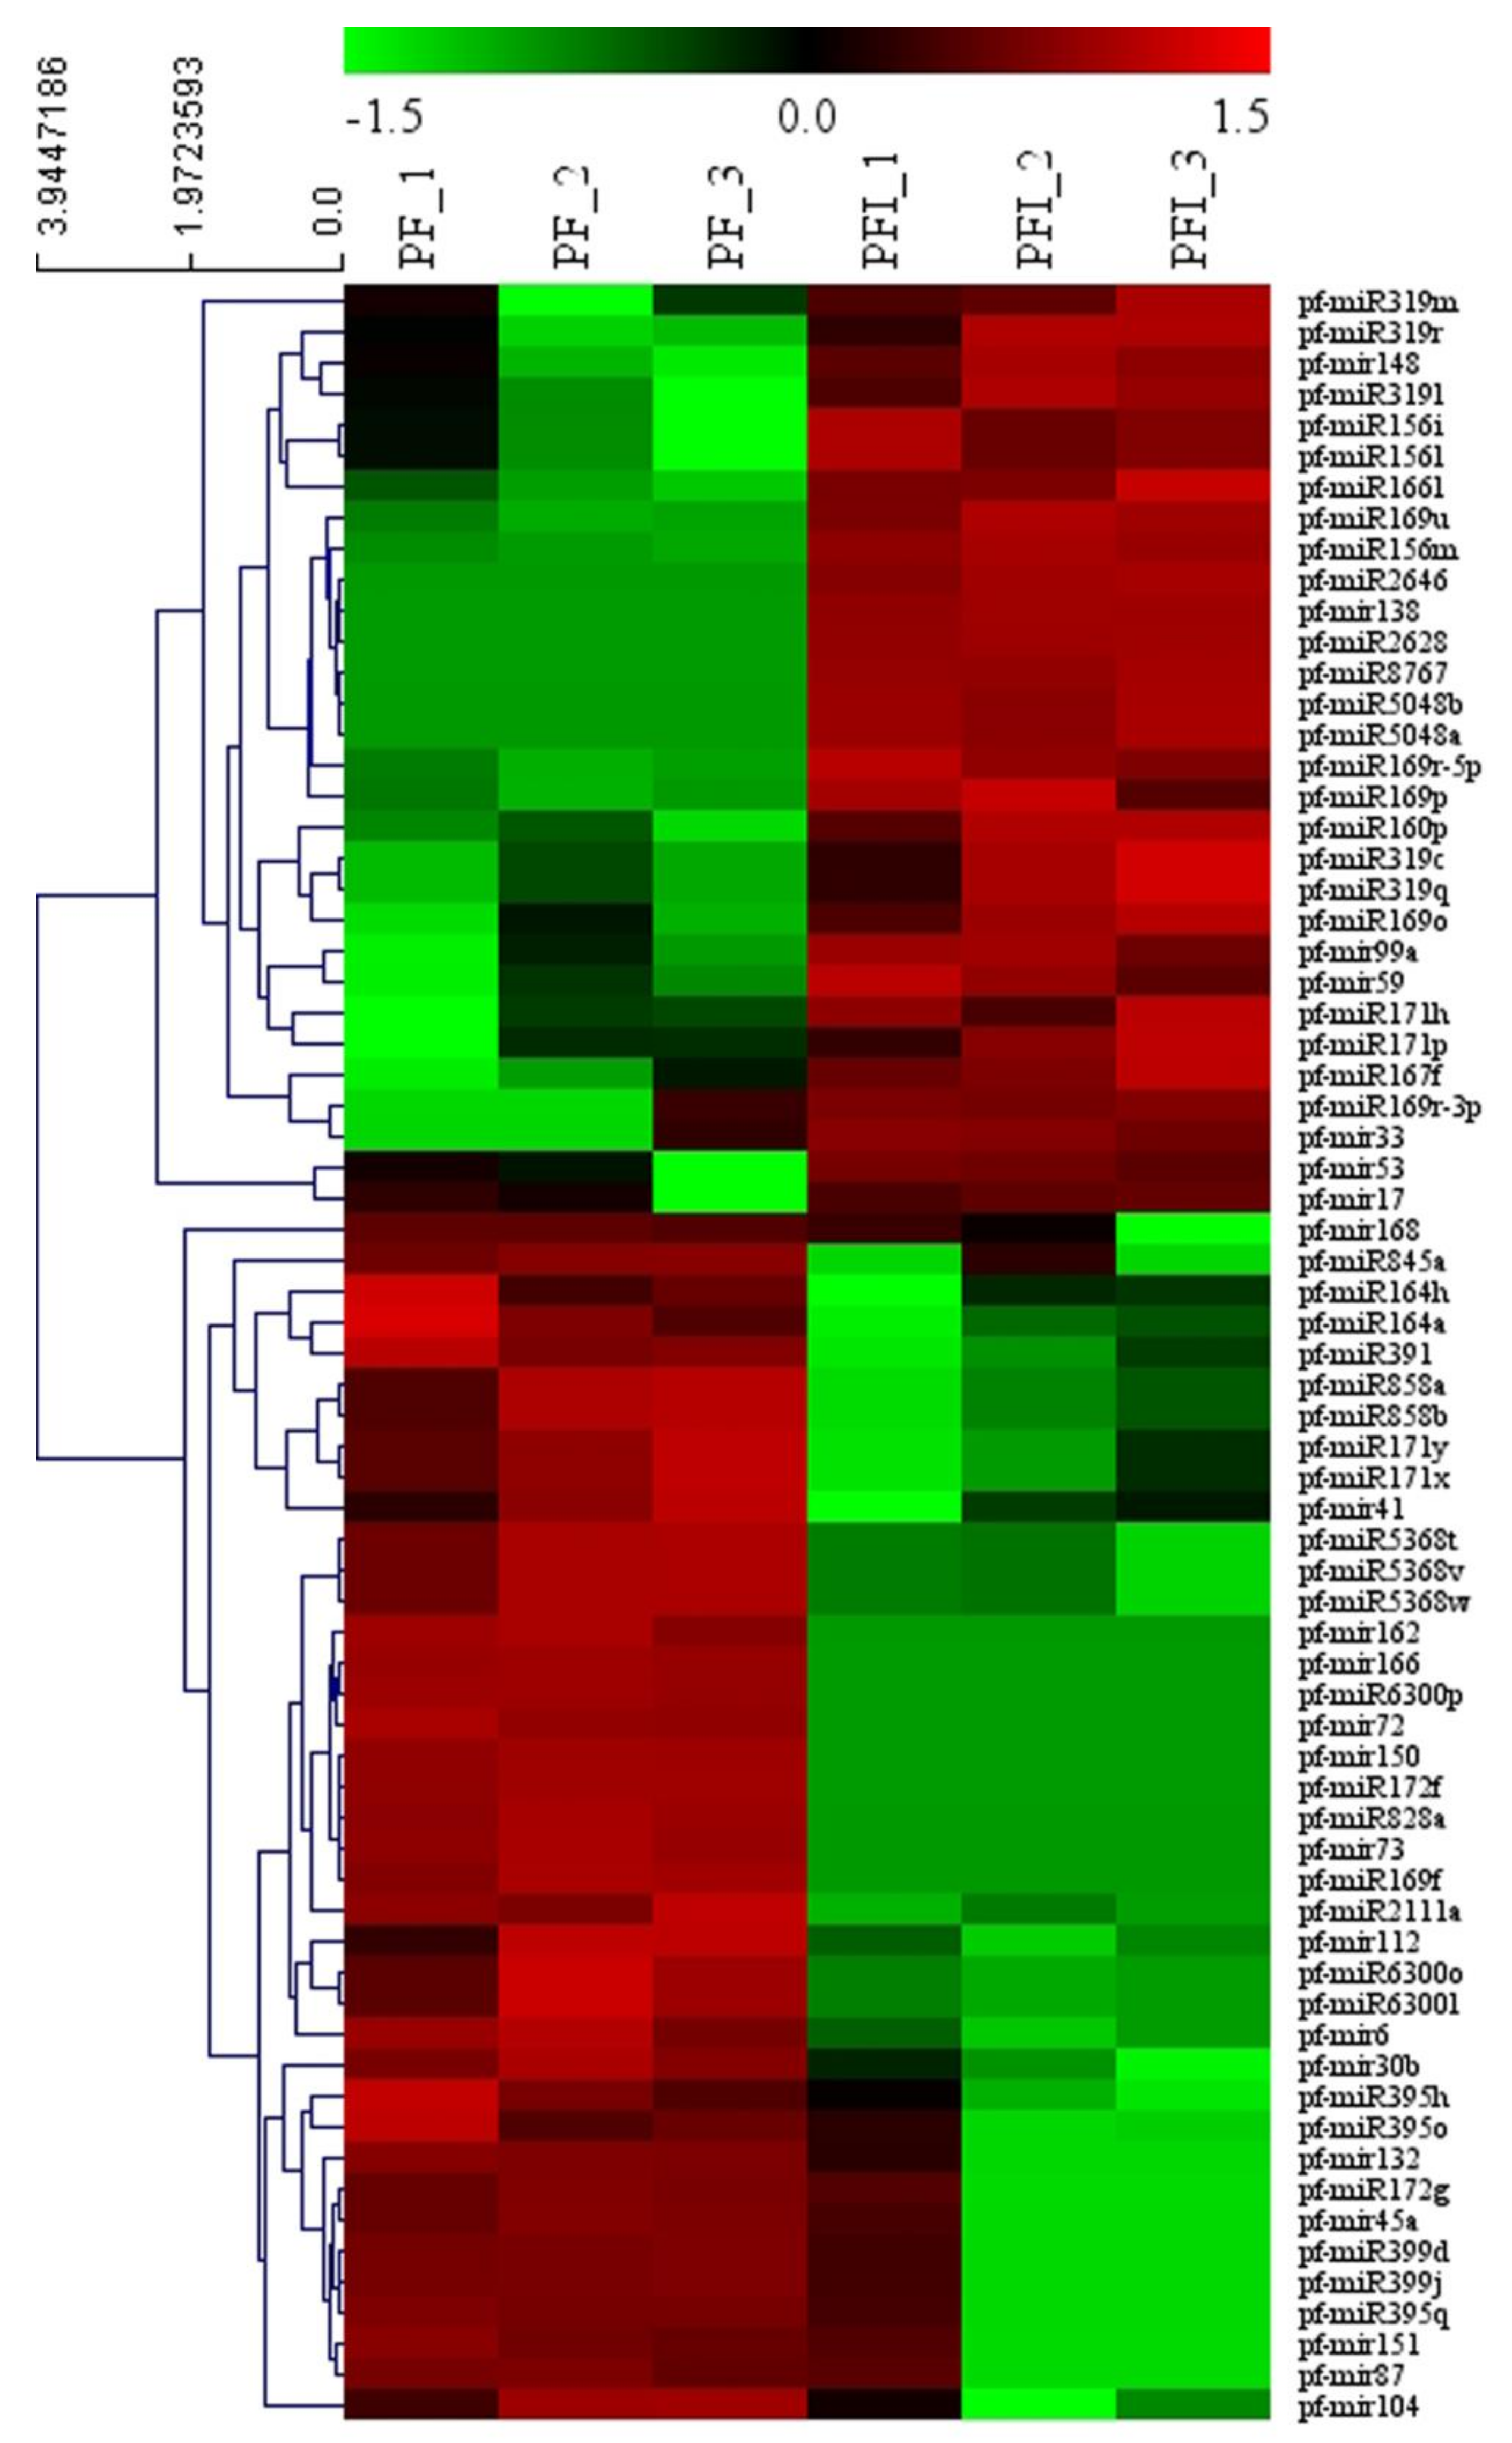
3.3. miRNA Identification

The PF and PFI sRNA libraries were constructed to study the miRNA expression profiles in response to PaWB. The PCA of the three biological replicates was showed in Figure 1B. More than 10 million raw reads were obtained from each replicate. After filteration, 8,180,411 and 7,109,787 valid reads from PF and PFI were obtained, respectively (Table S2). The lengths of valid reads ranged from 18 nt to 24 nt (Figure 3), which is consistent with a previous report that suggested 24 nt and 21 nt sRNAs may play crucial roles in PaWB resistance. A total of 493 miRNAs in the PF and PFI libraries were identified (Table S3); 321 miRNAs belonging to 51 families were known miRNAs. Among them, miR156, miR159, and miR166 families occupied high percentages (Table S4). The remaining 172 miRNAs that cannot map to miRBase sequences were identified as new candidate miRNAs. Most of the new miRNAs were found in lower abundance than the conserved miRNAs, which is consistent with previous studies [46].

3.4. Functional Analysis of the PaWB-Related miRNAs and Their Target Genes

To identify the miRNAs which were involved in PaWB, 67 DERs (22 novel and 45 conserved) that satisfied two conditions, Fold Change (FC) ≥ 1.0 or ≤ −1.0 and p-values ≤ 0.05) were detected for analysis (Table S5). According to the heatmap, the vast majority of the DERs that belonged to the same family exhibited the same expression patterns. For instance, five, three, and four members of the miR319, miR156, and miR169 families were upregulated in the PFI library, and three, three, and two members of the miR395, miR6300 and miR171 families were downregulated. Among the new miRNAs, seven were upregulated and 15 were downregulated (Figure 4). In addition, 569 target genes of 39 conserved miRNAs were identified (Table S6). Furthermore, 66 target genes of seven new miRNAs were also predicted. Ten of the miRNAs targeted a single gene, while the remaining miRNAs targeted more than two genes. Moreover, Pf-miR8767 had 123 predicted target genes.
The 635 predicted target genes were annotated by GO functional classification to further determine whether they played vital roles in PaWB (Figure 5). The GO functional analysis indicated that transcription and transcription regulation processes were the most abundant terms under the biological process category. Under the cellular component category, the most abundant terms were nucleus and plasma membrane. Under the molecular function category, the most abundant term was protein binding. The functional analysis of these target genes indicated that TFs such as MYB3, MYB5, ARFs, NAC, and WRKY may be related to PaWB.
In addition, GO and KEGG pathway enrichment were performed to further understand the biological functions of target genes. The results showed that some critical biological pathways may be involved in PaWB response (Figure 6A,B). GO terms related to disease resistance (GO: 0003700 transcription factor activity, sequence-specific DNA binding; GO: 0004364 glutathione transferase activity) and phytohormone (GO: 0009737 response to abscisic acid; GO: 0009741 response to brassinosteroid; GO: 0009734 auxin-activated signaling pathway) were enriched. The KEGG pathway analysis indicated that the 735 target genes were mainly involved in plant–pathogen interaction, amino sugar and nucleotide sugar metabolism, and endocytosis. For example, the target genes of pf-miR858, miR160, and miRNA164 families encode MYB-like, ARF, and NAC TFs (which were reported to be involved in plant defense, and growth and development processes). In this study, miR156, miR159, miR397, and miR403 families were significantly upregulated in the PFI library. Taken together, these results demonstrate that the DERs and their target genes may play vital roles in response to PaWB.

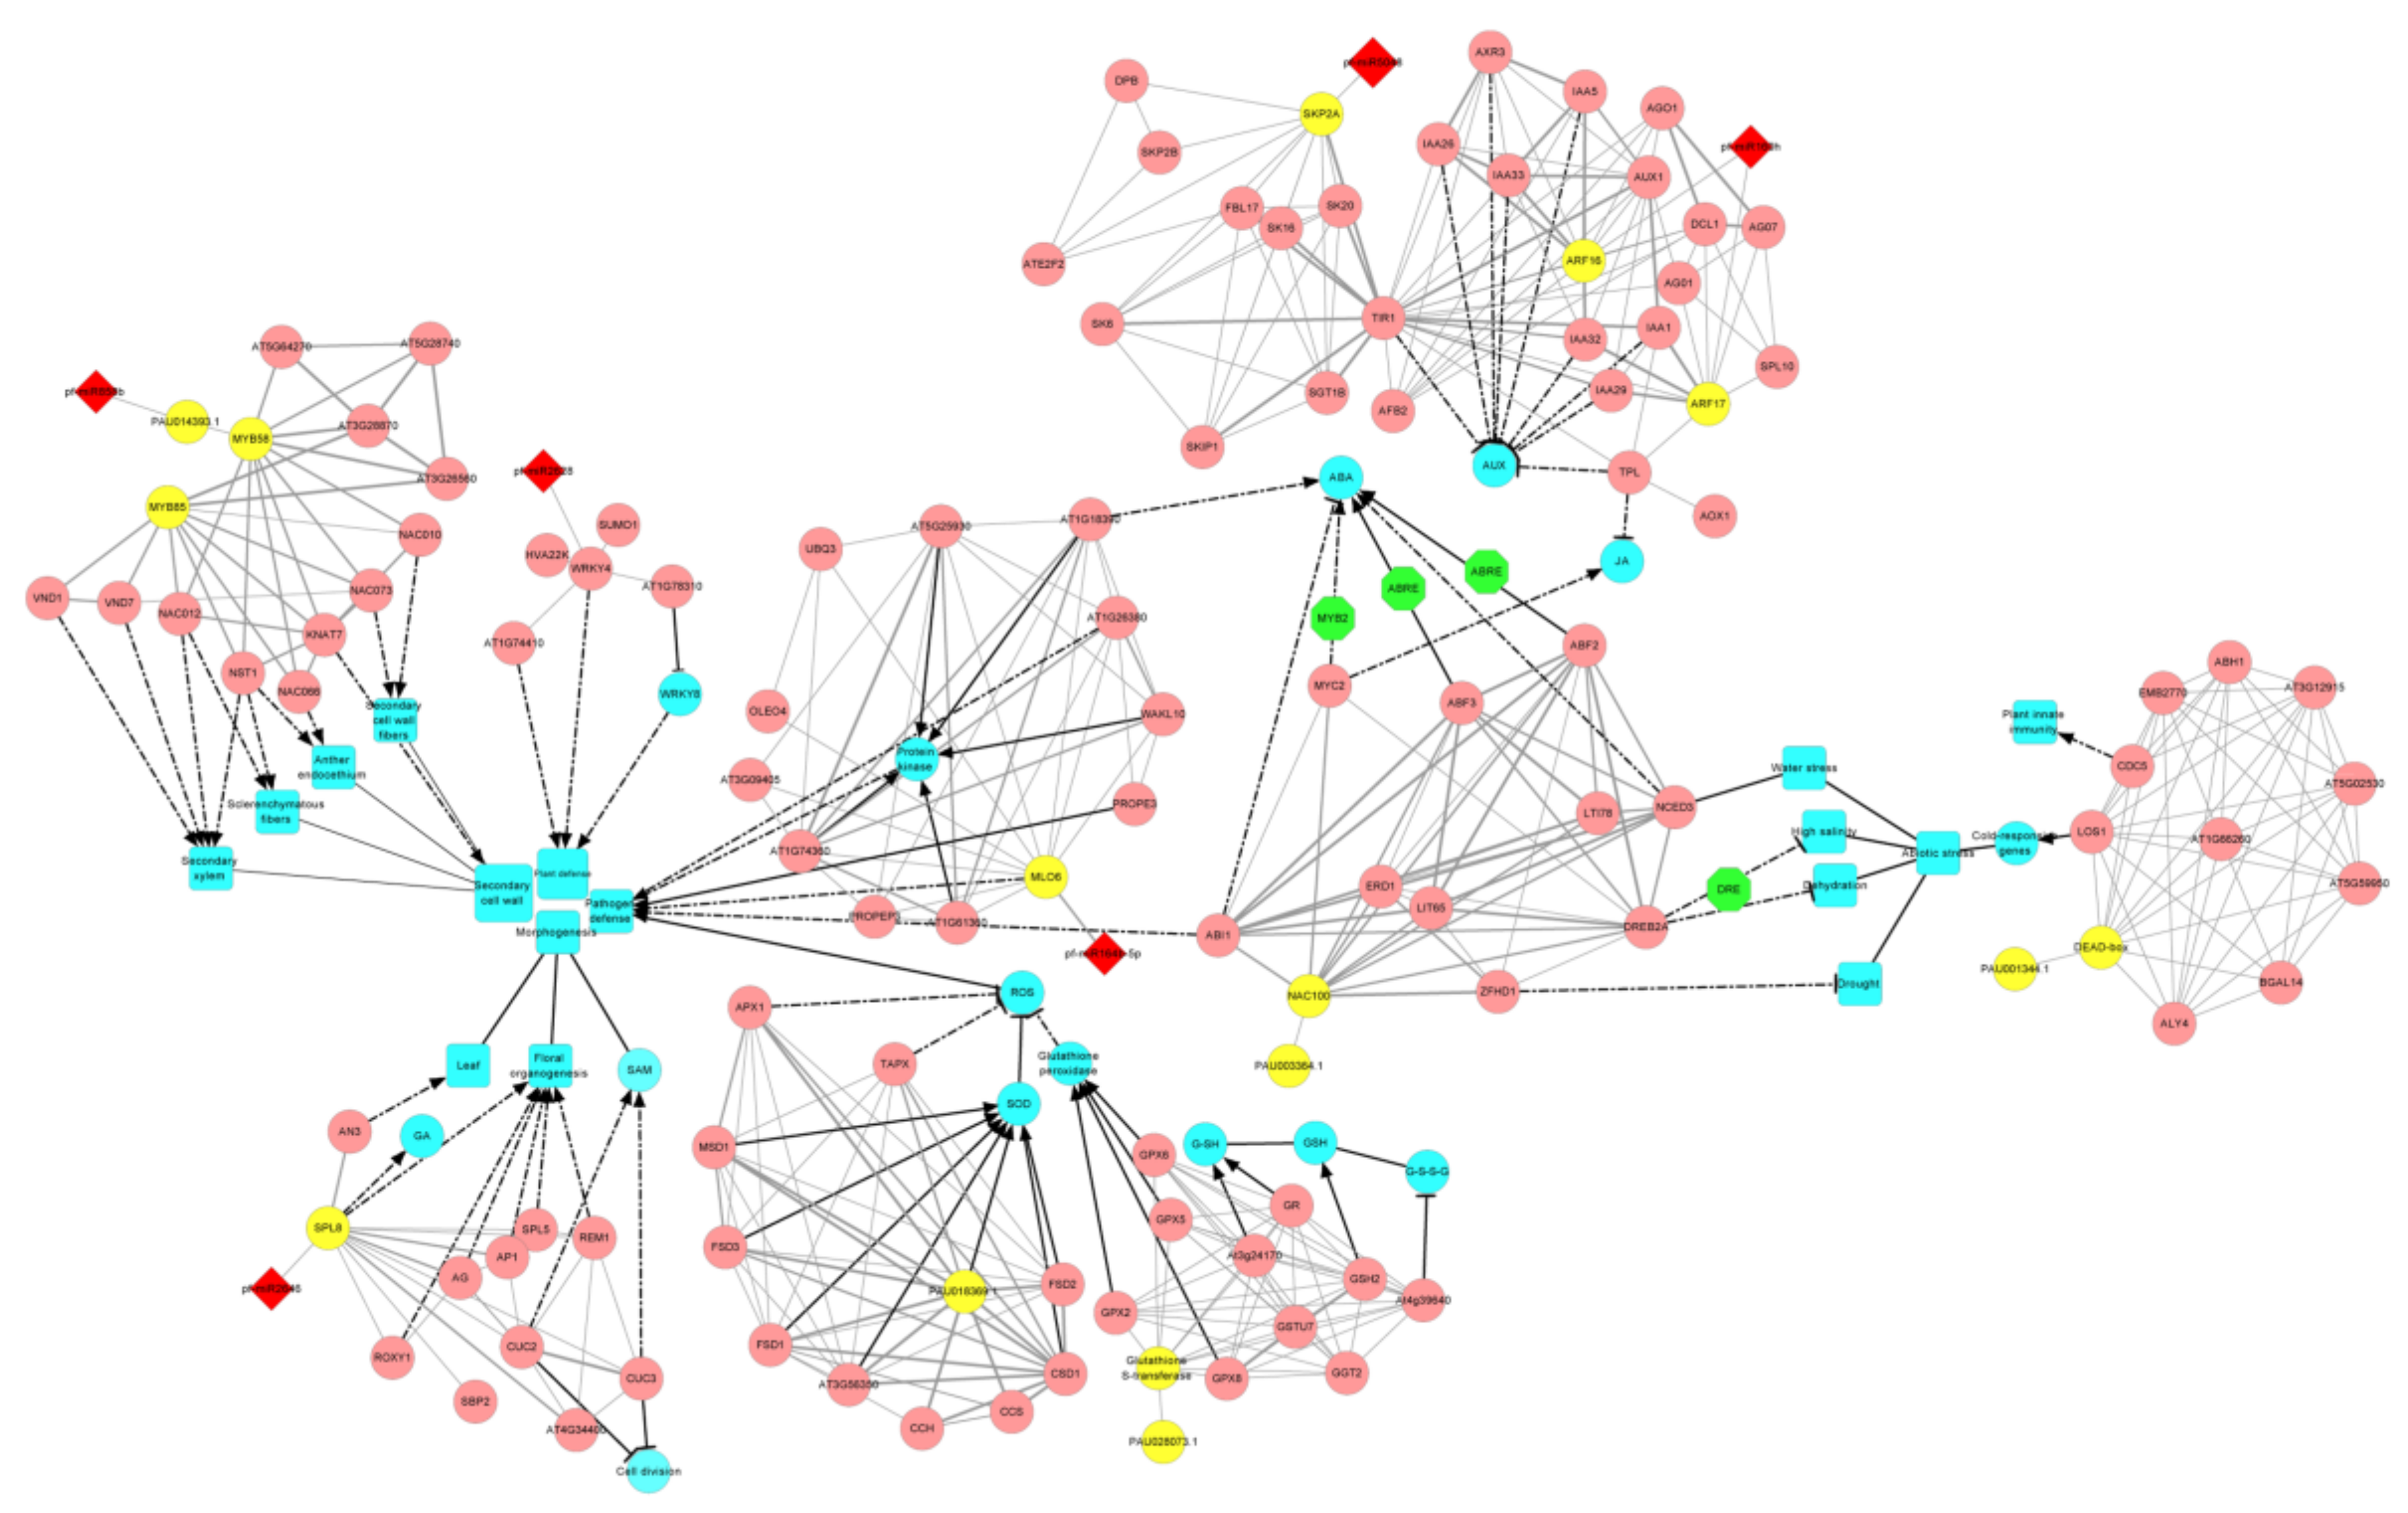
3.5. The miRNA-Target Gene Interaction Network That Related to PaWB

To further clarify the regulatory functions of the miRNAs and their target genes that involved in PaWB, a miRNA-target gene interaction network was constructed with Cytoscape. The network suggested that these DERs participated in multiple regulation process including morphogenesis, plant defense and plant hormones signal transduction. For instance, pf-miR858b, pf-miR2628 and pf-miR164b-5p mainly involved in regulation of plant defense. Among them, pf-miR858b played an essential role in the regulation layer of secondary cell wall biosynthesis. Pf-miR2628 might directly mediate the plant defense by regulating the expression of WRKY4 (or indirectly regulation of WRKY8). Pf-miR164b-5p might involve in plant defense process via activating the cascade response of protein kinases, which was essential for pathogen defense. Mildew resistance locus o 6 (MLO6) (target of Pf-miR164b-5p) mainly interacted with several proteins that participated in transmitting the signal to protein kinase, such as AT1G61360, AT1G74360, WAKL10, AT1G18390 and AT5G25930. Pf-miR5046 and pf-miR160h mainly participated in the signal transduction process of auxin (AUX) and abscisic acid (ABA), which were essential in plant development, and they seemed to have a more complicated mechanism to the hormone in the regulation layer. Furthermore, pf-miR2624 that targeted (SPL8) was mainly involved in the morphogenesis of leaf and floral organs. In summary, the network indicated that DERs may be involved in multiple developmental processes of plants in different ways to respond to PaWB-infection (Figure 7).

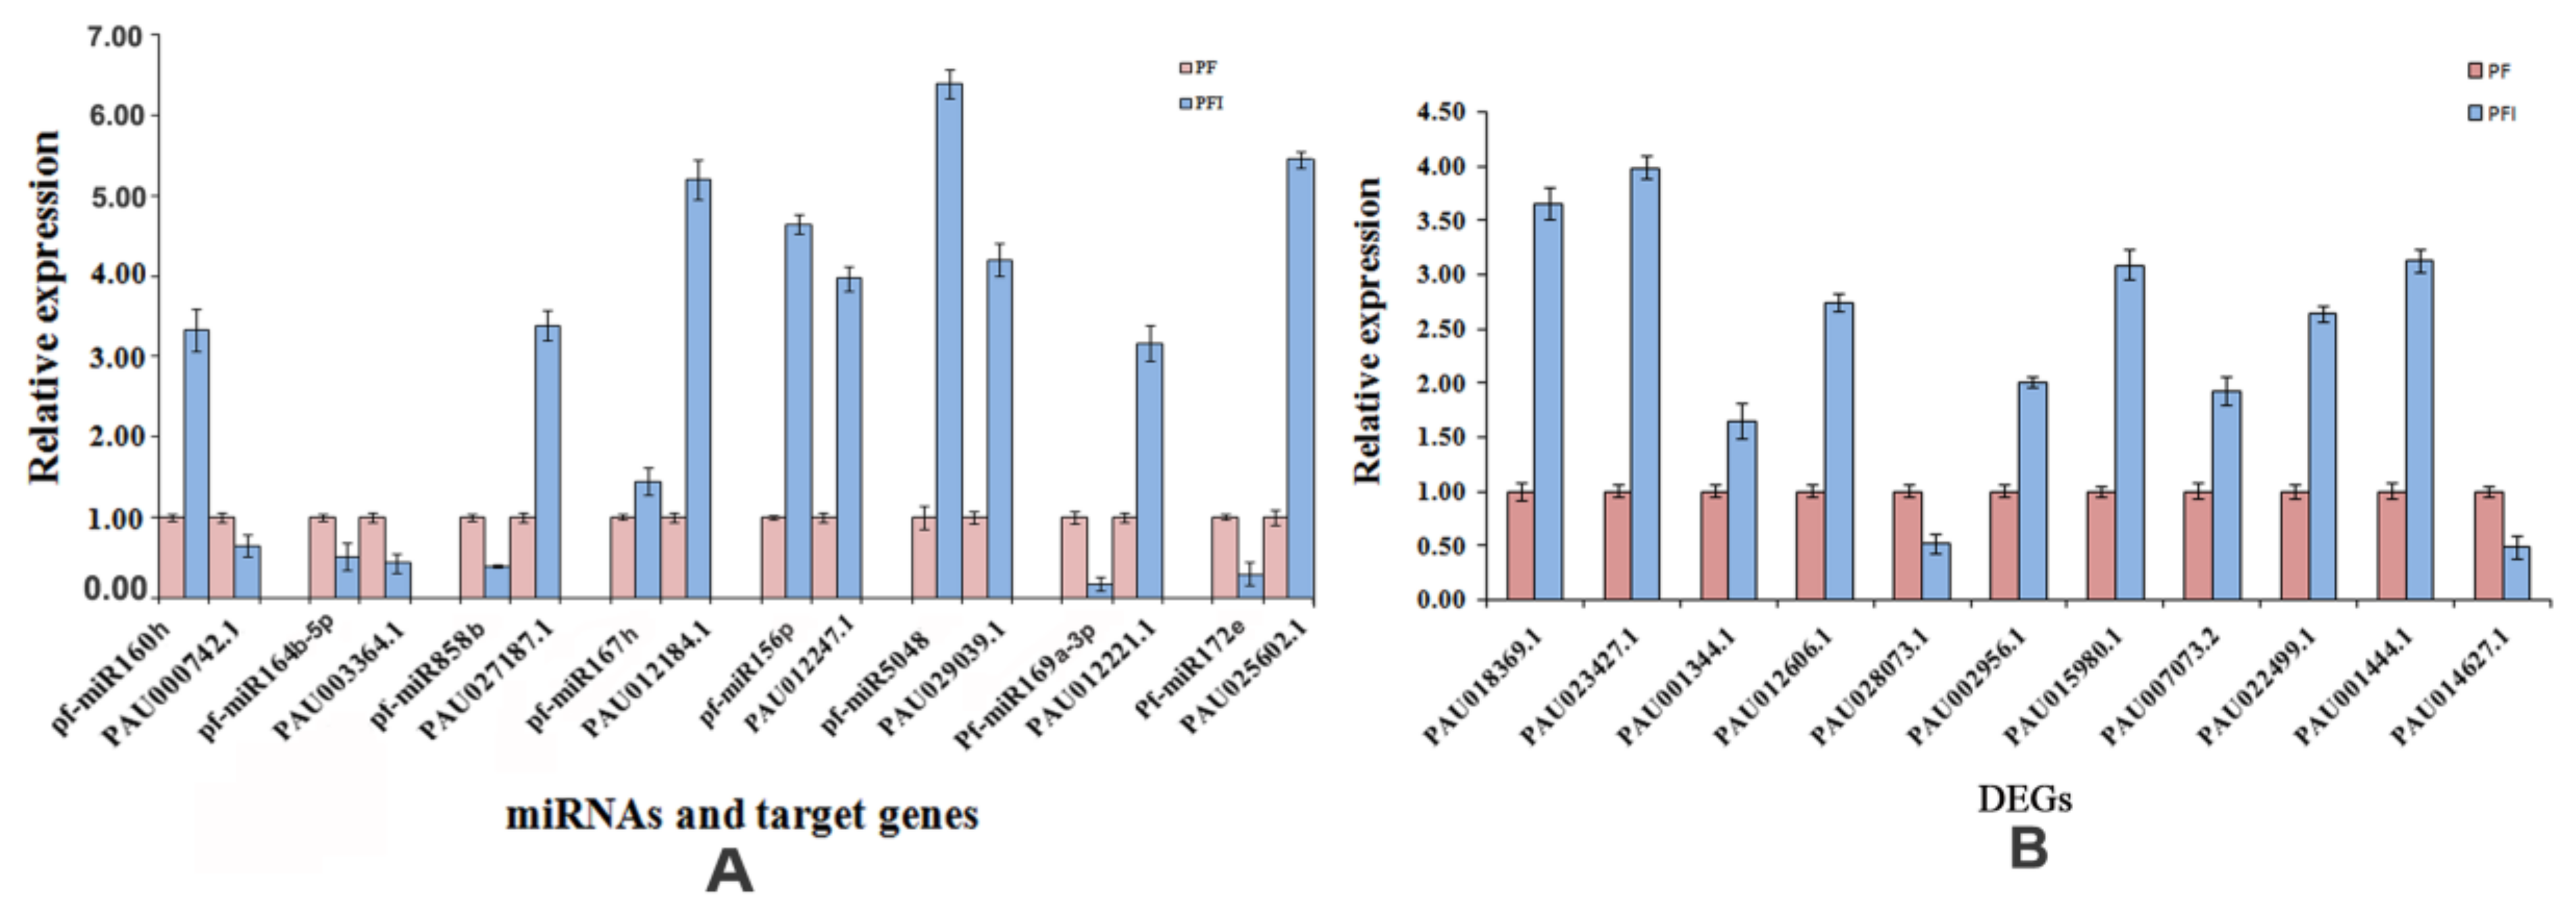
3.6. Verification of the Expression Patterns of miRNAs and Their Target Genes

To verify the reliability of the high-throughput sequencing results, 11 differentially expressed mRNAs, eight target genes and their corresponding DERs were randomly chosen for qRT-PCR verification. The results indicated that the expression patterns of the DERs and differentially expressed mRNAs were similar in high-throughput sequencing. Further analysis suggested that expression patterns of four miRNA–mRNA pairs (pf-miR160h–PAU000742.1, pf-miR858b–PAU027187.1, pf-miR169a-3p–PAU012221.1, and pf-miR172e–PAU025602.1) were negatively correlated, and the expression patterns of the other four miRNAs–mRNA pairs (pf-miR164b-5p–PAU003364.1, pf-miR167h–PAU012184.1, pf-miR156p–PAU012247.1, and pf-miR5048–PAU029039.1) were positively correlated (Figure 8). Similar regulation patterns of miRNA–mRNA pairs have been reported in cotton [47]. These results indicate that the transcriptome data are sufficient to estimate miRNA-target gene interactions in phytoplasmas infected P. fortunei.

4. Discussion

The availability of reference genome sequences makes the annotation of important genes, proteins, lncRNAs (LncRNAs (long non-coding RNAs) are defined as having more than 200 nucleotides and little protein-coding potential, which are an important class of pervasive genes involved in a variety of biological functions [48,49].), metabolites, and miRNAs more precise compared with the transcriptome background, as well as providing meaningful insights into genome reorganization, gene evolution and comparative genomic analyses between multiple species [50]. Thus, based on the reference genome, transcriptome and miRNAs were performed in phytoplasama infected plantlets, and obtained several key genes related to PaWB. Previous studies about genes related to PaWB have been found, but the mechanisms were still unclear. To get a deeper understanding of the interaction between Paulownia and phytoplasmas, we compared the data obtained in this study with others [51,52]. The number and species of miRNAs or genes in the present study were different. The probable reasons for this difference are as follows: three biological replicates were performed in this study, making the data more reliable; the plant materials in previous reports were treated with reagent, which might lead to the changes in miRNAs and gene expression; and high-throughput sequencing was performed with the genome of P. fortunei as the reference.

4.1. PaWB Responsive DER-Target Gene Pairs Regulate Morphological Variations

Expression variations of miRNAs make it possible for responding to phytoplasmas invasion with reprogramming of gene expression. In this work, six DERs that may be related to plant defense or morphogenesis were selected to construct the miRNA-target gene interaction network based on gene function annotation. Previous studies demonstrated that downregulation of squamosa promoter binding protein-like 8 (SPL8) could increase branch development by facilitating the formation of axillary buds [53] and regulate the GA signaling pathway and biosynthesis in stem elongation [54]. Gou et al. [53] indicated that GA signaling transduction was regulated by SPL8 from the upstream GA receptor (GID1) to the downstream responsive genes (GRASs). GID1 sensed and bound endogenous GA to induce the formation of GID1–GA–DELLA protein complex [53]. There was increasing evidence that the GA-GID1 complex caused rapid degradation of the DELLA protein [55] and DELLA as a nuclear transcription regulator could inhibit GA signaling and restrict plant growth [56]. In addition, it was also reported that SPL regulate cell proliferation in leaf primordial [57]. Leaf cell proliferation was positively controlled by functional transcriptional coactivators Ans and Grf-Interacting Factor 1 (GIF1) that affected the gene expression for leaf growth based on the interaction network [58,59]. In this study, pf-miR2646 was upregulated in the phytoplasma-infected seedlings, which might decrease the expression level of its target gene (SPL8). Thereby, we hypothesize the downregulation of SPL8 inhibit the GA signal which may result in the stem section shortening in infected P. fortunei. Meanwhile, regulation of leaf cell proliferation by SPL may be involved in the occurrence of witches’ broom.
Research has also shown that auxin responsive genes participated in biotic stresses to regulate the plant morphology. The involvement of ARFs in response to biotic stresses was also revealed in Arabidopsis thaliana [60], Gossypium [61] and Oryza sativa Linn [62]. In addition, Fan et al. [63] suggested that the concentration of Indole-3-acetic acid (IAA) in PaWB-infected plants was significantly lower than that in healthy plants, while the concentration of cytokine (CK) in PaWB-infected plants was significantly higher than that in healthy plants. Moreover, the upregulation of CK/IAA could lead to the appearance of witches’ broom symptoms. This is consistent with the results of that achieved in this study, i.e., ARFs (the target genes of pf-miR160h), are downregulated in the PFI library, implying that ARF TFs might play essential roles in response to PaWB-infection.

4.2. Regulation of Plant Defense Systems by DER-Target Genes Pairs

DERs modulate multiple biological processes not only in morphology, but also in the plant defense responsive to pathogen invasion. With the parallel evolution process of pathogen, the pattern of plant defense is constantly diversifying. Plants can establish a complete defense system to resist the invasion of pathogens by activating cascade response of protein kinases, strengthening the cell wall and building an salicylic acid (SA)-dependent immune response. As for strengthening the cell wall, the composition of the cell wall allows it to act as a major barrier to resist the invasion of pathogens [64]. Zhong et al. [65] elucidated that over-expression of MYB can induce the gene expression changes of phenylpropanoid biosynthesis, which modulate the biosynthesis of lignin, one of the components of the cell wall [66,67]. In Arabidopsis, the ectopic expression of MYB TFs AtPAP1 leads to increased gene expression of pheammonia-lyase, chalcone synthase and dihydroflavonol 4-reductase, which could increase the production of ligin and anthocyanin compounds [68]. Evidence indicated that SECONDARY WALL-ASSOCIATED NAC DOMAIN PROTEIN1 (SND1) and its homologues such as NAC SECONDARY WALL THICKENING PROMOTING FACTOR1 (Nst1), Nst2, VASCULAR RELATED NAC-DOMAIN 7(VND7) and VND6 were the main switches activating a group of MYB TFs (including MYB20, MYB46, MYB85, MYB103), which in turn aroused the secondary wall synthesis process [65,69,70]. In this study, pf-miR858a and pf-miR858b, whose target genes encoded MYB TFs (Arabidopsis MYB58 homolog), were downregulated, and the MYB genes displayed a higher expression level in PFI than that in PF plantlets. In consideration of the above-mentioned facts, we speculate that MYB and SND1 may work together on the synthesis of the cell wall to protect against pathogen invasion in P. fortunei.
As sessile organisms, plants have evolved unique cell surface receptors, which can sense chemical signals of intercellular communication to cope with various stresses. Receptor-Like Kinase (RLK) protein with a special structure (containing a signal sequence, an amino-terminal domain with a transmembrane region and a carboxyl-terminal kinase domain) is one of the dominant cell surface receptors that can receive signals of cell-to-cell communication. In Arabidopsis, leucine-rich repeat- receptor-like protein kinases (LRR)-RLKs containing an extracellular LRR and a Ser/Thr kinase domain were thought to be involved in plant defense processes via various signal cascade response [71,72]. Recently, it has been reported that LRR domains of RLK could interact with multiple proteins resulting in signal response transduction [73,74]. MLO proteins are leucine-rich peptides and play key roles in the signal recognition process of plant defense [73,74]. The binding of the endogenous plant elicitor peptides (PEPs) to their receptors (PEPRs) located on the plasma membrane resulted in an increase of cytosolic Ca2+, which was the early response of the signal cascade to activate the immune response [75,76]. It also had been reported that the Ca2+ increase played a critical role in MLO function [77]. Peterhansel et al. [78] suggested that the development of MLO-mediated resistance required the involvement of two genes, ROR1 and ROR2, while MLO-mediated defense response might involve one or more small GTP-binding proteins of the ROP family [79]. Therefore, Bhat’s [80] research team believed that MLO, ROR2 and other proteins might develop a new pathogen-triggered microdomain at the site of biotic stress. Hence, among the interaction network when plant encounter stresses, the protein kinase family with leucine-rich repeat domain may interact with MLO to activate the signal cascade transduction to respond to phytoplasma invasion. In this study, the MLO6 (target of pf-miR164b-5p) is upregulated in PFI, indicating that the plant could trigger a series of defense responses when infected with phytoplasmas.
Salicylic acid (SA) plays an important role in protecting pathogen infection [81]. As the key speed limiting enzyme in the biosynthesis of SA, Isochorismate synthase 1 (ICS1) was regulated by AtTCP8 [82]. TCP8 showed positive regulation on the expression of ICS1 when interacting with the WRKY family [82]. Moreover, in this interaction network, pf-miR2628 plays a key role in regulating the expression of WRKY4 (whose function was directly improved plant defense). In a word, during the process of PaWB-infection, pf-miR2628 and its targets may function as a key regulator to mediate the plant defense.
Taken together, our results revealed the significant roles of miRNA-target gene pairs in response to PaWB based on the interaction network, but further studies still need to be performed to explore their complex functions in Paulownia.

4.3. AS Events Related to PaWB Response in P. fortunei

AS is a vital regulatory mechanism at the post-transcriptional level in eukaryotes, which increases transcriptome complexity and protein diversity by splicing the same pre-mRNA [83]. Research showed that AS can adjust the function of important plant stress–response components [84,85]. In order to response to the invasion or attack from pathogens and pests, plant evolved defense mechanisms which involve multiple signal cascades and protein networks to provide specific and comprehensive defenses.
Serine/arginine-rich (SR) proteins belong to a conserved RNA-binding protein family, and play important roles in both constitutive splicing and AS. Recent studies have shown that alternative splicing of SR proteins play vital roles in stress response process [86,87,88]. Xu et al. [86] have proved that MOS14 functioned as the nuclear import receptor of SR proteins, which play vital roles in RNA metabolism. MOS14 mutation changed the splicing patterns of resistance (R) gene SNC1 and RPS4, and then damaged the plant resistance, which was mediated by these two genes. As mentioned above, SR proteins can act as splicing factors for AS [89], and they also play a vital role in the plant immunity response.
In this study, the genes encoding SR proteins (PAU016740.2, PAU000297.1, and PAU019143.1) contained five AS categories (TSS, XSKIP, SKIP, AE, and XAE) in the PFI library. Taken together, these results suggest that AS events may influence the defense mechanisms of plants in response to pathogen invasion. We speculate that PaWB-infected plants could induce lots of SR proteins through AS events in order to respond pathogen invasion. In general, our results elucidate the crucial roles of AS events in answering to PaWB and provided new ideas to further investigate the transcriptome complexity

5. Conclusions

In this study, we combined transcriptome and sRNA sequencing to conduct a comprehensive analysis focused on obtaining vital regulatory miRNA-target pairs associated with PaWB based on the P. fortunei genome. A total of 321 known and 172 novel miRNAs were obtained. Among them, 67 DERs were identified in response to PaWB. Relationships between interaction genes were constructed using the STRING database, and miRNA-target gene pairs and mRNAs related to PaWB were analyzed between the PF and PFI libraries. In addition, we constructed a network that showed how the genes that encoded proteins predicted to be involved in regulating gene expression such as TFs, SOD, and other pathogen-related proteins interacted in response to PaWB. Further research is needed to understand the specific functions of the miRNAs related to the invasion of phytoplasmas and how they influence the witches’ broom symptoms through metabolic pathways. Additionally, AS genes play crucial roles in defense responses in Paulownia. These results will provide a more in-depth insight to elucidate the relationship between phytoplasmas and host at the gene level. In the future, the interacting network between them will be further constructed using ChIP-seq and Dual RNA-seq technologies.

Supplementary Materials

The following are available online at https://www.mdpi.com/1999-4907/9/7/397/s1, Table S1: The results of DEGs of transcriptome sequencing, Table S2: The basic statistics of the miRNA sequencing, Table S3: The results of miRNA sequencing, Table S4: The family classification of miRNAs, Table S5: The DERs in PF and PFI libraries, Table S6: The number of target genes corresponding to miRNAs, Figure S1: Boxplot of log10 (FPKM) of genes, Figure S2: Gene Ontology functional classification of the DEGs, Figure S3: Gene Ontology enrichment of the DEGs, Figure S4: KEGG annotation for the DEGs.

Author Contributions

G.F. conceived, designed, and performed the experiments. Y.C., H.Z., Z.W., and H.L. provided suggestions on the experimental design and analyses. B.L. and X.Z. wrote the paper. All authors read the script, provided comments, and approved the final manuscript.

Funding

This work was supported by the Distinguished Talents Foundation of Henan Province of China (174200510001) and the Natural Science Foundation of Henan Province of China (162300410158). The funders had no role in study design, data collection and analysis, decision to publish, or preparation of the manuscript.

Acknowledgments

We thank Margaret Biswas, from Liwen Bianji, Edanz Group China (www.liwenbianji.cn/ac), for editing the English text of a draft of this manuscript.

Conflicts of Interest

The authors declare no conflict of interest.

References

  1. Li, B.; Zhao, Z.; Deng, M.; Cao, Y.; Dong, Y.; Fan, G. Effect of Salt Stress on Gene Expressions of Different Genotypes of Paulownia australis. J. Henan Agric. Univ. 2017, 4, 471–480. [Google Scholar]
  2. Jørgensen, I.; Vivekanandan, K. Private Forestry Based on Paulownia in Sri Lanka: An Appraisal of the Outgrower Scheme Presented by Paulownia Plantations LTD. Available online: http://www.diva-portal.org/smash/get/diva2:446489/FULLTEXT01.pdf (accessed on 3 July 2018).
  3. Ayan, S.; Sivacioglu, A.; Bilir, N. Growth variation of Paulownia Sieb. and Zucc. species and origins at the nursery stage in Kastamonu-Turkey. J. Environ. Biol. 2006, 27, 499–504. [Google Scholar] [PubMed]
  4. Ates, S.; Ni, Y.; Akgul, M.; Tozluoglu, A. Characterization and evaluation of Paulownia elongota as a raw material for paper production. Afr. J. Biotechnol. 2008, 7, 4153–4158. [Google Scholar]
  5. Hiruki, C.; Lemattre, M.; Lemattre, P.; Lemaire, F. Paulownia witches’-broom disease important in East Asia. Acta Hortic. 1999, 496, 63–68. [Google Scholar] [CrossRef]
  6. Shao, F.; Zhang, Q.; Liu, H.; Lu, S.; Qiu, D. Genome-wide identification and analysis of MicroRNAs involved in witches’-broom phytoplasma response in Ziziphus jujuba. PLoS ONE 2016, 11, e0166099. [Google Scholar] [CrossRef] [PubMed]
  7. Fan, G.; Xu, E.; Deng, M.; Zhao, Z.; Niu, S. Phenylpropanoid metabolism, hormone biosynthesis and signal transduction-related genes play crucial roles in the resistance of Paulownia fortunei to paulownia witches’ broom phytoplasma infection. Genes Genom. 2015, 37, 913–929. [Google Scholar] [CrossRef]
  8. Jin, Q.; Wang, D.; Zhiqiang, L.; Wei, J.; Wang, Y.; Su, X. Molecular identification of phytoplasma strain isolated from mulberry trees infected by mulberry mosaic leaf roll disease in Zhejiang province. Sci. Seric. 2017, 42, 196–201. [Google Scholar]
  9. Chung, W.; Chen, L.; Lo, W.; Lin, C.; Kuo, C. Comparative analysis of the peanut witches’-broom phytoplasma genome reveals horizontal transfer of potential mobile units and effectors. PLoS ONE 2013, 8, e62770. [Google Scholar] [CrossRef] [PubMed]
  10. Padovan, A.; Firrao, G.; Schneider, B.; Gibb, K. Chromosome mapping of the sweet potato little leaf phytoplasma reveals genome heterogeneity within the phytoplasmas. Microbiology 2000, 146, 893–902. [Google Scholar] [CrossRef] [PubMed] [Green Version]
  11. Doi, Y.; Teranaka, M.; Yora, K.; Asuyama, H. Mycoplasma- or PLT group-like microorganisms found in the phloem elements of plants infected with mulberry dwarf, potato witches’ broom, aster yellows, or paulownia witches’ broom. Jpn. J. Phytopathol. 1967, 33, 259–266. [Google Scholar] [CrossRef]
  12. Bertaccini, A.; Duduk, B.; Paltrinieri, S.; Contaldo, N. Phytoplasmas and phytoplasma diseases: A severe threat to agriculture. Am. J. Plant Sci. 2014, 5, 1763–1788. [Google Scholar] [CrossRef]
  13. Namba, S. Phytoplasmas: A century of pioneering research. J. Gen. Plant Pathol. 2011, 77, 345–349. [Google Scholar] [CrossRef]
  14. Ishiie, T.; Doi, Y.; Yora, K.; Asuyama, H. Suppressive effects of antibiotics of tetracycline group on symptom development of mulberry dwarf disease. Jpn. J. Phytopathol. 2009, 33, 267–275. [Google Scholar] [CrossRef]
  15. Oshima, K.; Kakizawa, S.; Nishigawa, H.; Jung, H.; Wei, W.; Suzuki, S.; Arashida, R.; Nakata, D.; Miyata, S.; Ugaki, M. Reductive evolution suggested from the complete genome sequence of a plant-pathogenic phytoplasma. Nat. Genet. 2004, 36, 27–29. [Google Scholar] [CrossRef] [PubMed]
  16. Oshima, K.; Maejima, K.; Namba, S. Genomic and evolutionary aspects of phytoplasmas. Front. Microbiol. 2013, 4, 230. [Google Scholar] [CrossRef] [PubMed]
  17. Sugio, A.; Maclean, A.; Kingdom, H.; Grieve, V.; Manimekalai, R.; Hogenhout, S. Diverse targets of phytoplasma effectors: From plant development to defense against insects. Annu. Rev. Phytopathol. 2011, 49, 175–195. [Google Scholar] [CrossRef] [PubMed]
  18. Maclean, A.; Sugio, A.; Makarova, O.; Findlay, K.; Grieve, V.; Tóth, R.; Nicolassen, M.; Hogenhout, S. Phytoplasma effector sap54 induces indeterminate leaf-like flower development in Arabidopsis plants. Plant Physiol. 2011, 157, 831–841. [Google Scholar] [CrossRef] [PubMed]
  19. Li, H.; Zhou, Y.; Zhang, Z. Network analysis reveals a common host–pathogen interaction pattern in Arabidopsis immune responses. Front. Plant Sci. 2017, 8, 893. [Google Scholar] [CrossRef] [PubMed]
  20. Niu, S.; Fan, G.; Deng, M.; Zhao, Z.; Xu, E.; Cao, L. Discovery of microRNAs and transcript targets related to witches’ broom disease in Paulownia fortunei by high-throughput sequencing and degradome approach. Mol. Genet. Genom. 2016, 291, 181–191. [Google Scholar] [CrossRef] [PubMed]
  21. Fan, G.; Niu, S.; Zhao, Z.; Deng, M.; Xu, E.; Wang, Y.; Yang, L. Identification of microRNAs and their targets in Paulownia fortunei plants free from phytoplasma pathogen after methyl methane sulfonate treatment. Biochimie 2016, 127, 271–280. [Google Scholar] [CrossRef] [PubMed]
  22. Cao, X.; Fan, G.; Dong, Y.; Zhao, Z.; Deng, M.; Wang, Z.; Liu, W. Proteome profiling of paulownia seedlings infected with Phytoplasma. Front. Plant Sci. 2017, 8, 342. [Google Scholar] [CrossRef] [PubMed]
  23. Mou, H.; Lu, J.; Zhu, S.; Lin, C.; Tian, G.; Xu, X.; Zhao, W. Transcriptomic analysis of Paulownia infected by paulownia witches’-broom Phytoplasma. PLoS ONE 2013, 8, e77217. [Google Scholar] [CrossRef] [PubMed]
  24. Cao, Y.; Zhai, X.; Deng, M.; Fan, G. Relationship between Metabolites Variation and Paulownia Witches’ Broom. Sci. Silvae Sin. 2017, 6, 85–93. [Google Scholar]
  25. Wang, M.; Wang, Q.; Zhang, B. Response of miRNAs and their targets to salt and drought stresses in cotton (Gossypium hirsutum L.). Gene 2013, 530, 26–32. [Google Scholar] [CrossRef] [PubMed]
  26. Bartel, D. MicroRNAs: Target recognition and regulatory functions. Cell 2009, 136, 215–233. [Google Scholar] [CrossRef] [PubMed]
  27. Chen, Z.; Bao, M.; Sun, Y.; Yang, Y.; Xu, X.; Wang, J.; Han, N.; Bian, H.; Zhu, M. Regulation of auxin response by miR393-targeted transport inhibitor response protein 1 is involved in normal development in Arabidopsis. Plant Mol. Biol. 2011, 77, 619–629. [Google Scholar] [CrossRef] [PubMed]
  28. Kim, V. Microrna biogenesis: Coordinated cropping and dicing. Nat. Rev. Mol. Cell Biol. 2005, 6, 376–385. [Google Scholar] [CrossRef] [PubMed]
  29. Sunkar, R.; Li, Y.; Jagadeeswaran, G. Functions of microRNAs in plant stress responses. Trends Plant Sci. 2012, 17, 196–203. [Google Scholar] [CrossRef] [PubMed]
  30. Navarro, L.; Dunoyer, P.; Jay, F.; Arnold, B.; Dharmasiri, N.; Estelle, M.; Voinnet, O.; Jones, J. A plant miRNA contributes to antibacterial resistance by repressing Auxin signaling. Science 2006, 312, 436–439. [Google Scholar] [CrossRef] [PubMed]
  31. Navarro, L.; Jay, F.; Nomura, K.; He, S.; Voinnet, O. Suppression of the microRNA pathway by bacterial effector proteins. Science 2008, 321, 964–967. [Google Scholar] [CrossRef] [PubMed]
  32. Kasschau, K.; Xie, Z.; Allen, E.; Llave, C.; Chapman, E.; Krizan, K.; Carrington, J. P1/HC-Pro, a Viral suppressor of RNA silencing, interferes with Arabidopsis development and miRNA function. Dev. Cell 2003, 4, 205–217. [Google Scholar] [CrossRef]
  33. Abdi, H.; Williams, L. Principal component analysis. Wiley Interdiscip. Rev. Comput. Stat. 2010, 2, 433–459. [Google Scholar] [CrossRef] [Green Version]
  34. Xu, E.; Fan, G.; Niu, S.; Zhao, Z.; Deng, M.; Dong, Y. Transcriptome sequencing and comparative analysis of diploid and autotetraploid Paulownia australis. Tree Genet. Genomes 2015, 11, 5. [Google Scholar] [CrossRef]
  35. Altschul, S.; Madden, T.; Schäffer, A.; Zhang, J.; Zhang, Z.; Miller, W.; Lipman, D. Gapped blast and psi-blast: A new generation of protein database search programs. Nucleic Acids Res. 1997, 25, 3389–3402. [Google Scholar] [CrossRef] [PubMed]
  36. Audic, S.; Claverie, J. The significance of digital gene expression profiles. Genome Res. 1997, 7, 986–995. [Google Scholar] [CrossRef] [PubMed]
  37. Benjamini, Y.; Yekutieli, D. The control of the false discovery rate in multiple testing under dependency. Ann. Stat. 2001, 29, 1165–1188. [Google Scholar]
  38. Liu, H.; Zhao, Z.; Wang, L.; Deng, M.; Zhai, X.; Dong, Y.; Fan, G. Genome-wide expression analysis of transcripts, microRNAs, and the degradome in Paulownia tomentosa under drought stress. Tree Genet. Genomes 2017, 13, 128. [Google Scholar] [CrossRef]
  39. Hofacker, I.; Fontana, W.; Stadler, P.; Bonhoeffer, L.; Tacker, M.; Schuster, P. Fast folding and comparison of RNA secondary structures. Monatshefte Chem. 1994, 125, 167–188. [Google Scholar]
  40. Meyers, M.; Chen, P.; Lin, Y.; Seki, Y. Biological materials: Structure and mechanical properties. Prog. Mater. Sci. 2008, 53, 1–206. [Google Scholar] [CrossRef] [Green Version]
  41. Han, X.; Yin, H.; Song, X.; Zhang, Y.; Liu, M.; Sang, J.; Jiang, J.; Li, J.; Zhuo, R. Integration of small RNAs, degradome and transcriptome sequencing in hyperaccumulator Sedum alfredii uncovers a complex regulatory network and provides insights into cadmium phytoremediation. Plant Biotechnol. J. 2016, 14, 1470–1483. [Google Scholar] [CrossRef] [PubMed]
  42. Szklarczyk, D.; Franceschini, A.; Wyder, S.; Forslund, K.; Heller, D.; Huertacepas, J.; Simonovic, M.; Roth, A.; Santos, A.; Tsafou, K. String v10: Protein–protein interaction networks, integrated over the tree of life. Nucleic Acids Res. 2015, 43, D447–452. [Google Scholar] [CrossRef] [PubMed]
  43. Shannon, P.; Markiel, A.; Ozier, O.; Baliga, N.; Wang, J.; Ramage, D.; Amin, N.; Schwikowski, B.; Ideker, T. Cytoscape: A software environment for integrated models of biomolecular interaction networks. Genome Res. 2003, 13, 2498–2504. [Google Scholar] [CrossRef] [PubMed]
  44. Wang, B.; Brendel, V. Genomewide comparative analysis of alternative splicing in plants. Proc. Natl. Acad. Sci. USA 2006, 103, 7175–7180. [Google Scholar] [CrossRef] [PubMed] [Green Version]
  45. Duque, P. A role for SR proteins in plant stress responses. Plant Signal. Behav. 2011, 6, 49–54. [Google Scholar] [CrossRef] [PubMed] [Green Version]
  46. Fahlgren, N.; Howell, M.; Kasschau, K.; Chapman, E.; Sullivan, C.; Cumbie, J.; Givan, S.; Law, T.; Grant, S.; Dangl, J. High-throughput sequencing of Arabidopsis microRNAs: Evidence for frequent birth and death of miRNA genes. PLoS ONE 2007, 2, e219. [Google Scholar] [CrossRef] [PubMed]
  47. Wei, M.; Wei, H.; Wu, M.; Song, M.; Zhang, J.; Yu, J.; Fan, S.; Yu, S. Comparative expression profiling of miRNA during anther development in genetic male sterile and wild type cotton. BMC Plant Biol. 2013, 13, 66. [Google Scholar] [CrossRef] [PubMed]
  48. Ponting, C.; Oliver, P.; Reik, W. Evolution and functions of long noncoding RNAs. Cell 2009, 136, 629–641. [Google Scholar] [CrossRef] [PubMed]
  49. Yang, Y.; Wen, L.; Zhu, H. Unveiling the hidden function of long non-coding RNA by identifying its major partner-protein. Cell Biosci. 2015, 5, 59. [Google Scholar] [CrossRef] [PubMed]
  50. Tuskan, G.; Difazio, S.; Jansson, S.; Bohlmann, J.; Grigoriev, I.; Hellsten, U.; Putnam, N.; Ralph, S.; Rombauts, S.; Salamov, A. The genome of black cottonwood, Populus trichocarpa (Torr. & Gray). Science 2006, 313, 1596–1604. [Google Scholar] [PubMed]
  51. Fan, G.; Cao, X.; Niu, S.; Deng, M.; Zhao, Z.; Dong, Y. Transcriptome, microRNA, and degradome analyses of the gene expression of Paulownia with phytoplamsa. BMC Genom. 2015, 16, 896. [Google Scholar] [CrossRef] [PubMed]
  52. Cao, X.; Zhai, X.; Zhang, Y.; Cheng, Z.; Li, X.; Fan, G. Comparative Analysis of MicroRNA Expression in Three Paulownia Species with Phytoplasma Infection. Forests 2018, 6, 302. [Google Scholar] [CrossRef]
  53. Gou, J.; Debnath, S.; Sun, L.; Flanagan, A.; Tang, Y.; Jiang, Q.; Wen, J.; Wang, Z. From model to crop: Functional characterization of SPL8 in M. truncatula led to genetic improvement of biomass yield and abiotic stress tolerance in alfalfa. Plant Biotechnol. J. 2017, 16, 951–962. [Google Scholar] [CrossRef] [PubMed]
  54. Unte, U.; Sorensen, A.; Pesaresi, P.; Gandikota, M.; Leister, D.; Saedler, H.; Huijser, P. SPL8, an SBP-box gene that affects pollen Sac development in Arabidopsis. Plant Cell 2003, 15, 1009–1019. [Google Scholar] [CrossRef] [PubMed]
  55. Sun, T. Gibberellin-GID1-DELLA: A pivotal regulatory module for plant growth and development. Plant Physiol. 2010, 154, 567–570. [Google Scholar] [CrossRef] [PubMed]
  56. Peng, J.; Carol, P.; Richards, D.; King, K.; Cowling, R.; Murphy, G.; Harberd, N. The Arabidopsis GAI gene defines a signaling pathway that negatively regulates gibberellin responses. Genes Dev. 1997, 11, 3194–3205. [Google Scholar] [CrossRef] [PubMed]
  57. Usami, T.; Horiguchi, G.; Yano, S.; Tsukaya, H. The more and smaller cells mutants of Arabidopsis thaliana identify novel roles for SQUAMOSA PROMOTER BINDING PROTEIN-LIKE genes in the control of heteroblasty. Development 2009, 136, 955–964. [Google Scholar] [CrossRef] [PubMed]
  58. Liu, D.; Song, Y.; Chen, Z.; Yu, D. Ectopic expression of miR396 suppresses GRF target gene expression and alters leaf growth in Arabidopsis. Physiol. Plant. 2009, 136, 223–236. [Google Scholar] [CrossRef] [PubMed]
  59. Horiguchi, G.; Nakayama, H.; Ishikawa, N.; Kubo, M.; Demura, T.; Fukuda, H.; Tsukaya, H. ANGUSTIFOLIA3 plays roles in adaxial/abaxial patterning and growth in leaf morphogenesis. Plant Cell Physiol. 2011, 52, 112–124. [Google Scholar] [CrossRef] [PubMed]
  60. Llorente, F.; Musksktt, P.; Sanchez-Vallet, P.; Lopez, G.; Ramos, B.; Sánchez-Rodríguez, C.; Jordá, L.; Parker, J.; Molina, A. Repression of the auxin response pathway increases Arabidopsis susceptibility to necrotrophic fungi. Mol. Plant 2008, 1, 496–509. [Google Scholar] [CrossRef] [PubMed]
  61. Dowd, C.; Wilson, I.; Mcfadden, H. Gene expression profile changes in cotton root and hypocotyl tissues in response to infection with Fusarium oxysporum f. sp. Vasinfectum. Mol. Plant-Microbe Interact. 2004, 17, 654–667. [Google Scholar] [CrossRef] [PubMed]
  62. Challa, G.; Mukesh, J. Role of auxin-responsive genes in biotic stress responses. Plant Signal. Behav. 2009, 4, 846–848. [Google Scholar] [Green Version]
  63. Fan, G.; Dong, Y.; Deng, M.; Zhao, Z.; Niu, S.; Xu, E. Plant-pathogen interaction, circadian rhythm, and hormone-related gene expression provide indicators of phytoplasma infection in Paulownia fortunei. Int. J. Mol. Sci. 2014, 15, 23141–23162. [Google Scholar] [CrossRef] [PubMed]
  64. Smirnova, O.; Kochetov, A. Plant cell wall and mechanisms of resistance to pathogens. Russ. J. Genet. Appl. Res. 2016, 6, 622–631. [Google Scholar] [CrossRef]
  65. Zhong, R.; Demura, T.; Ye, Z. SND1, a NAC domain transcription factor, is a key regulator of secondary wall synthesis in fibers of Arabidopsis. Plant Cell 2006, 18, 3158–3170. [Google Scholar] [CrossRef] [PubMed]
  66. Deluc, L.; Barrieu, F.; Marchive, C.; Lauvergeat, V.; Decendit, A.; Richard, T.; Carde, J.P.; Mérillon, J.; Hamdi, S. Characterization of a grapevine R2R3-MYB transcription factor that regulates the phenylpropanoid pathway. Plant Physiol. 2006, 140, 499–511. [Google Scholar] [CrossRef] [PubMed]
  67. Mondal, S.; Roy, S. Genome-wide sequential, evolutionary, organizational and expression analyses of phenylpropanoid biosynthesis associated MYB domain transcription factors in Arabidopsis. J. Biomol. Struct. Dyn. 2018, 36, 1577–1601. [Google Scholar] [CrossRef] [PubMed]
  68. Borevitz, J.; X, Y.; Blount, J.; Dixon, R.; Lamb, C. Activation tagging identifies a conserved MYB regulator of phenylpropanoid biosynthesis. Plant Cell 2000, 12, 2383–2394. [Google Scholar] [CrossRef] [PubMed]
  69. Zhong, R.; Richardson, E.; Ye, Z. Two NAC domain transcription factors, SND1 and NST1, function redundantly in regulation of secondary wall synthesis in fibers of Arabidopsis. Planta 2007, 225, 1603–1611. [Google Scholar] [CrossRef] [PubMed]
  70. Zhong, R.; Lee, C.; Zhou, J.; Mccarthy, R.; Ye, Z. A battery of transcription factors involved in the regulation of secondary cell wall biosynthesis in Arabidopsis. Plant Cell 2008, 20, 2763–2782. [Google Scholar] [CrossRef] [PubMed]
  71. Jia, L.; Tax, F. Receptor-like kinases: Key regulators of plant development and defense. J. Integr. Plant Biol. 2013, 55, 1184–1187. [Google Scholar]
  72. Shiu, S.; Bleecker, A. Plant receptor-like kinase gene family: Diversity, function, and signaling. Sci. STKE 2001, re22. [Google Scholar] [CrossRef] [PubMed]
  73. Singh, V.; Singh, A.; Chand, R.; Singh, B. Genome wide analysis of disease resistance mlo gene family in sorghum [Sorghum Bicolor (l.) Moench]. Int. J. Plant Genom. 2012, 2, 18–27. [Google Scholar]
  74. Kemmerling, B.; Schwedt, A.; Rodriguez, P.; Mazzotta, S.; Frank, M.; Qamar, S.; Mengiste, T.; Betsuyaku, S.; Parker, J.; Müssig, C.; et al. The bri1-associated kinase 1, bak1, has a brassinolide-independent role in plant cell-death control. Curr. Biol. 2007, 17, 1116–1122. [Google Scholar] [CrossRef] [PubMed]
  75. Yamaguchi, Y.; Huffaker, A. Endogenous peptide elicitors in higher plants. Curr. Opin. Plant Biol. 2011, 14, 351–357. [Google Scholar] [CrossRef] [PubMed]
  76. Ma, Y.; Zhao, Y.; Walker, R.; Berkowitz, G. Molecular steps in the immune signaling pathway evoked by plant elicitor peptides: Ca2+-dependent protein kinases, nitric oxide, and reactive oxygen species are downstream from the early Ca2+ signal. Plant Physiol. 2013, 163, 1459–1471. [Google Scholar] [CrossRef] [PubMed]
  77. Kim, M.; Lee, S.; Kim, J.; Chun, H.; Choi, M.; Chung, W.; Moon, B.; Kang, C.; Park, C.; Yoo, J.; et al. Mlo, a modulator of plant defense and cell death, is a novel calmodulin-binding protein. Isolation and characterization of a rice mlo homologue. J. Biol. Chem. 2002, 277, 19304–19314. [Google Scholar] [CrossRef] [PubMed]
  78. Peterhänsel, C.; Schulze-Lefert, P. Interaction analyses of genes required for resistance responses to powdery mildew in barley reveal distinct pathways leading to leaf cell death. Plant Cell 1997, 9, 1397–1409. [Google Scholar] [CrossRef] [PubMed]
  79. Schultheiss, H.; Dechert, C.; Kogel, K.; Hückelhoven, R. A small GTP-binding host protein is required for entry of powdery mildew fungus into epidermal cells of barley. Plant Physiol. 2002, 128, 1447–1454. [Google Scholar] [CrossRef] [PubMed]
  80. Bhat, R.; Miklis, M.; Schmelzer, E.; SchulzeLefert, P.; Panstruga, R. Recruitment and interaction dynamics of plant penetration resistance components in a plasma membrane microdomain. Proc. Natl. Acad. Sci. USA 2005, 102, 3135–3140. [Google Scholar] [CrossRef] [PubMed] [Green Version]
  81. Durner, J.; Shah, J.; Klessig, D. Salicylic acid and disease resistance in plants. Crit. Rev. Plant Sci. 1999, 18, 547–575. [Google Scholar] [CrossRef]
  82. Wang, X.; Gao, J.; Zhu, Z.; Dong, X.; Wang, X.; Ren, G.; Zhou, X.; Kuai, B. TCP transcription factors are critical for the coordinated regulation of ISOCHORISMATE SYNTHASE 1 expression in Arabidopsis thaliana. Plant J. Cell Mol. Biol. 2015, 82, 151–162. [Google Scholar] [CrossRef] [PubMed]
  83. Simpson, C.; Lewandowska, D.; Fuller, J.; Maronova, M.; Kalyna, M.; Davidson, D.; McNicol, J.; Raczynska, D.; Jarmolowski, A.; Barta, A.; et al. Alternative splicing in plants. Biochem. Soc. Trans. 2008, 36, 508–510. [Google Scholar] [CrossRef] [PubMed]
  84. Laloum, T.; Martín, G.; Duque, P. Alternative splicing control of abiotic stress responses. Trends Plant Sci. 2018, 23, 140–150. [Google Scholar] [CrossRef] [PubMed]
  85. Whitham, S.; Dineshkumar, S.; Choi, D.; Hehl, R.; Corr, C.; Baker, B. The product of the tobacco mosaic virus resistance gene N: Similarity to toll and the interleukin-1 receptor. Cell 1994, 78, 1101–1115. [Google Scholar] [CrossRef]
  86. Xu, S.; Zhang, Z.; Jing, B.; Gannon, P.; Ding, J.; Xu, F.; Li, X.; Zhang, Y. Transportin-SR is required for proper splicing of Resistance genes and plant immunity. PLoS Genet. 2011, 7, e1002159. [Google Scholar] [CrossRef] [PubMed]
  87. Kumar, K.; Kirti, P. Novel role for a serine/arginine-rich splicing factor, AdRSZ21 in plant defense and HR-like cell death. Plant Mol. Biol. 2012, 80, 461–476. [Google Scholar] [CrossRef] [PubMed]
  88. Olsen, J. Stress-Induced Alternative Splicing of Serine/Arginine-Rich Proteins in the Moss Physcomitrella Patens. Available online: http://www.diva-portal.org/smash/get/diva2:446489/FULLTEXT01.pdf (accessed on 3 July 2018).
  89. Lopato, S.; Gattoni, R.; Fabini, G.; Stevenin, J.; Barta, A. A novel family of plant splicing factors with a Zn knuckle motif: Examination of RNA binding and splicing activities. Plant Mol. Biol. 1999, 39, 761–773. [Google Scholar] [CrossRef] [PubMed]
Figure 1. The PCA results of three biological replicates. (A) Represents three biological replicates of mRNA, while (B) represents miRNA.
Forests 09 00397 g001
Figure 2. Transcription factors (TF ) families’ distribution of differentially expressed genes (DEGs).
Forests 09 00397 g002
Figure 3. Length distribution of small RNA reads.
Forests 09 00397 g003
Figure 4. The heatmap of differentially expressed miRNAs (DERs).
Forests 09 00397 g004
Figure 5. Gene Ontology functional classification of identified target genes.
Forests 09 00397 g005
Figure 6. (A) Gene Ontology (GO) enrichment of the target genes; (B) Kyoto Encyclopedia of Genes and Genomes (KEGG) annotation for the target genes.
Forests 09 00397 g006
Figure 7. The interaction network of DERs and genes. Red diamonds represents DERs in PaWB-infected plants; the yellow circle represents the DEGs; the pink circle represents the gene that interacts with the target gene; the blue circle represents the downstream gene of the target gene; the green octagon represents the synergistic action with other genes; and the blue rectangle represents a specific function or tissue organ in plants. The thickness of gray lines between genes indicates the strength of the interaction; and as the black dotted and solid lines represent the indirect and direct effects, respectively. The arrows represent the positive regulation; and horizontal lines represent negative regulation.
Forests 09 00397 g007
Figure 8. Quantificational real-time polymerase-PCR analysis of eight DER-target pairs and 11 DEGs in Paulownia fortunei. (A) miRNA and target genes; (B) DEGs.
Forests 09 00397 g008
Table 1. Primers of quantitative PCR analysis.
Gene IDForward Primer (5′-3′)Reverse Primers (5′-3′)
pf-miR160hTGCCTGGCTCCCTGTATGCCT
pf-miR164b-5pTGGAGAAGCAGGGCACGTGC
pf-miR858bTTCGTTGTCTGTTCGACCTTG
pf-miR167hTAAAGCTGCCAGCGTGATCTA
pf-miR156pGCTCTCTATTCTTCTGTCATC
pf-miR5048AAAACCAAAAAAGTAATGA
pf-miR169a-3pTGGCTACAATTTGCTCTCTTC
pf-miR172eTGAATCTTGATGATGCTGCATAA
PAU000742.1ATGGCTGGTGGAATTAGTAAATCTGGATGCTGTGGTA
PAU003364.1CTTCAGCCATCTCCAATCCAGTAATTCCACAAGCAATC
PAU027187.1CCATCAAGAACAAGAAACCTTATTATTAGCCTCCTCTGC
PAU012184.1AGGAAGACAGGTGATGATCAGACTGGTTATGAATAGCA
PAU025602.1TATCCTCAAGCAGTCGTTACACTATACCTCAATCCATTCC
PAU012247.1CTTGATTCCACCAATGCTATACCAGAACTCCATACACAT
PAU01444.1TGACAACTAATGAGACTGGAAGAAGATAGGCTGAGAAG
PAU014627.1GGCACAGAGCATAACATTTTCCAGAGATTCCAACTTC
PAU029039.1TAGCAAGTCTGACTCCAAGCAGTAAACAAGAGCAAAG
PAU012221.1GACAAGCGATTAGGCATTACAGTTCCTCTATCCTTCTT
PAU018369.1GTATATCAACAGGAGCACATCCTCAGCATTAGCAACTAT
PAU023427.1GCTGTGTTAATTCAGTCAAGCTTCGGTCAAGAACTTCA
PAU001344.1CTTGATGAGGCAGATAGAATGCACCTTGAGGAGGCATAT
PAU012606.1GGAGGAGGCATTCTTAACCGGACCAGGAATAATAATCT
PAU028073.1TGATGCCTATGAGACTTGAGGACTTGGATACACTCT
PAU002956.1GGTGGCTTGAAGTAGATGGCTGAAGTCTGAAGAACA
PAU015980.1ATGTGGAGAGGAGGAATGTGGTCACTGTTGATAGCA
PAU007073.2CATCACCATCCGTATTGTGGCTTCACTCTATCCTTC
PAU022499.1AGTGTAGAGTGTGCTTGTCCTTTGTGGAATGTGTGCTT
Table 2. Detailed information on sequencing transcriptome library in healthy P. fortunei (PF) and PaWB-infected P. fortunei (PFI).
SampleTotal Raw ReadsTotal Valid ReadsQ20 (%)GC Content (%)
PF_1136,371,054119,367,22499.8646.00
PF_2133,864,544123,717,27899.5345.50
PF_3125,474,542113,284,08899.6745.00
PFI_1130,262,456124,472,80299.8147.00
PFI_2155,719,594147,092,87899.6145.00
PFI_3137,646,316131,027,11099.6345.50
Table 3. Mapped to the genome.
SampleValid ReadsMapped Reads (%)Unique Mapped Reads (%)Multi Mapped Reads (%)
PF_184,989,60647,528,895 (55.92)34,900,121 (41.06)12,628,774 (14.86)
PF_283,415,50445,070,813 (54.03)36,987,732 (44.34)8,083,081 (9.69)
PF_376,364,32241,534,953 (54.39)33,118,690 (43.37)8,416,263 (11.02)
PFI_156,829,42625,302,842 (44.52)17,283,734 (30.41)8,019,108 (14.11)
PFI_256,829,42642,396,529 (44.43)35,484,885 (37.19)6,911,644 (7.24)
PFI_388,618,88039,074,874 (44.09)30,740,288 (34.69)8,334,586 (9.40)
Table 4. Statistic of alternative splicing categories from mRNA data.
AS_CategoryPF_1 (% *)PF_2 (%)PF_3 (%)PFI_1 (%)PFI_2 (%)PFI_3 (%)
AE5879 (9.51)5929 (9.23)5795 (9.07)5168 (9.07)6071 (9.49)5939 (9.36)
IR4660 (7.54)4742 (7.38)4688 (7.34)4286 (7.52)4800 (7.50)4790 (7.55)
MIR950 (1.54)959 (1.49)950 (1.49)901 (1.58)952 (1.49)955 (1.51)
MSKIP1009 (1.63)989 (1.54)1004 (1.57)805 (1.41)1004 (1.57)1016 (1.60)
SKIP4346 (7.03)4310 (6.71)4330 (6.78)3572 (6.27)4406 (6.89)4364 (6.88)
TSS19,838 (32.10)20,936 (32.58)20,911 (32.73)18,832 (33.05)20,607 (32.21)20,417 (32.19)
TTS18,309 (29.63)19,434 (30.24)19,451 (30.45)17,621 (30.93)19,141 (29.92)18,979 (29.92)
XAE1625 (2.63)1649 (2.57)1623 (2.54)1372 (2.41)1670 (2.61)1640 (2.59)
XIR2090 (3.38)2139 (3.33)2091 (3.27)1850 (3.25)2133 (3.33)2146 (3.38)
XMIR408 (0.66)409 (0.64)412 (0.64)373 (0.65)422 (0.66)416 (0.66)
XMSKIP474 (0.77)460 (0.72)479 (0.75)376 (0.66)457 (0.71)478 (0.75)
XSKIP2207 (3.57)2313 (3.60)2153 (3.37)1819 (3.19)2310 (3.61)2296 (3.62)
* The ratio of this alternative splicing event to all alternative splicing events in the sample.

