Temporal Variations in Soil Profile Carbon and Nitrogen during Three Consecutive Years of 15N Deposition in Temperate Oak and Pine Forest Stands


Department of Agricultural Biotechnology and Research Institute of Agriculture and Life Sciences, Seoul National University, 1 Gwanak-ro, Gwanak-gu, Seoul 08826, Korea
*
Author to whom correspondence should be addressed.
Forests 2018, 9(6), 338; https://doi.org/10.3390/f9060338
Submission received: 3 May 2018
/
Revised: 6 June 2018
/
Accepted: 7 June 2018
/
Published: 8 June 2018
(This article belongs to the Section Forest Ecology and Management)
Abstract
:Experiments using 15N–labeled urea were conducted for three years to assess the effect of N-deposition on soil C and N dynamics under oak (Qa) and pine (Pk) forest stands in natural field conditions. Throughout the experiment, an increase in total C, mineral N, and total N due to N deposition was greater in coniferous forest soils than in deciduous forest soils, while decreasing the pH of both soils as a result of nitrification. Natural 13C abundance of soil samples was interpreted to reveal the physical mixing of new C substrates from leaf-litter with old C substrates. The δ13C of the upper soil layers became more negative, with greater decreases in the Pk soil. However, with time, the lowering of δ13C was better maintained in the Pk soil than in the Qa soil, indicating greater incorporation of new C substrates from leaf-litter decomposition into old SOC pools in the Pk soil compared to the Qa soil. We revealed that an increase in total C and N contents due to N deposition was greater under coniferous forest stands than under deciduous forest stands as a result of greater mixing of new C substrates into the soil profile in this temperate forest.
1. Introduction
The current global concentrations of greenhouse gases in the atmosphere have reached their highest levels in at least the last 800,000 years [1], and nitrogen (N) deposition from the atmosphere to forest soils has accordingly increased relative to pre–industrial levels and is predicted to exceed 10 to 60 kg N ha−1 year−1 by 2050 [2]. However, in forests, high N fertilizer application or large atmospheric N deposition is required to ensure high forest productivity. For example, mature temperate forest stands require an annual N fertilization of about 500 kg N ha−1 year−1 to meet the high demand of about 100 kg N ha−1 year−1 for mature forests [3], which is similar to agricultural N use [4,5,6]. Even though most forest ecosystems are N limited, such high amounts of N inputs may become available in the N processes in mature forests, affecting the productivity of forest ecosystems [7,8]. Nitrogen availability is a critical constraint that determines the size and composition of soil organic carbon (SOC) pools in terrestrial ecosystems [7]. This is because N deposited into the soil surface increases the formation and degradation of soil organic matter (SOM), thereby resulting in an increased residence time of carbon (C) in the soil [8]. In forest ecosystems, an increase in N deposition has had a positive effect on net primary production (NPP), nutrient supply, and SOM decomposition [9,10]. However, several recent investigations have raised concerns regarding such unfavorable phenomena as soil acidification, biodiversity loss, unexpected modification of biogeochemical cycles, and retardation of biodegradation of persistent organic pollutants potentially resulting from increased N deposition [10,11].
Nitrogen deposited in the soil surface tends to move downward through the soil profile, affecting aboveground and belowground biogeochemical processes that regulate the decomposition of tree litter and SOC pools [12]. However, despite the long history of N input to the soil, the response of soil C dynamics to external N deposition remains poorly understood [9,10]. Therefore, understanding the interactive effects of N deposition in the soil and tree species on SOC decomposition dynamics along the soil profile is essential for determining the residence time and size of an ecosystem’s soil organic C pools [13,14].
In forest ecosystems, since the biochemical composition of leaf and root litter varies with the type (deciduous and coniferous) of tree species, the composition of tree communities predominantly determines the size and quality of SOC pools, and their decomposition characteristics are further changed by increased N availability due to N deposition at the forest floor [14]. Previous studies have reported that the functional activities of soil microorganisms are related to tree species composition and soil properties [15], where the tree species affect the microbial community composition, thereby resulting in changes in the soil N mineralization rate, labile C availability, and the C/N ratio [16]. Even though many soil studies have been conducted by comparing different tree species, most of them have focused solely on the aboveground portion of the soil, particularly on soil microbial activity and litter decomposition. Therefore, differences in soil C dynamics due to the type of tree species have not yet been clearly determined. In general, the degree of stabilization of SOC depends on the biochemical composition of organic matter in the soil, and increases with soil depth [12,13,14,15,16,17]. Since the quality and decomposition of SOM are affected by the type of tree species and environmental conditions, these two major factors will in turn affect the soil C stocks in the forest. Consequently, in order to clarify these differences, it is necessary to investigate the changes in SOM decomposition with soil depth. However, since soil organic matter decomposes over a long time period, it is not sufficient to fully evaluate its variation within a short time frame, so long-term studies are needed.
Natural 13C abundance is a useful tool for assessing organic matter turnover in the soil, which is used in many studies as an index to interpret the effects of various factors on the plant and soil environment [17,18]. Particularly, natural abundances of the stable C isotopes (13C/12C, expressed as δ13C) of leaves are about −26‰ for C3 plants, as a result of the C isotope discrimination during photosynthesis [18]. Therefore, natural abundances of the stable C isotopes of plant litters can vary depending on the isotopic C discrimination determined by photosynthetic pathways and environmental conditions, such as nutrient availability, vegetation type, temperature, moisture availability, and salinity [17,18]. On the other hand, natural 15N abundances in soils are commonly higher than those in atmospheric N2 and may increase with depth in the soil profile during the decomposition of plant materials [19]. Therefore, stable C and N isotopes in soils can serve as a traceable proxy for the study of SOM dynamics. In addition, the 15N-isotope dilution technique has been used frequently to identify the fate and retention of N in terrestrial ecosystems. Particularly, it is used to trace the material balance and circulation through soil N cycles because it can identify the influence of various factors affected by chemical and biological processes [17,18,19,20]. Therefore, to our knowledge, the natural abundance of stable C and N isotopes has the potential to provide important information for interpreting changes in the decomposition of the soil organic C pools.
It is a commonly-held belief that an increase in soil C pools due to N deposition is greater in deciduous forest soils than in coniferous forest soils. However, we noticed that the litter from deciduous leaves contains more decomposable components than that of coniferous leaves [7,8,9,10,11], thus leading to greater C loss due to faster litter decomposition [9,12,15]. Therefore, we hypothesized that N deposition on the soil surface of two different forest (deciduous trees and coniferous trees) floors would result in different distribution patterns of the SOC pools in these forest soil systems. We tested this hypothesis with soil profile samples taken from two different forest floors in Mt. Taewha, Korea. To this end, we conducted a three-year field experiment by applying 15N–labeled urea once a year in a natural forest. During the experimental period, we measured the time-course patterns of total C and N content, natural abundances of C isotopes along the soil profile.
2. Materials and Methods
2.1. Experimental Sites and Soil Description
The experimental sites were located in a relatively mild hilly area (200 m above sea level), in a mixed coniferous–broadleaf forest that forms part of the Seoul National University Forest in Mt. Taewha, Geonggi–do, (37°18′ N, 127°17′ E), Korea. The annual mean air temperature and precipitation here are 11 °C and 1389 mm, respectively. Since a mix of deciduous oak (Quercus acutissima Carruth., Qa) and coniferous pine (Pinus koraiensis Siebold & Zucc., Pk) tree species were predominant in the canopy of this forest, one stand each for these two tree species of a similar forest stand age (about 35–40 years old) were chosen for comparison. This forest did not receive any NPK fertilization for 35–40 years following its establishment. Surface soils (0–20 cm) were collected from each of the Qa soil and Pk soil areas using a soil auger, and the samples were then composited, air-dried at room temperature, passed through a 2-mm sieve, and mixed homogeneously for physicochemical analyses. Soils under both experimental stands were classified as Dystrudepts (Great Group) and were texturally loam (USDA classification scheme): 443 g kg−1 sand, 323 g kg−1 silt, and 235 g kg−1 clay for the Qa soil; and 517 g kg−1 sand, 294 g kg−1 silt, and 189 g kg−1 for the Pk soil. Some relevant soil chemical properties under each forest stand are shown in Table 1.
2.2. Natural Field 15N Experiments
Field experiments using 15N–labeled urea were conducted for three consecutive years to assess the cumulative effect of N deposition on the soil C and N dynamics for the oak (Qa) and pine (Pk) forest stands under natural field conditions. Three locations (15 m × 15 m each) spaced 20 m apart from each other were randomly chosen as replicates for each forest stand, and seven stainless steel soil retrieval profile cores (7.6 cm and 50.0 cm deep) per location were vertically installed in June (summer) 2011 after the removal of tree leaf-litter from the surface. One soil profile core per location was taken and dissected into six sections (0–5, 5–10, 10–20, 20–30, 30–40, and 40–50 cm), and the soils in each section were analyzed for the initial characterization of chemical properties of the soil profile. In each experiment location, half of the remaining profile cores were treated individually with 0.28 g urea (=1.48 g N) (15N–urea at 300 kg N ha−1 year−1, 5 atom % excess) on the surface of each profile, while the other half was left untreated (control). Subsequently, 5 ml of distilled water was carefully applied to the surfaces to prevent the loss of 15N-urea. In June (summer) 2012, two profile cores per location were taken from each of the N–treated and control groups for soil chemical analyses (the first year sampling), and the same amount of 15N-urea was applied to the soil surface of the remaining two profile cores assigned to the N–treatment groups. The same procedures were repeated in June 2013–2014 to take soil samples for the second and third year soil chemical analyses.
2.3. Sampling and Chemical Analyses
Soil samples were collected from the 0–5, 5–10, 10–20, 20–30, 30–40, and 40–50 cm layers of each soil profile core. Soil bulk density was determined by gravimetry using intact cores [21]. Each soil sample was air-dried at room temperature, passed through a 2-mm sieve, mixed homogeneously, and analyzed for soil pH, mineral N (NH4+–N + NO3−–N), total C, δ13C, total N, and 15N atom %. The soil pH was measured potentiometrically in a 1:5 (w/v) soil-to-water suspension using a pH meter (Orion 3 Star, Thermo Scientific, Waltham, MA, USA). Approximately 15 g of fresh soil (8 g on an oven-dry basis) was extracted with 60-mL of 2 M KCl, and the extract was filtered through a Whatman No. 42 filter paper followed by a 0.45-µm nylon membrane. The filtrate was analyzed for NH4+–N and NO3−–N by steam distillation. A 30-mL aliquot of each filtrate was added to a distillation flask and steam-distilled with MgO for NH4+–N determination; thereafter, the sample in a flask was steam-distilled again after the addition of Devarda’s alloy for NO3−–N determination [22]. During each distillation, the liberated NH3 was collected in a 0.005 M H2SO4 solution, and then titrated with a 0.01 M NaOH solution using an automatic titrator (702 SM Titrino, Metrohm, Herisau, Switzerland) for the determination of each mineral N concentration. The total mineral N was calculated as the sum of NH4+–N and NO3−–N concentrations. The dried soil samples were ground into very fine powder using a ball mill (MM400, Retsch, Haan, Germany) to determine total C (TC) and N (TN), and δ13C, δ15N, and 15N atom %. The values of TC, TN, δ13C, δ15N, and 15N atom % were analyzed with a continuous-flow stable isotope ratio mass spectrometer linked to a CN elemental analyzer (IRMS, IsoPirme–EA, Micromass, Stockport, UK).
2.4. Calculation and Statistical Analysis
Natural abundances (δ) of the stable isotopes (δ13C and δ15N) were calculated as:
where Rsample is either the 13C/12C or 15N/14N ratio for the samples and Rstandard is the ratio for a standard [Pee Dee Belemnite for C and atmospheric N2 (=0.0036765 for N).
δ13C or δ15N (‰) = [(Rsample/Rstandard) − 1] × 1000
In 15N-isotope dilution, the 15N recovery (%) in each soil receiving 15N inputs can be obtained using the following equations [23].
where NDFI is the N derived from 15N-labeled inputs, Nf is the amount of N input, T is the total amount of N in the N-treated soil, AS is the atom % excess 15N in the soil sample, and AF is the atom % excess 15N in the N inputs treated.
15N Recovery (%) = NDFI/Nf
NDFI = T × (AS/AF)
All statistical analyses were performed with General Linear Model (GLM) procedures in SAS software (SAS Institute, Version 9.3, Cary, NC, USA). The effects of four factors (tree species, N treatment, time, and soil depth) and their interactions on soil pH, NH4+–N, NO3−–N, TN, NDFI, TC, and δ13C were evaluated. A four–way analysis of variance (ANOVA) for a completely randomized design with three replications per treatment was performed to test for significant differences among the treatment means within each factor and for interactions among factors. Tukey’s least significant difference (LSD) test at the level of p < 0.05 was used to test for significant differences among means. The calculated p-values for the three main factors and the interaction are shown in Table 2.
3. Results
3.1. Initial Chemical Properties of Two Different Forest Floor Soils
The chemical properties of Qa and Pk soils are shown in Figure 1. Mineral N contents and pH were higher in the Pk soil than in the Qa soil at soil depth 0–20 cm, but inverse results were identified at soil depth 20–50 cm (p < 0.05) (Figure 1a,b). Mineral N contents decreased with soil depth from 11.6 mg kg−1 (0–5 cm) to 1.5 mg kg−1 (40–50 cm) for the Qa soil, and from 16.7 mg kg−1 to 7.8 mg kg−1 for the Pk soil (p < 0.01). The total C and N contents were higher in the Qa soil than in the Pk soil throughout the soil profile, and decreased with increasing soil depth for both soils (p < 0.001). Differences in the average total C and N contents of the upper layer of the soil (0–20 cm) between the Qa and Pk soils were 16.8 g kg−1 and 1.32 g kg−1, while those of the lower layer (30–50 cm) were 3.81 g kg−1 and 0.27 g kg−1, respectively. (Figure 1c,d). The δ13C of total C was less negative in the Pk soil than in the Qa soil throughout the soil profile, and increased to a depth of 20–30 cm in both soils (p < 0.001) (Figure 1c,d). On the other hand, the δ15N of total N increased from near 0‰ (surface layer) to near +7‰ at a depth of 20–30 cm beyond (p < 0.05) (Figure 1c,d).
3.2. Soil pH and Mineral N Contents
Soil pH decreased during the experimental year and soil depth regardless of tree species, and the decrease was greater in the Pk soil than in the Qa soil (p < 0.05) (Figure 2). In the first-year of the experiment, soil pH at 0–20 cm decreased sharply by 0.29 in the Qa soil and 0.41 in the Pk soil, which were lower than that of control soil throughout the experiment (p < 0.001). At the end, compared with the control soil, the pH of N-treated soils decreased by 0.3 and 0.3 in the upper layers of the Qa and Pk soils, and by 0.3 and 0.6 in the lower layers (30–50 cm) of the Qa and Pk soils, respectively. Prior to N treatment, mineral N (NH4+–N and NO3−–N) contents were higher in the Pk soil than in the Qa soil, and this pattern was maintained throughout the experiment (Figure 3). However, the levels of NH4+–N at a soil depth of 0–5 cm in N-treated soils were not different during the first two years, but increased during the third year (p < 0.05) (Figure 3A-a,B-a), while those of NO3−–N increased in the Qa soil and decreased in the Pk soil throughout the experiment (p < 0.05) (Figure 3A-b,B-b).
3.3. Soil Total N Content, NDFI, and 15N Recovery
Regardless of tree species, total N content in N-treated soils increased with time, while that in the control soils remained virtually unchanged (p < 0.05) (Figure 4). The increasing effect due to N application was evident in the surface soil layer (0–5 cm), but not in the layer below (p > 0.05). The distribution patterns of the NDFI were uniform throughout the soil profile and similar in both N-treated soils during the first year, and the NDFI increased with time, particularly in the surface soil layer (p < 0.01) (Figure 5). The increase in the NDFI in this layer was greater in the Pk soil than in the Qa soil. The percent 15N recovery of soils was calculated based on the NDFI values (data not shown). At the end of experiment, the total recovery of 15N from both N-treated soils calculated through the mass N-balance approach was 61.4 ± 4.8% for the Qa soil and 77.2 ± 10.6% for the Pk soil, with an average of approximately 30.7% of N unrecovered portion.
3.4. Soil Total C Content and δ13C
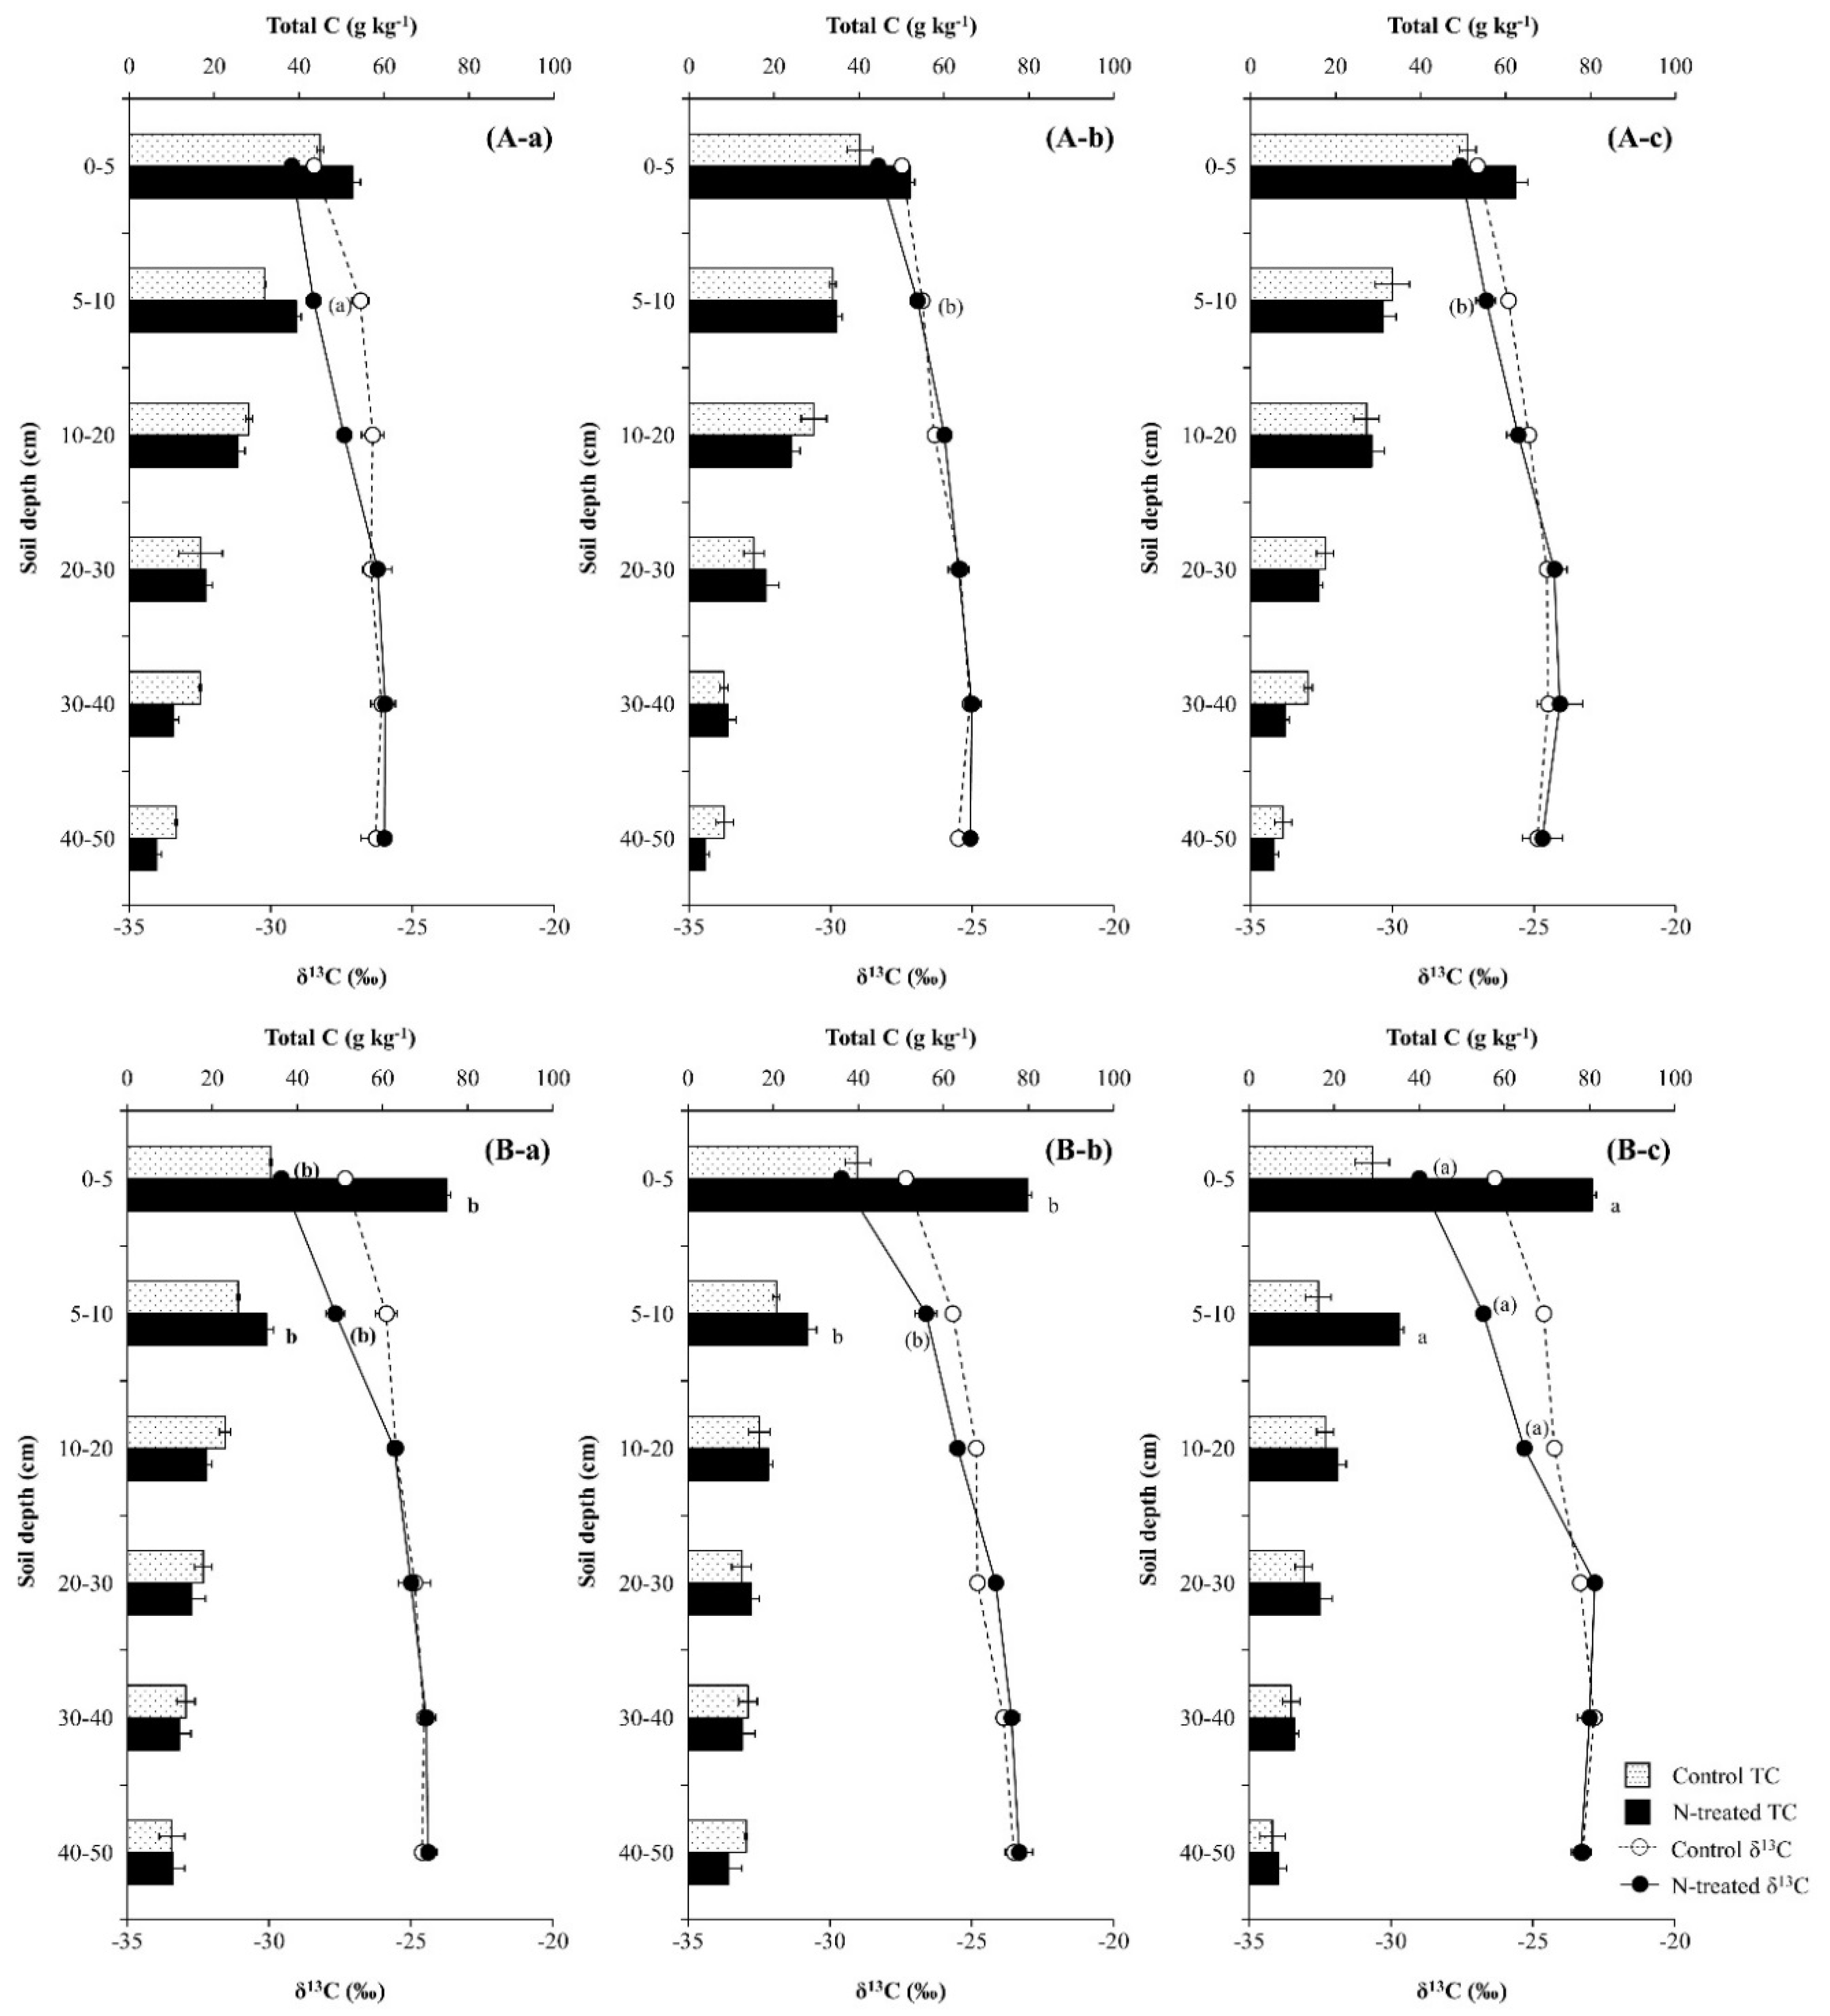
Compared with the control soils, the application of N increased total C content and decreased δ13C values in the upper soil layer (0–10 cm) during the first year, and the effect was greater in the Pk soil than in the Qa soil (p < 0.05) (Figure 6). However, as time progressed, total C content at a soil depth of 5–10 cm increased in the Pk soil, while the increasing effect disappeared in the Qa soil (Figure 6A-a–c). During the same period, the decrease in δ13C values in the upper soil layer due to N application disappeared in the Qa soil, while δ13C values of total C in the deeper layer (10–20 cm) were suppressed more negatively, resulting in an increase in total C content in the soil layer behind the advancing δ13C values front (p < 0.05) (Figure 6B-a–c).
4. Discussion
4.1. Differences in Initial Chemical Properties of Two Different Forest Soils
Since deciduous trees have higher nutrient levels and lower levels of lignin and polyphenols than coniferous trees, leaf-litter of the former decomposes faster than that of the latter [24,25,26,27], resulting in different soil chemical properties under these two contrasting forest stands (Figure 1). In our study, mineral N contents of the Pk soil were higher than those of the Qa soil (Figure 1a), and this difference can be explained by the differences in the N uptake patterns between tree species [28,29]. In general, the amount of N uptake by coniferous trees is almost 56% of that absorbed by deciduous trees [25,26,27]. However, higher soil total C and N contents in the Qa soil than in the Pk soil (Figure 1b,c) were due to lower levels of lignin and polyphenols of leaf-litter of Qa tree species [23,24,25,26] and its faster decomposition in the Qa soil [19,30,31]. In particular, soil δ13C and δ15N values were higher in the lower layers than in the upper layers, and this difference in the isotopic C and N compositions of soil total C and total N pools between two soil zones could be explained by the mixing of fresh substrates having more negative δ13C and lower δ15N into the preexisting old SOC pools that had been enriched in 13C and 15N in the profiles for both soils [19,30,31,32].
Nevertheless, we could deduce that both δ13C of soil total C and δ15N of total N along the soil profile reflect isotopic fractionation associated with litterfall decomposition and physical mixing processes. Since forest soils are characterized by litterfall and root exudates that are gradually mixed and decomposed down the soil profile [33], more decomposed SOM can exist lower in the soil profile as a result of decomposition and physical mixing, while newer C and N inputs tend to exist shallower in the soil profile [34]. It is well known that microbial enzymes discriminate against 13C and 15N during SOM decomposition, resulting in the significant enrichment of 13C and 15N in SOM pools [19,30,31,32,33,34,35]. Therefore, the experimental site well reflected the history of long-term enrichment of 13C and 15N in SOM pools and the current mixing of new SOM substrates into the soil profile (Figure 1b,c).
4.2. Effect of N Treatment on Soil pH and Mineral N
With time, compared with the control soils, the pH in both N-treated soils decreased throughout the soil profile, with greater decreases in the Pk soil than in the Qa soil (Figure 2). In general, it is known that the decrease in soil pH in forest stands correlates well with the production of H+ during nitrification [36,37]; however, NO3−–N contents were maintained at higher levels in the Qa soil than in the Pk soil (Figure 3A-b,B-b), unlike the previous investigations in which the rates of nitrification in coniferous tree stands were faster than in deciduous tree stands [38]. However, greater decreases in pH in the Pk soil than in the Qa soil could not be explained by nitrification alone. In addition to nitrification, the production of H+ from leaf-litter decomposition may also affect soil acidification, since coniferous litter produces more organic acids than deciduous litter [39].
Most previous studies have shown that greater and more frequent NO3− leaching occurred in soils under coniferous tree stands than under deciduous tree stands [36,37] and the leaching of nitrate down the soil profile occurred more rapidly when the C/N ratio of an SOM pool was below a threshold of 25 [28]. Particularly, even at the same C/N ratio, leaching of nitrate was greater in soils under coniferous tree stands than under deciduous tree stands [28,38,39,40]. In our experimental sites, intense rainfall occurs from July to August during the summer season (approximately 50% or more of the mean annual precipitation), and rainfall exceeds evapotranspiration.
Our results of annual distribution patterns of NO3− (Figure 3A-b,B-b) were consistent with the above-mentioned results of previous studies of NO3− leaching through the soil profile, and this pattern of NO3− transported by leaching was well corroborated by the NDFI profiles (Figure 4) in which N treated on the soil surface of the forest floor was transported down to the bottom of the profile column during the first year. However, during the following two years, a greater portion of N was recovered in the upper surface layer in both soils, indicating the incorporation of urea-N into the formation of SOM and/or microbial mass.
4.3. Effect of N Treatment on Soil Total N Contents
The application of N increased total N content in the topmost soil layer (0–5 cm) (Figure 4) due to enhanced decomposition of leaf-litter containing about 5% N [7,8], and the increasing effect was greater in the Pk soils than in the Qa soils due to greater decomposition [39,40]. A greater increase in total N observed in the topmost soil layer was well corroborated by the recovery and partitioning of applied-N in the soil profile (Figure 5). In particular, a greater soil total N in the Pk soil than in the Qa soil indicated faster decomposition of the Pk leaves on the forest floor, as evidenced by a greater increase in total C and a concurrent decrease in soil-δ13C (Figure 6).
At the end of the study, total amounts of urea-N recovered and the corresponding recovery in the system were 353.1 ± 3.8 mg and 61.4 ± 4.8% for the Qa soil and 455.8 ± 2.9 mg and 77.2 ± 10.6% for the Pk soil (data not shown), indicating a considerable N loss from the system. The unrecovered loss of 15N could be ascribed to N leaching, denitrification, and/or NH3 volatilization [23]. However, NH3 volatilization or denitrification would have contributed much less to 15N loss than N leaching based on the amounts of NDFI throughout the profile (Figure 5), since the soil pH remained acidic (below 5) and the soil remained mostly aerobic (data not shown). In addition, dissimilatory nitrate reduction to ammonia (DNRA) could result in decreasing NO3− concentrations [41], but we could disregard the contribution of DNRA to N loss, since denitrification is negligible and NH4+ concentrations remained virtually at low levels in both soils (Figure 3). Therefore, we deduced that NO3− leaching denitrification was mostly responsible for the unrecovered portion of 15N (N loss) in both N-treated forest systems [23,37,38].
4.4. Effect of N Treatment on Soil Total C Contents and δ13C Values
It is well known that N treatment to the forest floor increases the soil microbial activity and the soluble- and insoluble organic C pools in the forest soils [2], and the magnitude of the increase in the soil microbial activity and SOC pools varies with the litter composition of the plant species [41]. We also observed that N treatment to the surface of the forest soils obviously increased soil total C contents at 0–10 cm soil depth in both forest soils (p < 0.001) (Figure 6) due to stimulated decomposition of leaf-litter and SOC pools, and this phenomenon was corroborated by a greater increase in total N content in this surface soil layer (p < 0.01) (Figure 4). In particular, the portion of N recovered in the surface layer of the soil was greater under coniferous tree (Pk) stands than under deciduous tree (Qa) stands (Figure 5), and this phenomenon could explain the greater increase in total C contents in the Pk soil due to greater litter decomposition (Figure 6). Unlike most previous observations which showed that an increase in soil total C content was greater under deciduous tree stands than under coniferous tree stands as a result of faster decomposition of SOM pools in the former forest soils than in the latter forest soils [42,43], we observed that N treatment caused a faster tree litter decomposition in the Pk soil than in the Qa soil, resulting in a greater increase in total C content in the Pk soil than in the Qa soil. Finn et al. [44] reported that the amounts of soil C and N pools that remained in coniferous forest floors after decomposition at a constant temperature were larger than those in deciduous forest floors. In particular, even under similar environmental conditions (climate region, temperature, rainfall, and soil moisture), it is well-known that soil CO2 efflux is highest from deciduous forests, followed by mixed forests, and lowest from coniferous forests [44,45,46], as a result of the higher lignin content of their leaf-litter [47,48] and lower SOM degradation [46]. Compared with the control soils, N deposition obviously increased soil total C contents (p < 0.001) (Figure 6), and this increase in SOC pools was well supported by the increase in 15N recovery (Figure 5) and the concurrent decrease in soil-δ13C to 0–10 cm soil depth in both forest soils (Figure 6).
It is believed that δ13C reflects the decomposition and physical mixing of leaf-litter (new substrate) and SOC (old substrate) pools in forest soils [18,30,36]. We obviously showed that compared with their respective control soils, δ13C of total C in the surface soil layer (0–10 cm) decreased due to N deposition, while total C content increased, indicating the mixing and transport of new C substrates into old C substrates down the profile (p < 0.001) (Figure 6). During the same time period, the decrease in δ13C of total C was maintained in the upper surface layer under the Pk stands (Figure 6), and this could reveal the sustained incorporation of leaf-litter and release of newer C substrates from decomposition, resulting in a greater increase in total C content. In particular, the increase in total C content and the concurrent decrease in its δ13C became greater with time in the Pk soil compared to the Qa soil (Figure 6), and the annual increase in total C content was well corroborated by the increase in 15N recovery in this soil layer (Figure 5).
However, soil total C contents were not different between both N-treated soils and the control soils below a soil depth of 10 cm, and this pattern indicated that new C substrates from litter decomposition did not penetrate into the soil profile below this soil depth (10 cm) over the three years, since NO3− ions migrate much faster than organic C particles through the soil profile [49]. The increasing patterns of δ13C from the surface to this soil depth obviously reflected the physical mixing of new C substrates with old C substrates while migrating down the profile (Figure 6), even though the decomposition of SOC pools leaves behind the heavier 13C substrates in the soil. Since forest soils are characterized by litterfall and SOM pools that are gradually mixed and degraded down the soil profile, more recalcitrant substrates (such as lignin, fat, and wax) are in deeper soil layers [2,47]. It is a common notion that N treatment causes an increase in SOC contents through increased soil microbial activity [35,38,49]. However, our results invariably indicated that the decomposition of old SOC pools is very limited in deeper soil layers where the chemical and biological activities are limited.
5. Conclusions
We challenged a commonly-held belief that an increase in soil C pools due to N deposition is greater in deciduous forest soils than in coniferous forest soils. We hypothesized that N deposition at the surface of the forest floor would stimulate the decomposition of litter and SOC pools and affect the mixing of new C substrates released from decomposition into preexisting old SOC pools down the profile, thus causing a difference in the response to N deposition between two oak and pine forest soils. We interpreted the causal relations for the differences in SOC dynamics in a temperate natural oak and pine forest by analyzing natural 13C abundances (δ13C) and by using the 15N-isotope dilution technique. Compared with their respective control soils, the lowering of δ13C with increasing total C contents in the surface soil layers (0–20 cm) for both forest soils after N application well reflected the relative contribution of the production of fresh C substrates from litter decomposition and the subsequent physical mixing into old SOC pools down the soil profile. In addition, we found that the incorporation of new C substrates into old SOC pools was greater under coniferous pine tree stands than under deciduous oak tree stands, at least in this temperate region. Particularly, an increasing pattern of δ13C of the soil to a depth of 20 cm indicated the deeper penetration of new C substrates into the soil profile as a result of 13C isotope mixing with old C pools, and this phenomenon was well evidenced by an increase in 15N recovery in this upper region with time. However, we could not fully explain how differences in nutrient composition of leaf-litter between two contrasting tree species affect litter decomposition and the formation of SOC pools, since no direct measurements were made on the kinetics of litter decomposition and microbial activity in both forest floor soils. Despite this lack of direct information supporting the contribution of leaf-litter decomposition to the increase in SOC pools, we revealed that an increase in total C and N contents due to N deposition was greater under coniferous forest stands than under deciduous forest stands as a result of greater mixing of new C substrates into the soil profile in this temperate forest. Therefore, the kinetics of litter decomposition of leaf-litter types, soil microbial activity, separation of the mixing of new substrates from the decomposition of old C substrates, and the formation and stabilization of SOC pools should be considered in advance.
Author Contributions
H.-M.R. conceived and designed the entire study, and obtained funding. J.-S.P. conducted soil analyses and statistical evaluation. H.-M.R. and J.-S.P. interpreted and discussed the data, participated in the writing and editing of the manuscript, discussed the results, and approved the final manuscript.
Acknowledgments
This research was funded by the Brain Korea 21 Plus Program from the Ministry of Education of Korea.
Conflicts of Interest
The authors declare no conflicts of interest.
References
- Pachauri, R.K.; Allen, M.R.; Barros, V.R.; Broome, J.; Cramer, W.; Christ, R.; Church, J.A.; Clarke, L.; Dahe, Q.; Dasgupta, P.; et al. Climate Change 2014: Synthesis Report. Contribution of Working Groups I, II and III to the Fifth Assessment Report of the Intergovernmental Panel on Climate Change; IPCC: Geneva, Switzerland, 2014; pp. 1–151. [Google Scholar]
- Tietema, A.; Wessel, W.W. Gross nitrogen transformations in the organic layer of acid forest ecosystems subjected to increased atmospheric nitrogen input. Soil Biol. Biochem. 1992, 24, 943–950. [Google Scholar] [CrossRef]
- Rennenberg, H.; Dannenmann, M. Nitrogen nutrition of trees in temperate forests—The significance of nitrogen availability in the pedosphere and atmosphere. Forests 2015, 6, 2820–2835. [Google Scholar] [CrossRef]
- Christ, M.; Zhang, Y.; Likens, G.E.; Driscoll, C.T. Nitrogen retention capacity of a northern hardwood forest soil under ammonium sulfate additions. Ecol. Appl. 1995, 5, 802–812. [Google Scholar] [CrossRef]
- Zhu, J.; He, N.; Zhang, J.; Wang, Q.; Zhao, N.; Jia, Y.; Ge, J.; Yu, G. Estimation of carbon sequestration in China’s forests induced by atmospheric wet nitrogen deposition using the principles of ecological stoichiometry. Environ. Res. Lett. 2017, 12, 114038. [Google Scholar] [CrossRef] [Green Version]
- Schlesinger, W.H. On the fate of anthropogenic nitrogen. Proc. Natl. Acad. Sci. USA 2009, 106, 203–208. [Google Scholar] [CrossRef] [PubMed]
- Nowinski, N.S.; Trumbore, S.E.; Schuur, E.A.; Mack, M.C.; Shaver, G.R. Nutrient addition prompts rapid destabilization of organic matter in an arctic tundra ecosystem. Ecosystems 2008, 11, 16–25. [Google Scholar] [CrossRef]
- Fog, K. The effect of added nitrogen on the rate of decomposition of organic matter. Biol. Rev. 1988, 63, 433–462. [Google Scholar] [CrossRef]
- Kim, H.; Kang, H. The impacts of excessive nitrogen additions on enzyme activities and nutrient leaching in two contrasting forest soils. J. Microbiol. 2011, 49, 369–375. [Google Scholar] [CrossRef] [PubMed]
- De Vries, W.; Du, E.; Butterbach-Bahl, K. Short and long-term impacts of nitrogen deposition on carbon sequestration by forest ecosystems. Curr. Opin. Environ. Sustain. 2014, 9, 90–104. [Google Scholar] [CrossRef]
- Van Diepen, L.T.; Frey, S.D.; Sthultz, C.M.; Morrison, E.W.; Minocha, R.; Pringle, A. Changes in litter quality caused by simulated nitrogen deposition reinforce the N-induced suppression of litter decay. Ecosphere 2015, 6, 1–16. [Google Scholar] [CrossRef]
- Cotrufo, M.F.; Wallenstein, M.D.; Boot, C.M.; Denef, K.; Paul, E. The Microbial Efficiency-Matrix Stabilization (MEMS) framework integrates plant litter decomposition with soil organic matter stabilization: Do labile plant inputs form stable soil organic matter? Glob. Chang. Biol. 2013, 19, 988–995. [Google Scholar] [CrossRef] [PubMed]
- Bradford, M.A.; Fierer, N.; Reynolds, J.F. Soil carbon stocks in experimental mesocosms are dependent on the rate of labile carbon, nitrogen and phosphorus inputs to soils. Funct. Ecol. 2008, 22, 964–974. [Google Scholar] [CrossRef] [Green Version]
- Hobbie, S.E. Plant species effects on nutrient cycling: Revisiting litter feedbacks. Trends Ecol. Evol. 2015, 30, 357–363. [Google Scholar] [CrossRef] [PubMed]
- Gartzia-Bengoetxea, N.; Kandeler, E.; de Arano, I.M.; Arias-González, A. Soil microbial functional activity is governed by a combination of tree species composition and soil properties in temperate forests. Appl. Soil Ecol. 2016, 100, 57–64. [Google Scholar] [CrossRef]
- Huang, Z.; Wan, X.; He, Z.; Yu, Z.; Wang, M.; Hu, Z.; Yang, Y. Soil microbial biomass, community composition and soil nitrogen cycling in relation to tree species in subtropical China. Soil Biol. Biochem. 2013, 62, 68–75. [Google Scholar] [CrossRef]
- Gregory, A.S.; Dungait, J.A.J.; Watts, C.W.; Bol, R.; Dixon, E.R.; White, R.P.; Whitmore, A.P. Long-term management changes topsoil and subsoil organic carbon and nitrogen dynamics in a temperate agricultural system. Eur. J. Soil Sci. 2016, 67, 421–430. [Google Scholar] [CrossRef] [PubMed] [Green Version]
- Farquhar, G.D.; Ehleringer, J.R.; Hubick, K.T. Carbon isotope discrimination and photosynthesis. Annu. Rev. Plant Biol. 1989, 40, 503–537. [Google Scholar] [CrossRef]
- Turner, G.L.; Bergersen, F.J.; Tantala, H. Natural enrichment of 15N during decomposition of plant material in soil. Soil Biol. Biochem. 1983, 15, 495–497. [Google Scholar] [CrossRef]
- Perakis, S.S.; Compton, J.E.; Hedin, L.O. Nitrogen retention across a gradient of 15N additions to an unpolluted temperate forest soil in Chile. Ecology 2005, 86, 96–105. [Google Scholar] [CrossRef]
- Blake, G.R.; Hartge, K.H. Bulk density. In Methods of Soil Analysis; Arnold, K., Page, A.L., Eds.; Science Society of America Inc.: Madison, WI, USA, 1986; pp. 363–375. [Google Scholar]
- Mulvaney, R.L. Nitrogen-Inorganic Forms. In Methods of Soil Analysis; Loeppert, R.H., Soltanpour, P.N., Tabatabai, M.A., Johnston, C.T., Sumner, M.E., Eds.; Soil Science Society of America Inc.: Madison, WI, USA, 1996; pp. 1123–1184. [Google Scholar]
- Ro, H.M.; Kim, P.G.; Park, J.S.; Yun, S.I.; Han, J.H. Nitrogen removal through N cycling from sediments in a constructed coastal marsh as assessed by 15N-isotope dilution. Mar. Pollut. Bull. 2018, 129, 275–283. [Google Scholar] [CrossRef] [PubMed]
- Chiti, T.; Díaz-Pinés, E.; Rubio, A. Soil organic carbon stocks of conifers, broadleaf and evergreen broadleaf forests of Spain. Biol. Fertil. Soils 2012, 48, 817–826. [Google Scholar] [CrossRef]
- Prescott, C.E.; Zabek, L.M.; Staley, C.L.; Kabzems, R. Decomposition of broadleaf and needle litter in forests of British Columbia: Influences of litter type, forest type, and litter mixtures. Can. J. For. Res. 2000, 30, 1742–1750. [Google Scholar] [CrossRef]
- Zhang, P.; Tian, X.; He, X.; Song, F.; Ren, L.; Jiang, P. Effect of litter quality on its decomposition in broadleaf and coniferous forest. Eur. J. Soil Biol. 2008, 44, 392–399. [Google Scholar] [CrossRef]
- Gurmesa, G.A.; Schmidt, I.K.; Gundersen, P.; Vesterdal, L. Soil carbon accumulation and nitrogen retention traits of four tree species grown in common gardens. For. Ecol. Manag. 2013, 309, 47–57. [Google Scholar] [CrossRef]
- Kristensen, H.L.; Gundersen, P.; Callesen, I.; Reinds, G.J. Throughfall nitrogen deposition has different impacts on soil solution nitrate concentration in European coniferous and deciduous forests. Ecosystems 2014, 7, 180–192. [Google Scholar] [CrossRef]
- Xing, S.; Chen, C.; Zhou, B.; Zhang, H.; Nang, Z.; Xu, Z. Soil soluble organic nitrogen and active microbial characteristics under adjacent coniferous and broadleaf plantation forests. J. Soils Sediment. 2010, 10, 748–757. [Google Scholar] [CrossRef]
- Boström, B.; Comstedt, D.; Ekblad, A. Isotope fractionation and 13C enrichment in soil profiles during the decomposition of soil organic matter. Oecologia 2007, 153, 89–98. [Google Scholar] [CrossRef] [PubMed]
- Fernandez, I.; Mahieu, N.; Cadisch, G. Carbon isotopic fractionation during decomposition of plant materials of different quality. Glob. Biogeochem. Cycles 2003, 17, 1–11. [Google Scholar] [CrossRef]
- Kao, W.Y.; Tsai, H.C.; Shin, C.N.; Tsai, T.T.; Handley, L.L. Nutrient contents d13C and d15N during leaf senescence in the mangrove, Kandelia candel (L.) Druce. Bot. Bull. Acad. Sin. 2002, 43, 277–282. [Google Scholar]
- Acton, P.; Fox, J.; Campbell, E.; Rowe, H.; Wilkinson, M. Carbon isotope for estimating soil decomposition and physical mixing in well-drained forest soils. J. Geophys. Res. Biogeosci. 2013, 118, 1532–1545. [Google Scholar] [CrossRef]
- Wang, C.; Lu, X.; Mori, T.; Mao, Q.; Zhou, K.; Zhou, G.; Nie, Y.; Mo, J. Responses of soil microbial community to continuous experimental nitrogen additions for 13 years in a nitrogen-rich tropical forest. Soil Biol. Biochem. 2018, 121, 103–112. [Google Scholar] [CrossRef]
- Nadelhoffer, K.J.; Fry, B. Controls on natural Nitrogen 15 and Carbon 13 abundances in forest soil organic matter. Soil Sci. Soc. Am. J. 1988, 52, 1633–1640. [Google Scholar] [CrossRef]
- Davidson, E.A.; Hart, S.C.; Firestone, M.K. Internal cycling of nitrate in soils of a mature coniferous forest. Ecology 1992, 73, 1148–1156. [Google Scholar] [CrossRef]
- Luo, X.; Yan, Q.; Wang, C.; Luo, C.; Zhou, N.; Jian, C. Treatment of ammonia nitrogen wastewater in low concentration by two-stage ozonization. Int. J. Envion. Res. Pubilc Health 2015, 12, 11975–11987. [Google Scholar] [CrossRef] [PubMed]
- Staelens, J.; Rütting, T.; Huygens, D.; De Schrijver, A.; Müller, C.; Verheyen, K.; Boeckx, P. In situ gross nitrogen transformations differ between temperate deciduous and coniferous forest soils. Biogeochemistry 2012, 108, 259–277. [Google Scholar] [CrossRef]
- Augusto, L.; Ranger, J.; Binkley, D.; Rothe, A. Impact of several common tree species of European temperate forests on soil fertility. Ann. For. Sci. 2002, 59, 233–253. [Google Scholar] [CrossRef] [Green Version]
- Dawud, S.M.; Raulund-Rasmussen, K.; Domisch, T.; Finér, L.; Jaroszewicz, B.; Vesterdal, L. Is tree species diversity or species identity the more important driver of soil carbon stocks, C/N ratio, and pH? Ecosystems 2016, 19, 645–660. [Google Scholar] [CrossRef]
- Gundersen, P.; Callesen, I.; de Vries, W. Nitrate leaching in forest ecosystems is related to forest floor CN ratios. Environ. Pollut. 1998, 102, 403–407. [Google Scholar] [CrossRef]
- Booth, M.S.; Stark, J.M.; Rastetter, E. Controls on nitrogen cycling in terrestrial ecosystems: A synthetic analysis of literature data. Ecol. Monogr. 2005, 75, 139–157. [Google Scholar] [CrossRef]
- Tonitto, C.; Goodale, C.L.; Weiss, M.S.; Frey, S.D.; Ollinger, S.V. The effect of nitrogen addition on soil organic matter dynamics: A model analysis of the Harvard Forest Chronic Nitrogen Amendment Study and soil carbon response to anthropogenic N deposition. Biogeochemistry 2014, 117, 431–454. [Google Scholar] [CrossRef]
- Finn, D.; Page, K.; Catton, K.; Strounina, E.; Kienzle, M.; Robertson, F.; Armstrong, R.; Dalal, R. Effect of added nitrogen on plant litter decomposition depends on initial soil carbon and nitrogen stoichiometry. Soil Biol. Biochem. 2015, 91, 160–168. [Google Scholar] [CrossRef]
- Lettens, S.; Orshoven, J.O.S.; Wesemael, B.A.S.; Muys, B.; Perrin, D. Soil organic carbon changes in landscape units of Belgium between 1960 and 2000 with reference to 1990. Glob. Chang. Biol. 2005, 11, 2128–2140. [Google Scholar] [CrossRef]
- Kim, D.G.; Mu, S.; Kang, S.; Lee, D. Factors controlling soil CO2 effluxes and the effects of rewetting on effluxes in adjacent deciduous, coniferous, and mixed forests in Korea. Soil Biol. Biochem. 2010, 42, 576–585. [Google Scholar] [CrossRef]
- Laganière, J.; Pare, D.; Bradley, R.L. How does a tree species influence litter decomposition? Separating the relative contribution of litter quality, litter mixing, and forest floor conditions. Can. J. For. Res. 2010, 40, 465–475. [Google Scholar] [CrossRef]
- Qualls, R.G. Long–Term (13 Years) Decomposition rates of forest floor organic matter on paired coniferous and deciduous watersheds with contrasting temperature regimes. Forests 2016, 7, 231. [Google Scholar] [CrossRef]
- Edmoned, R.L. Organic matter decomposition in western United States forests. USDA For. Ser. Gen. Tech. Rep. 1991, 280, 116–128. [Google Scholar]
Figure 1.
Some characteristic chemical properties of two different oak and pine forest floor soils prior to N treatment: (a) mineral N, (b) pH, (c) total C and its δ13C, and (d) total N and its δ15N. Error bars indicate ± one standard deviation (n = 3).
Figure 1.
Some characteristic chemical properties of two different oak and pine forest floor soils prior to N treatment: (a) mineral N, (b) pH, (c) total C and its δ13C, and (d) total N and its δ15N. Error bars indicate ± one standard deviation (n = 3).


Figure 2.
Annual variations in pH profiles after N deposition into two different (A) oak (Qa) and (B) pine (Pk) forest floor soils. Error bars indicate ± one standard deviation (n = 3).
Figure 2.
Annual variations in pH profiles after N deposition into two different (A) oak (Qa) and (B) pine (Pk) forest floor soils. Error bars indicate ± one standard deviation (n = 3).
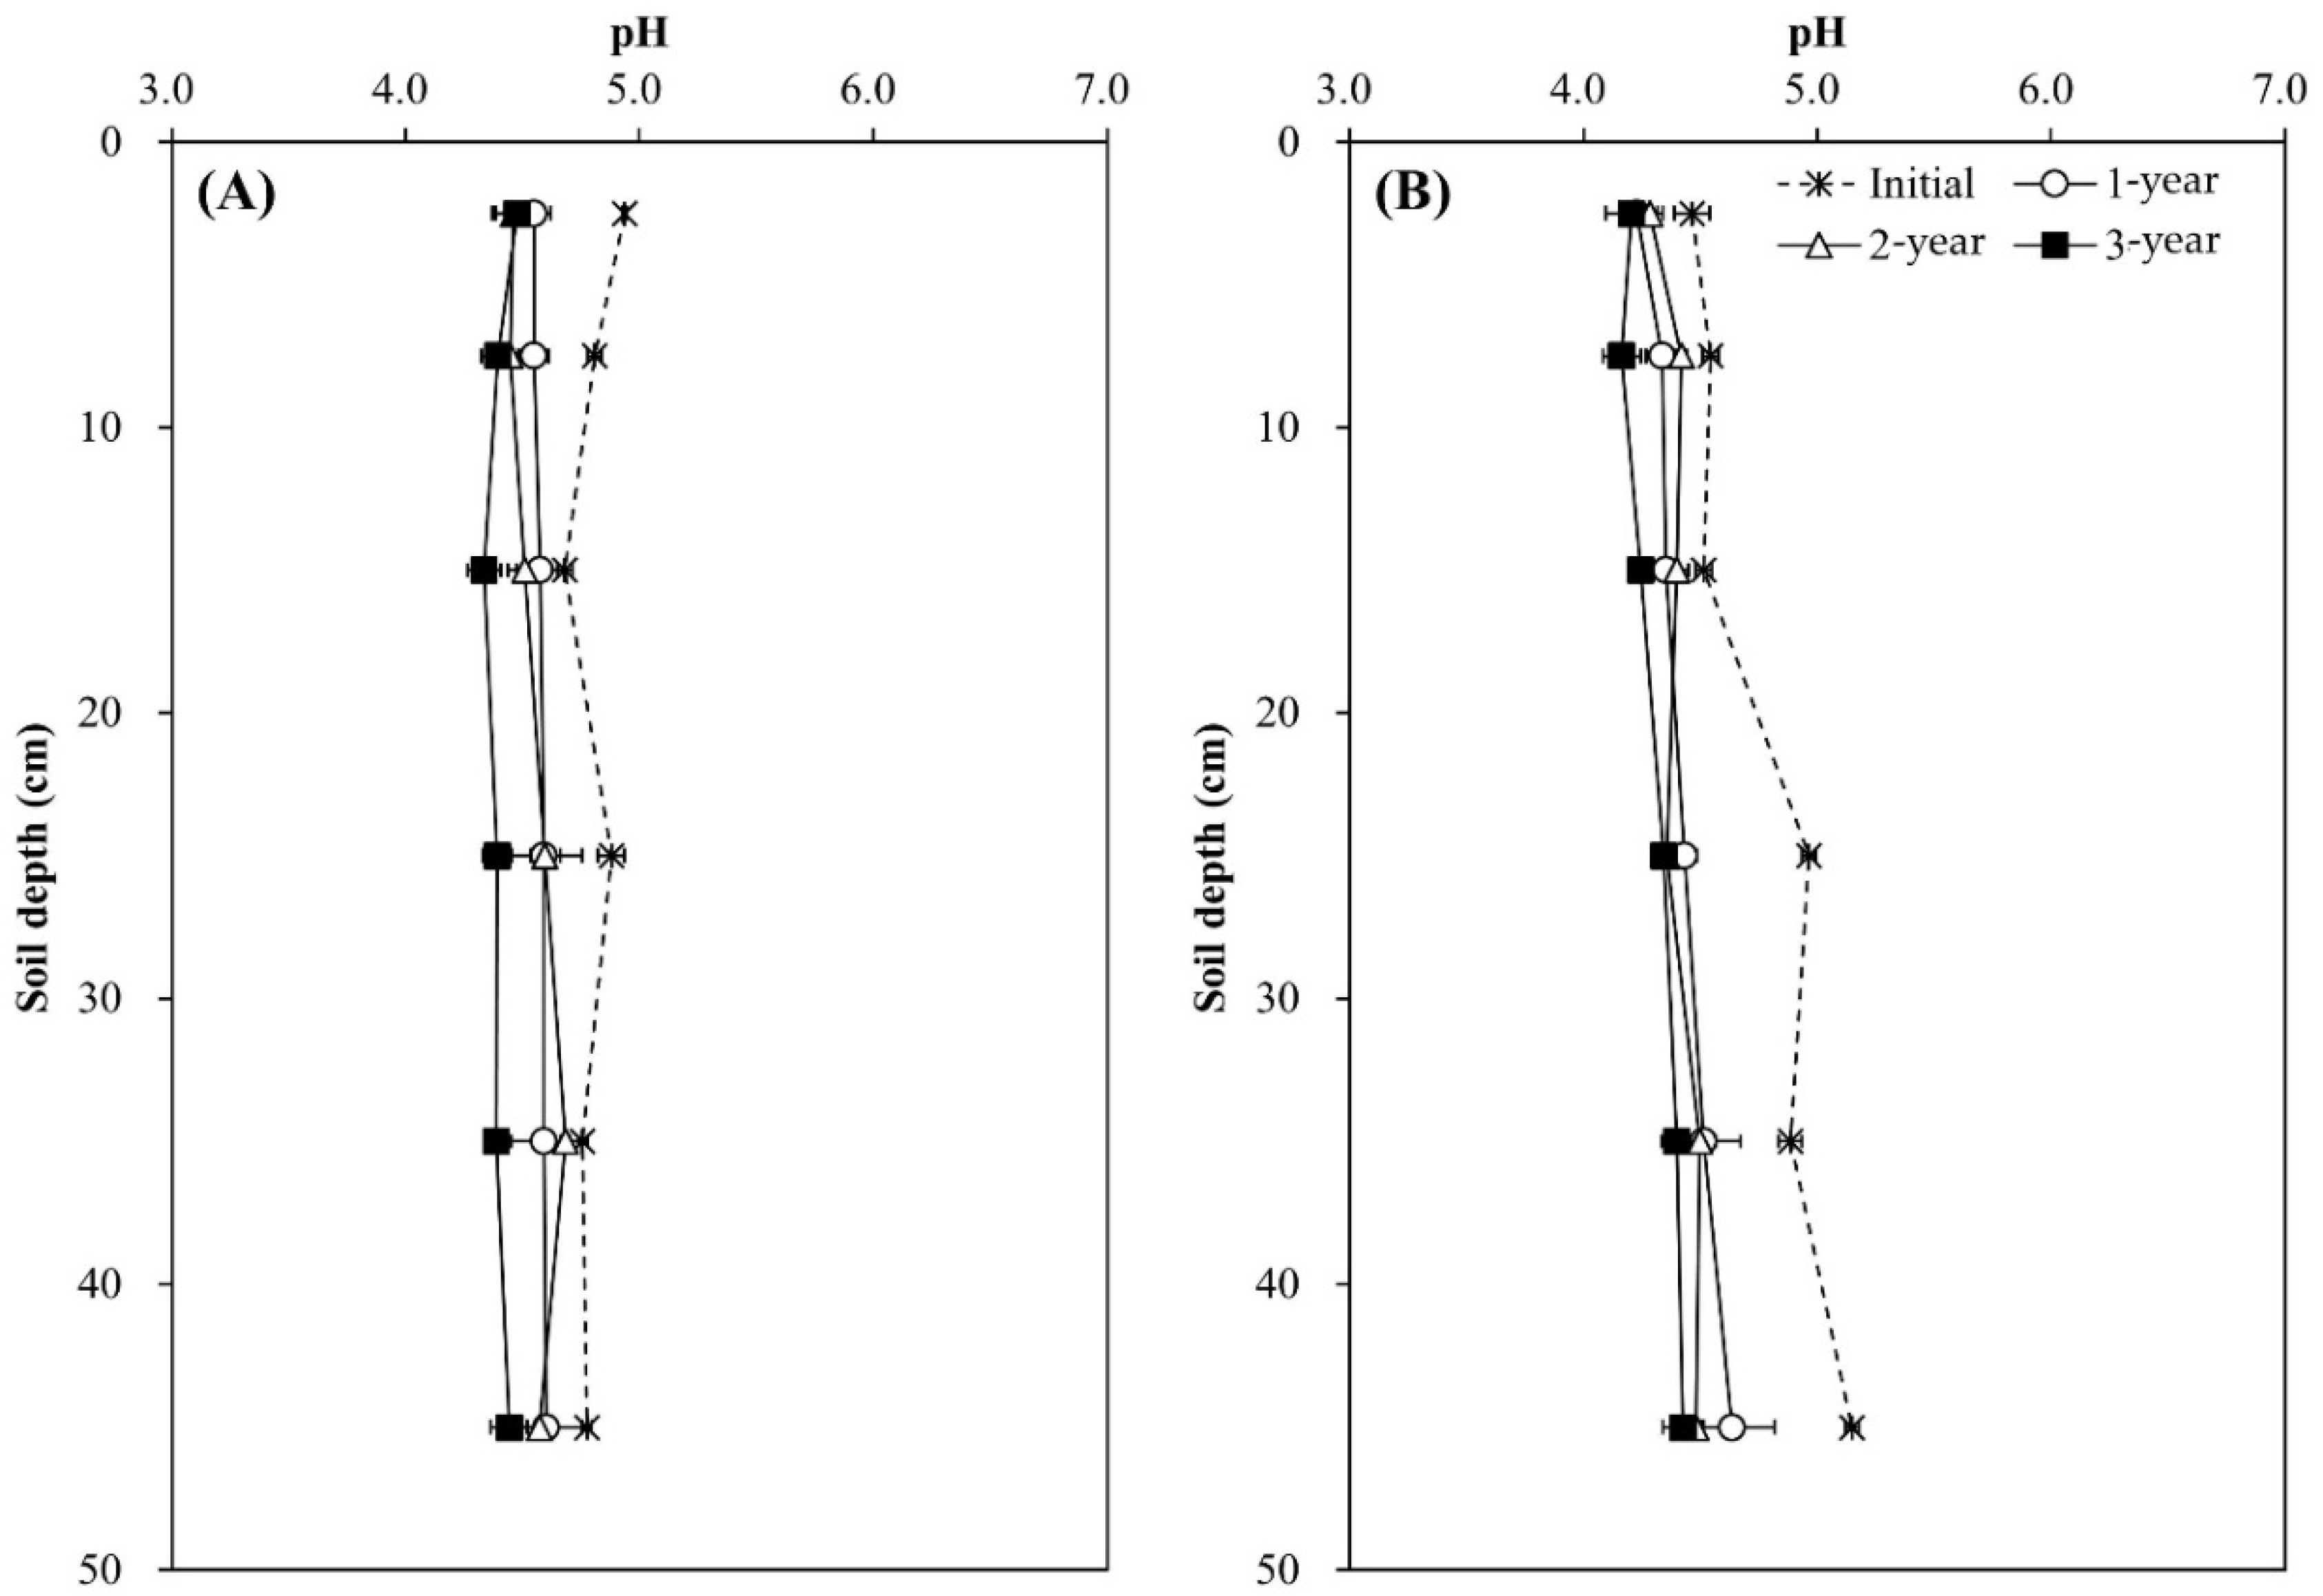
Figure 3.
Annual variations in (a) NH4+-N content and (b) NO3−-N content profiles after N deposition into two different (A) oak (Qa) and (B) pine (Pk) forest floor soils. Each N content indicates the difference between N-treated and control soils: Error bars indicate ± one standard deviation (n = 3).

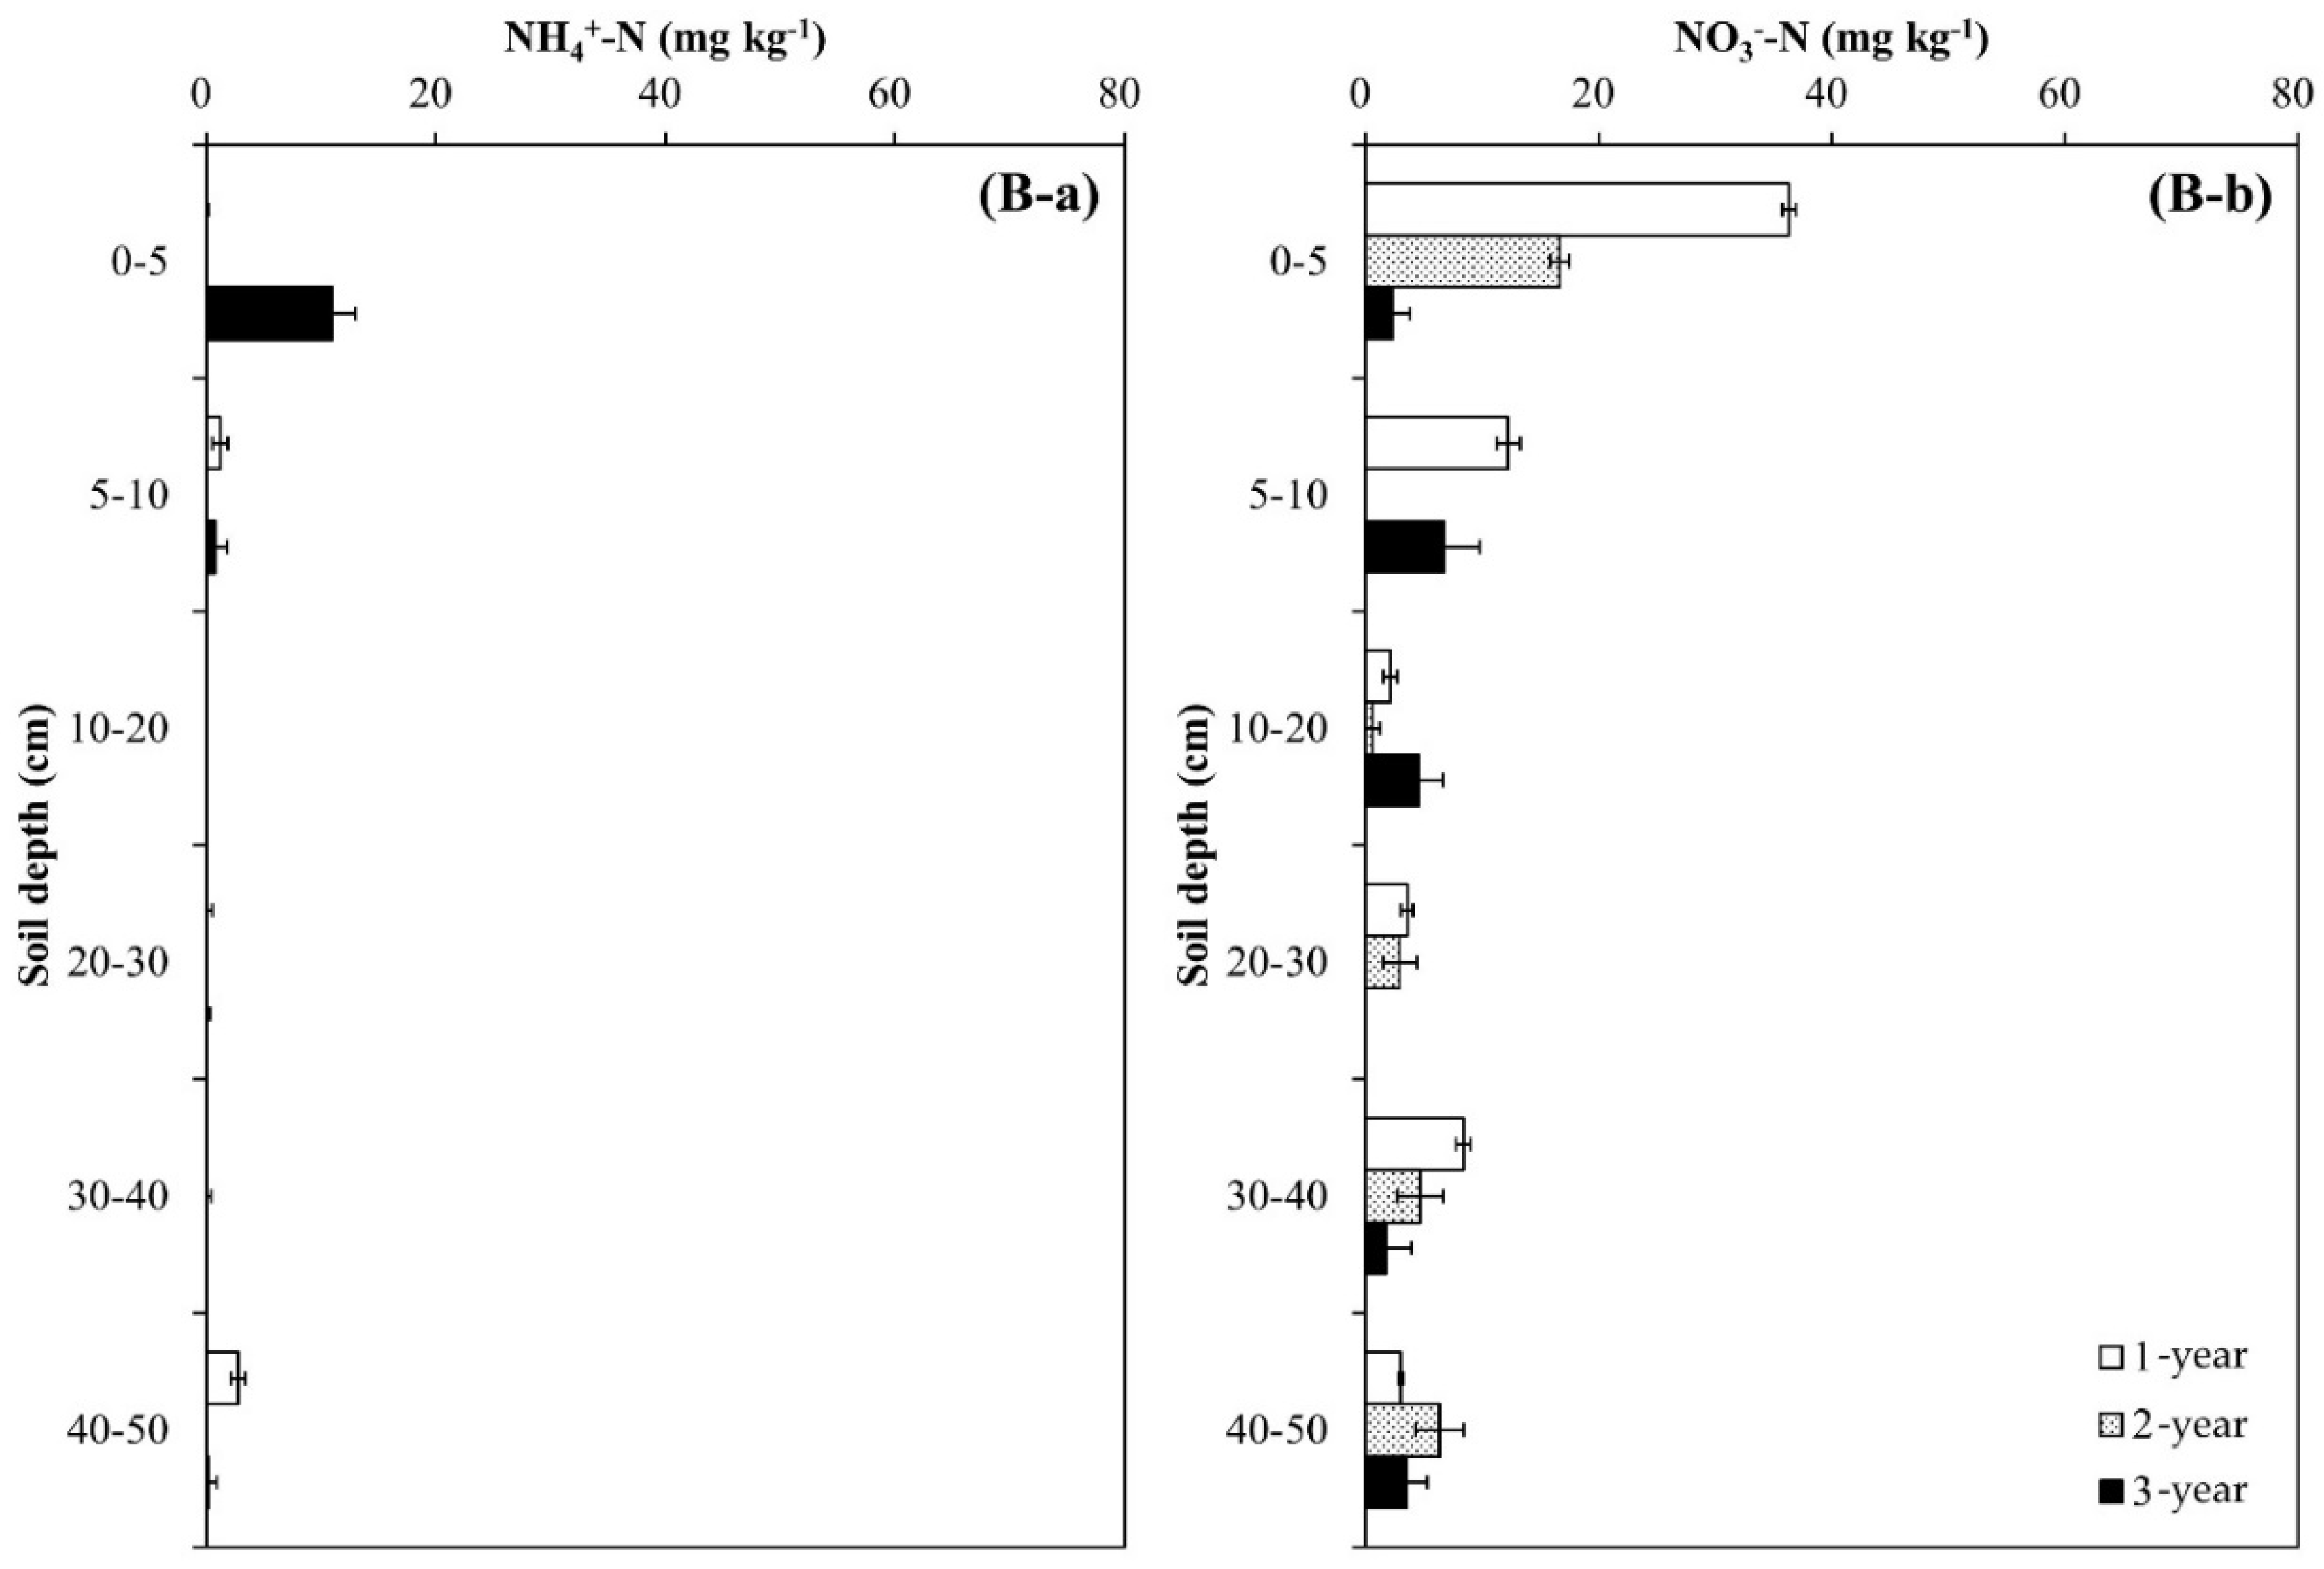
Figure 4.
Annual variations in total N after (a) one year, (b) two years, and (c) three years of N deposition in two different (A) oak (Qa) and (B) pine (Pk) forest floor soils. For each N profile, different lowercase letters indicate a significant difference (p < 0.05). Error bars indicate ± one standard deviation (n = 3).
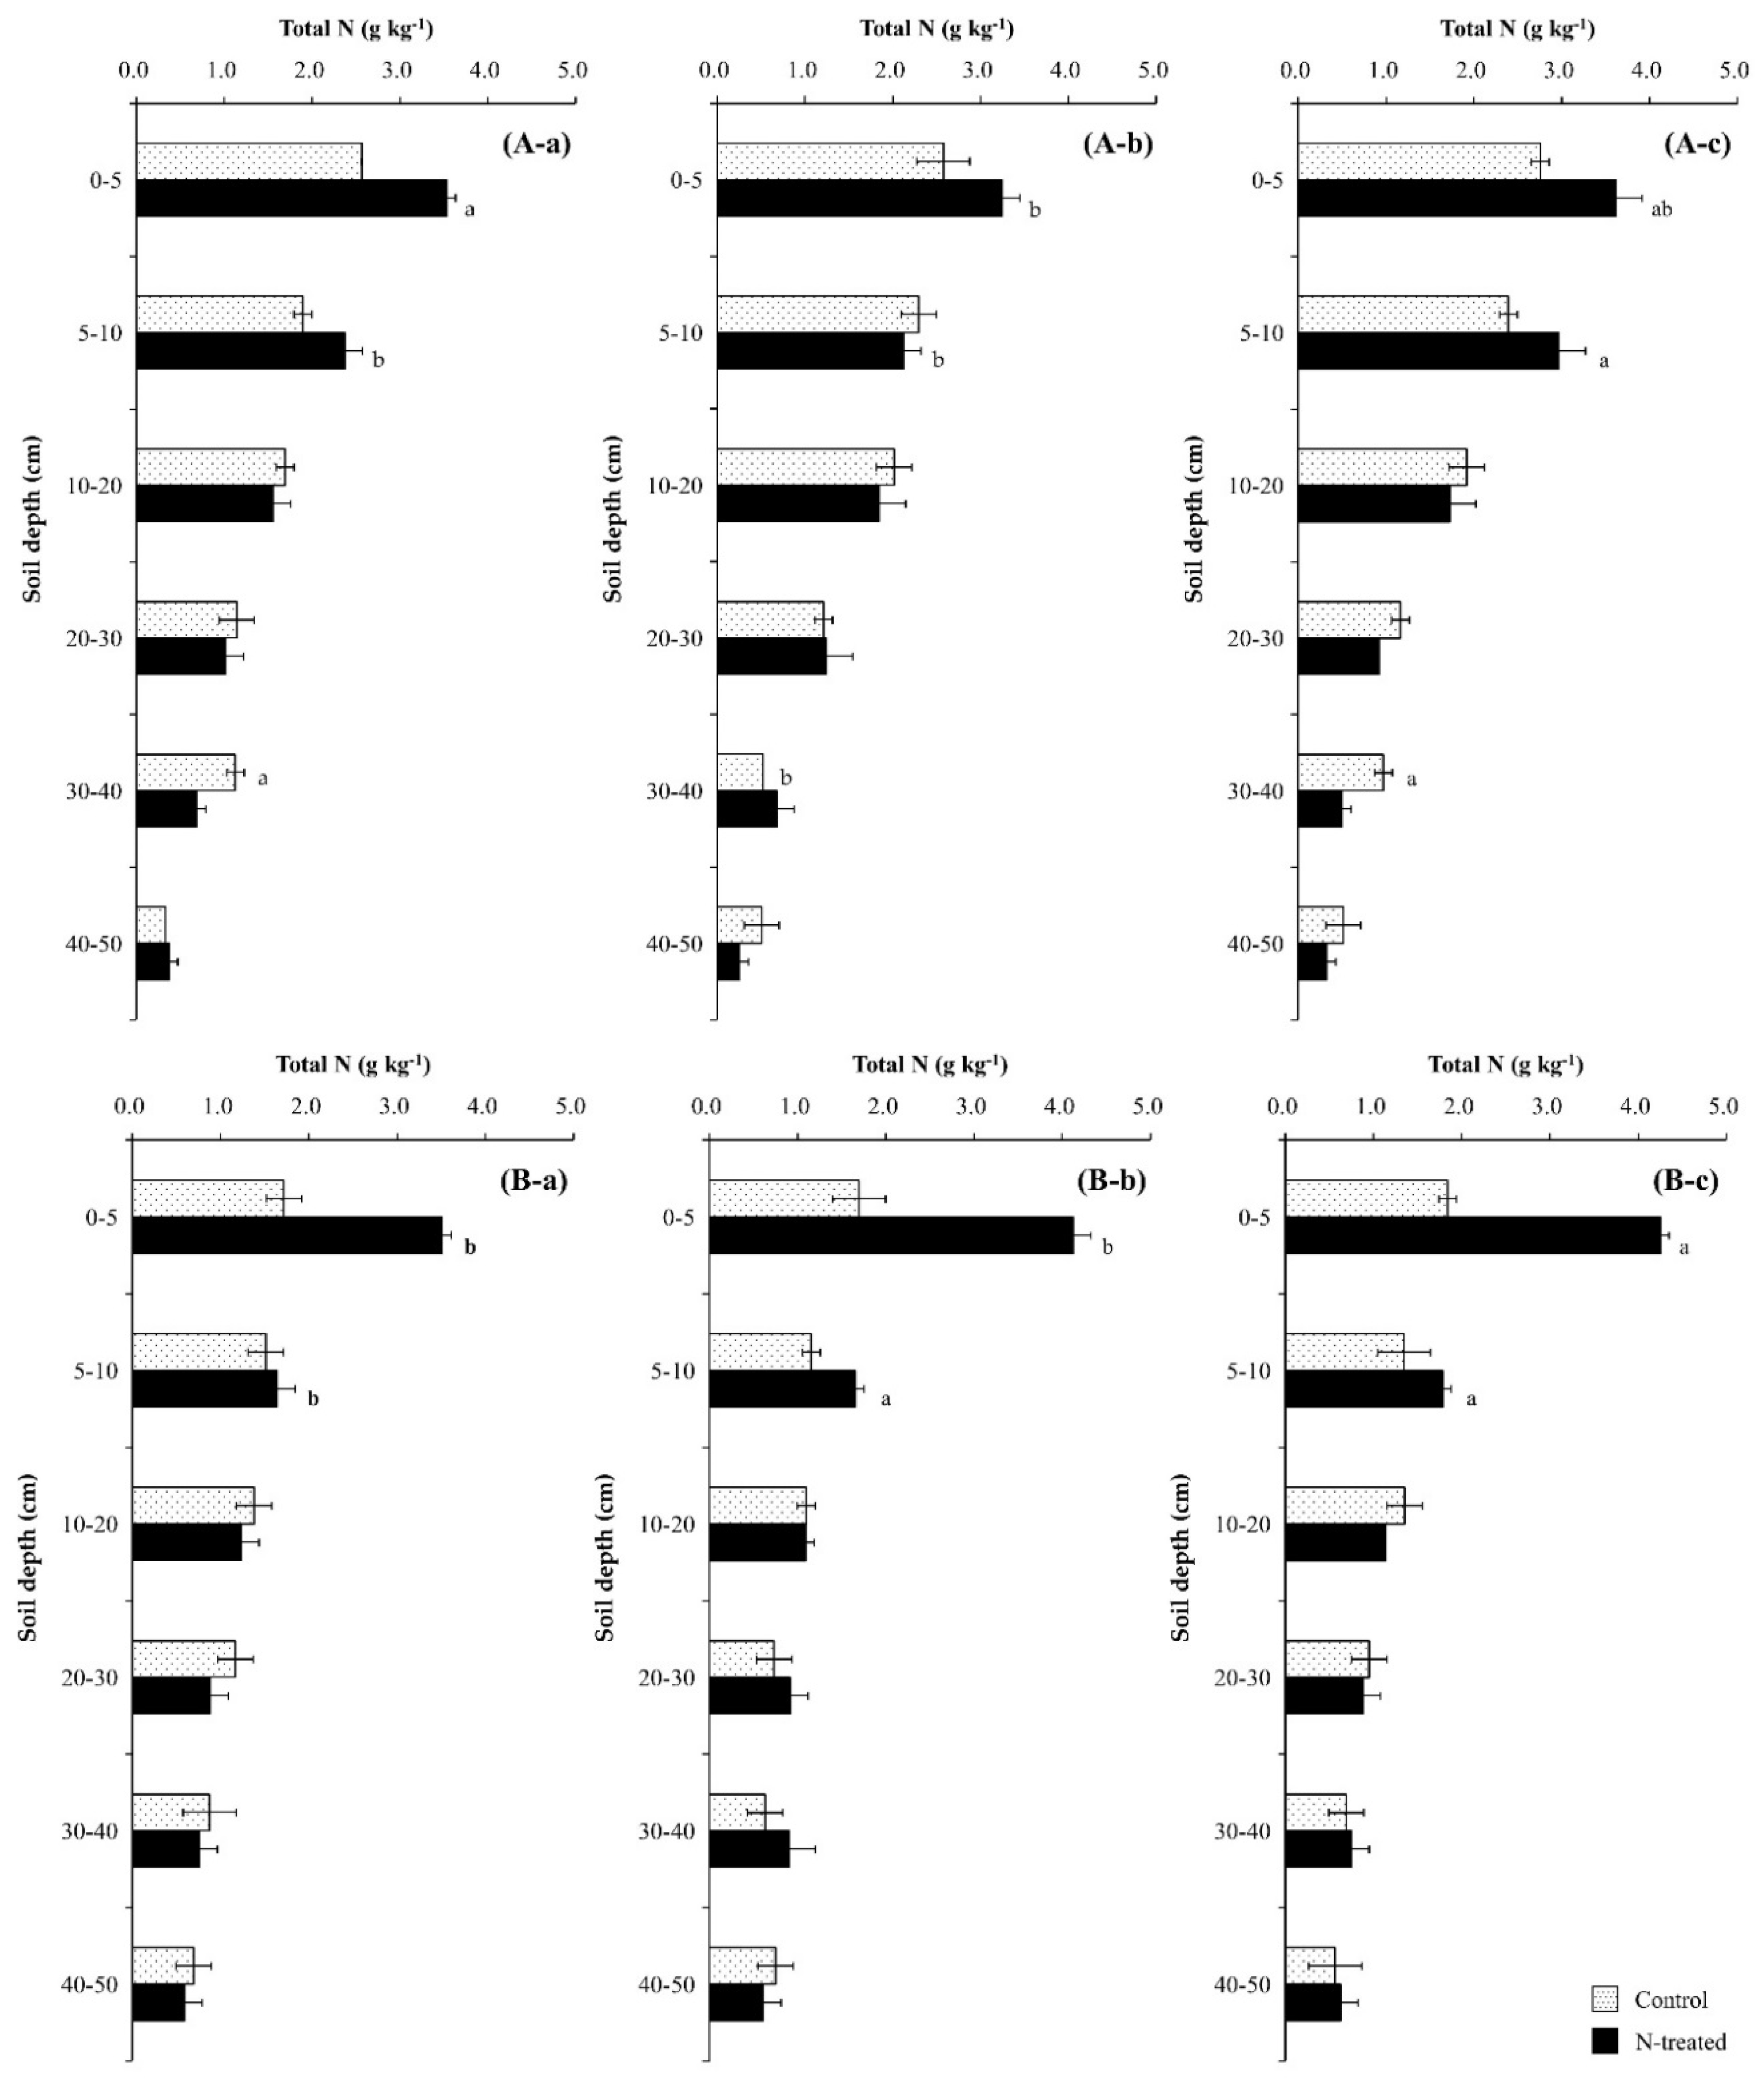
Figure 5.
Annual variations in the amount of N derived from 15N-labeled input sources (NDFI) along the soil profile in two different (A) oak (Qa) and (B) pine (Pk) tree forest soils. Error bars indicate ± one standard deviation (n = 3).
Figure 5.
Annual variations in the amount of N derived from 15N-labeled input sources (NDFI) along the soil profile in two different (A) oak (Qa) and (B) pine (Pk) tree forest soils. Error bars indicate ± one standard deviation (n = 3).
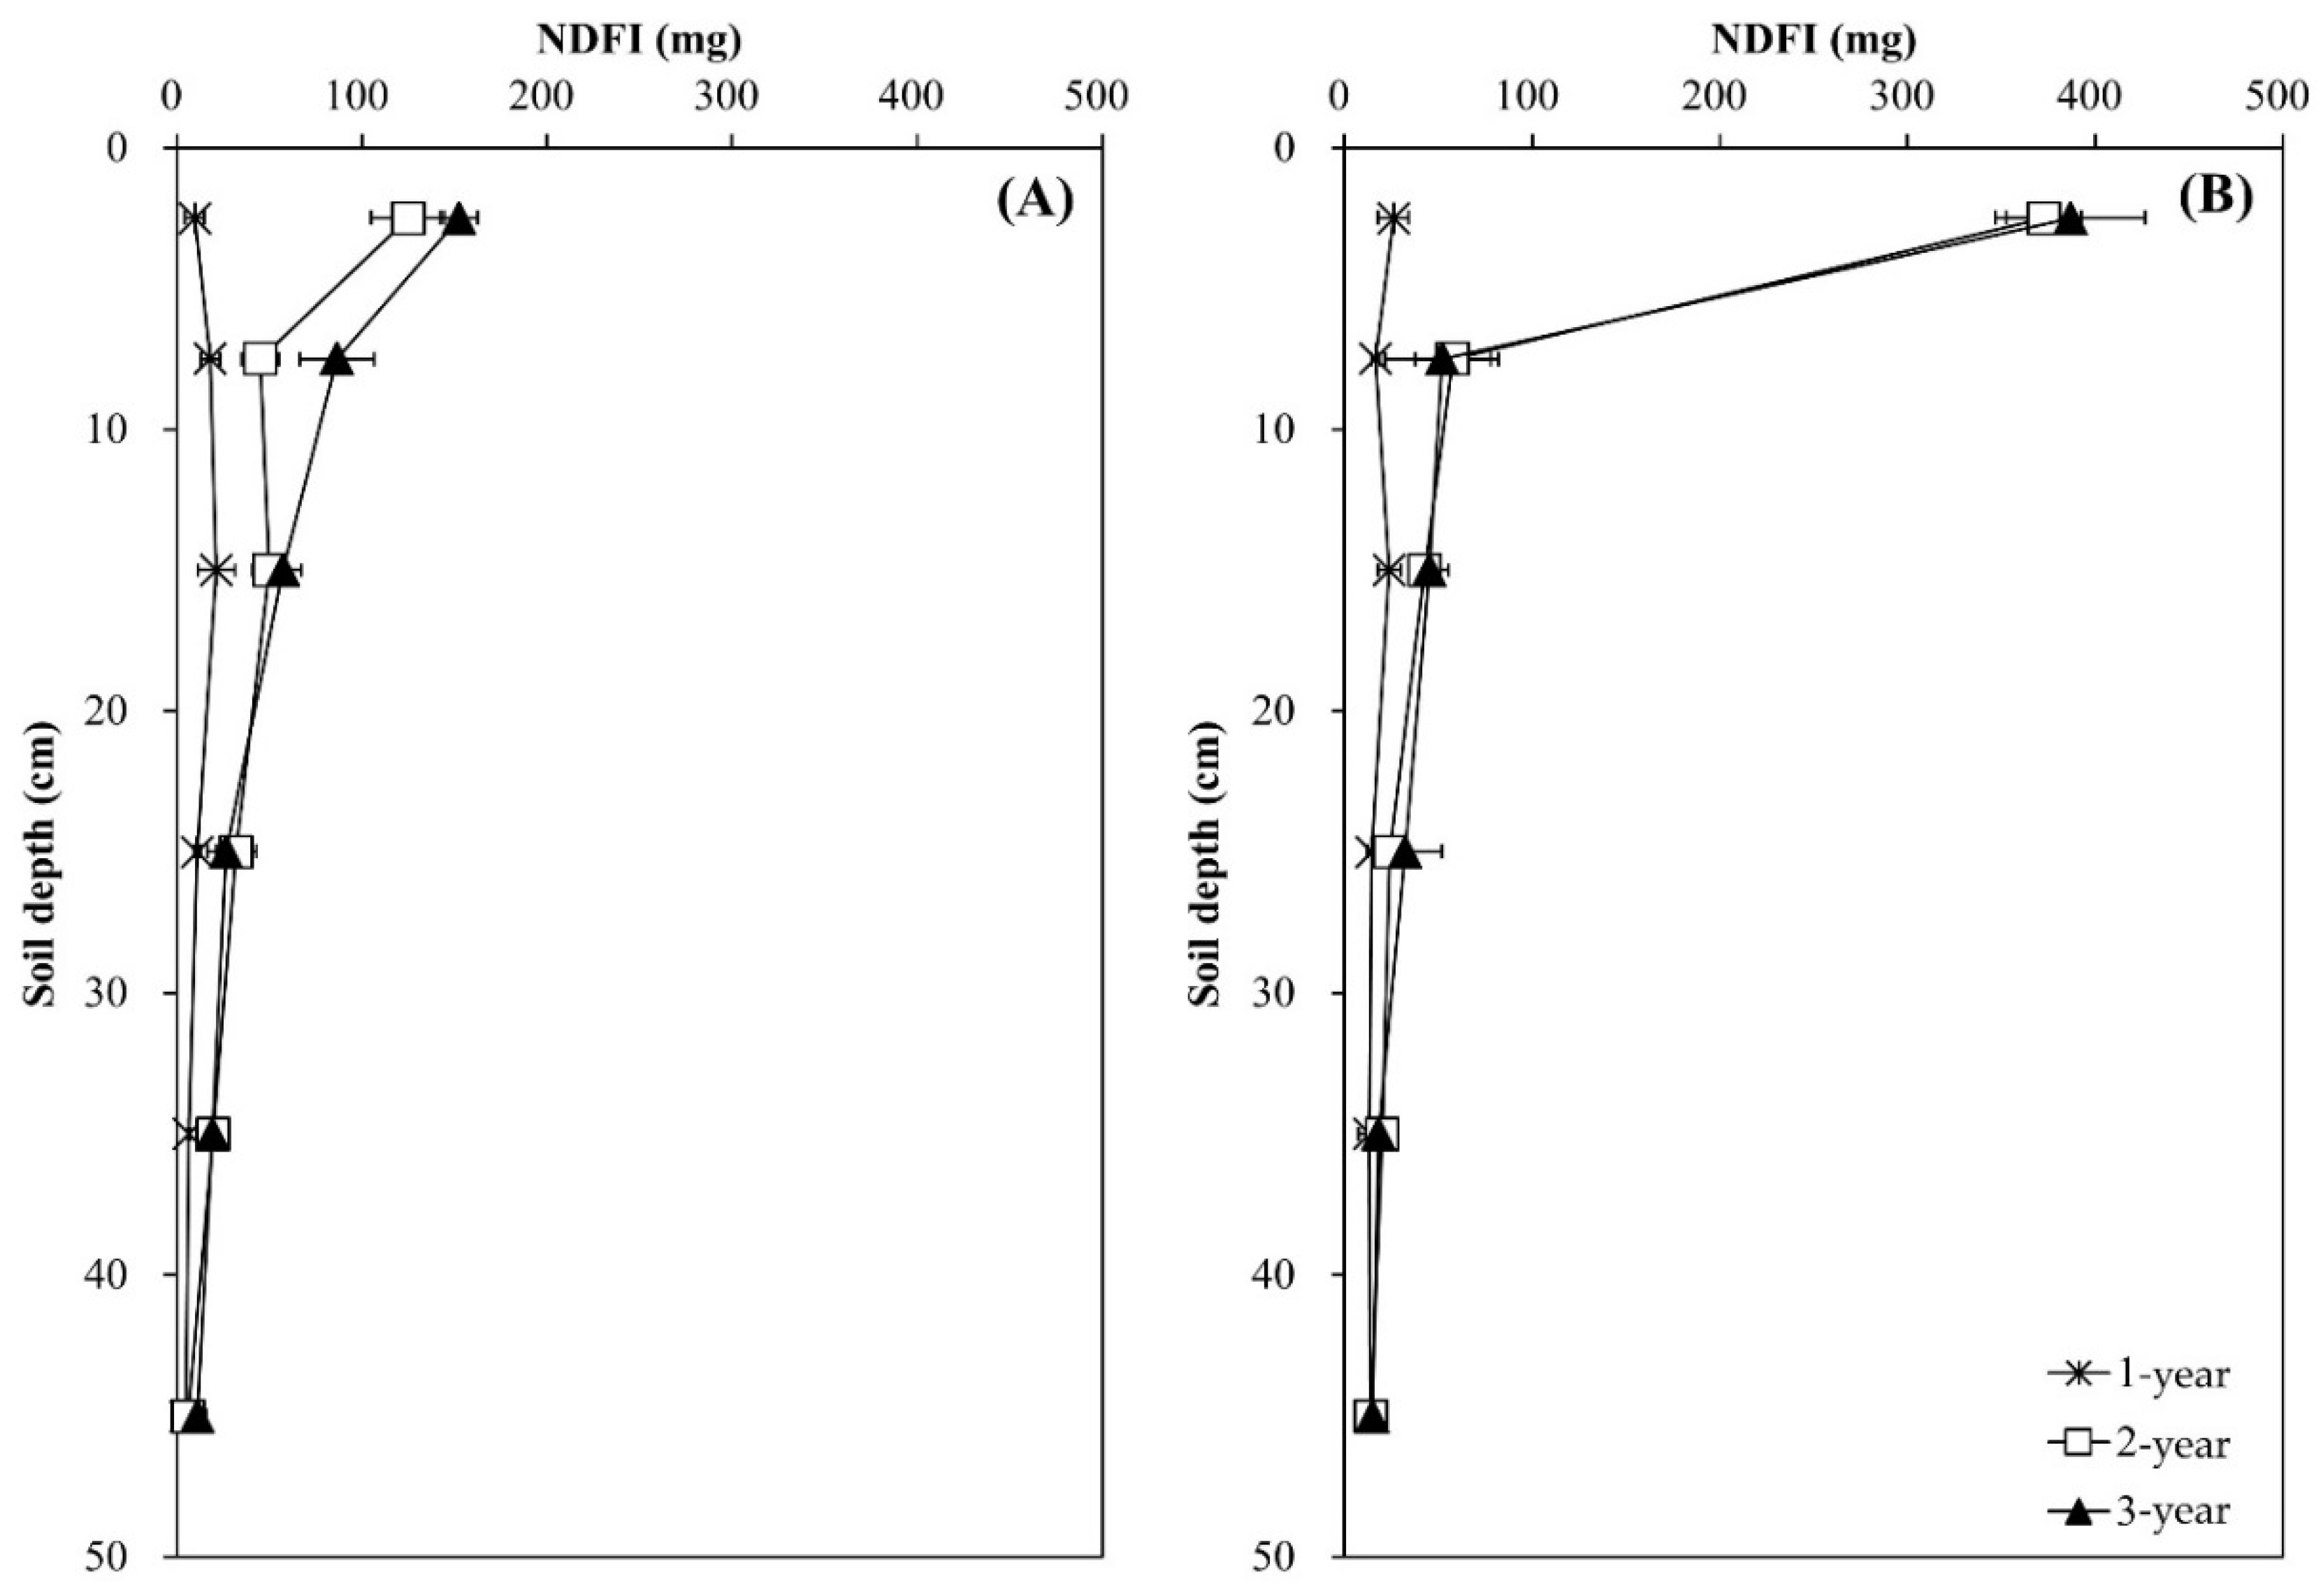
Figure 6.
Annual variations in total C (Top) and δ13C (Bottom) after (a) one year, (b) two years, and (c) three years of N deposition in two different (A) oak (Qa) and (B) pine (Pk) forest floor soils. For each N profile, different lowercase letters indicate a significant difference (p < 0.05). Error bars indicate ± one standard deviation (n = 3).

Table 1.
Some chemical characteristics of the soils collected from two different oak (Q. acutissima) and pine (P. koraiensis) forest floor soils.
Table 1.
Some chemical characteristics of the soils collected from two different oak (Q. acutissima) and pine (P. koraiensis) forest floor soils.
| Soil Properties | Q. acutissima | P. koraiensis |
|---|---|---|
| pH (soil:water = 1:5) a | 4.8 ± 0.0 b | 4.6 ± 0.0 |
| Mineral N (mg kg−1) | 5.5 ± 1.1 | 12.1 ± 3.0 |
| Total C (g kg−1) | 39.4 ± 1.4 | 22.6 ± 0.8 |
| δ13C (‰) | −26.9 ± 0.1 | −24.9 ± 0.4 |
| Total N (g kg−1) | 2.8 ± 0.1 | 1.4 ± 0.1 |
| δ15N (‰) | 1.8 ± 0.1 | 2.1 ± 0.2 |
| C/N ratio | 14.1 ± 0.2 | 16.1 ± 0.3 |
a Soil–to–suspension ratio of 1:5. b The values are given as mean ± standard deviation (n = 3).
Table 2.
Results of four–way analysis of variance (ANOVA) showing the significance of the effects of experimental parameters on pH, mineral N (NH4+–N and NO3−–N), total N (TN), N derived from 15N-labeled inputs (NDFI), total C (TC), and δ13C.
Table 2.
Results of four–way analysis of variance (ANOVA) showing the significance of the effects of experimental parameters on pH, mineral N (NH4+–N and NO3−–N), total N (TN), N derived from 15N-labeled inputs (NDFI), total C (TC), and δ13C.
| Factors | Mineral N | ||||||
|---|---|---|---|---|---|---|---|
| pH | NH4+ | NO3− | TN | NDFI | TC | δ13C | |
| Time (T) | * | n.s. | n.s. | n.s. | * | n.s. | *** |
| Treatment (N) | *** | * | *** | ** | *** | *** | * |
| Soil depth (D) | *** | *** | *** | *** | *** | *** | ** |
| Tree species (S) | *** | n.s. | * | n.s. | n.s. | ** | *** |
| T × N | * | *** | * | * | * | * | * |
| T × D | * | *** | n.s. | * | * | ** | * |
| T × S | * | * | * | n.s. | n.s. | n.s. | n.s. |
| N × D | *** | *** | *** | *** | *** | *** | ** |
| N × S | *** | ** | *** | * | * | *** | n.s. |
| D × S | *** | n.s. | * | n.s. | n.s. | ** | ** |
| T × N × D | n.s. | *** | n.s. | n.s. | ** | * | * |
| T × N × S | * | * | * | n.s. | * | * | * |
| T × D × S | n.s. | n.s. | n.s. | n.s. | * | n.s. | n.s. |
| N × D × S | ** | * | * | * | n.s. | ** | n.s. |
| T × N × D × S | * | n.s. | * | n.s. | * | n.s. | * |
***: significant at the p < 0.001 level; **: significant at the p < 0.01 level; *: significant at the p < 0.05 level; n.s.: not significant (p > 0.05).
© 2018 by the authors. Licensee MDPI, Basel, Switzerland. This article is an open access article distributed under the terms and conditions of the Creative Commons Attribution (CC BY) license (http://creativecommons.org/licenses/by/4.0/).
Share and Cite
MDPI and ACS Style
Park, J.; Ro, H. Temporal Variations in Soil Profile Carbon and Nitrogen during Three Consecutive Years of 15N Deposition in Temperate Oak and Pine Forest Stands. Forests 2018, 9, 338. https://doi.org/10.3390/f9060338
AMA Style
Park J, Ro H. Temporal Variations in Soil Profile Carbon and Nitrogen during Three Consecutive Years of 15N Deposition in Temperate Oak and Pine Forest Stands. Forests. 2018; 9(6):338. https://doi.org/10.3390/f9060338
Chicago/Turabian StylePark, Ji–Suk, and Hee–Myong Ro. 2018. "Temporal Variations in Soil Profile Carbon and Nitrogen during Three Consecutive Years of 15N Deposition in Temperate Oak and Pine Forest Stands" Forests 9, no. 6: 338. https://doi.org/10.3390/f9060338
Note that from the first issue of 2016, this journal uses article numbers instead of page numbers. See further details here.