Anthropogenic and Biophysical Factors Associated with Vegetation Restoration in Changting, China


1
College of Forestry, Fujian Agriculture and Forestry University, Fuzhou 350002, China
2
Co-Innovation Center for Soil and Water Conservation in Red Soil Region of the Cross-Straits, Fuzhou 350002, China
3
College of Agriculture, Nanjing Agricultural University, Nanjing 210000, China
*
Author to whom correspondence should be addressed.
Forests 2018, 9(6), 306; https://doi.org/10.3390/f9060306
Submission received: 26 March 2018
/
Revised: 23 May 2018
/
Accepted: 25 May 2018
/
Published: 1 June 2018
(This article belongs to the Section Forest Ecology and Management)
Abstract
:Changting has been promoted by the Chinese government as a demonstration for the soil and water conservation works in recent years. As the experience in Changting is now being explored and summarized and will be further promoted to the nation, it is important to understand the factors affecting the vegetation restoration process. Random forest and multiple linear regression approaches were applied to investigate the influential factors and their relative importance on the dynamic change of vegetation coverage of Changting during the period of 2000–2010. The Normalized Difference Vegetation Index (NDVI) was used to calculate Fractional Vegetation Cover (FVC) dynamics in response to topographic, climatic, infrastructure, and economic factors. The results show that overall, there was a dramatic increase in the FVC of Changting from 2000–2010. The percentage of the FVC-increased area reached 87.86% with an increase rate of 0.142. Factors such as precipitation, temperature, elevation, slope and financial investment for soil conservation were important drivers of local FVC change. Our findings reveal that climatic factors along with the strict implementation of government policies played a role in driving vegetation cover dynamics, and the continuation of implementation of soil erosion management in Changting is required.
1. Introduction
Vegetation provides a measure of the productivity of terrestrial ecosystems and plays a crucial role in regulating the carbon balance and global climate system [1,2]. Therefore, it is important to monitor the vegetation change and to identify its drivers. Vegetation cover can be affected by climate change, topographic and socio-economic factors [3,4,5,6,7], and a rapid change in vegetation cover can be triggered by environmental forces [8] and political change [9]. The causes of vegetation change have been researched extensively in many forested regions around the world [7,10,11,12]. Vegetation is greatly influenced by the rapid change of population density, which usually leads to either negative or positive impacts. On the one hand, material consumption will be improved along with an increased population, in turn negatively impacting the vegetation cover [13]; on the other hand, the increased population may accelerate the process of urbanization and the quality of life, and increase green area and vegetation cover [14]. It is a great challenge because the changes in vegetation cover can be influenced by a complex set of factors, ranging from global external drivers to local conditions and pressures [15].
Changting County is located in the southeast of China. Historically, the county has had good vegetation cover due to the plant-favorable climate conditions [16]. However, a half-century of forest exploitation and monoculture planting has led to a large decrease in vegetation cover and serious soil and water erosion in the area [17,18]. To alleviate this land degradation, the local government has implemented a series of policies such as the Grain for Green program, Afforestation and Soil Erosion Control since 1985 but with little effect [17]. In 2000, a new policy providing annual compensation to areas experiencing high intensity soil erosion was launched, and the soil loss rate decreased from 21.95% (1988) to 11.37% (2010) [19]. Recently, the achievement of soil and water conservation in Changting has been affirmed by the state. Although the policy change had an important impact on vegetation restoration, the roles of other factors are also important as factors co-occurred and interacted during the restoration process [20]. Effective policies alone may not be able to drive rapid vegetation restoration if the natural conditions, such as temperature, precipitation, soil condition, and topography, are unsuitable for vegetation growth. However, the relative importance of the factors and how they interact to induce vegetation cover change in Changting are still uncertain.
The objective of this study was to identify key factors that influence the vegetation restoration in areas that have experienced soil degradation and water scarcity, which can provide a scientific basis for the local government to develop a more efficient and economic vegetation restoration plan. For this purpose, both Multiple Linear Regression (MLR) and Random Forest (RF) methods were applied to obtain a comprehensive analysis of associated factors of vegetation restoration in Changting. MLR is a widely used technique in influential-factor analysis [21,22]. It is powerful in terms of predictability, but is limited to reveal the nonlinear and complex relationships that often exist between biophysical and social data. The RF method is a non-parametric technique, which is a more flexible method to evaluate complicated interactions among variables, regardless of the number of variables that are used initially, and does not encounter the problem of over-fitting [23,24,25]. However, RF also has some limitations, as it does not calculate regression coefficients or confidence intervals [26]. The applicability and performance of two methods were investigated and compared, and the influential factors and their importance to local vegetation restoration are revealed.
2. Materials and Methods
2.1. Study Area
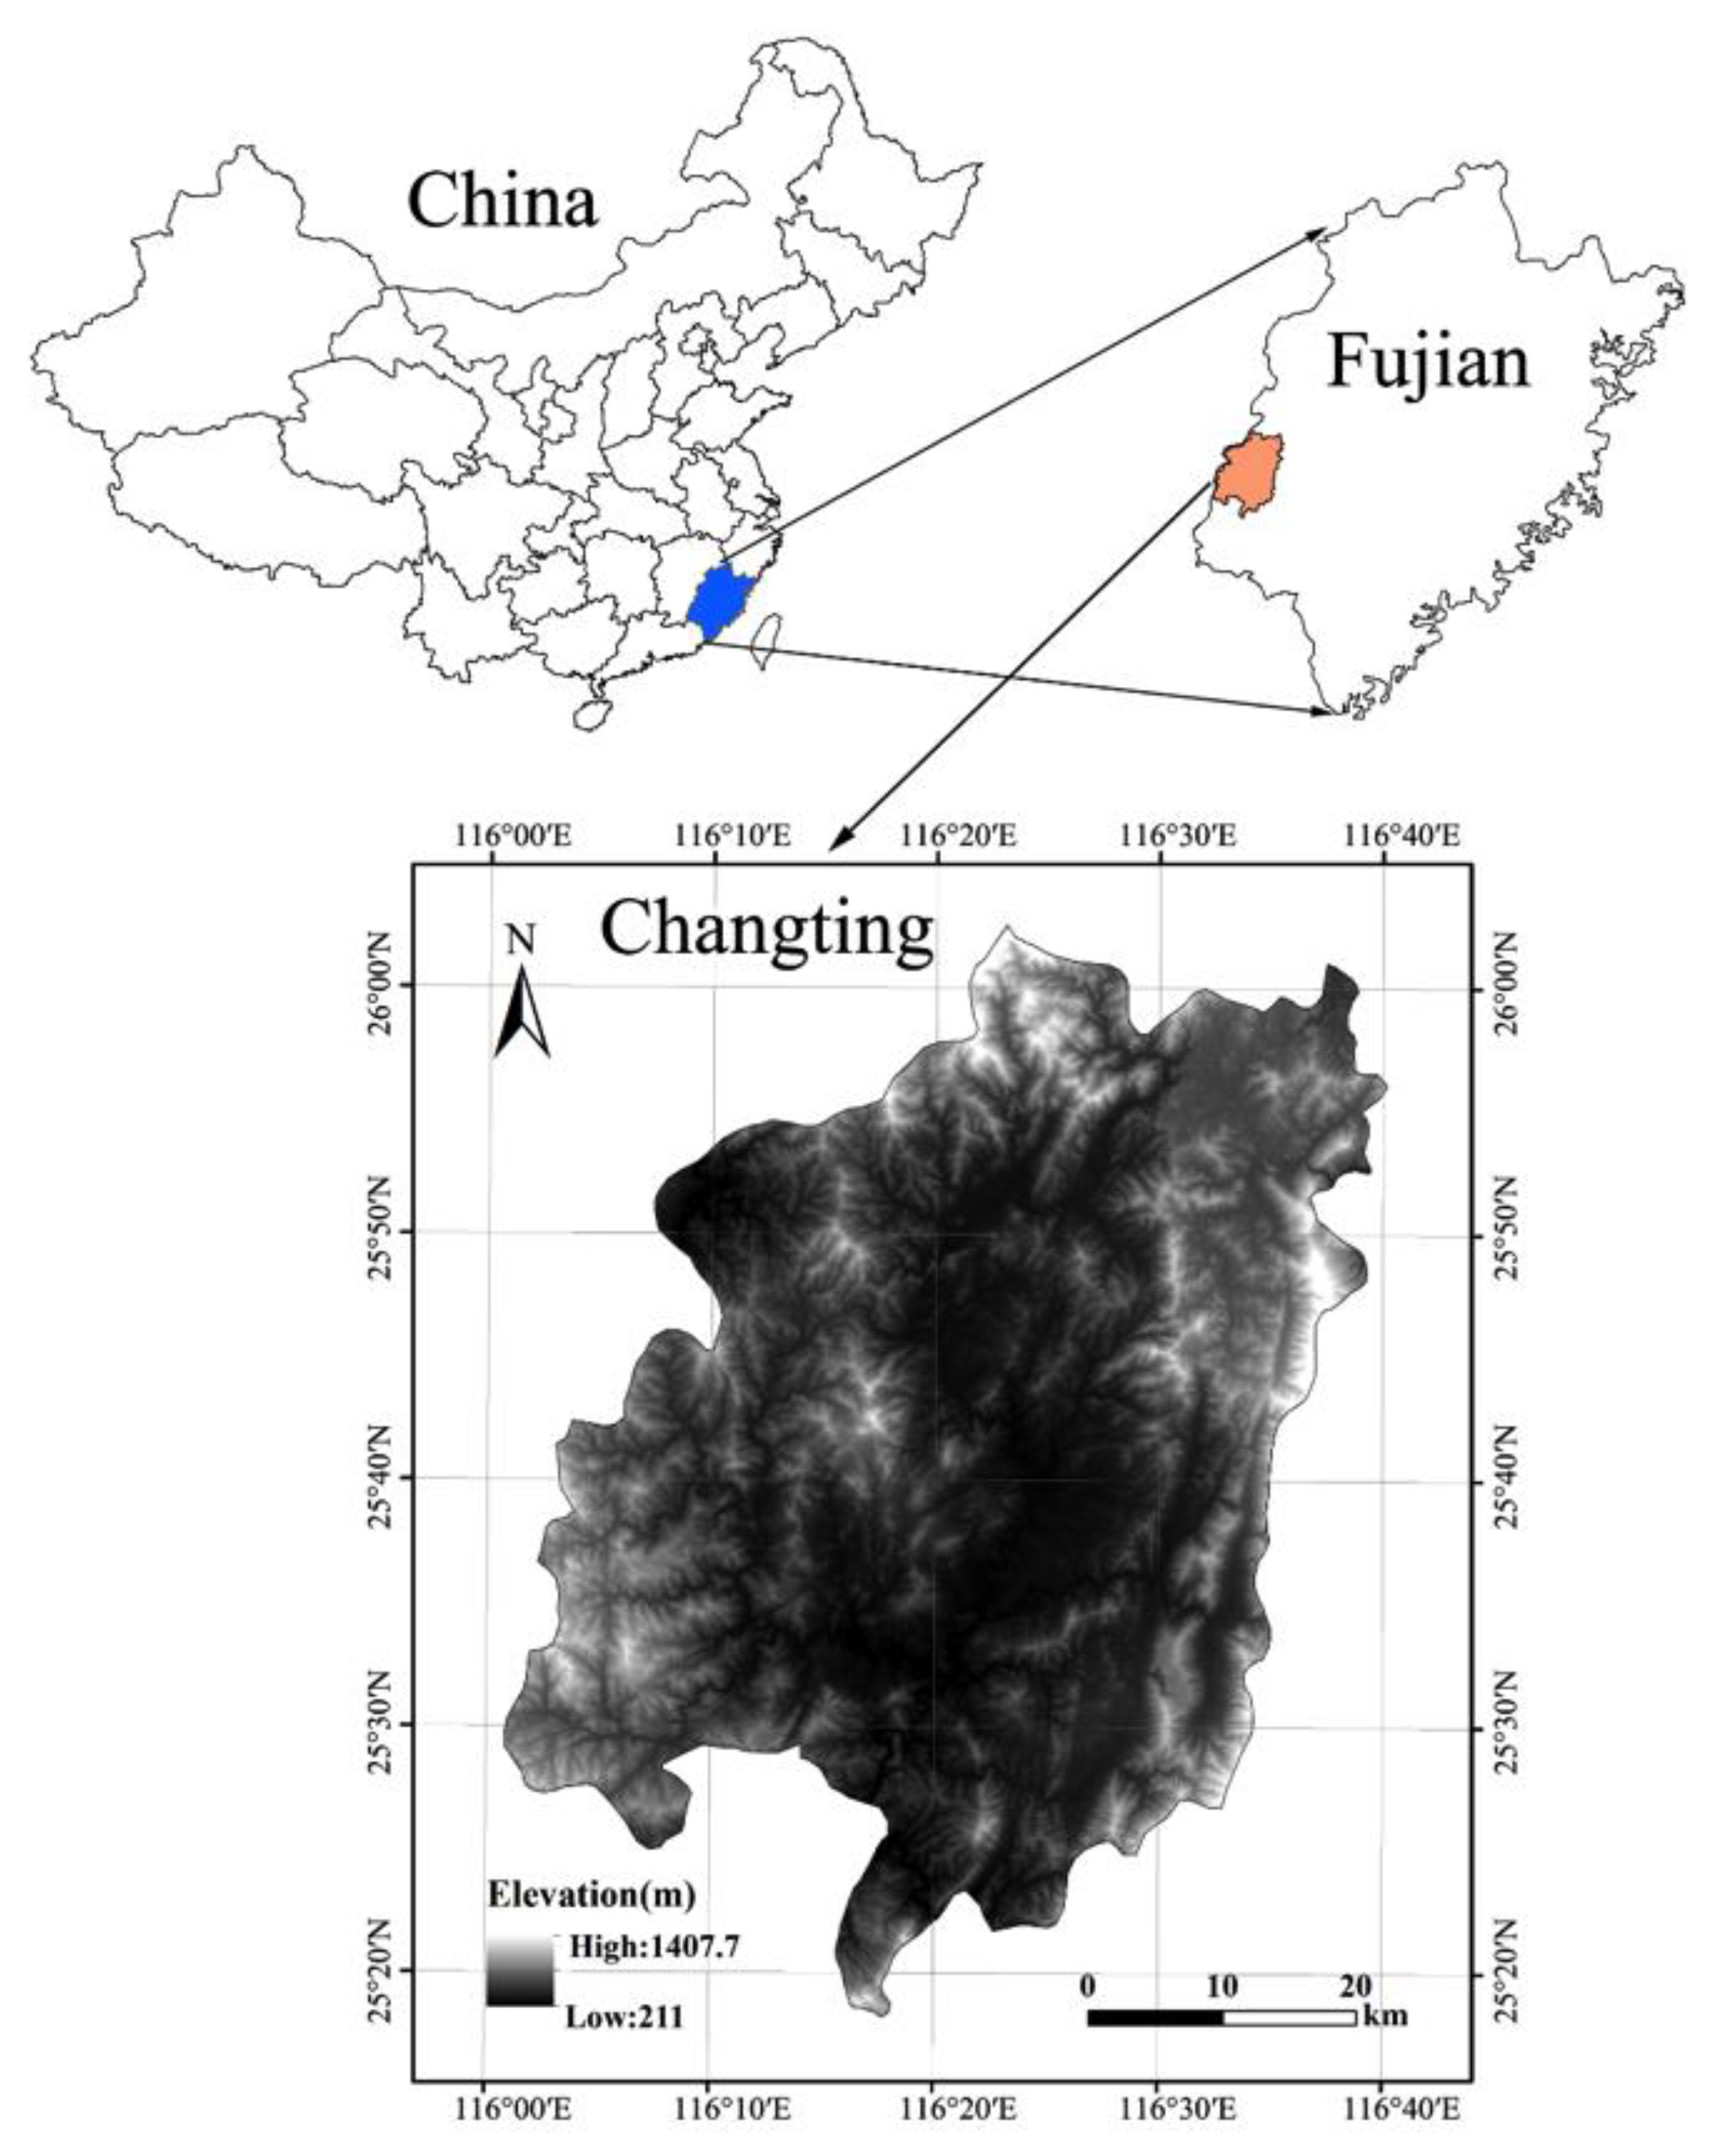
Changting County is located in the southwest of Fujian Province, China (25°18′40″–26°02′05″ N and 116°00′45″–116°39′20″ E). It is characterized by a humid, subtropical monsoon climate, and it is primarily covered by loose granite red soils [8]. The annual average temperature is 18.3 °C. Changting experiences heavy rainfall at a rate of 1730.4 mm year−1 [27]. The total area of Changting County is 3097.26 km², of which low hills constitute about 71.11% (Figure 1). Historically, the county had good vegetation cover, which was beneficial as the thin layer of soil has low resistance to erosion [28]. However, in recent history, the region has suffered from severe soil erosion as result of anthropogenic and natural factors [29], and it has gradually become a typical case of red soil erosion, with high soil erosion intensity and a long history of treatment. In order to protect the local natural environment, the government developed policies and took a series of steps, particularly after the year 2000, to restore the vegetation cover. By 2010, the local vegetation cover experienced a significant change [27]. The vegetation belongs to the evergreen broad-leaved forest region of central Asia. The dominant tree species include Pinus massoniana Lamb. and Ischaemum Ciliare Retz.
2.2. Selection and Pre-Processing of Variables
2.2.1. Fractional Vegetation Coverage (FVC)
As an important indicator of vegetation change, the fractional vegetation coverage (FVC) can be used as the dependent variable. FVC is the projection of the crown or shoot region of vegetation on the ground surface within a unit area [30]. We calculated the FVC based on the Pixel Dimidiate Model (PDM) [31] according to Equation (1):
where R represents the information observed by remote sensing, Rv and Rs represent the pure green vegetation pixel and the pure soil pixel, respectively.
R = Rv + Rs
In a pixel mixture of vegetation and soil, the proportion of the vegetation covered area is Vc, and the soil area is 1 − Vc. Combined with Equation (1), a mixed pixel’s vegetation information Rveg and soil information Rsoil can be calculated by Equations (2) and (3):
Rv = Vc × Rveg
Rs = (1 − Vc) × Rsoil
Integrating Equations (1)–(3), the portion of the vegetation covered area Vc can be expressed by Equation (4):
Vc = (R − Rsoil)/(Rveg − Rsoil)
Since the normalized difference vegetation index (NDVI) is the best indicator of vegetation growth and is closely related to the FVC [32], Equation (4) can then be transformed to Equation (5) to calculate the FVC of a given pixel.
where NDVIveg and NDVIsoil represent the NDVI parameter of vegetation coverage and soil, respectively, and the calculations are conducted in ENVI 5.3 (http://www.harrisgeospatial.com/docs/using_envi_Home.html).
FVC = (NDVI − NDVIsoil)/(NDVIveg − NDVIsoil)
The NDVI dataset was extracted from Landsat 4–5 Thematic Mapper (TM) (2000–2003) and Landsat 7 Enhanced Thematic Mapper (ETM) (2004–2010) (Jointly managed by NASA and USGS) with a spatial resolution of 30 m. The dataset was provided by the International Scientific and Technical Data Mirror Site, Computer Network Information Center, Chinese Academy of Sciences (http://www.gscloud.cn). In order to compare the variation of vegetation cover between different years, the NDVI images should be collected at the same time each year. Considering the high proportion of cloudy and rainy days in spring and summer in the study area, which will lead to a negative influence on satellite image analysis, we selected the images in autumn (October or December) as a base to calculate FVC, which represents the average level of vegetation cover of each year during 2000–2010. A total number of 31,978 grids in each FVC image was obtained.
2.2.2. Explanatory Factors
Based on previous studies and local practical experience, 19 explanatory (independent) variables that may affect the local vegetation restoration were selected (Table 1). Variables were grouped into four categories including meteorology, topography, urbanization and socio-economic factors. Each variable was generated as one layer in ArcGIS environment and was converted to a 1 × 1 km grid for further model fitting.
Topographic Factors
The importance of topographic factors for vegetation cover change has been indicated by several studies [32,33]. High resolution (25 m) Digital Elevation Model (DEM) data were collected from the National Administration of Surveying, Mapping and Geoinformation of China. In order to obtain accurate topographic factors, elevation and slope were retrieved from the data and sink-fill treatment was conducted. Aspect was reclassified into four main directions: N (293–67°), E (67–113°), S (113–248°) and W (248–293°). Since the data were available at 25 m resolution, taking into account the circular nature of this variable and to avoid losing crucial information when upscaling to 1 km, it was preferable to retrieve the proportion of each pixel occupied by each different aspect, thus creating four other layers (proportion of aspect N, E, S and W).
Climatic Factors
Meteorological factors have been reported as the key drivers of the change in vegetation cover [34,35] and their lag effects [1,36,37]. We therefore selected annual average temperature, precipitation, and relative humidity of the current year (the year that corresponds to the vegetation cover data) and one year before the vegetation cover investigation year as explanatory factors. The climate dataset was generated by the Geographical Sciences and Resources Research Institute, Chinese Academy of Sciences. The data-generating process was based on the combination of re-analysis of NCEP (National Centre for Environmental Prediction)/NCAR (National Center for Atmospheric Research). The data are available on the Earth System Science Data Sharing Platform, China (http://geodata.nju.edu.cn/). We averaged each climate factor within a 1 × 1 km grid for further model fitting.
Urbanization
Infrastructure indicators represent the development of urbanization, which has been considered as an important influential factor on the change of vegetation coverage and land use [38,39]. Some infrastructures such as density of railways, density of roads and density of settlements were extracted for the analysis based on a 1:250,000 Digital Line Graphic (DLG) map in the ArcGIS10.2 environment. A Digital Line Graphic (DLG) map was obtained from the National Administration of Surveying, Mapping and Geoinformation of China (http://218.244.250.78/NgccDigitalHall/). Given the rapid development and expansion of local infrastructure, we set up an annual-expansion rate of a 50-m buffer based on the settlements and roads of the year 2000 to represent the dynamic change in infrastructure in Changting.
Social-Economic Factors
Population density and per capita Gross Domestic Product (GDP), which represent the development speed of local population and economic development, were considered as influential factors of local vegetation cover [40]. Gridded population density and per capita GDP data of 2000, 2003, 2005 and 2010 with 1-km resolution were obtained from the Data Sharing Infrastructure of Earth System Science (http://www.geodata.cn/Portal/index.jsp). The average annual growth rates of population and GDP during 2000–2010 were then calculated and the value of any given year can be estimated based on the annual growth rate.
In addition to gross domestic product and population density, we also selected some specific local economic factors (Table 1), which were collected from the Statistical Year book of Fujian Province (http://www.stats-fj.gov.cn/), Cao et al. [27] (2009)’s study, and the water and soil conservation bureau of Changting County.
2.3. Application of Statistical Models
2.3.1. Linear Trend Analysis
The linear trend analysis is a common method to calculate the trend based on a linear regression model. It is assumed that the residuals are independent and normally distributed, from which we can calculate the trend of each raster grid [41,42]. We applied this method to analyze the change trend of each pixel during 2000–2010 in this study. The equation is as follow:
where n is a cumulative number of monitoring years, which in our study is 11 years; i represents the specific year; i is 1 for 2000, 2 for 2001, and so on. θslope is the slope of the linear regression model, representing the change trend of vegetation cover of each pixel from 2000–2010. θslope > 0 indicates an increasing trend for vegetation cover; θslope < 0 means a decreasing trend; and there is no obvious change when θslope = 0. FVCi represents the fraction vegetation cover of each pixel of a specific year.
2.3.2. Models and Computing Procedures
We randomly divided the original dataset into two parts: 60% for calibration and the remaining 40% for validation. The data division procedure was repeated five times in order to achieve a stable result, and five random sub-samples of the data were generated accordingly. The whole study area was gridded by a 1 × 1 km cell, and the total amount of grid cells is about 32,000. Both multiple linear regression (MLR) and random forest (RF) were used to analysis the main driving factors of vegetation coverage change. All the calculations were conducted using R Statistical Software (https://www.r-project.org/) [43]. In order to eliminate the bias of model fitting, the multicollinearity analysis of the independent variables was performed before fitting the MLR model [44]. The variance inflation factor (VIF) is used as an important indicator for multicollinearity testing in this study [45].
Multiple Linear Regression
MLR has been widely applied in vegetation coverage dynamic change analysis [10,46]. In this study, the training data of each sub-sample were used to fit the MLR model and five intermediate models were created accordingly. The performance of model fitting was tested based on the validation data. We selected the predictor variables that were statistically significant (α = 0.05) in at least three of five intermediate models to build the final MLR model. In addition, the relative importance of each variable to vegetation change was assessed using the package Relaimpo of the R software [24,47]. The metrics lmg (Lindeman, Merenda and Gold) [48], which represent the R2 contribution of each variable averaged over orderings among regressors, was calculated. A higher metric lmg value indicates a higher importance of the variable [48] and the lmg of the variable that was less than 1% was removed from final model fitting. Although MLR is a popular method, some studies indicated that MLR may be inappropriate because a nonlinear relationship may exist between vegetation change and its influential factors [49,50].
Random Forest
Due to the potential limitations of traditional MLR, Random Forests was also applied to fit the data. Random Forests (RF) is an ensemble learning method based on classification and regression trees (CART). It can evaluate the relationship between covariates and dependent variables and calculate the relative importance of covariates [25,26]. RF generates ntree bootstrap samples from the original dataset. For each of the bootstrap samples, it establishes an unpruned classification or regression tree. The final outcome is the average of the results of all the ntrees. For each bootstrap sample, the outcome consists of about two-thirds of the overall samples, and retains about one-third of the samples (called out-of-bag, OOB) for validation [51]. For each classification or regression tree, at each node, RF randomly samples mtry of the predictors and chooses the best split from among those variables. When using RF for data fitting and prediction, the number of trees (ntree) and the number of each random variable at each node (mtry) must be parameterized. Referring to previous studies, we set the mtry as and ntree as 1000 to get a stable result [52,53,54].
The mean decrease in accuracy (% IncMSE) in RF was used to measure the importance of the variables. The importance of each variable was independently calculated in each intermediate model based on % IncMSE, and the most relevant variables were selected to fit the final model. In addition, we used the partial plot function in R to construct partial dependence plots to reveal the relationship between vegetation change and influential variables [55,56].
3. Results
3.1. Vegetation Coverage Dynamic Change
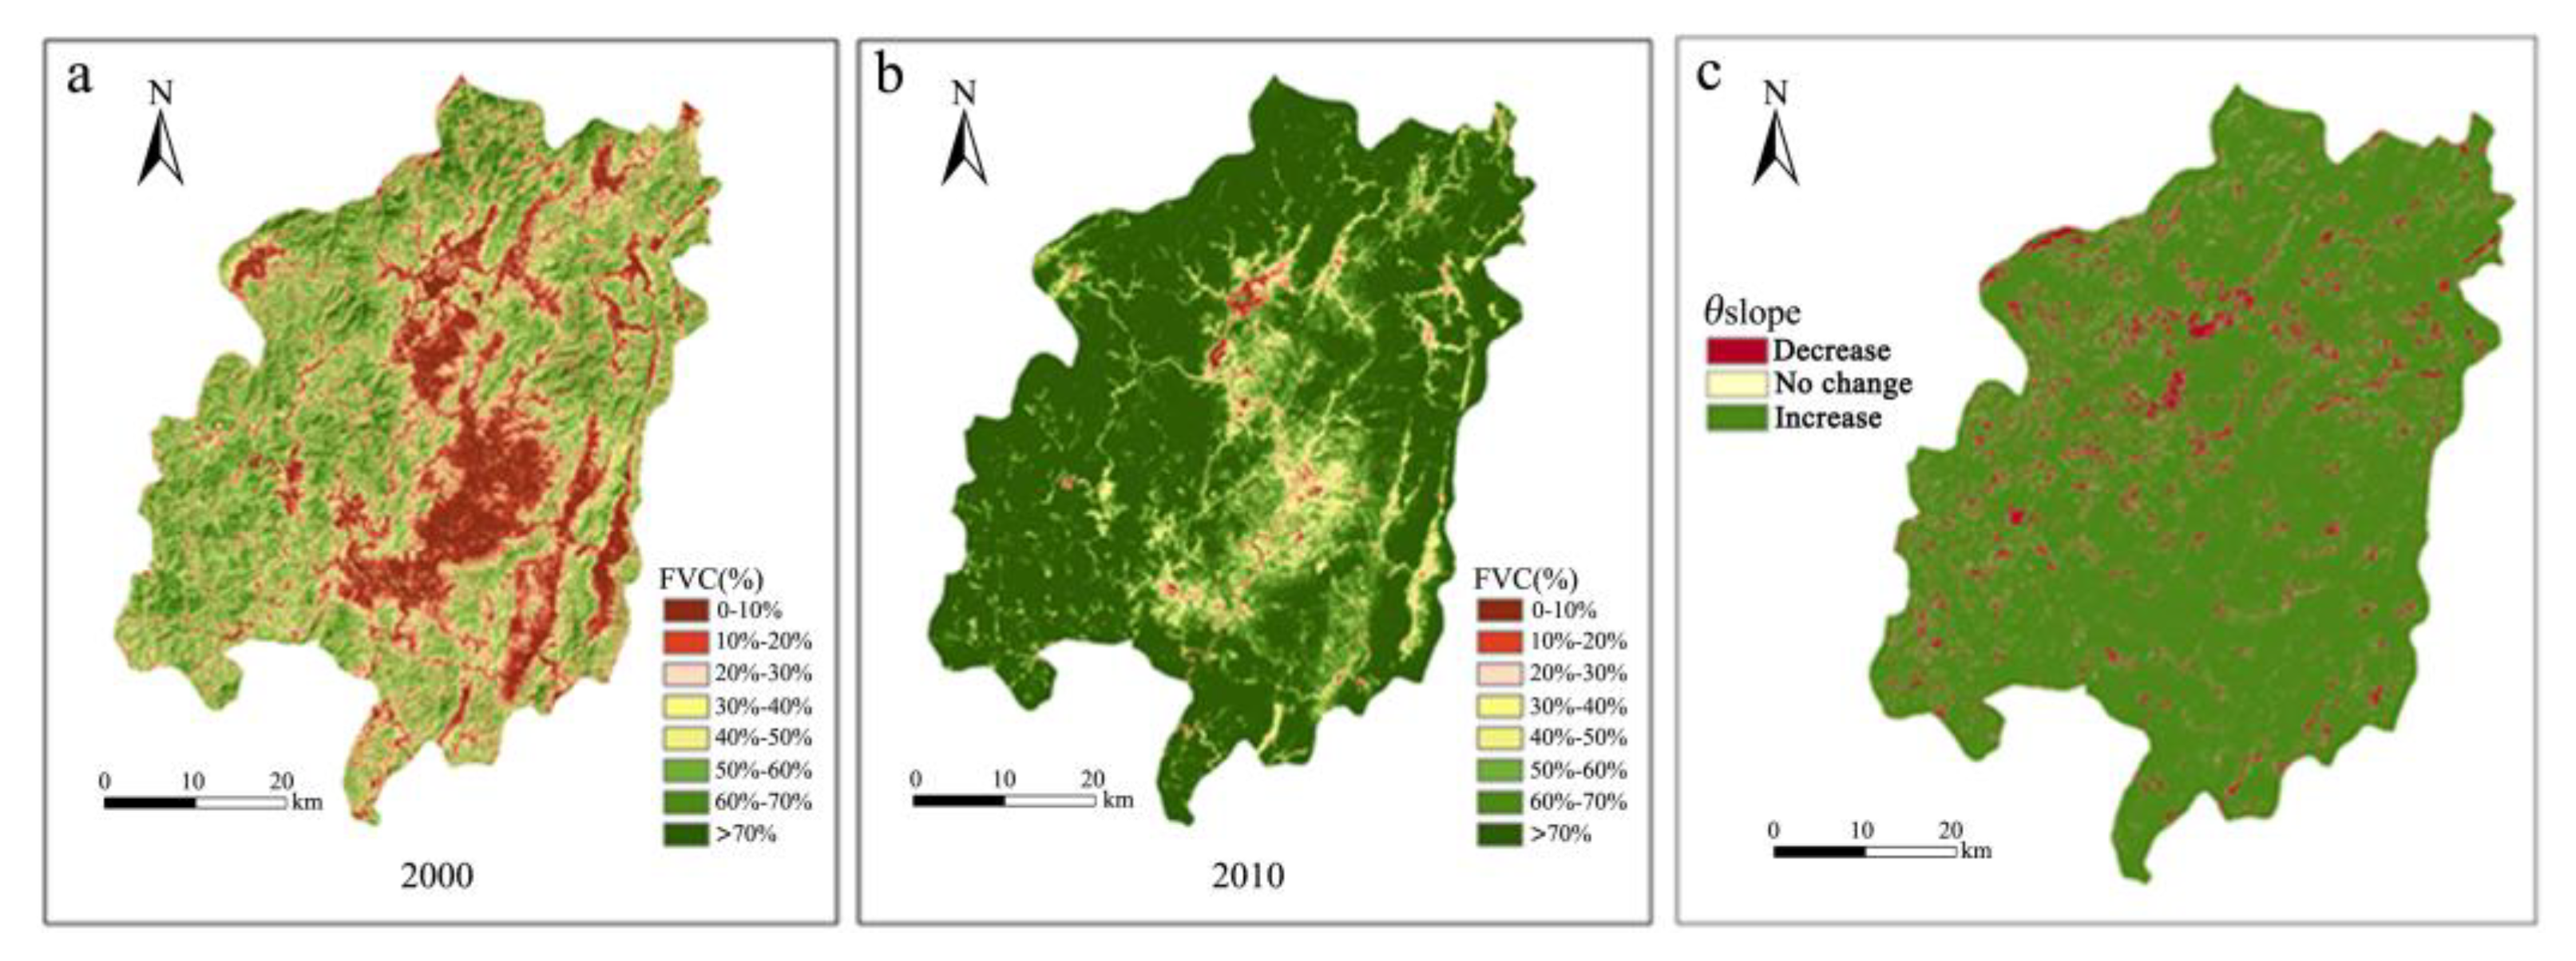
The FVC of Changting in 2000, 2010 and the overall change from 2000–2010 are shown in Figure 2a–c, respectively. There was a dramatic increase in the FVC from 2000 to 2010. In 2000, fractional vegetation cover was mainly below 30%, and the lowest FVC values were concentrated in the middle of Changting, the main mining area. The FVC of Changting had significantly improved by 2010, in which most of areas had high FVC (>50%). However, compared to other regions, the recovery rate of FVC in the middle area of Changting was relatively slow, mainly because the soil texture was severely damaged by mining activities and would take more time to recover. The trend line analysis for FVC of Changting over the 2000–2010 period showed that the percentages of increase, no-change and decrease were 87.86%, 5.04% and 7.10%, respectively, the change slopes were 0.142, 0.0007 and −0.0073 and the average change slope of FVC of Changting was 0.134 (Table 2).
3.2. Variable Importance Measurement
3.2.1. Multiple Linear Regression
After testing for multicollinearity, all nineteen variables were included in the analysis. Cropping land-use, local fiscal expenditure and previous average temperature showed the highest importance in the MLR model followed by slope of the terrain, previous average precipitation and elevation. The density of settlements, roads, rivers and aspect factors had a low contribution to the MLR model (Table 3). The final model was built with 9 variables in the entire dataset. In the final model (R2 = 0.705, p < 0.0001, S.D. = 0.011), the rank of variable importance did not change with regards to the cropping land-use, local fiscal expenditure, previous average temperature and slope of the terrain (Table 4).
3.2.2. Random Forest
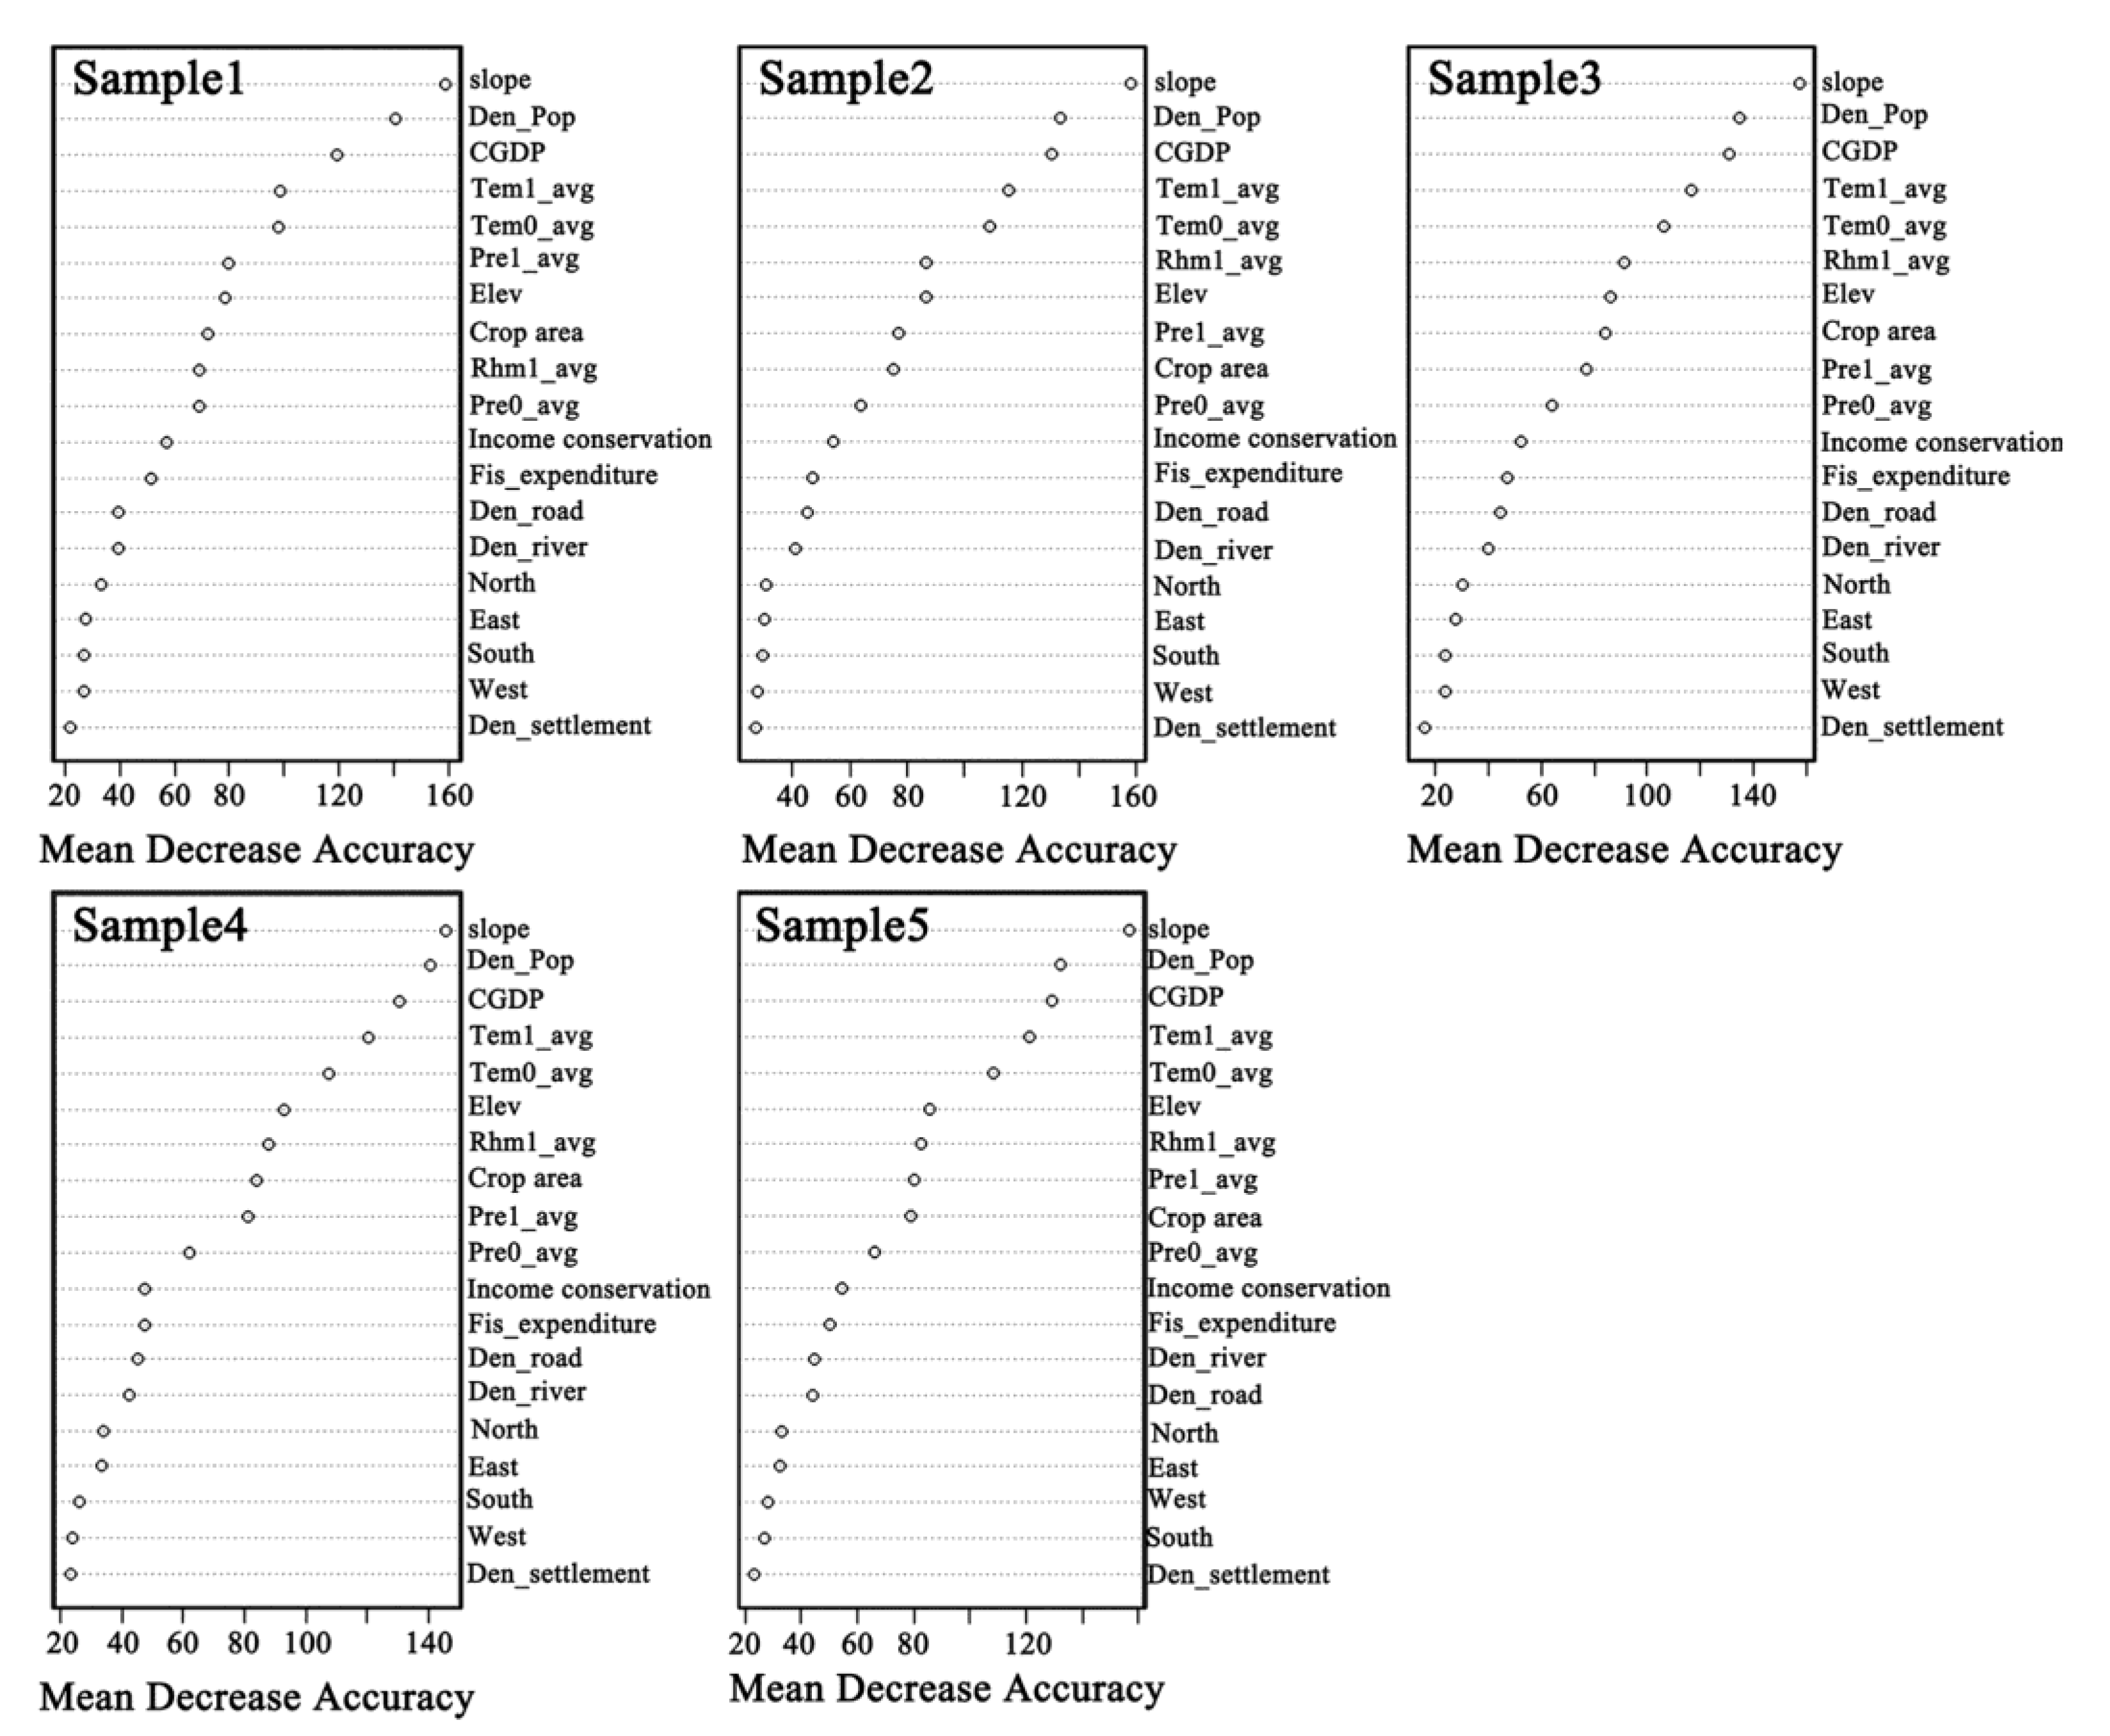
Since RF can overcome the influence of collinearity between explanatory variables, we used all nineteen variables to fit all sample data. The variable importance plots for the five samples showed a threshold of ca. 50% IncMSE above which the variables assumed higher importance (Figure 3). The average % IncMSE was calculated between all the samples, and the variables that showed an average IncMSE of 50% or higher were selected for the final model. The final model was built with the 12 variables shown in Table 5. In this model, the most important variables according to the values of % IncMSE were (in descending order): slope, population density, CGDP, average temperature, previous temperature, elevation, average relative humidity, cropping land-use, average precipitation, previous average precipitation, water conservation activities income and local fiscal expenditure.
3.3. Model Fitting Comparison
The adjusted R2 of each training sample and the correlation value between the observed and the predicted values for MLR are given in Table 6. The R2 values were around 0.70, and the correlation values were all above 0.84. The percent of variance explained with MLR final model was above 70%, and all the variables appeared as highly significant (p < 0.0001) in the intermediate models.
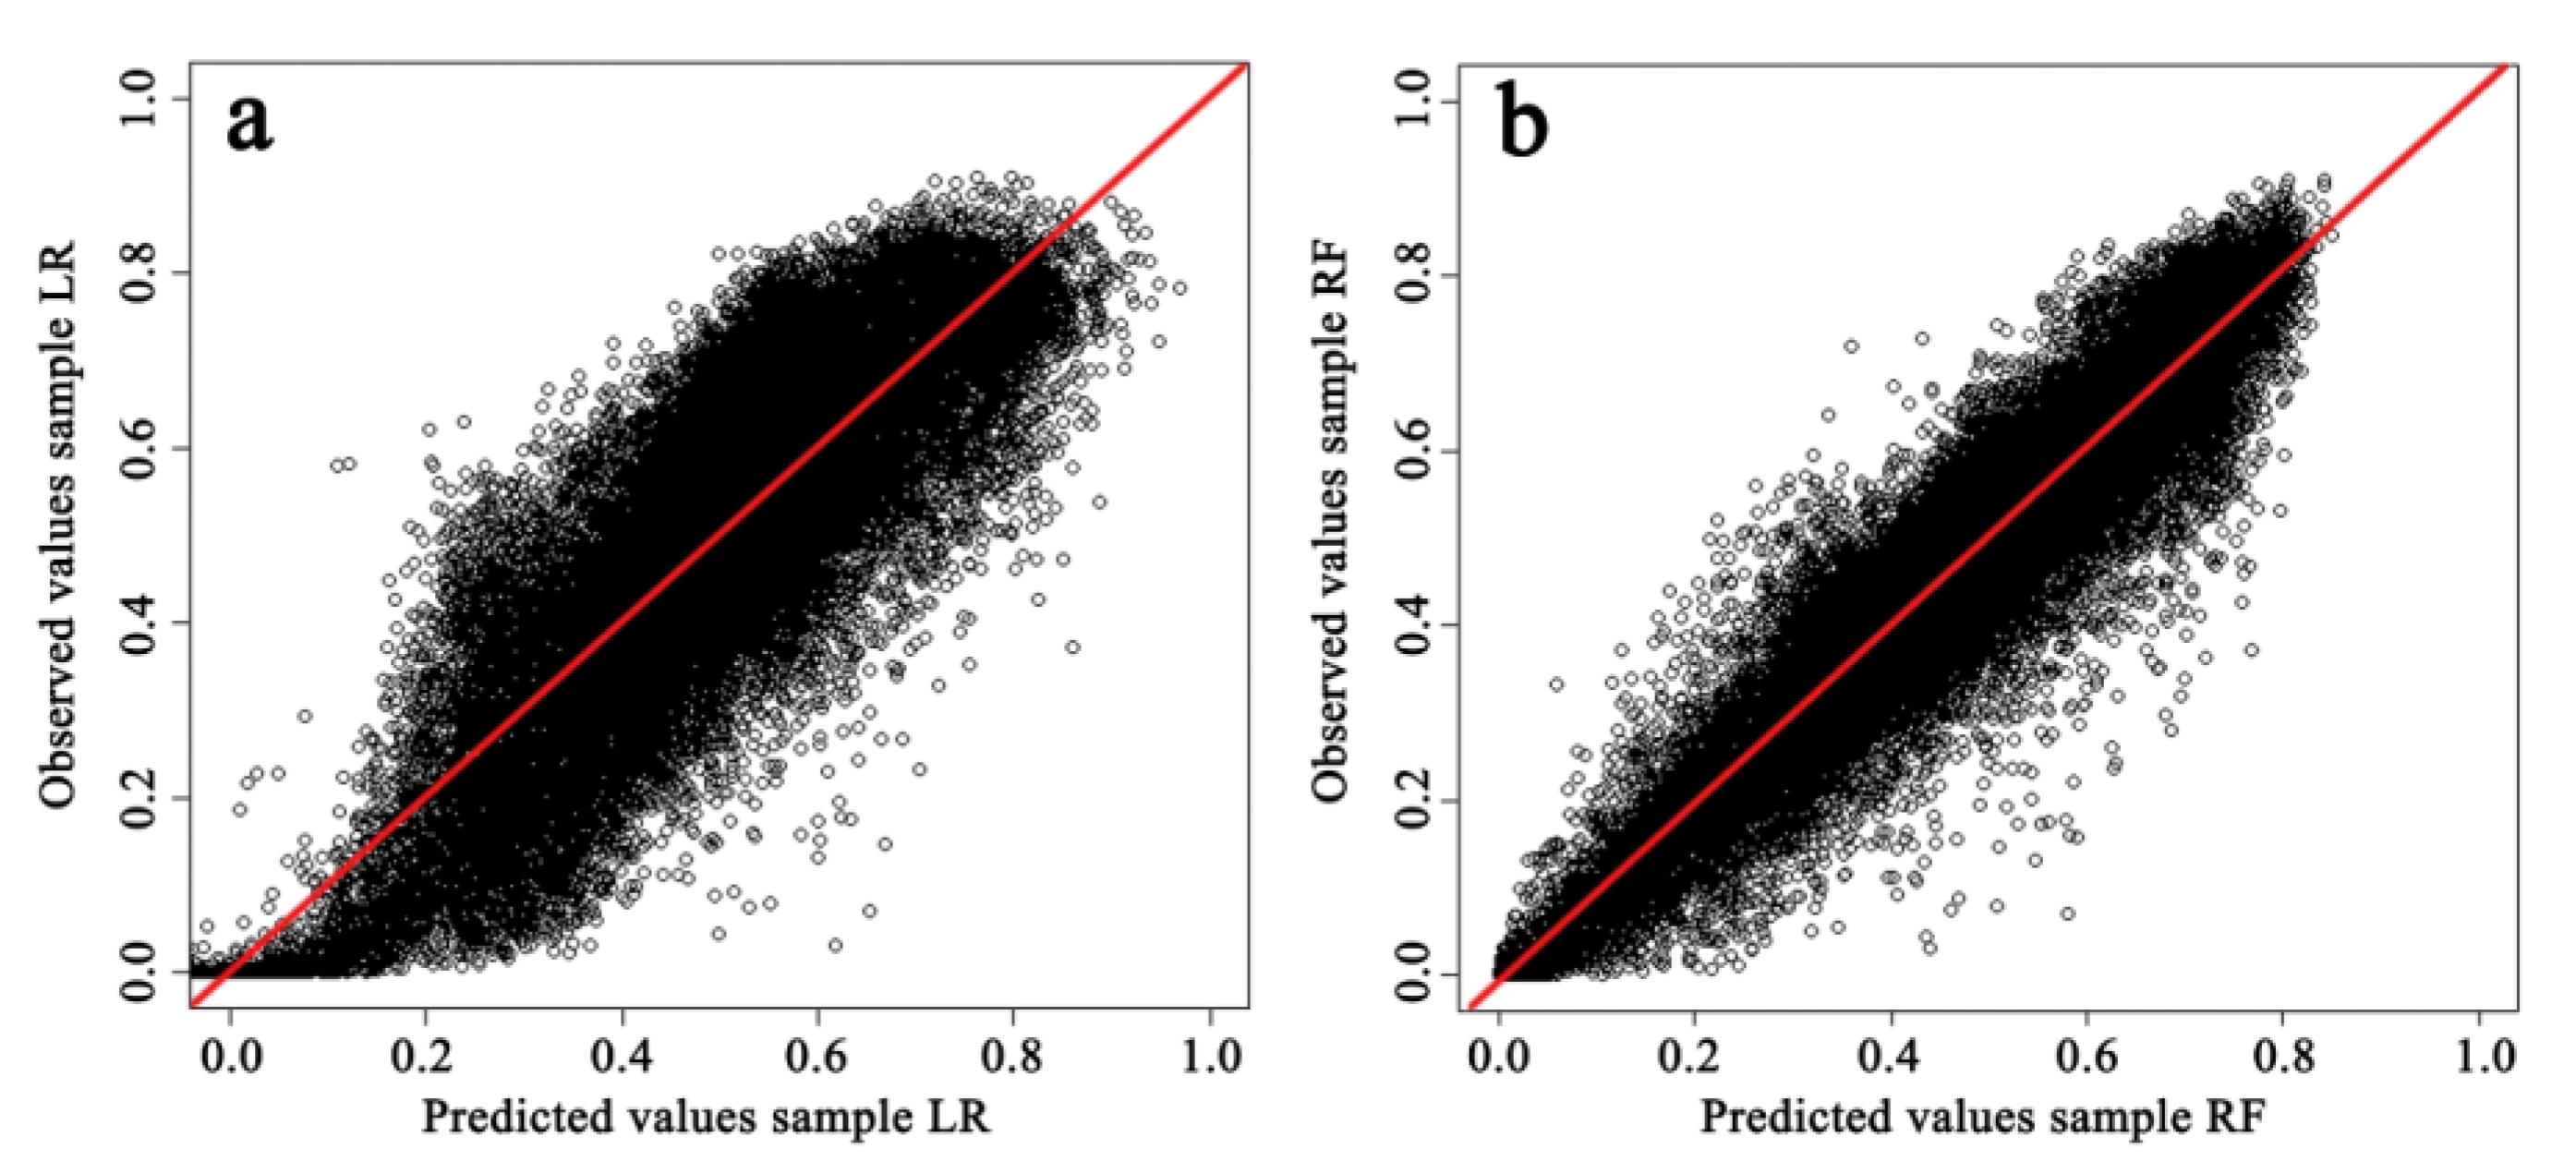
In contrast, RF modelling showed a proportion of explained variance between 87.7% and 89.1%, in both the training and validation datasets (Table 7). The correlation between the observed and the predicted values in the testing datasets is higher than 0.93 for all the samples. The distribution of the observed and predicted values of MLR is more discrete than that of the RF (Figure 4). It was also evident that the MLR might lead to more residuals in the explanation of vegetation cover change than RF.
3.4. Partial Dependence for Important Variables
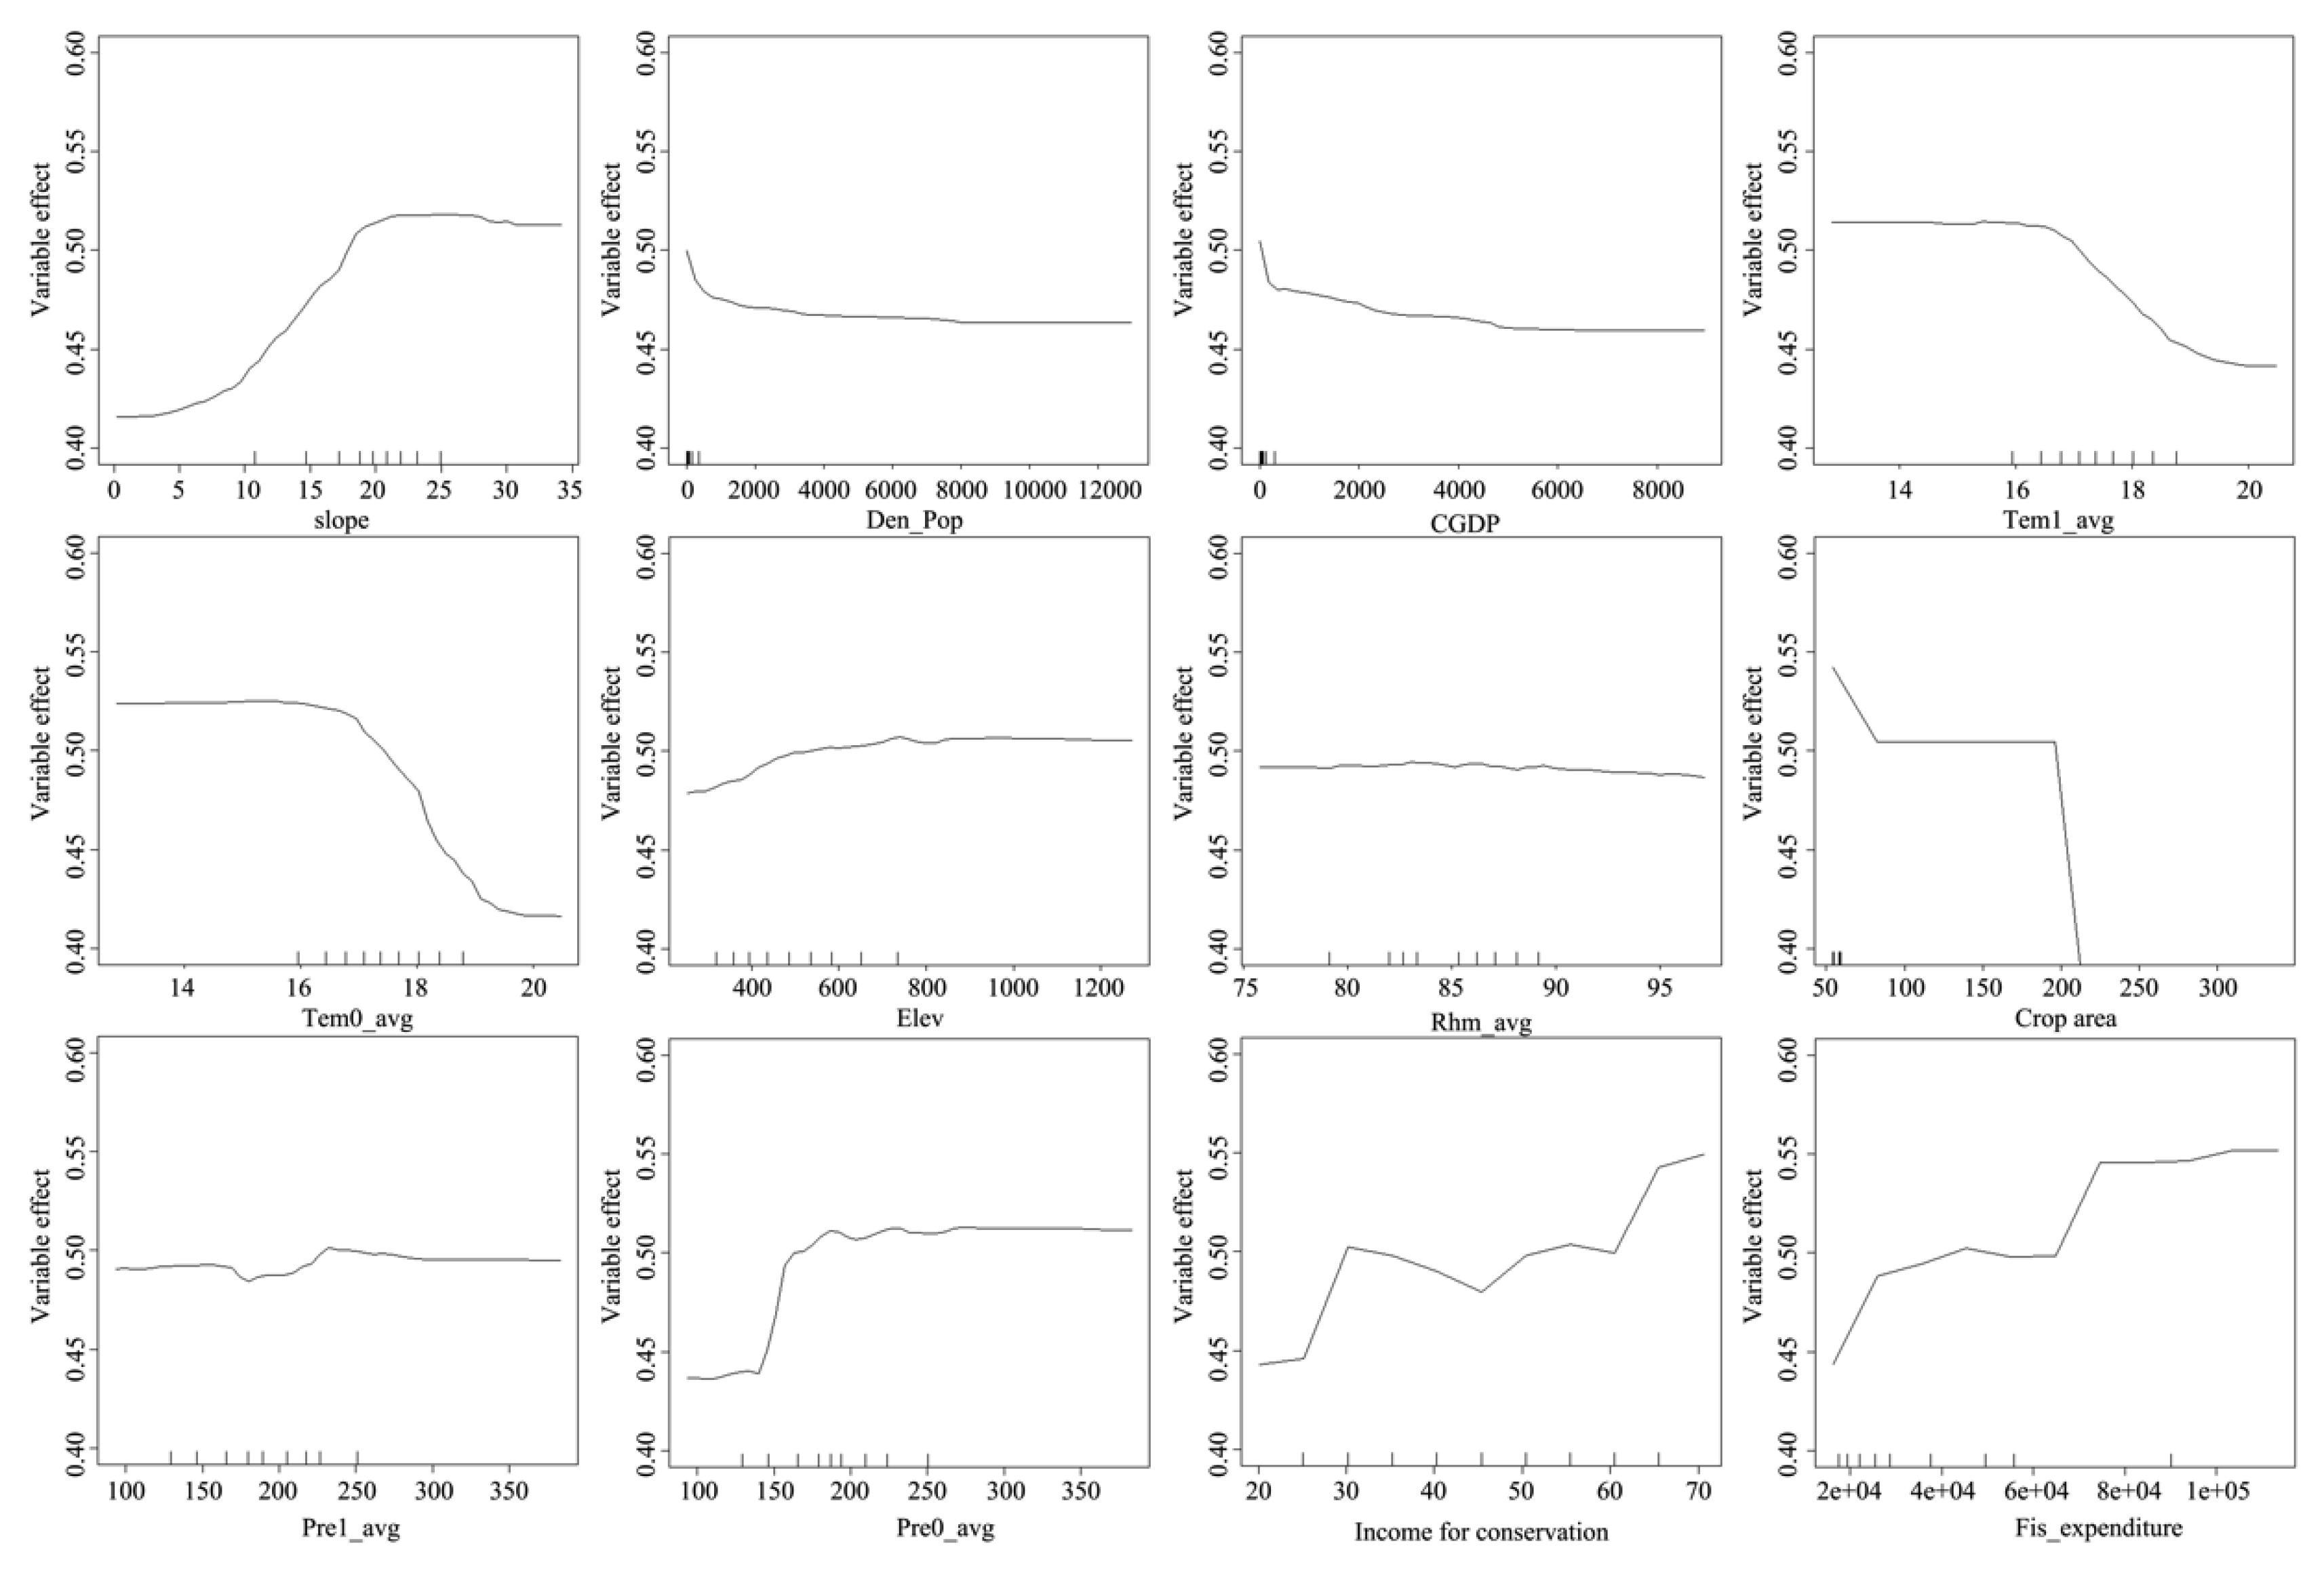
Partial dependence plots (Figure 5) reflected the relationship between the vegetation cover of Changting and its important influential factors including slope, elevation, previous and current average temperature, per capital GDP, cropping land use, previous annual average precipitation, local fiscal expenditure, and water conservation activities income in millions. The influence of slope on vegetation cover was gradually greater in the interval of 0–20 degree and then stabilized after 21 degrees (Figure 5). The previous and current average annual temperatures have a similar variable-effect trend. The greatest effective power occurred before 17 °C and then declined between 17–19 °C. The influence of the sown area of the agricultural crop on vegetation cover was greatest at 50 km2 and stabilized with increasing area until 200 km2, then sharply decreased after 200 km2. Compared to current precipitation, vegetation cover seemed more sensitive to the previous precipitation. After 100 mm, the variable effect of precipitation gradually increased and then stabilized after 250 mm. The local fiscal expenditure and water conservation activities income had a similar trend; the effective power improved as the value of the variables increased.
4. Discussion
Our results indicated the comprehensive influence of human, climatic, and topographic factors on the vegetation cover change of Changting during 2000–2010 as found in other Chinese regions [2,57,58]. We further analyzed the importance and influence of each variable on local vegetation change using MLR and RF models. The RF is better than the MLR in estimation the vegetation change, and ten variables were determined as important driving factors in both methods. Of these factors, precipitation and temperature were identified as important climate factors influential vegetation dynamic of Changting, which is in line with findings from earlier studies [34,59]. Additionally, our study indicated the importance of previous precipitation and temperature on vegetation cover change, which is supported by other studies [60,61]. Consistent with our study, Wang et al. [62] and Kaufmann et al. [63] concluded that compared to precipitation, temperature played a more important role in vegetation cover change in the southern region of China; however, a rapid increase of temperature will enhance evapotranspiration, inhibiting the growth of vegetation.
In addition to climate factors, topography, including elevation and slope also influence vegetation dynamics of Changting, which is consistent with other studies [64,65,66,67]. Elevation and slope can significantly influence the vegetation composition, distribution, and growth through soil moisture and fertility [68,69]. Pozzi and Small [70] and Traore et al. [71] revealed a negative correlation between NDVI and population densities. However, there are some opposing views; Fuller and Gaston [14] showed that there was a long-term inverted N-shaped curve relationship between population growth and vegetation cover in a region with frequent human activities and that the influence of climate change on vegetation cover changes was relatively small. Generally, increases in population density correspond to decreases in NDVI values [65]. In our study, population density is a significant variable in both MLR and RF models, indicating that local vegetation cover is related to the population dynamics.
Our study indicated that socio-economic factors including CGDP, water conservation activities income, and the agricultural crop area significantly influence vegetation dynamics. Some studies have pointed out that the relationship between GDP growth and NDVI is U-shaped, suggesting that land degradation first declines as GDP increases and then increases beyond a threshold [65]. According to our MLR model, CGDP is negatively related to vegetation cover in Changting, which is consistent with other studies [40,72]. In the RF model, CGDP showed significant importance for vegetation change, ranking number two among all variables. Past studies revealed that agricultural intensification, represented by crop area in this study, could slow down the conversion of forest land into agricultural land (corresponding to an observed increase in NDVI) [73]. Our study identified the importance of the crop area change on vegetation cover in Changting based on two models. Furthermore, MLR concluded a negative relationship between NDVI and crop area.
The financial investment in soil and water conservation, representing government effectiveness, significantly improved the vegetation cover of Changting. Similarly, Nkonya et al. [65] concluded that greater government effectiveness is associated with higher NDVI values. In the past decades, the Chinese central government and local governments have made tremendous efforts and invested a large amount of money in ecology restoration through afforestation and reforestation, which directly influenced the vegetation cover in many regions [74,75,76], such as Changting. National policies have a large impact on land management practices and could have a direct or indirect impact on land users’ behavior. For example, the government encouraged the construction of infrastructure for the production and use of methane-generation facilities for local residents in order to decrease the demands of fuel wood. In addition, the government provided compensation to encourage the planting of fruit trees, which incentivized farmers to protect the trees [27]. Further, local institutions are important drivers of land management practices. Strong local institutions with a capacity for land management are likely to enact bylaws and other regulations that could enhance sustainable land management practices [9]. In 2000, the county’s government began testing a new development policy that was designed to promote both environmental conservation and poverty reduction. Under this policy, provinces provided annual compensation to individual households in areas that were experiencing the heaviest soil erosion. To compensate residents for their inability to harvest trees for fuel, subsidies were provided to farmers who stopped cutting vegetation [12,27]. Local governments also encouraged the development of animal husbandry and fisheries by providing compensation to residents, which are more sustainable alternatives to environmentally damaging activities such as tree harvesting and selling firewood and timber. However, it is worth noticing that, although the overall vegetation cover of Changting showed a significant increase from 2000 to 2010, there is about 7% of the area experiencing a low rate of degradation scattered throughout the study area. This is because the long-term soil erosion causes the soil surface to be extremely barren, which combined with the high-intensity rainfall, accelerates the loss of soil and makes vegetation recovery very difficult. This indicates the arduousness of vegetation restoration in Changting in the future, and more measures, effort and continuous policy support are needed.
5. Conclusions
Our study provides a novel quantitative methodology through the use of Random Forest and Multi-linear Regression Models for ranking the main drivers of vegetation cover dynamics in Changting County. We found that climatic factors along with the strict implementation of government policies as well as socio-economic enhancement of the stakeholder`s livelihood played a role in driving vegetation cover dynamics. The results of the study indicate that a thorough assessment of vegetation cover dynamics in an ecosystem with a strong anthropogenic signature requires the simultaneous consideration of environmental and socio-economic factors. Factors such as precipitation, temperature, elevation, slope, financial investment for soil and soil conservation and subsidies for local community should be given prior consideration in environmental policies.
Author Contributions
X.M., F.G., and W.W. conceived, designed, and coordinated the research; W.W. performed the research; W.W. and S.M.N. analyzed the data; C.T. contributed to data collection and organization. W.W. and F.G. led the writing of the paper, with assistance from all co-authors.
Acknowledgments
The research was funded by the National Key Technology R&D Program, China (2014BAD15B02). This research was financially funded by the Fujian Agriculture and Forestry University Funds for Distinguished Young Scholar (xjq201613) and the International Science and Technology Cooperation Program of Fujian Agriculture and Forestry University (KXB16008A).
Conflicts of Interest
The authors declare no conflict of interest. The founding sponsors had no role in the design of the study; in the collection, analyses, or interpretation of data; in the writing of the manuscript, and in the decision to publish the results.
References
- Piao, S.L.; Fang, J.Y.; Zhou, L.M.; Guo, Q.H.; Henderson, M.; Ji, W.; Li, Y.; Tao, S. Interannual variations of monthly and seasonal normalized difference vegetation index (NDVI) in China from 1982 to 1999. J. Geophys. Res. 2003, 108. [Google Scholar] [CrossRef]
- Piao, S.L.; Mohammat, A.; Fang, J.Y.; Cai, Q.; Feng, J.M. NDVI-based increase in growth of temperate grasslands and its responses to climate changes in China. Glob. Environ. Chang. 2006, 16, 340–348. [Google Scholar] [CrossRef]
- Fitter, A.H.; Fitter, R.S.R. Rapid changes in flowering time in British plants. Science 2002, 296, 1689–1692. [Google Scholar] [CrossRef] [PubMed]
- Nemani, R.R.; Keeling, C.D.; Hirofumi, H.; Jolly, W.M.; Piper, S.C.; Tucker, C.J.; Myneni, R.B.; Running, S.W. Climate-driven increases in global terrestrial net primary production from 1982 to 1999. Science 2003, 300, 1560–1563. [Google Scholar] [CrossRef] [PubMed]
- Brown, M.E.; Beurs, K.M.D.; Marshall, M. Global phenological response to climate change in crop areas using satellite remote sensing of vegetation, humidity and temperature over 26 years. Remote Sens. Environ. 2012, 126, 174–183. [Google Scholar] [CrossRef]
- Schulz, J.J.; Luis, C.; Rey-Benayas, J.M.; Boris, S. Factors influencing vegetation cover change in Mediterranean Central Chile (1975–2008). Appl. Veg. Sci. 2011, 14, 571–582. [Google Scholar] [CrossRef]
- Harini, N. Drivers of reforestation in human-dominated forests. Proc. Natl. Acad. Sci. USA 2007, 104, 15218–15223. [Google Scholar] [Green Version]
- Wang, C.; Yang, Y.; Zhang, Y. Economic development, rural livelihoods, and ecological restoration: Evidence from China. Ambio J. Hum. Environ. 2011, 40, 78–87. [Google Scholar] [CrossRef]
- Sasaki, N.; Takahara, H. Late Holocene human impact on the vegetation around Mizorogaike Pond in northern Kyoto Basin, Japan: A comparison of pollen and charcoal records with archaeological and historical data. J. Archaeol. Sci. 2011, 38, 1199–1208. [Google Scholar] [CrossRef]
- Olson, K.C.; Sindelar, B.W. Response of Vegetation of the Northern Great Plains to Precipitation Amount and Grazing Intensity. J. Range Manag. 1985, 38, 357–361. [Google Scholar] [CrossRef]
- Dai, S.P.; Zhang, B.; Wang, H.J.; Wang, Y.M.; Guo, L.X.; Wang, X.M. Vegetation cover change and the driving factors over northwest China. J. Arid Land 2011, 3, 25–33. [Google Scholar]
- Wang, C.; Yang, Y.; Zhang, Y. Cost-effective targeting soil and water conservation: A case study of Changting county in southeast China. Land Degrad. Dev. 2016, 27, 387–394. [Google Scholar] [CrossRef]
- Wang, K.; Zhang, L.; Qiu, Y.; Ji, L.; Tian, F. Snow effects on alpine vegetation in the Qinghai-Tibetan Plateau. Int. J. Digit. Earth 2013, 8, 56–73. [Google Scholar] [CrossRef]
- Fuller, R.A.; Gaston, K.J. The scaling of green space coverage in European cities. Biol. Lett. 2009, 5, 352–355. [Google Scholar] [CrossRef] [PubMed] [Green Version]
- Geist, H.J.; Lambin, E.F. Proximate Causes and Underlying Driving Forces of Tropical Deforestation. Bioscience 2002, 52, 143–150. [Google Scholar] [CrossRef]
- Yang, X.; Zhong, B.; Xie, X. Soil Erosion and Conservation in Red-Soil Hill Area; China Agricultural Press: Beijing, China, 2005. [Google Scholar]
- Chen, Z. Desertification induced by water erosion and its combat of Hetian town in Changding County, Fujian province. Prog. Geogr. 1998, 64, 834–841. [Google Scholar]
- Zeng, J.; Zhong, B. Historical changes in strategies to control soil and water erosion in Changting County. Fujian Soil Water Conserv. 2002, 14, 37–39. [Google Scholar]
- Zhou, W.; Wang, X.; Wu, Z.; Liu, Y. Spatio-temporal variation of the soil and water loss in Changting County of granite red soil eroded area of southern China from 1988 to 2013. Sci. Soil Water Conserv. 2016, 14, 49–58. [Google Scholar]
- Echeverria, C.; Coomes, D.; Salas, J.; Rey-Benayas, J.M.; Lara, A.; Newton, A. Rapid deforestation and fragmentation of Chilean Temperate Forests. Biol. Conserv. 2006, 130, 481–494. [Google Scholar] [CrossRef]
- Syphard, A.D.; Radeloff, V.C.; Keuler, N.S.; Taylor, R.S.; Hawbaker, T.J.; Stewart, S.I.; Clayton, M.K. Predicting spatial patterns of fire on a southern California landscape. Int. J. Wildl. Fire 2008, 17, 602–613. [Google Scholar] [CrossRef]
- Guo, F.; Su, Z.; Tigabu, M.; Yang, X.; Lin, F.; Liang, H.; Wang, G.; Fetting, C.J.; Martin, T.A. Spatial modelling of fire drivers in urban-forest ecosystems in China. Forests 2017, 8, 180. [Google Scholar] [CrossRef]
- Breiman, L. Random Forest. Mach. Learn. 2001, 45, 5–32. [Google Scholar] [CrossRef]
- Oliveira, S.; Oehler, F.; San-Miguel-Ayanz, J.; Camia, A.; Pereira, J.M.C. Modeling spatial patterns of fire occurrence in Mediterranean Europe using Multiple Regression and Random Forest. For. Ecol. Manag. 2012, 275, 117–129. [Google Scholar] [CrossRef]
- Archibald, S.; Roy, D.P.; Wilgen, B.W.V.; Scholes, R.J. What limits fire? An examination of drivers of burnt area in southern Africa. Glob. Chang. Biol. 2009, 15, 613–630. [Google Scholar] [CrossRef]
- Cutler, A.; Cutler, D.R.; Stevens, J.R. Random Forests. Mach. Learn. 2011, 45, 157–176. [Google Scholar]
- Cao, S.; Zhong, B.; Yue, H.; Zeng, H.; Zeng, J. Development and testing of a sustainable environmental restoration policy on eradicating the poverty trap in China’s Changting County. Proc. Natl. Acad. Sci. USA 2009, 106, 10712–10716. [Google Scholar] [CrossRef] [PubMed]
- Wang, J.; Wang, K.; Zhang, M.; Zhang, C. Impacts of climate change and human activities on vegetation cover in hilly southern China. Ecol. Eng. 2015, 81, 451–461. [Google Scholar] [CrossRef]
- Wang, C.; Yang, Y.; Zhang, Y. Rural household livelihood change, fuel wood substitution, and hilly ecosystem restoration: Evidence from China. Renew. Sustain. Energy Rev. 2012, 16, 2475–2482. [Google Scholar] [CrossRef]
- Purevdor, T.; Tateishi, R.; Ishiyama, T.; Honda, Y. Relationships between percent vegetation cover and vegetation indices. Int. J. Remote Sens. 1998, 19, 3519–3535. [Google Scholar] [CrossRef]
- Tong, S.; Zhang, J.; Si, H.; Lai, Q.; Ma, Q. Dynamics of fractional vegetation coverage and its relationship with climate and human activities in Inner Mongolia, China. Remote Sens. 2016, 8, 776. [Google Scholar] [CrossRef]
- Gutam, G.; Ignatov, A. The derivation of the green vegetation fraction from NOAA/AVHRR Data for use in numerical weather prediction models. Int. J. Remote Sens. 1997, 19, 1533–1543. [Google Scholar]
- Liu, C.L.; Fan, R.H.; Wu, J.J.; Yan, F. Temporal lag of grassland vegetation growth response to precipitation in Xilinguolemeng. J. Arid Land 2009, 32, 512–518. [Google Scholar]
- Dai, L.; Zhang, L.; Wang, K.; Wang, R.L. Response of Vegetation to Climate Change in the Drylands of East Asia. Earth Environ. Sci. 2014, 17, 682–691. [Google Scholar] [CrossRef]
- Myneni, R.B.; Keeling, C.D.; Tucker, C.J.; Asrar, G.; Nemani, R.R. Increased Plant Growth in the Northern High Latitudes from 1981 to 1991. Nature 1997, 386, 698–702. [Google Scholar] [CrossRef]
- Chen, X.; Hu, B.; Yu, R. Spatial and temporal variation of phenological growing season and climate change impacts in temperate eastern China. Glob. Chang. Biol. 2005, 11, 1118–1130. [Google Scholar] [CrossRef]
- Chang, C.T.; Wang, H.C.; Huang, C. Impacts of vegetation onset time on the net primary productivity in a mountainous island in Pacific Asia. Environ. Res. Lett. 2013, 8, 925–932. [Google Scholar] [CrossRef]
- Luck, G.W.; Smallbone, L.T.; O’Brien, R. Socio-economics and vegetation change in urban ecosystems: Patterns in space and time. Ecosystems 2009, 12, 604–620. [Google Scholar] [CrossRef]
- Liu, Y.; Wang, Y.; Peng, J.; Du, Y.; Liu, X.; Li, S.; Zhang, D. Correlations between urbanization and vegetation degradation across the world’s metropolises using DMSP/OLS nighttime light data. Remote Sens. 2015, 7, 2067–2088. [Google Scholar] [CrossRef]
- Han, G.F.; Xu, J.H. Influence of population and economic development on vegetation—A case study in Chongqing city. Resour. Environ. Yangtze Basin 2008, 17, 785–792. [Google Scholar]
- Stow, D.; Daeschner, S.; Hope, A.; Douglas, D.; Petersen, A.; Myneni, R.; Zhou, L.; Oechel, W. Variability of the seasonally integrated normalized difference vegetation index across the north slope of Alaska in the 1990s. Int. J. Remote Sens. 2003, 24, 1111–1117. [Google Scholar] [CrossRef]
- Feidas, H.; Makrogiannis, T.; Borasenta, E. Trend analysis of air temperature time series in Greece and their relationship with circulation using surface and satellite data: 1955–2001. Theor. Appl. Climatol. 2004, 79, 185–208. [Google Scholar] [CrossRef]
- R Core Team. R: A Language and Environment for Statistical Computing; R Foundation for Statistical Computing: Vienna, Austria, 2012. [Google Scholar]
- Guo, F.T.; Selvalakshmi, S.; Lin, F.F.; Wang, G.Y.; Wang, W.H.; Su, Z.W.; Liu, A.Q. Geospatial information on geographical and human factors improved anthropogenic fire occurrence modeling in the Chinese boreal forest. Can. J. For. Res. 2016, 46, 582–594. [Google Scholar] [CrossRef] [Green Version]
- Wu, W.; Zhang, L.J. Comparison of spatial and non-spatial logistic regression models for modeling the occurrence of cloud cover in northeastern Puerto Rico. Appl. Geogr. 2013, 37, 52–62. [Google Scholar] [CrossRef]
- Graham, M.H. Confronting multicollinearity in ecological multiple regression. Ecology 2003, 84, 2809–2815. [Google Scholar] [CrossRef]
- Gromping, U. Relative Importance for Linear Regression in R: The Package relaimpo. J. Stat. Softw. 2006, 17, 925–933. [Google Scholar] [CrossRef]
- Lindeman, R.H.; Merenda, P.F.; Gold, R.Z. Introduction to Bivariate and Multivariate Analysis; Scott Foresman: Glenview, IL, USA, 1980; Volume 76, pp. 375–380. [Google Scholar]
- Mikelbank, B.A. Quantitative Geography: Perspectives on Spatial Data Analysis, by A. S. Fotheringham, C. Brunsdon, and M. Charlton. Geogr. Anal. 2001, 33, 370–372. [Google Scholar] [CrossRef]
- Prasad, A.M.; Iverson, L.R.; Liaw, A. Newer Classification and Regression Tree Techniques: Bagging and Random Forests for Ecological Prediction. Ecosystems 2006, 9, 181–199. [Google Scholar] [CrossRef]
- Duro, D.C.; Franklin, S.E.; Dube, M.G. Multi-scale object-based image analysis and feature selection of multi-sensor earth observation imagery using random forests. Int. J. Remote Sens. 2012, 33, 4502–4526. [Google Scholar] [CrossRef]
- Abdel-Rahman, E.M.; Ahmed, F.B.; Ismail, R. Random forest regression and spectral band selection for estimating sugarcane leaf nitrogen concentration using EO-1 Hyperion hyperspectral data. J. Remote Sens. 2013, 34, 712–728. [Google Scholar] [CrossRef]
- Marston, C.G.; Danson, F.M.; Armitage, R.P.; Giraudoux, P.; Pleydell, D.R.J.; Wang, Q.; Qui, J.M.; Craig, P.S. A random forest approach for predicting the presence of Echinococcus multilocularis intermediate host Ochotona spp. presence in relation to landscape characteristics in western China. Appl. Geogr. 2014, 55, 176–183. [Google Scholar] [CrossRef] [PubMed]
- Genuer, R.; Poggi, J.M.; Tuleau-Malot, C. Variable selection using random forests. Pattern Recognit. Lett. 2010, 31, 2225–2236. [Google Scholar] [CrossRef] [Green Version]
- Hastie, T.J.; Tibshirani, R.J.; Friedman, J.H. The Elements of Statistical Learning; Springer: New York, NY, USA, 2000. [Google Scholar]
- Cutler, D.R.; Edwards, T.J.; Beard, K.H.; Cutler, A.; Hess, K.T.; Gibson, J.; Lawler, J.J. Random forests for classification in ecology. Ecology 2007, 88, 2783–2792. [Google Scholar] [CrossRef] [PubMed]
- Zhou, X.Y.; Shi, H.D.; Wang, X.R. Impact of Climate Change and Human Activities on Vegetation Coverage in the Mongolian Plateau. Arid Zone Res. 2014, 31, 604–610. [Google Scholar]
- Li, S.; Yang, S.; Liu, X.; Liu, Y.; Shi, M. NDVI-Based Analysis on the Influence of Climate Change and Human Activities on Vegetation Restoration in the Shaanxi-Gansu-Ningxia Region, Central China. Remote Sens. 2015, 7, 11163–11182. [Google Scholar] [CrossRef] [Green Version]
- He, B.; Chen, A.; Wang, H.; Wang, Q. Dynamic Response of Satellite-Derived Vegetation Growth to Climate Change in the Three North Shelter Forest Region in China. Remote Sens. 2015, 7, 9998–10016. [Google Scholar] [CrossRef] [Green Version]
- Swemmer, A.M.; Knapp, A.K.; Snyman, H.A. Intra-seasonal precipitation patterns and above-ground productivity in three perennial grasslands. J. Ecol. 2007, 95, 780–788. [Google Scholar] [CrossRef] [Green Version]
- Sherry, R.; Arnone, J.A., III; Johnson, D.W.; Schimel, D.S.; Verburg, P.S.; Wallace, L.L.; Luo, Y.Q. Lagged effects of experimental warming and doubled precipitation on annual and seasonal aboveground biomass production in a tallgrass prairie. Glob. Chang. Biol. 2008, 14, 2923–2936. [Google Scholar] [CrossRef]
- Wang, J.; Meng, J.J.; Cai, Y.L. Assessing vegetation dynamics impacted by climate change in the southwestern karst region of China with AVHRR NDVI and AVHRR NPP time-series. Environ. Geol. 2008, 54, 1185–1195. [Google Scholar] [CrossRef]
- Kaufmann, R.K.; Zhou, L.; Myneni, R.B.; Tucker, C.J.; Slayback, D.; Shabanov, N.V.; Pinzon, J. The effect of vegetation on surface temperature: A statistical analysis of NDVI and climate data. Geophys. Res. Lett. 2003, 30, 2147–2151. [Google Scholar] [CrossRef]
- Nie, Q.; Xu, J. The relationship between vegetation coverage and climate elements in Yellow River Basin, China. PeerJ. 2013. [Google Scholar] [CrossRef]
- Nkonya, E.; Gerber, N.; Baumgartner, P.; Braun, V.J.; Pinto, D.A.; Graw, V.; Kato, E.; Kloos, J.; Walter, T. The Economics of Desertification, Land Degradation, and Drought toward an Integrated Global Assessment. Social Science Electronic Publishing. 2011. Available online: https://ideas.repec.org/p/ags/ubzefd/109326.html (accessed on 20 May 2018).
- Xin, Z.B.; Xu, J.X. Spatial and temporal evolution of vegetation cover in the Loess Plateau and its response to climate change. Prog. Nat. Sci. 2007, 17, 770–778. [Google Scholar]
- Mehrjardi, R.T.; Akbarzadeh, A.; Biniyaz, M.; Mahmoodi, S.; Chahouki, M.A.Z. Studying the effect of elevation and edaphic variables on vegetation composition in Khezrabad 579 rangelands using principal component analysis (PCA). Analele Univ. Oradea Fascicula Biologie 2009, 16, 155–161. [Google Scholar]
- Volařík, D. Application of digital elevation model for mapping vegetation tiers. J. For. Sci. 2010, 56, 112–120. [Google Scholar] [CrossRef] [Green Version]
- Bernhardt-Römermann, M.; Stadler, J. Functional traits and local environment predict vegetation responses to disturbance: A pan-European multi-site experiment. J. Ecol. 2011, 99, 777–787. [Google Scholar] [CrossRef]
- Pozzi, F.; Small, C. Vegetation and population density in urban and suburban areas in the USA. In Proceedings of the Third International Symposium of Remote Sensing of Urban Areas, Istanbul, Turkey, 11–13 June 2002; Volume 3, pp. 489–496. [Google Scholar]
- Traore, S.S.; Forkuo, E.K.; Pierre, C.S.; Landmann, T.T. Assessing the inter-relationship between vegetation productivity, rainfall, population and land cover over the Bani River Basin in Mali (West Africa). IOSR J. Eng. 2015, 5, 10–18. [Google Scholar]
- Bonan, G.B. Effects of Land Use on the Climate of the United States. Clim. Chang. 1997, 37, 449–486. [Google Scholar] [CrossRef]
- Bürgi, M.; Hersperger, A.M.; Schneeberger, N. Driving forces of landscape change-current and new directions. Landsc. Ecol. 2004, 19, 857–868. [Google Scholar] [CrossRef]
- Deng, L.; Shangguan, Z.P.; Rui, L.I. Effects of the grain-for-green program on soil erosion in China. Int. J. Sediment Res. 2012, 27, 120–127. [Google Scholar] [CrossRef]
- Wu, Z.; Wu, J.; Liu, J.; He, B.; Lei, T.; Wang, Q. Increasing terrestrial vegetation activity of ecological restoration program in the Beijing–Tianjin Sand Source Region of China. Ecol. Eng. 2013, 52, 37–50. [Google Scholar] [CrossRef]
- Cai, H.; Yang, X.; Wang, K.; Xiao, L. Is forest restoration in the southwest china karst promoted mainly by climate change or human-induced factors? Remote Sens. 2014, 6, 9895–9910. [Google Scholar] [CrossRef]
Figure 1.
The location of the study.

Figure 2.
FVC in the 2000 (a) and 2010 (b) and the fractional vegetation cover change in Changting during 2000–2010 (c). FVC represents fractional vegetation cover.
Figure 2.
FVC in the 2000 (a) and 2010 (b) and the fractional vegetation cover change in Changting during 2000–2010 (c). FVC represents fractional vegetation cover.

Figure 3.
Plots of the variable importance measure for five samples. Note: the abbreviated variable names are the same as in Table 1.
Figure 3.
Plots of the variable importance measure for five samples. Note: the abbreviated variable names are the same as in Table 1.

Figure 4.
Plots of observed and predicted values calculated by Multiple Linear Regression (a) and Random Forest (b).
Figure 4.
Plots of observed and predicted values calculated by Multiple Linear Regression (a) and Random Forest (b).

Figure 5.
Partial dependence plots for variables predicting vegetation cover change, selected using Random Forest. Partial plots show the effect of each variable on vegetation cover change. Note: the abbreviated variable names are the same as in Table 1.
Figure 5.
Partial dependence plots for variables predicting vegetation cover change, selected using Random Forest. Partial plots show the effect of each variable on vegetation cover change. Note: the abbreviated variable names are the same as in Table 1.


Table 1.
Collected variables to be included as predictors in the model. The codes chosen may not include the whole description of the variable for simplicity purposes.
Table 1.
Collected variables to be included as predictors in the model. The codes chosen may not include the whole description of the variable for simplicity purposes.
| Variable Type | Variable Name | Minimum/Maximum | Unite | Code | Resolution/Scale | Source and Reference |
|---|---|---|---|---|---|---|
| Topographic | Elevation | 253/1270 | m | Elev | Raster/25 m | National Administration of Surveying, Mapping and Geoinformation of China, 2002 |
| Slope | 0/34 | ° | slope | Raster/25 m | ||
| North | 0/90 | % | North | Raster/25 m | ||
| West | 0/100 | % | West | Raster/25 m | ||
| East | 0/71 | % | East | Raster/25 m | ||
| South | 0/50 | % | South | Raster/25 m | ||
| Climatic | Average temperature (the year) | 13/20 | °C | Tem1_avg | Raster/1 km | A Statistical Downscaling Approach of NCEP/NCAR Reanalysis Temperature Data (J). Journal of Geo-Information Science, 2013, 15 (6). |
| Average precipitation (the year) | 93/383 | mm | Pre1_avg | Raster/1 km | ||
| Average relative humidity (the year) | 76/97 | % | Rhm1_avg | Raster/1 km | ||
| Average temperature (one year prior to the year) | 13/20 | °C | Tem0_avg | Raster/1 km | ||
| Average precipitation (one year prior to the year) | 93/380 | mm | Pre0_avg | Raster/1 km | ||
| Urbanization | Density road | 0/665,506 | m/km2 | Den_road | Vector/1:250,000 | National Administration of Surveying, Mapping and Geoinformation of China, 2002 |
| Density river | 0/578,622 | m/km2 | Den_river | Vector/1:250,000 | ||
| Density settlement | 0/1,000,000 | m2/km2 | Den_settlement | Vector/1:250,000 | ||
| Demographic | Density of population | 0/12,944 | Person/km2 | Den_Pop | Raster/1 km | Data Sharing Infrastructure of Earth System Science (http://www.geodata.cn/Portal/index.jsp), 2010 |
| Economic | Per capital GDP | 0/8938 | RMB/km2 | CGDP | Raster/1 km | |
| sown area of the crops | 54/338 | ha | Crop area | Global data | Fujian Provincial Burean of Statistics (http://www.stats-fj.gov.cn/) | |
| local fiscal expenditure | 16,296/113,395 | RMB | Fis_expenditure | Global data | ||
| Water conservation activities income | 20/71 | Million RMB | Income for conservation | Global data | Development and testing of a sustainable environmental restoration policy on eradicating the poverty trap in China’s Changting County, 2007 |
Table 2.
The percentage and rate of different types of FVC change of Changting during 2000–2010.
| Type of FVC Change | Percentage of Each Change Type (%) | Average θslope |
|---|---|---|
| Decrease | 7.10 | −0.0073 |
| No change | 5.04 | 0.0007 |
| Increase | 87.86 | 0.1423 |
Note: Average θslope was calculated based on Equation (2), representing the change trend of FVC of Changting during the period of 2000–2010.
Table 3.
The significance of variables in five intermediate models (p-value) and the variable importance based on lmg (%) in MLR. “No. sample sig.” represents the number of samples where each variable is significant.
Table 3.
The significance of variables in five intermediate models (p-value) and the variable importance based on lmg (%) in MLR. “No. sample sig.” represents the number of samples where each variable is significant.
| Variable | p-Value Min | p-Value Max | No. Sample Sig. | VIF | Lmg (%) |
|---|---|---|---|---|---|
| Crop area | <0.0001 | <0.0001 | 5 | 1.278 | 25.822 |
| Fis_expenditure | <0.0001 | <0.0001 | 5 | 1.355 | 18.352 |
| tem0_avg | <0.0001 | <0.0001 | 5 | 5.830 | 16.731 |
| slope | <0.0001 | <0.0001 | 5 | 2.058 | 11.352 |
| pre0_avg | <0.0001 | 0.210 | 2 | 1.810 | 9.059 |
| Elev | <0.0001 | <0.0001 | 5 | 6.468 | 6.025 |
| Tem1_avg | <0.0001 | <0.0001 | 5 | 5.912 | 6.024 |
| Rhm1_avg | <0.0001 | 0.365 | 1 | 2.368 | 1.472 |
| Den_Pop | <0.0001 | 0.092 | 4 | 1.702 | 1.390 |
| Pre1_avg | <0.0001 | <0.0001 | 5 | 2.520 | 1.214 |
| CGDP | <0.0001 | <0.0001 | 5 | 1.770 | 1.016 |
| Den_road | <0.0001 | 0.383 | 4 | 1.174 | 0.731 |
| Den_settlement | 0.129339 | 0.293 | 0 | 1.298 | 0.339 |
| Den_river | <0.0001 | <0.0001 | 5 | 1.015 | 0.338 |
| West | 0.005747 | 0.408 | 3 | 2.921 | 0.043 |
| East | 0.139433 | 0.980 | 0 | 2.840 | 0.042 |
| North | 0.0482 | 0.532 | 1 | 2.550 | 0.032 |
| South | 0.058775 | 0.777 | 0 | 2.253 | 0.019 |
Note: The abbreviated variable names are the same as in Table 1.
Table 4.
Results of the Multiple Linear Regression model with 9 selected variables.
| Variables | Estimate | Std. Error | t Value | Pr (>|t|) | Lmg (%) |
|---|---|---|---|---|---|
| Intercept | 0.4963 | 0.0006 | 844.3940 | p < 0.001 | |
| Crop area | −0.0815 | 0.0007 | −123.7490 | p < 0.001 | 25.63 |
| Fis_expenditure | 0.0767 | 0.0006 | 121.8950 | p < 0.001 | 24.24 |
| tem0_avg | −0.1354 | 0.0019 | −72.7350 | p < 0.001 | 15.53 |
| slope | 0.0472 | 0.0009 | 55.4600 | p < 0.001 | 11.27 |
| pre0_avg | −0.0020 | 0.0008 | −2.3890 | 0.0169 | 8.78 |
| Elev | −0.0478 | 0.0016 | −29.4130 | p < 0.001 | 5.89 |
| Tem1_avg | 0.0362 | 0.0019 | 19.4110 | p < 0.001 | 5.69 |
| Den_Pop | −0.0034 | 0.0007 | −4.5470 | p < 0.001 | 1.52 |
| CGDP | −0.00032 | 0.00001 | −16.432 | p < 0.001 | 1.32 |
Note: The abbreviated variable names are the same as in Table 1.
Table 5.
Variables that were included in the final model and the ranking of importance of variables (descending order) based on average % IncMSE from the five samples. Note: the variable name refers to Table 1.
Table 5.
Variables that were included in the final model and the ranking of importance of variables (descending order) based on average % IncMSE from the five samples. Note: the variable name refers to Table 1.
| Variables | Average Mean Decrease in Accuracy (%) |
|---|---|
| slope | 151.427 |
| Den_Pop | 136.401 |
| CGDP | 131.357 |
| Tem1_avg | 114.534 |
| tem0_avg | 105.845 |
| Elev | 85.919 |
| Rhm1_avg | 83.622 |
| Crop area | 79.045 |
| Pre1_avg | 79.031 |
| pre0_avg | 61.388 |
| Income for conservation | 53.236 |
| Fis_expenditure | 50.524 |
Table 6.
Adjusted R2 and correlation values between observed (obs) and prediction (pre) values of five intermediate models using Multiple Linear Regression.
Table 6.
Adjusted R2 and correlation values between observed (obs) and prediction (pre) values of five intermediate models using Multiple Linear Regression.
| Sample | Adjusted R2 | Variance Explained (%) | Correlation Obs vs. Pre |
|---|---|---|---|
| Sample 1 | 0.7355 | 73.57 | 0.858 |
| Sample 2 | 0.7067 | 70.7 | 0.841 |
| Sample 3 | 0.7089 | 70.92 | 0.842 |
| Sample 4 | 0.7035 | 70.37 | 0.839 |
| Sample 5 | 0.7037 | 70.39 | 0.839 |
Table 7.
Results of the intermediate models created with the Random Forest modelling approach, including the correlation values between observed (obs) and predicted (pre) values.
Table 7.
Results of the intermediate models created with the Random Forest modelling approach, including the correlation values between observed (obs) and predicted (pre) values.
| Sample | Variance Explained (%) | Mean Squared | Correlation Obs vs. Pre |
|---|---|---|---|
| Sample 1 | 89.15 | 0.003916185 | 0.938 |
| Sample 2 | 87.79 | 0.00458418 | 0.932 |
| Sample 3 | 88.00 | 0.004492208 | 0.946 |
| Sample 4 | 87.74 | 0.004550245 | 0.928 |
| Sample 5 | 87.75 | 0.0045971 | 0.937 |
© 2018 by the authors. Licensee MDPI, Basel, Switzerland. This article is an open access article distributed under the terms and conditions of the Creative Commons Attribution (CC BY) license (http://creativecommons.org/licenses/by/4.0/).
Share and Cite
MDPI and ACS Style
Wang, W.; Ma, X.; Moazzam Nizami, S.; Tian, C.; Guo, F. Anthropogenic and Biophysical Factors Associated with Vegetation Restoration in Changting, China. Forests 2018, 9, 306. https://doi.org/10.3390/f9060306
AMA Style
Wang W, Ma X, Moazzam Nizami S, Tian C, Guo F. Anthropogenic and Biophysical Factors Associated with Vegetation Restoration in Changting, China. Forests. 2018; 9(6):306. https://doi.org/10.3390/f9060306
Chicago/Turabian StyleWang, Wenhui, Xiangqing Ma, Syed Moazzam Nizami, Chao Tian, and Futao Guo. 2018. "Anthropogenic and Biophysical Factors Associated with Vegetation Restoration in Changting, China" Forests 9, no. 6: 306. https://doi.org/10.3390/f9060306
Note that from the first issue of 2016, this journal uses article numbers instead of page numbers. See further details here.