Changes in Soil Enzyme Activities and Microbial Biomass after Revegetation in the Three Gorges Reservoir, China


Key Laboratory of Eco-Environment in the Three Gorges Reservoir Region of the Ministry of Education, School of Life Sciences, Southwest University, Chongqing 400715, China
*
Author to whom correspondence should be addressed.
Forests 2018, 9(5), 249; https://doi.org/10.3390/f9050249
Submission received: 28 March 2018
/
Revised: 1 May 2018
/
Accepted: 2 May 2018
/
Published: 4 May 2018
(This article belongs to the Special Issue Carbon, Nitrogen and Phosphorus Cycling in Forest Soils)
Abstract
:Soil enzymes and microbes are central to the decomposition of plant and microbial detritus, and play important roles in carbon, nitrogen, and phosphorus biogeochemistry cycling at the ecosystem level. In the present study, we characterized the soil enzyme activity and microbial biomass in revegetated (with Taxodium distichum (L.) Rich. and Cynodon dactylon (L.) Pers.) versus unplanted soil in the riparian zone of the Three Gorges Dam Reservoir (TGDR), in order to quantify the effect of revegetation on the edaphic microenvironment after water flooding in situ. After revegetation, the soil physical and chemical properties in revegetated soil showed significant differences to those in unplanted soil. The microbial biomass carbon and phosphorus in soils of T. distichum were significantly higher than those in C. dactylon and unplanted soils, respectively. The microbial biomass nitrogen in revegetated T. distichum and C. dactylon soils was significantly increased by 273% and 203%, respectively. The enzyme activities of T. distichum and C. dactylon soils displayed no significant difference between each other, but exhibited a great increase compared to those of the unplanted soil. Elements ratio (except C/N (S)) did not vary significantly between T. distichum and C. dactylon soils; meanwhile, a strong community-level elemental homeostasis in the revegetated soils was found. The correlation analyses demonstrated that only microbial biomass carbon and phosphorus had a significantly positive relationship with soil enzyme activities. After revegetation, both soil enzyme activities and microbial biomasses were relatively stable in the T. distichum and C. dactylon soils, with the wooded soil being more superior. The higher enzyme activities and microbial biomasses demonstrate the C, N, and P cycling and the maintenance of soil quality in the riparian zone of the TGDR.
1. Introduction
The riparian zone, as an important ecotone, is known to be the key area for improving water quality, controlling flooding, and relieving soil erosion [1]. The riparian zone of the Yangtze River in China, analogous to many other critical interfaces of the river ecosystems in the world, is a unique transition zone in the landscape and plays a crucial role in the health and functioning of the diverse Yangtze River watershed biome as a whole [2]. However, since the building of the Three Gorges Dam (TGD) in the upper reaches of the Yangtze River, the natural flow regime has been disrupted. In this newly formed water level fluctuation zone (WLFZ), the hydrological regime is opposite to the Yangtze River’s natural regime, with its peak flows occurring in winter rather than in summer [3]. Plant species adapted to previously terrestrial habitats intensively died out or otherwise were degraded, leading to considerable soil erosion, texture coarsening, habitat loss, biodiversity decline, and environmental pollution in the riparian zone of the TGD region. With the far-reaching and profound challenges exerted on this region [4], reforestation and vegetation reconstruction to restore the newly-formed riparian zone of the TGD region have been thought to be an environmentally friendly alternative [5,6].
Restoration of the degraded riparian zone is a significant management practice [7] that may return an area to a pre-disturbance ecological state, functionally [8] and/or structurally [9]. Since 2000, research has been conducted to determine the suitability of potential plant species for restoring the novel habitat in the WLFZ. Accumulating evidence has demonstrated that species including Cynodon dactylon (Bermuda grass) and Taxodium distichum (bald cypress) are promising candidates [6,10]. After revegetation, plants such as the abovementioned Bermuda grass and bald cypress will have to experience the hydrological regimes of the WLFZ, i.e., an annual imposed water level fluctuation of 30 meters (from 145 m a.s.l. to 175 m a.s.l.) within the Three Gorges Dam Reservoir (TGDR), and input leaves and plant detritus into the riparian soil. However, riparian zones can effectively remove pollutants and protect water quality through performing functions such as filtration and denitrification. In this regard, soil enzymes can play an essential role in catalyzing reactions necessary for the decomposition of leaves and plant detritus, and also for nutrient cycling, in the WLFZ. It has been reported that any change in soil management and land use is reflected in the soil enzyme activities, and thus soil enzyme activities can anticipate changes in soil quality before necessary further detection through other means of soil analyses [11]. As such, measurements of soil enzyme activities can describe how nutrient cycling is affected by environmental changes after revegetation in the TGD region.
Moreover, microorganisms are the main source of enzymes in soils [12], because they produce extracellular enzymes to acquire energy and resources from complex biomolecules in the soil environment [13]. Parts of the energy and resources are immobilized in their biomass, which thus strongly influences the concentrations of plant available nutrients in the soil [14,15]. Therefore, the soil microbial communities strongly affect the potential of the soil for enzyme-mediated substrate catalysis. Microbial biomass is the labile portion of the organic fraction in soils and serves as both an important source of and sink for plant available nutrients [16]. However, enzyme activities and microbial biomass are closely related to each other because transformations of the important organic elements occur through microorganisms [16].
After re-vegetation in the TGR zone, additional plant leaves, dead roots, and nutrient translocation caused by water fluctuation, may cause a change in the pH and nutrient stocks in the soil [17]. Such changes in nutrient availability in the riparian soil environment would cause substantial variation in soil enzyme activities and microbial biomass in the WLFZ of the TGDR. In particular, the presence of plant roots leads to shifts in the microbial growth strategy, upregulation of enzyme production, and increased microbial respiration [18]. Thus, after revegetation, the in situ monitoring and evaluation of soil enzymes and microbial biomass are both of great significance and necessity for better understanding the dynamic patterns of the riparian ecosystems. Furthermore, understanding the functioning of soils within a riparian zone can be used to evaluate their influence on water quality, and ultimately provide information on the whole ecosystem level environmental quality. Thus, the objective of this work was to monitor and assess microbial biomass and selected enzyme activities relevant to C, N, and P cycling in soils of the WLFZ of the TGDR as affected by re-vegetation. We hypothesized that (1) revegetation of the plants in the riparian zone of the TGDR will enhance soil microbial biomass and enzyme activities as compared to those of the unplanted soil; and (2) the revegetated soils are more homeostatic than unplanted soil.
2. Materials and Methods
2.1. Study Site and Experimental Setup
The study site is located in the Ruxi River basin in Gonghe Village of Shibao Township, Zhong County, Chongqing Municipality (107°32′–108°14′ E, 30°03′–30°35′ N), China. Ruxi River is one of the largest tributaries of the TGDR. The area has a subtropical monsoon climate with four distinctive seasons. It has a mean annual temperature of 19.5 °C and an annual rainfall of 1200 mm. The soil within this region is purple soil (Regosols according to the World Reference Base for Soil Resources), formed in the parent material of calcareous purple sand shale in the subtropical region. The degree of soil development is limited because the rock is not deeply weathered. The soil and water erosion is serious in the less-vegetated riparian zone of the Ruxi River.
Before the inundation, vegetation in this region was dominated by annuals (e.g., Setaria viridis (L.) P.Beauv., Digitaria ciliaris (Retz.) Koeler, and Leptochloa chinensis (L.) Nees), perennials (e.g., Cynodon dactylon (L.) Pers., Hemarthria compressa (L.f.) R.Br., and Capillipedium assimile (Steud.) A. Camus), and woody species (e.g., Pterocarya stenoptera C.DC., Metasequoia glyptostroboides Hu and W.C.Cheng, and Alnus cremastogyne Burk.). However, the reversed flooding seasonality and prolonged flooding duration caused the loss of the former vegetation, and only S. viridis and D. ciliaris remained [19]. In the study region, revegetation was carried out in March, 2012. Bald cypress and Bermuda grass were planted in the upper portion between 165 m a.s.l. and 175 m a.s.l., with the same slope, solar radiation intensity, and initial soils. The planting density for bald cypress saplings was 1 m × 1 m, and for Bermuda grass was 20 cm × 20 cm, in a total riparian area of 13.3 hm2. The survival rate of the plants was 100 percent, and they displayed substantial progress in their growth in the following years. In the meantime, there was no sign of anthropogenic disturbance at the experimental site. After a four-year growth, the soil sampling was carried out in June 2016. Growth data on bald cypress saplings and Bermuda grass including tree height, diameter at breast height (DBH), grass stem basal diameter, and crown canopy area (Table 1), were recorded. For the purposes of comparison, we used unplanted plots as controls, henceforth referred to as “CK” treatment.
2.2. Soil Sampling and Soil Physicochemical Properties Determination
The water level of the riparian zone in Zhong County in the TGDR is raised from September to October, then maintained at its highest water level (i.e., about 175 m a.s.l.) from November to January. After January, a gradual decrease of the water level will be followed and then maintained at its lowest level (i.e., 145 m a.s.l.) during the months of June through September. Under this circumstance of water-level changes, the soil sampling was conducted in June 2016, when the riparian zone of the TGDR was completely exposed to the air. Nine sampling plots (5 m × 5 m each) were randomly selected in the revegetation area of bald cypress, Bermuda grass, and the unplanted area, between the elevations of 165–175 m a.s.l. When sampling in the field, a cutting ring (10 cm in diameter × 20 cm in height) was used to collect the soil samples, and vegetation was removed from the top of the soil prior to collection.
Within each plot, five 1 m × 1 m soil sampling subplots were made and arranged in a quincunx pattern. Soil samples were collected from the surface 20 cm soil from each of the five 1 m × 1 m sampling subplots, and then used to make one composite sample for that entire plot. Each soil composite sample collected from a particular plot was homogenized and then quartered. All samples were placed on ice and transported to the laboratory immediately. A portion of the soil was stored at 4 °C for biochemistry analysis. The other portion was air-dried separately, then hand-passed through a 2 mm followed by a 0.25 mm sieve, and finally analyzed for the soil nutrients present. Soil pH value was determined using a 1:2.5 ratio of soil to deionized water. Soil organic carbon (SOC) was determined using the potassium dichromate titration method. Total nitrogen (TN) was determined by an element analysis machine (Elementar Vario. EL, Langenselbold, Germany), and available nitrogen (AN) was determined using a micro-diffusion technique after alkaline hydrolysis. Total phosphorus (TP) was determined with acid digestion (HNO3, HF, and H2O2) in a microwave oven and subsequent inductively coupled plasma-optical emission spectrometry measurements (ICP-OES, CIROS, Spectro, Thermo Fisher, NY, USA) [17]. Available phosphorus (AP) was determined using the Mo-Sb colorimetric method. The soil water content (WC) was determined by oven drying method, and soil density was determined by pycnometer method. The soil porosity was calculated from soil density and measured bulk density [20].
2.3. Soil Enzyme and Microbial Biomass Determination
Activities of soil enzymes related to C, N, and P cycling were measured. These enzymes included four hydrolytic enzymes: Catalase activity was determined by measuring the O2 absorbed by KMnO4 (Chuanjiang Chemical Industry, Chongqing, China) after the addition of H2O2 (Chuandong Chemical Industry, Chongqing, China) to the samples [21]. Urease activities were determined in 0.1 M phosphate buffer at pH 7; 1 M urea (Chuandong Chemical Industry, Chongqing, China) and 0.03 M Na-benzoyl-argininamide (BAA) (Fusheng Industry, Shanghai, China) were used as substrates, respectively. A total of 2 mL of buffer and 0.5 mL of substrate were added to 0.5 g of soil sample, and then incubated at 37 °C for 24 h. The activities of urease were determined by the released [22]. Acid phosphatase, which breaks phosphoester bonds and releases inorganic phosphorus, was measured by p-nitrophenyl phosphate disodium colorimetry, and expressed as mg p-nitrophenol released per gram dry soil over 24 h at 37 °C. The sucrase activity was determined using sucrose as the substrate, and the activity was expressed as mg glucose g−1∙dw 24 h−1 [23].
Soil microbial biomass C, N and P (SMC, SMN, and SMP) concentrations were determined by the chloroform fumigation extraction method. Specifically, for each soil sample, 25 g (fresh weight) pre-incubated soil was used for chloroform fumigation, and the same weight soils without chloroform fumigation were also conducted for the control. Then, 100 mL 0.5 mol∙L−1 K2SO4 extract was used for the extraction of SMC and SMN [24,25]. Besides, biomass P was measured in 5 g (fresh weight) fumigation soil, with the non-fumigation soil as the control, and 100 mL 0.5 mol L−1 NaHCO3 extract was used for the extraction of SMP [26]. The following formulas were used to calculate the soil microbial biomass:
SMC = EC/kEC
SMN = EN/kEN
SMP = EP/kEP
EC, EN, and EP were the differences in extractable fractions between fumigated and unfumigated soil. kEC, kEN, and kEP were conversion coefficients, and had values of 0.38, 0.45, and 0.40, respectively [27].
2.4. Statistics Analysis
To determine significant differences between the activities of soil enzymes or edaphic properties after revegetation, one-way analysis of variance (ANOVA) was used, followed by LSD’s test. The difference was reported as significant when p < 0.05. Redundancy analysis (RDA) with the Monte Carlo permutation test (499 permutations) was performed to determine if soil enzyme activities were correlated with soil properties or microbial biomass. Statistical procedures were conducted using SPSS version 18.0 (IBM, Armonk, NY, USA), MS Excel (Microsoft, Redmond, WA, USA), and Canoco version 4.5 (Microcomputer Power, Ithaca, NY, USA).
3. Results
3.1. The Edaphic Physicochemical Properties
Soil physicochemical properties are shown in Table 2. Although soil pH values in the planted plots were a little bit lower than the neutral value of 7, indicating a slightly acidic soil, there was no significant difference in soil pH among the three groups. However, bald cypress soils had the highest SOC when compared to that of Bermuda grass and unplanted soils. The planted soils, including both bald cypress and Bermuda grass soils, displayed much higher TN, WC, and porosity than unplanted soil, with a 97% and 58% increase in TN, 41% and 33% increase in WC, and 17% and 28% enhancement in porosity, respectively. In contrast, AN content of planted soils was significantly lower than that of unplanted soil. Moreover, soil density varied among different treatments, with the highest value being found in Bermuda grass soil. The soil density of Bermuda grass was significantly higher than that of bald cypress soil, whereas the soil density of bald cypress showed no obvious difference compared to that of unplanted soil.
3.2. Soil Microbial Biomass
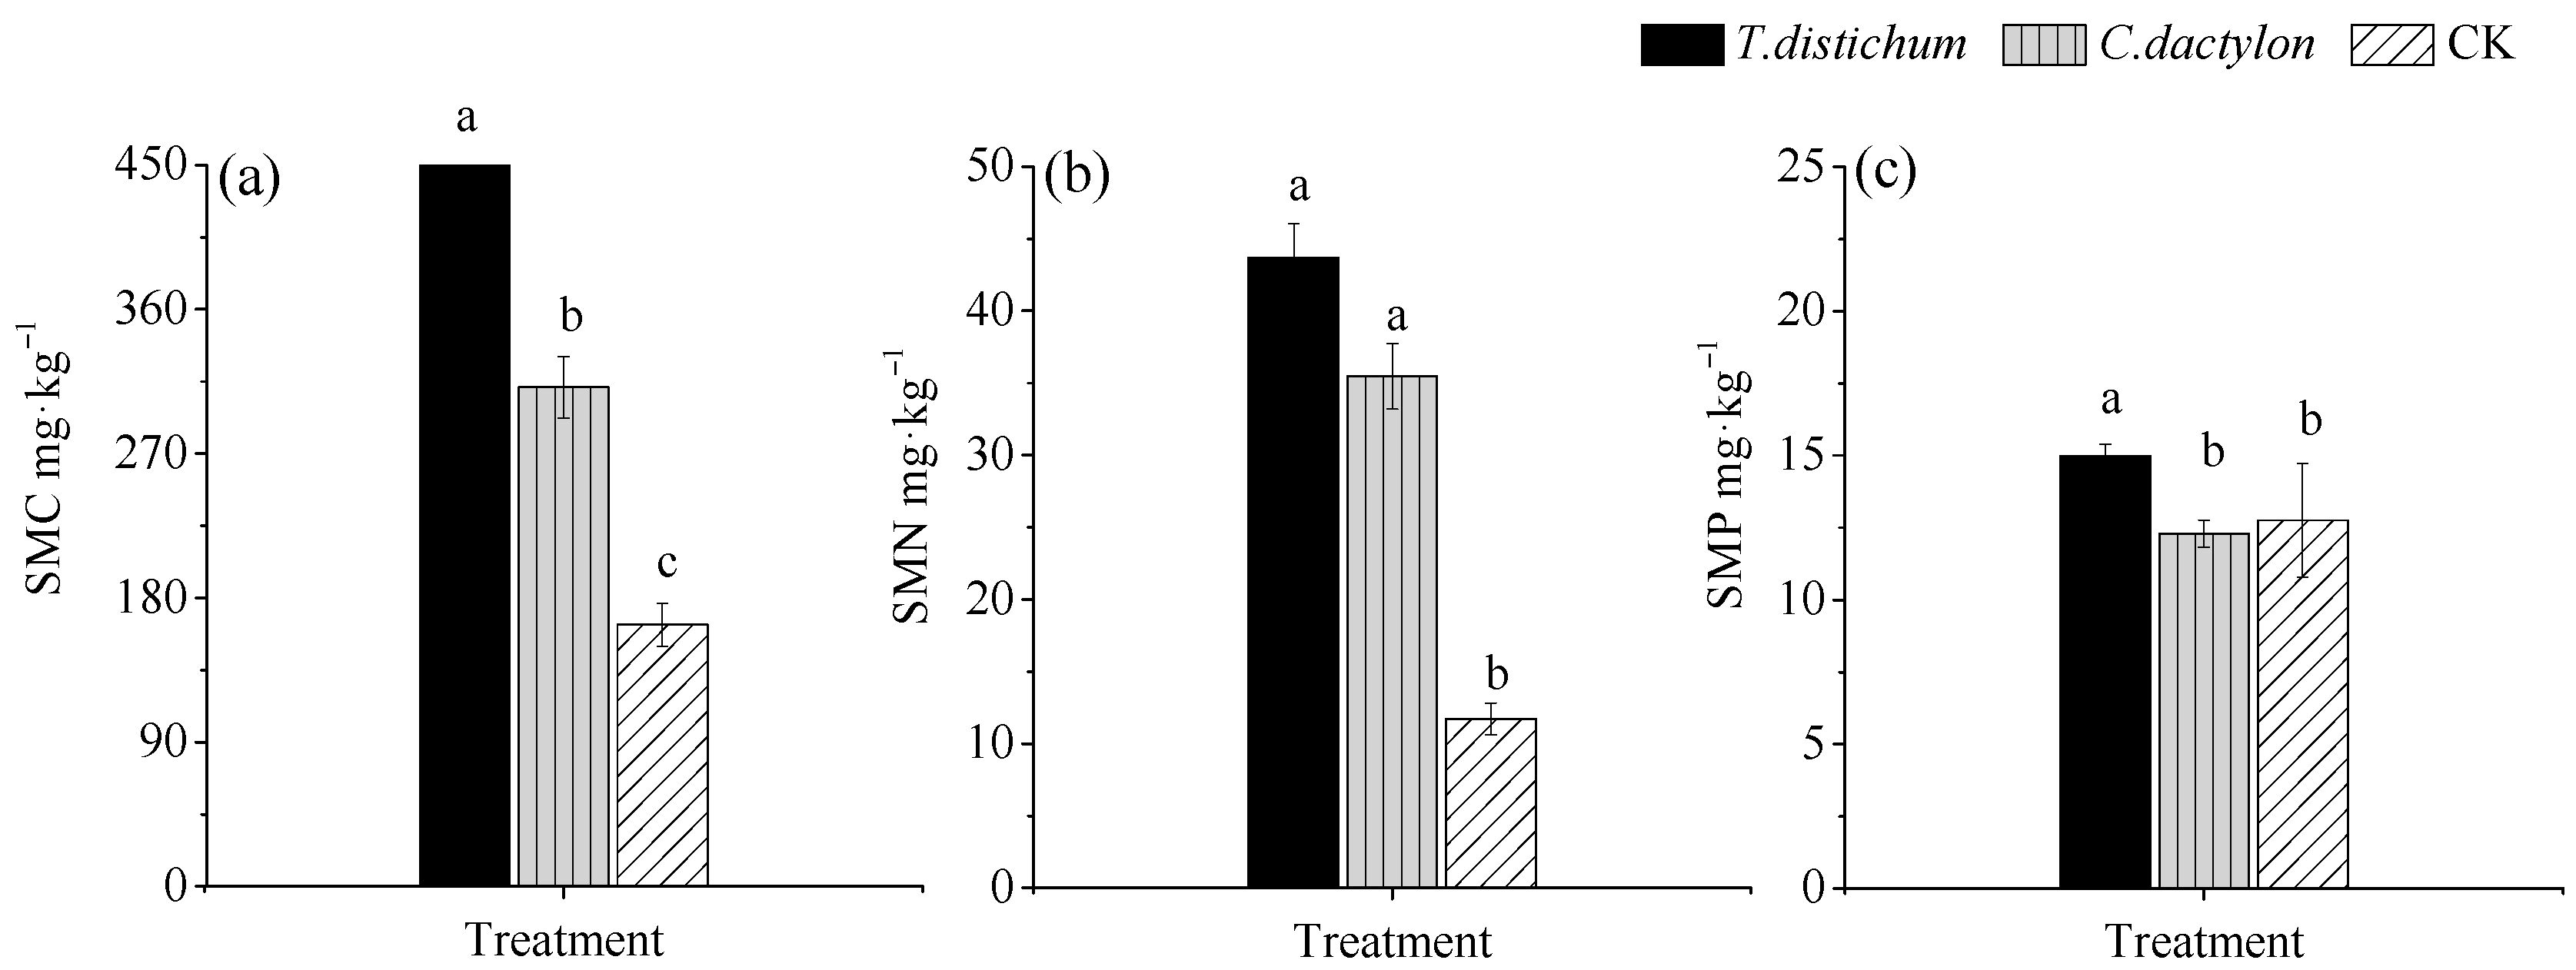
The bald cypress soil exhibited significantly or extremely significantly higher SMC and SMP than the other two soils (Figure 1a,c). Meanwhile, the SMC of Bermuda grass soil was also significantly higher than that of unplanted soil. However, no significant difference was observed for SMP between Bermuda grass and unplanted soils. Compared to the lowest SMN of unplanted soil, the SMN values of revegetated soils were significantly increased by 273% and 203% after revegetation, respectively.
3.3. Soil Enzyme Activities
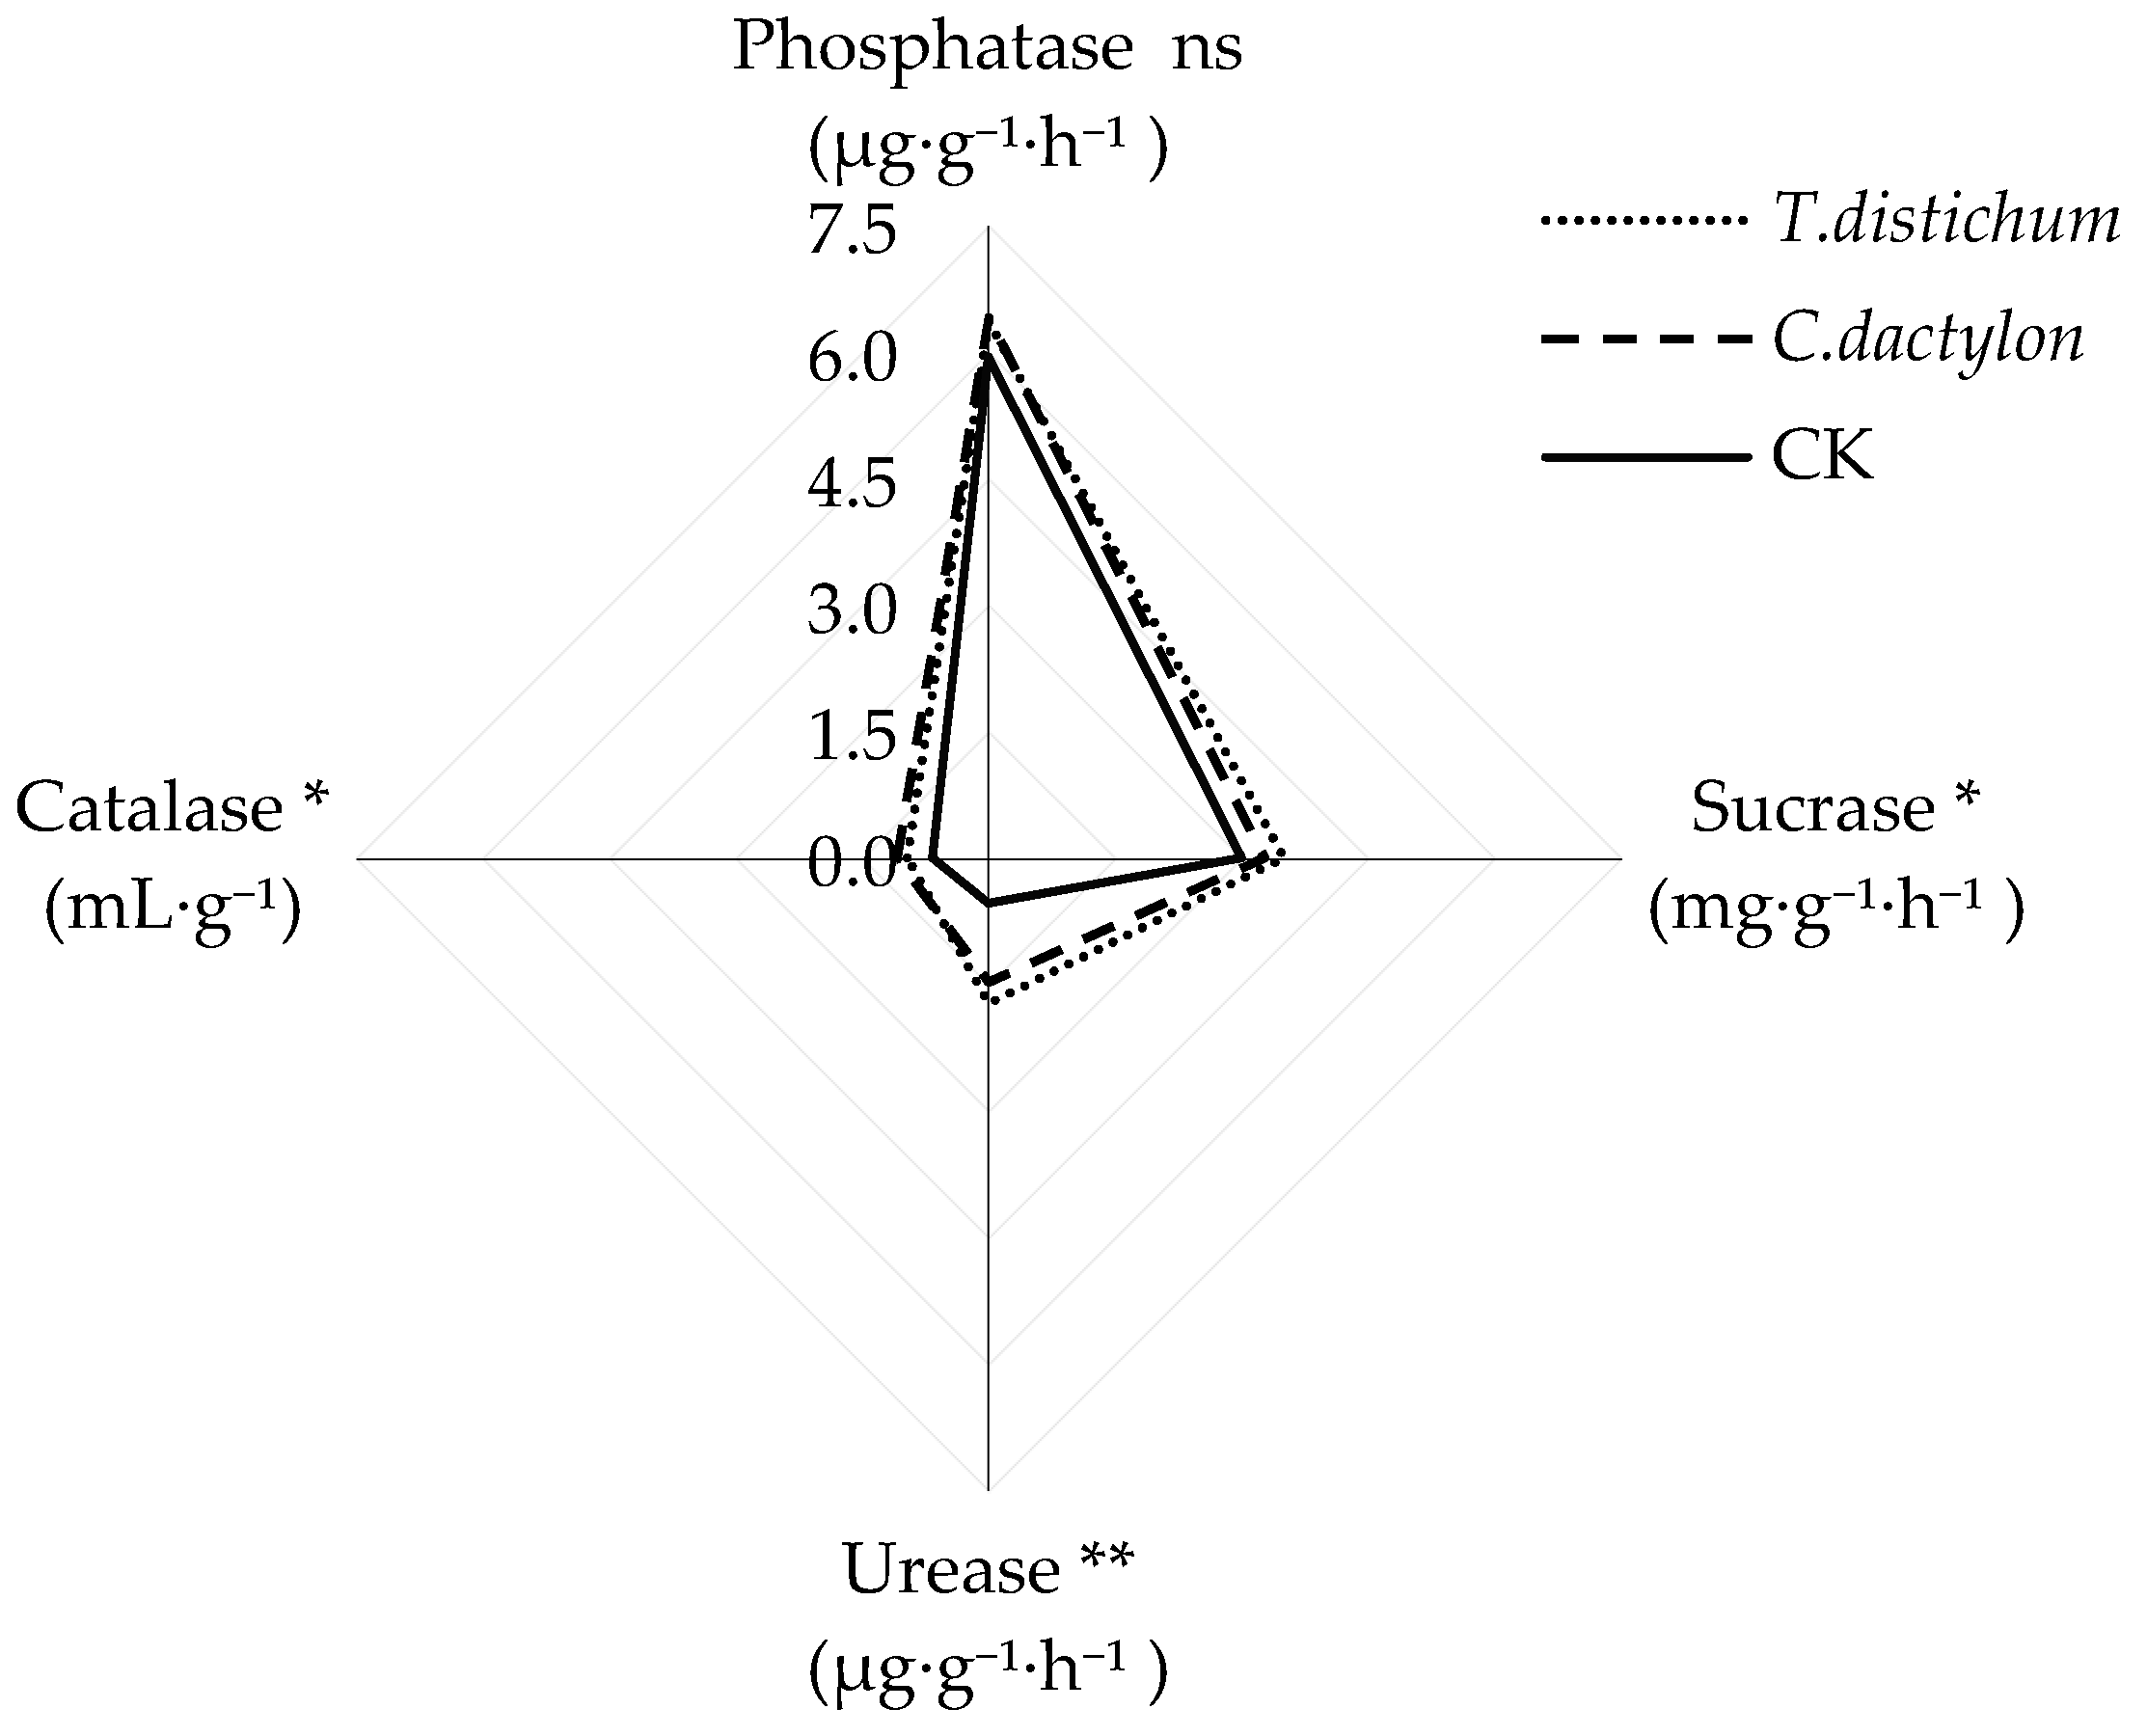
Soil enzyme activities of bald cypress and Bermuda grass soils displayed a similar trend, while showing no significant difference between each other. When compared to the unplanted soil, the activities of all enzymes except phosphatase were strongly augmented after re-vegetation. The activities of catalase, sucrase, and urease of bald cypress soils were significantly increased by 17%, 220%, and 47%, respectively. Likewise, the activities of catalase, sucrase, and urease of Bermuda grass soils were also significantly increased by 9%, 172%, and 65%, respectively.
3.4. Threshold Elemental Ratios of CNP and Stoichiometric Homeostasis
The soil C/N ratio under bald cypress vegetation was significantly higher than that of unplanted soil, but no significant difference in the C/N ratio was observed between the two planted soils or between Bermuda grass and unplanted soils. In contrast, the highest value of microbial C/N ratio occurred in the unplanted soil, which was significantly higher than that of Bermuda grass soil. The ratio of C/P, including both in the soil and in the microbial biomass, displayed a significantly greater value in planted soils than that in unplanted soils. Among the three treatments, the ratios of microbial biomass C, N, and P to soil total C, N, and P correspondingly varied between 2–6%, 1–4%, and 1–2%. The stoichiometric ratios of SMC/SOC and SMN/TN in both bald cypress and Bermuda grass soils were significantly higher than in the unplanted soil, whereas SMP/TP of bald cypress soil showed no obvious difference with that of the unplanted soil.
We analyzed the associations between nutrient elemental ratios in soils and microbial biomass elemental ratios in microbes, and the H value was used to evaluate the strength of soil stoichiometric homeostasis in the present study plots. In the planted soil, the H value was larger than 1, whereas the H value in unplanted soil was around 1.
3.5. Correlations between Soil Variables and Enzyme Activity
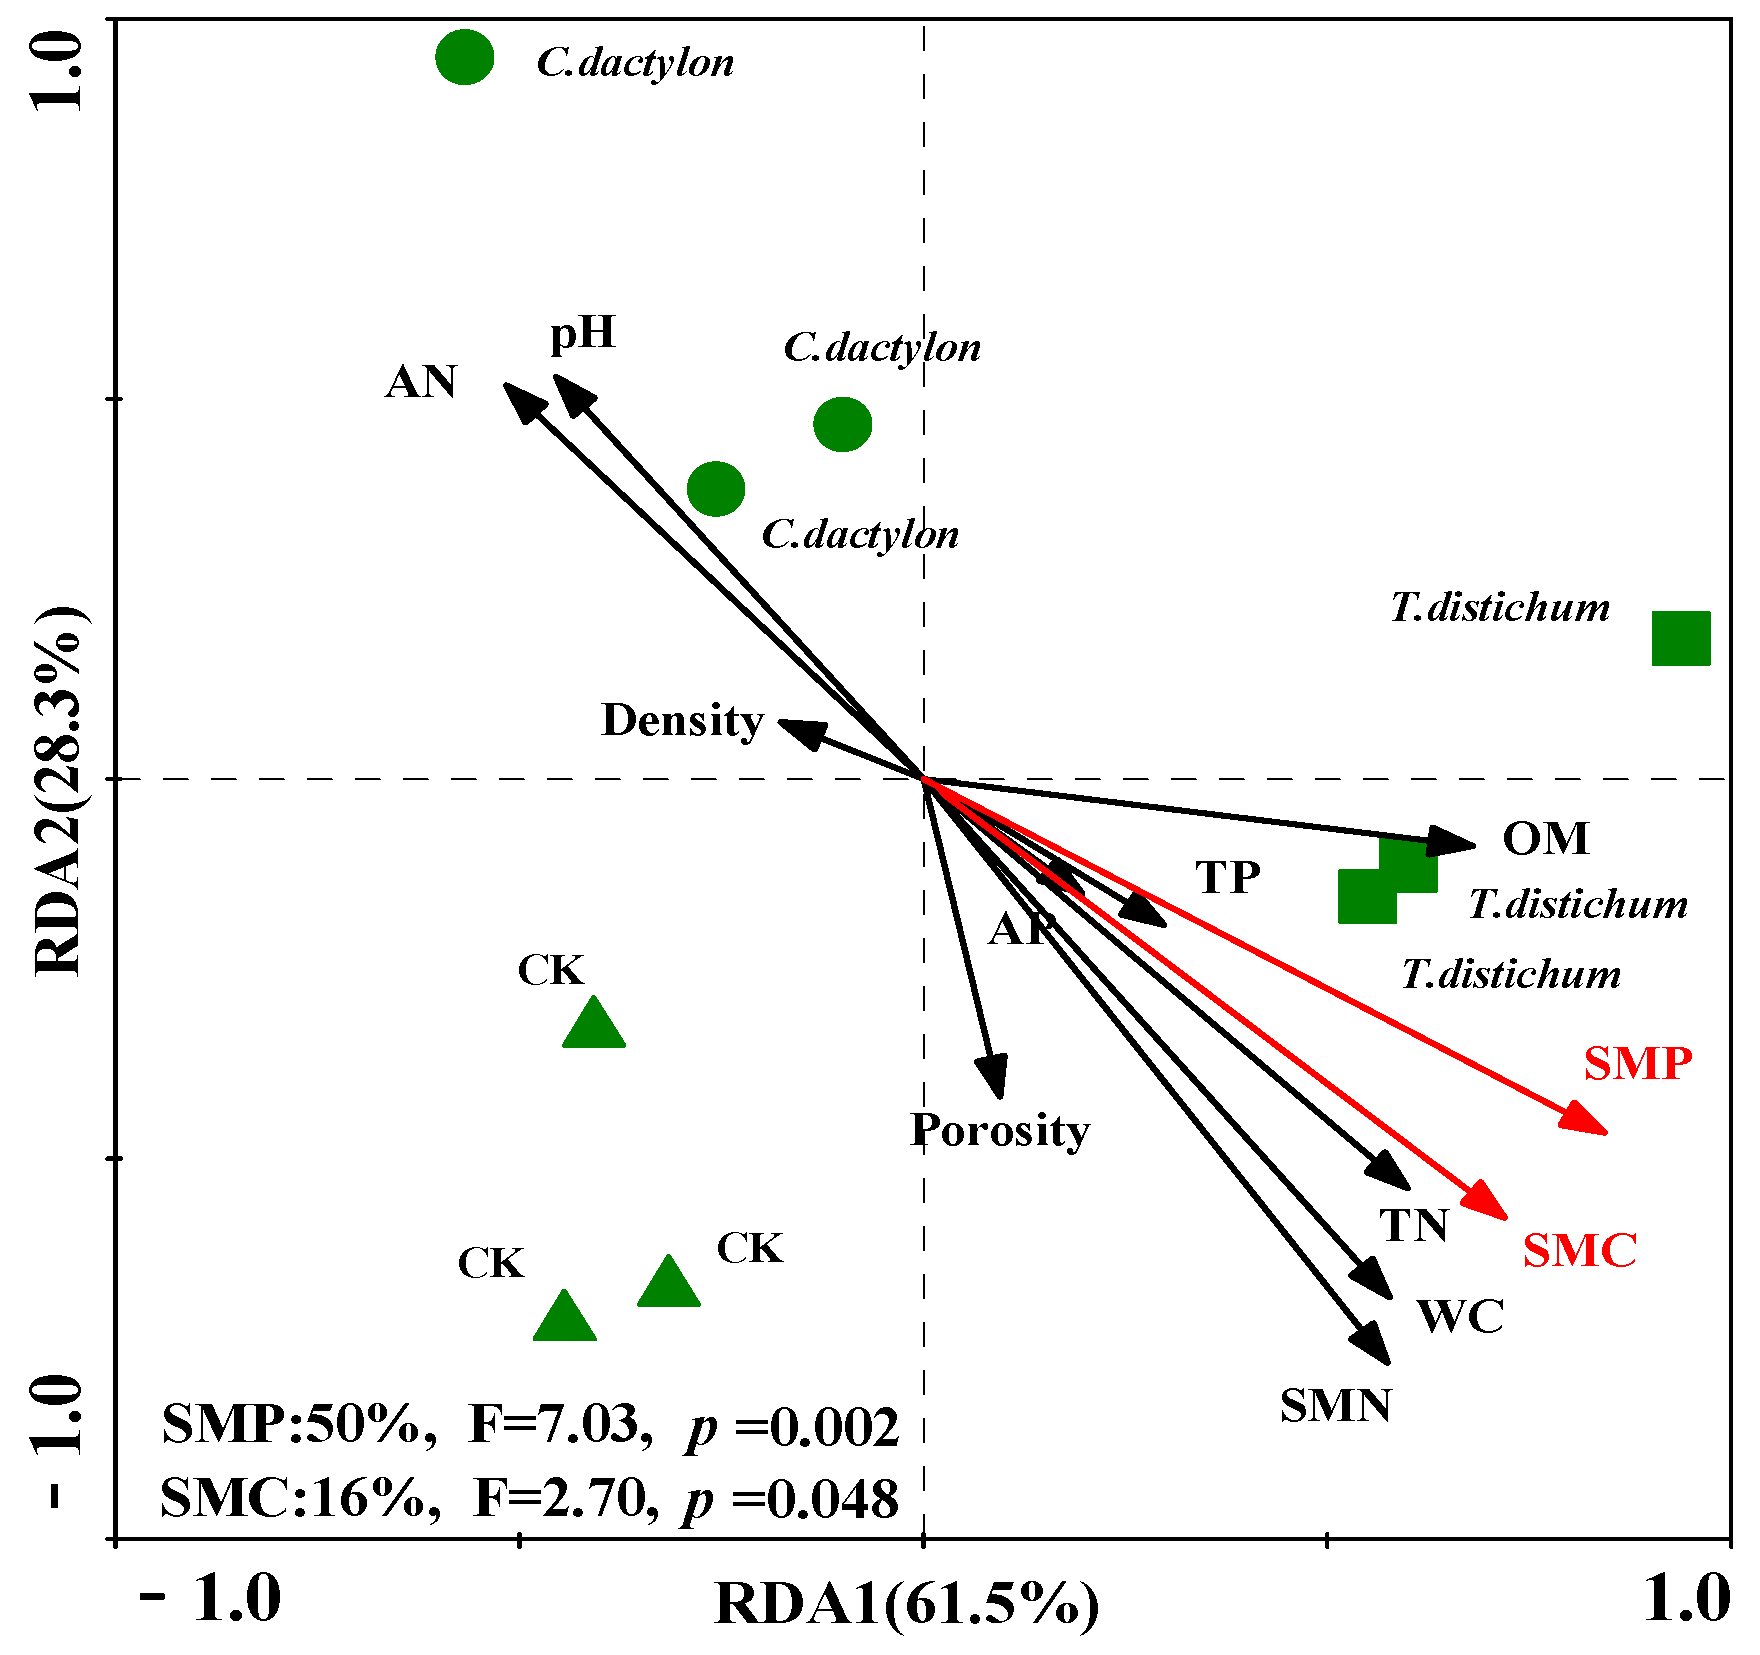
Results from the RDA identified that the first two axes could explain 89.8% of the variance caused by soil edaphic properties and microbial biomass. However, only the SMP and SMC significantly positively correlated with soil enzyme activities, which explained 50% (p = 0.002, F = 7.03) and 16% (p = 0.048, F = 2.7) of the variances of the total variability of soil enzyme activity, respectively.
4. Discussion
4.1. Edaphic Physicochemical Properties
In our current study, the revegetation with either bald cypress or Bermuda grass modified the soil conditions in the riparian zone of the TGDR (Table 2), which was mainly attributed to the inputs of litter and root exudes. The spatial differences in soil moisture content can partly be ascribed to the differences in throughfall, the vegetative (tree and grass) cover, and water loss through the soil evaporation, since throughfall and evaporation strongly correlate with the gap fraction [28]. In addition, without vegetative covering such as in the group CK, the unplanted soil tends to have a coarser texture and lower porosity, and some soil nutrients might be easily extracted or removed by the water flooding under the dynamic hydrological regime of the TGDR.
4.2. Edaphic Enzyme Activities and Soil Microbial Biomass
Divergence of nutrient availabilities and soil moisture can give feedback to soil microbes’ resource requirements, which in turn may influence the microbial biomass [29]. In the present study, the discrepancy of plant characteristics may result in a difference of soil microbial biomass. The leaf type would be a primary factor of microbial biomass accumulation in surface soils due to differences in leaf litter chemistry. The higher SMC in bald cypress soil may be attributed to its higher content of SOC. Meanwhile, in Bermuda grass soil, cellulose represents a crucial proportion of plant detritus that returned to the soil. The inflexible ingredient makes cellulose difficult to decompose in the soil. Additionally, previous studies reported that the SMP is a very important P pool in the organic layer of P-poor soil [30]. In the riparian zone of TGDR, though the P (TP and AP) content displayed no significant difference among the three treatments, the uptake of P was increased by soil microbes in bald cypress soils, which is most likely due to the larger mass of SOC (Table 2) that existed in bald cypress soil through overcompensating for the lower SMP [31]. This result illustrated that the microorganisms in bald cypress soils were capable of immobilizing available P much more efficiently than in the Bermuda grass and unplanted soils, leading to the low P mineralization rates.
Moreover, the more extensive rooting systems and protective canopies of the bald cypress and Bermuda grass will protect the vegetated soil from erosion and maintain more favorable conditions for plant and microbial growth, which were conducive to the accumulation of microbial biomass. In the TGDR region during summer time, the climate was both very hot (the average temperature reaching 37 °C) and dry (the relative humidity index being −0.62), thus promoting extensive evapotranspiration in the studied riparian zone. Consequently, soil impoverishment and nutrient unavailability might occur much more commonly in bare (unplanted) soil compared to that in planted soil which was covered by vegetation, thus leading to the inactive status of the microbes [32]. The active soil microbes under bald cypress and Bermuda grass could build up their new biomass, but, on the contrary, the inactive ones are incapable of accumulating carbon in biomass, even possibly depleting their C by respiring [33]. In such circumstances, the microorganism would also almost completely decrease the production of enzyme, as well as metabolic activities related to decomposition [34], which were consistent with the lower enzyme activities in unplanted soils. However, although the soil microbial biomass under the two re-vegetation schemes in our present study was different, their enzyme activities displayed a similar value. It is also possible that, while the soil microbial community as a whole shifted, the relative abundance of enzyme producers did not [13].
Besides, the soil aggregation could also influence the microbial biomass. A portion of microorganisms live on or closer to the aggregate surface. The increase of microbial biomass as soil aggregate size decreases may depend on the presence of small pore-size microaggregates [35]. This may protect microorganisms from predation by protozoa or from desiccation [36]. Fang et al. [37] also documented that smaller aggregate sizes in the soil have a higher specific surface for microbial cells to attach to, which was of benefit to the build-up of microbial biomass. After the revegetation in the riparian zone of the TGDR, with the root penetrating into the riparian soil, their soil aggregate would be shrunken. However, the unplanted soil maintains its bigger size aggregation without plant effects. The increasing soil aggregation in the CK would prevent the soil enzyme from accessing carbon and nitrogen substrates inside aggregates [38], which was in accordance with the lower nutrient content and enzyme activities in the CK in the present study.
The higher enzyme activities of the soil after revegetation confirmed our first hypothesis, for which one possible reason should be owing to the accumulated microbial biomass. Because the soil enzymes are mainly excreted by microbes to mineralize soil carbon, nitrogen, and phosphorus from SOC, the activities of enzymes could therefore be partially explained by the distribution of soil microbial biomass. Furthermore, soil enzyme activities were also affected by soil water content. In unplanted soil, the water content was significantly lower than that of the planted soils (Table 2), which reduced the diffusion of soil soluble substrates. In such a less hydrologic environment, both the substrate and water become limited, and the soil microorganism down-regulates enzyme production [37,39].
In the riparian zone of the TGDR, as the soil experienced inundation in winter, and strong soil weathering in summer, this resulted in the leaching of nutrient elements of the riparian soil, followed by a decline in the soil nutrients availability [40,41]. According to the lower AN content in planted soil, we could infer that the soil N has a limited availability, and the microbial organism needs to secrete corresponding enzymes to meet their N demand [42]. Therefore, soil urease activities increased significantly in the planted soils. However, the phosphatase activities exhibited no significant difference among the three groups, for which the result was consistent with the undifferentiated P content across the soils of the three groups, further indicating that the P in the riparian soil may not be a limiting nutrient for aboveground productivity in the TGDR region. The former research also pointed out that some enzymes involved in P acquisition seem to be correlated better with the environmental requirement of P [43]. Other studies, however, have reported that the higher N content could stimulate enzyme activities in acidic soil, particularly for phosphatase activity enhancement [44,45]. Under acidic soil conditions, the plant roots would release protons and organic ligands, and thus the rhizosphere would be stimulated and promote the acid phosphatase activity [46]. In our research plots, although the soil TN contents under bald cypress and Bermuda grass were higher than those under unplanted soil, the pH value tended to be neutral, and the moderate pH might weaken the function of soil N or root exudates. Moreover, Cleveland et al. [47] reported that there was similar soil phosphatase activity under both forest and pasture for an oxisol in Costa Rica, and they also found a higher soil microbial biomass under forest than that under pasture. The extremely low activities of catalase throughout unplanted soil profiles suggested that oxygen availability may be a major control factor for catalase, because soil redox status is also an important microbial driver in surface soils [48], particularly in the frequently inundated riparian zone of the TGDR.
4.3. Elemental Ratios in Soils and in Soil Microbial Biomass
Ecological stoichiometry is an important tool to study nutrient cycling and understand the ecosystem dynamics and functioning [49]. Former research showed that, though the soil nutrient ratios varied through the latitude, they did not vary significantly between forests and grasslands [50]. In our present study, the ratios of C/N and C/P in the bald cypress and Bermuda grass soil in the TGDR also revealed no significant difference (Table 3), which is consistent with the finding reported by the previous study [50]. This may be attributed to the fact that the plants are the major sources of soil C and N in the revegetated soils, while because of a lack of litter input into the soil, the ratios of C/N and C/P maintained a relatively lower value in the unplanted soil. Besides, the large amount of needs of N during photosynthesis of the plants from the soil, could lead to a higher ratio of C/N in the revegetated soils as well [50]. In general, biological organisms have an ordered chemical composition, and recent analyses have shown that most plants have relatively constrained element ratios [51]. In the riparian zone of the TGDR, soil microbial C/N ratios varied between 4 and 7 in our present study, which was slightly different to the result obtained from the research conducted in Mongolian grassland, whose soil microbial C/N ratios ranged from 5 to 9 [52]. However, the total soil C/P ratios falling in between 5 to 8 were also different from the result carried out in a hilly area [53]. This kind of divergence in soil C/N and C/P ratios could be mainly generated by the varied environmental habitats and biomes. Furthermore, the ratio of C/N can reflect the overall investment in structural cellular material by soil microbial biomass, for example, the relatively high ratio of C/N representing the high abundance of fungi [51].
The higher ratios of SMC/SOC and SMN/TN in planted soils reflected the faster nutrient turnover rate after revegetation. The results might be correlated with the higher activities of sucrase and urease (Figure 2), because with the assistance of soil enzymes, the accumulation of elements in the microbes would be accelerated. This finding also indicated that the microbial cells follow the mechanism in terms of element assimilation across C, N, and P, in order to meet the functional demands of microbial progress [54].
Stoichiometric homeostasis can reflect the allocations of different elements in organisms and indicate the stage of microorganism response to variations in soil condition [55]. When the stoichiometric composition of the organism does not vary with changes in resource stoichiometry, it is considered to be homeostatic [56]. In order to test the strength of stoichiometric homeostasis, we analyzed the associations between soil nutrient ratios and microbial biomass elemental ratios in the present research. Based on all the soil data, as well as microbial biomass C, N, and P stoichiometric values, a strong community-level elemental homeostasis in both the bald cypress and Bermuda grass soils was detected. Both the H (C/N) and H (C/P) were in close proximity to 1, indicating the unstable condition in unplanted soils in the TGDR region. Thereby, microorganisms could adjust their physiological metabolism to regulate their requirement of C, N, and P resources, thereby acclimating to various habitats [57].
4.4. Correlations between Enzyme Activities and Soil Parameters
Soil enzyme activities may also reflect the availability of different substrates, as well as microbial energy and nutrient demand, and are often related to C/N ratios of the microbial biomass or of the SOC [58]. In the present study, we found that enzyme activities were more closely correlated to soil microbial biomass than to soil nutrient content, especially to SMC and SMP (Figure 3). This was consistent with the former study conducted by Sari Stark [39], who found that the potential activities of enzymes for nutrient acquisition were not affected when the soil nutrient content increased. In the present study, although the soil physical and chemical parameters did not display direct significant correlations with the enzyme activities, we argued for the potential controls of the physicochemical properties over both soil enzyme activities and microbial biomass. The results may also indicate that for some litter types, such as bald cypress and Bermuda grass, or under some circumstances, such as drying-wetting events, C and P release are more closely coupled [43].
5. Conclusions
Because many soil enzymes and microbial biomass are immediately responsive to soil restoration, they can be used as indices of environmental stability and soil quality for riparian sustainable management. Our results showed that soil enzyme activities and microbial biomass, however, tend to stabilize in the revegetated bald cypress and Bermuda grass soils after revegetation, and the bald cypress showed more preponderance. Therefore, temporal changes in enzyme activities should be accounted for when evaluating the sustainability of revegetation in the TGR region. Besides, the revegetation of bald cypress and Bermuda grass enhanced the ratios of C/N, C/P, SMC/SOC, and SMN/TN, in revegetated soils, indicating a faster nutrient turnover rate after revegetation of the degraded riparian zone of the TGR.
Author Contributions
C.L. and Q.R. conceived of and designed the experiments. Q.R., H.S. and Z.Y. performed the experiments. Q.R. and X.N. analyzed the data. Q.R. wrote the paper. All authors contributed to reviewing the manuscript.
Founding
This research was financially supported by the Chongqing Municipality Key Forestry Research Project [No. Yulinkeyan 2016-8], International Sci-Tech Cooperation Project of Ministry of Science and Technology [No. 2015DFA90900], Forestry Extension Project of China Central Finance [No. Yulinketui 2017-12], China Postdoctoral Science Foundation [2016M602629], and Chongqing Postdoctoral Research Project Special Funding [Xm2016111].
Conflicts of Interest
The authors declare no conflict of interest.
References
- Clerici, N.; Paracchini, M.L.; Maes, J. Land-cover change dynamics and insights into ecosystem services in European stream riparian zones. Ecohydrol. Hydrobiol. 2014, 14, 107–120. [Google Scholar] [CrossRef]
- Slabbert, E.; Jacobs, S.M.; Jacobs, K. The soil bacterial communities of South African Fynbos riparian ecosystems invaded by Australian Acacia species. PLoS ONE 2014, 9, e86560. [Google Scholar] [CrossRef] [PubMed]
- Lu, Z.J.; Li, L.F.; Jiang, M.X.; Huang, H.D.; Bao, D.C. Can the soil seed bank contribute to revegetation of the drawdown zone in the Three Gorges Reservoir Region? Plant Ecol. 2010, 209, 153–165. [Google Scholar] [CrossRef]
- Yan, T.; Yang, L.; Campbell, C.D. Microbial biomass and metabolic quotient of soils under different land use in the Three Gorges Reservoir area. Geoderma 2003, 115, 129–138. [Google Scholar] [CrossRef]
- Yang, Y.; Li, C. Photosynthesis and growth adaptation of Pterocarya stenoptera and Pinus elliottii seedlings to submergence and drought. Photosynthetica 2016, 54, 120–129. [Google Scholar] [CrossRef]
- Zhang, Q.; Lou, Z. The environmental changes and mitigation actions in the Three Gorges Reservoir region, China. Environ. Sci. Policy 2011, 14, 1132–1138. [Google Scholar] [CrossRef]
- Veach, A.M.; Dodds, W.K.; Jumpponen, A. Woody plant encroachment, and its removal, impact bacterial and fungal communities across stream and terrestrial habitats in a tallgrass prairie ecosystem. Fems Microbiol. Ecol. 2015, 91. [Google Scholar] [CrossRef] [PubMed]
- Osborne, L.L.; Kovacic, D.A. Riparian vegetated buffer strips in water-quality restoration and stream management. Freshwater Biol. 1993, 29, 243–258. [Google Scholar] [CrossRef]
- Richardson, D.; Holmes, P.; Esler, K.; Galatowitsch, S.; Stromberg, J.; Kirkman, S.; Pysek, P.; Hobbs, R. Riparian vegetation: Degradation, alien plant invasions, and restoration prospects. Divers. Distrib. 2007, 13, 126–139. [Google Scholar] [CrossRef]
- Wang, C.; Li, C.; Wei, H.; Xie, Y.; Han, W. Effects of long-term periodic submergence on photosynthesis and growth of Taxodium distichum and Taxodium ascendens saplings in the hydro-fluctuation zone of the Three Gorges Reservoir of China. PLoS ONE 2016, 11, e0162867. [Google Scholar] [CrossRef] [PubMed]
- Acosta-Martínez, V.; Cruz, L.; Sotomayor-Ramírez, D.; Pérez-Alegría, L. Enzyme activities as affected by soil properties and land use in a tropical watershed. Appl. Soil Ecol. 2007, 35, 35–45. [Google Scholar] [CrossRef]
- Cui, Y.; Fang, L.; Guo, X.; Wang, X.; Zhang, Y.; Li, P.; Zhang, X. Ecoenzymatic stoichiometry and microbial nutrient limitation in rhizosphere soil in the arid area of the northern Loess Plateau, China. Soil Biol. Biochem. 2018, 116, 11–21. [Google Scholar] [CrossRef]
- Stone, M.M.; DeForest, J.L.; Plante, A.F. Changes in extracellular enzyme activity and microbial community structure with soil depth at the Luquillo Critical Zone Observatory. Soil Biol. Biochem. 2014, 75, 237–247. [Google Scholar] [CrossRef]
- Spohn, M.; Widdig, M. Turnover of carbon and phosphorus in the microbial biomass depending on phosphorus availability. Soil Biol. Biochem. 2017, 113, 53–59. [Google Scholar] [CrossRef]
- Richardson, A.E.; Barea, J.M.; Mcneill, A.M.; Prigent-Combaret, C. Acquisition of phosphorus and nitrogen in the rhizosphere and plant growth promotion by microorganisms. Plant Soil 2009, 321, 305–339. [Google Scholar] [CrossRef]
- Ajwa, H.A.; Dell, C.J.; Rice, C.W. Changes in enzyme activities and microbial biomass of tallgrass prairie soil as related to burning and nitrogen fertilization. Soil Biol. Biochem. 1999, 31, 769–777. [Google Scholar] [CrossRef]
- Tischer, A.; Blagodatskaya, E.; Hamer, U. Microbial community structure and resource availability drive the catalytic efficiency of soil enzymes under land-use change conditions. Soil Biol. Biochem. 2015, 89, 226–237. [Google Scholar] [CrossRef]
- Loeppmann, S.; Semenov, M.; Blagodatskaya, E.; Kuzyakov, Y. Substrate quality affects microbial and enzyme activities in rooted soil. J. Plant Nut. Soil Sci. 2016, 179, 39–47. [Google Scholar] [CrossRef]
- Ye, C.; Cheng, X.; Zhang, Y.; Wang, Z.; Zhang, Q. Soil nitrogen dynamics following short-term revegetation in the water level fluctuation zone of the Three Gorges Reservoir, China. Ecol. Eng. 2012, 38, 37–44. [Google Scholar] [CrossRef]
- Bao, S.D. Soil Agricultural Chemistry Analysis, 3rd ed.; China Agriculture Press: Beijing, China, 1999; pp. 30–109. ISBN 9787109066441. [Google Scholar]
- Rodríguez-Kábana, R. The effects of crop rotation and fertilization on soil xylanase activity in a soil of the southeastern United States. Plant Soil 1982, 69, 97–104. [Google Scholar] [CrossRef]
- Nannipieri, P.; Ceccanti, B.; Cervelli, S.; Matarese, E. Extraction of phosphatase, urease, proteases, organic carbon, and nitrogen from soil. Soil Sci. Soc. Am. J. 1980, 44, 1011–1016. [Google Scholar] [CrossRef]
- Ye, S.; Yang, Y.; Xin, G.; Wang, Y.; Ruan, L.; Ye, G. Studies of the Italian ryegrass–rice rotation system in southern China: Arbuscular mycorrhizal symbiosis affects soil microorganisms and enzyme activities in the Lolium mutiflorum L. rhizosphere. Appl. Soil Ecol. 2015, 90, 26–34. [Google Scholar] [CrossRef]
- Vance, E.D.; Brookes, P.C.; Jenkinson, D.S. An extraction method for measuring soil microbial biomass C. Soil Biol. Biochem. 1987, 19, 703–707. [Google Scholar] [CrossRef]
- Brookes, P.C.; Landman, A.; Pruden, G.; Jenkinson, D.S. Chloroform fumigation and the release of soil nitrogen: A rapid direct extraction method to measure microbial biomass nitrogen in soil. Soil Biol. Biochem. 1985, 17, 837–842. [Google Scholar] [CrossRef]
- Brookes, P.C.; Powlson, D.S.; Jenkinson, D.S. Measurement of microbial biomass phosphorus in soil. Soil Biol. Biochem. 1982, 14, 319–329. [Google Scholar] [CrossRef]
- Wu, J.S.; Lin, Q.M.; Huang, Q.Y.; Xiao, H.A. Soil Microbial Biomass Determination Method and Its Application, 1st ed.; Meteorological Press: Beijing, China, 2006; pp. 59–81. ISBN 7-5029-4158-4. [Google Scholar]
- Baldrian, P.; Merhautová, V.; Petránková, M.; Cajthaml, T.; Šnajdr, J. Distribution of microbial biomass and activity of extracellular enzymes in a hardwood forest soil reflect soil moisture content. Appl. Soil Ecol. 2010, 46, 177–182. [Google Scholar] [CrossRef]
- Yoshitake, S.; Tabei, N.; Mizuno, Y.; Yoshida, H.; Sekine, Y.; Tatsumura, M.; Koizumi, H. Soil microbial response to experimental warming in cool temperate semi-natural grassland in Japan. Ecol. Res. 2015, 30, 235–245. [Google Scholar] [CrossRef]
- Zavisic, A.; Polle, A. Dynamics of phosphorus nutrition, allocation and growth of young beech (Fagus sylvatica L.) trees in P-rich and P-poor forest soil. Tree Physiol. 2017, 38, 37–51. [Google Scholar] [CrossRef] [PubMed]
- Spohn, M.; Zavišić, A.; Nassal, P.; Bergkemper, F.; Schulz, S.; Marhan, S.; Schloter, M.; Kandeler, E.; Polle, A. Temporal variations of phosphorus uptake by soil microbial biomass and young beech trees in two forest soils with contrasting phosphorus stocks. Soil Biol. Biochem. 2018, 117, 191–202. [Google Scholar] [CrossRef]
- Lennon, J.T.; Jones, S.E. Microbial seed banks: The ecological and evolutionary implications of dormancy. Nat. Rev. Microbiol. 2011, 9, 119–130. [Google Scholar] [CrossRef] [PubMed]
- Salazar, A.; Sulman, B.N.; Dukes, J.S. Microbial dormancy promotes microbial biomass and respiration across pulses of drying-wetting stress. Soil Biol. Biochem. 2018, 116, 237–244. [Google Scholar] [CrossRef]
- Blagodatskaya, E.; Kuzyakov, Y. Active microorganisms in soil: Critical review of estimation criteria and approaches. Soil Biol. Biochem. 2013, 67, 192–211. [Google Scholar] [CrossRef]
- Jastrow, J.D.; Amonette, J.E.; Bailey, V.L. Mechanisms controlling soil carbon turnover and their potential application for enhancing carbon sequestration. Clim. Chang. 2007, 80, 5–23. [Google Scholar] [CrossRef]
- Zhang, S.; Li, Q.; Ying, L.; Zhang, X.; Liang, W. Contributions of soil biota to C sequestration varied with aggregate fractions under different tillage systems. Soil Biol. Biochem. 2013, 62, 147–156. [Google Scholar] [CrossRef]
- Fang, X.; Zhou, G.; Li, Y.; Liu, S.; Chu, G.; Xu, Z.; Liu, J. Warming effects on biomass and composition of microbial communities and enzyme activities within soil aggregates in subtropical forest. Biol. Fert. Soils 2016, 52, 353–365. [Google Scholar] [CrossRef]
- Sollins, P.; Homann, P.; Caldwell, B.A. Stabilization and destabilization of soil organic matter: Mechanisms and controls. Geoderma 1996, 74, 65–105. [Google Scholar] [CrossRef]
- Stark, S.; Männistö, M.K.; Eskelinen, A. Nutrient availability and pH jointly constrain microbial extracellular enzyme activities in nutrient-poor tundra soils. Plant Soil 2014, 383, 373–385. [Google Scholar] [CrossRef]
- Bettinahm, S.; Wang, C.P.; Chang, S.C.; Egbert, M. High precipitation causes large fluxes of dissolved organic carbon and nitrogen in a subtropical montane Chamaecyparis forest in Taiwan. Biogeochemistry 2010, 101, 243–256. [Google Scholar]
- Jost, G.; Dirnböck, T.; Grabner, M.T.; Mirtl, M. Nitrogen leaching of two forest ecosystems in a karst watershed. Water Air Soil Pollut. 2011, 218, 633–649. [Google Scholar] [CrossRef]
- Xu, Z.; Yu, G.; Zhang, X.; He, N.; Wang, Q.; Wang, S.; Wang, R.; Zhao, N.; Jia, Y.; Wang, C. Soil enzyme activity and stoichiometry in forest ecosystems along the North-South Transect in eastern China (NSTEC). Soil Biol. Biochem. 2017, 104, 152–163. [Google Scholar] [CrossRef]
- Johnson, D.; Moore, L.; Green, S.; Leith, I.D.; Sheppard, L.J. Direct and indirect effects of ammonia, ammonium and nitrate on phosphatase activity and carbon fluxes from decomposing litter in peatland. Environ. Pollut. 2010, 158, 3157–3163. [Google Scholar] [CrossRef] [PubMed]
- Fatemi, F.R.; Fernandez, I.J.; Simon, K.S.; Dail, D.B. Nitrogen and phosphorus regulation of soil enzyme activities in acid forest soils. Soil Biol. Biochem. 2016, 98, 171–179. [Google Scholar] [CrossRef]
- Gress, S.E.; Nichols, T.D.; Northcraft, C.C.; Peterjohn, W.T. Nutrient limitation in soils exhibiting differing nitrogen availabilities: What lies beyond nitrogen saturation? Ecology 2007, 88, 119–130. [Google Scholar] [CrossRef]
- Lambers, H.; Shane, M.W.; Cramer, M.D.; Pearse, S.J.; Veneklaas, E.J. Root structure and functioning for efficient acquisition of phosphorus: Matching morphological and physiological traits. Ann. Bot. 2006, 98, 693–713. [Google Scholar] [CrossRef] [PubMed]
- Cleveland, C.C.; Townsend, A.R.; Schmidt, S.K.; Constance, B.C. Soil microbial dynamics and biogeochemistry in tropical forests and pastures, Southwestern Costa Rica. Ecol. Appl. 2003, 13, 314–326. [Google Scholar] [CrossRef]
- Hall, S.J.; Silver, W.L. Iron oxidation stimulates organic matter decomposition in humid tropical forest soils. Glob. Chang. Biol. 2013, 19, 2804–2813. [Google Scholar] [CrossRef] [PubMed]
- Zeng, Q.; Liu, Y.; Fang, Y.; Ma, R.; Lal, R.; An, S.; Huang, Y. Impact of vegetation restoration on plants and soil C: N: P stoichiometry on the Yunwu Mountain Reserve of China. Ecol. Eng. 2017, 109, 92–100. [Google Scholar] [CrossRef]
- Cleveland, C.C.; Liptzin, D. C: N: P stoichiometry in soil: Is there a “Redfield ratio” for the microbial biomass? Biogeochemistry 2007, 85, 235–252. [Google Scholar] [CrossRef]
- Reiners, W.A. Complementary models for ecosystems. Am. Nat. 1986, 127, 59–73. [Google Scholar] [CrossRef]
- Li, X.Z.; Qu, Q.H. Soil microbial biomass carbon and nitrogen in Mongolian grassland. Acta Pedol. Sin. 2002, 39, 91–98. [Google Scholar]
- Xue, S.; Liu, G.B.; Dai, Q.H.; Dang, X.H.; Zhou, P. Effect of different vegetation restoration models on soil microbial biomass in eroded hilly Loess Plateau. J. Nat. Resour. 2007, 22, 20–27. [Google Scholar] [CrossRef]
- Xu, X.; Hui, D.; King, A.W.; Song, X.; Thornton, P.E.; Zhang, L. Convergence of microbial assimilations of soil carbon, nitrogen, phosphorus, and sulfur in terrestrial ecosystems. Sci. Rep. 2015, 5, 17445. [Google Scholar] [CrossRef] [PubMed]
- Yu, Q.; Elser, J.J.; He, N.; Wu, H.; Chen, Q.; Zhang, G.; Han, X. Stoichiometric homeostasis of vascular plants in the Inner Mongolia grassland. Oecologia 2011, 166, 1–10. [Google Scholar] [CrossRef] [PubMed]
- Sterner, R.W.; Elser, J.J. Ecological Stoichiometry: The Biology of Elements from Molecules to the Biosphere, 1st ed.; Elser Princeton University Press: Princeton, NJ, USA, 2002; pp. 225–226. [Google Scholar]
- Tapia-Torres, Y.; Elser, J.J.; Souza, V.; García-Oliva, F. Ecoenzymatic stoichiometry at the extremes: How microbes cope in an ultra-oligotrophic desert soil. Soil Biol. Biochem. 2015, 87, 34–42. [Google Scholar] [CrossRef]
- Sinsabaugh, R.L.; Lauber, C.L.; Weintraub, M.N.; Ahmed, B.; Allison, S.D.; Crenshaw, C.; Contosta, A.R.; Cusack, D.; Frey, S.; Gallo, M.E.; et al. Stoichiometry of soil enzyme activity at global scale. Ecol. Lett. 2008, 11, 1252–1264. [Google Scholar] [CrossRef] [PubMed]
Figure 1.
(a) Variations in SMC under different treatments, (b) Variations in SMN under different treatments, (c) Variations in SMP under different treatments CK: unplanted treatment, SMC: Soil microbial biomass C, SMN: Soil microbial biomass N; SMP: Soil microbial biomass P. Different lowercase letters represent significant differences (p < 0.05) among different treatments.

Figure 2.
Radar graphs illustrating enzyme activities after revegetation. * and ** refer to significant differences between planted and unplanted soils at p < 0.05 and p < 0.01, respectively; ns refers to no significant difference.
Figure 2.
Radar graphs illustrating enzyme activities after revegetation. * and ** refer to significant differences between planted and unplanted soils at p < 0.05 and p < 0.01, respectively; ns refers to no significant difference.

Figure 3.
The redundancy analysis (RDA) used to identify the relationship between the soil variables and enzyme activity. The arrows indicate the soil parameters, and the red one indicates significant impacts of the soil parameters on soil enzyme activities (p < 0.05). The explained proportion of variability by Monte Carlo permutation is shown at the bottom.


Table 1.
Basic situation of the vegetation (Mean ± SE).
| Vegetation | Height (m) | Diameter Breast Height (DBH) (cm)/Stem Basal Diameter (mm) | Canopy (m2)/Coverage (%) |
|---|---|---|---|
| T. distichum | 4.67 ± 0.18 | 5.21 ± 0.41 | 2.16 ± 0.60 |
| C. dactylon | 0.86 ± 0.02 | 1.68 ± 0.03 | 99.17 ± 1.04 |
The DBH of T. distichum was measured, and the stem basal diameter of C. dactylon was measured. SE: standard error.
Table 2.
Comparisons of soil physicochemical properties under different vegetation types (Means ± SE, n = 3).
Table 2.
Comparisons of soil physicochemical properties under different vegetation types (Means ± SE, n = 3).
| Soils Covered by Vegetation | pH | SOC (g∙kg−1) | TN (g∙kg−1) | TP (g∙kg−1) | AN (mg∙kg−1) | AP (mg∙kg−1) | WC (%) | Density (g∙cm−3) | Porosity (%) |
|---|---|---|---|---|---|---|---|---|---|
| T. distichum | 6.84 ± 0.06a | 14.76 ± 1.42a | 1.32 ± 0.09a | 1.14 ± 0.01a | 72.31 ± 2.13b | 1.04 ± 0.11a | 47.7 ± 0.90a | 2.48 ± 0.05b | 35.25 ± 1.64a |
| C. dactylon | 6.94 ± 0.06a | 10.20 ± 2.21b | 1.06 ± 0.11a | 0.82 ± 0.08a | 75.51 ± 2.21b | 0.96 ± 0.01a | 45.1 ± 1.11a | 2.78 ± 0.56a | 38.68 ± 7.15a |
| CK | 7.14 ± 0.18a | 9.88 ± 0.54b | 0.67 ± 0.08b | 0.74 ± 0.27a | 85.26 ± 1.90a | 1.02 ± 0.11a | 33.8 ± 1.39b | 2.55 ± 0.01ab | 30.04 ± 0.35b |
Note: CK referred to as unplanted treatment. Different lowercase letters represent significant differences (p < 0.05) among different treatments. The same below. SOC: soil organic carbon; TN: total nitrogen; TP: total phosphorus; AN: available nitrogen; AP: available phosphorus; WC: Water content.
Table 3.
The element ratio of soil and microbial C, N, P, and stoichiometric homeostasis.
| Soils Covered by Vegetation | C/N(S) | C/P(S) | C/N(M) | C/P(M) | SMC/SOC (%) | SMN/TN (%) | SMP/TP (%) | H(C/N) | H(C/P) |
|---|---|---|---|---|---|---|---|---|---|
| T. distichum | 6.62 ± 0.08a | 7.54 ± 0.68a | 10.68 ± 0.19ab | 31.08 ± 1.09a | 5.25 ± 0.57a | 3.12 ± 0.30a | 1.32 ± 0.04ab | 4.48 | 2.69 |
| C. dactylon | 5.38 ± 0.64ab | 7.08 ± 0.85a | 8.78 ± 0.06b | 25.39 ± 1.64a | 4.85 ± 0.41a | 3.37 ± 0.26a | 1.53 ± 0.14a | 434.78 | 9.61 |
| CK | 4.37 ± 0.63b | 5.83 ± 0.56b | 14.21 ± 1.80a | 15.06 ± 1.75b | 2.84 ± 0.11b | 1.86 ± 0.39b | 1.11 ± 0.05b | 1.42 | 1.00 |
C/N (S), and C/P (S) refer to the ratio of C/N and C/P in the soil; C/N (M) and C/ P (M) refer to the ratio of C/N and C/P in the microbial biomass. H = 1/K. In equation, K is the slope of ln C:N (S) versus ln C:N (M) or slope of ln C:P (S) versus ln C:P (M).
© 2018 by the authors. Licensee MDPI, Basel, Switzerland. This article is an open access article distributed under the terms and conditions of the Creative Commons Attribution (CC BY) license (http://creativecommons.org/licenses/by/4.0/).
Share and Cite
MDPI and ACS Style
Ren, Q.; Song, H.; Yuan, Z.; Ni, X.; Li, C. Changes in Soil Enzyme Activities and Microbial Biomass after Revegetation in the Three Gorges Reservoir, China. Forests 2018, 9, 249. https://doi.org/10.3390/f9050249
AMA Style
Ren Q, Song H, Yuan Z, Ni X, Li C. Changes in Soil Enzyme Activities and Microbial Biomass after Revegetation in the Three Gorges Reservoir, China. Forests. 2018; 9(5):249. https://doi.org/10.3390/f9050249
Chicago/Turabian StyleRen, Qingshui, Hong Song, Zhongxun Yuan, Xilu Ni, and Changxiao Li. 2018. "Changes in Soil Enzyme Activities and Microbial Biomass after Revegetation in the Three Gorges Reservoir, China" Forests 9, no. 5: 249. https://doi.org/10.3390/f9050249
Note that from the first issue of 2016, this journal uses article numbers instead of page numbers. See further details here.