Article

Responses of the Carbon Storage and Sequestration Potential of Forest Vegetation to Temperature Increases in Yunnan Province, SW China

1
Key Laboratory of Tropical Forest Ecology, Xishuangbanna Tropical Botanical Garden, Chinese Academy of Sciences, Menglun 666303, China
2
University of Chinese Academy of Sciences, Beijing 100049, China
3
School of Ecological Engineering, Guizhou University of Engineering Science, Bijie 551700, China
4
Institute of Ecology and Geobotany, Yunnan University, Kunming 650091, China
5
School of GeoSciences, The University of Edinburgh, Edinburgh EH9 3FF, UK
6
Canada Centre for Remote Sensing, Natural Resources Canada, Ottawa, ON K1A 0E4, Canada
*
Author to whom correspondence should be addressed.
Forests 2018, 9(5), 227; https://doi.org/10.3390/f9050227
Submission received: 26 March 2018 / Revised: 20 April 2018 / Accepted: 23 April 2018 / Published: 25 April 2018
(This article belongs to the Special Issue Forest Landscape Ecology: Linking Past, Present, and Future Data)

Abstract

:
The distribution of forest vegetation and forest carbon sequestration potential are significantly influenced by climate change. In this study, a map of the current distribution of vegetation in Yunnan Province was compiled based on data from remote sensing imagery from the Advanced Land Observing Satellite (ALOS) from 2008 to 2011. A classification and regression tree (CART) model was used to predict the potential distribution of the main forest vegetation types in Yunnan Province and estimate the changes in carbon storage and carbon sequestration potential (CSP) in response to increasing temperature. The results show that the current total forest area in Yunnan Province is 1.86 × 10⁷ ha and that forest covers 48.63% of the area. As the temperature increases, the area of forest distribution first increases and then decreases, and it decreases by 11% when the temperature increases from 1.5 to 2 °C. The mean carbon density of the seven types of forest vegetation in Yunnan Province is 84.69 Mg/ha. The total carbon storage of the current forest vegetation in Yunnan Province is 871.14 TgC, and the CSP is 1100.61 TgC. The largest CSP (1114.82 TgC) occurs when the temperature increases by 0.5 °C. Incremental warming of 2 °C will sharply decrease the forest CSP, especially in those regions with mature coniferous forest vegetation. Semi-humid evergreen broad-leaved forests were highly sensitive to temperature changes, and the CSP of these forests will decrease with increasing temperature. Warm-hot coniferous forests have the greatest CSP in all simulation scenarios except the scenario of a 2 °C temperature increase. These results indicate that temperature increases can influence the CSP in Yunnan Province, and the largest impact emerged in the 2 °C increase scenario.

1. Introduction

Forest vegetation is a major terrestrial ecosystem and can provide low-cost options to mitigate climate change. However, climate change, especially temperature change [1], has significantly influenced the distribution [2], structure and ecology [3] of forest vegetation. Understanding the distribution of forest vegetation and assessing the present and future carbon balance of forest ecosystems are of scientific and policy interest.
Studies have explored the carbon storage and sequestration potential of forest vegetation in China with different models. Some used mature forests to estimate the carbon sequestration potential (CSP) of forest vegetation as a reference for the forests in China [4]. Some utilized logistic equations to estimate the biomass carbon storage at a species level in China [5,6]. Some used the data from the forest resource inventory to predict the forest vegetation carbon storage from 2005 to 2050 with a stage-classified matrix model [7]. However, these approaches cannot be used to predict future whole-forest CSP, especially under climate change. In addition, the prediction results at the national scale are not suitable for prediction at smaller scales. Therefore, other studies have been performed to focus on the regional scale in China. There had researchers used the TRIPLEX model to simulate the forest growth and carbon dynamics of the boreal and temperate forest in Northeast China [8]; however, this model is limited for modeling vegetation succession and future dynamics. Some studies have explored the carbon storage and carbon sequestration in Yunnan Province [9,10,11]. However, those studies have assumed that all forests are mature, and they have not considered the succession and distribution changes of forest vegetation. In addition, climate change causes high uncertainty, which is a key factor that regulates carbon sequestration in a forest.
Bioclimatic classification schemes are commonly used to predict changes in forest vegetation distribution caused by climate change [12]. The most popular method is the Holdridge Scheme [13], but this scheme does not provide a biological interpretation of the influences of plant life forms and attributes [14]. The dynamic vegetation model [15] considers the succession and physiological responses of forest vegetation to climate change but requires abundant data and many physiological parameters [16]. General linear models (GLM), general addition models (GAM) and classification and regression (CART) [17] models have been extensively used to assess climate-vegetation relationships. Researchers compared these three types of predictive models for Fagus crenata forests (Fagus crenata Blume) in Japan and concluded that when accounting for the interactions of predictor variables, CART could explain the relationships between climate and forest vegetation distribution with greater accuracy than GLM and GAM [18]. CART models are a practical technology that can be used to explore the relationships between environmental variables and vegetation [19], and they have been used to predict plant habitat distributions [20].
The Paris climate agreement aims to hold the global average temperature increase to well below 2 °C and pursues efforts to limit the temperature increases to 1.5 °C above preindustrial levels [21]. Some previous studies have suggested that the global temperature will reach the 2 °C increase between 2026 and 2060 [22]. Increasing temperatures affect forests by changing their geographical distributions [23] and exhibit dominant control over the natural distribution of forest ecosystems [24]. Temperature increases will change the regeneration capacities [25] of species and therefore alter the area of suitable habitat of forest vegetation. Changes in the forest distribution area entail changes in the forest biomass and hence changes in the CSP. Predicting how forest distributions respond to ongoing and anticipated global warming is a challenge with great ecological relevance [26].
Forest vegetation is characterized by large biomass carbon stocks that are vulnerable to both biological and non-biological factors [27]. Temperate and high-latitude forests have been shown to be carbon sinks; however, the carbon balance of subtropical forests has been less well studied [28]. Achieving an understanding of the current and potential future role of forest sequestration is required by international negotiations and is very important for both managed and unmanaged forests [29]. However, to date, few studies have investigated the potential impacts of further temperature increases on the distribution and carbon sequestration of natural vegetation.
Yunnan Province is one of the most climatically and biologically diverse areas in the world and has been noted to be sensitive to climate changes [2]. The landform, climate, ecosystem, and species diversity of the province are higher than in any comparably sized region in China. In this study, the space-for-time method based on climax theory was adopted, which hypothesizes that forest vegetation ultimately reaches a climax status by succession [30]. A spatial modeling approach based on a statistically derived bioclimatic factor is used to predict and understand the vegetation distribution and CSP of projected temperature increases within Yunnan Province. Our objectives are as follows: (1) determine the changes in forest vegetation distribution with temperature increases in Yunnan Province and (2) evaluate the responses of carbon storage and sequestration potential in forest vegetation in Yunnan Province to temperature increases.

2. Materials and Methods

2.1. Study Area

Yunnan Province is located in Southwest China between 21°08′32″–29°15′08″ N and 97°31′39″–106°11′47″ E. It is situated at the meeting point of three geographic regions: the eastern Asia monsoon region, the Tibetan Plateau region and the tropical monsoon region of southern Asia and Indo-China. The province has topographic complexity, with a large altitudinal range of 76 to 6740 m. Yunnan Province spans only 8° in latitude but exhibits all of the climate zones and land ecosystem types of China [31]. The climate is generally mild with a long growing period. There are cold winters at the higher elevations in the northwestern mountain regions, moderate temperatures in the middle plateau region, and tropical, hot and humid conditions at the lower elevations and valley bottoms in the southern region [32]. Yunnan’s rich ecosystems comprise over 30 ecosystem types according to the Chinese classification, which span from the lower tropical valleys and basins in the southern part to the barren high peaks and deep valleys in the northwestern part [33]. The ecosystems of Yunnan Province are sensitive to environmental change and are less stable than those in temperate zones [34].

2.2. Climate and Forest Vegetation Data

We selected six bioclimatic factors from the WorldClim dataset: annual mean temperature (TMA, °C), mean temperature of the warmest quarter (TMS, °C), minimum temperature of the coldest month (TMW, °C), annual precipitation (PRA, mm), precipitation of the warmest quarter (PRS, mm) and precipitation of the coldest quarter (PRW, mm). The resolution of all datasets is 1 × 1 km. TMS is a measure of the effective heat required for plant growth. TMW is a measure of extreme cold, which controls the altitudinal and northern range limit of evergreen broad-leaved forests [35]. PRS and PRW are measures of water supply during the growing and winter seasons, respectively. By performing paired samples t-tests, we confirmed that there were no significant differences between the WorldClim dataset and the dataset derived from 134 climate observation stations in Yunnan [36].
In this study, we investigated different climate change scenarios of air temperature due to anthropogenic influences based on the current climate background. Precipitation has not changed significantly over the past several decades in southwestern China [37]. As the temperature increases in the future, the change in precipitation is not sure [38]. Therefore, we considered the influence of temperature increases only. Here, we considered temperature (TMA, TMS and TMW) increases from 0 to 2 °C at 0.5 °C intervals with no changes in precipitation in each scenario.
We set up a vegetation database by combining field investigations with remote sensing identification. We drew a vegetation map based on remote sensing images from the Advanced Land Observing Satellite (ALOS) from 2008 to 2011 (Table 1), in the Albers equal-area conic projection and Krasovsky datum. We used the 1:50,000 topographic map for geometric correction of remote sensing images.
We were building the 1 × 1 km grid to resample vegetation data which was drawn from ALOS remote sensing by ArcGIS 10.2 (ESRI Inc., Redlands, CA, USA). The longitude and latitude records of the cells were taken from this map, which yielded the same spatial resolution as the climate data. A 10 × 10 km grid and global positioning system (GPS) point layer were built for accuracy tests. The Beijing 54 coordinates were adopted in all layers and subsequent processes. The 1 × 1 km spatial resolution was used to combine these data. The accuracy of the two methods was tested using the 10 × 10 km geographic grid point and the GPS point that was recorded in the field investigation and not used for interpretation. When assessing the accuracy by using the 10 × 10 km grid, we evaluated whether the altitude and image characteristics of the point matched the vegetation type. When testing the accuracy by using the GPS point, we determined whether the vegetation type was consistent with that recorded within a 0.25 km buffer area of the point. The validation results indicated that the vegetation map was highly accurate [39,40]. Thus, the vegetation map was used for the geographic distribution of vegetation data in Yunnan Province. In this study, we chose 7 dominant vegetation types, which are shown in Table 2.

2.3. Description of the CART Model

A CART model is built using the binary recursive partitioning method, and the results are a simple binary tree structure. Each branch of the binary tree represents a test result. CART models are a practical technology that can be used to explore the relationships between environmental variables and vegetation [41] and have been widely used to predict the distribution of plant habitat [20]. Minimum Gini coefficient values are used to evaluate the attributes of the model. A smaller Gini value indicates a higher “purity” of the samples and better divided results. The CART algorithm builds a tree before pruning, and the accuracy is often higher than that of the multi-tree algorithms because the binary tree cannot easily generate data fragments. Therefore, the CART model uses binary recursive partitioning and utilizes Boolean tests at the branch nodes. If a condition is met, then the sample is divided into the left branch; otherwise, the sample is divided down the right branch, and a binary decision tree is eventually formed.
We obtained the spatial vegetation data by encoding the forest vegetation and 1 × 1 km grid samples. We established the CART model by using the “Tree” program in R3.3.3 software (University of California, Berkeley, CA, USA). All climate-vegetation sampling data were divided into two data sets, one for validation and another for testing. The model was built using 70% of the data that was randomly selected; the rest of the data were used for pruning. Overfitting may occur during the modeling process; therefore, we used cross-validation rules to eliminate the least important tree using the “prune tree” function on the final model.
The area under the curve (AUC) derived from receiver operating characteristic (ROC) analysis was calculated to validate the performance of the CART model. The AUC values were interpreted for model accuracy using the following standards: 0.90–1.00: excellent, 0.8–0.90: good and 0.7–0.80: fair [42]. We divided the habitats into three categories: non-habitats, marginal habitats and suitable habitats, and the occurrence probability thresholds were obtained from the ROC analysis [43]. The areas where the predicted probability of occurrence was less than a low occurrence probability (0.01) were defined as non-habitats; the areas where the probability was equal to or greater than 0.01 but smaller than the optimal threshold were defined as marginal habitats; and the areas where the probability was greater than the optimal threshold were defined as suitable habitats. In this study, we selected the suitable habitats as potential habitats. It has been proved that climate factors can be used to build CART models [36].

2.4. Calculation of CSP

Using the Forest Identity concept [44], the area of forest vegetation (S, ha), the mean aboveground biomass (Wa, Mg/ha) (Table 3) and the forest vegetation biomass (W, TgC) can be linked using Equation (1).
W = Wa × S
The forest carbon storage was based on the biomass in the study area and was calculated according to the different forest carbon sequestration rates. We used a conversion coefficient of 0.5 [52] (the carbon content of per gram of dry matter) to calculate the forest carbon storage. We obtained the forest carbon storage by multiplying the carbon density by the forest vegetation distribution area. Suitable habitat and actual carbon storage were calculated by the following formula:
Wc = 0.5W
where Wc is forest carbon storage (TgC), W is the vegetation biomass of the forest (TgC), and 0.5 is the conversion coefficient.
We simulated the habitat area suitable for forest vegetation by using the CART model. We obtained the carbon sequestration potential (CSP) by subtracting the carbon storage of suitable habitat from the actual carbon storage:
Wp = WsuiWact
where Wp is the CSP (TgC), Wsui is the carbon storage of suitable habitat (TgC), and Wact is the actual carbon storage (TgC).

3. Results

3.1. Prediction Accuracy and Contribution of Climate Variables

The AUC values are greater than 0.8 and less than 0.9 for all simulation scenarios. Deviance-weighted scores (DWS) were applied to evaluate the contributions of each predictor variable to the model (Table 4). TMW was an overwhelmingly potent factor among the six climate variables, indicating that extremely cold temperatures in a year play a decisive role in the broad-scale distribution of the forest vegetation in Yunnan Province. TMS, PRS and PRW also affected the distribution to a small extent. TMA and PRA showed no contribution; thus, these variables are not shown in Table 4.

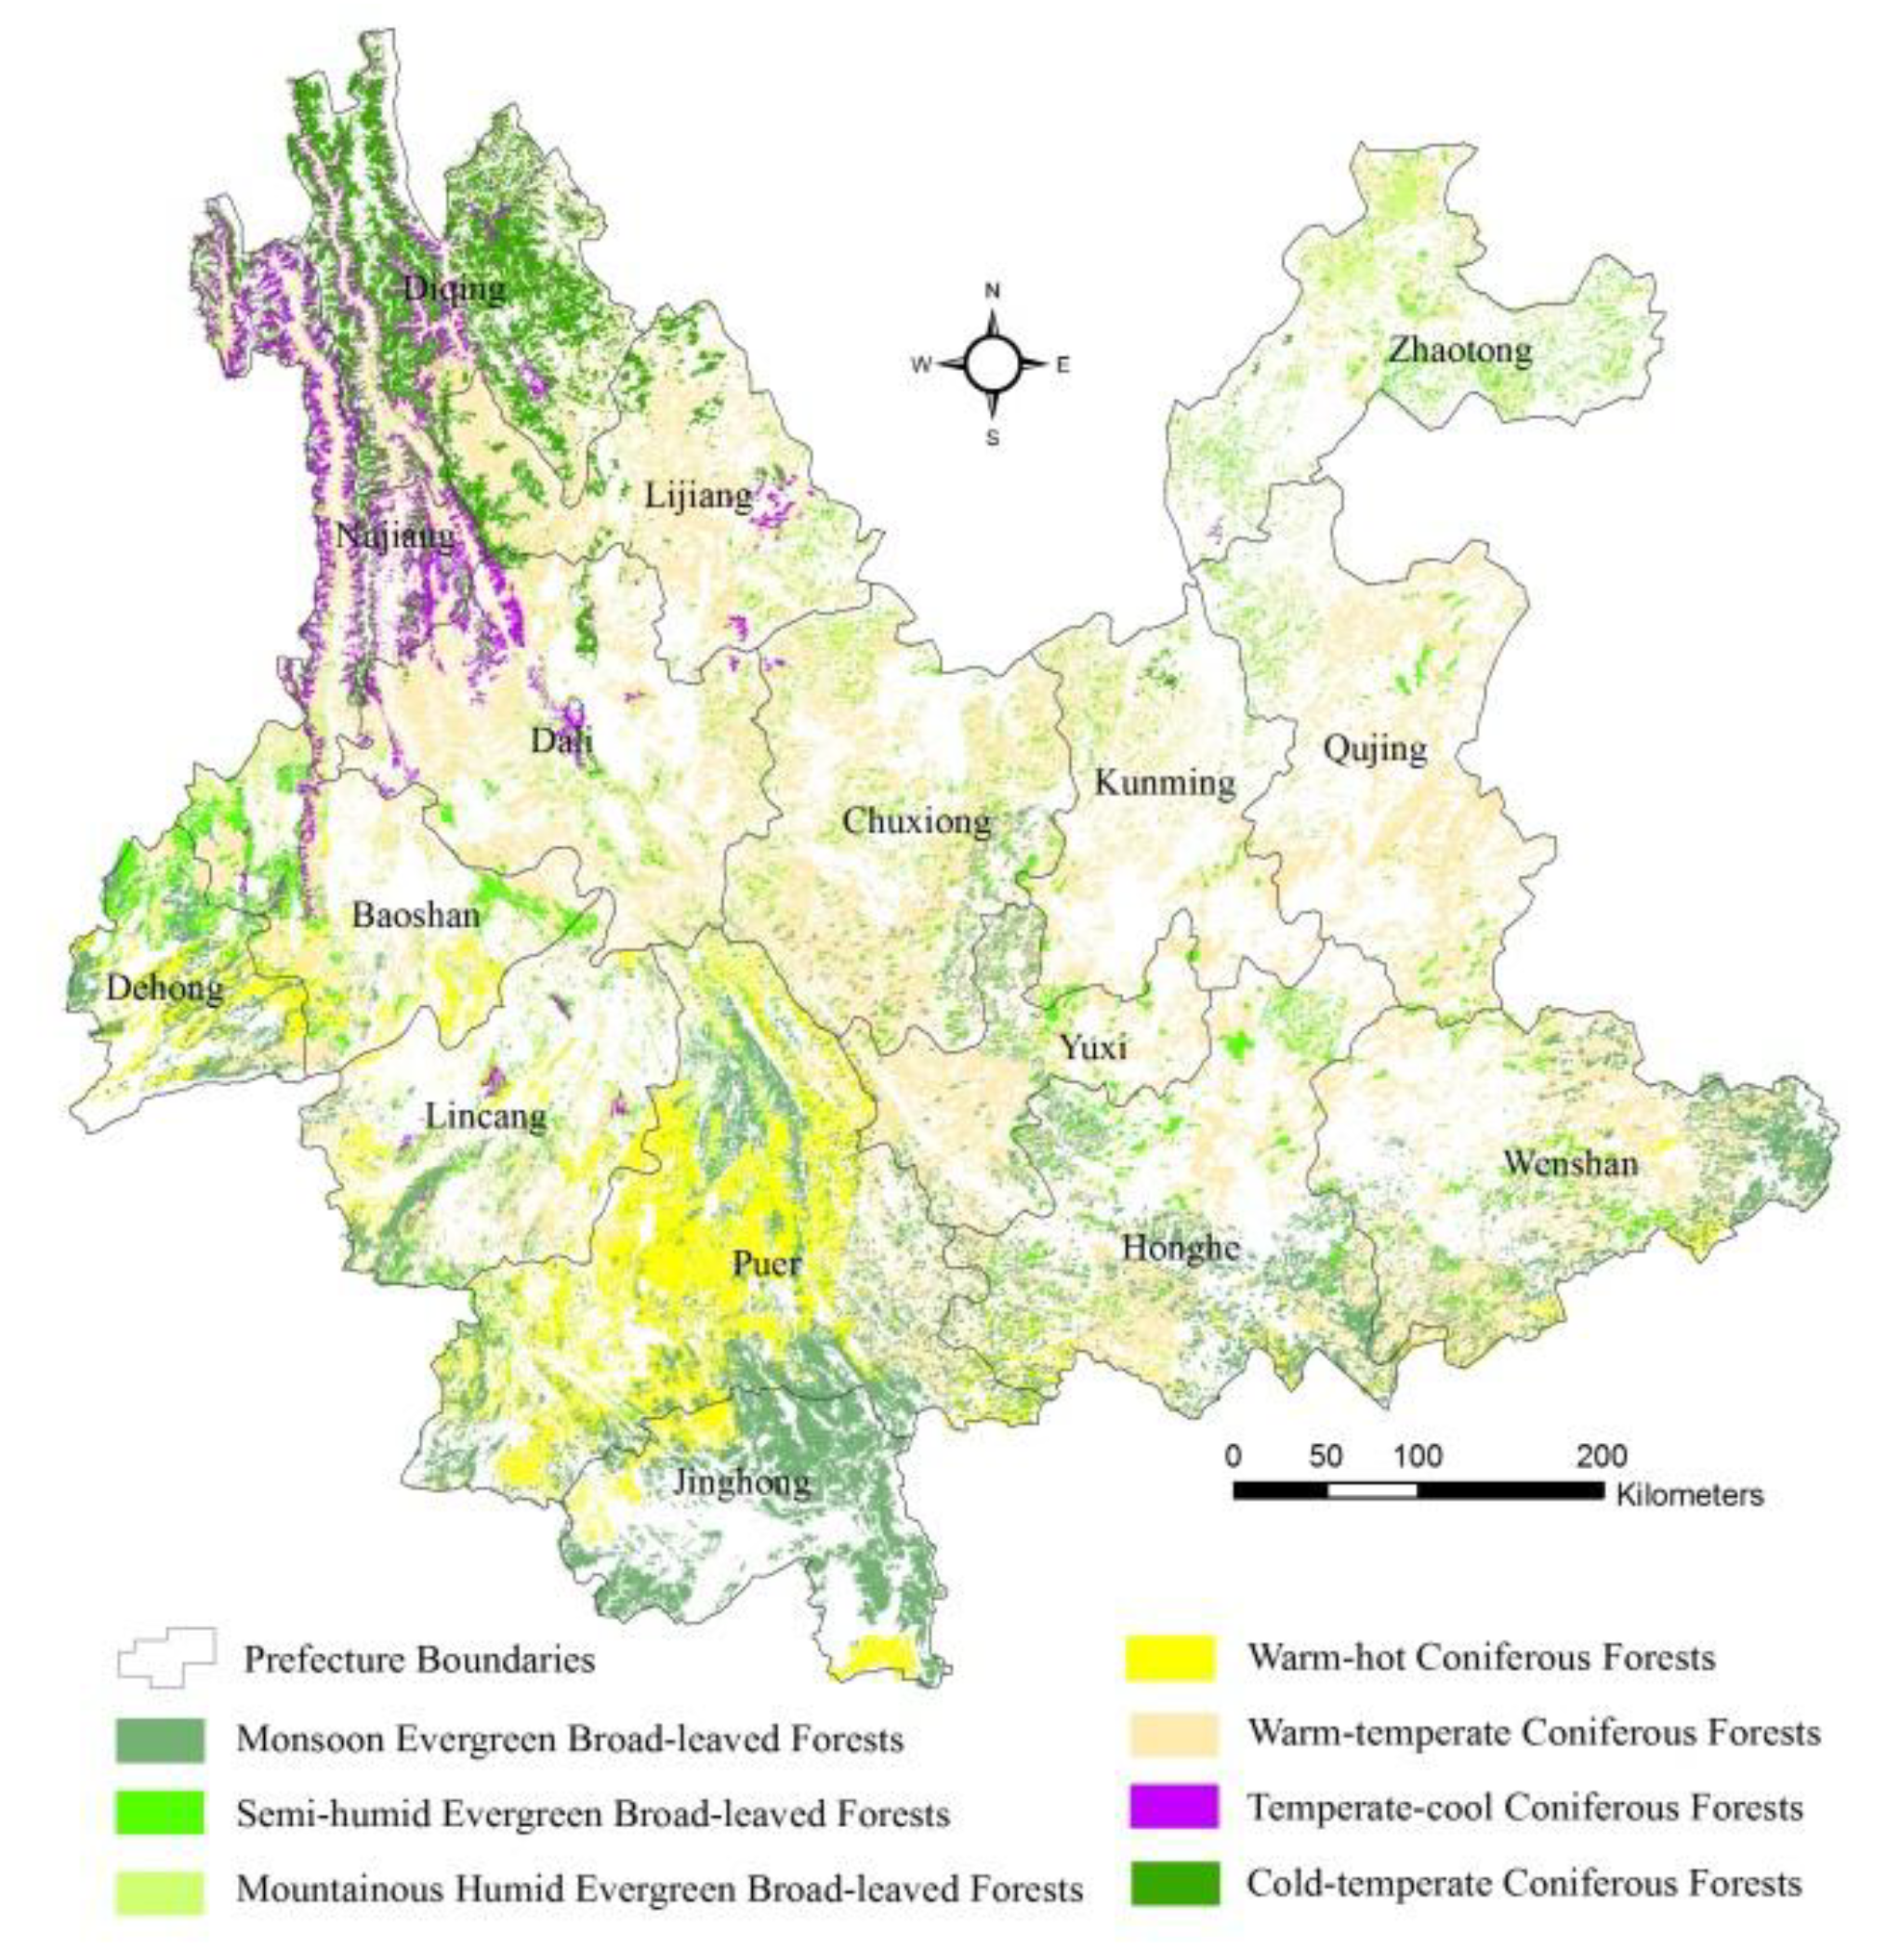
3.2. Distribution Area of Current Forest Vegetation

The map of the vegetation in Yunnan Province (Figure 1) shows that the main forest vegetation area in Yunnan Province was 1.86 × 10⁷ ha and that the forest coverage was 48.63%. The TCC and CTC types had small distribution areas and coverage. They were mainly distributed in northwestern Yunnan. The areas of TCC and CTC were 7.10 × 10⁵ ha and 1.35 × 10⁶ ha, respectively, and accounted for 1.85% and 3.52% of Yunnan’s land area, respectively. WHC was mainly distributed in Pu’er District and had an area of 1.94 × 10⁶ ha. MHEB had the smallest area (3.79 × 10⁵ ha) among the forest vegetation types and was mainly distributed in mountainous areas with higher elevations in Yunnan; MHEB accounted for 0.99% of Yunnan’s total land area. MEB was mainly distributed in southern Yunnan and had an area of 3.16 × 10⁶ ha. The SEB and WTC forests were intermixed and had the largest distributions, being spread throughout the central region of Yunnan. The areas of SEB and WTC were 1.47 × 10⁶ ha and 9.62 × 10⁶ ha, respectively, and accounted for 3.84% and 25.11% of the land area, respectively.

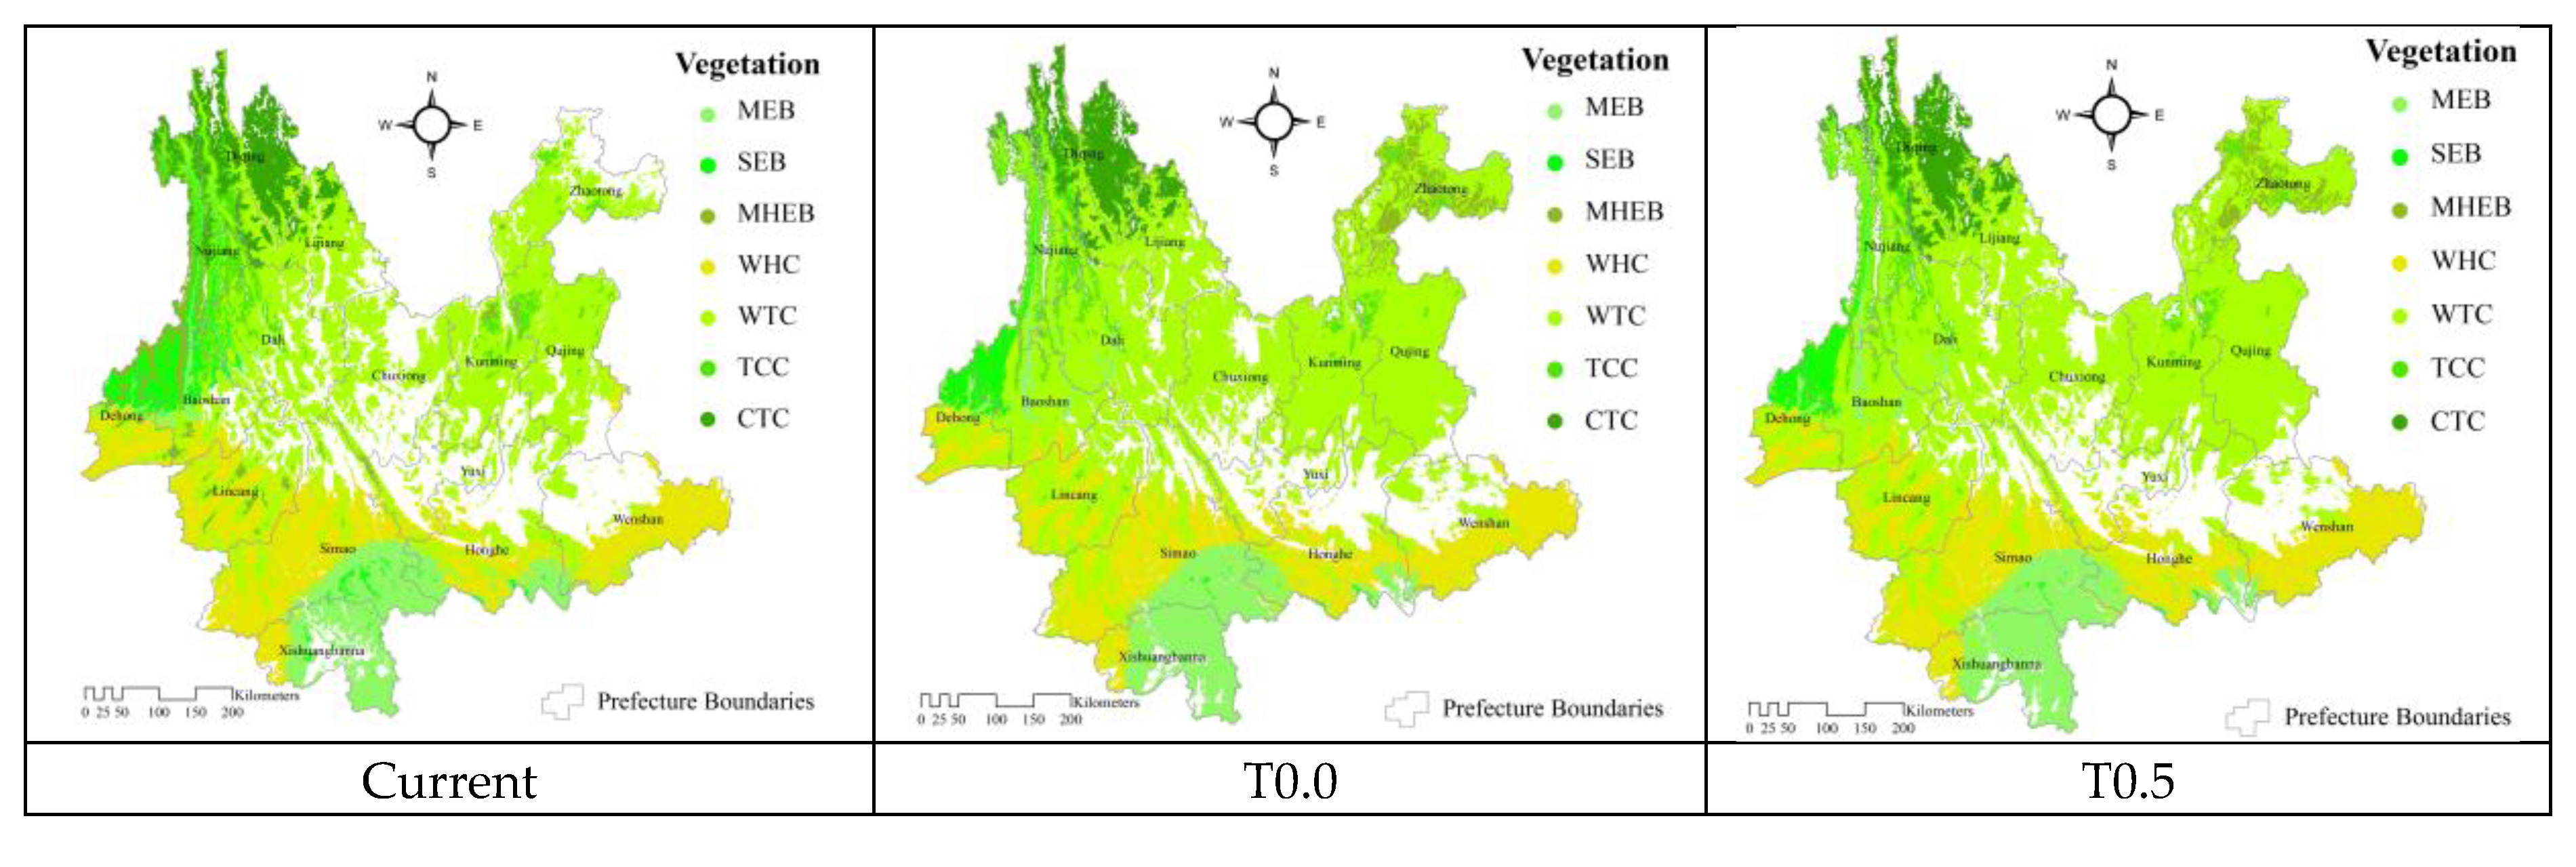
3.3. Potential Forest Vegetation Distribution

Under the T0.0 scenario, the forest vegetation ultimately reaches a climax status by succession. The entire forest area in Yunnan Province increased by 130.42% compared with the current forest vegetation distribution area. The vegetation distribution areas of the 7 selected forest types all increased under this scenario, especially WHC, which increased by 572.30%. As the temperature increased, the distribution area of all forest vegetation types (except WTC) decreased to varying extents (Table 5). The distribution area of WTC increased by approximately 30% in all of the simulation scenarios. When the temperature increased from 0.5 °C to 1.0 °C, the distribution area of MHEB decreased significantly. When the temperature increased from 1.5 °C to 2.0 °C, the distribution area of WHC decreased significantly. SEB was the forest type most sensitive to temperature, with its distribution area decreasing by more than half with a temperature increase of 0.5 °C (Figure 2). In general, the mean forest distribution area first increased and then decreased with increasing temperature. When the temperature increased by 2 °C, the mean forest distribution area in Yunnan decreased by 11% (Table 5).

3.4. Carbon Storage and CSP

The total current actual carbon storage of the seven types of forest vegetation in Yunnan Province was 871.14 TgC. Among the forest types, MEB and WTC had the highest levels of actual carbon storage due to their large distribution areas, with values of 205.42 TgC and 172.72 TgC, respectively. Although MHEB has the highest mean biomass, it had lower actual carbon storage, with a value of 75.93 TgC. TCC had a high mean biomass, but because of its small distribution area and coverage, it had the lowest value (56.40 TgC) of actual carbon storage among the forest types. In contrast, WTC had a low mean biomass but a wide distribution, resulting in a high value of actual carbon storage. SEB, WHC and CTC had intermediate levels of actual carbon storage, which were 99.91 TgC, 137.78 TgC and 122.98 TgC, respectively. The total actual carbon storage in coniferous forests was 489.88 TgC, accounting for 56.23% of the total.
Overall, the CSP of the seven types of forest vegetation in Yunnan Province increased and then decreased as the temperature increased. In particular, the CSP decreased sharply from 1059.19 TgC to 647.24 TgC when the temperature increased by 2 °C. On the whole, the forest vegetation exhibited the largest CSP (1114.82 TgC) when the temperature increased by 0.5 °C. The different forest vegetation types in Yunnan Province showed varying increases in carbon sink ability as the temperature increased except SEB, which exhibited a negative CSP value. Among the forest types, WHC and WTC exhibited the largest CSP values when the temperature increased. The results show that incremental warming of 2 °C will sharply decrease forest carbon sequestration in Yunnan Province. Much of the observed decrease was due to WHC, which showed a decrease in CSP from 734.52 TgC to 234.96 TgC (Table 6).

4. Discussion

4.1. Model Accuracy Test

The AUC values of all models were greater than 0.8 and less than 0.9 in all simulation scenarios (Table 5). The high accuracy of the model suggested that the distribution of vegetation at the province scale can be explained by climatic variables. The accuracy of the carbon density estimate is very important and should be discussed. Although future vegetation distributions were predicted by the CART model under a rising temperature scenario, the present carbon density values were used to calculate the future carbon storage in Yunnan Province in this study. However, this method is not entirely accurate because carbon density in the future will change under future climate conditions [53,54]. Carbon sequestration depends on both vegetation composition and the climate [53]. Although the past and future vegetation compositions may be similar to the present composition, they may have different carbon densities under different future climate conditions [55]. Hence, the application of the modern carbon density database [56] might underestimate or overestimate past and future terrestrial carbon storage values. Thus, changes in carbon density under future climate conditions could have a significant impact on the estimates of carbon storage in Yunnan Province. In this sense, new approaches, such as dynamic global vegetation models (DGVMs) that couple biogeography and biogeochemistry models are encouraging [57] because they consider the effects of changes in both the climate and atmospheric CO2 concentrations on both vegetation redistribution and carbon density [53].

4.2. The Status of Forest Vegetation Carbon Storage in Yunnan

The carbon density of the forest vegetation in Yunnan Province was 84.69 Mg/ha, which was twice the average carbon density in China (41.32 Mg/ha) [58], similar to the worldwide average carbon density (86.00 Mg/ha) [59] and greater than the subtropical forest carbon density (66–77 Mg/ha) [60]. These results can be interpreted as follows. First, the forest cover in Yunnan Province is high and mostly consists of mature coniferous forest vegetation [4]. Furthermore, the International Biosphere Project (IBP) may have overestimated worldwide forest carbon storage because of an insufficient number of sampling sites [61].
The vegetation carbon storage in the forests of Yunnan Province was approximately 871.14 TgC, which was 14.9% of the total forest vegetation carbon storage in China (5.85 PgC; Fang et al., 2007) and 0.24% of the worldwide forest vegetation carbon storage (360 PgC; Pan et al., 2011). The main reason for this difference was that the other studies used the national forest inventory data to estimate carbon storage, which led to the underestimation of the forest vegetation distribution area. In addition, differences in vegetation classification schemes and estimation methods result in different carbon storage estimates. The forest vegetation in Yunnan Province is a large carbon sink in China and plays an important role in the world.

4.3. The Effects of Temperature Increases on Forest Vegetation Carbon Storage and CSP

The successful simulation of the distribution of forest vegetation under different climate conditions achieved here is partly attributable to the accurate simulation of the relative distribution of forest carbon. Previous studies have indicated that temperature is the main factor that affects forest vegetation carbon storage in China, the Midwestern United States [62], Russia [63], Canada, and the Netherlands [64], among other places. The effect of temperature differs among places and vegetation types. Temperature increases have been found to increase forest carbon storage in colder and wetter ecoregions [65] but reduce the rates of net above-ground biomass increases in the Amazon rainforest [66] and the growth rates of mature rainforests [67]. Rising temperatures affect forest carbon storage in two ways. First, rising temperatures alter vegetation types [68] and vegetation boundaries [69] and can transform coniferous forest regions into broad-leaved forest regions [68]. Second, rising temperatures increase species diversity [70], which reduces the sensitivity to temperature and influences CO2 and energy exchange [71]. A temperature increase of 4 °C will increase the absorption and saturation of CO2 in forest vegetation [72]. Forests respond positively to the influences of rising temperatures [73,74], and temperature increases have positive effects on forest growth and wood production in the short-to-medium term [75]. In turn, stand age has an influence on forest carbon storage. With increasing stand age, the carbon storage of forest increases quickly, then reaches a maximum value [76]. At last, the carbon storage of forest decreases to a relatively stable level because of the limit of hydraulic resistance [77], and the growth of wood becomes extremely slow or is almost not change [78]. Future studies can consider further the effect of stand age.
In Yunnan Province, the forest distribution area changed by 5.74%, 3.30%, 5.31% and −11.10% when the temperature increased by 0.5, 1.0, 1.5 and 2.0 °C, respectively. The total amount of carbon sequestration in the worldwide forest is approximately 360 PgC [32], and the CSP of mature forest constitutes 49.32 to 58.37% of total forest CSP [78]. Among forest types, subtropical forests have higher CSP [4] but are more sensitive to temperature changes. The carbon sequestration rate of coniferous forests is more impacted by climate change than is that of deciduous forests [79] in subtropical regions. Much of the coniferous forest vegetation in Yunnan Province is mature vegetation [4] and is easily affected by rising temperatures (Table 5). Temperature increases from 0 °C to 1.5 °C did not have severe impacts on the CSP of the forests in Yunnan Province. However, a temperature increase of 2 °C resulted in sharp decreases in the CSP of coniferous forest vegetation (Table 6). This result indicated that the CSP of mature forest vegetation was more easily influenced by temperature increases than broad-leaved forest vegetation. Mature coniferous forests are mainly distributed in the Hengduan Mountains of northwestern Yunnan Province. In this region, the mean annual temperature over the last two decades has increased at a rate of 0.6 °C/10 year, and the vegetation distribution has changed in the past [80]. In conclusion, rising temperature has impacted the CSP in Yunnan Province by affecting the mature forest vegetation, especially coniferous forest vegetation. In this paper, we hypothesize only that the forest is balanced with current climate conditions, and the forest will develop to the climax. At last, the places where are uitable for forest growth will full of this kind of forest vegetaiton in turn. With the development of forest vegetation, the CO2 will increase and have fertilization effects [81], revealing underestimates of forest carbon storage in our projections. However, nitrogen limitation is a driving factor of the forest carbon storage responses to elevated CO₂ [82]. It suppresses the positive vegetation response to enhanced CO2 fertilization [83], and this same limitation effect has been observed in a grassland ecosystem [84]. Other problems are anthropogenic effects, because the need for cropland will lead to over-estimates of the carbon sink and coupling effects of temperature with other climate factors. In this study, the influence of temperature change was taken into consideration, and there was a gap between it and the actual effect. Future studies can consider the comprehensive effect.

4.4. The CSP of Warm-Hot Coniferous Forest

The warm-hot coniferous forest had the highest CSP in Yunnan Province under each simulation scenario except the temperature increase of 2 °C (Table 6). These results are similar to those obtained in India, that noted that the total forest biomass and carbon pool of Pinus kesiya forest were greater than those of other pine forests studied in other regions of the world [85]. In the present study, the forest distribution area was found to change by −5.83%, −4.89%, −5.83% and −59.76% when the temperature increased by 0.5, 1.0, 1.5 and 2.0 °C, respectively. The main species composition was P. kesiya which can occupy a variety of habitats and is mainly distributed in Southwestern Yunnan Province [86]. In the distribution area, the annual precipitation ranges from 1000 to 1500 mm, the relative humidity reaches 80%, and the elevation ranges from 600 to 1950 m [87]. P. kesiya trees have rapid growth [88] and strong natural regeneration ability. The average carbon sequestration rate of P. kesiya is 12.7 Mg C ha−1 yr−1 in the Philippines [88]. If P. kesiya and Pinus yunnanensis share the same habitat, the two species exhibit converging development [87]. The emission-reduction effect of the P. kesiya afforestation project in Yunnan Province has been pronounced [89].

5. Conclusions

Classification and regression tree models are capable of modeling the distribution of forest vegetation, especially suitable habitat and the carbon sequestration potential under changing climatic conditions. Based on the simulated results, several conclusions can be drawn. The carbon sequestration potential of coniferous forests is more strongly influenced by temperature increases than the carbon sequestration potential of deciduous forests. Temperature increases can influence the carbon storage and carbon sequestration potential in Yunnan Province. Warm-hot coniferous forests have a large current carbon storage and carbon sequestration potential, and this vegetation type is especially sensitive to temperature increases of 2 °C compared with other forest vegetation types. However, warm-temperate coniferous forests have the largest distribution area, and the carbon sequestration potential will increase when temperatures increase by 2 °C. The carbon sequestration of semi-humid evergreen broad-leaved forests is most sensitive to temperature increases, and it will decrease when temperatures increase by 0.5 °C. Overall, the forest vegetation in Yunnan Province has high carbon density, carbon storage and carbon sequestration potential. Temperature increases of 2 °C will sharply decrease the carbon sequestration potential of the forests in Yunnan Province.

Author Contributions

Y.Z. and M.P. conceived and designed the study. M.P., C.W., W.L. and R.Z. performed the data collection, data analysis and literature search. L.S., Y.L., Q.S., X.F., Y.J., J.G., and Y.L. contributed to data interpretation and discussion. R.Z. wrote the paper. J.G. and S.W. reviewed and edited the manuscript. All authors read and approved the manuscript.

Acknowledgments

We gratefully acknowledge the students and staff of the Institute of Ecology and Geobotany of Yunnan University for assisting with the fieldwork and interpretation of vegetation. In addition, this study was supported by National Natural Science Foundation of China (U1602234), the National Key Research and Development Program of China (2016YFC0502105), the National Natural Science Foundation of China (31770528), the CAS 135 project (2017XTBG-F01, 2017XTBG-T01), and the Chinese Academy of Sciences President’s International Fellowship Initiative (2017 VCA0036).

Conflicts of Interest

The authors declare no conflict of interest.

References

  1. Hui, D.; Deng, Q.; Tian, H.; Luo, Y. Climate change and carbon sequestration in forest ecosystems. In Handbook of Climate Change Mitigation and Adaptation; Springer: Cham, Germany, 2017; pp. 555–594. [Google Scholar]
  2. Weng, E.; Zhou, G. Modeling distribution changes of vegetation in China under future climate change. Environ. Model. Assess. 2006, 11, 45–58. [Google Scholar] [CrossRef]
  3. Watson, R.T.; Zinyowera, M.C.; Moss, R.H. Climate Change 1995 Impacts, Adaptations and Mitigation of Climate Change: Scientific-Technical Analysis; Cambridge University Press: Cambridge, UK, 1996. [Google Scholar]
  4. Liu, Y.C.; Yu, G.R.; Wang, Q.F.; Zhang, Y.J.; Xu, Z.H. Carbon carry capacity and carbon sequestration potential in China based on an integrated analysis of mature forest biomass. Sci. China Life Sci. 2014, 57, 1218–1229. [Google Scholar] [CrossRef] [PubMed]
  5. Xu, B.; Guo, Z.D.; Shilong, P.; Fang, J.Y. Biomass carbon stocks in China’s forests between 2000 and 2050: A prediction based on forest biomass-age relationships. Sci. China Life Sci. 2010, 53, 776–783. [Google Scholar] [CrossRef] [PubMed]
  6. He, N.; Wen, D.; Zhu, J.; Tang, X.; Xu, L.; Zhang, L.; Hu, H.; Huang, M.; Yu, G. Vegetation carbon sequestration in Chinese forests from 2010 to 2050. Glob. Chang. Biol. 2017, 23, 1575–1584. [Google Scholar] [CrossRef] [PubMed]
  7. Hu, H.; Wang, S.; Guo, Z.; Xu, B.; Fang, J. The stage-classified matrix models project a significant increase in biomass carbon stocks in china’s forests between 2005 and 2050. Sci. Rep. 2015, 5, 11203. [Google Scholar] [CrossRef] [PubMed]
  8. Peng, C.; Zhou, X.; Zhao, S.; Wang, X.; Zhu, B.; Piao, S.; Fang, J. Quantifying the response of forest carbon balance to future climate change in Northeastern China: Model validation and prediction. Glob. Planet. Chang. 2009, 66, 179–194. [Google Scholar] [CrossRef]
  9. Zhou, J.; Xu, S. Analysis of the current status and dynamics of forest carbon storage in Yunnan Province. For. Invent. Plan. 2016, 41, 17–23. [Google Scholar]
  10. Cai, L.S. Study on Carbon Storage of Forest Vegetation and Its Changes in Yunnan Province. Master’s Thesis, Southwest Forestry University, Kunming, China, 2009. [Google Scholar]
  11. Li, L. Dynamic Change and Carbon Sequestration of Forest Vegetation Carbon Potential Analysis from 1992 to 2007 in Yunnan. Master’s Thesis, Yunnan University of Finance and Economics, Kunming, China, 2012. [Google Scholar]
  12. Solomon, A.M.; Shugart, H. Vegetation Dynamics & Global Change; Springer Science & Business Media: Charlottesville, VA, USA, 1993. [Google Scholar]
  13. Holdridge, L.R. Life Zone Ecology; Tropical Sciences Centre: San Jose, Costa Rica, 1967. [Google Scholar]
  14. Sykes, M.T.; Prentice, I.C.; Laarif, F. Quantifying the impact of global climate change on potential natural vegetation. Clim. Chang. 1999, 41, 37–52. [Google Scholar] [CrossRef]
  15. Bonan, G.B.; Levis, S.; Sitch, S.; Vertenstein, M.; Oleson, K.W. A dynamic global vegetation model for use with climate models: Concepts and description of simulated vegetation dynamics. Glob. Chang. Biol. 2003, 9, 1543–1566. [Google Scholar] [CrossRef]
  16. Yates, D.N.; Kittel, T.G.F.; Cannon, R.F. Comparing the correlative holdridge model to mechanistic biogeographical models for assessing vegetation distribution response to climatic change. Clim. Chang. 2000, 44, 59–87. [Google Scholar] [CrossRef]
  17. Chipman, H.A.; George, E.I.; Mcculloch, R.E. Bayesian CART model search. J. Am. Stat. Assoc. 2012, 93, 935–948. [Google Scholar] [CrossRef]
  18. Matsui, T.; Yagihashi, T.; Nakaya, T.; Tanaka, N.; Taoda, H. Climatic controls on distribution of fagus crenata forests in Japan. J. Veg. Sci. 2004, 15, 57–66. [Google Scholar] [CrossRef]
  19. Michaelsen, J.; Schimel, D.S.; Friedl, M.A.; Davis, F.W.; Dubayah, R.C. Regression tree analysis of satellite and terrain data to guide vegetation sampling and surveys. J. Veg. Sci. 1994, 5, 673–686. [Google Scholar] [CrossRef]
  20. Vayssières, M.P.; Plant, R.E.; Allen-Diaz, B.H. Classification trees: An alternative non-parametric approach for predicting species distributions. J. Veg. Sci. 2000, 11, 679–694. [Google Scholar] [CrossRef]
  21. Schellnhuber, H.J.; Rahmstorf, S.; Winkelmann, R. Why the right climate target was agreed in Paris. Nat. Clim. Chang. 2016, 6, 649–653. [Google Scholar] [CrossRef]
  22. New, M. Arctic climate change with a 2 °C global warming. In Evidence and Implications of Dangerous Climate Change in the Arctic; WWF International Arctic Program: Oslo, Norway, 2005; pp. 1–15. [Google Scholar]
  23. Eriksson, M.; Vesterberg, A. When Not in the Best of Worlds: Uncertainty and Forest Carbon Sequestration. Available online: https://ssrn.com/abstract=2766236 (accessed on 22 March 2016).
  24. Rashid, I.; Romshoo, S.A.; Chaturvedi, R.K.; Ravindranath, N.; Sukumar, R.; Jayaraman, M.; Lakshmi, T.V.; Sharma, J. Projected climate change impacts on vegetation distribution over Kashmir Himalayas. Clim. Chang. 2015, 132, 601–613. [Google Scholar] [CrossRef]
  25. Kirschbaum, M.U.; Fischlin, A. Climate change impacts on forests. In Climate Change 1995—Impacts, Adaptations and Mitigation of Climate Change: Scientific-Technical Analysis. Contribution of Working Group to the Second Assessment Report of the Intergovern Mental Panel of Climate Change; Watson, R., Zinyowera, M.C., Moss, R.H., Eds.; Cambridge University Press: Cambridge, UK, 1996; pp. 95–129. [Google Scholar]
  26. Levin, S.; Harvey, J. Fragile Dominion: Complexity and the Commons; Perseus Reading: Cambridge, UK, 1999. [Google Scholar]
  27. Reichstein, M.; Bahn, M.; Ciais, P.; Frank, D.; Mahecha, M.D.; Seneviratne, S.I.; Zscheischler, J.; Beer, C.; Buchmann, N.; Frank, D.C. Climate extremes and the carbon cycle. Nature 2013, 500, 287–295. [Google Scholar] [CrossRef] [PubMed]
  28. Yu, G.; Chen, Z.; Piao, S.; Peng, C.; Ciais, P.; Wang, Q.; Li, X.; Zhu, X. High carbon dioxide uptake by subtropical forest ecosystems in the East Asian monsoon region. Proc. Natl. Acad. Sci. USA 2014, 111, 4910–4915. [Google Scholar] [CrossRef] [PubMed]
  29. Pan, Y.; Birdsey, R.A.; Fang, J.; Houghton, R.; Kauppi, P.E.; Kurz, W.A.; Phillips, O.L.; Shvidenko, A.; Lewis, S.L.; Canadell, J.G. A large and persistent carbon sink in the world’s forests. Science 2011, 333, 988–993. [Google Scholar] [CrossRef] [PubMed]
  30. Whittaker, R.H. A consideration of climax theory: The climax as a population and pattern. Ecol. Monogr. 1953, 23, 41–78. [Google Scholar] [CrossRef]
  31. Yang, Y.M.; Wang, J.H.; Liu, N. Yunnan Zoogeography (Local Chronicles of Yunnan-Geography); Yunnan People’s Publishing House: Kunming, China, 1998; pp. 381–384, 401–419. [Google Scholar]
  32. Zhang, M.; Zhou, Z.; Chen, W.; Slik, J.F.; Cannon, C.H.; Raes, N. Using species distribution modeling to improve conservation and land use planning of Yunnan, China. Biol. Conserv. 2012, 153, 257–264. [Google Scholar] [CrossRef]
  33. Guo, H.J.; Long, C.L. Biodiversity of Yunnan; Yunnan Science and Technology Press: Kunming, China, 1998; Volume 10, pp. 56, 61, 65–68. [Google Scholar]
  34. Yang, Y.; Tian, K.; Hao, J.; Pei, S.; Yang, Y. Biodiversity and biodiversity conservation in Yunnan, China. Biodivers. Conserv. 2004, 13, 813–826. [Google Scholar] [CrossRef]
  35. Nakao, K.; Higa, M.; Tsuyama, I.; Matsui, T.; Horikawa, M.; Tanaka, N. Spatial conservation planning under climate change: Using species distribution modeling to assess priority for adaptive management of Fagus crenata in Japan. J. Nat. Conserv. 2013, 21, 406–413. [Google Scholar] [CrossRef]
  36. Li, W.; Peng, M.; Higa, M.; Tanaka, N.; Matsui, T.; Tang, C.Q.; Ou, X.; Zhou, R.; Wang, C.; Yan, H. Effects of climate change on potential habitats of the cold temperate coniferous forest in Yunnan Province, Southwestern China. J. Mt. Sci. 2016, 13, 1411–1422. [Google Scholar] [CrossRef]
  37. Li, Z.; He, Y.; An, W.; Song, L.; Zhang, W.; Catto, N.; Wang, Y.; Wang, S.; Liu, H.; Cao, W. Climate and glacier change in Southwestern China during the past several decades. Environ. Res. Lett. 2011, 6, 1–24. [Google Scholar] [CrossRef]
  38. Kong, F.; Wang, Y.F.; Fang, J.; Lv, L.L.; Zhang, L.L.; Wang, Z.N. Projected regional difference of the rainfall with different intensities and their contribution to total rainfall under the RCP6.0 scenario in China during 2006–2100. Trop. Geogr. 2018, 1, 48–60. [Google Scholar]
  39. Li, W.; Peng, M.; Pan, H.; Wang, C.; Peng, Z.; Qin, R. Landscape pattern in Honghe River basin based on moving window method. J. Anhui Agric. Sci. 2013, 41, 4455–4457. [Google Scholar]
  40. Pan, H.; Peng, M.; Wang, C.; Li, W.; Peng, Z.; Qin, R. Landscape ecological patterns analysis of Nanpan River basin (Yunnan part) based on eCongnition and LAOS images. J. Anhui Agric. Sci. 2013, 41, 4467–4470. [Google Scholar]
  41. Timilsina, N.; Cropper, W.; Escobedo, F.; Lima, J. Predicting understory species richness from stand and management characteristics using regression trees. Forests 2013, 4, 122–136. [Google Scholar] [CrossRef]
  42. Swets, J.A. Measuring the accuracy of diagnostic systems. Science 1988, 240, 1285–1293. [Google Scholar] [CrossRef] [PubMed]
  43. Horikawa, M.; Tsuyama, I.; Matsui, T.; Kominami, Y.; Tanaka, N. Assessing the potential impacts of climate change on the alpine habitat suitability of Japanese stone pine (Pinus pumila). Landsc. Ecol. 2009, 24, 115–128. [Google Scholar] [CrossRef]
  44. Waggoner, P.E. Using the forest identity to grasp and comprehend the swelling mass of forest statistics. Int. For. Rev. 2008, 10, 689–694. [Google Scholar] [CrossRef]
  45. Dang, C.L.; Wu, Z.L. Studies on the net primary production for Castanopsis echidnocarpa community of monsoon Evergreen broad-leaved forest. J. Yunnan Univ. (Nat. Sci.) 1992, 14, 108–119. [Google Scholar]
  46. Dang, C.L.; Wu, Z.L.; Zhang, Z. Studies on the biomass of Cyclobalanopsis delavayi community. J. Yunnan Univ. (Nat. Sci.) 1994, 16, 205–209. [Google Scholar]
  47. Xie, S.; Liu, W.; Li, S.; Yang, G. Preliminary studies on the biomass of middle-mountain moist evergreen broadleaved forests in Ailao Mountain, Yunnan. Acta Phytoecol. Sin. 1995, 20, 167–176. [Google Scholar]
  48. Wu, Z.L.; Dang, C.L. The biomass of Pinus kesiya var. Langbianensis stands in Pu’er district, Yunnan. J. Yunnan Univ. (Nat. Sci.) 1992, 14, 167–176. [Google Scholar]
  49. Dang, C.L.; Wu, Z.L. Studies on the biomass of Pinus yunnanensis forest. Acta Bot Yunnanica 1991, 13, 59–64. [Google Scholar]
  50. Jiang, H. A study on the biomass and production of Picea purpurea forest communities. Geobot. Sin. 1986, 10, 146–152. [Google Scholar]
  51. Feng, Z.W. The Forest Ecosystem Biomass and Productivity in China; Science Press: Beijing, China, 1999. [Google Scholar]
  52. Gifford, R.M. National Carbon Accounting System Technical Report No. 22. Carbon Contents of above-Ground Tissues of Forest and Woodland Trees; Australian Greenhouse Office: Canberra, Australian, 2000. [Google Scholar]
  53. Peng, C.L.; Guiot, J.; Van Campo, E. Estimating changes in terrestrial vegetation and carbon storage: Using palaeoecological data and models. Quat. Sci. Rev. 1998, 17, 719–735. [Google Scholar] [CrossRef]
  54. Cramer, W.; Shugart, H.; Noble, I.; Woodward, F.; Bugmann, H.; Bondeau, A.; Foley, J.; Gardner, R.; Lauenroth, W.; Pitelka, L. Ecosystem composition and structure. In The Terrestrial Biosphere and Global Change: Implications for Natural and Managed Ecosystems; Walker, B.H., Steffen, W.L., Canadell, J., Ingram, J.S.I., Eds.; Cambridge University Press: Cambridge, UK, 1999; pp. 190–228. [Google Scholar]
  55. Friedlingstein, P.; Prentice, K.C.; Fung, I.Y.; John, J.G.; Brasseur, G.P. Carbon-biosphere-climate interactions in the last glacial maximum climate. J. Geophys. Res. Atmos. 1995, 100, 7203–7221. [Google Scholar] [CrossRef]
  56. Olson, J.S.; Watts, J.A.; Allison, L.J. Carbon in Live Vegetation of Major World Ecosystems; Oak Ridge National Lab.: Oak Ridge, TN, USA, 1983. [Google Scholar]
  57. Melillo, J.M.; Borchers, J.; Chaney, J. Vegetation/ecosystem modeling and analysis project: Comparing biogeography and biogeochemistry models in a continental-scale study of terrestrial ecosystem responses to climate change and CO2 doubling. Glob. Biogeochem. Cycles 1995, 9, 407–437. [Google Scholar]
  58. Fang, J.Y.; Guo, Z.; Piao, S.L.; Chen, A. Terrestrial vegetation carbon sinks in China, 1981–2000. Sci. China Ser. D Earth Sci. 2007, 50, 1341–1350. [Google Scholar] [CrossRef]
  59. Dixon, R.K.; Solomon, A.; Brown, S.; Houghton, R.; Trexier, M.; Wisniewski, J. Carbon pools and flux of global forest ecosystems. Science 1994, 263, 185–190. [Google Scholar] [CrossRef] [PubMed]
  60. Pan, Y.; Birdsey, R.A.; Phillips, O.L.; Jackson, R.B. The structure, distribution, and biomass of the world’s forests. Annu. Rev. Ecol. Evol. Syst. 2013, 44, 593–622. [Google Scholar] [CrossRef]
  61. Zhou, Y.R.; Yu, Z.L.; Zhao, S.D. Carbon storage and budget of major Chinese forest types. Acta Phytoecol. Sin. 2000, 24, 518–522. [Google Scholar]
  62. Peckham, S.D.; Gower, S.T.; Buongiorno, J. Estimating the carbon budget and maximizing future carbon uptake for a temperate forest region in the U.S. Carbon Balance Manag. 2012, 7, 1–8. [Google Scholar] [CrossRef] [PubMed]
  63. Alexeyev, V.; Birdsey, R.; Stakanov, V.; Korotkov, I. Carbon in vegetation of Russian forests: Methods to estimate storage and geographical distribution. Water Air Soil Pollut. 1995, 82, 271–282. [Google Scholar] [CrossRef]
  64. Nabuurs, G.; Mohren, G. Carbon in Dutch forest ecosystems. Neth. J. Agric. Sci. 1993, 41, 309–326. [Google Scholar]
  65. Dymond, C.C.; Beukema, S.; Nitschke, C.R.; Coates, K.D.; Scheller, R.M. Carbon sequestration in managed temperate coniferous forests under climate change. Biogeosciences 2016, 13, 1933–1947. [Google Scholar] [CrossRef]
  66. Brienen, R.J.; Phillips, O.L.; Feldpausch, T.R.; Gloor, E.; Baker, T.R.; Lloyd, J.; Lopez-Gonzalez, G.; Monteagudo-Mendoza, A.; Malhi, Y.; Lewis, S.L.; et al. Long-term decline of the Amazon carbon sink. Nature 2015, 519, 344–348. [Google Scholar] [CrossRef] [PubMed] [Green Version]
  67. Hopkin, M. Rising temperatures “will stunt rainforest growth”. Nature 2007. Available online: https://www.nature.com/ news/2007/070806/full/news070806-13.html (accessed on 12 October 2008). [CrossRef]
  68. Lenihan, J.M.; Drapek, R.; Bachelet, D.; Neilson, R.P. Climate change effects on vegetation distribution, carbon, and fire in California. Ecol. Appl. 2003, 13, 1667–1681. [Google Scholar] [CrossRef]
  69. Wang, H.; Ni, J.; Prentice, I.C. Sensitivity of potential natural vegetation in China to projected changes in temperature, precipitation and atmospheric CO2. Reg. Environ. Chang. 2011, 11, 715–727. [Google Scholar] [CrossRef] [Green Version]
  70. Lutz, D.A.; Shugart, H.H.; White, M.A. Sensitivity of Russian forest timber harvest and carbon storage to temperature increase. Forestry 2013, 86, 283–293. [Google Scholar] [CrossRef]
  71. Grant, R.; Arain, A.; Arora, V.; Barr, A.; Black, A.; Chen, J.; Wang, S.; Yuan, F.; Zhang, Y. Modelling temperature effects on CO2 and energy exchange in temperate and boreal coniferous forests. In AGU Spring Meeting; American Geophysical Union: San Francisco, CA, USA, 2004. [Google Scholar]
  72. Way, D.A.; Oren, R. Differential responses to changes in growth temperature between trees from different functional groups and biomes: A review and synthesis of data. Tree Physiol. 2010, 30, 669–688. [Google Scholar] [CrossRef] [PubMed]
  73. Fang, J.Y.; Piao, S.L.; Field, C.B.; Pan, Y.; Guo, Q.; Zhou, L.; Peng, C.; Tao, S. Increasing net primary production in China from 1982 to 1999. Front. Ecol. Environ. 2003, 1, 293–297. [Google Scholar] [CrossRef]
  74. Piao, S.L.; Fang, J.Y.; Zhou, L.M.; Zhu, B.; Tan, K.; Tao, S. Changes in vegetation net primary productivity from 1982 to 1999 in China. Glob. Biogeochem. Cycles 2005, 19, 1–16. [Google Scholar] [CrossRef]
  75. Marcus, L.; Michael, M.; Sigrid, N.; Antoine, K.; Anna, B.; Jordi, G.G.; Rupert, S.; Sylvain, D.; Piermaria, C.; Marja, K. Climate change impacts, adaptive capacity, and vulnerability of European forest ecosystems. For. Ecol. Manag. 2010, 259, 698–709. [Google Scholar]
  76. Yu, Y.; Chen, J.M.; Yang, X.G.; Fan, W.Y.; Li, M.Z.; He, L.M. Influence of site index on the relationship between forest net primary productivity and stand age. PLoS ONE 2017, 12, e0177084. [Google Scholar] [CrossRef] [PubMed]
  77. Zaehle, S.; Sitch, S.; Prentice, I.C.; Liski, J.; Cramer, W.; Erhard, M.; Hickler, T.; Smith, B. The importance of age-related decline in forest NPP for modeling regional carbon balances. Ecol. Appl. 2006, 16, 1555–1574. [Google Scholar] [CrossRef]
  78. Liu, Y.; Yu, G.; Wang, Q.; Zhang, Y. Huge carbon sequestration potential in global forests. J. Resour. Ecol. 2012, 3, 193–201. [Google Scholar]
  79. Ma, J.; Hu, Y.; Bu, R.; Chang, Y.; Deng, H.; Qin, Q. Predicting impacts of climate change on the aboveground carbon sequestration rate of a temperate forest in Northeastern China. PLoS ONE 2014, 9, e96157. [Google Scholar] [CrossRef] [PubMed]
  80. Sun, J.; Baker, B.; Bachelet, D.; Daly, C.; Ma, J.; Liu, J. Impact of climate change in the Hengduan Mountains of Northwestern Yunnan, P.R. China: Vegetation distribution change in the foretime and future. In Earth Observing Systems XI; The International Society for Optical Engineering: San Diego, CA, USA, 2006. [Google Scholar]
  81. Schimel, D.S. Terrestrial ecosystems and the carbon cycle. Glob. Chang. Biol. 1995, 1, 77–91. [Google Scholar] [CrossRef]
  82. Walker, A.P.; Zaehle, S.; Medlyn, B.E.; De Kauwe, M.G.; Asao, S.; Hickler, T.; Lomas, M.R.; Pak, B.C.; Parton, W.J.; Quegan, S. Vegetation turnover and nitrogen feedback drive temperate forest carbon sequestration in response to elevated CO2. A multi-model structural analysis. In AGU Fall Meeting; American Geophysical Union: San Francisco, CA, USA, 2013. [Google Scholar]
  83. He, L.; Chen, J.M.; Croft, H.; Gonsamo, A.; Luo, X.; Liu, J.; Zheng, T.; Liu, R.G.; Liu, Y. Nitrogen availability dampens the positive impacts of CO2 fertilization on terrestrial ecosystem carbon and water cycles. Geophys. Res. Lett. 2017, 44, 11590–11600. [Google Scholar] [CrossRef]
  84. Reich, P.B.; Hobbie, S.E.; Lee, T.; Ellsworth, D.S.; West, J.B.; Tilman, D.; Trost, J. Nitrogen limitation constrains sustainability of ecosystem response to CO2. Nature 2006, 440, 922–925. [Google Scholar] [CrossRef] [PubMed]
  85. Baishya, R.; Barik, S.K. Estimation of tree biomass, carbon pool and net primary production of an old-growth Pinus kesiya Royle ex. Gordon forest in North-eastern India. Ann. For. Sci. 2011, 68, 727–736. [Google Scholar] [CrossRef]
  86. Wu, Z. A review of the research status of Pinus kesiya var. Langbianensis in Southwestern China. Sci. Silvae Sin. 1994, 30, 151–157. [Google Scholar]
  87. Wu, Z.; Zhu, Y.; Jiang, H. Vegetation of Yunnan; Science Press: Beijing, China, 1987. [Google Scholar]
  88. Patricio, J.; Tulod, A. Carbon sequestration potential of Benguet pine (Pinus kesiya) plantations in Bukidnon, Philippines. J. Nat. Stud. 2010, 9, 99–104. [Google Scholar]
  89. Cao, X.; Zhang, Y. Analysis on the China certified emission reductions, economic value and its sensitivity of Pinus kesiya var. Langbianensis afforestation project in Yunnan Province. Ecol. Environ. Sci. 2017, 26, 234–242. [Google Scholar]
Figure 1. The distribution of forest vegetation in Yunnan Province in the 2010s.
Forests 09 00227 g001
Figure 2. The potential distribution of forest vegetation in Yunnan Province under current and different temperature increasing scenarios. MEB: Monsoon Evergreen Broad-leaved Forests; SEB: Semi-humid Evergreen Broad-leaved Forests; MHEB: Mountainous Humid Evergreen Broad-leaved Forests; WHC: Warm-hot Coniferous Forests; WTC: Warm-temperate Coniferous Forests; TCC: Temperate-cool Coniferous Forests; CTC: Cold-temperate Coniferous Forests.
Forests 09 00227 g002aForests 09 00227 g002b
Table 1. Waveband parameters of the ALOS remote sensing images.
BandBand NameSpectral Range (nm)Spatial Resolution (m)
1Blue420~52010
2Green520~60010
3Red610~69010
4Near-infrared760~89010
PanchromaticPanchromatic520~7702.5
Table 2. Vegetation types and representative tree species of the study.
Forest VegetationRepresentative Tree Species
MEBCastanopsis hystrix J. D. Hooker et Thomson ex A. De Candolle; Castanopsis indica (Roxburgh ex Lindley) A. DC.; Castanopsis fleuryi Hickel et A. Camus; Lithocarpus truncatu (King ex Hook. f.); Schima wallichii (DC.) Korth.; Anneslea fragrans Wall.
SEBCyclobalanopsis glaucoides Rehder & E.H.Wilson; Cyclobalanopsis xanthotricha (A. Camus) Y. C. Hsu et H. W. Jen; Castanopsis delavayi Franch.; Castanopsis orthacantha Franch; Magnolia delavayi Franch.
MHEBLithocarpus craibianus Barn.; Lithocarpus variolosus (Franchet) Chun; Manglietia insignis (Wall.) Blume; Machilus shweliensis W. W. Sm.; Rhododendron excellens Hemsl. et Wils.
WHCPinus kesiya Royle ex Gordon; Toona ciliata M. Roem.
WTCPinus yunnanensis Franch.; Alnus nepalensis D.Don
TCCTsuga dumosa (D. Don) Eichler; Pinus armandii Franch.; Abies ernestii Rehd.
CTCPicea likiangensis (Franch.) E.Pritz.; Abies georgei Orr; Abies delavayi Franch.; Abies forrestii C. C. Rogers; Larix potaninii Batalin
MEB: Monsoon Evergreen Broad-leaved Forests; SEB: Semi-humid Evergreen Broad-leaved Forests; MHEB: Mountainous Humid Evergreen Broad-leaved Forests; WHC: Warm-hot Coniferous Forests; WTC: Warm-temperate Coniferous Forests; TCC: Temperate-cool Coniferous Forests; CTC: Cold-temperate Coniferous Forests.
Table 3. The mean forest vegetation biomass of seven forest types in Yunnan Province.
Forest VegetationMean Aboveground Biomass (Mg/ha)Reference
MEB129.92[45]
SEB135.91[46]
MHEB400.81[47]
WHC142.06[48]
WTC35.91[49]
TCC285.90[50]
CTC182.27[51]
MEB: Monsoon Evergreen Broad-leaved Forests; SEB: Semi-humid Evergreen Broad-leaved Forests; MHEB: Mountainous Humid Evergreen Broad-leaved Forests; WHC: Warm-hot Coniferous Forests; WTC: Warm-temperate Coniferous Forests; TCC: Temperate-cool Coniferous Forests; CTC: Cold-temperate Coniferous Forests.
Table 4. DWS and the percentage of each climatic variable and AUC of each simulation scenario.
Simulation ScenarioTMWTMSPRSPRWAUCCI (95%)
DWS%DWS%DWS%DWS%
T0.013,438.8946.212022.9219.827442.6223.191986.1810.780.84860.8437–0.8532
T0.519,462.3154.381372.3212.805519.0923.703142.269.120.85140.8471–0.8555
T1.019,334.0554.451553.0812.975496.6623.443150.829.140.85090.8462–0.8556
T1.518,857.3750.951965.6515.395558.5323.793190.059.880.85290.8480–0.8577
T2.020,002.7457.081399.2212.305552.2022.762914.187.860.85790.8527–0.8628
DWS: deviance-weighted scores; AUC: area under the curve.
Table 5. The area and rate of change in forest distribution area under different temperature scenarios. Units: Area (×105 ha); Rate of change (%).
Forest VegetationT0.0–CurrentT0.5–T0.0T1.0–T0.0T1.5–T0.0T2.0–T0.0
AreaRate of ChangeAreaRate of ChangeAreaRate of ChangeAreaRate of ChangeAreaRate of Change
MEB12.1338.35−7.19−16.44−6.22−14.24−8.26−18.88−6.76−15.44
SEB4.3729.71−10.42−54.66−10.33−54.17−8.69−45.59−10.35−54.28
MHEB2.6469.67−0.64−9.97−2.39−37.18−2.39−37.18−1.82−28.33
WHC111.01572.30−7.61−5.83−6.37−4.89−7.61−5.83−77.94−59.76
WTC87.3290.7759.7632.5650.1527.3261.6033.5757.9231.56
TCC14.99211.00−5.32−24.07−6.22−28.13−6.42−29.04−5.00−22.63
CTC10.5177.93−3.96−16.46−4.46−18.56−5.45−22.69−3.72−15.49
Mean242.98130.4224.635.7414.153.3022.795.31−47.66−11.10
MEB: Monsoon Evergreen Broad-leaved Forests; SEB: Semi-humid Evergreen Broad-leaved Forests; MHEB: Mountainous Humid Evergreen Broad-leaved Forests; WHC: Warm-hot Coniferous Forests; WTC: Warm-temperate Coniferous Forests; TCC: Temperate-cool Coniferous Forests; CTC: Cold-temperate Coniferous Forests.
Table 6. The CSP of forest vegetation in Yunnan Province (Unit: TgC).
Forest VegetationT0.0T0.5T1.0T1.5T2.0
MEB78.7932.0538.3225.1434.89
SEB29.69−41.14−40.51−29.39−40.66
MHEB52.8940.055.005.0016.40
WHC567.62734.52743.28734.52234.96
WTC156.78212.72193.30209.68260.36
TCC119.0076.7969.6668.0679.32
CTC95.8459.8355.2446.1861.96
Sum.1100.611114.821064.291059.19647.24
MEB: Monsoon Evergreen Broad-leaved Forests; SEB: Semi-humid Evergreen Broad-leaved Forests; MHEB: Mountainous Humid Evergreen Broad-leaved Forests; WHC: Warm-hot Coniferous Forests; WTC: Warm-temperate Coniferous Forests; TCC: Temperate-cool Coniferous Forests; CTC: Cold-temperate Coniferous Forests.

