Regional Scale Determinants of Nutrient Content of Soil in a Cold-Temperate Forest
by
 ,
,
Shusheng Yuan
1,2 ,
,
Tongtong Tang
3,
Minchao Wang
2,4,
Hao Chen
2,
Aihua Zhang
2 and
Jinghua Yu
2,* 1
State Engineering Laboratory of Bio-Resource Eco-Utilization (Heilongjiang), Northeast Forestry University, Harbin 150040, China
2
Institute of Applied Ecology, Chinese Academy of Sciences, Shenyang 110016, China
3
Institute of Soil Science, Chinese Academy of Sciences, Nanjing 210008, China
4
School of Life Science, Shenyang Normal University, Shenyang 110016, China
*
Author to whom correspondence should be addressed.
Forests 2018, 9(4), 177; https://doi.org/10.3390/f9040177
Submission received: 1 February 2018
/
Revised: 20 March 2018
/
Accepted: 22 March 2018
/
Published: 30 March 2018
(This article belongs to the Special Issue Carbon, Nitrogen and Phosphorus Cycling in Forest Soils)
Abstract
:The effect of climatic factors on soil nutrients is significant. Identifying whether soil nutrients respond to local climate and how the forest types modulate this responsiveness is critical for forest management. Therefore, six soil nutrients from five main forest types found for a range of sites within the Daxing’an Mountains, China, were investigated. Climatic factors were obtained from the WorldClim dataset. Pearson correlations and stepwise regressions were employed to elucidate and model the response of the six soil nutrients to the four different climatic factors in this study. On the whole, climate was correlated with all the nutrients. Further, from stepwise regressions, climatic factors could affect soil nutrients in distinct forests. Our findings suggest that climatic factors are instrumental in affecting soil nutrients in different forest types. Identifying the relationships between soil nutrients, climatic factors and forest types, as suggested in this research, can provide theoretical foundations to further comprehend nutrient cycling in the forest ecosystem.
1. Introduction
Climate changes have significant effects on ecosystems. In the present paper, with the primary focus on the links between ecosystems and climate change, gradients of natural climate are noteworthy in studying the interactions between climate and variation in forest ecosystem processes. Terrestrial ecosystems play a dominant and irreplaceable role, due to the functions of releasing and absorbing greenhouse gases in such climate-feedbacks, while storing a great deal of carbon in vegetation and soil, thus serving as the global carbon sink [1]. Some studies have shown that there are strong linkages between climate change and soil. The study of Brittany et al. showed that the gradient of climates (precipitation and temperature) has obvious regulating effects on the physical and chemical properties of soil, such as pH, Mg2+, N, P and K content [2]. The effects of climatic factors on SOC (soil organic carbon) density were obvious and stronger than those of grassland and farmland [3]. Furthermore, regression analysis showed that temperature has a negative correlation with SOC content, and precipitation has a positive correlation with SOC content, but using multiple regression analysis, temperature and precipitation explained 43% of total variance in the SOC variables [4,5]. Soil organic matter related to SOC, total nitrogen (TN), total phosphorus (TP), total potassium (TK), available P (AP) and available K (AK) has been extensively used to evaluate soil quality [6,7,8,9]. Moreover, forest types can impact the cycling and amounts of the nutrients, and nutrients have been confirmed to be influenced by the upper layer [10]. However, the impacts of tree species upon soil nutrients varied depending upon the type of bedrock, climate and forest management [11]. Therefore, understanding the relationships between soil nutrients and climate change in different forest types will provide more reliable information to prudently manage forest resources and promote sustainable forestry development under climate change in the future.
The Daxing’an Mountains forest area is in the mid-latitude and high-latitude area that is extremely sensitive to global warming [12]. The Daxing’an Mountains forest area is the main forest in China. It plays an important role in carbon sequestration management and ecological environment construction. Nevertheless, under the influence of climate change, the edge of the forest has retreated 140 km over the past century in this region [13]. Therefore, the soil nutrients of different vegetation types in this region have attracted widespread attention. Jiang et al. [14] studied the soil nutrients of different forests. However, there is less research focused on the soil nutrient characteristics in different forest types in the Daxing’an Mountains forest area. Although the distribution of SOC, N, P, and K in the Liaodong Mountains area [15] and the correlations between SOC, inorganic carbon and soil nutrients in the northeast of China [16] have been studied, studies reporting research related to the comprehensive evaluation of soil nutrients from different forest types in the Daxing’an Mountains forest area are scarce.
In this study, the soil nutrients of a total of 230 sample plots collected from five main forest types were measured from the Daxing’an Mountains, and four bioclimatic variables (mean annual temperature (MAT), temperature seasonality (TS), mean annual precipitation (MAP) and precipitation seasonality (PS)) were obtained from the WorldClim dataset. We hypothesized that climatic factors could affect soil nutrients in different forest types. Thus, identifying whether soil nutrients respond to local climate and how the forest types modulate this responsiveness is critical for forest management.
2. Methods
2.1. Site Description
The forest in the Daxing’an Mountains is one of the most important areas in China: the lush natural forest is distributed widely. It is an important production base for forest trees in China, and also an important ecological barrier in northeastern China. The study area comprises about 86,000 km2 and belongs to the cool coniferous forests. The investigated forest plots are shown in detail in Figure 1 [17]. Five main forest types were chosen, including pure Larix gmelinii (Rupr.) Kuzen forest (PL) (87 samples, altitude: 235–1023 m), pure Betula platyphylla Suk. forest (PB) (64 samples, altitude: 160–1003 m), pure Quercus mongolica Fisch. ex Ledeb. forest (PQ) (36 samples, altitude: 240–771 m), Larix gmelinii (Rupr.) Kuzen and Betula platyphylla Suk. mixed forest (MLB) (25 samples, altitude: 247–1038 m) and pure Pinus sylvestris L. var. mongolica Litv. forest (PP) (18 samples, altitude: 296–905 m). The study was conducted in the eastern forest zones of the Daxing’an Mountains area (45°59′–53°19′ N, 119°47′–130°53′ E), Heilongjiang Province and Inner Mongolia Autonomous Region. This region has a continental monsoon climate, and receives a mean annual precipitation (MAP) of 764 mm. The temperature varies between −41 °C in January–February and 35 °C in July–August, with a mean annual temperature (MAP) of −2.8 °C.
2.2. Field Soil Sampling and Preliminary Analysis
The forest-covered area of the Daxing’an Mountains was systematically divided into 30 km × 30 km grids using ArcGIS 10.0 (Esri, Redlands, CA, USA) as the meshing tool. The exact latitude and longitude for each grid were recorded with a GPS system (Google, Mountain, CA, USA) [18,19]. Soil sample depth was 0–20 cm [3,4], taken from 3–7 plots (30 m × 30 m each) in each 30 km × 30 km grid (total grids = 52), and 3–7 plots were chosen based on the investigation areas. As much as possible, we chose plots from the central region of the grid; the distance of each plot to the edge of the grid must be more than 15% of the length on the side of the grid. A total of 230 sample plots were included in this study, and the geometric center coordinates for each sample plot were input into Excel, saved in CSV (Comma Separated Value) format, and the ArcGIS 10.0 software was used to extract the climatic data for each sample plot [19].
SOC was determined by external heating with the potassium dichromate oxidation method; TN was determined by the Semi-micro Kjeldahl method; TP and TK were determined by the method of the NaOH melt—Mo-Sb Colorimetry; AP was determined by the method of the HCl-NaOH extracts; AK was determined using the flame photometry method [20,21].
2.3. Climatic Data
Climatic data were obtained from the WorldClim database (http://www.worldclim.org/), the accuracy class of which is a spatial resolution of approximately 1 km2. The WorldClim data are collected from weather stations across the globe, which include altitude, temperature, and rainfall (period 1950–2000) [22]. In the present study, four bioclimatic variables (MAT, TS, MAP and PS) were considered to assess the current climatic conditions. The IPCC 4th assessment data provided information for the future climate projections [23].
2.4. Statistical Analyses
The multivariate statistical analysis method has been employed to determine the minimum dataset under the hypothesis that soil nutrients significantly impact forest type. Principal component analysis (PCA) has previously been applied in different research fields to identify nutrients in semiarid soils [24,25] and soil pollutant sources [26] as well as to assess the effect of tillage on soil quality and yield [27,28,29,30]. Dimension reduction analysis by using the PCA method to reduce the dimensional data and eliminate the redundant data [31,32]. In our research, we built a hypothesis about which principal components (PCs) possess the highest eigenvalues, variables, and absolute eigenvectors and may best express the minimum dataset.
Pearson correlation coefficients were employed to evaluate the correlations between climatic factors and soil nutrients. Analyses of regression are helpful for inspecting differences among group comparisons; therefore, they are suitable for assessing the variation of soil nutrients under diverse climatic factors. To test whether the climatic factors (MAT, TS, MAP, and PS) affected the soil nutrients (SOC, TN, TP, TK, AP, and AK), a simple linear regression was used for each biological element of the 230 sites with the four climatic factors. To study forest types, specifically the response to climate changes, the climate-change response trends were compared among the forest types. The slopes of the regression lines were used to indicate the different responses of forest types to the climate changes. Linear models compared with non-linear models (Spearman Rank Correlation) gave the best regression results. In addition, stepwise regression between climatic factors and soil nutrients in five main forest types was also analyzed (F-to-enter p ≤ 0.05, F-to remove p ≥ 0.10).
The statistical analyses were conducted using SPSS 17.0 software, while the graphs were made using OriginPro 9.0 software (OriginLab Corporation, Northampton, MA, USA).
3. Results
3.1. Variation of Soil Nutrients and Climatic Factors in Different Forest Types
In Figure 2, the contents of SOC, TN, TK, TP, AK and AP in five main forest types averaged at 28.23 g∙kg−1, 4.03 g∙kg−1, 26.23 g∙kg−1, 1.70 g∙kg−1, 158.68 mg∙kg−1 and 21.46 mg∙kg−1, respectively. In particular, SOC, TN, TK, TP, AK and AP contents in the PQ were lower than those in the other four forest types.
3.2. Principal Component Analysis of the Different Forest Types and the Soil Nutrients
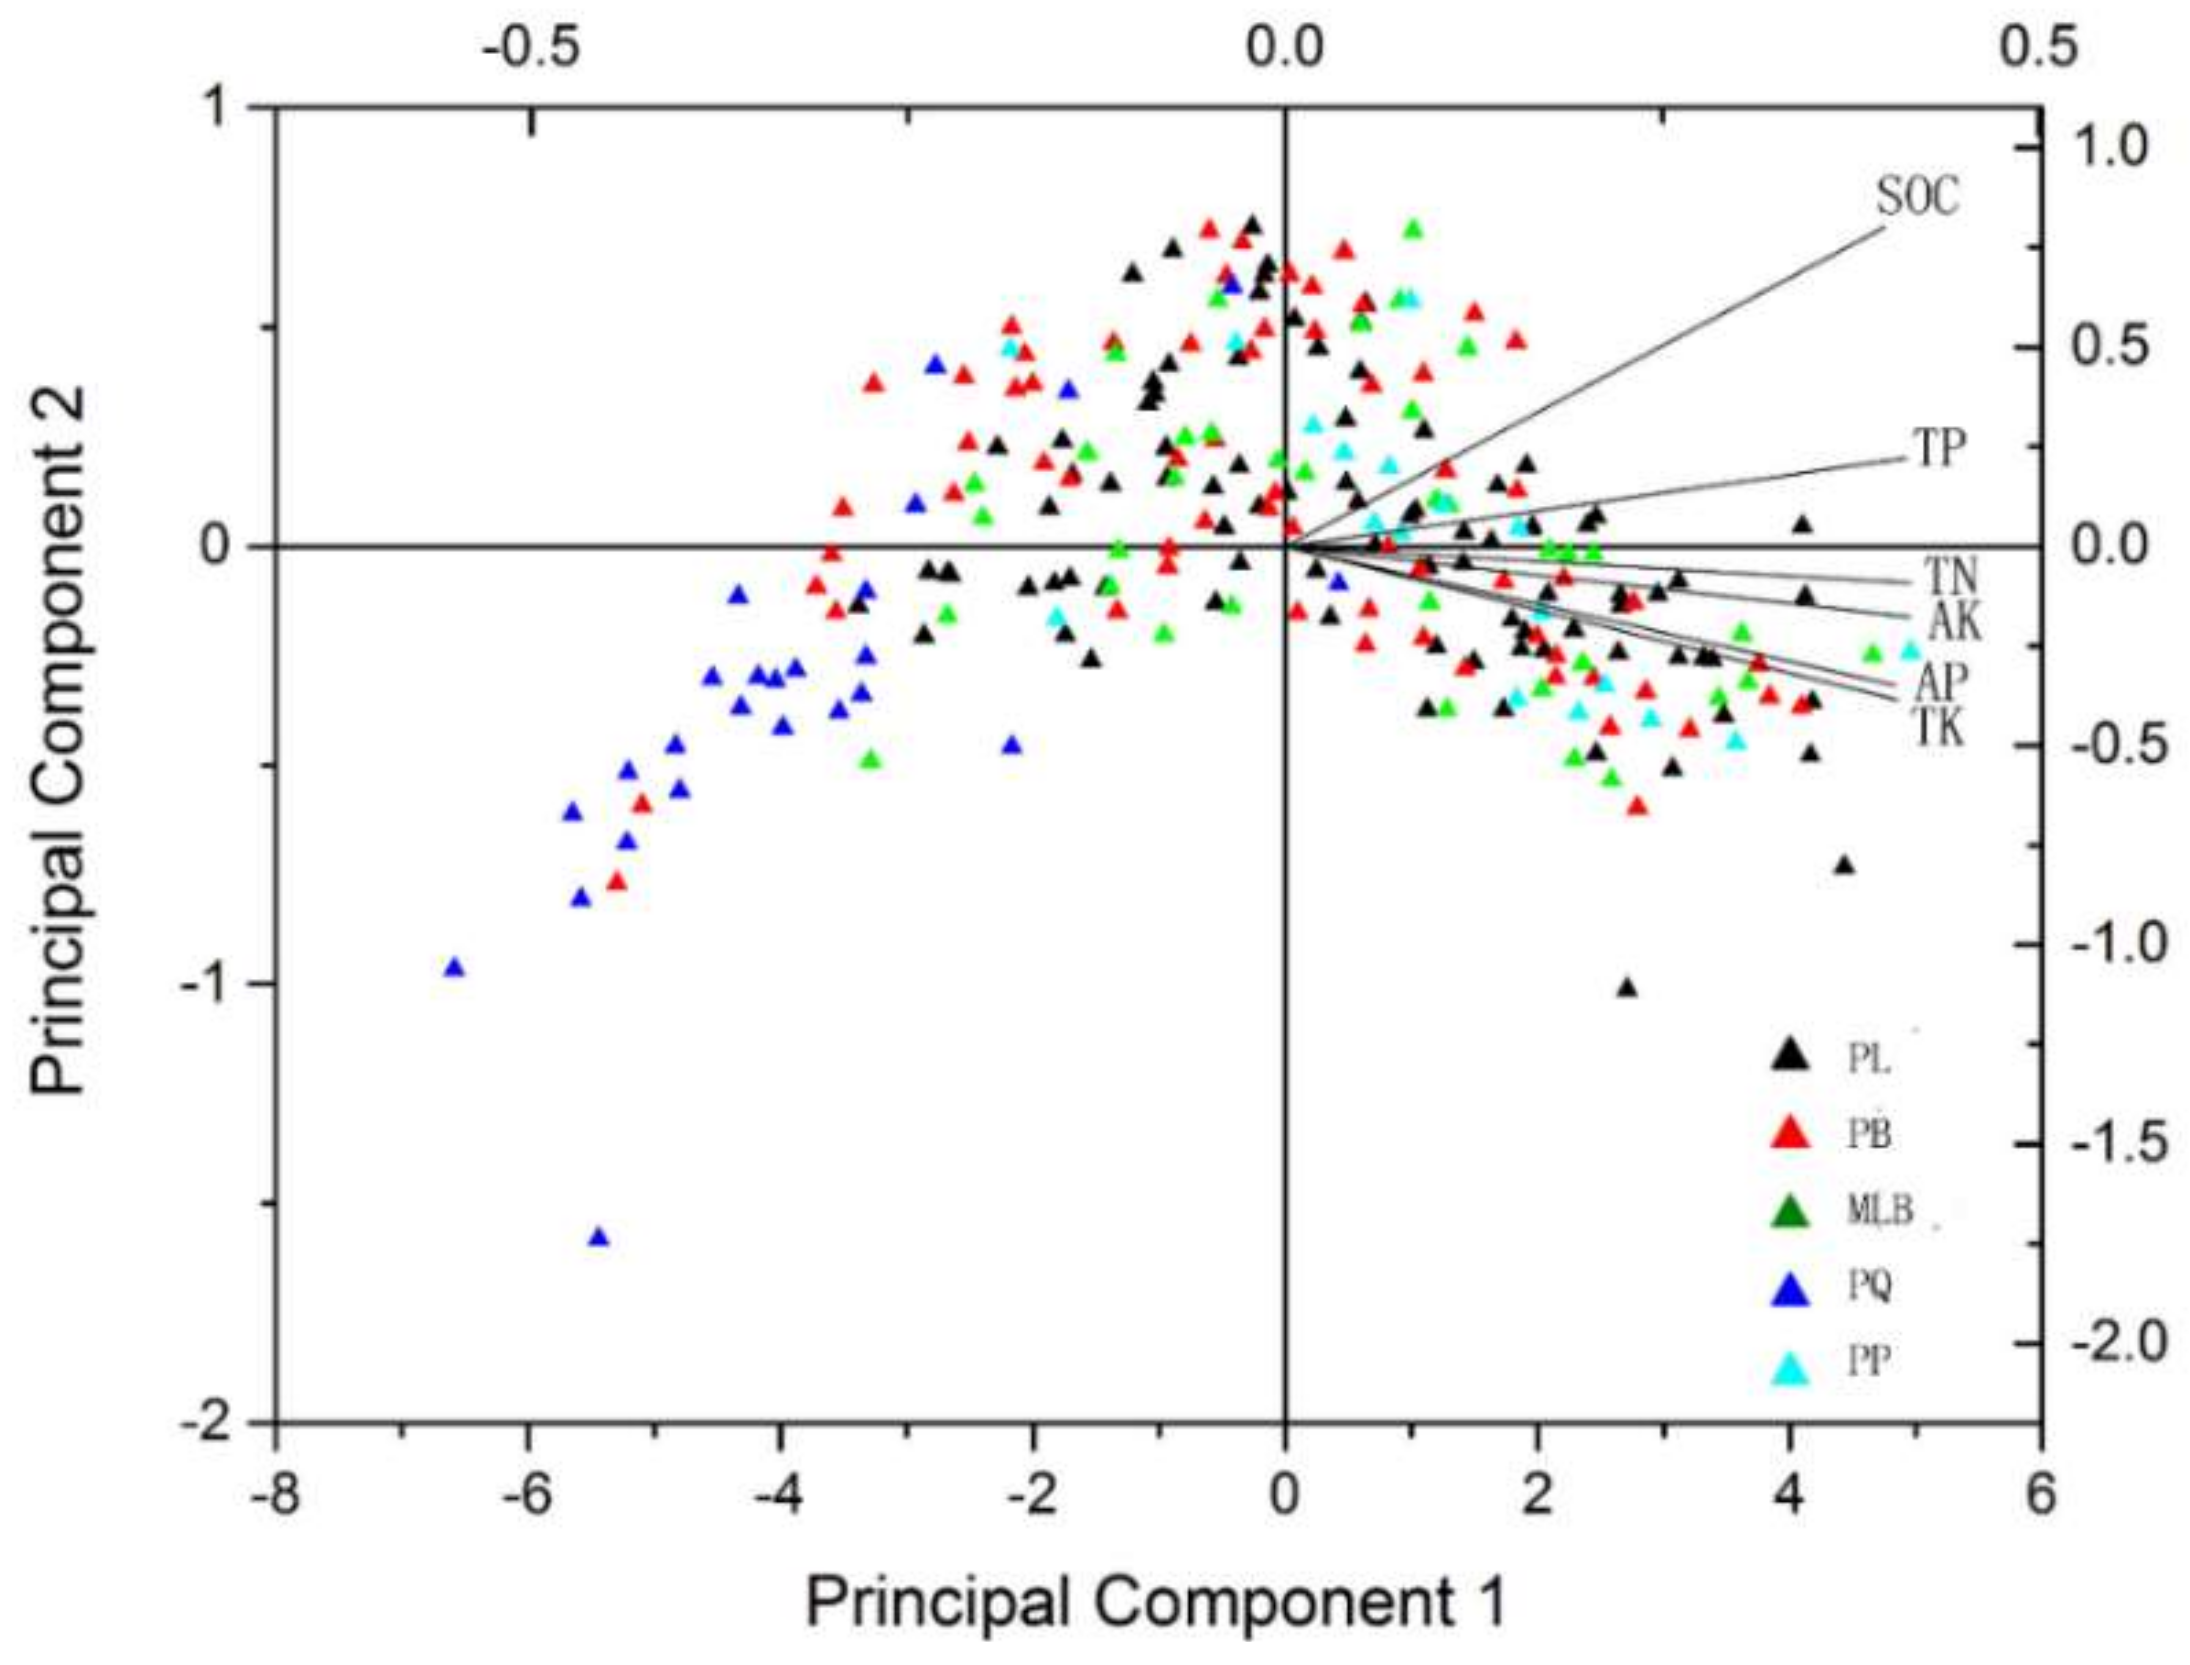
The results of the PCA showed the variables that characterized the soil nutrients of the different forest types (Figure 4). PCs 1–6 explained 100.0% of the variation, and can be broken down as follows: 95.55%, 2.22%, 1.13%, 0.73%, 0.24% and 0.12%, respectively, as shown in Table 1. Principal component 1 can reflect most of the variation; it includes TN (0.296), TK (0.816), TP (−0.263), AP (0.749), AK (0.447) and SOC (−1.302). As shown in Figure 4, five main forest types showed PQ separated from other types.
3.3. Correlations between Climatic Factors and Soil Nutrients
The relationships between soil nutrients and climatic factors are shown in Table 2. MAT was negatively correlated with SOC, TN, TK, AK and AP, while it was positively correlated with TP (r = 0.187) (p < 0.01). TS was positively correlated with SOC, TN, TK, AK and AP (r = 0.307–0.417), while it was negatively correlated with TP (r = −0.405) (p < 0.01). In contrast to TS, the relationships between PS and soil nutrients showed the opposite trend (p < 0.01). MAP was positively correlated with SOC, TN, AK and AP, while it was negatively correlated with TK and TP (p < 0.01).
Moreover, relationships between soil nutrients and climatic factors in the five main forest types were also observed. In Table 3, p (*, **) value represents whether climatic factors are correlated with soil nutrient contents, so as to determine whether there is statistical significance. The r value indicated the correlation between climate factors and soil nutrient contents. MAT was significantly and positively correlated with nutrients in PL, PB, and MLB, except for SOC in PB. TS had no effect on almost all nutrients but positively correlated with SOC in PB. MAP was similar to MAT in PL, PB, and MLB; in addition, MAP was also significantly correlated with TN, TK, TP, AK, AP in PP and TN, TP in PQ. Although the correlation between PS and nutrients was unimpressive compared with MAT and MAP in five forest types, it was negatively correlated with SOC in PL, TN, TP and TK in MLB, as well as SOC and AK in PP.
3.4. Stepwise Regressions between Climatic Factors and Soil Nutrients
Step regression between soil nutrients and climatic factors in the five main forest types is shown in Table 4. In the case of PB, the four climatic factors could affect all the six soil nutrients, and MAP was the first parameter entered into the model. In the case of MLB and PP, MAP and MAT were the key factors for influencing the five soil nutrients (TN, TP, TK, AP and AK). For PL, MAT, MAP and TS mainly affected SOC, TN, TP, TK and AK. However, for PQ, MAP was the key factor for TN and TP, and no parameters were entered into the model of SOC, TK, AP and AK. In all, we found that there were different influencing factors in various forest types.
4. Discussion
4.1. Forest Types Influence Soil Nutrient Contents
The relationships between soil nutrients and forest types have been presented previously [3]. In addition, northeastern China has been considered as one of the regions with the most abundant soil nutrition [16,33]. To confirm the influencing trends of the variation of soil nutrient contents to forest types, PCA was carried out on the collected data. From the distribution of the loading plot in the PCA space, it was found that the forest type influenced the soil nutrients. For instance, SOC, TP, TN, AK, AP and TK were higher in PL, PB, MLB and PP in this study, while these soil nutrients showed the opposite trend. So, we suspect that there were certain correlations between soil nutrients and forest type. In addition, the differences caused by vegetation effects in the responses of the nutrients may be due to slight distinctions in parent material in different forest types [34,35].
From the above results, it was found that the distributions of soil nutrients from different forests were different. These values were influenced by the forest site conditions, advantageous tree species and different amounts of forest litter as well as the composition and decomposition levels, so the differences in the forest soil nutrients are very obvious. For instance, the distribution of SOC was ranged in order PL > MLB > PB > PP > PQ with the SOC average content being 28.68, 28.46, 28.43, 28.28 and 26.68 g∙kg−1 respectively. From the viewpoint of succession, PL, MLB and PP were in the top stage of succession—the complexity of the tree species composition increased the possibilities of the accumulation of organic matter [36]—but PB and PQ were the secondary forests which were disturbed more frequently in recent years. So, the SOC content of PL, MLB and PP should be larger than that of PB or PQ [37]. However, the SOC content in PP was minimal, even lower than in PB. This phenomenon was unexpected, and it is possible that it is related to the terrain: the slope is large, litter does not accumulate as much, and in addition to the soil acidity, the litter layer was difficult to decompose; therefore, the conditions are not conducive to the formation of organic matter, which means that the SOC content is low [3]. This also means that SOC stock will continue to increase if the interference is ended and the forest is developed toward the climax community; otherwise, the forest can turn into PQ and the stock of SOC will decrease, especially in the rich PB forest region.
Statistically, the distributions of TN and SOC were identical. A large number of data analysis results show that the TN was positively correlated with SOC. The order was PL > MLB > PB > PP > PQ with the contents being 4.2, 4.12, 4.11, 4.02 and 3.50 g·kg−1 respectively. The distribution of TN identified in this study was in accordance with that presented by Zu et al. [16] and Jiang et al. [14]. The order of the TP content was PP > PL = MLB > PB > PQ and the contents were 1.81, 1.76, 1.76, 1.70 and 1.35 g·kg−1 respectively. The correlations of the AP and SOC were identical but opposite to that of TP. The same phenomenon appeared with AK and TK, and this could be explained by the composition of TP and TK, which is very complex, with the existence of inorganic and organic states, and AP and AK being only part of them. This trend may have been due to the influence of various factors such as the climate. In addition, although AP content decreased with the MAP and MAT increasing, TP content increased [32,33]. This confirms that the vegetation type is a key factor that affects the soil nutrients of the Daxing’an Mountains ecosystems.
4.2. Soil Nutrient Responses to Climatic Factors
The study of Harradine, F. et al. indicated that climate (especially precipitation and temperature) has significant effects on pedogenesis and macronutrient cycling in soil [38]. It is a challenge to isolate each of the individual soil forming factors such as climate, vegetation, parent material and so on, due to the frequent co-variance of many factors [39]. For instance, changes in species vary with the climate and location. In the present paper, with the primary focus on the links between ecosystems and climate change, gradients of natural climate are noteworthy in studying the interactions between climate and variation in forest ecosystem processes.
On the whole, it was found that SOC decreased with increasing MAT, and SOC increased with increasing MAP (Table 1). This trend may be due to the hydrothermal conditions of Daxing’an Mountains area. The MAT in Daxing’an Mountains is −3.69 °C and the MAP is 481.2 mm. The region is rich in forest resources, and rainfall is abundant which is conducive to the growth of plants, while the low temperature is beneficial to the accumulation of biomass. Yimer, F. et al. suggested that some other factors, such as erosion, leaching of cations and variations in biomass production may influence soil property [39]. Our results were consistent with previous research which showed that increasing temperature leads to the growth of microorganisms [40], thus increasing the decomposition rate of SOC [41,42]. Precipitation change will affect the content of plant-available water and the length of the growing season; a reduction in precipitation can limit plant growth [30], and the soil microbial number will surge after rain [43], thus reducing the SOC content in soil. In this study, a similar conclusion can be drawn.
More than half of the soil nutrients were significantly linked with variations in the climatic factors, but PQ had weak correlations between climatic factors and soil nutrients, showing that the soil nutrient distribution characteristics were affected by forest types. TN was affected by MAP, MAT and TS, while TP was susceptible to MAP in PQ (Table 3). However, MAT and MAP were the key factors for most soil nutrients in PB, PL, MLB and PP (Table 3), indicating that MAP and MAT played key roles in the accumulation of biomass matter in this region. In addition, the weak correlations between soil nutrients and the climatic factors (PS, TS) indicated that the changes in temperature and precipitation affected the time scale of soil nutrients.
The wide distribution of the forested land resulted in the higher storage of soil nutrient elements in the Daxing’an Mountains area than in other areas of China, even though the contents vary between the different forest types. Although determining the mechanism through which climate acted on the forest types proved difficult, the spatial distribution of the soil nutrients was related to vegetation in the Daxing’an Mountains.
5. Conclusions
The results of this study revealed obvious differences in the variation of soil nutrients. The content of each nutrient in PP was minimal, in obvious contrast to other forest types. Correlations between the soil nutrients and climatic factors were found in this paper. Climatic factors could affect soil nutrients in different forest types. We confirmed that climatic factors (MAT and MAP) are instrumental in affecting soil nutrients (SOC, TN, TP, TK, AP and AK) in five main forest types in the Daxing’an Mountains. Identifying the relationships between soil nutrients, climatic factors and forest types, as suggested in this research, can provide theoretical foundations to further comprehend nutrient cycling in the forest ecosystem.
Acknowledgements
This study was supported by the National Natural Science Foundation of China (41330530).
Author Contributions
S.Y. and T.T. collected the samples and analyzed the data; M.W. and A.Z. performed the experiments; H.C. consulted the literatures; S.Y. wrote the paper; J.Y. designed the experiments.
Conflicts of Interest
The founding sponsors had no role in the design of the study; in the collection, analyses, or interpretation of data; in the writing of the manuscript, and in the decision to publish the results.
References
- Schimel, D.S.; Braswell, B.H.; Holland, E.A.; Mckeown, R.; Ojima, D.S.; Painter, T.H.; Parton, W.J.; Townsend, A.R. Climatic, edaphic, and biotic controls over storage and turnover of carbon in soils. Glob. Biogeochem. Cycles 1994, 8, 279–294. [Google Scholar] [CrossRef]
- Brittany, G.J.; Paul, J.V.; John, A.A. Effects of climate and vegetation on soil nutrients and chemistry in Great Basin studied along a latitudinal-elevational climate gradient. Plant Soil 2014, 382, 151–163. [Google Scholar]
- Duan, X.W.; Rong, L.; Hu, J.M.; Zhang, G.L. Soil organic carbon stocks in the Yunnan Plateau, southwest China: Spatial variations and environmental controls. J. Soil Sediments 2014, 14, 1643–1658. [Google Scholar] [CrossRef]
- Campos, C.A.; Auilar, G.S.; Landgrave, R. Soil organic carbon stocks in Veracruz State (Mexico) estimated using the 1:250,000 soil database of INEGI: Biophysical contributions. J. Soil Sediments 2014, 14, 860–871. [Google Scholar] [CrossRef]
- Hobley, E.; Wilson, B.; Wilkie, A.; Gray, J.; Koen, T. Drivers of soil organic carbon storage and vertical distribution in Eastern Australia. Plant Soil 2015, 390, 111–127. [Google Scholar] [CrossRef]
- Solomon, D.; Fritzsche, F.; Lehmann, J.; Tekalign, M.; Zech, W. Soil organic matter dynamics in the subhumid agroecosystems of the Ethiopian Highlands. J. Organomet. Chem. 2002, 66, 35–42. [Google Scholar]
- Chandra, L.R.; Gupta, S.; Pande, V.; Singh, N. Impact of forest vegetation on soil characteristics: A correlation between soil biological and physico-chemical properties. 3 Biotech. 2016, 6, 188. [Google Scholar] [CrossRef] [PubMed]
- Prietzel, J.; Christophel, D.; Traub, C.; Kolb, E.; Schubert, A. Regional and site-related patterns of soil nitrogen, phosphorus, and potassium stocks and Norway spruce nutrition in mountain forests of the Bavarian Alps. Plant Soil 2015, 386, 151–169. [Google Scholar] [CrossRef]
- Jiang, F.; Wu, X.; Xiang, W.H.; Fang, X.; Zeng, Y.L.; Ouyang, S.; Lei, P.F.; Deng, X.W.; Peng, C.H. Spatial variations in soil organic carbon, nitrogen and phosphorus concentrations related to stand characteristics in subtropical areas. Plant Soil 2017, 413, 289–301. [Google Scholar] [CrossRef]
- Gosz, J.R. Nitrogen cycling in coniferous ecosystems. Ecol. Bull. (Sweden) 1981, 33, 405–426. [Google Scholar]
- Augusto, L.; Ranger, J.; Dan, B.; Rothe, A. Impact of several common tree species of European temperate forests on soil fertility. Ann. For. Sci. 2002, 59, 233–253. [Google Scholar] [CrossRef]
- Wu, J.; Liu, Q. Charcoal-recorded climate changes from Moon Lake in Late Glacial. J. China Univ. Geosci. 2012, 37, 947–954. [Google Scholar]
- Wang, X.Y.; Zhao, C.; Yu, J. Impacts of Climate Change on Forest Ecosystems in Northeast China. Adv. Clim. Chang. Res. 2013, 4, 230–241. [Google Scholar]
- Jiang, C.Q.; Xu, Q.; Jiang, P.K. Integrated evaluation of soil chemical and biochemical fertility under different vegetations. For. Res. 2002, 15, 700–705. [Google Scholar]
- Qu, K.Y.; Dai, L.M.; Feng, H.M.; Zhang, H.S. Soil fertility characteristics of main forest types in Easten Mountain areas of Liaoning. Chin. J. Soil Sci. 2009, 40, 558–562. [Google Scholar]
- Zu, Y.G.; Li, R.; Wang, W.J.; Su, D.X.; Wang, Y.; Qiu, L. Soil organic and inorganic carbon contents in relation to soil physicochemical properties in northeastern China. Acta Ecol. Sin. 2011, 31, 5207–5216. [Google Scholar]
- Zhou, Y.L. Geography of the Vegetation in Northeast China; Science Press: Beijing, China, 1997. [Google Scholar]
- Yu, J.H.; Wang, C.J.; Wan, J.Z.; Han, S.J.; Wang, Q.G.; Nie, S.M. A model-based method to evaluate the ability of nature reserves to protect endangered tree species in the context of climate change. For. Ecol. Manag. 2014, 327, 48–54. [Google Scholar] [CrossRef]
- Wan, J.; Wang, C.; Han, S.; Yu, J. Planning the priority protected areas of endangered orchid species in northeastern China. Biodivers. Conserv. 2014, 23, 1395–1409. [Google Scholar] [CrossRef]
- Avery, B.W.; Bascomb, C.L. Soil Survey Laboratory Methods; Rothamsted Experimental Station, Lawes Agricultural Trust: Harperden, UK, 1974. [Google Scholar]
- Bao, S.D. Soil and Agricultural Chemistry Analysis; China Agriculture Press: Beijing, China, 2000. [Google Scholar]
- Kumar, P. Assessment of impact of climate change on Rhododendrons in Sikkim Himalayas using Maxent modelling: Limitations and challenges. Biodivers. Conserv. 2012, 21, 1251–1266. [Google Scholar] [CrossRef]
- Pachauri, R.K.; Reisinger, A. Climate Change 2007: Synthesis Report; Contribution of Working Groups I, II and III to the Fourth Assessment Report of the Intergovernmental Panel on Climate Change; IPCC: Paris, France, 2007; p. 104. [Google Scholar]
- Blecker, S.W.; Stillings, L.L.; Amacher, M.C.; Ippolito, J.A.; Decrappeo, N.M. Development of vegetation based soil quality indices for mineralized terrane in arid and semi-arid regions. Ecol. Indic. 2012, 20, 65–74. [Google Scholar] [CrossRef]
- Bautista-Cruz, A.; León-González, F.D.; Carrillo-González, R.; Robles, C. Identification of soil quality indicators for maguey mezcalero (Agave angustifolia Haw.) plantations in Southern Mexico. Afr. J. Agric. Res. 2011, 6, 4795–4799. [Google Scholar]
- Ouyang, W.; Huang, H.; Hao, F.; Shan, Y.; Guo, B. Evaluating spatial interaction of soil property with non-point source pollution at watershed scale: The phosphorus indicator in Northeast China. Sci. Total Environ. 2012, 432, 412–421. [Google Scholar] [CrossRef] [PubMed]
- Sharma, K.L.; Grace, J.K.; Mishra, P.K.; Venkateswarlu, B.; Nagdeve, M.B.; Gabhane, V.V.; Sankar, G.M.; Korwar, G.R.; Chary, G.R.; Rao, C.S. Effect of soil and nutrient-management treatments on soil quality indices under cotton-based production system in Rainfed Semi-arid Tropical Vertisol. Commun. Soil Sci. Plant 2011, 42, 1298–1315. [Google Scholar] [CrossRef]
- Batey, T. Soil compaction and soil management—A review. Soil Use Manag. 2010, 25, 335–345. [Google Scholar] [CrossRef]
- Jagadamma, S.; Lal, R.; Hoeft, R.G.; Nafziger, E.D.; Adee, E.A. Nitrogen fertilization and cropping system impacts on soil properties and their relationship to crop yield in the central Corn Belt, USA. Soil Tillage Res. 2008, 98, 120–129. [Google Scholar] [CrossRef]
- Chang, J.; Clay, D.E.; Dalsted, K.; Clay, S.; O’neill, M. Corn (L.) yield prediction using multispectral and multidate reflectance. Agron. J. 2003, 95, 1447–1453. [Google Scholar] [CrossRef]
- Hothorn, T.; Everitt, B.S. A Handbook of Statistical Analyses Using R, 3rd ed.; CRC Press: Boca Raton, FL, USA, 2014; Volume 37, p. 434. [Google Scholar]
- Andrews, S.S.; Carroll, C.R. Designing a soil quality assessment tool for sustainable agroecosystem management. Ecol. Appl. 2011, 11, 1573–1585. [Google Scholar] [CrossRef]
- Wang, F.; Huang, M.; Sun, X.H.; Gong, Y.Z.; Wang, J.B. Evaluation of soil nutrients for different forest types in Xing′an Mountains forest area. Bull. Soil Water Conserv. 2013, 33, 182–187. [Google Scholar]
- Christensen, J.H.; Carter, T.R.; Rummukainen, M.; Amanatidis, G. Evaluating the performance and utility of regional climate models: The PRUDENCE project. Clim. Chang. 2007, 81, 1–6. [Google Scholar] [CrossRef]
- Gavazov, K.S. Dynamics of alpine plant litter decomposition in a changing climate. Plant Soil 2010, 337, 19–32. [Google Scholar] [CrossRef]
- Shanin, V.; Komarov, A.; Khoraskina, Y.; Bykhovets, S.; Linkosalo, T.; Mäkipää, R. Carbon turnover in mixed stands: Modelling possible shifts under climate change. Ecol. Model. 2013, 251, 232–245. [Google Scholar] [CrossRef]
- Deng, L.; Wang, K.B.; Chen, M.L.; Shangguan, Z.P.; Sweeney, S. Soil organic carbon storage capacity positively related to forest succession on the Loess Plateau, China. CATENA 2013, 110, 1–7. [Google Scholar] [CrossRef]
- Harradine, F.; Jenny, H. Influence of parent material and climate on texture and nitrogen and carbon contents of virgin California soils—Texture and nitrogen contents of soils. Soil Sci. 1985, 85, 235–243. [Google Scholar] [CrossRef]
- Yimer, F.; Ledin, S.; Abdelkadir, A. Soil property variations in relation to topographic aspect and vegetation community in the south-eastern highlands of Ethiopia. For. Ecol. Manag. 2006, 232, 90–99. [Google Scholar] [CrossRef]
- Körner, C. Ecological impacts of atmospheric CO2 enrichment on terrestrial ecosystems. Philos. Trans. 2003, 361, 2023–2041. [Google Scholar] [CrossRef] [PubMed]
- Davidson, E.A.; Trumbore, S.E.; Amundson, R. Soil warming and organic carbon content. Nature 2000, 408, 789–790. [Google Scholar] [CrossRef] [PubMed]
- Lenton, T.M.; Huntingford, C. Global terrestrial carbon storage and uncertainties in its temperature sensitivity examined with a simple model. Glob. Chang. Biol. 2003, 9, 1333–1352. [Google Scholar] [CrossRef]
- Orchard, V.A.; Cook, F.J. Relationship between soil respiration and soil moisture. Soil Biol. Biochem. 1983, 15, 447–453. [Google Scholar] [CrossRef]
Figure 1.
Map of the study area and investigated plots of five forest types in the Daxing’an Mountains. PP = pure Pinus sylvestris L. var. mongolica Litv. forest, PQ = pure Quercus mongolica Fisch. ex Ledeb. forest, MLB = Larix gmelinii (Rupr.) Kuzen and Betula platyphylla Suk. mixed forest, PL = pure Larix gmelinii (Rupr.) Kuzen forest, PB = pure Betula platyphylla Suk. forest.
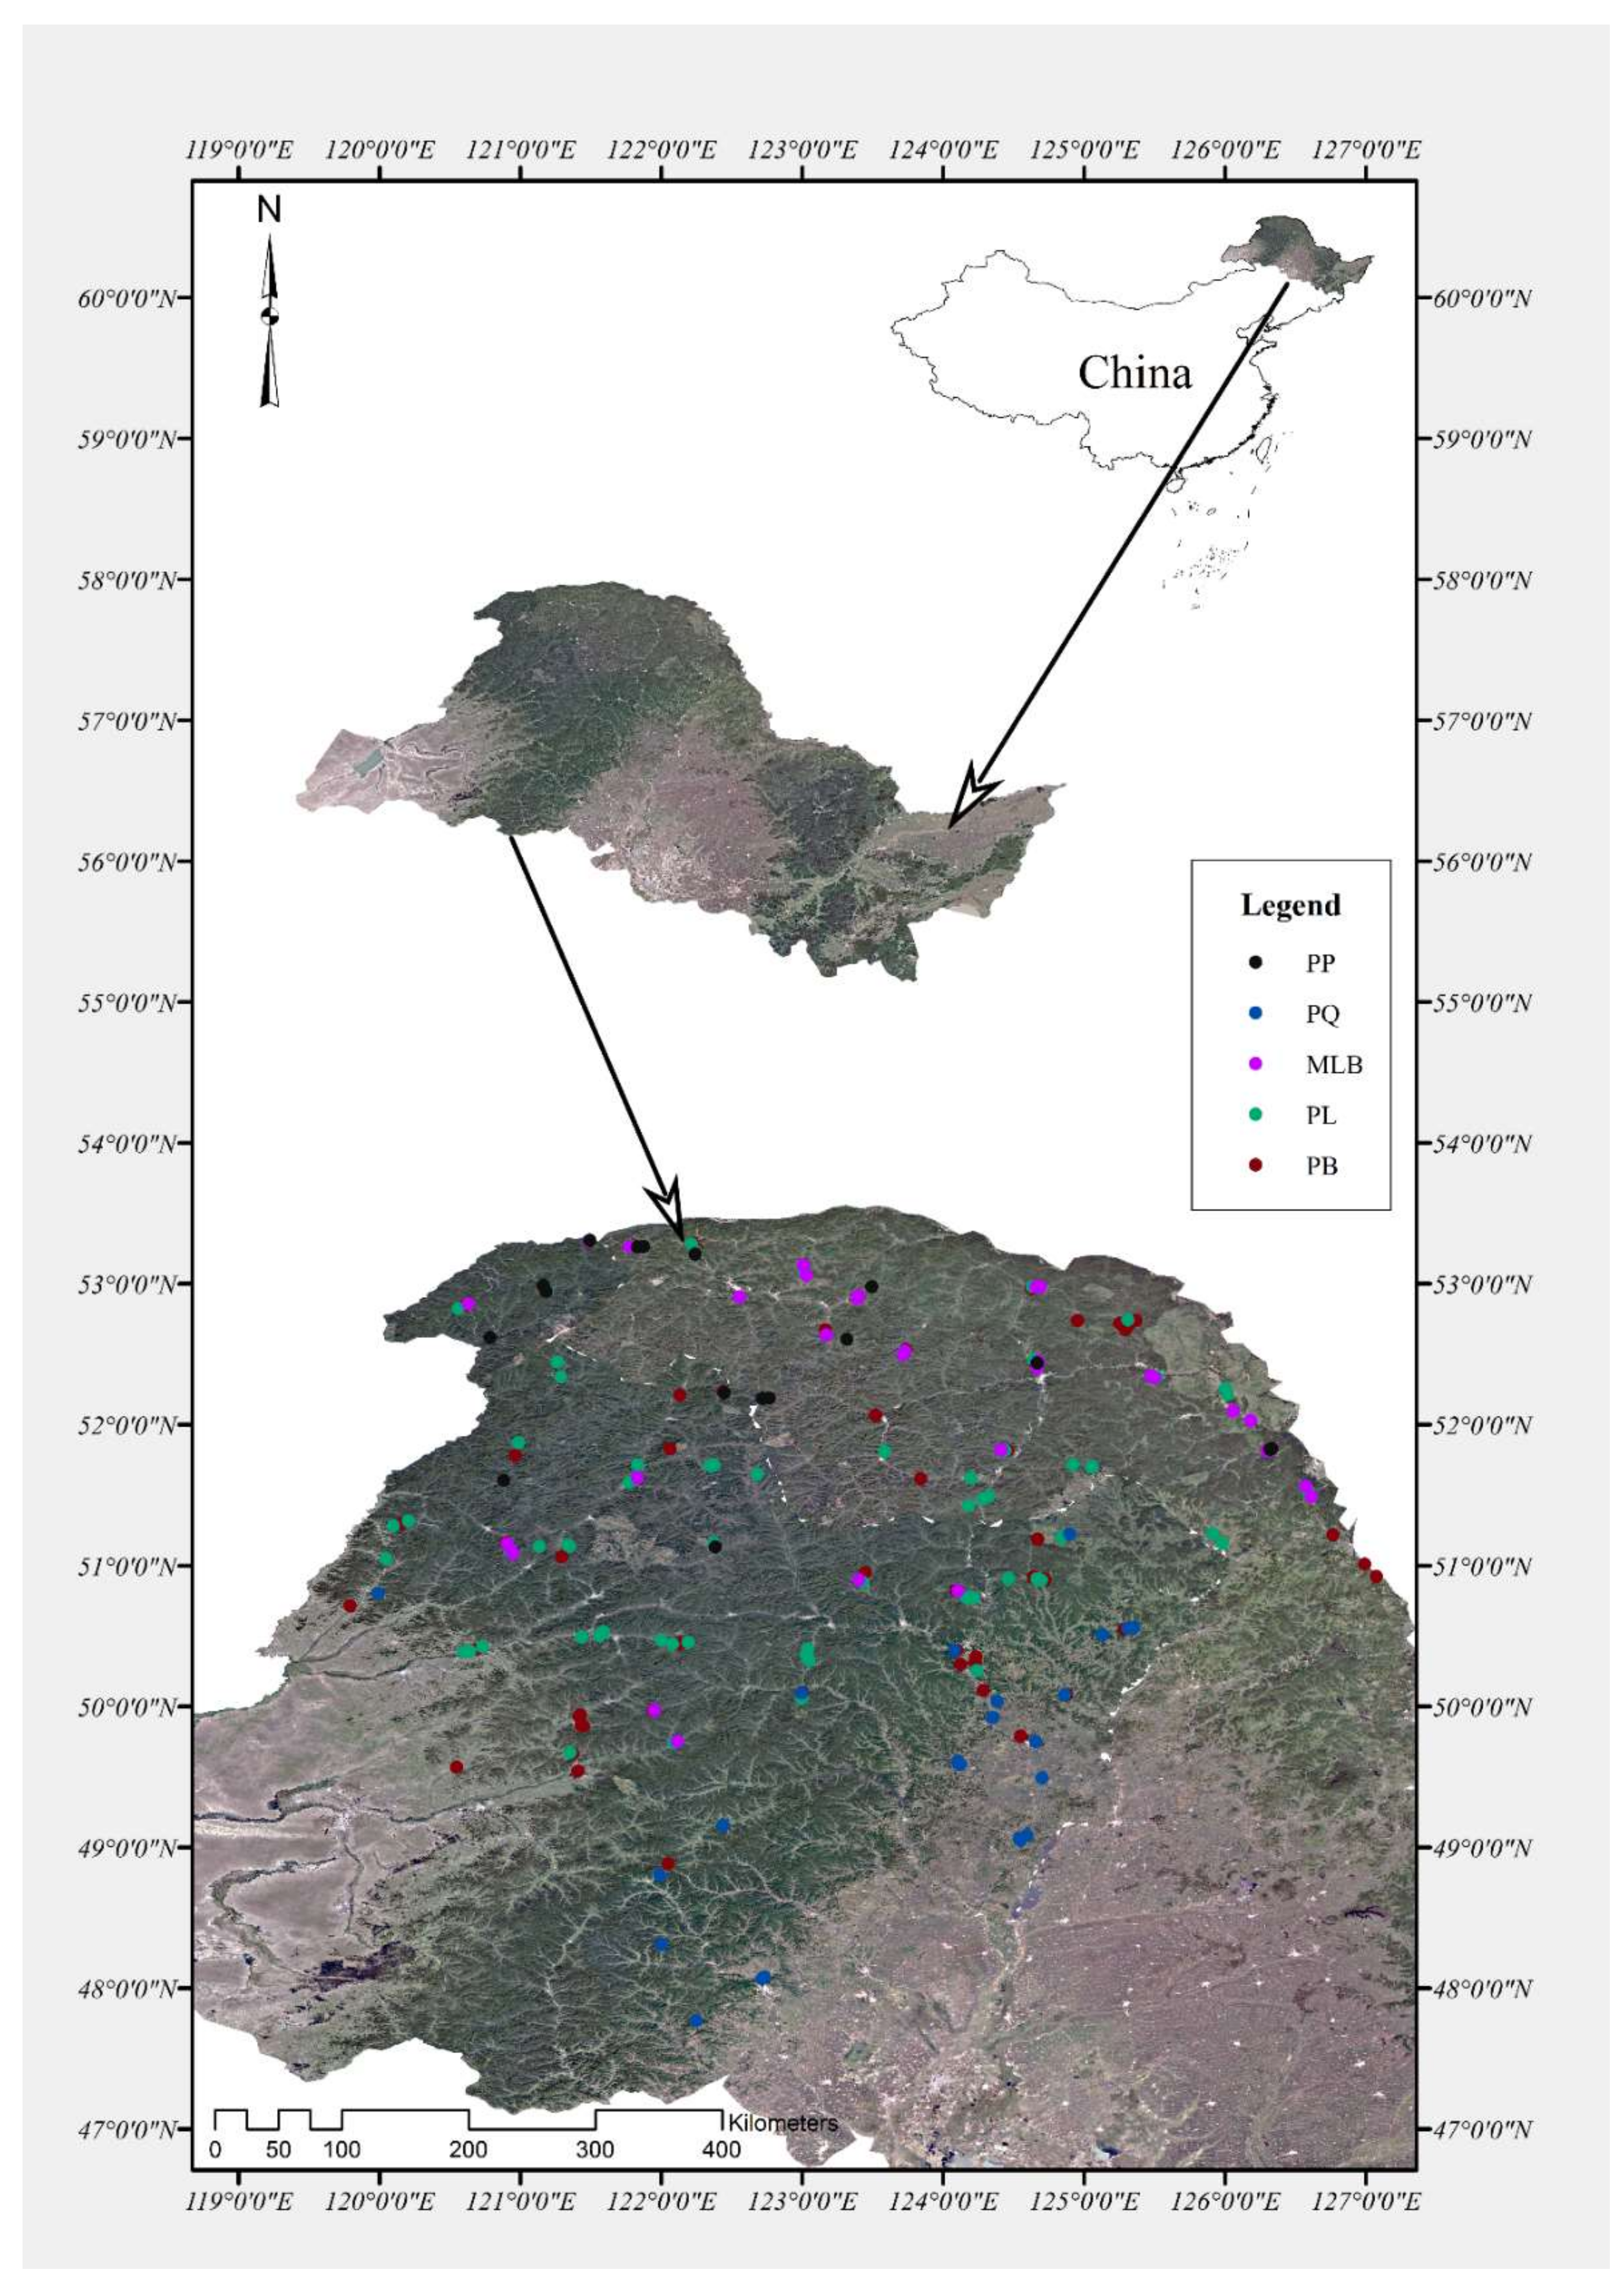
Figure 2.
Variation of soil properties in different forest types. SOC = soil organic carbon, TN = total nitrogen, TP = total phosphorus, TK = total potassium, AP = available phosphorus, and AK = available potassium. PP = pure Pinus sylvestris L. var. mongolica Litv. forest, PQ = pure Quercus mongolica Fisch. ex Ledeb. forest, MLB = Larix gmelinii (Rupr.) Kuzen and Betula platyphylla Suk. mixed forest, PL = pure Larix gmelinii (Rupr.) Kuzen forest, PB = pure Betula platyphylla Suk. forest. A, B, C, D, E and F were respectively represent for SOC, TN, TP, TK, AP and AK content of five forest types. “□” = average value, “×” = outliter.
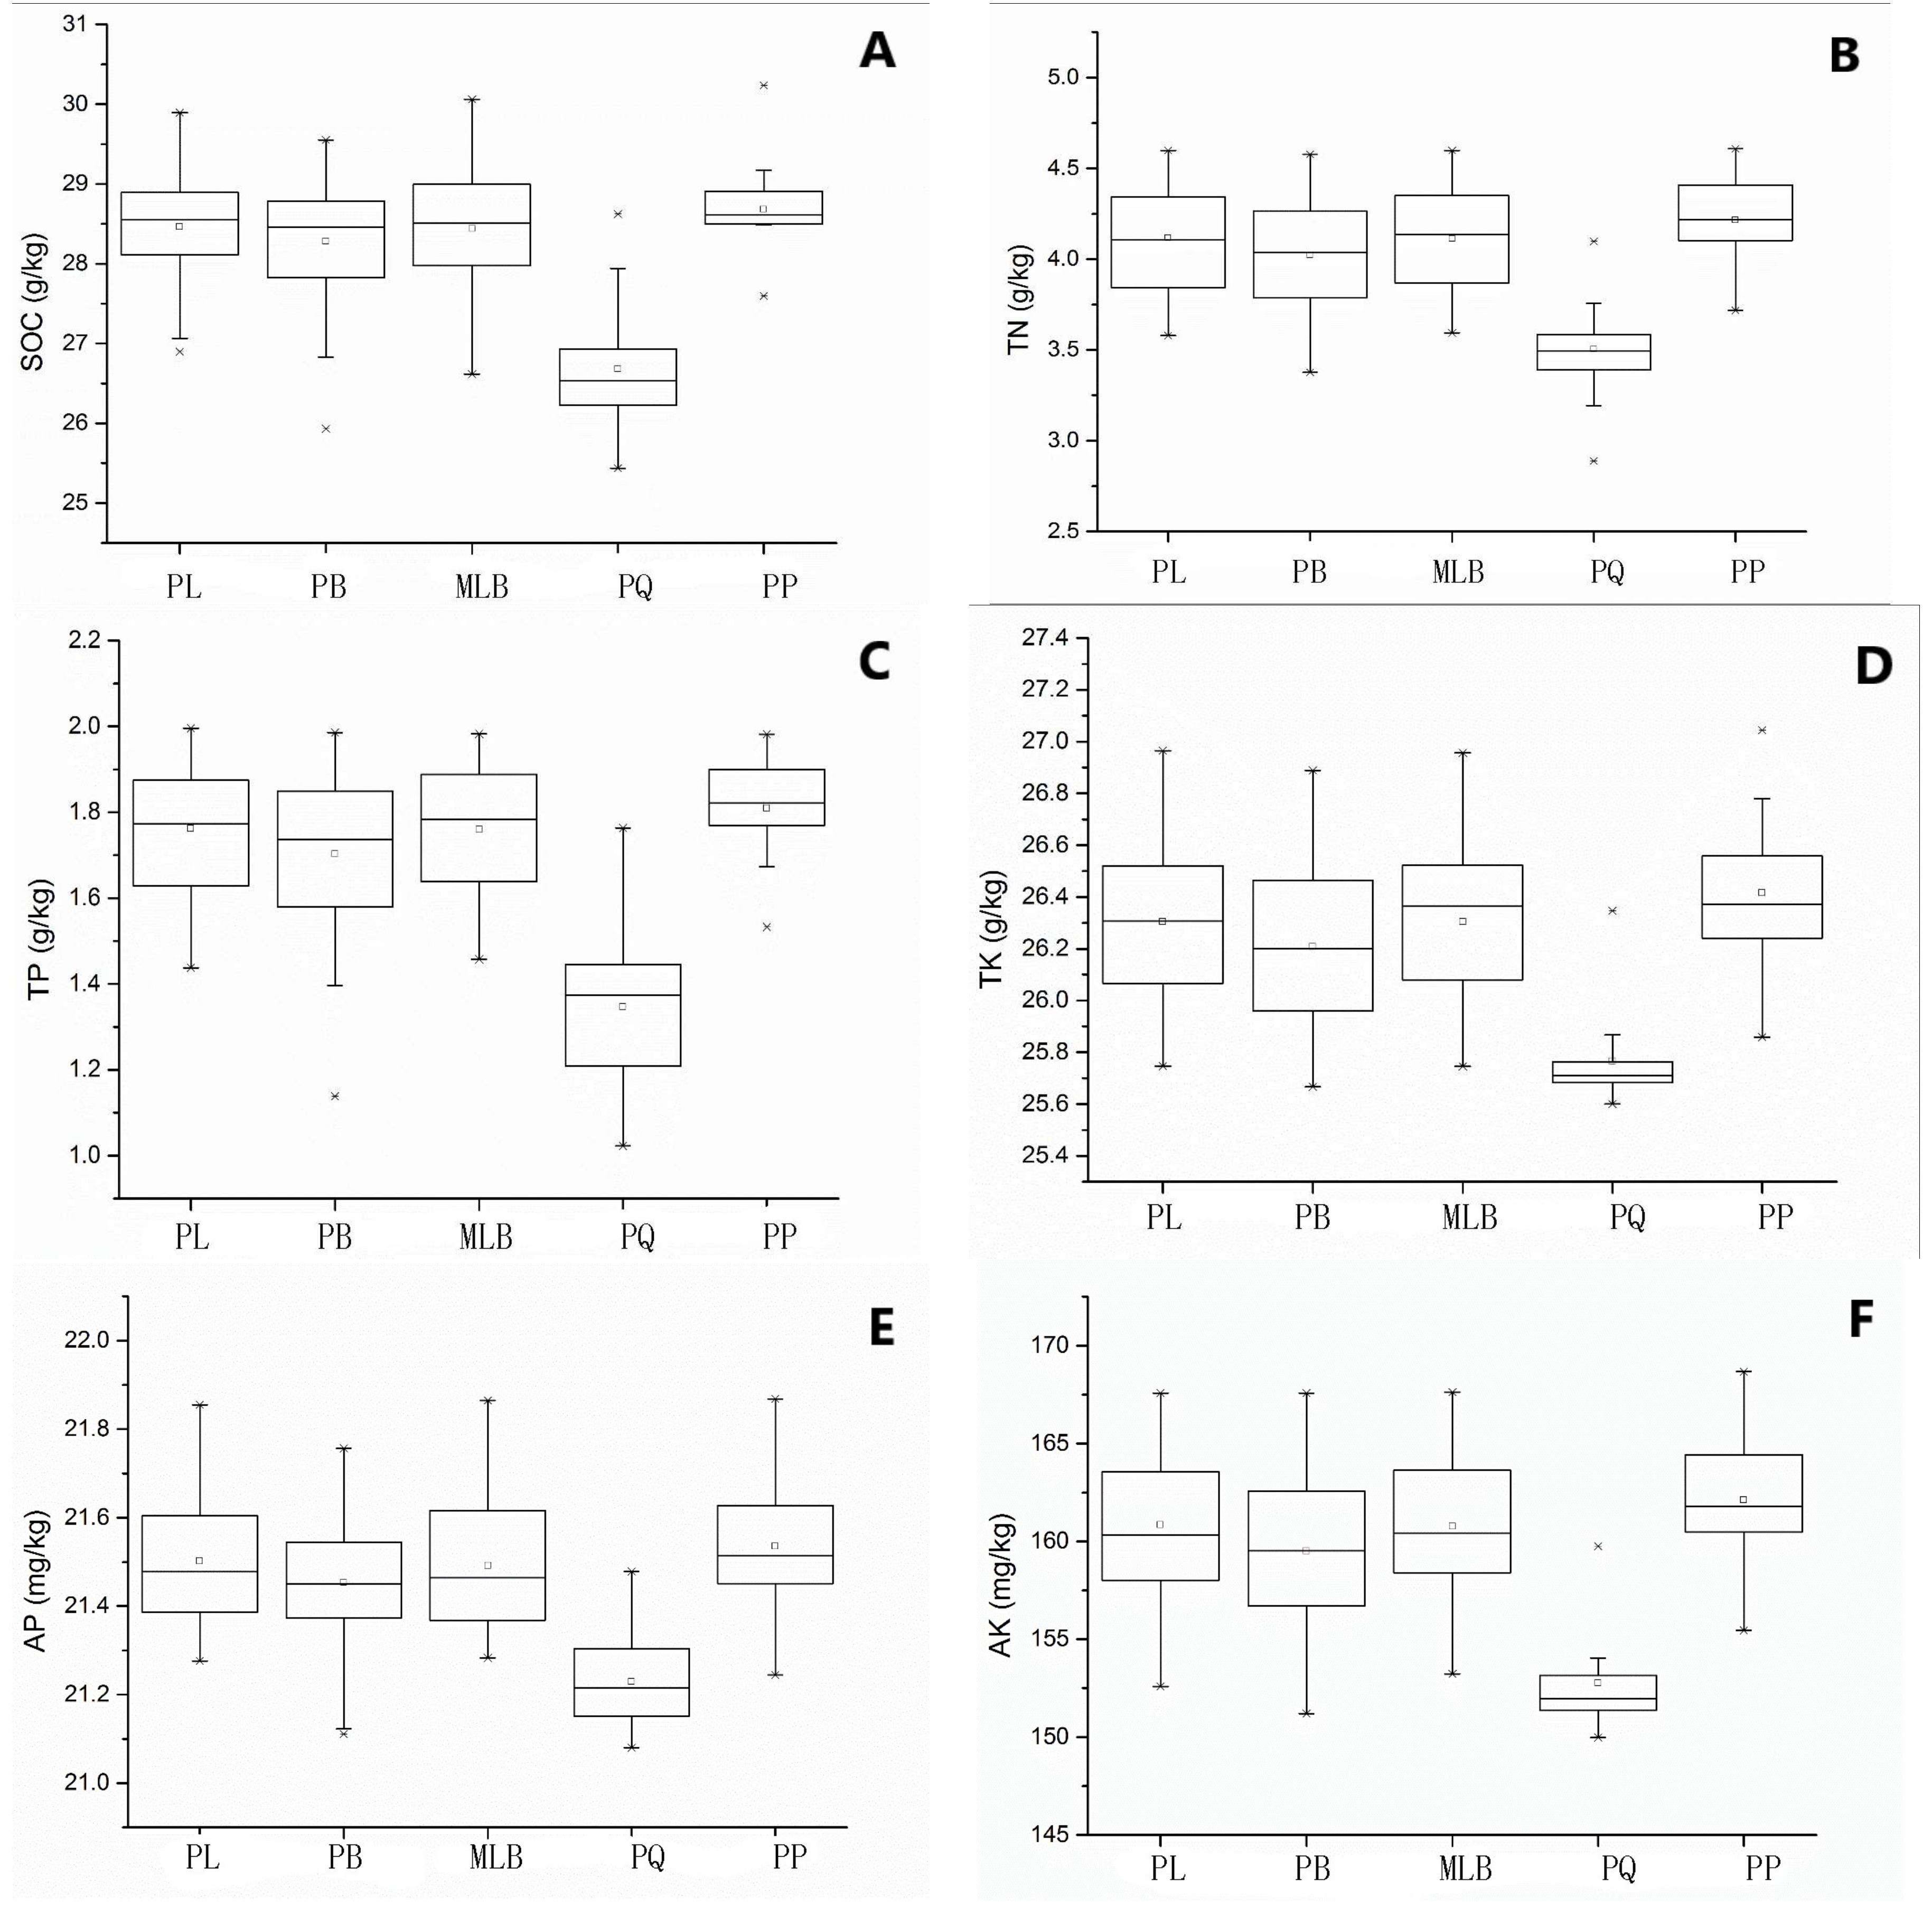
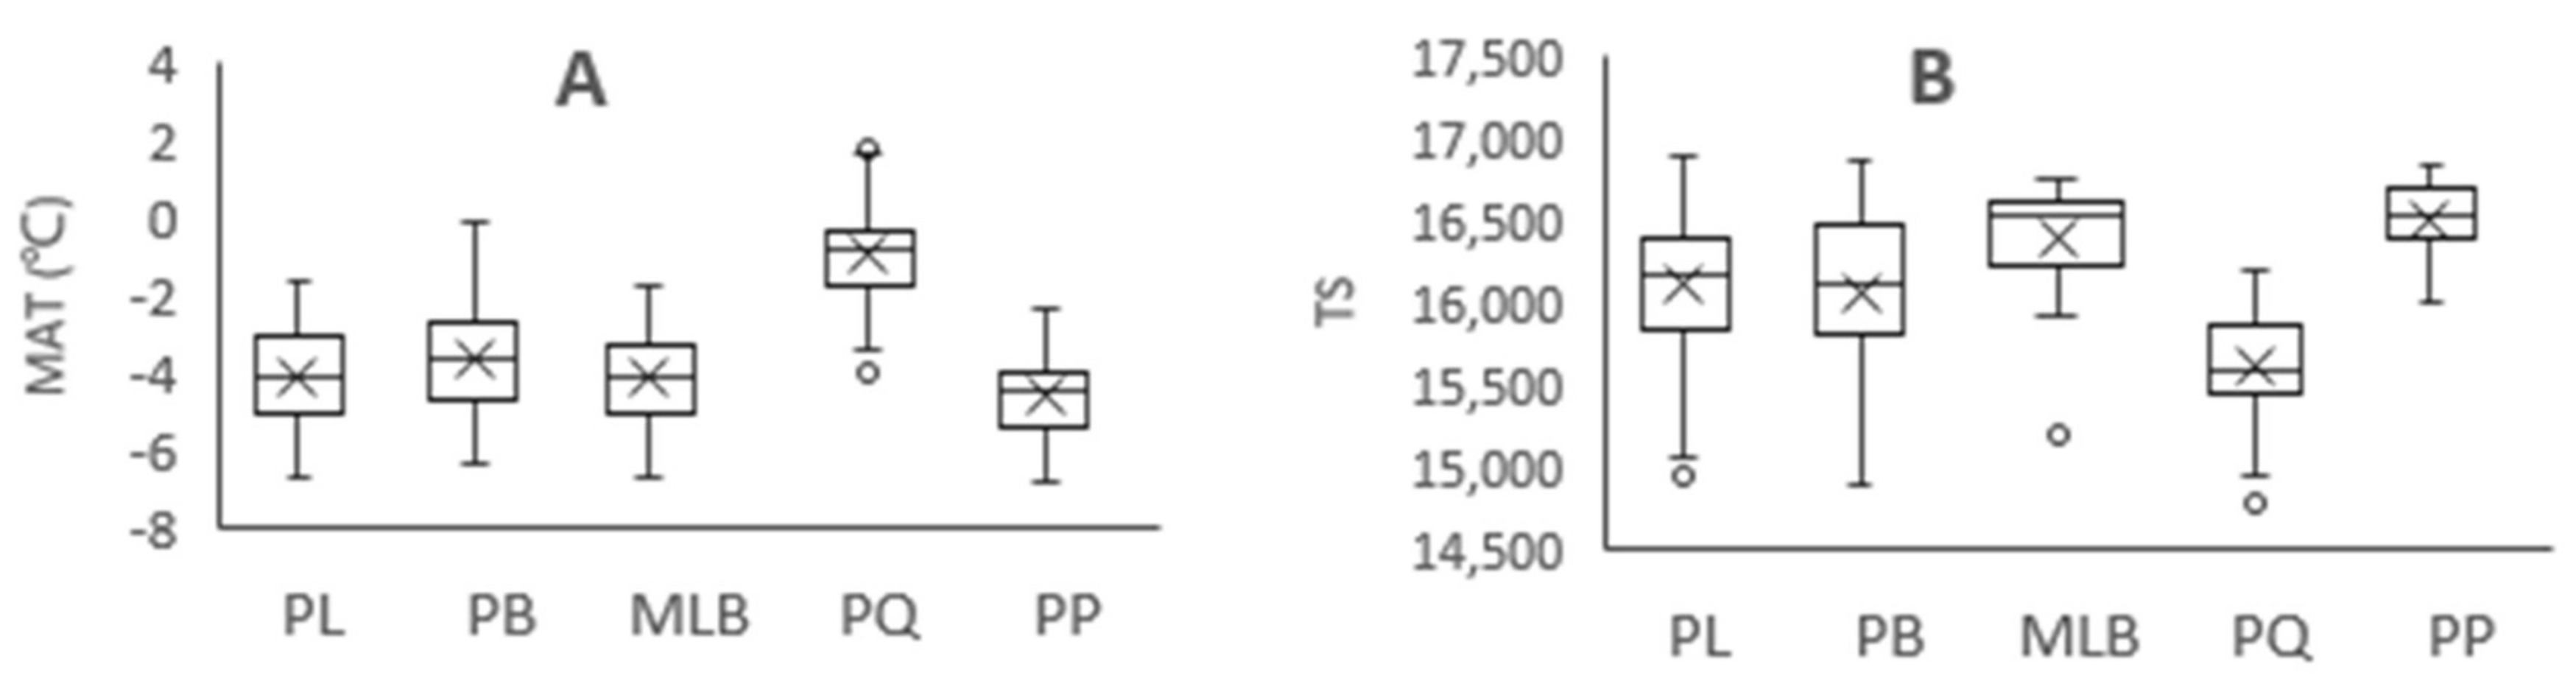
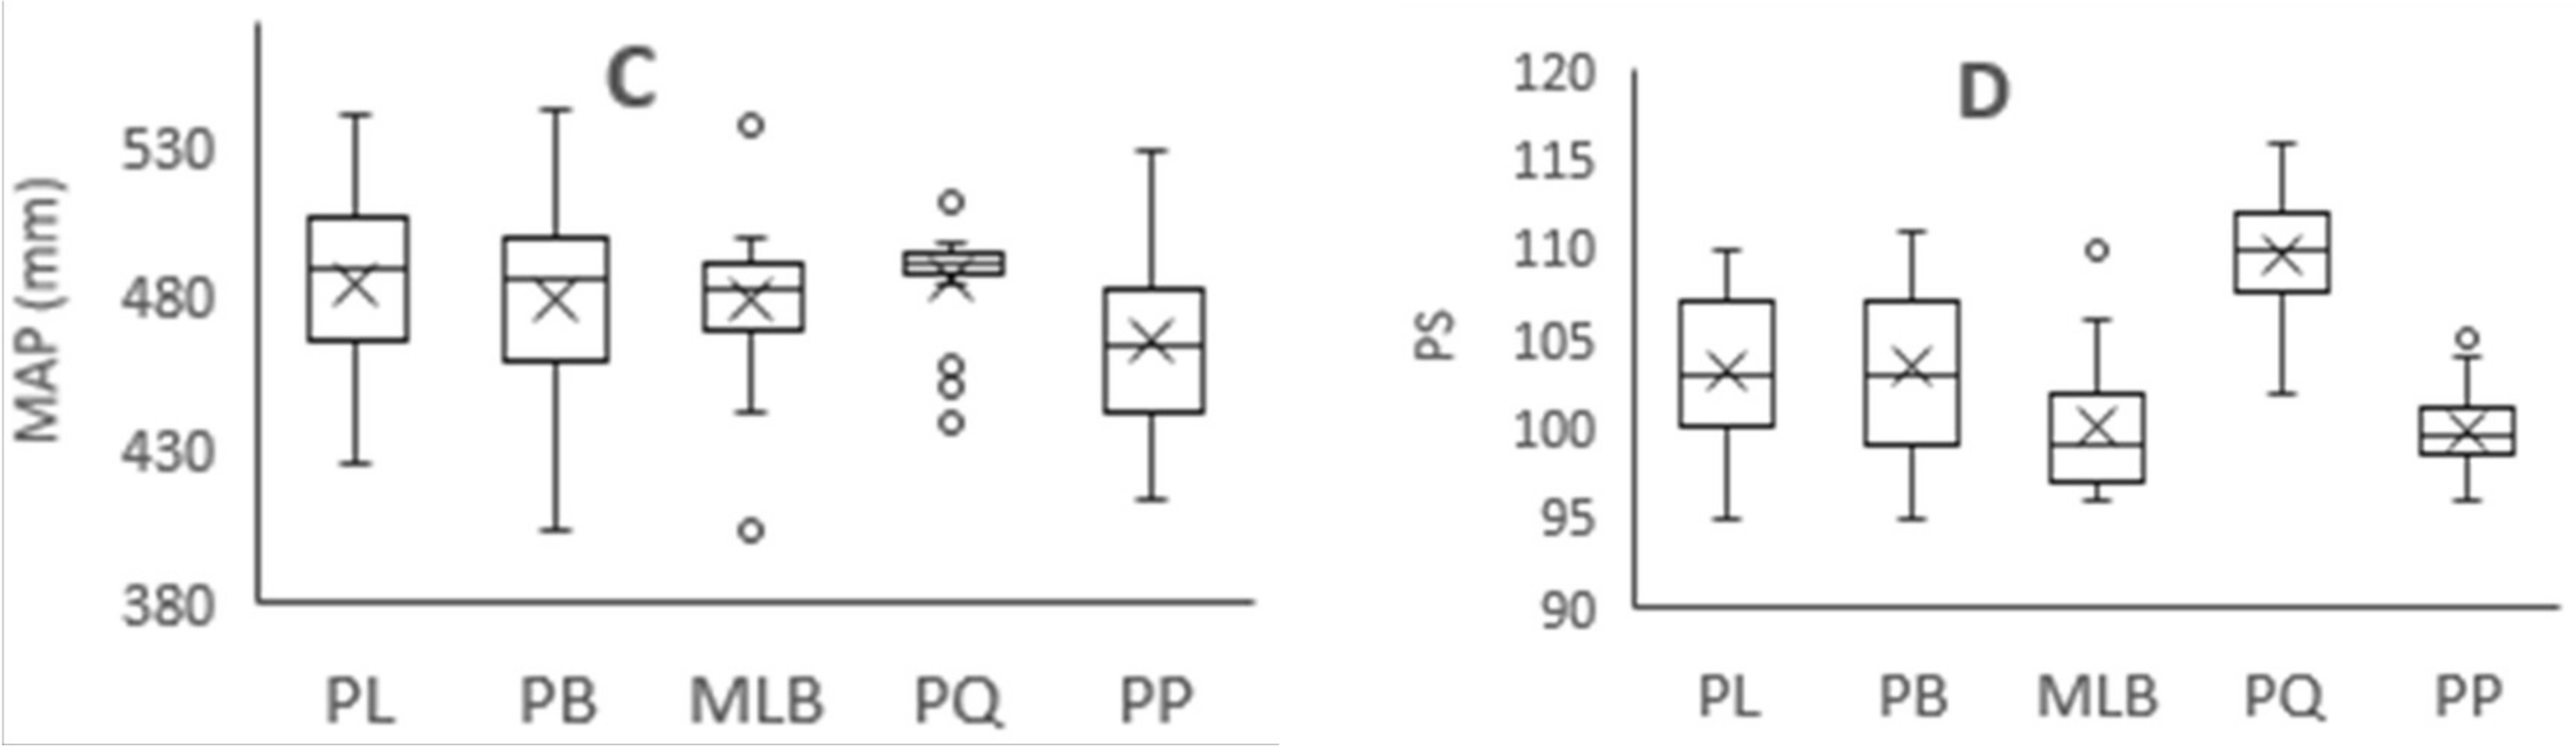
Figure 3.
Variation of climatic factors in different forest types. MAT = mean annual temperature, TS = temperature seasonality, MAP = mean annual precipitation, and PS = precipitation seasonality. PL = pure Larix gmelinii (Rupr.) Kuzen forest, PB = pure Betula platyphylla Suk. Forest, MLB = Larix gmelinii (Rupr.) Kuzen and Betula platyphylla Suk. mixed forest, PQ = pure Quercus mongolica Fisch. ex Ledeb. forest, PP = pure Pinus sylvestris L. var. mongolica Litv. Forest. A: MAT of five forest types, B: TS of five forest types, C: MAP of five forest types, D: PS of five forest types. “×” = average value, “○” = outliter.


Figure 4.
Principal component analysis (PCA) of the different forest types and the soil nutrients. PL = pure Larix gmelinii (Rupr.) Kuzen forest, PB = pure Betula platyphylla Suk. Forest, MLB = Larix gmelinii (Rupr.) Kuzen and Betula platyphylla Suk. mixed forest, PQ = pure Quercus mongolica Fisch. ex Ledeb. forest, PP = pure Pinus sylvestris L. var. mongolica Litv. Forest. SOC = soil organic carbon, TN = total nitrogen, TP = total phosphorus, TK = total potassium, AP = available phosphorus, and AK = available potassium.

Table 1.
Total variance explained.
| Component | Initial Eigenvalues | Extraction Sums of Squared Loadings | Rotation Sums of Squared Loadings | ||||||
|---|---|---|---|---|---|---|---|---|---|
| Total | % of Variance | Cumulative % | Total | % of Variance | Cumulative % | Total | % of Variance | Cumulative % | |
| 1 | 5.733 | 95.551 | 95.551 | 5.733 | 95.551 | 95.551 | 3.363 | 56.058 | 56.058 |
| 2 | 0.133 | 2.217 | 97.768 | 0.133 | 2.217 | 97.768 | 2.503 | 41.710 | 97.768 |
| 3 | 0.068 | 1.134 | 98.903 | ||||||
| 4 | 0.044 | 0.733 | 99.635 | ||||||
| 5 | 0.015 | 0.244 | 99.880 | ||||||
| 6 | 0.007 | 0.120 | 100.000 | ||||||
Extraction Method: Principal Component Analysis.
Table 2.
Correlation coefficient matrix for soil nutrients and climatic factors.
| Nutrient | MAT | TS | MAP | PS |
|---|---|---|---|---|
| SOC | −0.223 ** | 0.417 ** | 0.311 ** | −0.4700 ** |
| TN | −0.101 | 0.341 ** | 0.411 ** | −0.414 ** |
| TK | −0.052 | 0.312 ** | −0.411 ** | −0.378 ** |
| TP | 0.187 ** | −0.405 ** | −0.383 ** | 0.471 ** |
| AK | −0.106 | 0.365 ** | 0.384 ** | −0.425 ** |
| AP | −0.050 | 0.307 ** | 0.385 ** | −0.367 ** |
N = 230. SOC = soil organic carbon, TN = total nitrogen, TP = total phosphorus, TK = total potassium, AP = available phosphorus, and AK = available potassium. MAT = mean annual temperature, TS = temperature seasonality, MAP = mean annual precipitation, and PS = precipitation seasonality. (** p < 0.01).
Table 3.
Pearson correlations (r) between soil nutrients and climatic factors in the five main forest types.
Table 3.
Pearson correlations (r) between soil nutrients and climatic factors in the five main forest types.
| Types Nutrient | MAT | TS | MAP | PS | Types Nutrient | MAT | TS | MAP | PS | ||
|---|---|---|---|---|---|---|---|---|---|---|---|
| PL | SOC | 0.287 ** | 0.130 | 0.543 ** | −0.235 * | PB | SOC | 0.188 | 0.261 * | 0.542 ** | −0.223 |
| TN | 0.380 ** | 0.010 | 0.603 ** | −0.140 | TN | 0.364 ** | 0.176 | 0.600 ** | −0.148 | ||
| TK | 0.376 ** | 0.030 | 0.579 ** | −0.142 | TK | 0.387 ** | 0.191 | 0.586 ** | −0.165 | ||
| TP | 0.349 ** | 0.040 | 0.614 ** | −0.173 | TP | 0.284 * | 0.235 | 0.609 ** | −0.222 | ||
| AK | 0.379 ** | 0.058 | 0.586 ** | −0.172 | AK | 0.345 ** | 0.227 | 0.550 ** | −0.173 | ||
| AP | 0.485 ** | −0.06 | 0.542 ** | −0.061 | AP | 0.365 ** | 0.204 | 0.519 ** | −0.154 | ||
| MLB | SOC | 0.362 * | 0.151 | 0.358 * | −0.274 | PQ | SOC | 0.199 | 0.301 | 0.322 | −0.271 |
| TN | 0.46 ** | 0.151 | 0.455 ** | −0.337 * | TN | 0.295 | 0.202 | 0.426 * | −0.215 | ||
| TK | 0.546 ** | 0.157 | 0.407 * | −0.316 | TK | 0.121 | 0.047 | 0.201 | 0.059 | ||
| TP | 0.549 ** | 0.197 | 0.434 ** | −0.384 * | TP | 0.141 | 0.383 | 0.454 * | −0.332 | ||
| AK | 0.537 ** | 0.188 | 0.418 * | −0.349 * | AK | 0.219 | 0.171 | 0.219 | −0.128 | ||
| AP | 0.556 ** | 0.060 | 0.437 ** | −0.246 | AP | 0.168 | 0.329 | 0.337 | −0.227 | ||
| PP | SOC | 0.309 | 0.126 | 0.360 | −0.470 * | ||||||
| TN | 0.206 | 0.069 | 0.629 ** | −0.453 | |||||||
| TK | 0.270 | 0.044 | 0.614 ** | −0.336 | |||||||
| TP | 0.176 | 0.088 | 0.621 ** | −0.436 | |||||||
| AK | 0.273 | 0.056 | 0.619 ** | −0.485 * | |||||||
| AP | 0.205 | 0.028 | 0.611 ** | −0.464 | |||||||
SOC = soil organic carbon, TN = total nitrogen, TP = total phosphorus, TK = total potassium, AP = available phosphorus, and AK = available potassium. MAT = mean annual temperature, TS = temperature seasonality, MAP = mean annual precipitation, and PS = precipitation seasonality. PL = pure Larix gmelinii (Rupr.) Kuzen forest, PB = pure Betula platyphylla Suk. Forest, MLB = Larix gmelinii (Rupr.) Kuzen and Betula platyphylla Suk. mixed forest, PQ = pure Quercus mongolica Fisch. ex Ledeb. forest, PP = pure Pinus sylvestris L. var. mongolica Litv. Forest. (* p < 0.05; ** p < 0.01).
Table 4.
Step regressions between soil nutrients and climatic factors in the five main forest types.
Table 4.
Step regressions between soil nutrients and climatic factors in the five main forest types.
| Forest Types | Soil Nutrients | R | R2 | Adjusted R2 | Standard Error of the Estimate |
|---|---|---|---|---|---|
| PL | SOC | 0.715 | 0.512 | 0.488 | 0.45880 |
| TN | 0.741 | 0.549 | 0.539 | 0.19099 | |
| TP | 0.734 | 0.538 | 0.527 | 0.10257 | |
| TK | 0.717 | 0.513 | 0.502 | 0.21375 | |
| AP | 0.759 | 0.576 | 0.566 | 0.08648 | |
| AK | 0.726 | 0.527 | 0.516 | 2.61645 | |
| PB | SOC | 0.762 | 0.580 | 0.552 | 0.50973 |
| TN | 0.852 | 0.727 | 0.708 | 0.16591 | |
| TP | 0.829 | 0.687 | 0.665 | 0.10871 | |
| TK | 0.853 | 0.728 | 0.709 | 0.17232 | |
| AP | 0.812 | 0.660 | 0.637 | 0.08950 | |
| AK | 0.844 | 0.713 | 0.694 | 2.29320 | |
| MLB | SOC | 0.606 | 0.367 | 0.307 | 0.60923 |
| TN | 0.803 | 0.644 | 0.611 | 0.17465 | |
| TP | 0.809 | 0.654 | 0.621 | 0.09086 | |
| TK | 0.767 | 0.588 | 0.550 | 0.20503 | |
| AP | 0.740 | 0.548 | 0.520 | 0.09897 | |
| AK | 0.784 | 0.614 | 0.578 | 2.40780 | |
| PQ | SOC | – | – | – | – |
| TN | 0.782 | 0.612 | 0.557 | 0.15610 | |
| TP | 0.454 | 0.206 | 0.172 | 0.16556 | |
| TK | – | – | – | – | |
| AP | – | – | – | – | |
| AK | – | – | – | – | |
| PP | SOC | 0.470 | 0.221 | 0.172 | 0.50111 |
| TN | 0.787 | 0.619 | 0.569 | 0.16243 | |
| TP | 0.759 | 0.576 | 0.520 | 0.08790 | |
| TK | 0.817 | 0.667 | 0.520 | 0.16327 | |
| AP | 0.768 | 0.590 | 0.535 | 0.10037 | |
| AK | 0.822 | 0.676 | 0.633 | 2.13592 |
Note: SOC = soil organic carbon, TN = total nitrogen, TP = total phosphorus, TK = total potassium, AP = available phosphorus, and AK = available potassium. PL = pure Larix gmelinii (Rupr.) Kuzen forest, PB = pure Betula platyphylla Suk. Forest, MLB = Larix gmelinii (Rupr.) Kuzen and Betula platyphylla Suk. mixed forest, PQ = pure Quercus mongolica Fisch. ex Ledeb. forest, PP = pure Pinus sylvestris L. var. mongolica Litv. Forest, “–” = there is no value.
© 2018 by the authors. Licensee MDPI, Basel, Switzerland. This article is an open access article distributed under the terms and conditions of the Creative Commons Attribution (CC BY) license (http://creativecommons.org/licenses/by/4.0/).
Share and Cite
MDPI and ACS Style
Yuan, S.; Tang, T.; Wang, M.; Chen, H.; Zhang, A.; Yu, J. Regional Scale Determinants of Nutrient Content of Soil in a Cold-Temperate Forest. Forests 2018, 9, 177. https://doi.org/10.3390/f9040177
AMA Style
Yuan S, Tang T, Wang M, Chen H, Zhang A, Yu J. Regional Scale Determinants of Nutrient Content of Soil in a Cold-Temperate Forest. Forests. 2018; 9(4):177. https://doi.org/10.3390/f9040177
Chicago/Turabian StyleYuan, Shusheng, Tongtong Tang, Minchao Wang, Hao Chen, Aihua Zhang, and Jinghua Yu. 2018. "Regional Scale Determinants of Nutrient Content of Soil in a Cold-Temperate Forest" Forests 9, no. 4: 177. https://doi.org/10.3390/f9040177
Note that from the first issue of 2016, this journal uses article numbers instead of page numbers. See further details here.