Abstract
Moderate severity disturbances, which only kill a subset of canopy trees (e.g., via insects, pathogens, and windthrow), are increasingly widespread in North America, and can alter forest structure and production. Whether the net primary production (NPP) of forest stands differing in pre-disturbance site quality and composition respond similarly to moderate severity disturbance, however, is unknown, but critical to understanding the disturbance response dynamics of patchy landscapes. We experimentally disturbed three, 2-ha stands varying in pre-disturbance primary production and community composition, temporarily reducing live stand basal area by 38% to 66% through the stem girdling of all mature early successional aspen (Populus tremuloides Michx. and Populus grandidentata Michx.) and birch (Betula papyrifera Marshall). Disturbance significantly altered stand-scale physical and biological structure and prompted a similar decade-long pattern of wood NPP decline and recovery. All stands exhibited an initial reduction in wood NPP, followed by a recovery period and eventual return to pre-disturbance levels within eight years, with the most productive stand exhibiting an increase in primary production following recovery. Following wood NPP recovery, more biologically diverse forest canopies with higher leaf area indexes intercepted more light, and, consequently, had higher rates of wood NPP. We conclude that, despite substantial pre-disturbance differences in productivity and community composition, relative wood NPP recovery patterns can be similar, though long-term post-recovery primary production may trend higher in more productive and compositionally diverse stands. We suggest that improved mechanistic understanding of different forest ecosystems’ responses to disturbances remains critical to informing management decisions across diverse landscape mosaics.
1. Introduction
As the world’s largest terrestrial carbon (C) sink, forests reduce atmospheric CO2 by capturing an estimated 2.3 ± 0.4 Pg C year−1 through photosynthetic uptake and subsequent plant biomass accumulation [1]. Forest net primary production (NPP), a measure of C accumulation in plant biomass, varies considerably across [1,2,3] and within [1,4,5] forested landscapes, in part due to the influence of heterogeneously distributed disturbances, which occur along a continuum of severity [6,7,8]. While the generalized pattern of NPP decline and recovery following severe, stand-replacing disturbances has been well characterized [6,9,10], less is known about how NPP responds to moderate severity disturbances, such as extreme weather, insects and fungal pathogens, and age-related senescence, which may only kill a fraction of canopy trees. These moderate disturbances are increasing in frequency in North American forests [10,11,12], limiting our ability to accurately predict the recovery of these ecosystems [1,13,14,15].
The response of primary production to disturbance varies within forest landscapes due to co-varying differences in local site quality, productivity, physical structure, and community composition [10,16,17,18,19]. The effect of these biotic and abiotic factors on NPP may be especially strong because ecosystems experiencing milder disturbances retain and rely on their structural and biological legacies for growth recovery. This preserved biotic and abiotic capital fuels post-disturbance resource availability and, consequently, may strongly predict NPP response and recovery to disturbance. Prior studies have shown that within-landscape variation in site quality—a function of microclimate and soil fertility—influences how forest growth responds to canopy thinning [16]. Plant diversity measures summarizing the number and variety of species are highly variable across forested landscapes and may be positively correlated with the rate and extent of NPP disturbance recovery [20,21,22,23]. Physical canopy structure, which describes the arrangement of vegetation, affects access to growth-limiting resources [17,24,25,26], and is hypothesized to affect disturbance recovery patterns independent of plant diversity [27]. In general, however, very little is known about how differences in site productivity, and physical and biological structure together relate to patterns of primary production decline and recovery following moderate severity disturbance [10,11].
Here, we evaluated the response of forest stands differing in pre-disturbance site quality and canopy composition to moderate severity disturbance. To better understand the underlying patterns driving differential responses, we examined relationships between aboveground wood net primary production (wood NPP) and canopy physical and biological structure following the recovery of production and leaf area. Our work builds on findings from an experimental disturbance manipulation of an Upper Great Lakes forest landscape showing whole-landscape forest production was highly resistant to moderate severity disturbance, and that recovery patterns were related to physical and biological stand structural features [28,29,30]. Our specific objectives were to: evaluate whether stands differing in pre-disturbance site quality and composition follow similar trajectories of leaf area and stem diameter distribution change and wood NPP recovery following moderate severity disturbance (Obj. 1); and link measures of ecosystem structure to canopy light interception and wood NPP following the disturbance recovery, once leaf area rebounded to pre-disturbance levels (LAI; Obj. 2).
2. Materials and Methods
2.1. Study Site and Experimental Design
We conducted our research at the University of Michigan Biological Station (UMBS) in northern lower Michigan, USA (45°33′36″ N–84°42′36″ W). The area has a mean annual temperature of 5.5 °C and a mean annual precipitation of 817 mm [29]. Extensive clear-cutting and fire in the late 19th and early 20th centuries replaced white pine (Pinus strobus L.) and eastern hemlock (Tsuga canadensis L.) forests with early successional aspen (Populus spp.) and birch (Betula papyrifera Marshall) dominant stands. A century later, as early successional species senesce, the landscape is transitioning to mid-late successional forest stands dominated by red maple (Acer rubrum L.), red oak (Quercus rubra L.), American beech (Fagus grandifolia Ehrh.), sugar maple (Acer saccharum Marshall), and white pine (Pinus strobus L.), with substantial variation in composition and site quality across the broader landscape [6,31].
With advancing mortality of early successional aspen and birch occurring region-wide [27], our study centers on a large-scale manipulation of moderate severity disturbance designed to evaluate changes in forest physical and biological structure, and growth and C cycling dynamics following the mortality of early successional tree species. The Forest Accelerated Successional ExperimenT (FASET), in which all mature aspen and birch trees were stem girdled and retained onsite without felling in 2008, was implemented in a 33-ha landscape and was the emphasis of several prior studies at this site [19,28,29,30,31]. In this study we focus on three, previously undescribed 2-ha stands varying in pre-disturbance site productivity and community composition in which the FASET treatment was replicated, resulting in total basal area reductions from aspen and birch mortality of 36% to 68% (Table 1). This degree of moderate severity disturbance is within the range observed in the larger landscape-scale FASET manipulation [30] and is similar to severities observed in insect pests or windthrow disturbances [7,10,32]. The 2-ha stands are hereafter referred to as HIGH, MED, or LOW, referencing their variability in pre-disturbance wood NPP while acknowledging numerous interdependent and co-varying factors such as microclimate, soils, and plant species identities together define site quality and are not readily disentangled (Table 1). Though aspen and birch mortality in MED (68.4%) and HIGH (64.6%) stands is considerably higher than that in the LOW (36.1%) stand, this difference is representative of the tree community variability present on the landscape and, in the context of senescent early successional species, is inherently linked to disturbance severity. Measurements were conducted through re-inventorying one to three permanent 0.08-ha sampling plots per stand depending on the year and measurement, following a sampling protocol applied across our site that yields, even at the lowest plot sampling density, aboveground NPP measurements with precision ±10% of the mean [6,29,33,34].

Table 1.
Pre-disturbance aboveground wood net primary production (Wood NPP; 1997/1998–2001), wood mass (2001/2006), aspen and birch wood mass (% of total), basal area (BA; 2001/2006), aspen and birch BA (% of total), leaf area index (LAI; 2007), aspen and birch LAI (% of total) for each stand, sapling stem density of trees with a diameter at breast height (DBH) between 4–7.9 cm, and the five most dominant species (based on % basal area; 2001/206). Years cited in parentheses above reference the inventory year from which data were supplied. Mean ± SE.
Core long-term measurements in the 2-ha treatment stands included wood NPP and leaf area index (LAI), which began in 1997 and were repeated periodically through multiple periods of disturbance and recovery. We defined disturbance and recovery “ecological periods” as: (1) pre-disturbance, the period prior to the 2008 experimental disturbance; (2) disturbance, the period during which statistically significant declines in LAI and wood NPP were observed, relative to pre-disturbance; (3) disturbance recovery (2011–2015), the period in which LAI and wood NPP were recovering to pre-disturbance levels; and (4) post-recovery (2016), when all stands were no longer statistically significant from, or when stands significantly exceeded, pre-disturbance LAI and wood NPP values (Figure 1). Because our study includes long-term data collected up to a decade prior to the disturbance experiment and extending over nearly two decades, the number and frequency of measurements vary considerably across time. For statistical analysis and the derivation of means and standard errors, we considered plots within a stand separate experimental unit. While acknowledging the lack of treatment replication, our dataset provides a rare long-term ecosystem-level perspective of forest structure and C cycling dynamics. Our use of plots as experimental units is aligned with other long-term ecosystem manipulations and observational studies (e.g., C flux towers), for which treatment or site replication is not practical because of the scale of the experiment [33,35].
2.2. Litter Trap Leaf Area Index
Leaf area index (LAI) was quantified beginning in 1997 from litter traps, serving as a primary measure of forest canopy structural change during disturbance and recovery. Litter trap distribution and sample size varied over the 20-year collection period, with leaf litter being collected annually from one to three litter traps (0.264 m2) placed in one to three plots per stand. From 1997–2001 and again in 2014–2015, litter was collected in one plot per stand, with each plot containing one to three litter traps per plot, respectively. A felled tree in 2015 reduced the litter trap sample size by one in the HIGH stand. From 2006–2013 and in 2016, litter was collected in all nine sampling plots, with two or three litter traps per plot. Litter was not collected from 2002 through 2005. With the exception of 2016, dried litter was pooled by stand prior to weighing (hence within-stand variation could not be calculated). Litter, collected weekly in autumn and monthly otherwise, was dried at 60 °C, separated by species, and weighed. Leaf area index is calculated as the product of litter fall dry mass and site-specific leaf area values [29]. Though litter trap estimation of LAI has known limitations, the typical (n = 3 traps per stand) sample and litter trap sizes that we employed generate relatively high confidence estimates of leaf area (SE ± 10% mean) relative to optical methods [30].
2.3. Wood Net Primary Production, Wood Mass, and Stem Density
We used repeated inventories to quantify stand stem densities, wood mass stocks, and annual canopy and subcanopy aboveground wood net primary production (wood NPP), the annual accumulation of aboveground woody growth, for nearly two decades. Trees were tallied by species and their diameter at breast height (DBH) was recorded for all canopy trees (≥8 cm DBH) in 1997 (LOW and HIGH, n = 1 plot per stand); 1998 (MED, n = 1 plot); 2001 (All, n = 1 plot per stand); 2006 (All, n = 2 plots per stand); 2010 (All, n = 3 plots per stand); 2015 (All, n = 3 plots per stand); and 2016 (All, n = 3 plots per stand). We tallied subcanopy stems (<8 cm DBH) by species and diameter class (<2 cm, 2–3.9 cm, 4–5.9 cm, or 6–7.9 cm) in 1998 (All, n = 1 plot per stand); 2001 (All, n = 1 plots per stand); 2006 (All, n = 2 plots per stand); 2010 (All, n = 1 plot per stand); and 2016 (All, n = 3 plots per stand). We surveyed all subcanopy stems in each plot in 1998, 2001, 2006, and 2010, but, because of time restrictions, only in five non-overlapping 5-m radius small subplots nested within each larger plot (49% of the whole plot area) in 2016. An increment hammer was used to collect outer xylem cores for a subset (≥20%) of surveyed subcanopy trees in the 4–5.9 and 6–7.9 cm DBH classes in each plot during the summer of 2016. The annual stem increment of subcanopy trees was measured to 0.001 mm using a Velmex stage micrometer (Bloomfield, New York, NY, USA), and a mean increment growth time-series was constructed for each plot and DBH class. We estimated the number of trees in each DBH class in a given year by interpolating plot-level changes in tree stem density between inventory years, applying a diameter class midpoint for subcanopy wood mass estimation. Plot canopy and subcanopy wood NPP were derived from the mean annual increment of aboveground live wood between inventory years, using site and species-specific (canopy) or softwood/hardwood-specific (subcanopy) allometric equations relating DBH to wood mass [34]. Absolute wood mass was converted to carbon mass using a site-specific conversion factor of 0.48 g of C g−1 of dry wood mass [29].
2.4. Post-Recovery Canopy Structure
We derived ecosystem physical and biological structural parameters to evaluate how post-recovery (2016) structure, characterized as having fully recovered but re-arranged leaf area, relates to canopy light capture and, in turn, wood NPP. Physical and biological structural stand features at our site [19,26,33] and others [21,22,23] are sensitive to disturbance and strongly correlated with the extent and rate of primary production recovery, making them candidates for generalized, integrative predictors of forest growth following disturbance. Physical structural measures describe variation in the arrangement of canopy vegetation, while stand biological measures may characterize the diversity of plant species. Though in some cases inter-related [27], physical and biological structural attributes may correlate with primary production for mechanistically different reasons, with the former posited to correspond more closely with resource acquisition, including light interception, and the latter with how resources such as light interact with canopy physiological traits driving canopy carbon fixation. For the present analysis, we selected one physical and one biological structural measure correlated with primary production at our site but which have not been assessed concurrently: canopy rugosity and Shannon’s Diversity Index (H’).
As a measure of physical structure, we report canopy rugosity, the variance in the horizontal and vertical vegetation density [26,36,37,38]. We characterized canopy physical structural complexity using a ground-based Portable Canopy LiDAR (light detection and ranging) (PCL), which maps the spatial arrangement of vegetation from 1 m above the forest floor to the top of the canopy [19,25,26]. The application and prior use of the PCL at our site is detailed in Hardiman et al., 2011 [26]. Briefly, we collected LiDAR data along a 40 m transect passing through the center of each plot to create a 2D canopy hit-map detailing the location of vegetation through a vertical slice of canopy space. Raw LiDAR data were processed using published MATLAB (MathWorks Inc., Natick, MD) code [26].
For stand biological structure, we calculated tree diversity using basal area and species count data from our 2016 inventory and compared these post-disturbance values with those derived from 2001 or 2006 inventory data, collected before the disturbance. We expressed biological structure as Shannon’s Diversity Index (H’) for the subcanopy (<8 cm DBH), canopy (≥8 cm DBH), and combined (canopy and subcanopy). We chose H’ because this measure of diversity was correlated with NPP at our site [31], and is a common index of diversity [39,40], and does not favor dominant or rare species like Simpson’s Diversity Index [41,42].
2.5. Post-Recovery Canopy Light Interception
We quantified the amount of canopy light intercepted in each plot as the fraction of absorbed photosynthetically active radiation (fPAR), evaluating how post-recovery ecosystem structure relates to canopy light absorption and, in turn, primary production. Sixty PAR measurements at 1 m height were collected 1 m apart along each cardinal axis radiating from the center of each plot using an AccuPAR ceptometer (Decagon Devices Inc., Pullman, Washington, DC, USA). Measurements were taken within two hours of solar noon on cloudless days during the summer of 2016. Above canopy PAR was measured continuously using a BF5 sunshine sensor (Delta-T Devices, Cambridge, UK) within 1 km of understory measurements [30]. fPAR was calculated by subtracting the ratio of concurrent below- and above-canopy PAR from one.
2.6. Statistical Analyses
We used time-series analysis of variance (ANOVA) to test for mean differences in LAI, wood NPP, stem density, wood mass, and Shannon’s diversity index (H’) among years, before and after disturbance, and disturbance and recovery periods, and stands, and simple linear regression analysis to evaluate relationships between post-recovery structure, primary production, and light capture (Table A1, Table A2 and Table A3). Full factorial two-way ANOVAs were used to identify changes over time with disturbance and during recovery periods, and among stands in LAI and wood NPP, with plot-scale disturbance (as percent basal area loss) included as a covariate to account for the effects disturbance severity has on LAI and wood NPP [8,30]. Because of irregular LAI and wood NPP sample sizes and frequencies, we binned data into ecological periods for analysis; the exception was LAI during the peak disturbance period, during which data were collected in each of the nine plots. Full factorial three-way ANOVAs were conducted to test for the main effects and interactions of (pre- and post-) disturbance and recovery period, stand, and DBH class on stem density and wood mass distribution. Full factorial two-way ANOVAs were performed to test for the effect of stand and disturbance on H’ for the subcanopy (<8 cm DBH), canopy (≥8 cm DBH), and combined strata. Because time (i.e., year of data collection), disturbance (i.e., before or after), and ecological recovery period are auto-correlated parameters, their unique effects cannot be separated via statistical modeling and quantitative attribution of mean differences over time cannot be determined. All ANOVAs used Least Significant Difference (LSD) Post-Hoc analysis to compare individual means, with plots considered separate experimental units. Assumptions of normality and equal variances for all tests were checked. Wood mass, stem density, and litter trap LAI values were log transformed prior to analysis due to non-normality and heteroscedasticity. For LAI, standard errors express variation among years when data from multiple plots were not available. ANOVAs were performed using JMP pro (V. 12.2) (SAS Institute Inc., Cary, NC, USA), and regression analyses were performed using SigmaPlot (V. 13) software (Systat Software Inc., San Jose, CA, USA). Relationships were considered marginally significant when p ≤ 0.1 and highly significant when p ≤ 0.05.
3. Results
3.1. Long-Term Leaf Area Index and Wood Net Primary Production Response to Disturbance
The three stands, differing in site quality and community composition, exhibited similar relative patterns of decline and recovery in LAI and wood NPP following moderate severity disturbance. Though mean LAI and wood NPP differed among stands (LAI: p = 0.04; wood NPP: p = 0.0004), and disturbance and recovery periods (LAI: p = 0.0009; wood NPP: p = 0.0001), stands followed parallel patterns of primary production over time (p = 0.5; Figure 1; Table A1). From pre- to peak-disturbance, wood NPP declined similarly in all stands (HIGH: −49%, p = 0.05; MED: −59%, p = 0.09; LOW: −47%, p = 0.1). In contrast, we observed a significant interaction between stand, and disturbance and recovery periods for LAI (p = 0.08), with HIGH (−37%, p = 0.02) and LOW (−31%, p = 0.002), but not MED, declining significantly by 2010 from pre-disturbance values. All three stands recovered to pre-disturbance LAI and wood NPP levels by the end of the disturbance recovery period (p ≥ 0.4), with the exception of LAI in the LOW stand (p = 0.002), which did not recover until the 2016 post-recovery period. Notably, in the 2016 post-recovery period, wood NPP and LAI significantly increased in the HIGH stand (+31%, p = 0.08; +20%, p = 0.09, respectively) compared to pre-disturbance levels.
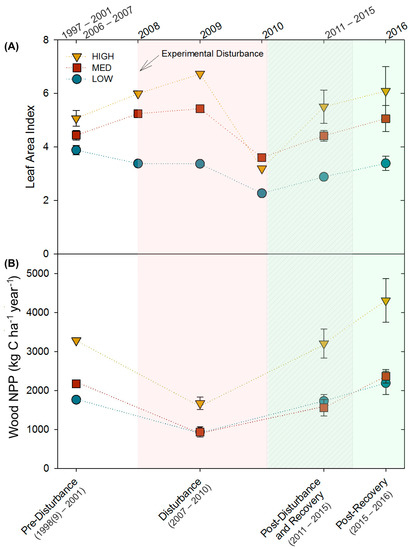
Figure 1.
(A) Leaf area indices (LAI) and (B) wood net primary productivity (wood NPP) for the three 2-ha treatment stands over time. Shaded areas correspond with ecological time periods along the bottom X-axis. When multiple observations were available, values shown represent mean ± SE.
3.2. Stand Structure Before and After Disturbance
Moderate severity disturbance similarly shifted stem densities and wood mass distributions among DBH classes in the three stands, increasing total stem density through the proliferation of small stems and reducing the wood mass of large stems. The absence of a significant interaction between disturbance and stand for stem density and wood mass indicates similar relative responses to disturbance, regardless of differences among sites in canopy composition, site quality, and/or productivity (Figure 2; Table A2). Across stands, disturbance significantly increased mean total stem density (p = 0.0003) by increasing subcanopy stem density by 31% stems ha−1 and decreasing mean total wood mass (p < 0.0001) by 43% (p = 0.02). In 2016, both stem density (p ≤ 0.02) and wood mass (p ≤ 0.002) significantly increased in the smaller 2–3.9 cm, 4–5.9 cm, and 6–7.9 cm DBH stem classes, causing subcanopy wood mass to more than double from 1.3 to 2.7 Mg C ha−1. Although disturbance reduced the wood mass of large trees, mean stem density of canopy (>8 cm DBH) trees was not significantly different in the post-recovery phase, suggesting rapid post-disturbance in-growth of stems into the largest (>8 cm) diameter class.
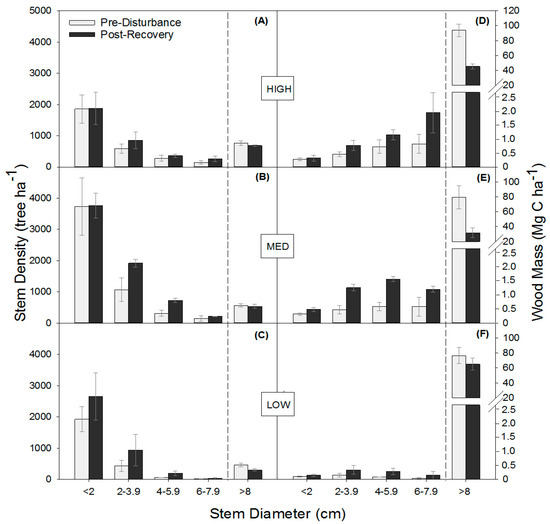
Figure 2.
Tree stem density (trees per hectare) (A–C) and wood mass (D–F) (mean ± SE) distributions across stem diameter classes before (2001 or 2006) and following the recovery (2016) of experimental disturbance.
Though stem densities and wood mass shifted similarly among stands, we found lower productivity stands were more vulnerable to shifts in biological structure expressed as reduced tree diversity following disturbance. All stands had statistically comparable combined (upper canopy and subcanopy) and upper canopy H’ prior to the disturbance, but in the post-recovery period, the LOW stand had significantly lower upper canopy and combined H’ relative to MED and HIGH stands (p ≤ 0.08; Figure 3; Table A3). The unmanipulated subcanopy exhibited no change in diversity in any of the treatments but was significantly lower before and after disturbance in the LOW stands (Figure 3C). Consequently, significant losses in tree diversity in the LOW stand were driven by declines in upper canopy diversity only, while MED and HIGH stands maintained a stable H’ in both canopy strata.
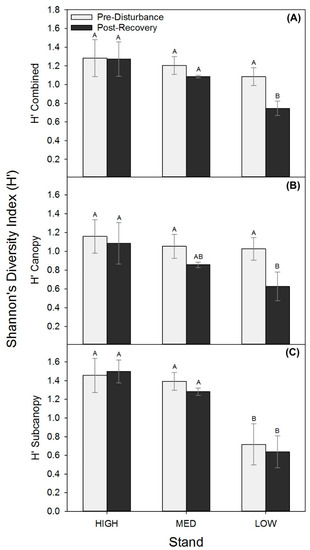
Figure 3.
Shannon’s diversity index (H’; mean ± SE), combined (A) and for canopy (B) and subcanopy (C) strata before (2001 or 2006) and following recovery (2016) for each treatment stand.
3.3. Post-Recovery Structure, Wood NPP, and Light Interception Interactions
Following the recovery of wood NPP and LAI (when pre- and post- disturbance values no longer significantly differed), we examined whether reorganized physical and biological structure exerted effects on canopy light interception and, as a result, primary production. We found leaf area and biological structure expressed as tree diversity, but not physical structure as canopy rugosity, were positively correlated with post-recovery primary production through their effects on fPAR. Leaf area index and combined (upper canopy and subcanopy) H’ were positively correlated with post-recovery wood NPP and fPAR, while canopy rugosity was not correlated with primary production or fPAR (Figure 4).
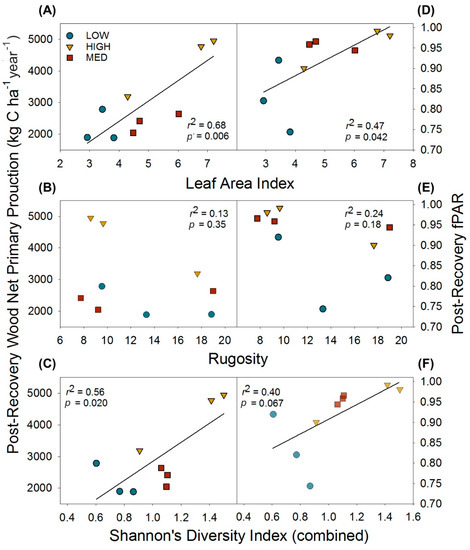
Figure 4.
Post-recovery (2016) relationships of physical and biological structural metrics and their effects on wood net primary production and the fraction of absorbed photosynthetically active radiation (fPAR). Relationships shown are for leaf area index (A,D); and canopy rugosity (B,E); and tree diversity as Shannon’s Diversity Index (C,F). Data points are for individual plots.
To evaluate whether the amount of canopy light intercepted, as fPAR, serves as a mechanistic linkage between post-recovery structure and primary production, we examined the relationship between wood NPP and fPAR. We found wood NPP increased linearly with fPAR (r2 = 0.38, p = 0.077; Figure 5), suggesting higher leaf area and Shannon’s Diversity indexes confer greater wood NPP through their positive effects on canopy light absorption.
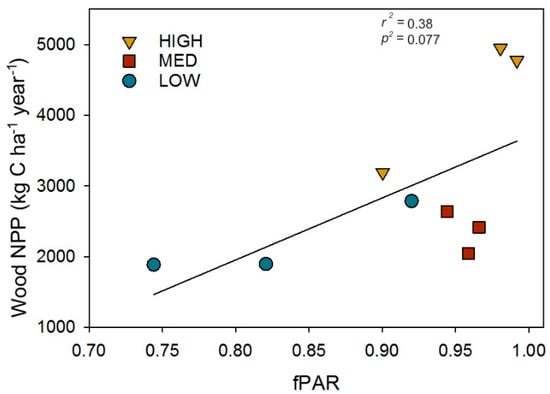
Figure 5.
The post-recovery (2016) relationship between the fraction of photosynthetically absorbed radiation (fPAR) and wood net primary production (Wood NPP). Data points are for individual plots.
4. Discussion
We have shown that three forest stands varying in pre-disturbance site quality and community composition exhibited similar patterns of wood NPP decline and recovery following moderate severity disturbance. Similar to other moderately disturbed forest stands [7,10,32], we observed an initial decline in production of 47% to 59%, with all stands recovering to pre-disturbance primary production values in less than a decade. The pattern we observed at the smaller 2-ha stand-scale, however, is notably different from larger landscape-scale observations at our site which showed high resistance to moderate disturbance, marked by no change in wood NPP following the girdling treatment [29]. Following the recovery of primary production and LAI in all stands, canopy light interception and net primary production were well-predicted by LAI and tree diversity, two forest structural features which are shaped by local site conditions and may be reshaped by disturbance. These findings show that the relative response of primary production to moderate severity disturbance over time can be similar among stands varying in productivity and composition, and that recovery of leaf area and tree diversity may influence primary production following disturbance recovery.
We attribute similarly paced patterns of primary production resilience across stands to rapid compensatory growth of surviving trees despite large differences in site quality, community composition, and tree mortality across stands. Our finding that resilience in primary production was partially supported by rapid growth of remaining dominant canopy trees is supported by many prior studies, including numerous forest thinning studies documenting the release of live trees following partial harvest [7,16,43,44,45,46]. Disturbance also stimulated the release of subcanopy trees, leading to three times more subcanopy contribution to total wood NPP following disturbance, which is consistent with prior studies of moderate severity disturbance at our site [30,31] and elsewhere [44,46,47]. More specific to our ecosystem and disturbance regime, our observation of rapid compensatory growth from later successional species as early successional species senesced from the dominant canopy position is consistent with long-standing theory and observations from other north temperate forests [48,49,50]. In contrast to syntheses showing variable primary production recovery patterns among geographically and ecologically disparate sites [7,10], our stands, distributed across a common forest landscape, exhibited parallel decline and recovery patterns following moderate severity disturbance, suggesting factors other than local site fertility and community composition determine the timing of resilience. Though beyond the scope and design of our study, differences affecting the timing of resilience may include disturbance severity and source, community composition, and climate [5,10,11,21].
Biological structure expressed as tree diversity was maintained in the MED and HIGH, but not in the LOW stand following disturbance, suggesting that this low fertility site with a poorly developed subcanopy was more vulnerable to tree diversity losses. Tree diversity loss in the LOW stand was associated with an underdeveloped and less diverse subcanopy and greater loss of upper canopy diversity compared to MED and HIGH stands. Although all stands had similar combined (upper canopy and subcanopy) tree diversity values (Figure 3A) prior to the disturbance, the LOW stand had lower subcanopy diversity (Figure 3C) than the MED or HIGH stands and significantly fewer subcanopy stems in the 4–7.9 cm DBH class (Table 1). The positive correlation between diversity and production found here, and by others [51,52], suggests that the loss of tree diversity may explain some of the stunted post-recovery production response in the LOW stand. Our findings are consistent with ecological theory and observations that material legacies, including diversity and advanced regeneration of the subcanopy, shape resilience patterns [53].
Our results show that tree species diversity and leaf area, but not physical structure as canopy rugosity, are related to wood primary production after recovery. Plot LAI, a well-known driver of NPP, exhibited the strongest positive relationship with primary production [17,54]. Tree species diversity is also broadly linked to primary production following disturbance [55,56], with diverse forest canopies at our site [33] and elsewhere [57,58] exhibiting higher rates of primary production. Though our study was not designed to reveal the mechanisms underlying a positive relationship between tree diversity and production, resource complementarity, in which functionally distinct species utilize resources uniquely in space and time, is hypothesized and supported by empirical evidence [50,59,60,61,62]. A more functionally diverse complement of species, each operating optimally in different microclimates, may support higher canopy functioning (e.g., photosynthesis) under a broader array of conditions by more thoroughly and efficiently using growth-limiting resources to power production [21,59,63]. However, contrary to undisturbed stands in our forested landscape [19,26], canopy physical structure, expressed as rugosity, was not correlated with wood NPP following disturbance recovery. Though the cause of this discrepancy is not known, disturbances that rearrange vegetation may temporarily decouple NPP from canopy physical structure as canopy elements slowly reorganize to exploit redistributed and newly available resources such as light [37,63].
Following recovery, we observed significantly greater primary production in the HIGH stand, providing initial support for the hypothesis that moderate disturbance may enhance long-term primary production under some conditions. Moderate severity or intermediate disturbances are hypothesized [64,65] and, in some cases, counterintuitively observed to increase biological diversity and physical structural complexity [66,67], which in turn may augment primary production [27,34,45,68]. However, we found no evidence that disturbance-related increases in physical or biological complexity drove primary production upward, as physical structure exhibited no relationship with NPP and tree diversity remained stable in the HIGH stand. Even so, our measures of physical and biological structure—as canopy rugosity and Shannon’s Index—include only a subset of measures describing forest stand structure [24,25,26,39,41] and may not represent functionally meaningful changes in stand structure prompted by disturbance.
Though our study offers insight into the primary production trajectories of forest stands through disturbance, several study limitations are noted. First, across stands and over time, several variables that could shape and explain differences in primary production are intertwined and co-vary, limiting the present study’s ability to ascribe observed differences solely to specific biotic and abiotic parameters. For example, climate-driven interannual variability in primary production of roughly 100% at our site [34] is similar in magnitude to apparent disturbance-related variation in the present study. Moreover, disturbance severity (i.e., as tree mortality), site quality, community composition, and microclimatic variation across stands are autocorrelated and not independent of the stand structural parameters we examined, and therefore their effects on primary production are impossible to disentangle. An additional limitation of our ecosystem scale experiment is that true replication of disturbance in stands possessing similar biotic and abiotic site characteristics was not practical, limiting the inference of our results to the local landscape. Similarly, inconsistent sampling intensities and distributions over our 20-year sampling period resulted in an unbalanced statistical design and, for some years, a limited sample size and stand means with varying precision. The cumulative limitations above underscore a need to advance mechanistic knowledge of the variable effects of disturbance on long-term forest C cycling trajectories [3,4,5,36,56,67].
5. Conclusions
We conclude that pre-disturbance stand conditions, including site quality and community composition, minimally altered generalized patterns of forest primary production decline and recovery following moderate disturbance, though stand-specific shifts in tree diversity suggest potential changes in long-term trajectories among stands. We found leaf area and tree species diversity were significant predictors of wood primary production after disturbance through their effects on canopy light interception. Questions remain regarding why canopy physical structure, a primary driver of production in nearby undisturbed sites, was not correlated with primary production in our moderately disturbed sites. Our findings have wide-ranging implications for forest carbon and timber management, indicating that compositionally different stands nested within local landscapes can be similarly resilient and, therefore, may not require separate mitigation strategies to sustain or restore forest growth after disturbance. A better understanding of how disturbances affect diverse forest assemblages is critical moving forward as land managers and ecologists aim to improve forecasts of forest disturbance impacts on ecosystem functioning in a world with increasing disturbance frequency and extent.
Acknowledgments
We appreciate the comments of three anonymous reviewers, which greatly improved the manuscript. Funding for this AmeriFlux core site was provided by the U.S. Department of Energy’s Office of Science. The implementation of the experiment was supported by the Climate and Environmental Sciences Division, Office of Science, U.S. Department of Energy (DOE) (Award No. DE-SC0006708).
Author Contributions
B.T.S., C.M.G., and P.S.C. conceived and designed the experiments; B.T.S., C.S.V., and R.T.F. performed the experiments; B.T.S., C.M.G., R.T.F., and A.T.F analyzed the data; B.T.S. and C.M.G. led authorship of the paper, with co-authorship from P.S.C., R.T.F., A.T.F., and C.S.V.
Conflicts of Interest
The authors declare no conflict of interest. The funding sponsors had no role in the design of the study; in the collection, analyses, or interpretation of data; in the writing of the manuscript, and in the decision to publish the results.
Appendix A
Table A1.
Full factorial two-way analysis of variance (ANOVA) results testing for the effects stand, ecological period (seen in Figure 2), and the stand × ecological period had on both LAI (dimensionless) and net primary production (NPP) (Mg C ha−1 year-1). Significant differences are in bold.
Table A1.
Full factorial two-way analysis of variance (ANOVA) results testing for the effects stand, ecological period (seen in Figure 2), and the stand × ecological period had on both LAI (dimensionless) and net primary production (NPP) (Mg C ha−1 year-1). Significant differences are in bold.
| Term | Degrees of Freedom (DF) | Litter Trap LAI | NPP | ||||
|---|---|---|---|---|---|---|---|
| Sums of Squares | F-Value | p-Value | Sums of Squares | F-Value | p-Value | ||
| Stand | 2 | 0.17 | 3.40 | 0.0449 | 7646786 | 14.63 | 0.0004 |
| Time/Ecological Period | 3 | 0.51 | 6.86 | 0.0009 | 11348383 | 14.47 | 0.0001 |
| Stand × Time/Ecological Period | 6 | 0.31 | 2.07 | 0.0820 | 1369897 | 0.87 | 0.5381 |
| Disturbance Severity (covariate) | 1 | 0.02 | 0.79 | 0.3817 | 291892 | 1.12 | 0.3085 |
Table A2.
Full factorial three-way ANOVA results for stem density (stems ha−1) and wood mass (Mg C ha−1). We tested for the effect of time (before and after disturbance), different stands, DBH classes, and all interaction terms. Analyses were performed on log-transformed values. Significant differences are in bold.
| Stem Density (Stems ha−1) | Wood Mass (Mg C ha−1) | ||||||
|---|---|---|---|---|---|---|---|
| Term | DF | Sums of Squares | F-Value | p-Value | Sums of Squares | F-Value | p-Value |
| Time | 1 | 4.78 | 15.21 | 0.0003 | 6.02 | 20.72 | <0.0001 |
| Stand | 2 | 11.93 | 18.98 | <0.0001 | 21.62 | 37.23 | <0.0001 |
| DBH Class | 4 | 90.67 | 72.11 | <0.0001 | 377.91 | 325.35 | <0.0001 |
| Time × Stand | 2 | 0.54 | 0.87 | 0.4265 | 0.82 | 01.40 | 0.2539 |
| Time × DBH Class | 4 | 4.24 | 3.37 | 0.0153 | 8.91 | 7.67 | <0.0001 |
| Stand × DBH Class | 8 | 6.19 | 2.46 | 0.0230 | 11.37 | 4.90 | 0.0001 |
| Time × Stand × DBH Class | 8 | 0.81 | 0.32 | 0.9540 | 0.78 | 0.33 | 0.9490 |
Table A3.
Full factorial two-way ANOVA testing for differences between stands, and the effect that time (before and after disturbance) or time × stand had on Shannon’s Diversity Index (H’) for the subcanopy, canopy, and combined (subcanopy and canopy) strata. Significant differences are in bold.
Table A3.
Full factorial two-way ANOVA testing for differences between stands, and the effect that time (before and after disturbance) or time × stand had on Shannon’s Diversity Index (H’) for the subcanopy, canopy, and combined (subcanopy and canopy) strata. Significant differences are in bold.
| Term | DF | H’ Combined | H’ Canopy | H’ Subcanopy | ||||||
|---|---|---|---|---|---|---|---|---|---|---|
| Sums of Squares | F-Value | p-Value | Sums of Squares | F-Value | p-Value | Sums of Squares | F-Value | p-Value | ||
| Time | 1 | 0.11 | 2.26 | 0.1588 | 0.22 | 3.31 | 0.0939 | 0.01 | 0.16 | 0.6961 |
| Stand | 2 | 0.42 | 4.18 | 0.0419 | 0.26 | 1.94 | 0.1865 | 2.18 | 16.02 | 0.0004 |
| Time × Stand | 2 | 0.08 | 0.87 | 0.4446 | 0.08 | 0.60 | 0.5668 | 0.02 | 0.14 | 0.8699 |
References
- Pan, Y.; Birdsey, R.A.; Fang, J.; Houghton, R.; Kauppi, P.E.; Kurz, W.A.; Phillips, O.L.; Shvidenko, A.; Lewis, S.L.; Canadell, J.G.; et al. A large and persistent carbon sink in the World’s forests. Science 2011, 333, 988–993. [Google Scholar] [CrossRef] [PubMed]
- Goodale, C.L.; Apps, M.J.; Birdsey, R.A.; Field, C.B.; Heath, L.S.; Houghton, R.A.; Jenkins, J.C.; Kohlmaier, G.H.; Kurz, W.A.; Liu, S.; et al. Forest carbon sinks in the Northern Hemisphere. Ecol. Appl. 2002. [Google Scholar] [CrossRef]
- Pregitzer, K.S.; Euskirchen, E.S. Carbon cycling and storage in world forests: Biome patterns related to forest age. Glob. Chang. Biol. 2004, 10, 2052–2077. [Google Scholar] [CrossRef]
- McKinley, D.C.; Ryan, M.G.; Birdsey, R.A.; Giardina, C.P.; Harmon, M.E.; Heath, L.S.; Houghton, R.A.; Jackson, R.B.; Morrison, J.F.; Murray, B.C.; et al. A synthesis of current knowledge on forests and carbon storage in the United States. Ecol. Appl. 2011, 21, 1902–1924. [Google Scholar] [CrossRef] [PubMed]
- Williams, C.A.; Collatz, G.J.; Masek, J.; Goward, S.N. Carbon consequences of forest disturbance and recovery across the conterminous United States. Glob. Biogeochem. Cycles 2012, 26, GB1005. [Google Scholar] [CrossRef]
- Gough, C.M.; Vogel, C.S.; Harrold, K.H.; George, K.; Curtis, P.S. The legacy of harvest and fire on ecosystem carbon storage in a north temperate forest. Glob. Chang. Biol. 2007, 13, 1935–1949. [Google Scholar] [CrossRef]
- Hicke, J.A.; Allen, C.D.; Desai, A.R.; Dietze, M.C.; Hall, R.J.; (Ted) Hogg, E.H.; Kashian, D.M.; Moore, D.; Raffa, K.F.; Sturrock, R.N.; et al. Effects of biotic disturbances on forest carbon cycling in the United States and Canada. Glob. Chang. Biol. 2012, 18, 7–34. [Google Scholar] [CrossRef]
- Flower, C.E.; Gonzalez-Meler, M.A. Responses of temperate forest productivity to insect and pathogen disturbances. Annu. Rev. Plant Biol. 2015, 66, 547–569. [Google Scholar] [CrossRef] [PubMed]
- Kashian, D.M.; Romme, W.H.; Tinker, D.B.; Turner, M.G.; Ryan, M.G. Carbon storage on landscapes with stand-replacing fires. Biol. Sci. 2006, 56, 598–606. [Google Scholar] [CrossRef]
- Amiro, B.D.; Barr, A.G.; Barr, J.G.; Black, T.A.; Bracho, R.; Brown, M.; Chen, J.; Clark, K.L.; Davis, K.J.; Desai, A.R.; et al. Ecosystem carbon dioxide fluxes after disturbance in forests of North America. J. Geophys. Res. 2010, 115, G00K02. [Google Scholar] [CrossRef]
- Dale, V.H.; Joyce, L.A.; McNulty, S.; Neilson, R.P.; Ayres, M.P.; Flannigan, M.D.; Hanson, P.J.; Irland, L.C.; Lugo, A.E.; Peterson, C.J.; et al. Climate change and forest disturbances: Climate change can affect forests by altering the frequency, intensity, duration, and timing of fire, drought, introduced species, insect and pathogen outbreaks, hurricanes, windstorms, ice storms, or landslides. Bio. Science 2001, 51, 723–734. [Google Scholar] [CrossRef]
- Cohen, W.B.; Yang, Z.; Stehman, S.V.; Schroeder, T.A.; Bell, D.M.; Masek, J.G.; Huang, C.; Meigs, G.W. Forest disturbance across the conterminous United States from 1985–2012: The emerging dominance of forest decline. For. Ecol. Manag. 2016, 360, 242–252. [Google Scholar] [CrossRef]
- Goetz, S.J.; Bond-Lamberty, B.; Law, B.E.; Hicke, J.A.; Huang, C.; Houghton, R.A.; McNulty, S.; O’Halloran, T.; Harmon, M.; Meddens, A.J.H.; et al. Observations and assessment of forest carbon dynamics following disturbance in North America. J. Geophys. Res. 2012, 117, G02022. [Google Scholar] [CrossRef]
- Bond-Lamberty, B.; Fisk, J.P.; Holm, J.A.; Bailey, V.; Bohrer, G.; Gough, C.M. Moderate forest disturbance as a stringent test for gap and big-leaf models. Biogeosciences 2015, 12, 513–526. [Google Scholar] [CrossRef]
- Xiao, J.; Liu, S.; Stoy, P.C. Preface: Impacts of extreme climate events and disturbances on carbon dynamics. Biogeosciences 2016, 13, 3665–3675. [Google Scholar] [CrossRef]
- Skovsgaard, J.P. Analysing effects of thinning on stand volume growth in relation to site conditions: A case study for even-aged Sitka spruce (Picea sitchensis (Bong.) Carr.). Forestry 2009, 82, 87–104. [Google Scholar] [CrossRef]
- Reich, P.B. Key canopy traits drive forest productivity. Proc. R. Soc. Lond. B Biol. Sci. 2012, 279, 2128–2134. [Google Scholar] [CrossRef] [PubMed]
- Peters, E.B.; Wythers, K.R.; Bradford, J.B.; Reich, P.B. Influence of disturbance on temperate forest productivity. Ecosystems 2013, 16, 95–110. [Google Scholar] [CrossRef]
- Hardiman, B.S.; Bohrer, G.; Gough, C.M.; Curtis, P.S. Canopy structural changes following widespread mortality of canopy dominant trees. Forests 2013, 4, 537–552. [Google Scholar] [CrossRef]
- Reinikainen, M.; D’Amato, A.W.; Bradford, J.B.; Fraver, S. Influence of stocking, site quality, stand age, low-severity canopy disturbance, and forest composition on sub-boreal aspen mixedwood carbon stocks. Can. J. For. Res. 2013, 44, 230–242. [Google Scholar] [CrossRef]
- Pedro, M.S.; Rammer, W.; Seidl, R. Tree species diversity mitigates disturbance impacts on the forest carbon cycle. Oecologia 2015, 177, 619–630. [Google Scholar] [CrossRef] [PubMed]
- Metz, J.; Annighöfer, P.; Schall, P.; Zimmermann, J.; Kahl, T.; Schulze, E.-D.; Ammer, C. Site-adapted admixed tree species reduce drought susceptibility of mature European beech. Glob. Chang. Biol. 2016, 22, 903–920. [Google Scholar] [CrossRef] [PubMed]
- Dănescu, A.; Albrecht, A.T.; Bauhus, J. Structural diversity promotes productivity of mixed, uneven-aged forests in southwestern Germany. Oecologia 2016, 182, 319–333. [Google Scholar] [CrossRef] [PubMed]
- Ishii, H.; Tanabe, S.; Hiura, T. Exploring the relationships among canopy structure, stand productivity, and biodiversity of temperate forest ecosystems. For. Sci. 2004, 50, 342–355. [Google Scholar]
- Parker, G.G.; Harding, D.J.; Berger, M.L. A portable LIDAR system for rapid determination of forest canopy structure. J. Appl. Ecol. 2004, 41, 755–767. [Google Scholar] [CrossRef]
- Hardiman, B.S.; Bohrer, G.; Gough, C.M.; Vogel, C.S.; Curtis, P.S. The role of canopy structural complexity in wood net primary production of a maturing northern deciduous forest. Ecology 2011, 92, 1818–1827. [Google Scholar] [CrossRef] [PubMed]
- Gough, C.M.; Curtis, P.S.; Hardiman, B.S.; Scheuermann, C.M.; Bond-Lamberty, B. Disturbance, complexity, and succession of net ecosystem production in North America’s temperate deciduous forests. Ecosphere 2016, 7. [Google Scholar] [CrossRef]
- Nave, L.E.; Gough, C.M.; Maurer, K.D.; Bohrer, G.; Hardiman, B.S.; Le Moine, J.; Munoz, A.B.; Nadelhoffer, K.J.; Sparks, J.P.; Strahm, B.D.; et al. Disturbance and the resilience of coupled carbon and nitrogen cycling in a north temperate forest. J. Geophys. Res. 2011, 116, G04016. [Google Scholar] [CrossRef]
- Gough, C.M.; Hardiman, B.S.; Nave, L.E.; Bohrer, G.; Maurer, K.D.; Vogel, C.S.; Nadelhoffer, K.J.; Curtis, P.S. Sustained carbon uptake and storage following moderate disturbance in a Great Lakes forest. Ecol. Appl. 2013, 23, 1202–1215. [Google Scholar] [CrossRef] [PubMed]
- Stuart-Haëntjens, E.J.; Curtis, P.S.; Fahey, R.T.; Vogel, C.S.; Gough, C.M. Net primary production of a temperate deciduous forest exhibits a threshold response to increasing disturbance severity. Ecology 2015, 96, 2478–2487. [Google Scholar] [CrossRef] [PubMed]
- Fahey, R.; Stuart-Haëntjens, E.; Gough, C.; De La Cruz, A.; Stockton, E.; Vogel, C.; Curtis, P. Evaluating forest subcanopy response to moderate severity disturbance and contribution to ecosystem-level productivity and resilience. For. Ecol. Manag. 2016, 376, 135–147. [Google Scholar] [CrossRef]
- Flower, C.E.; Knight, K.S.; Gonzalez-Meler, M.A. Impacts of the emerald ash borer (Agrilus planipennis Fairmaire) induced ash (Fraxinus spp.) mortality on forest carbon cycling and successional dynamics in the eastern United States. Biol. Invasions 2013, 15, 931–944. [Google Scholar] [CrossRef]
- Gough, C.M.; Vogel, C.S.; Hardiman, B.; Curtis, P.S. Wood net primary production resilience in an unmanaged forest transitioning from early to middle succession. For. Ecol. Manag. 2010, 260, 36–41. [Google Scholar] [CrossRef]
- Gough, C.M.; Vogel, C.S.; Schmid, H.P.; Su, H.-B.; Curtis, P.S. Multi-year convergence of biometric and meteorological estimates of forest carbon storage. Agric. For. Meteorol. 2008, 148, 158–170. [Google Scholar] [CrossRef]
- Davies, G.M.; Gray, A. Don’t let spurious accusations of pseudoreplication limit our ability to learn from natural experiments (and other messy kinds of ecological monitoring). Ecol. Evol. 2015, 5, 5295–5304. [Google Scholar] [CrossRef]
- Hardiman, B.S.; Gough, C.M.; Halperin, A.; Hofmeister, K.L.; Nave, L.E.; Bohrer, G.; Curtis, P.S. Maintaining high rates of carbon storage in old forests: A mechanism linking canopy structure to forest function. For. Ecol. Manag. 2013, 298, 111–119. [Google Scholar] [CrossRef]
- Fahey, R.T.; Fotis, A.T.; Woods, K.D. Quantifying canopy complexity and effects on productivity and resilience in late-successional hemlock–hardwood forests. Ecol. Appl. 2015, 25, 834–847. [Google Scholar] [CrossRef] [PubMed]
- Sheuermann, C.S.; Nave, L.E.; Fahey, T.R.; Nadelhoffer, K.J.; Gough, C.M. The coupling of ecosystem biological and physical structure with primary production is mixed in upper Great Lakes forests. Oecologia 2018. submitted. [Google Scholar]
- Hill, M.O. Diversity and evenness: A unifying notation and its consequences. Ecology 1973, 54, 427–432. [Google Scholar] [CrossRef]
- Gorelick, R. Combining richness and abundance into a single diversity index using matrix analogues of Shannon’s and Simpson’s indices. Ecography 2006, 29, 525–530. [Google Scholar] [CrossRef]
- Magurran, A.E. Ecological Diversity and Its Measurement; Springer: Dordrecht, The Netherlands, 1988; ISBN 978-94-015-7360-3. [Google Scholar]
- Liang, J.; Buongiorno, J.; Monserud, R.A.; Kruger, E.L.; Zhou, M. Effects of diversity of tree species and size on forest basal area growth, recruitment, and mortality. For. Ecol. Manag. 2007, 243, 116–127. [Google Scholar] [CrossRef]
- Romme, W.H.; Knight, D.; Yavitt, J. Mountain pine beetle outbreaks in the Rocky Mountains: Regulators of primary productivity? Am. Nat. 1986, 127. [Google Scholar] [CrossRef]
- Brown, M.; Black, T.A.; Nesic, Z.; Foord, V.N.; Spittlehouse, D.L.; Fredeen, A.L.; Grant, N.J.; Burton, P.J.; Trofymow, J.A. Impact of mountain pine beetle on the net ecosystem production of lodgepole pine stands in British Columbia. Agric. For. Meteorol. 2010, 150, 254–264. [Google Scholar] [CrossRef]
- Pfeifer, E.M.; Hicke, J.A.; Meddens, A.J.H. Observations and modeling of aboveground tree carbon stocks and fluxes following a bark beetle outbreak in the western United States. Glob. Chang. Biol. 2011, 17, 339–350. [Google Scholar] [CrossRef]
- Campbell, J.; Alberti, G.; Martin, J.; Law, B.E. Carbon dynamics of a ponderosa pine plantation following a thinning treatment in the northern Sierra Nevada. For. Ecol. Manag. 2009, 257, 453–463. [Google Scholar] [CrossRef]
- Edburg, S.L.; Hicke, J.A.; Lawrence, D.M.; Thornton, P.E. Simulating coupled carbon and nitrogen dynamics following mountain pine beetle outbreaks in the western United States. J. Geophys. Res. 2011, 116, G04033. [Google Scholar] [CrossRef]
- Bormann, F.H.; Likens, G.E. Catastrophic disturbance and the steady state in northern hardwood forests: A new look at the role of disturbance in the development of forest ecosystems suggests important implications for land-use policies. Am. Sci. 1979, 67, 660–669. [Google Scholar]
- Woods, K.D. Multi-decade biomass dynamics in an old-growth hemlock-northern hardwood forest, Michigan, USA. PeerJ 2014, 2, e598. [Google Scholar] [CrossRef] [PubMed]
- Halpin, C.R.; Lorimer, C.G. Long-term trends in biomass and tree demography in northern hardwoods: An integrated field and simulation study. Ecol. Monogr. 2016, 86, 78–93. [Google Scholar] [CrossRef]
- Morin, X.; Fahse, L.; Scherer-Lorenzen, M.; Bugmann, H. Tree species richness promotes productivity in temperate forests through strong complementarity between species. Ecol. Lett. 2011, 14, 1211–1219. [Google Scholar] [CrossRef] [PubMed]
- Loreau, M. Biodiversity and ecosystem functioning: A mechanistic model. Proc. Natl. Acad. Sci. USA 1998, 95, 5632–5636. [Google Scholar] [CrossRef] [PubMed]
- Johnstone, J.F.; Allen, C.D.; Franklin, J.F.; Frelich, L.E.; Harvey, B.J.; Higuera, P.E.; Mack, M.C.; Meentemeyer, R.K.; Metz, M.R.; Perry, G.L.; et al. Changing disturbance regimes, ecological memory, and forest resilience. Front. Ecol. Environ. 2016, 14, 369–378. [Google Scholar] [CrossRef]
- Reichle, D.E. Dynamic Properties of Forest Ecosystems; Cambridge University Press: Cambridge, UK, 1981; ISBN 978-0-521-22508-3. [Google Scholar]
- Zhang, Y.; Chen, H.Y.H.; Reich, P.B. Forest productivity increases with evenness, species richness and trait variation: A global meta-analysis. J. Ecol. 2012, 100, 742–749. [Google Scholar] [CrossRef]
- Liang, J.; Crowther, T.W.; Picard, N.; Wiser, S.; Zhou, M.; Alberti, G.; Schulze, E.-D.; McGuire, A.D.; Bozzato, F.; Pretzsch, H.; et al. Positive biodiversity-productivity relationship predominant in global forests. Science 2016, 354, aaf8957. [Google Scholar] [CrossRef] [PubMed]
- Kelty, M.J. The role of species mixtures in plantation forestry. For. Ecol. Manag. 2006, 233, 195–204. [Google Scholar] [CrossRef]
- Forrester, D.I.; Bauhus, J.; Cowie, A.L.; Vanclay, J.K. Mixed-species plantations of Eucalyptus with nitrogen-fixing trees: A review. For. Ecol. Manag. 2006, 233, 211–230. [Google Scholar] [CrossRef]
- Fotis, A.; Murphy, S.; Ricart, R.D.; Krishnadas, M.; Whitacre, J.; John, W.; Queenborough, S.; Comita, L. Aboveground biomass is driven by mass-ratio effects and stand structural attributes in a temperate deciduous forest. J. Ecol. 2017. [Google Scholar] [CrossRef]
- Chesson, P. Mechanisms of maintenance of species diversity. Annu. Rev. Ecol. Evol. Syst. 2000, 31, 343–366. [Google Scholar] [CrossRef]
- Adler, P.B.; Hillerislambers, J.; Levine, J.M. A niche for neutrality. Ecol. Lett. 2007, 10, 95–104. [Google Scholar] [CrossRef] [PubMed]
- Forrester, D.I. The spatial and temporal dynamics of species interactions in mixed-species forests: From pattern to process. For. Ecol. Manag. 2014, 312, 282–292. [Google Scholar] [CrossRef]
- Fotis, A.T.; Curtis, P.S. Effects of structural complexity on within-canopy light environments and leaf traits in a northern mixed deciduous forest. Tree Physiol. 2017. [Google Scholar] [CrossRef] [PubMed]
- Wilkinson, D.M. The disturbing history of intermediate disturbance. Oikos 1999, 84, 145–147. [Google Scholar] [CrossRef]
- Sakai, T.; Akiyama, T. Quantifying the spatio-temporal variability of net primary production of the understory species, Sasa senanensis, using multipoint measuring techniques. Agric. For. Meteorol. 2005, 134, 60–69. [Google Scholar] [CrossRef]
- Cole, W.G.; Lorimer, C.G. Probabilities of small-gap capture by sugar maple saplings based on height and crown growth data from felled trees. Can. J. For. Resour. 2005, 35, 643–655. [Google Scholar] [CrossRef]
- Hart, J. Gap-Scale Disturbances in Central Hardwood Forests with Implications for Management. In Natural Disturbances and Historic Range of Variation Type, Frequency, Severity, and Post-Disturbance Structure in Central Hardwood Forests USA; Greenberg, C., Collins, B., Eds.; Springer: Cham, Switzerland, 2015; Volume 32, pp. 33–47. ISBN 978-3-319-21527-3. [Google Scholar]
- Portsmuth, A.; Niinemets, Ü. Structural and physiological plasticity in response to light and nutrients in five temperate deciduous woody species of contrasting shade tolerance. Funct. Ecol. 2007, 21, 61–77. [Google Scholar] [CrossRef]
© 2018 by the authors. Licensee MDPI, Basel, Switzerland. This article is an open access article distributed under the terms and conditions of the Creative Commons Attribution (CC BY) license (http://creativecommons.org/licenses/by/4.0/).