1. Introduction
In the last decade, organizations have quickly adapted to the Internet, social networks, and search engines. The appearance of Web 2.0 has allowed users to design, create, and produce content and activities on the Internet [
1].
These new forms of online expression have transformed and changed the ideas of users and organizations so that they can achieve their goals. Therefore, Web 2.0, Social Media, and search engines have transformed how users obtain information about the topics that interest them on the Internet [
2].
With the increase in the volume of content on the Internet in recent years and the search for information using search engines, the quality and speed of information sources has increased its potential. To achieve this, search engines have increased their efforts to apply quality filters that group search results into relevant sources, and respond to the queries made by users. Search engines are widely used to measure the interest that people have in a certain topic.
In this way, numerous investigations have evaluated the effectiveness of search engines as sources for obtaining information. Some of these investigations have analyzed the sustainability of search engines based on linguistic factors. In the research study by Allen and Seaman [
3], the authors measured the correlations between the impressions users had of a search engine and the number of queries made with it. In the investigations by Allen and Seaman [
3] and Bankole et al. [
4], analyses were conducted that compared the number of times a search engine showed results to the number of web pages indexed. In addition, the research of Baptista and Oliveira [
5] analyzed the opinions made on a search engine over a limited period of time.
The research of Batet and Sánchez [
6] was concerned with evaluating search engines using the frequency and probability of the queries made as variables, and then identifying the best search engine using Linguistic Research.
The research of Bollegala et al. [
7] was focused on the importance of the types of search engines that support social work from the point of view of technology and information. The research by NetMarket [
8] explained Ecosia’s social business model by studying global pollution changes compared to the trees planted by the search engine. The research of Venkatesh et al. and Shaikh and Karjaluoto [
9,
10] considered the impact that search engines have on the development of Green Business Models by analyzing the Ecosia search engine with the case study methodology. We must emphasize that these investigations were carried out on search engines such as: Google, Yahoo, or Bing [
11]. According to the research by NetMarket [
8], the market share of search engines is distributed globally, as can be seen in
Table 1, which shows data from year 2016.
The search engine that obtains the highest global market share is Google, with a total of 78.78%. The search engine that appears with the second highest market share is Bing, with 7.65% of searches around the world. In third and fourth place appear Baidu (the Chinese search engine) and Yahoo, with a total market share of 7.33% and 4.70%, respectively. The number of global searches performed daily, if we take into account all search engines, is 6,586,013,574. If we look at the results of the Similar Web Search Report (2017), the sponsored search results, known as SEM (Search Engine Marketing) strategy or paid search, get 5% of the traffic and clicks, while 95% of traffic and clicks are on organic search results, which are known as SEO (Search Engine Optimization). Since 2008, there have been many initiatives which have developed search engines with socially responsible objectives.
This work has been structured as follows: The first section, called Literature Review, reviews the background of ecological marketing and, more specifically, the case of Ecosia.org. Likewise, this section reviews studies of the adoption of search engine technology on the Internet. In the second section, the UTAUT2 framework (Unified theory of acceptance and use of technology) [
12] is proposed as the technology adoption theory selected to understand the adoption model of Ecosia.org. Also, Trust was proposed as the external variable for the variables in this theory, given the specific functionalities of Ecosia.org. Finally, this section lists the eleven hypotheses proposed in the study.
In the third section, the selected methodology is detailed, which in our case was the survey technique. This quantitative method allowed us to propose a questionnaire (
Appendix A) that was given to a sample (
n = 445) of regular users of search engines on the Internet. The fourth section carries out an analysis of the results by using PLS-SEM (Partial Least Squares-Structural Equation Modeling). Finally, the last section concludes with a summary of the most important findings. This research seeks to clarify whether search engine users are willing to use a search engine like Ecosia, knowing that it helps to mitigate climate change, favors the planting of trees, and therefore deforestation, or if, on the contrary, these benefits for planet Earth are not enough to change the search engine that they use daily.
2. Literature Review
2.1. The Search Engine Ecosystem
There have been important changes in the information management ecosystem in recent years. This means that nowadays there is a large variety of techniques and tools for consumers or Internet users to obtain information in digital environments. When a query is made on a search engine, the best possible truthful and up-to-date results are made available to the users. The result of a query, known as “ranking of results” or SEPRs (Search Engine Pages Results), is automatically developed by the search engine, based on hundreds of parameters that the algorithm takes into account to rate each website according to the search that has been made, which offers only relevant results.
In these search results, search engines show sponsored ads known as SEM (Search Engine Marketing) that are used to generate revenue. Search engines are the first source of information for users according to the research carried out by Shaikh and Karjaluoto, Jayaram et al., Chaffey and Patron, and Saura et al. [
10,
11,
12,
13], in which they study user behavior on these search engines. The results displayed by the search engines do not all generate income when the user clicks on them. However, if a sponsored result receives a click, the search engine obtains a commission from the CPC (Cost per Click) advertisement owner. In general, these sponsored search results are the main source of income for search engines [
14,
15,
16].
The results of the searches offered by the search engines show a warning with the word “Ads” advising the consumer that they are commercial search results for advertising purposes and are those corresponding to the results of “Paid Search” that generate income for the search engines [
13,
14].
The work of Martínez-Sanahuja and Sánchez [
17] identifies the main search engines that exist in the market and that use this technology to generate income with searches made by users.
Table 2 shows the search engines in terms of their relevance according to the work of Schmidt et al. [
18].
2.2. Ecosia.org: The Search Engine that Plants Trees
Ecosia is a Green Search Engine that donates at least 80% of its advertising benefits to WWF (Word Wide Fund for nature) programs for reforestation. These promoted results are known in the company as Ecolinks. In Nils research, an in-depth description of this search engine was made. The Ecosia search engine does not provide its own search engine due to financial limitations, but works with the Bing search engine technology. Revenue is generated by the clicks that users make on the promoted ads that appear in the search results.
Eighty percent (80%) of the income generated by clicks on these ads is donated to programs for reforestation [
19]. The remaining 20% is used to pay for necessary costs such as salaries, servers, domains, or marketing. According to the research of Schmidt et al. [
18], the CEO (Chief Executive Officer) of the company has a salary lower than 1000 €. According to the latest company data of July 2017, Ecosia has already planted 11.5 million trees and has an average of 202,323 daily active users that perform an average of 500,000 searches per day. This translates into 0.5 Euro cents per search and click on Ecolinks. In
Table 3 an overview of the company can be seen:
Ecosia has set a very clear goal, which is to achieve one billion planted trees by the year 2020. According to the research on Ecosia org in 2010, Ecosia manages to maintain its financial structure and costs because it does not have its own search engine and therefore has no hardware to maintain; the company considers its search engine as a personal contribution to the environment and society, instead of a project for investment based on profitability, and marketing is carried out to increase the social awareness of search engine users [
15,
18].
The projects that Ecosia finances are for planting trees, mainly in the African and Brazilian continents, and therefore we can say that Ecosia is an example of a social business model in the search engine market [
19].
Projects for planting trees were chosen for the following reasons. Trees provide a cool climate and absorb CO
2, one of the main causes of climate change. Likewise, large forests can even create clouds that in turn reflect sunlight and cool our planet, thus helping to mitigate the effects of global warming. Biodiversity is also increased by the forests created with the trees, as they produce diverse, sustainable wildlife systems for plants and animals to live in [
18,
19].
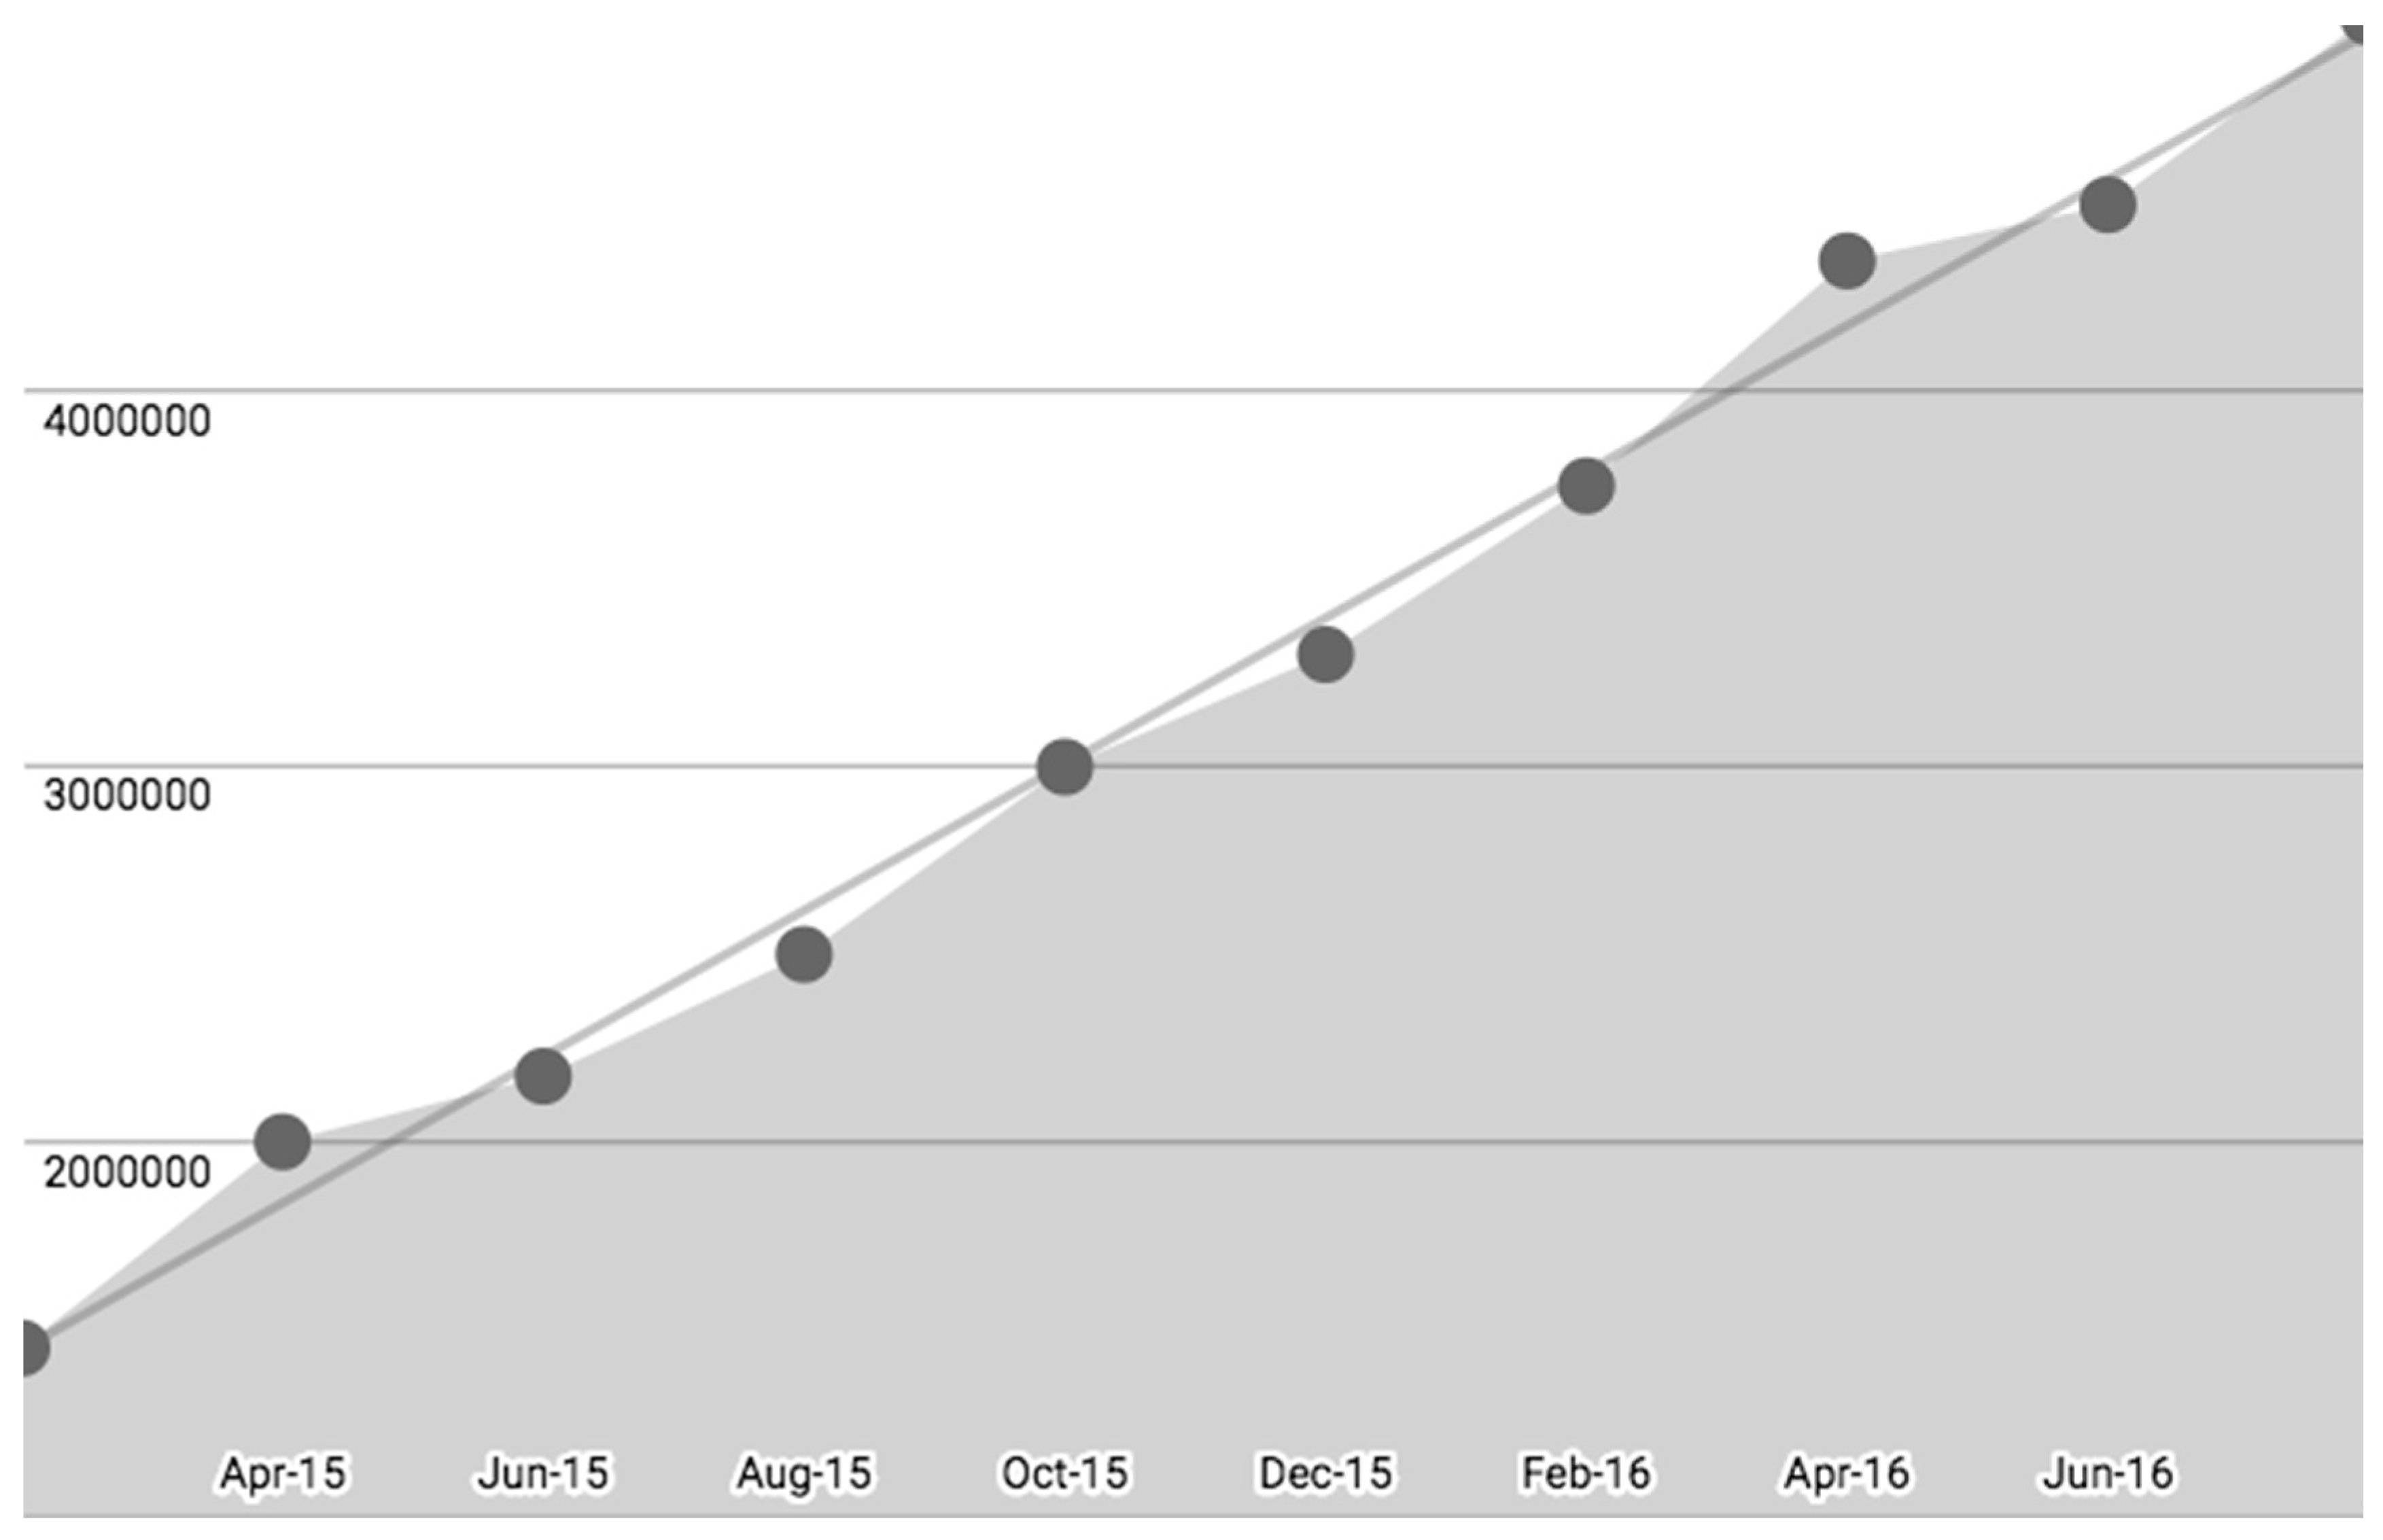
In
Figure 1, we can see the number of trees planted per year by Ecosia.
Trees help to protect land and soil from erosion, and also to create productive and fertile land. In addition, trees generate clean air and provide the oxygen that we need to breathe. Trees also clean the air by absorbing polluting gases and filtering toxic particles. Trees are additionally a source of healthy foods and other products which can be harvested sustainably.
The livelihoods of 1.6 billion people around the world depends on these products. Finally, trees provide water security, as forests regulate water cycles and prevent floods, create humid microclimates, and increase groundwater levels.
These are the reasons that the Ecosia search engine gives as the basis for its business model of planting trees [
18,
20].
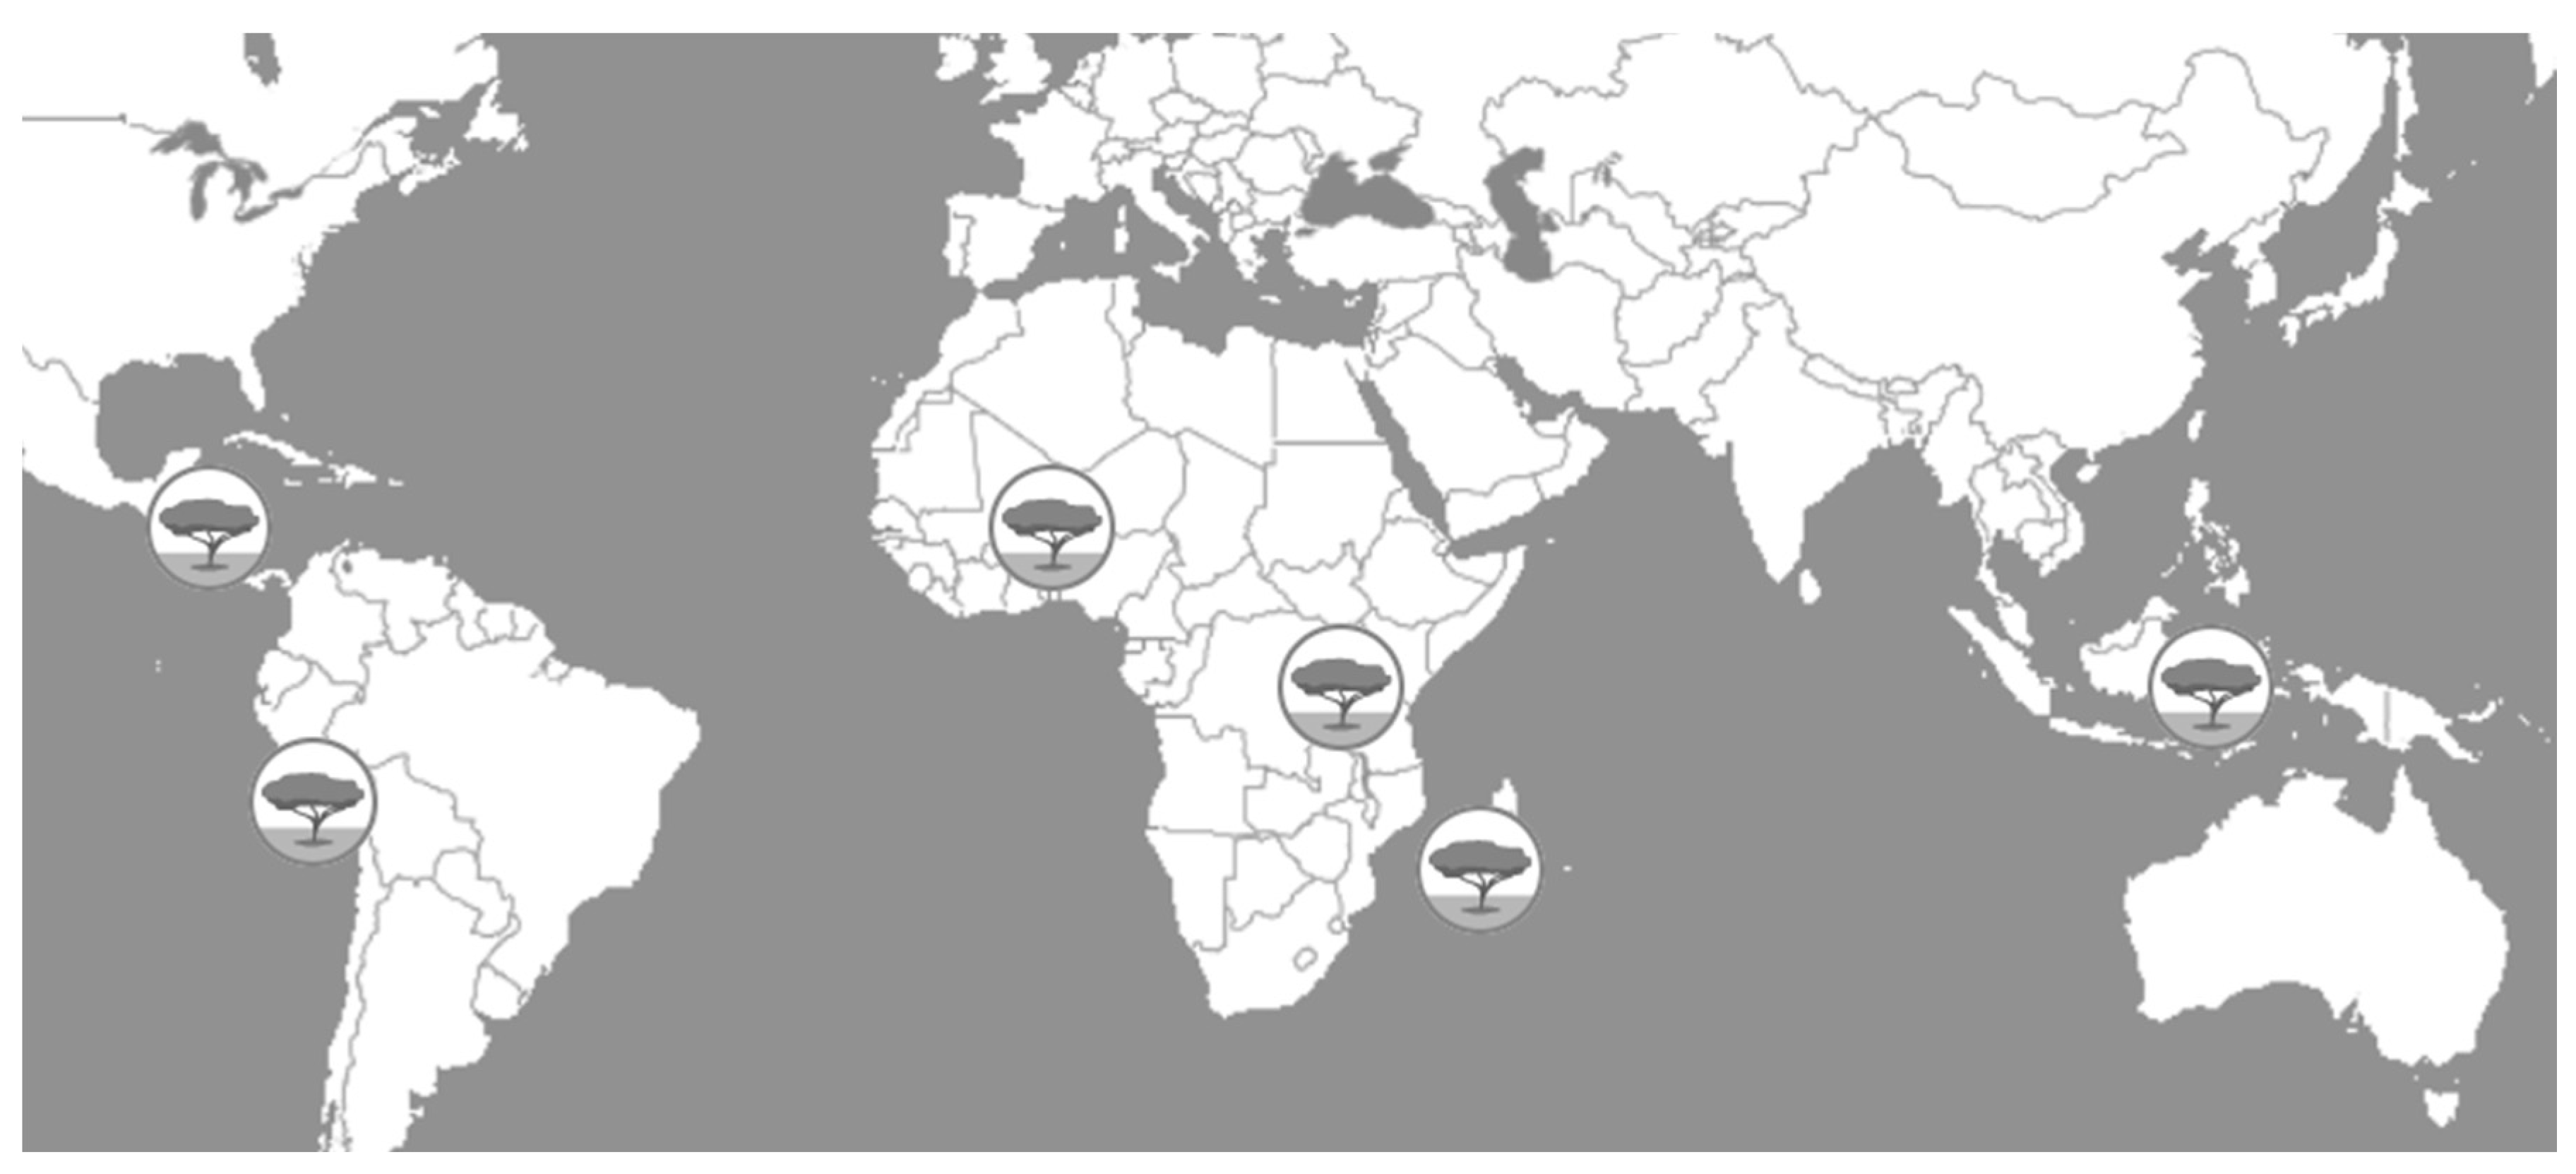
In addition, it is important to identify the parts of the world where these plantation projects are being carried out in order to assess their biodiversity.
To do this, the search engine provides the following information about the projects being carried out in the different areas of the world. In
Figure 2, the geographical areas with Ecosia projects can be seen.
In
Table 4, the geographical areas and the relevant objectives of tree planting by Ecosia are explained [
17,
18,
19].
Although Ecosia has a large number of social improvement projects, it is not the only initiative that has been started for these purposes. There have been various other projects that use search engines for environmental improvement and global sustainability, as can be seen in
Table 5.
Table 5 shows the distribution of the socially responsible search engines market as shown in the research of Schmidt et al. [
18].
2.3. Unified Theory of Acceptance and Use of Technology
Technology Acceptance Model (TAM) is a theoretical method that can be used to explain the impact of external factors on behavioral intention [
21]. However, many of the variables have their own unique properties that are applicable in a wide range of fields, which resulted in the development of the integrated Unified Theory of Acceptance and Use of Technology (UTAUT) model [
9]. The UTAUT model contains three constructs that have been recognized as decisive factors for behavioral intention: the expectation of performance, the expectation of effort, and social influence. The behavioral intention to use, together with the facilitating conditions constitutes two constructs of UTAUT and the TAM models that are considered decisive factors for the use behavior.
The UTAUT model is one of the most used by researchers to understand the choice and adoption of any technology [
9]. This method unifies models such as the so-called Technology Acceptance Model (TAM) [
21] as well as the well-known theory of Use Behavior [
22]. Since its development, there have been numerous investigations which analyzed and expanded this theoretical perspective for academic research by adding different variants. The TAM model has been used in many studies that analyze the adoption of different technological variants, such as the adoption of cloud computing [
23] or mobile applications [
1,
10,
24].
The research of Venkatesh and Davis [
25] studies and presents the TAM 2 model. TAM 2 incorporates user satisfaction and technological acceptance into the model following the work of Wixom and Todd [
26]. The TAM 3 model proposed by Venkatesh and Bala [
27] specializes in Internet and electronic commerce.
In addition, the model has also been adapted to different research objectives in different organizations in order to understand, for example, the factors that influence the acceptance of use of ICT (Information and Communications Technology) by employees. This model is concerned with different perspectives, not only those of consumers as in the UTAUT model.
The UTAUT model has successfully been used in numerous studies, including projects involving various health-related technologies [
28], robotics [
29], procurement recommendation systems [
30], booking systems in rural tourism [
31], energy efficiency [
32], and technologies for social innovation [
33]. The UTAUT model has also increased its relevance in recent decades due to the fact that numerous investigations have developed the model in the area of innovation and adaptation of ICT [
34].
In this research, the adoption of the Ecosia.org search engine is studied to extend research that uses the UTAUT model for ICT.
In the research presented by Venkatesh et al. [
35], the UTAUT model explained 70% of the variance in technology for the behavioral intention to use. This model has also been used to research areas such as the adoption of information systems by mobile banking technology users [
5,
36]. The model has also been applied to studies based on technologies that use the Internet, such as electronic commerce [
37], web development and design [
2], mobile telephony technologies [
37], mobile applications [
38], banking and electronic banking systems [
39,
40], payment using mobile applications [
41,
42], education based on online devices [
43], location-based services such as search engines [
44,
45], health services [
46], the negotiation of actions based on technology [
47], health and fitness applications [
48], integrated instant messaging and social networking platforms or social search engines [
49], smart watches [
50], and e-tourism strategies and their visibility on the Internet [
51].
In this research, the original UTAUT2 model was modified with additional variables in order to achieve the research objectives of the research. In UTAUT2, the use of technology is directly determined by the intention to use and facilitating conditions, as in UTAUT, but UTAUT2 adds the habit variable. The behavioral intention to use directly explains the expectation of performance, the expectation of effort and social influence, and, as a new addition, the hedonistic motivation and the price value. The relationships between the seven variables (the original four of UTAUT and the three additional ones of UTAUT2) and the behavioral intention to use and the behavioral use of technology are moderated by age, sex, and experience. In comparison with the original UTAUT model, the new UTAUT2 model [
10] produced a substantial improvement in the explained variance of the behavioral intention to use (from 56% to 74%) and the behavioral use of technology (from 40% to 52%).
This study sought to determine the benefits that users identified when using the Ecosia.org search engine and the factors that affect the use behavior as references to guide the future improvement of the search engine. Similarly, a comparison of the use of Ecosia.org with the use of the Google search engine, which is the most used search engine, was made.
As mentioned above, in this research we adapted the UTAUT2 model [
10], a model that imports and develops efficient improvements into the original UTAUT model, in order to explain the behavioral intention to use a given search engine when users perform a search on Internet.
2.4. Variables and Hypotheses Development
The TAM model presents the relationship that exists between the expectation of utility and expectation of effort, that is supported by authors such as Escobar-Rodríguez and Carvajal-Trujillo [
51] or Brown and Venkatesh [
52] who define the perceived utility as the degree to which the use of a website helps consumers to carry out activities, in our case with the Ecosia.org search engine. Based on this definition, we establish the relationship between the perceived utility and the expectation of effort that consumers or users have with the use of the search engine. Other authors also formulate these hypotheses in similar studies based on ICT [
35,
43,
50,
53].
In the conclusions of different investigations, like those of [
54,
55] or [
56], the results explain that consumers or users find the technology easy to use (lower expectation of effort). Users also believe that technology is useful (greater expectation of utility) and, therefore, the expectation of effort is similar to the Utility perceived in TAM [
34].
In UTAUT, the effort expectation positively affects the acceptance of use [
34]. The expectation of effort is defined by Venkatesh et al. [
9] as the ease associated with the use of technology by users of ICT-based services. This value is related to the quality of the expected results shown by Internet search engines in [
54,
55,
56].
Based on the statements made above, it is proposed that:
Hypothesis 1. The Effort Expectancy of the search engine performance has a positive effect on the Behavioral Intention to Use the search engine.
In this document, we study the trust in the access to information on the Internet with the use of search engines. That is, the trust that users have in search engines as tools to find information on the Internet, especially as information providers resulting from the searches may charge a fee in some cases.
Firstly, Trust refers to how much a user believes in the safety, reliability, efficiency, competence, and validity of a system that can be unsafe to use [
41,
56,
57,
58,
59]. When users find a service to be unreliable, they tend to have less interaction with that service and related parties [
56]. In the behavioral intention of use a search engine, Trust is defined as the general belief that these searches will be made [
57].
This variable has been investigated in several studies on the Internet where the UTAUT model has been applied [
41,
58]. Therefore, we can structure the hypotheses in the following way:
Hypothesis 2. The Trust perceived by users who use the search engine on the Internet has a positive effect on the Behavioral Intention to Use.
Hypothesis 3. The Trust perceived by users of the Internet search engine has a positive effect on Use Behavior when using a search engine.
The relationship of the influence of Behavioral Intention to Use was defined by Venkatesh et al. and Venkatesh and Davis [
9,
25]. Other studies that consider the adoption of search engines define this structure as Planned Behavior [
59]. Use Behavior has been established in different technology adoption models such as TAM [
20] and UTAUT [
34]. It is well known that the number of search engines on the Internet is increasing exponentially, as is the number of users who make queries on them [
41,
44]. The formulation of these hypotheses allows us to study the adoption behavior for the search engines by users and empirically demonstrates the relationship between Behavioral Intention to Use search engines and the Use Behavior for search engines. Previous studies [
4,
30,
35,
59,
60,
61,
62] have defined the Behavioral Intention to Use search engines as the attitude, beliefs, and perceptions of a person about using a technology, and the Use Behavior as the actual use that a user makes of the technology. In research by Liaw [
59], the Behavioral Intention to Use is applied to the study of search engines.
Other authors also formulate these hypotheses in similar studies on the behavior and actions of a user with Internet search engines [
57,
58].
Based on the statements made above, it is proposed that:
Hypothesis 4. The Behavioral Intention to Use has a positive effect on the Use Behavior of the search engine.
The relationship between Social Influences on the use of search engines and the perceived usefulness of the search engine itself is another existing relationship. Social influence is defined in the research of Orso et al. [
60] and is identified as the extent to which consumers believe that other important members in their lives, such as family members, friends, and other colleagues, believe that they should use a particular technology. Studies have been made on the relationship between the influence that this generates in use behavior when using one search engine or another [
26,
51]. However, the strongest social influences are the reasons why consumers perceive technology as more useful, influencing intention to use [
34] and determining the option of adopting a new product [
59]. These facts are studied by Orso et al. [
60] for search engines.
Other authors also formulate these hypotheses in similar studies [
35,
44,
63]. Following this line of thought and the investigations that confirm it, we constructed the fifth hypothesis:
Hypothesis 5. The Social Influence has a positive effect on the Behavioral Intention to Use for the search engine.
One of the new variables that UTAUT2 incorporates is the hedonic motivation, known in other studies as perceived enjoyment [
51]. This new variable for the UTAUT2 model has a significant influence on the final behavioral intention to use [
51]. Numerous investigations on the adoption of information systems demonstrate the influence of hedonic motivation on the behavioral intention to use a technology and the use behavior [
64,
65]. Therefore, the following hypothesis is presented:
Hypothesis 6. The Hedonic Motivation to use a search engine has a positive effect on the Behavioral Intention to Use the search engine.
Habit is considered the measure in which people perform actions automatically, doing so as a consequence of their learning [
9,
64]. It is a new variable in the UTAUT2 model and has been used in various investigations as a predictor for behavioral intention to use [
47,
60,
64,
66] and has been shown to have a decisive influence on it. As a result, we consider that:
Hypothesis 7. The Habit of using the search engine has a positive effect on Behavioral Intention to Use for the search engine.
Hypothesis 8. The Habit of using the search engine has a positive effect on Use Behavior.
The facilitating conditions are the consumers’ feelings about the resources and the support available to use it [
34,
67]. These variables were declared in the original UTAUT model and it has been possible to measure them in this study, because the users in this survey use search engines to obtain information and have previous experience with the search engines:
Hypothesis 9. The Facilitating Conditions have a positive effect on the Behavioral Intention to Use the search engine.
Hypothesis 10. The Facilitating Conditions have a positive effect on the Use Behavior of the search engine.
As we have mentioned previously, price value is considered to be the relationship between the perceived benefits from using the search engine and the monetary cost of using it [
15,
68]. This is a new variable in the UTAUT2 model, which has already been studied in some recent research on ICT products and services [
53,
69]. This variable compares the cost or monetary price of the services that a particular technology ICT provides with the perceived quality of the service. This, from its original adaptation [
9,
70], examines whether the perceived benefits of use of technology in some way exceed the financial expense of using the technology.
Hypothesis 11. The price value has a positive effect on the Behavioral Intention to Use the search engine.
Hypothesis 12. The price value has a positive effect on the Use Behavior of the search engine.
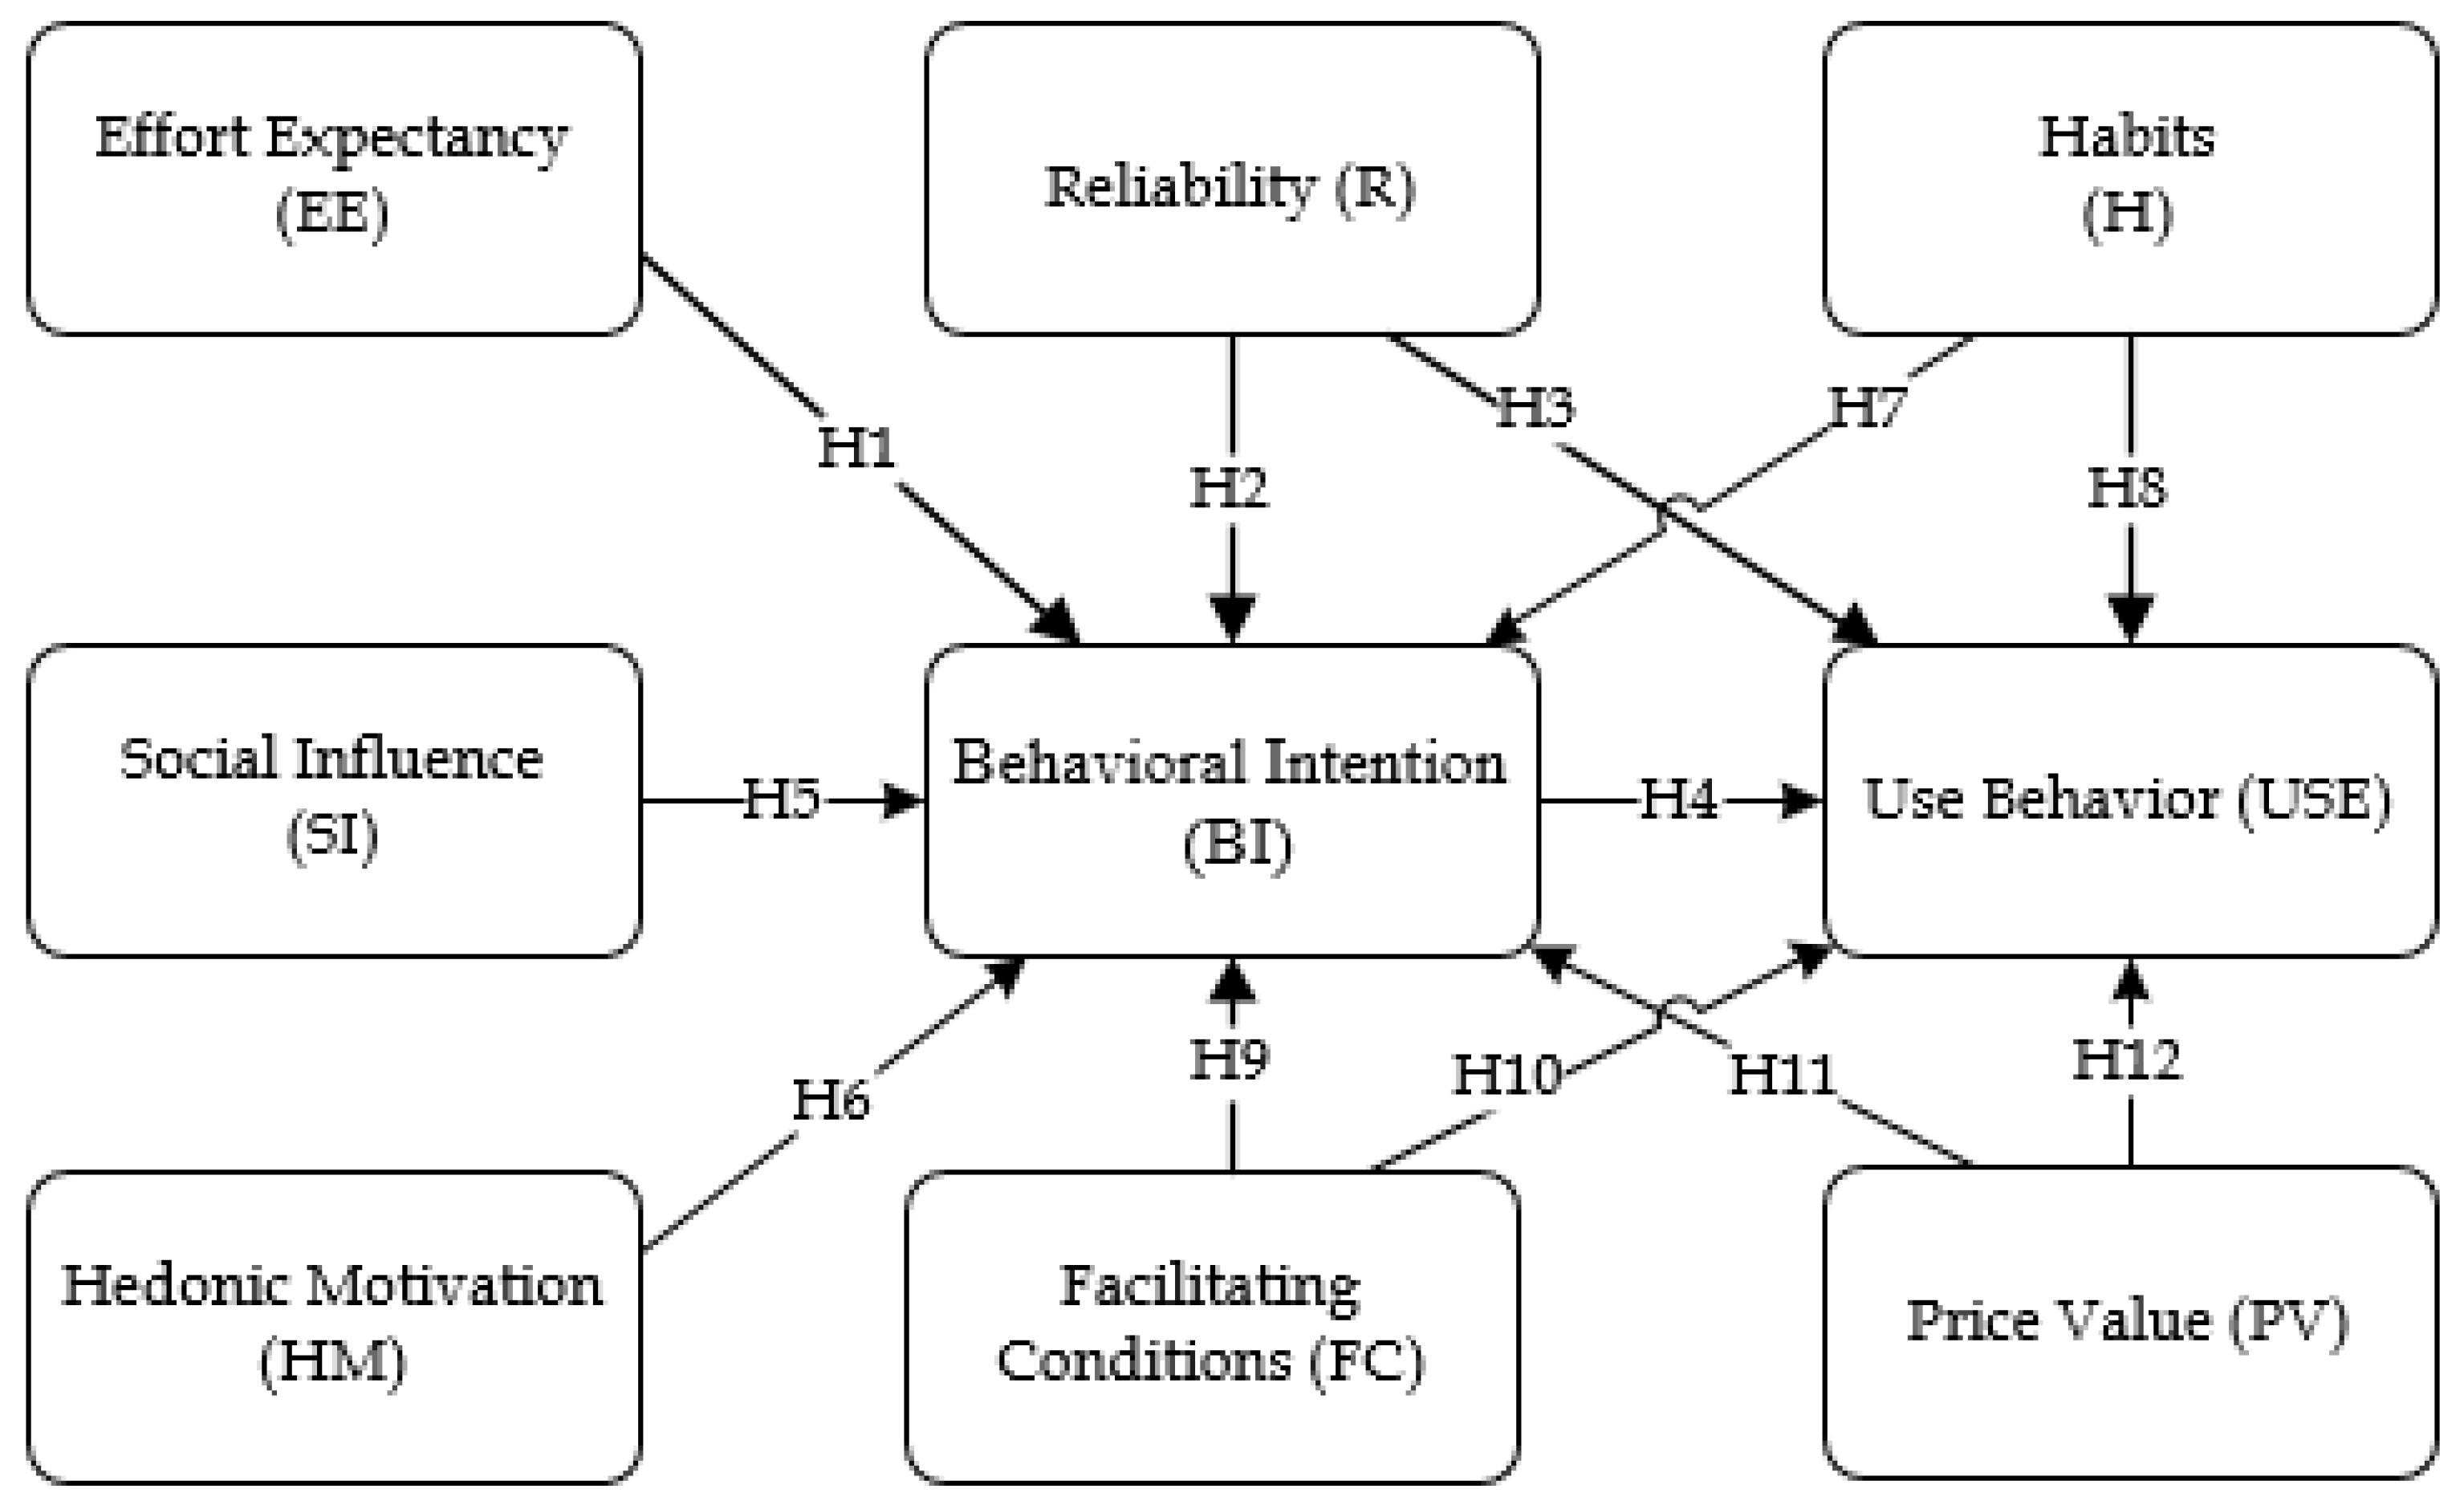
Based on the above12 hypotheses, this study presents a complete model (
Figure 3) shown below.
5. Conclusions
This study explored the factors that affect the adoption of Ecosia.org. This was done using the second version of the Unified Theory of Acceptance and Use of Technology (UTAUT2) [
9].
This study confirms the idea that an Internet search engine that helps mitigate the effects of climate change by planting trees is well received by Internet users. This conclusion is supported by the fact that 25.6% (see
Table 6) of the sample members indicated Ecosia.org as a favorite. However, in this same sample, the individuals who regularly use the search engine fell to 10.6%, which indicates that preference and use are not totally related [
93,
94].
The results obtained offer an optimistic outlook for the fight against deforestation, and consequently against climate change, by showing an interest of consumers for the responsible consumption of resources. The case that was studied in this research study offers a future in which companies are responsible for the environmental consequences of their actions, and where consumers can, with their choice of service, choose to what extent they are willing to contribute to the deterioration of the planet. Therefore, environmental management will start to not only be the responsibility of countries and governments, but of us all [
95,
96].
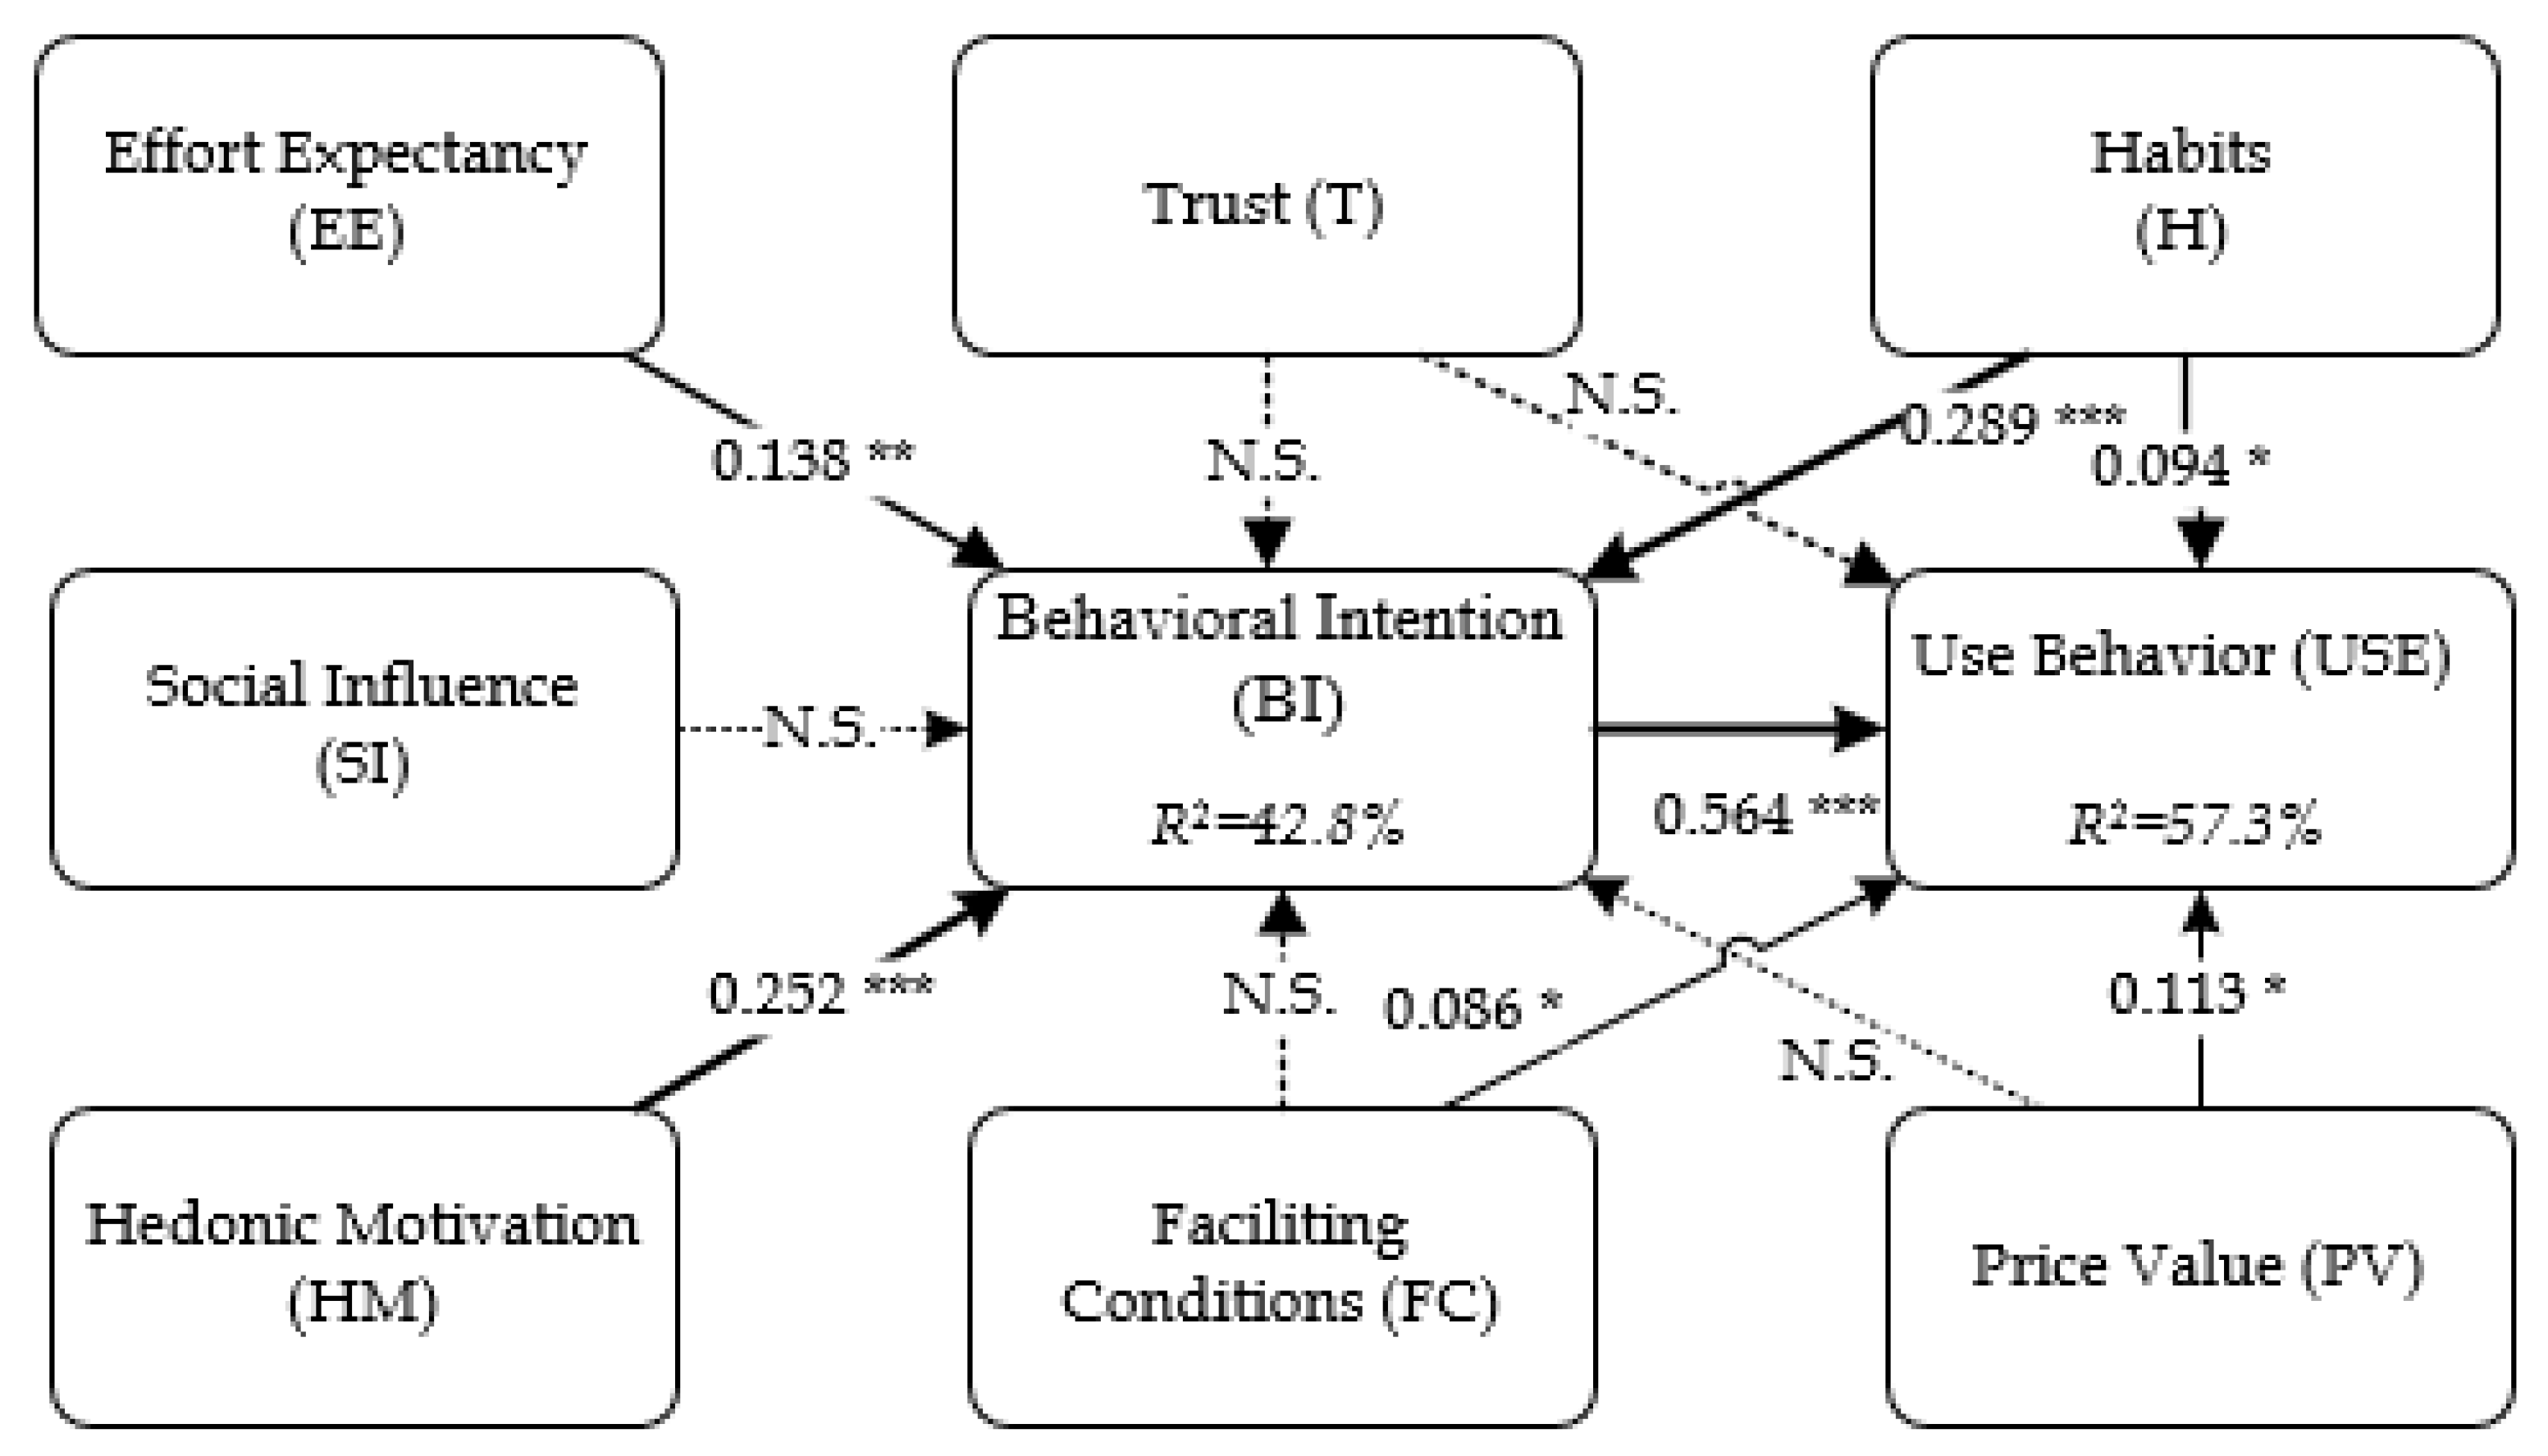
We saw how the Behavioral Intention to Use influences Use Behavior (H4) for users of search engines other than Ecosia.org, which is perceived as a socially responsible search engine that helps improve the environment. From this hypothesis, we can see that users are fully aware of the characteristics of search engines and the effects of using each one. Search engine users are therefore able to assess the different characteristics of each search engine and the actions and options which are available with each one. This fact confirms that the users understand the reasons for Ecosia.org and its social business model.
Another important result is that Social Influence does not influence Behavioral Intention to Use (H5) for any particular search engine. Therefore, although 21st century society is concerned about the state of the planet, pollution, and global warming, it is still not a problem or social concern that society links with projects whose ultimate goal is to contribute to the improvement of sustainability and global warming.
This study helps to demonstrate that habit is very powerful and that it has a decisive influence on Behavioral Intention to Use (H7) and Use Behavior (H8) [
61,
62,
63,
97,
98]. Many questionnaires reflect this in the answers given, where the subjects indicate that they do not consider changing the search engine they use, amongst other reasons, because they always automatically use the same one. Such solid consumption habits have been formed that it is difficult for users to modify their chosen search engine when making queries on the Internet, even though the new option offers social values that strongly support the environment.
We must bear in mind that respect for the environment is also related to habit and the questions that are continually asked are “Which habit is most powerful?”, “Can a search engine really break that habit?” The results indicate, however, that few users accept the idea of changing their habits and prefer to continue with the traditional search engine because the added value presented by a browser that supports the environment with its social tasks is not enough to de-link the habit of using a preferred search engine. It is therefore striking that the generations that use search engines daily to find information are not willing to change their habits for causes that fight against worsening global warming, the ozone layer, air quality, or the general pollution of the planet. It is surprising to see how the society of the XXI century, which is advanced and worried, a priori, about the planet is not willing to modify its habits when consulting the Internet for the mere fact of having to use a different search engine. The positive environmental actions of a search engine are not influential enough to change the users’ choice of a habitually used search engine.
Even though users may understand the Facilitation Conditions for a search engine, this fact does not influence the Behavioral Intention to Use it, which is the reason why H9 is rejected. However, the influence of Facilitating Conditions on Use Behavior (H10) is confirmed. This is because search engine users understand and feel that the Facilitating Conditions will allow them to perform specific tasks when using a search engine to make inquiries on the Internet. In this respect, the interface of Ecosia.org is very similar to the rest of search engines on the Internet, so the design and easily usable interface is an important factor that influences the Use Behavior of search engine users on the Internet. However, for the choice of one particular search engine or another, certain variables such as the Price Value do not influence the Behavioral Intention to Use (H11) of search engine users, because accessing the internet with a search engine is considered such a basic and necessary task that it has become a habit in their daily life.
However, Ecosia is seen to be a widely compatible search engine that does not need many resources to use it, since the influence of Effort Expectancy is not significant in Behavioral Intention to Use (H1). This conclusion makes us optimistic and gives Ecosia.org a competitive advantage over its competitors.
This research work discovers two additional advantages. On the one hand, users relate Price Value with Use Behavior (H12), but not in the case of Ecosia.org, where the influence is not significant. That is to say, in the case of Ecosia.org, users do not mind what the company that owns the search engine does with its income, but they are concerned about this for the rest of the companies. In these other cases, the users could demand more improvements or a more correct distribution of income. This fact does not occur in Ecosia.org, which distributes up to 80% of its income in the planting of trees in areas of need on our planet.
It is very interesting to discover that Behavioral Intention to Use is conditioned in a very significant way by Hedonic Motivation (H6). That is, enjoyment, use of search engines in leisure time, or as entertainment, are all reasons that condition behavior. However, this does not happen in Ecosia.org. Unlike other search engines, this factor does not condition user behavior. It seems therefore that environmental respect and, above all, the contribution to the end of deforestation and mistreatment of our forests is a more important priority than enjoyment or entertainment when choosing a particular search engine as a favorite.
This study confirms that ecological marketing is an appropriate marketing strategy for the future, which can increase the intention to use a technological product. Based on the results obtained, this study shows that a search engine or, perhaps in the future, another Internet service that is auditable (visits, searches, files, etc.) can also contribute to curbing the effects of deforestation and climate change. These conclusions are based on the fact that Trust is not a factor that conditions Use Behavior (H3) in the case of Ecosia.org. Therefore, we can affirm that the social business model established by Ecosia.org can be used by other forms of technology to improve the environment and the sustainability of the planet. In addition, companies and, especially technological start-ups, are recommended to take into account that users feel better using tools that support the environment, sustainability, or that fight against the effects of climate change, even though this fact does not ensure that users will use the product in question instead of the competition if this has already become a habit.
The results of this research for the importance of awareness and promotion of deforestation are solid. This means that the results of this research can be used to improve users’ awareness of the problems of deforestation, climate change, and air pollution. Forestry deals with the management of woods and forests as well as the science of tree cultivation. The results of this research can help to improve the understanding of this science and show its importance for the preservation of the planet, the fight against climate change, and the reduction of air pollution, and, above all, can increase awareness of the massive felling of trees and the problems that this brings to the planet.
Therefore, the results of this investigation can be used to urge foundations and non-governmental organizations to support these initiatives, as well as suggest that the companies that provide technological services follow the ecological marketing strategy of Ecosia.org, because of the positive effects achieved on user satisfaction by using this strategy.
The use of services that support sustainability increases user satisfaction and in the medium and long term means that the decision to use is influenced by the added value which is provided by these types of business initiatives. Companies must include these types of initiatives into their objectives in order to contribute to the improvement of the planet and have effective ecological marketing. Companies must ensure that the environmentally aware products and services that they provide become a habit for the consumers.
The scope of the present study is limited to a survey carried out on a community of advanced Internet users with an online questionnaire regarding the behavior and use of search engines that included the unique, ecological search engine Ecosia.org. Therefore, future researchers are encouraged to extend the scope and duration of the study with different users in other geographical areas in order to achieve more conclusive results.


