1. Introduction
Black spruce (
Picea mariana (Miller) B.S.P.) is distributed broadly across North American boreal forests, and is an important species, both economically and ecologically [
1]. Black spruce is the most important pulpwood species in Canada, and it is a major commercial species in the Lake States region (Michigan, Minnesota, and Wisconsin) of the United States [
1]. In Minnesota, black spruce comprises 648,000 hectares of the 7.04 million forested hectares [
2] and is the second-most harvested pulpwood species by volume [
3].
Across the US Lakes States, black spruce is near its southern and western range limit. Black spruce can occur under a variety of environmental conditions in both pure and mixed composition stands. Black spruce is the dominant overstory species in the black spruce/feather moss-lichen forest type, and is a co-dominant species in five other forest types [
4]. In Minnesota, black spruce can occur on both upland and lowland soils. However, in general, it is only a dominant species in lowland sites with low nutrient quality and poor drainage [
4]. On high quality sites, lowland black spruce in Minnesota can reach a diameter at breast height (1.3 m above the ground; DBH) of 35 cm, and a total height of 24 m. However, mature stands typically contain trees with diameters of 13 to 23 cm, and heights of 15 to 20 m [
5]. Stand yields vary greatly, depending on site index, basal area, and age. Yields for a 120-year old stand (all trees over 9.1 cm) with a basal area of 27.5 m
2 ha
−1 ranged from 173 m
3 ha
−1 in a stand with site index of 10.7 m (base age 50 years), to 141 m
3 ha
−1 in the same stand at a site index of 7.6 m [
6].
In Canada, there has been increased interest in understanding the growth dynamics of black spruce in both upland and lowland forests, in response to varying silvicultural systems. Black spruce diameter growth is influenced by tree and stand-level variables such as spatial position in a stand, distance relative to skidding trails, competition, growth prior to cutting, diameter, and tree age [
7,
8,
9]. In response to silvicultural systems, Groot and Hokka [
10] demonstrated that in uneven-aged black spruce stands, the average diameter growth of advance regeneration responds positively over a 10-year period following a regeneration harvest, peaking at 10 years and slowly declining to near pre-harvest levels. Black spruce individual diameter growth has also been shown to respond favorably to a variety of silvicultural treatments, including thinning, shelterwoods, and partial selection cuts [
7,
8,
11].
An important damaging agent in black spruce forests in the Lake States is eastern spruce dwarf mistletoe (
Arceuthobium pusillum Peck), which is present in 12% to 55% of black spruce stands in Minnesota [
12]. Dwarf mistletoe in black spruce stands affects both tree growth rates, and its presence thereof influences the selection of silvicultural systems used. Mistletoe greatly reduces growth, and eventually leads to the mortality of infected trees [
1,
12,
13,
14], resulting in volume losses of 14% to 30% over the course of a rotation [
15,
16]. Recommended management options for the control and eradication of the disease typically involves clearcutting with a buffer strip around known infections, and to avoid selection methods or other silvicultural systems with reserves [
1,
12,
17,
18,
19].
While there has been continued research on black spruce stand development and growth in Canada, these recent studies may not be directly comparable to black spruce forests of the Lakes States region, due to different precipitation and temperature extremes and norms. There are few studies in the region in black spruce silviculture and growth and yield over the last 40 years. Previously, in the mid-20th century, there was considerable work exploring the impacts of alternative silvicultural systems on growth and yield [
6,
14,
20,
21]. Similarly, yield tables published by the US Forest Service in 1971 are commonly used today [
6], but they have not been evaluated across a range of silvicultural systems.
Diameter growth is one common metric that is used to quantify the growth of managed forest stands [
22,
23]. Understanding individual tree diameter growth is important for land managers to assess how changing environmental conditions influence future productivity. Individual tree diameter increment models are used in many forest modeling systems, notably, the US Forest Service Forest Vegetation Simulator (FVS) program [
24]. Work by Deo and Froese [
25] to improve model fitting for large-diameter trees is currently being transitioned into use in FVS [
24]. Despite this work, little is known about the long-term effects of silvicultural treatments on black spruce diameter growth.
The goal of this research is to develop and evaluate black spruce diameter increment models across a range of silvicultural systems in northern Minnesota, USA. The specific objective is develop and assess the performance of non-linear fixed- and mixed-effects models to predict 10-year diameter growth in lowland black spruce under a variety of silvicultural treatments and across a range of tree- and stand-level conditions.
3. Results
A large range of stand conditions at the plot level—both before (
Table 1) and after (
Table 2) the initial treatment—and individual tree level (
Table 3) existed in each treatment. However, stand conditions prior to initial treatment were not significantly different among treatments (degree of freedom, df = 6,
p > 0.05).
Model fitting for the GNLS and NLME equations resulted in six fixed effects, as shown in Equation (2).
After fitting the GNLS model, nested random effects were added in fitting the NLME model. Plot nested within the compartment nested within the treatment resulted in the best model fit (AIC: 19,258) (Equation (3)). The final NLME model improved the coefficient of determination (
R2) by 51% from 0.2056 to 0.3114 over the GNLS model. The RMSE decreased 10% from 0.6772 to 0.6104 cm. Parameter estimates and their standard errors are in
Table 4. Fit statistics for the final 10-year diameter growth models are in
Table 5 and
Table 6. The final mixed effects model form was:
where
is a unique intercept term added to
for each plot nested within the compartment and treatment.
Refitting the model of Deo & Froese resulted in all but two of their independent variables being used to predict diameter increment (Equation (4)). The variables
and
were not significant to the model:
The NLME model outperformed the refit model of Deo & Froese, resulting in an R2 value that was 230% higher (0.3113 vs. 0.1352) and a lower RMSE (0.6104 vs. 0.6849). The GNLS model saw mixed results, with an adjusted R2 value of 0.2047 and a lower RMSE than the refit Deo & Froese model (0.6773).
The NLME model was much better in predicting the diameter growth over the refit Deo & Froese model across all treatments (
Table 5). The overall mean bias of the NLME model was 0.0054 cm, compared with −0.1469 cm for the Deo & Froese refit model. The Deo & Froese refit model underestimated diameter growth consistently across all treatments. The mean of the NLME model-predicted diameter growth was nearly identical to the observed growth, at 1.536 cm, compared to the observed growth of 1.539 cm over 10 years, while the Deo & Froese refit model averaged 1.357 cm (
Table 5).
For individual treatments, RMSE for the NLME model was the smallest in the two clearcut (0.5932 and 0.5490 cm) and thinning treatments (0.5697), and largest in the shelterwood treatment (0.8345 cm). The mean bias was the smallest in the group selection method (−0.0018 cm) and largest in the thinning treatment. The model overpredicted diameter growth slightly in the shelterwood and clearcut methods, and underpredicted diameter growth in the selection methods and the thinning (
Table 5).
4. Discussion
Ten-year diameter growth varied between treatments. The shelterwood treatment had the greatest diameter growth, likely a factor of it benefiting from increased available resources, due to having the lowest residual BA and TPA of all treatments after the initial treatment (
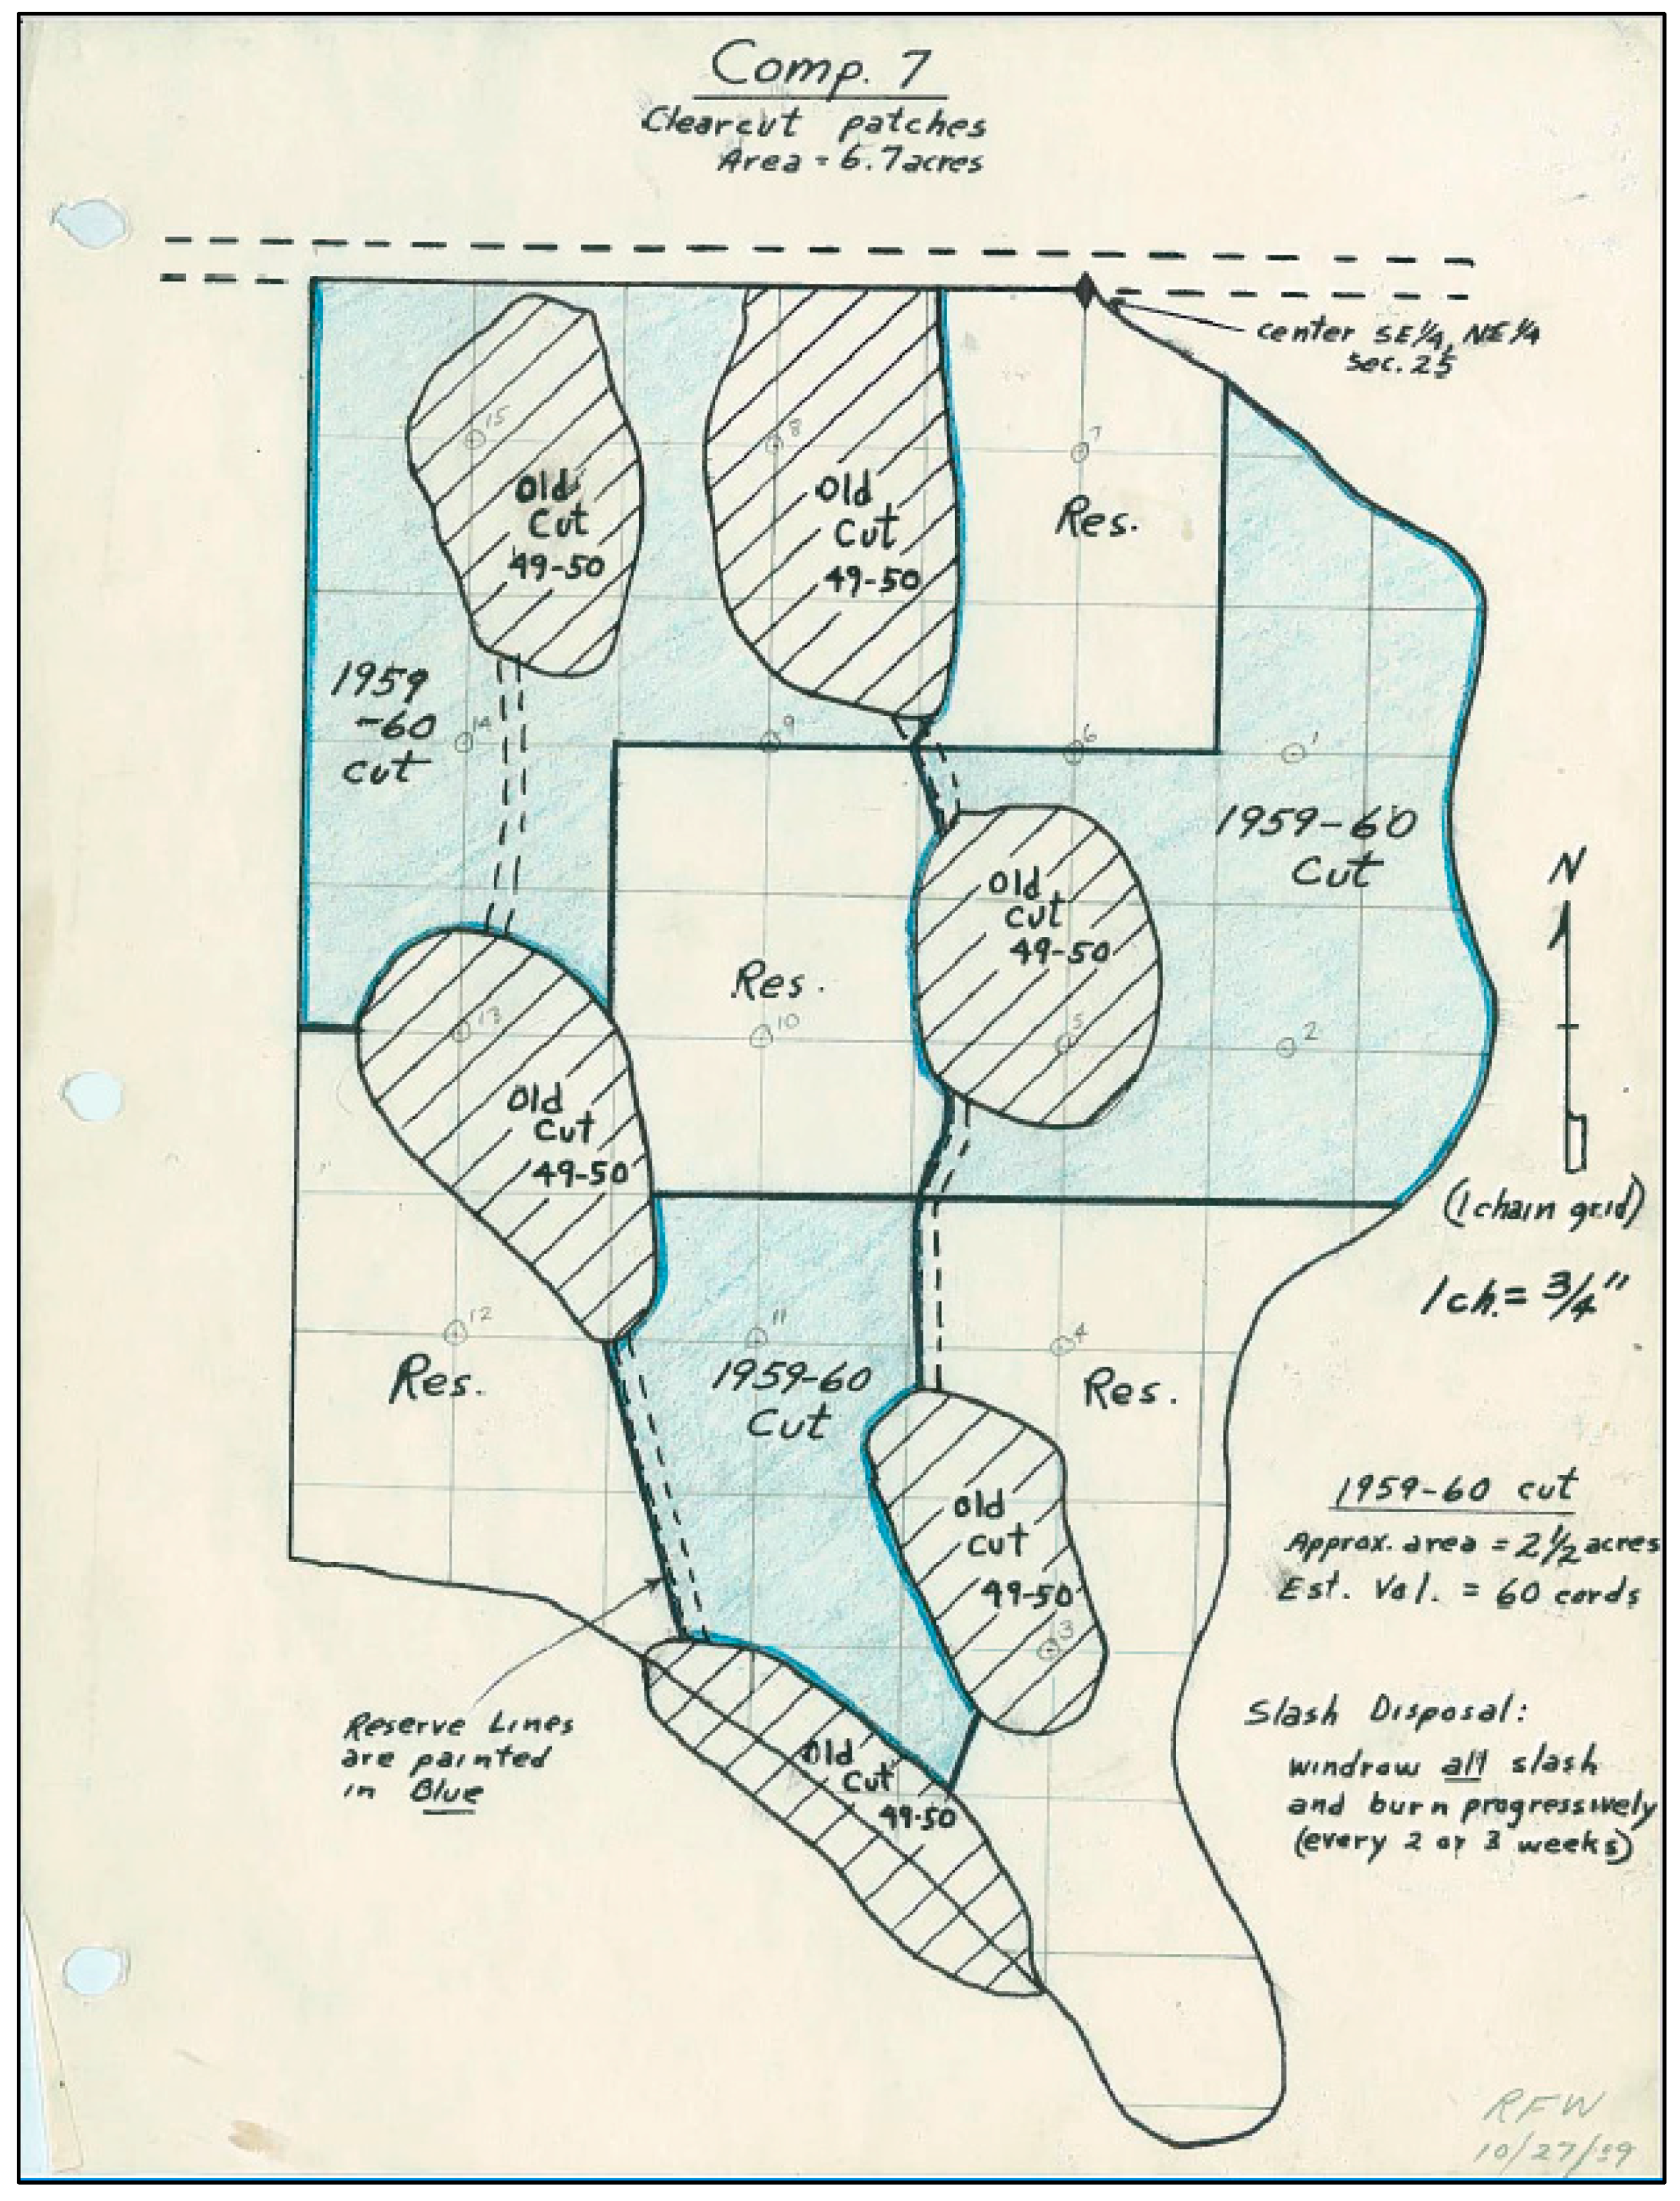
Table 3). The higher intensity of cutting resulted in greater growing space for residual trees in this treatment. Both selection treatments had the next highest average diameter growth, and they correspondingly had the next lowest residual BA. This pattern continued for the thinning treatment. Notably, plots that were re-measured in 1960 in the clearcut treatments were those that were not harvested in the initial 1950 treatment. Plots in patches or strips that were harvested were not re- measured, due to the immature size class of regeneration. The harvest area during the initial treatment in the clearcut strips or patches may have been as close as a few meters from trees on the outer portions of unharvested plots, based on the visual evidence of treatments and the cutting cycles of the experiment (
Figure 1). Girona et al. [
8] documented that trees at the edge of skidding trails showed significantly increased growth compared to trees in the interior of a stand. In future studies, location relative to harvest strips and patches could be assessed for their impact on diameter growth.
We adapted the Hann [
22] model in as simple a matter as possible using two frameworks. First, we manually added basic variables (e.g., initial diameter), and progressed by adding more complex variables (
Table 4). Second, we used AIC to balance the model performance with the model complexity. Fitting the diameter growth model by adapting the model of Hann [
22] and manually adding variables resulted in fit statistics (
R2 and RMSE) that were comparable to other modeling studies of diameter growth [
22,
23,
25,
32]. Using the power variance structure by weighting the variance for trees with larger diameters was effective in overcoming the non-constant variance to reduce the bias introduced by large trees. Stand age was tested as a possible independent variable, but this did not meaningfully reduce AIC. Age was not a factor in previous fittings using this model [
22,
32], or in Subedi and Sharma’s [
23] model fitting for black spruce in Ontario, Canada. Additionally, including age as a predictor variable may limit the model’s applicability to stands where age is not measured or are uneven-aged.
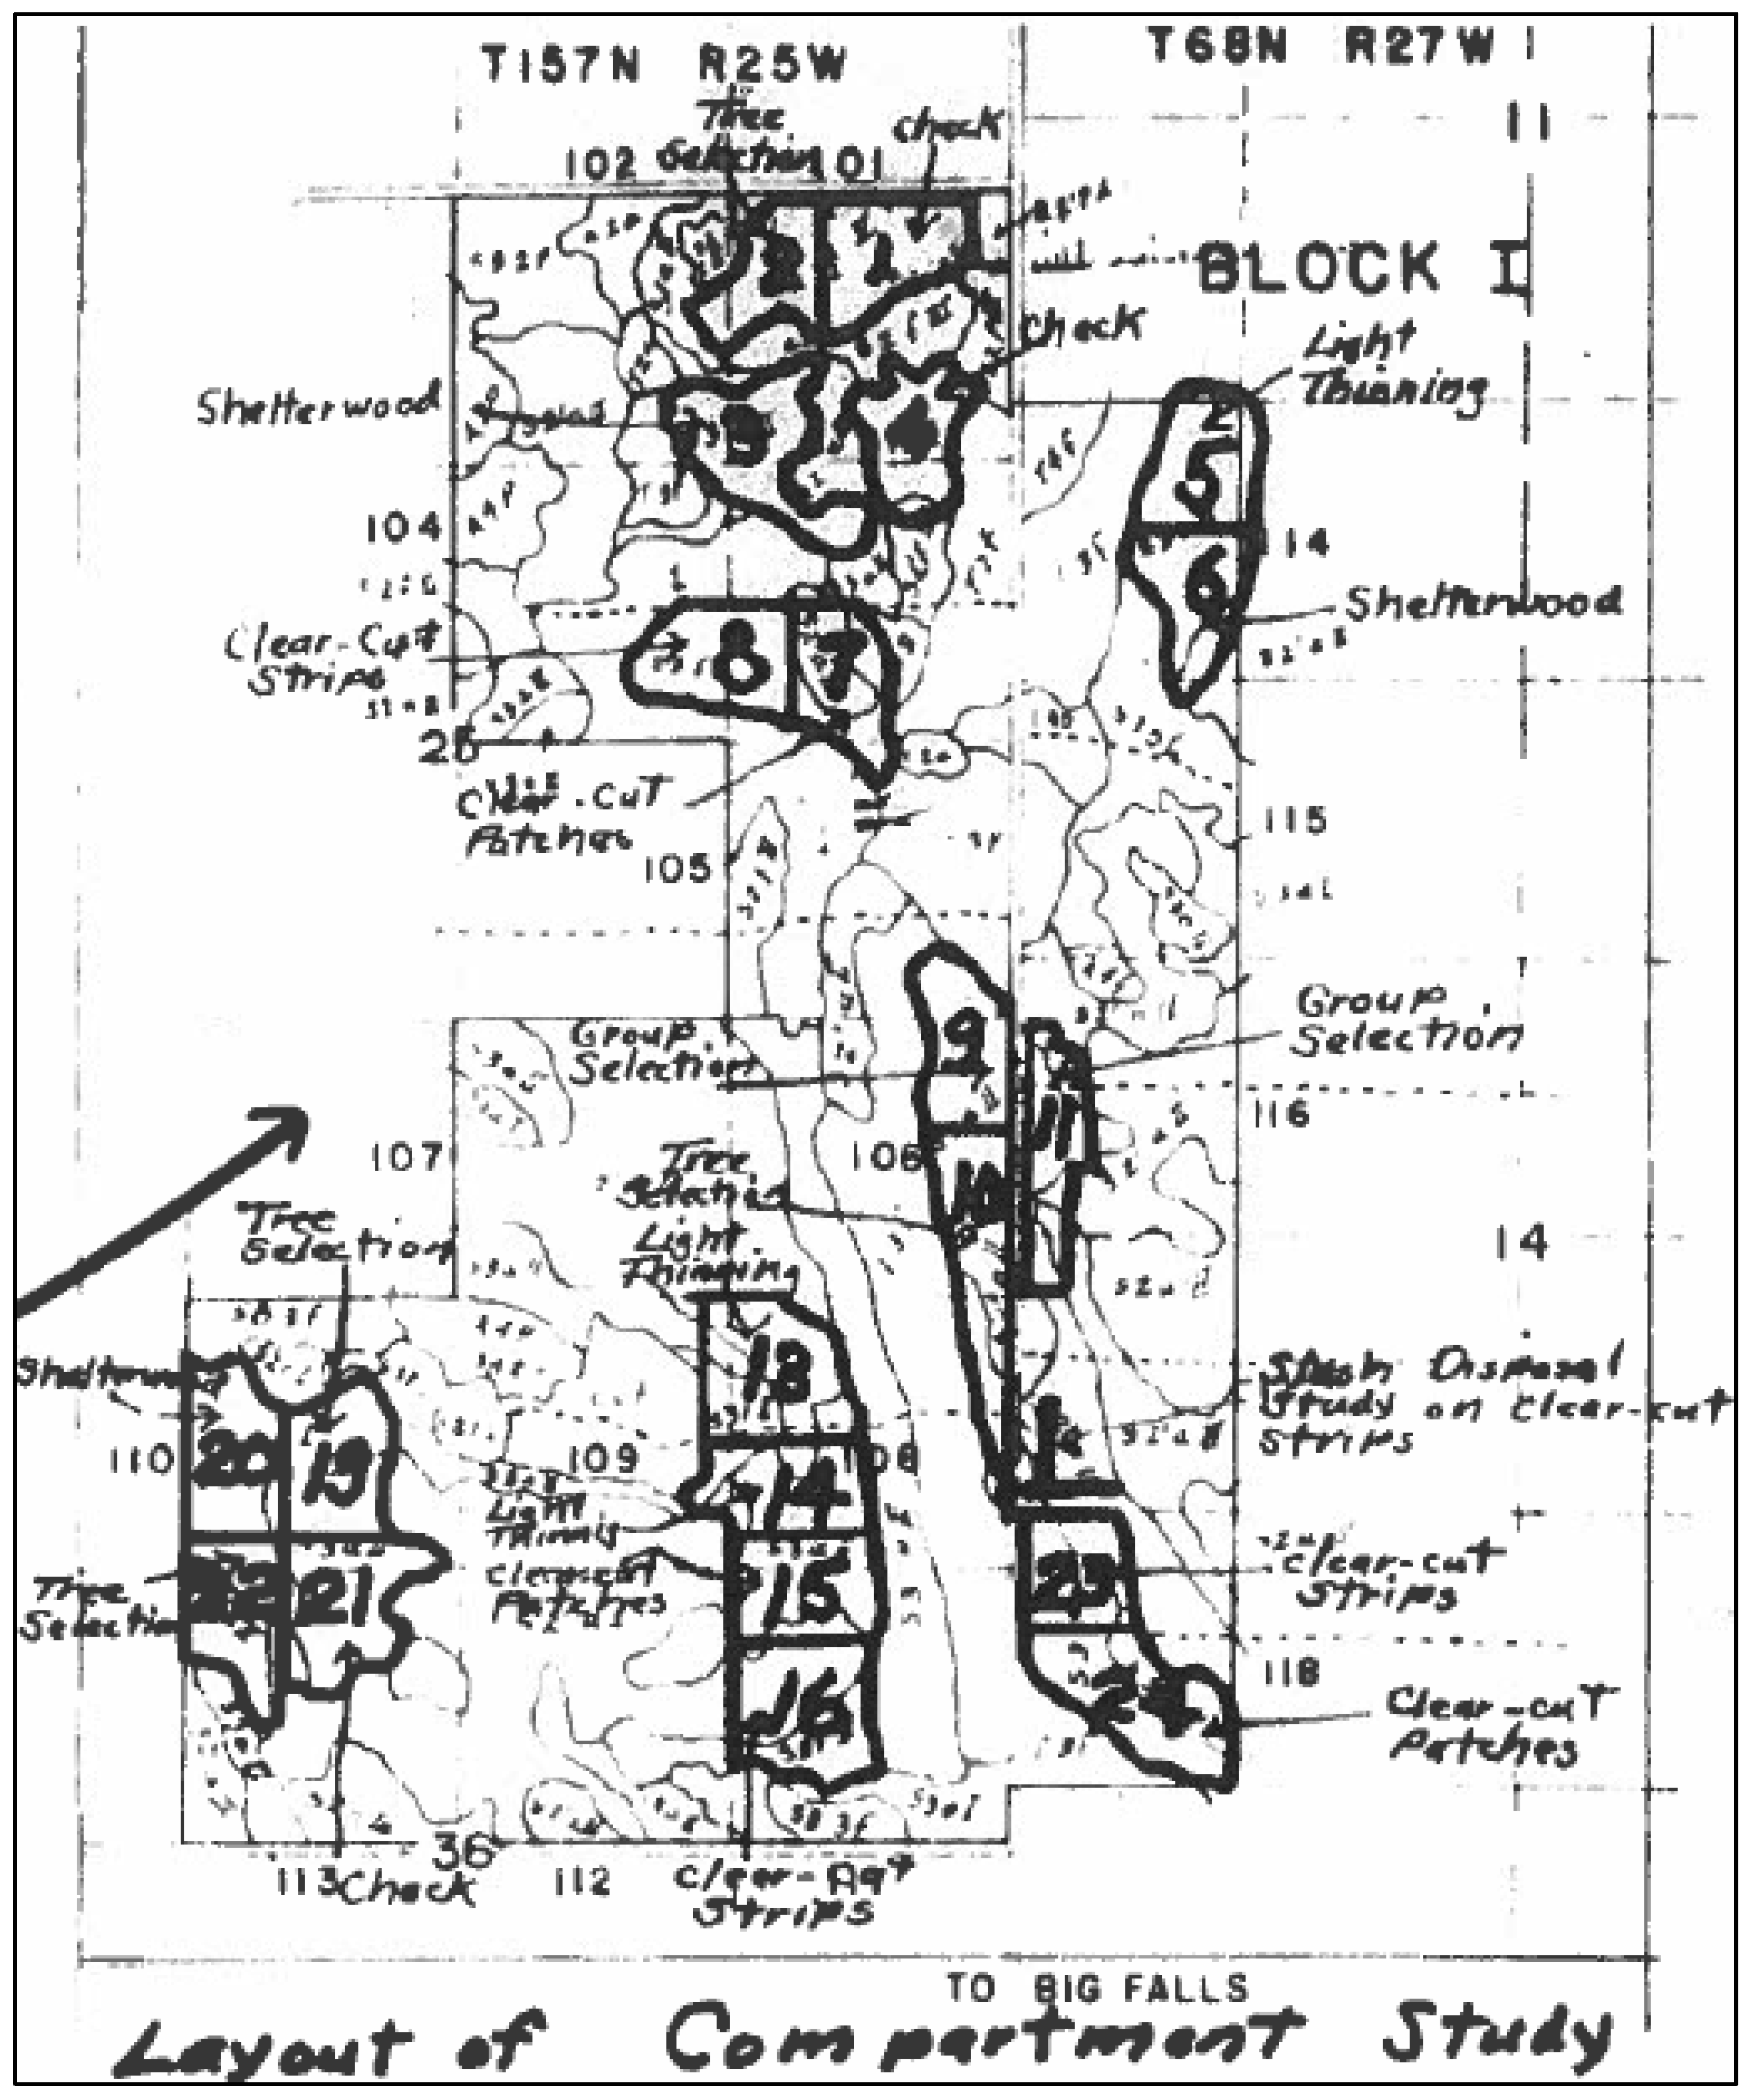
Adding random effects (i.e., the NLME model) after fitting the model with all fixed effects (i.e., the GNLS model) was successful in improving the model performance, likely due to the variety of stand conditions in lowland black spruce. The method of first adding the treatment, and then the compartment nested within treatment, and finally the plot nested within the compartment nested within the treatment, was logical in terms of sequentially increasing the model complexity. Adding the compartment as a nested random effect with treatment was particularly effective in improving the model performance through reducing AIC. Compartments ranged in size from 2.3 to 3.8 hectares, and they were located within about two kilometers of one another. However, black spruce can grow on a variety of sites with characteristics that can change even over short distances, including on this study. Site and environmental factors that were not measured, such as peat depth, water table level, soil moisture, or pH may help explain the additional variability that is not captured in the model [
19,
37]. This could explain the success of adding random effects at any level (i.e., treatment, compartment, and/or plot).
The NLME model outperformed the refit Deo & Froese model across treatments, and the model performance varied slightly by treatment. The higher RMSE in the shelterwood and selection treatments likely points to the difficulty in predicting the diameter across treatments that experience patchy residual areas. The shelterwood treatment aimed to leave healthy and vigorous trees, while the group and individual tree selection methods aimed to result in uneven-aged stands. The subjective nature of cutting rather than a systematic treatment, as in the clearcut treatments, likely resulted in the patchy distribution of residual trees, and variable resources.
This modeling approach fits a single growth model to all diameters in the dataset (9.1–32.5 cm), which may be more appropriate than fitting two models for large and small trees. The work by Deo & Froese [
25] refit the large tree diameter growth equations (trees greater than 12.7 cm) used in the Lake States Variant of FVS. The FVS framework models diameter growth differently for large and small trees (those below 12.7 cm DBH, and those equal to or greater than 12.7 cm). Fitting a single growth model for black spruce and other slow-growing species that attain smaller diameters may be advantageous over the current approach in FVS. The diameter growth curve (
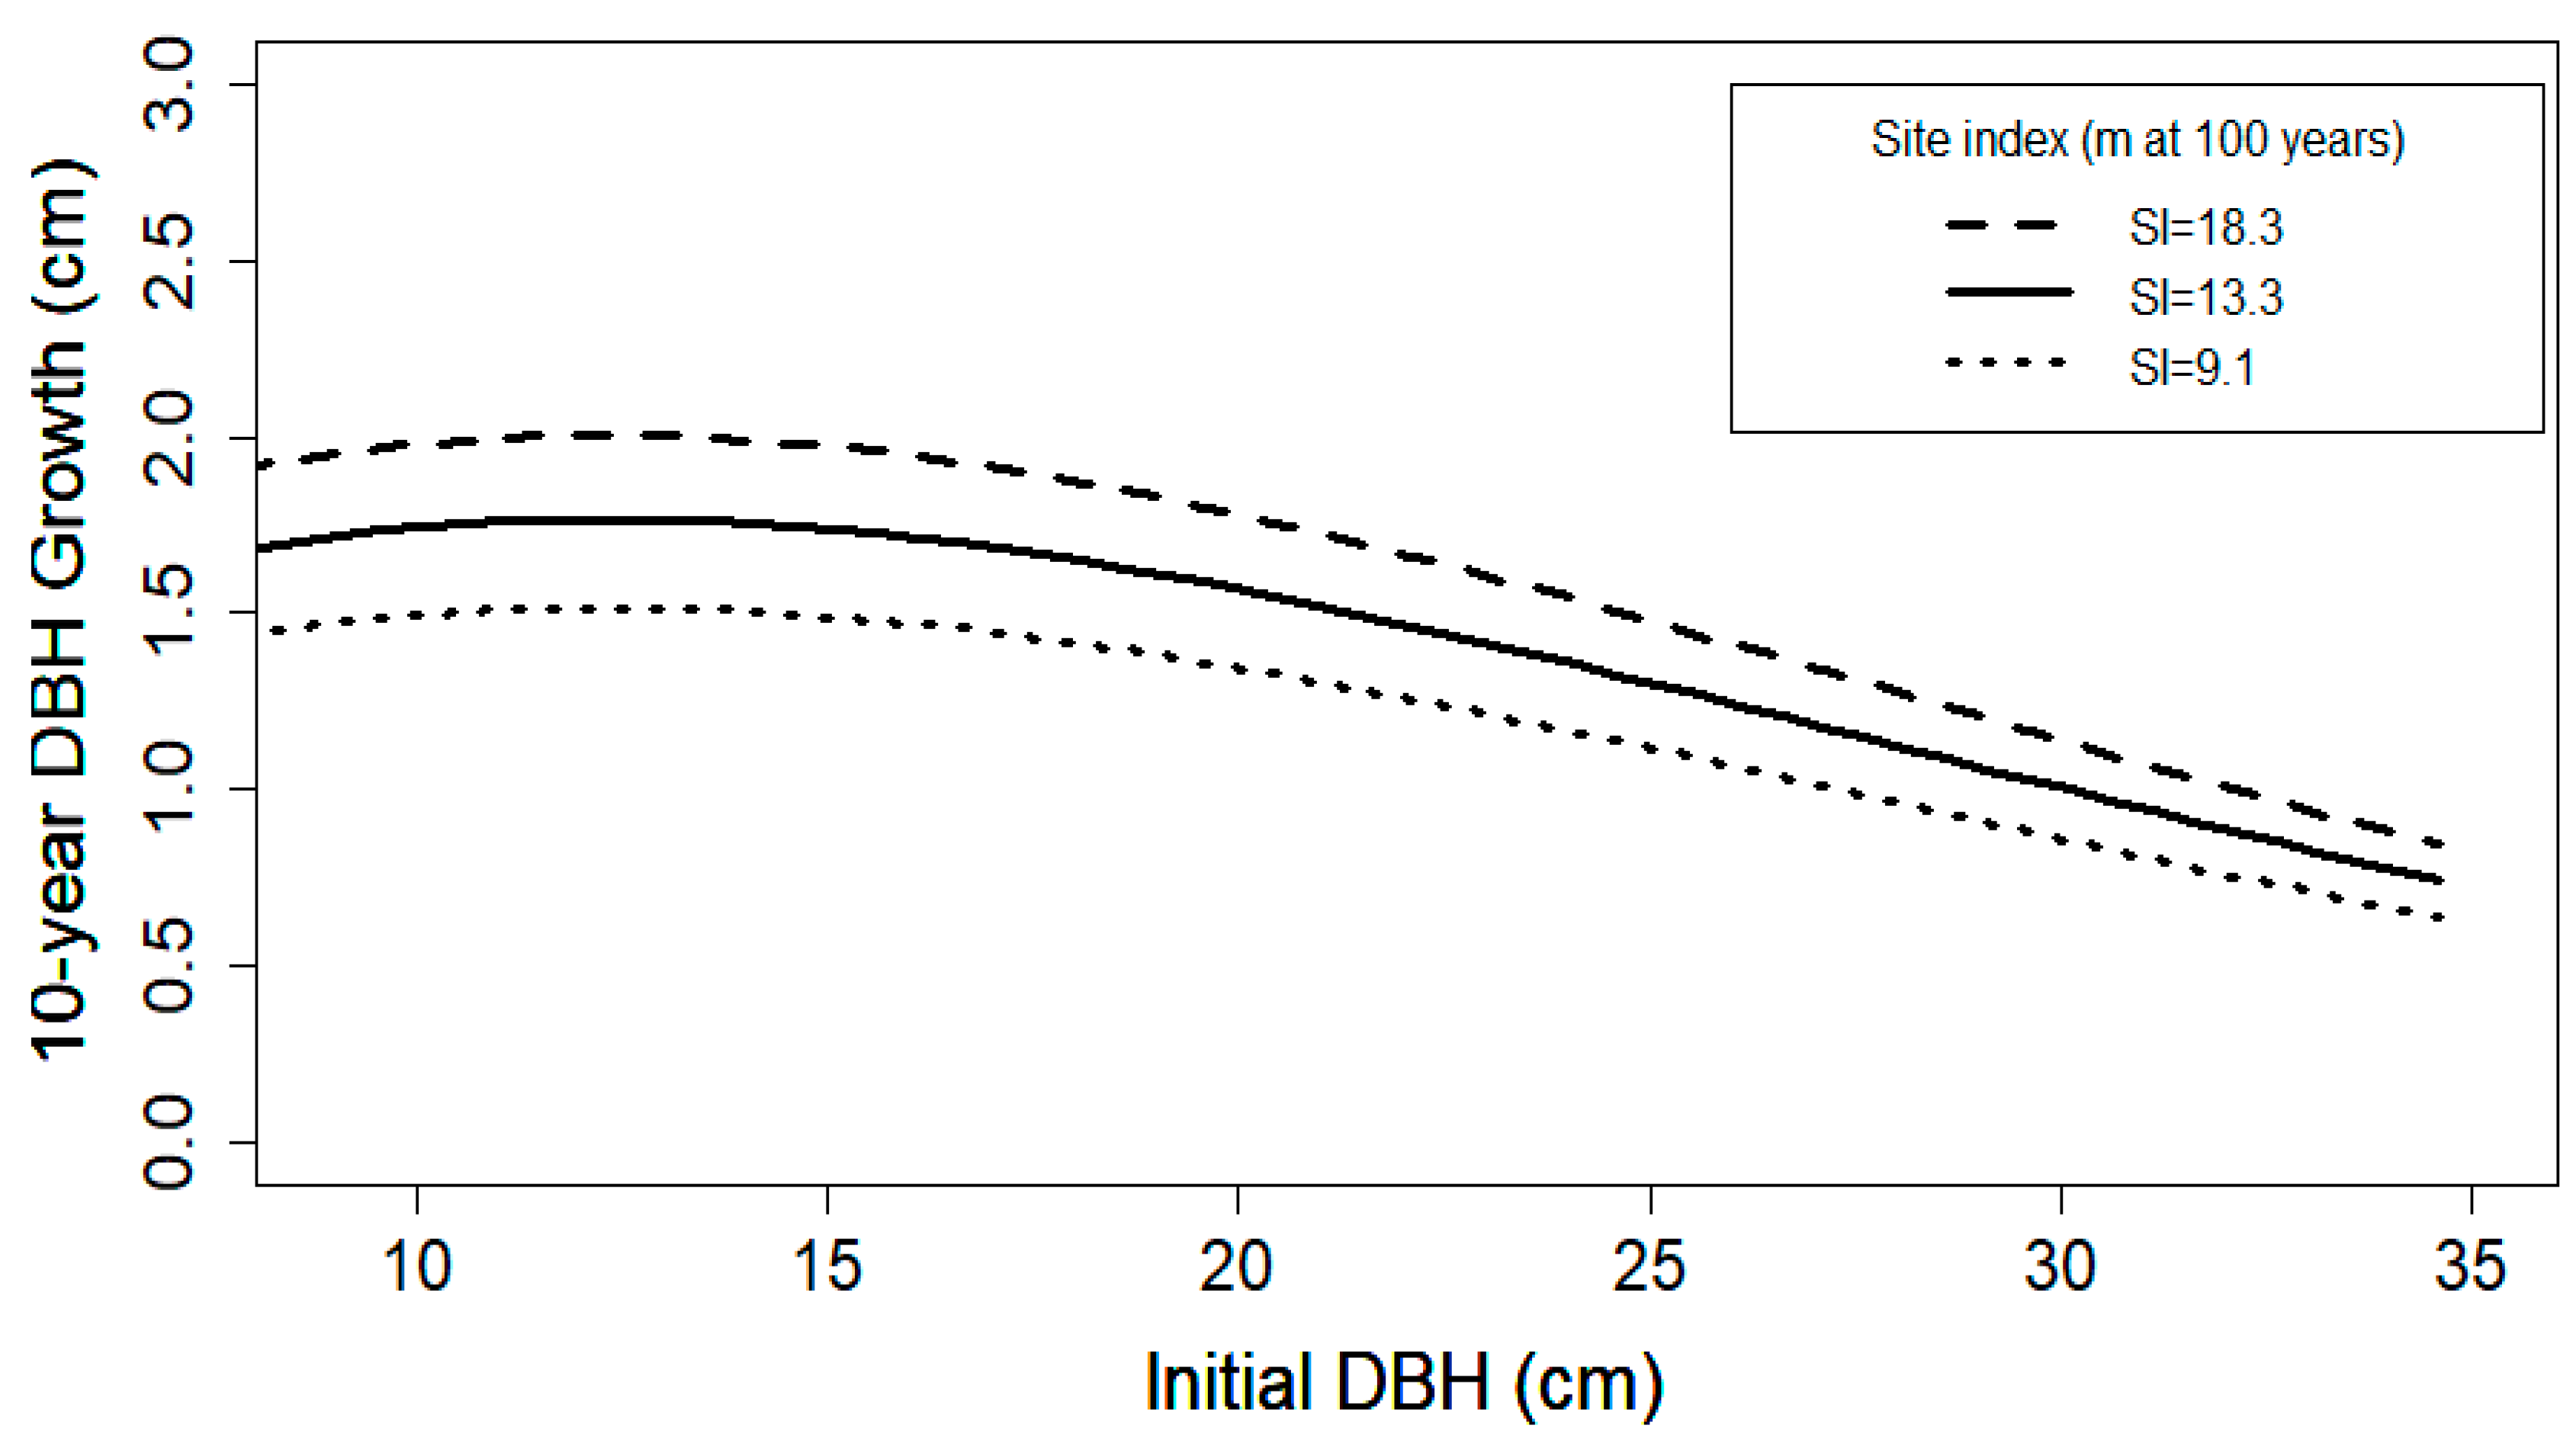
Figure 3) under average stand conditions shows that diameter growth in peatland black spruce peaks around 12.7 cm. Since black spruce grows under a variety of site conditions, and maximum sizes vary largely, depending on those conditions, having separate equations for small and large trees with a transition near the peak of diameter growth for a species may not be ideal. Additionally, FVS diameter increment models for large and small trees were originally developed for the Intermountain West, where average and maximum diameters for tree species are generally greater than that of Lake States species. Fitting separate equations with a breakpoint diameter of 12.7 cm in those geographic regions may be more appropriate than in the Lake States, particularly for species with smaller maximum diameters, like black spruce.
It is important that diameter growth models used by managers are applicable to the conditions where they are applied. This is of particular important in lowland black spruce in the Lake States, where the cover type tends to grow in pure stands, and growing conditions vary widely depending on its location and proximity to its range edges [
1]. Understanding how silvicultural systems and stand- and tree-level attributes affect diameter growth and its modeling in varying geographical locations and physiological conditions is critical for managers to be able to accurately model future stand conditions and volumes.
This model fitting resulted in the same variables predicting the diameter growth, as was found with the same model for other species by Hann [
22] and Weiskittel et al. [
31], with the notable substitution of a crown position indicator variable for crown ratios. This substitution seems adequate, given that the crown ratio was not measured in the original study. While crown ratio as an absolute measure would be a more accurate portrayal of a tree’s crown than the subjective measure of crown class, crown class may provide an alternative measurement to the crown ratio. This is of particular relevance in black spruce peatlands, where visibility in the canopy can be low, due to dense crowns and high stand densities.
The signs and values for both the GNLS and NLME models matched biological expectations for diameter growth. Positive coefficients occurred with log(DBH + 1), log(SI − 1.37), and the crown position dummy variable, indicating diameter growth, was positively correlated with these variables. Diameter growth was negatively correlated with BA
1/2, DBH
2, and
. Notably, DBH growth is strongly positively correlated with log(DBH + 1), and negatively correlated with DBH
2, showing that black spruce individuals with particularly large initial diameters will grow more slowly than trees with smaller diameters. This is evidenced when examining diameter growth in average stand conditions using the NLME parameters (
Figure 3).
One important factor in black spruce growth that was not considered in this study is eastern spruce dwarf mistletoe. While it was not present on the study site, dwarf mistletoe is a prevalent health concern in black spruce forests in Minnesota, and more broadly, in the Lake States, and it considerably slows growth and reduces stand volumes [
15,
16]. Future studies in the diameter growth of black spruce could focus on the effects of mistletoe.


 ,
, 
