Tree-Ring-Recorded Drought Variability in the Northern Daxing’anling Mountains of Northeastern China

Forestry College, Beijing Forestry University, Tsinghua East Road No. 35, Haidian District, Beijing 100083, China
*
Author to whom correspondence should be addressed.
Forests 2018, 9(11), 674; https://doi.org/10.3390/f9110674
Submission received: 25 July 2018
/
Revised: 16 October 2018
/
Accepted: 23 October 2018
/
Published: 27 October 2018
(This article belongs to the Section Forest Ecology and Management)
Abstract
:We developed two tree-ring width chronologies of Mongolian Scots pine (Pinus sylvestris var. mongolica) from the low elevation forest of the northern Daxing’anling Mountains of Inner Mongolia. Although the two chronologies come from different sampling sites, significant correlations existed among the chronologies (r = 0.318), and the first principal component (PC1) accounted for 65.9% of total variance over their common period 1792–2016. Climate-growth correlation analysis revealed that the previous June and July Palmer drought severity index (PDSIp6-7) was the main climatic factor controlling tree-ring growth. Using a linear regression model, we reconstructed the PDSIp6-7 for the past 225 years (1792–2016). The reconstruction satisfied required statistical calibration and validation tests, and represented 38.6% of the PDSI variance recorded by instruments over the period 1955–2016. Six wet and five dry periods were revealed during these 225 years. The drought of 1903–1927 was the most severe drought in the study area in the last 225 years. Comparison with other tree-ring-based moisture-sensitive sequences from nearby regions confirmed a high degree of confidence in our reconstruction. The results of a spatial climate correlation analysis with a gridded PDSI dataset revealed that our reconstructions contained strong regional drought signals for the southern Stanovoy Range and the northern Daxing’anling Mountains. The power spectrum revealed the existence of significant frequency cycles, which may be linked to large-scale atmospheric-oceanic variability, such as the El Niño-Southern Oscillation, solar activity, and the North Atlantic Oscillation.
1. Introduction
Drought is a recurring extreme climate event over land characterized by below-normal precipitation over a period of months to years [1]. Studies indicate that in recent decades, drought events have increased in intensity and frequency in response to global climatic changes, particularly in the heavily populated areas of monsoonal Asia [2,3]. Severe drought events have disastrous impacts on human society and economy, as well as on natural ecosystems, particularly in arid and semi-arid regions, and have led to numerous environmental problems [1,4]. Northeast China is located at the higher latitudes of the eastern end of the Eurasian continent (between 120° and 135° N and 38° and 53° E), geographically encompassing four provinces (Liaoning, Jilin, Heilongjiang, and a part of Inner Mongolia), and covers a total area of 152 × 104 km2. This region is among the most sensitive and vulnerable to climate change compared to other zones due to its relatively cold climate [5,6]. In recent decades, i.e., since the 1950s, severe drought events associated with global warming have been recorded in the region [7]. Northeast China is also an important grain-producing area, and drought poses a severe threat to agricultural development, thereby putting future agricultural production at risk. Furthermore, consistently high temperatures and frequent droughts can increase the risk of forest fires. Therefore, to evaluate the intensity and frequency of drought events and to improve our understanding of the historical climatic regimes and the behavior of monsoon circulation, it is important to obtain long-term records of past climatic variations, which enables us to view recently observed climatic changes from a long-term historical context. However, the short-term meteorological records in the region, since the 1950s, have limited our understanding of the long-term regime of past droughts history. It is, therefore, essential to develop high-resolution proxy records for northeast China.
Tree-ring analysis is often used in long-term paleoclimatic reconstructions because of the wide distribution of data, length of data, and ability to accurately date annual variability [8,9,10,11,12]. Although numerous tree-ring-based paleoclimatic reconstructions are available for China [8,13,14], compared with other regions, such as the Tibetan Plateau [15,16], the Qinling Mountains [17,18], the Tianshan Mountains [19,20], and southeastern China [21,22], long-term paleoclimatic records are still relatively sparse for northeast China. In this context, an improved tree-ring network, comprised of denser spatial coverage and a longer time span, is urgently required for this region.
The Daxing’anling Mountains are located in northeastern China, and extend over 1220 km south–north and 200–300 km east–west, with a total area of approximately 106,575 km2. The Mountains represent the watershed of the Inner Mongolia Plateau and the Songliao Plain. Liu et al. [23] reconstructed precipitation for the Hailar region for the period 1865–2003, Zhang et al. [24] reported a reconstruction of fluctuations of mean temperature from May to October for the northern Greater Higgnan Mountains for the period 1717–2008, and Zhang et al. [25] developed a series of 285-year precipitation variations (August–July) during the period 1724–2008 for the Mohe region in the northern Greater Higgnan Mountains. Although a few dendroclimatological reconstructions have been developed for the region [3,23,24,25], most of them have focused on temperature [24,26,27] and precipitation [3,23,25]. However, to date, there have been few studies reconstructing drought variations and exploring dynamics of drought variability at the northern Daxing’anling Mountains using tree-ring records [28], which severely limiting our understanding of long-term dry/wet variations in this area.
Mongolian Scots pine (Pinus sylvestris var. mongolica), an economically important conifer species, has been used in previous dendrochronological reconstructions in Daxing’anling Mountains [23,25,28]. However, these reconstructions cover a relatively short time interval, and do not include drought records in the region. To better understand the drought history of northeastern China, it is important to extend the time span of annual climate information extracted from tree-rings. Here, we present a 225-year reconstruction of annual PDSI using tree-ring chronologies from the northern Daxing’anling Mountains to identify the past drought variation regime and the potential driving mechanisms.
2. Materials and Methods
2.1. Study Area and Tree-Ring Core Sampling
The study area is located in the Daxing’anling Mountains of the Inner Mongolia autonomous region (47°3′40″–53°20′35″ N, 119°36′20″–125°19′50″ E), situated in northeastern China near the border with Russia (Figure 1). The Daxing’anling Mountains stretch over two provinces: Heilongjiang in the east and Inner Mongolia in the west. The area represents a transitional zone from semi-arid to arid conditions, and from Asian monsoon to non-monsoon climates. The climate is a typical subfrigid continental climate with cold winters, windy and dry springs, warm and wet summers, and cool and frosty autumns (Figure 1). The nearest meteorological station is in Mohe. The annual mean temperature from 1959 to 2015 is −4.2 °C. The coldest month is January (mean temperature of −29.6 °C), and the warmest month is July (mean temperature of 18.5 °C). Mean annual precipitation is 474.9 mm, of which about 73.7% occurs between June to September. The growing season is defined as June to August. According to the Chinese classification system, the substratum is predominantly brown coniferous forest soil. Dahurian larch (Larix gmelinii Rupr.) is the dominant primary forest species, accounting for roughly 60% of the total forestland, associated with Betula platyphylla, Populus davidiana, and Pinus sylvestris var. mongolica. The shrub layer mainly includes Rhododendron dahuricum and Ledum palustre, among others.
We sampled the species P. sylvestris, which is widely distributed on the Mongolian Plateau and the Daxing’anling Mountains [25]. It often reaches a height of 20 m, and usually lives for more than 150 years. In late July 2017, tree-ring cores were collected in Mangui Town of Genhe City, which is administratively affiliated with Hulun Buir City, Inner Mongolia autonomous region. Tree sampling was performed in two sites, the Hexi Forest Farm (HXL; 52°12′21.18″ N, 122°14′49.22″ E; 739 m a.s.l.) and the Ningcui Mountain Park (NCS; 52°02′40.47″ N, 122°06′02.75″ E; 789 m a.s.l.). The linear distance between the two sampling sites was 20.7 km. The sites were open stands with no evidence of fire or insect disturbances. Table 1 provides details of the sites and sampled trees. To minimize noise caused by non-climatic factors, only healthy overstory trees were included. In general, using an increment borer, one core from each tree was extracted at breast height (1.3 m above ground). To exclude the influence of reaction wood, the cores were mainly sampled in directions perpendicular to the slope. In total, we selected 66 increment cores.
2.2. Tree-Ring Width Chronology Development
The cores were transported to the laboratory and air-dried prior to mounting and sanding; all samples were prepared following standard dendrochronological techniques [29]. Tree-ring widths were measured to 0.01 mm, using a LINTAB™ 6.0 measuring system. The COFECHA program was used to verify the accuracy of cross-dating [30]. Cores with abnormal ring features, such as missing rings or indistinct boundaries, which are usually difficult to cross-date, were excluded; thus, a total of 50 cores were retained for final analysis. To remove non-climatic and tree-age-related growth trends, tree-ring width series were detrended prior to standardization, using ARSTAN [31] and a cubic smoothing spline with 50% frequency-response cutoff at 2/3 of series length (Figure 2). The ARSTAN program produced three kinds of chronologies: standard (STD), residual (RES), and autoregressive (ARS). The two chronologies are correlated significantly with each other (r = 0.318, p < 0.001, n = 225). According to the principal component analyses (PCA), PC#1RW accounts for 65.9% of the total variance. The SSS method (subsample signal strength), introduced by Wigley et al. [32], was adopted to ascertain the reliable starting year of the chronology, excluding the early period with low sample size. The generally acceptable threshold of the SSS was consistently greater than 0.85 from 1824 to 2016, affirming that this is a reliable period. However, although the SSS value (0.80) from 1792 to 2016 was below 0.85, it matched a minimum sample depth of five trees in this segment. It is extremely important to extend the reconstruction tree-ring width chronology as much as possible, because of the insufficient long paleoclimate reconstructions in this area. Therefore, we kept this part, from 1792 to 2016, to be used in the reconstruction. In addition, the PC#1RW was used in subsequent analyses to obtain more low- and high-frequency signals.
2.3. Climate Data
Climate data from the Mohe meteorological station (433.0 m a.s.l., 52°58′ N, 122°31′ E, 1959–2015) were used for climatic correlation analyses (Figure 3). This station is closest to the sampling points (113 km distant). Climate data were provided by the China Meteorological Data Sharing Service System (http://cdc.cma.gov.cn/). The global Palmer drought severity index (PDSI) dataset, updated by Dai et al. [33], has a resolution of 2.5° × 2.5°, spanning 1955–2016, and the geoposition of the nearest grid to our study area is 122.5°–123° E/52.5°–53° N, downloaded from the Royal Netherlands Meteorological Institute (KNMI) climate explorer (http://climexp.knmi/nl). In addition, data reflecting large-scale climate patterns, such as El Niño-Southern Oscillation (ENSO) and North Atlantic Oscillation (NAO) indices [34,35], were also downloaded from the KNMI climate explorer website.
2.4. Statistical Analysis and Climate Reconstruction
To assess the common growth forces between the individual sites, the PCA was applied over the common period of the chronologies. To understand how climatic factors affect tree growth in the study area, Pearson’s correlation function analysis was used to identify the relationship between tree-ring width and climatic variables. To further confirm this relationship, we calculated the first-order difference between tree-ring width and monthly climatic factors. To explore the stability of climate-growth relationship in our study, the 21-year moving correlation analysis between tree-ring width and the observed PDSI was conducted during 1955–2016. Subsequently, a simple linear regression model was used to reconstruct the past climate change history. To test the stability and reliability of the reconstructed climatic parameters, considering the short time span of the climate record, the leave-one-out cross-validation method was adopted [36]. We calculated Pearson’s correlation coefficient (r), sign test (ST), reduction of error (RE), product mean test (PMT), and root mean square error (RMSE) to assess the performance of the transfer model (Fritts, 1976). The reduction of error statistic (RE) was calculated to test for skill of reconstruction compared with that of a simple model that would use the calibration period mean of observed PDSI as the reconstruction. An RE value of greater than zero is considered positive skill [37]. The RMSE was used to estimate reconstruction uncertainty [37].
To explore how well the reconstructed PDSIp6-7 captures the spatial hydroclimatic signal in the northern Daxing’anling Mountains, spatial correlation patterns were investigated between the reconstructed/instrumental PDSIp6-7 and Climate Research Unit (CRU) TS3.23 gridded PDSI data through http://climexp.knmi.nl over the period 1955–2016. The reconstructed PDSI series was also compared with four moisture-sensitive reconstruction series in nearby areas, to verify its reliability during the past 225 years, including an October–September precipitation reconstruction in southern northeast China and the northern Korean Peninsula [38], an August–July precipitation reconstruction for the Mohe region in the northern Daxing’anling Mountains [25], an August–June precipitation reconstruction for the forest–steppe ecotone in northern Inner Mongolia, China [3], and a drought reconstruction from the same PDSI grid, derived from the Monsoon Asia Drought Atlas (MADA) from Cook et al. [39]. To highlight low-frequency drought signals, a 20-year fast Fourier transform (FFT) low-pass filter was applied to these tree-ring based PDSI/precipitation reconstructions. We also applied the multitaper method (MTM) of spectral analysis to examine the characteristics of the PDSI reconstruction in the frequency domain [40]. Wavelet analysis was used to investigate periodicities of the reconstructed series, and to examine how periodicities may have changed through time [41]. Furthermore, the wavelet coherence analysis was also adopted to analyze the relationships between the PDSI reconstruction and the ENSO index, the number of sunspots, and the reconstructed NAO index. The 5% significance level against red noise is shown as a thick contour. The relative phase relationship is shown as arrows (with anti-phase pointing left, in-phase pointing right). Further, to investigate the association between extreme events during the instrumental period and the circulation patterns, composites of 500 hPa vector wind composite anomalies (June to July) from the 1981–2010 mean were created, using data from the National Centers for Environmental Prediction—National Center for atmospheric research for the extreme dry and wet years of the reconstructed temperature (n = 10) in the period from 1948 to 2018.
3. Results
3.1. Climate-Growth Relationship
Correlation coefficients between the PC#1RW and the relevant climate factors for the period 1955–2016 are shown in Figure 4. Correlations between the PC#1RW and precipitation showed a significant positive correlation with that of the previous May to July and September and the current January (p < 0.05). However, no significant correlations were found between tree-ring width data and mean temperature (p > 0.05). Therefore, we further analyzed the correlations between radial growth and PDSI on monthly scales, which takes into account temperature and precipitation [33]. Significant (p < 0.05) positive correlations between tree-ring indices and PDSI were found for all months from the previous May to the current September, except for the current August and September (Figure 4c). Significant positive correlations between the PC#1RW and precipitation were identified in previous June to July, and a similar pattern between tree-ring width chronology and PDSI was observed (Figure 4d). On the seasonal scale, the highest correlation occurred between the PC#1RW and PDSIp6-7 (r = 0.620, p < 0.01). These results confirmed that water availability had a significant controlling influence on P. sylvestris growth in this mountainous region.
3.2. Reconstruction PDSIp6-7
The result showed that the relationship between the PC#1RW and PDSIp6-7 was stable during their common period (Figure 5, r = 0.50–0.72, p < 0.01). It indicated that no evident shift occurred between the tree-rings indices and PDSI relationship. Based on the results of the correlation analysis, we reconstructed the PDSIp6-7 for the Northern Daxing’anling Mountains. A transfer function was designed as:
where Y is PDSIp6-7 and X is the PC#1RW. This linear regression equation accounted for 38.6% (37.5% after adjusting for the loss of degrees of freedom) of the PDSIp6-7 variance over the calibration period of 1955–2016. The statistics of R, R2, ST and PMT are all significant at p < 0.05, which indicated that the model was reliable (Table 2). The positive sign of the reduction of error (RE) and the significant ST indicate that the regression model showed a good performance [37]. The PDSI series derived from the model performed well based on verification with observed data, particularly for dry years such as 1961, 1980, 1988, 1993, and 2009 (Figure 6a). To further assess the reliability of the reconstruction, we calibrated the first-order difference (year-to-year changes) of the reconstruction and observation, which explained 32.3% of the total regional PDSIp6-7 variation (Figure 6b). These results indicated that the reconstruction satisfactorily captured both high- and low-frequency variations of PDSIp6-7. Therefore, the regression equation was considered stable and reliable, allowing an accurate reconstruction of the local drought history.
Y = 0.134 + 1.179Xt
(r = 0.620, N = 62, R2 = 0.386, R2adj = 0.375, F = 37.5, p < 0.0001),
(r = 0.620, N = 62, R2 = 0.386, R2adj = 0.375, F = 37.5, p < 0.0001),
3.3. Reconstructed PDSIp6-7 Variation
Using the regression model, the regional PDSIp6-7 was reconstructed for the period 1792–2016 (Figure 6c). The mean value and standard deviation of the reconstructed PDSIp6-7 series are 0.13 and 1.18, respectively. The reconstructed series was further smoothed using a 20-year low-pass filter to highlight the fluctuations at decadal timescales. Wet periods (continuously above average for more than 10 years) occurred in 1792–1807, 1843–1859, 1887–1902, 1928–1942, 1950–1963, and 1991–2006, while dry periods (continuously below average for more than 10 years) were found in 1808–1825, 1832–1842, 1871–1886, 1903–1927, and 1964–1990. The longest dry and wet periods lasted for 27 (1964–1990) and 17 (1843–1859) years, respectively. The dry period, 1903–1927, represented the most severe dry episode over the past 225 years. A value of +1.5 SD above the mean designated an extremely wet year, and an extremely dry year was identified as −1.5 SD below the mean (Figure 6c). In the past 225 years, extremely wet/dry years accounted for 4.4% (10 years) and 6.2% (14 years), respectively.
Instrumental records of PDSIp6-7 in our study area, as well as reconstructed PDSIp6-7 values, correlated significantly with gridded PDSI on a regional scale (Figure 7). Spatial climate correlation analysis, with a gridded PDSI dataset, produced similar fields for the instrumental and reconstructed PDSI series, although correlations were lower for the latter (i.e., reconstructed). The highest correlation fields were confined to the southern Stanovoy Range and the northern Daxing’anling Mountains. These results indicated that our PDSIp6-7 reconstruction represents drought variation for a large territory in northeast Asia. Spectral analysis revealed that the historical PDSI variation in the Daxing’anling Mountains showed several significant (95% confidence level) periodicities at 2.1, 2.4–2.5, 6.8–7.0, and 37.7–42.6 years, which corresponded to significant cycle peaks presented in Figure 8a. Wavelet analysis supports many of the findings of the MTM, which indicated that the most significant cyclicity in PDSI reconstruction has a period of 40 years, with significant power at a period of 11 years during three intervals centered on the years 1860s to 1880s, and 1970s to 2010s (Figure 8b).
4. Discussion
4.1. Climate–Growth Relationship
Based on the correlations between tree-ring indices and climatic factors, we found that tree growth in our study area was negatively correlated with the mean temperature of the growing season of the previous year. Compared to mean temperature, precipitation played a key role in regulating the radial growth of P. sylvestris, as indicated by the high correlations of the tree-ring indices with growing season precipitation of the previous year, which is consistent with earlier findings in Inner Mongolia [3,23,25,42] and other regions of China [28,43]. However, correlations between the tree-ring indices and PDSIp6-7 were higher than those between the tree-rings indices and precipitation (r = 0.615, p < 0.01). Thus, it is not surprising that, because the PDSI is a direct metric of soil moisture conditions, taking both temperature and precipitation into account, this index is a better indicator of drought conditions than the sole element of precipitation records [33]. Thus, it is unsurprising that the monthly PDSI of the previous year had a significant influence on tree growth, due to the well-known lag effect. The reason may be the result of combined effect of previous soil moisture storage, which is crucial for the coming year’s growth, and time lag effect of tree’s response to climate. A similar climatic correlation has also been reported for other arid and semi-arid areas of northern China [14,44,45,46].
In general, higher summer temperatures, coupled with low precipitation levels, accelerate transpiration and soil evaporation and, thus, result in strong moisture stress on tree growth, inhibiting tree-ring growth [12]. This suggests that drought stress can be the main limiting factor of radial growth. In addition, a drought response was also found for Dahurian larch, a dominant conifer tree species in the northern Daxing’anling Mountains [47]. However, the typical drought response to mean temperature was undetected, and the radial growth of P. sylvestris was not significantly negatively correlated with growing season (June–July) temperature. A similar growth-response relationship has also frequently been reported for Inner Mongolia and the vicinity [23,45,46]. Precipitation in the previous and current growth season directly increases soil moisture availability, thereby compensating for soil water loss from evapotranspiration. According to these results, we inferred that tree growth at our sampling sites is mainly influenced by the moisture condition in the growing season. If temperature and moisture of the growing season significantly increase and decrease in the future, respectively, the drying climate may make it difficult for this species to retain its growth in this region, with severe impacts on the regional carbon sequestration capacity.
4.2. Comparisons with Other Precipitation or Drought Reconstructions
As shown in Figure 9, most of the dry/wet periods matched well, and the correlations were all significant at the 0.01 level, but there were still some discrepancies among them, which could be attributed to differences in species and season, as well as to the local influence of different geographic features. The dry period of 1808–1825 and 1832–1842, revealed in our reconstruction, corresponded well with the records we compared [25,38], with the exception of the same period in the forest–steppe ecotone in northern Inner Mongolia [3], which displayed a wet period. In addition, the dry periods of 1871–1886, as reconstructed in the present study, were also observed during a major dry episode in Mohe [25], the forest–steppe ecotone in northern Inner Mongolia [3], and on the eastern Mongolian Plateau [48], although there were differences in the durations of the dry intervals. Interestingly, this dry period was also confirmed by PDSI reconstruction in the Ortindag Sand Land, east Inner Mongolia, near the border with Mongolia [44]. The drought periods of 1903–1927 and 1964–1990, as reconstructed in our study, have also been observed during a major drought episode in other reports at the same time, albeit with significantly lower duration and amplitudes than those in our study area [3,25,38].
These droughts, especially the 1920s drought, were also widespread in the arid and semi-arid areas of northern China, and resulted in a widespread famine and with numerous casualties [3,4,28]. The dry period of 1964–1990 might partly be explained by the weakening influence of the East Asian Summer Monsoon (EASM) on tree growth in our study area. Previous studies have documented that the intensity of the East Asian summer monsoon weakened from the end of the 1970s [23,25,49], further leading to water deficiency in North China. The signal of abrupt changes of the summer monsoon from strong to weak was precisely captured by our reconstruction during the dry period of 1964–1990. In general, the period of June–July is the summer monsoon season, during which the total precipitation accounts for 40% of the annual precipitation in the Mangui region (Figure 3). A strong or weak variability of the EASM is indicated by rainfall to a certain degree. Therefore, it is clear that the amount of annual precipitation in the Mangui region is mainly associated with the fluctuation of the strength of the EASM. The stronger summer monsoon may lead to higher amounts of annual precipitation and vice versa. From this point of view, the abovementioned dry and wet intervals correspond to weak or strong EASM periods, respectively. Overall, these results confirm that our PDSI reconstruction captures the long- and broad-scale regional climatic variations, especially in the low-frequency domain.
4.3. Large-Scale Circulation Analysis
The 2.1-year quasi-cycles may also correspond to the tropospheric biennial oscillation [50] and the quasi-biennial oscillation [51]. In the Mohe region, Zhang et al. [25] also found the signals of quasi-biennial oscillation in a 285-year record of precipitation, which is also in agreement with the periodicity of climatic variance in northeastern China over the last 100 years [52]. The 2.1–7.0-year periodicities fall within the range of the ENSO variation, indicating that PDSIp6-7 in the Mangui region may be modulated by the ENSO. Footprints of ENSO events have also been identified widely in other tree-ring based moisture-sensitive reconstructions in northeast Asia [3,12,23,45,46]. In addition, some significant common oscillations of 2.1–7.0-year between the PDSIp6-7 reconstruction and the ENSO index were confirmed using wavelet coherence analysis (Figure 10a). Previous studies have showed that the ENSO may be an important oscillation pattern influencing precipitation variability through modulating the strength of the Asian Summer Monsoon in the marginal monsoon areas [3,45,48]. Therefore, these results imply possible impacts of the ENSO on dry/wet variations in the study region.
The 11-year cycle indicated that dry–wet changes in the northern Daxing’anling Mountains might be influenced by solar activity, such as sunspot number. Similar periodicities have been identified in a tree-ring based precipitation reconstruction for the northern Daxing’anling Mountains [25]. A significant linkage was confirmed at the quasi 11-year scale from the 1790s to the 2010s (Figure 10b). The arrows show an in-phase linkage from the 1830s to the 1890s. An anti-phase linkage was also identified in the periods 1890s–1960s and 1980s–2010s, on an approximate time scale of 10.5–12.5 years. The two time series share some significant common oscillations, further supporting a connection between PDSIp6-7 and solar activity. However, the specific physical mechanism by which solar activity influences dry/wet variations in northeast China over long time-scales requires further investigation.
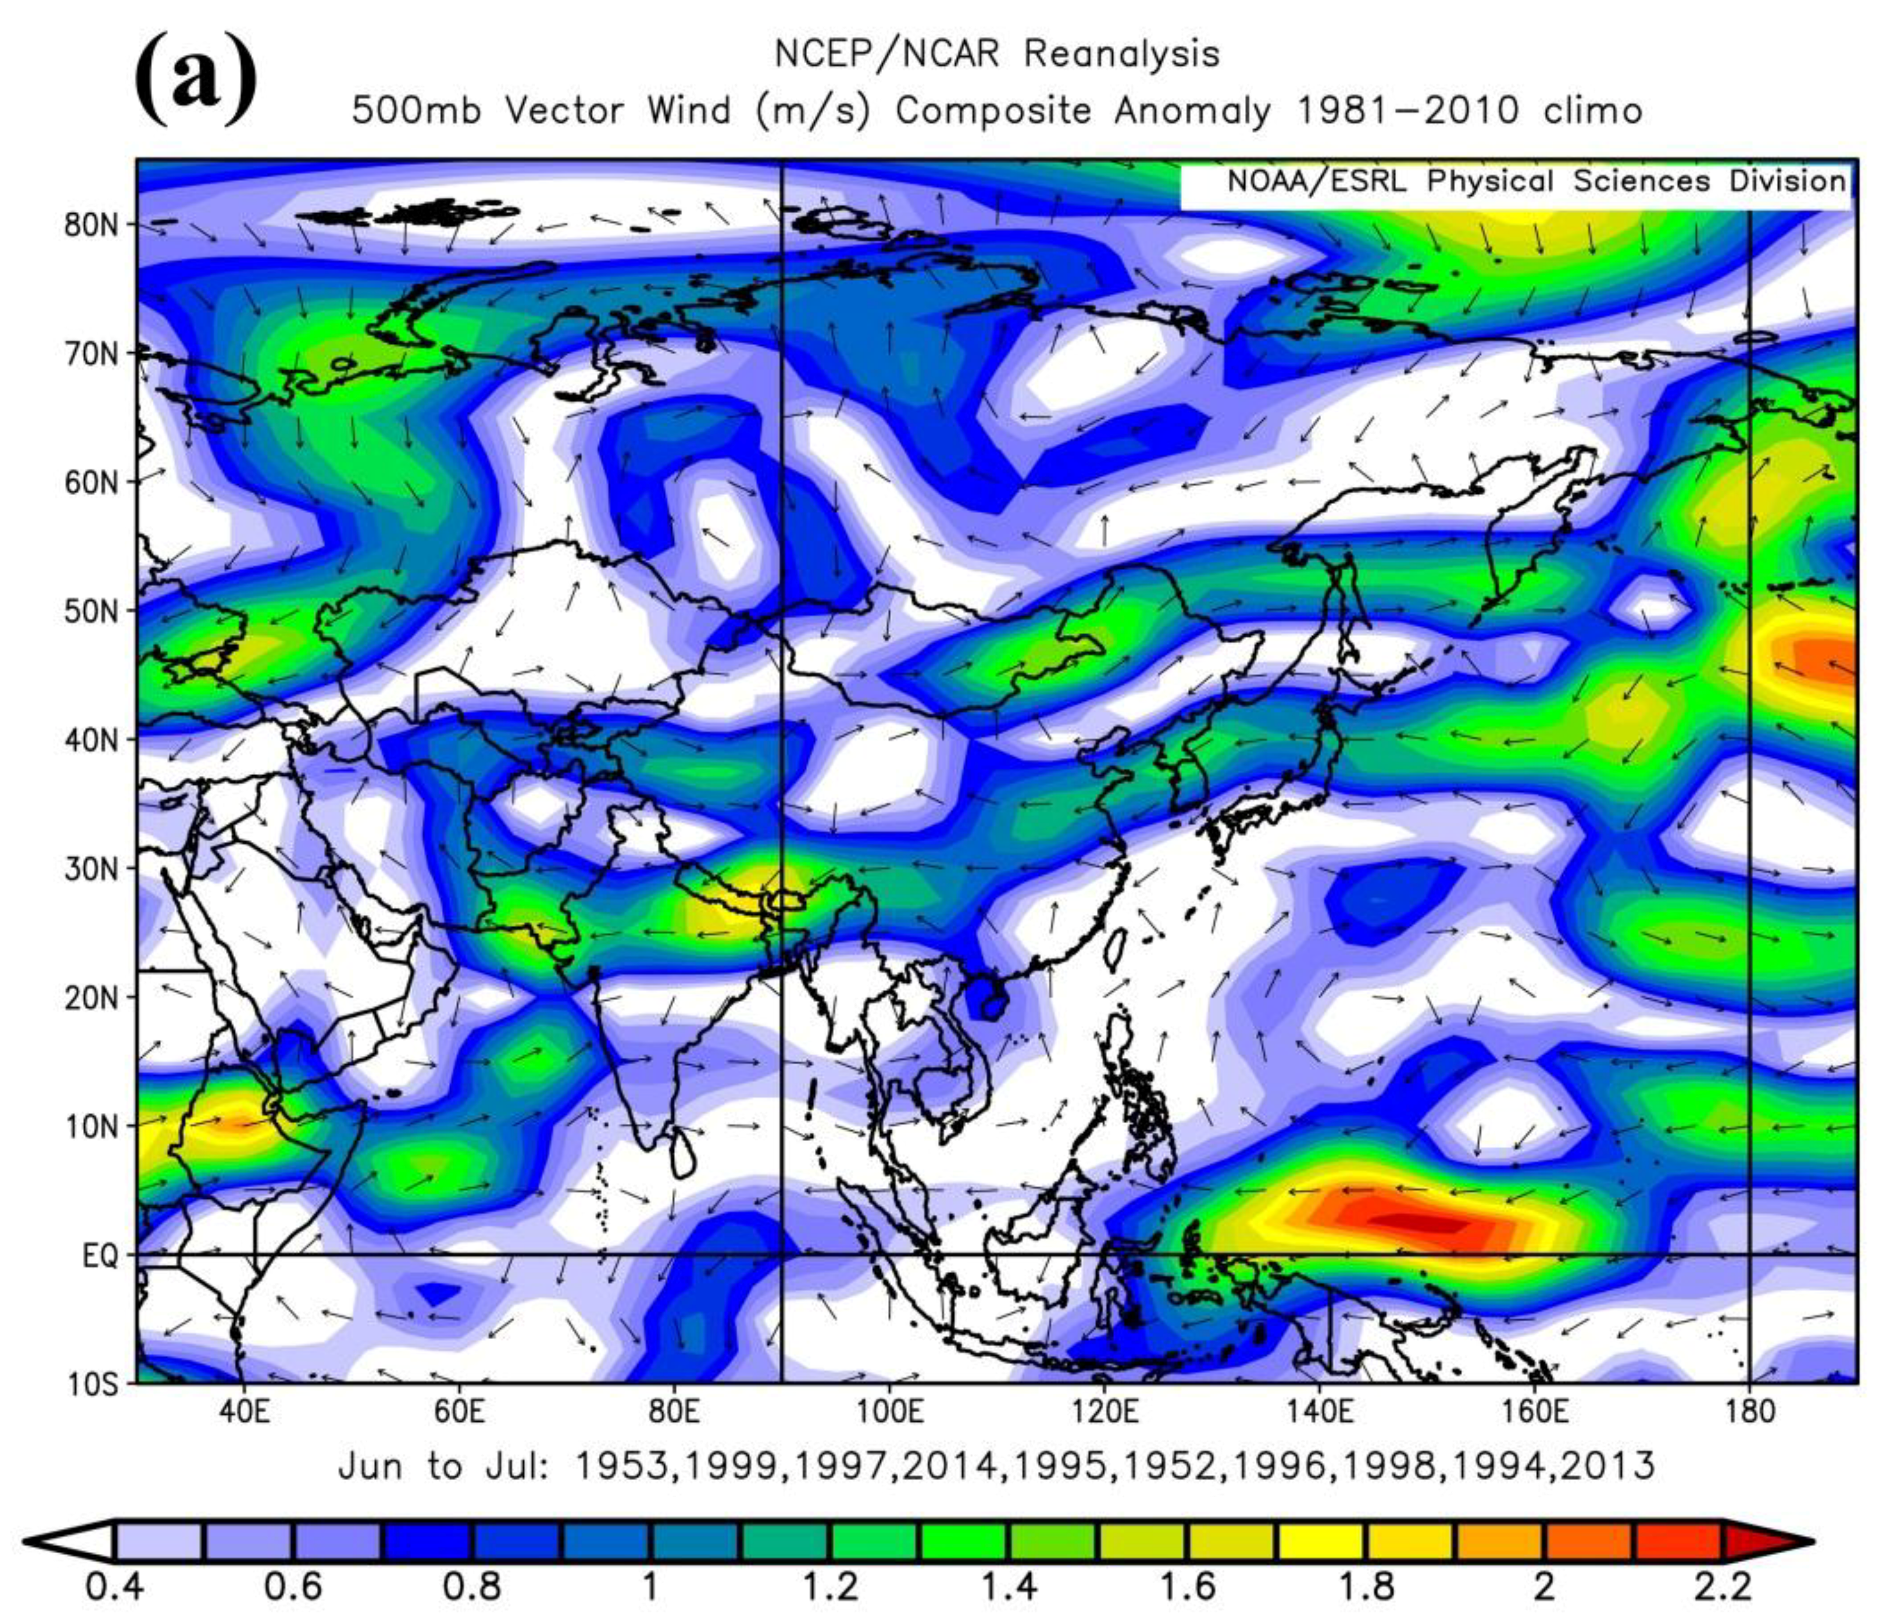
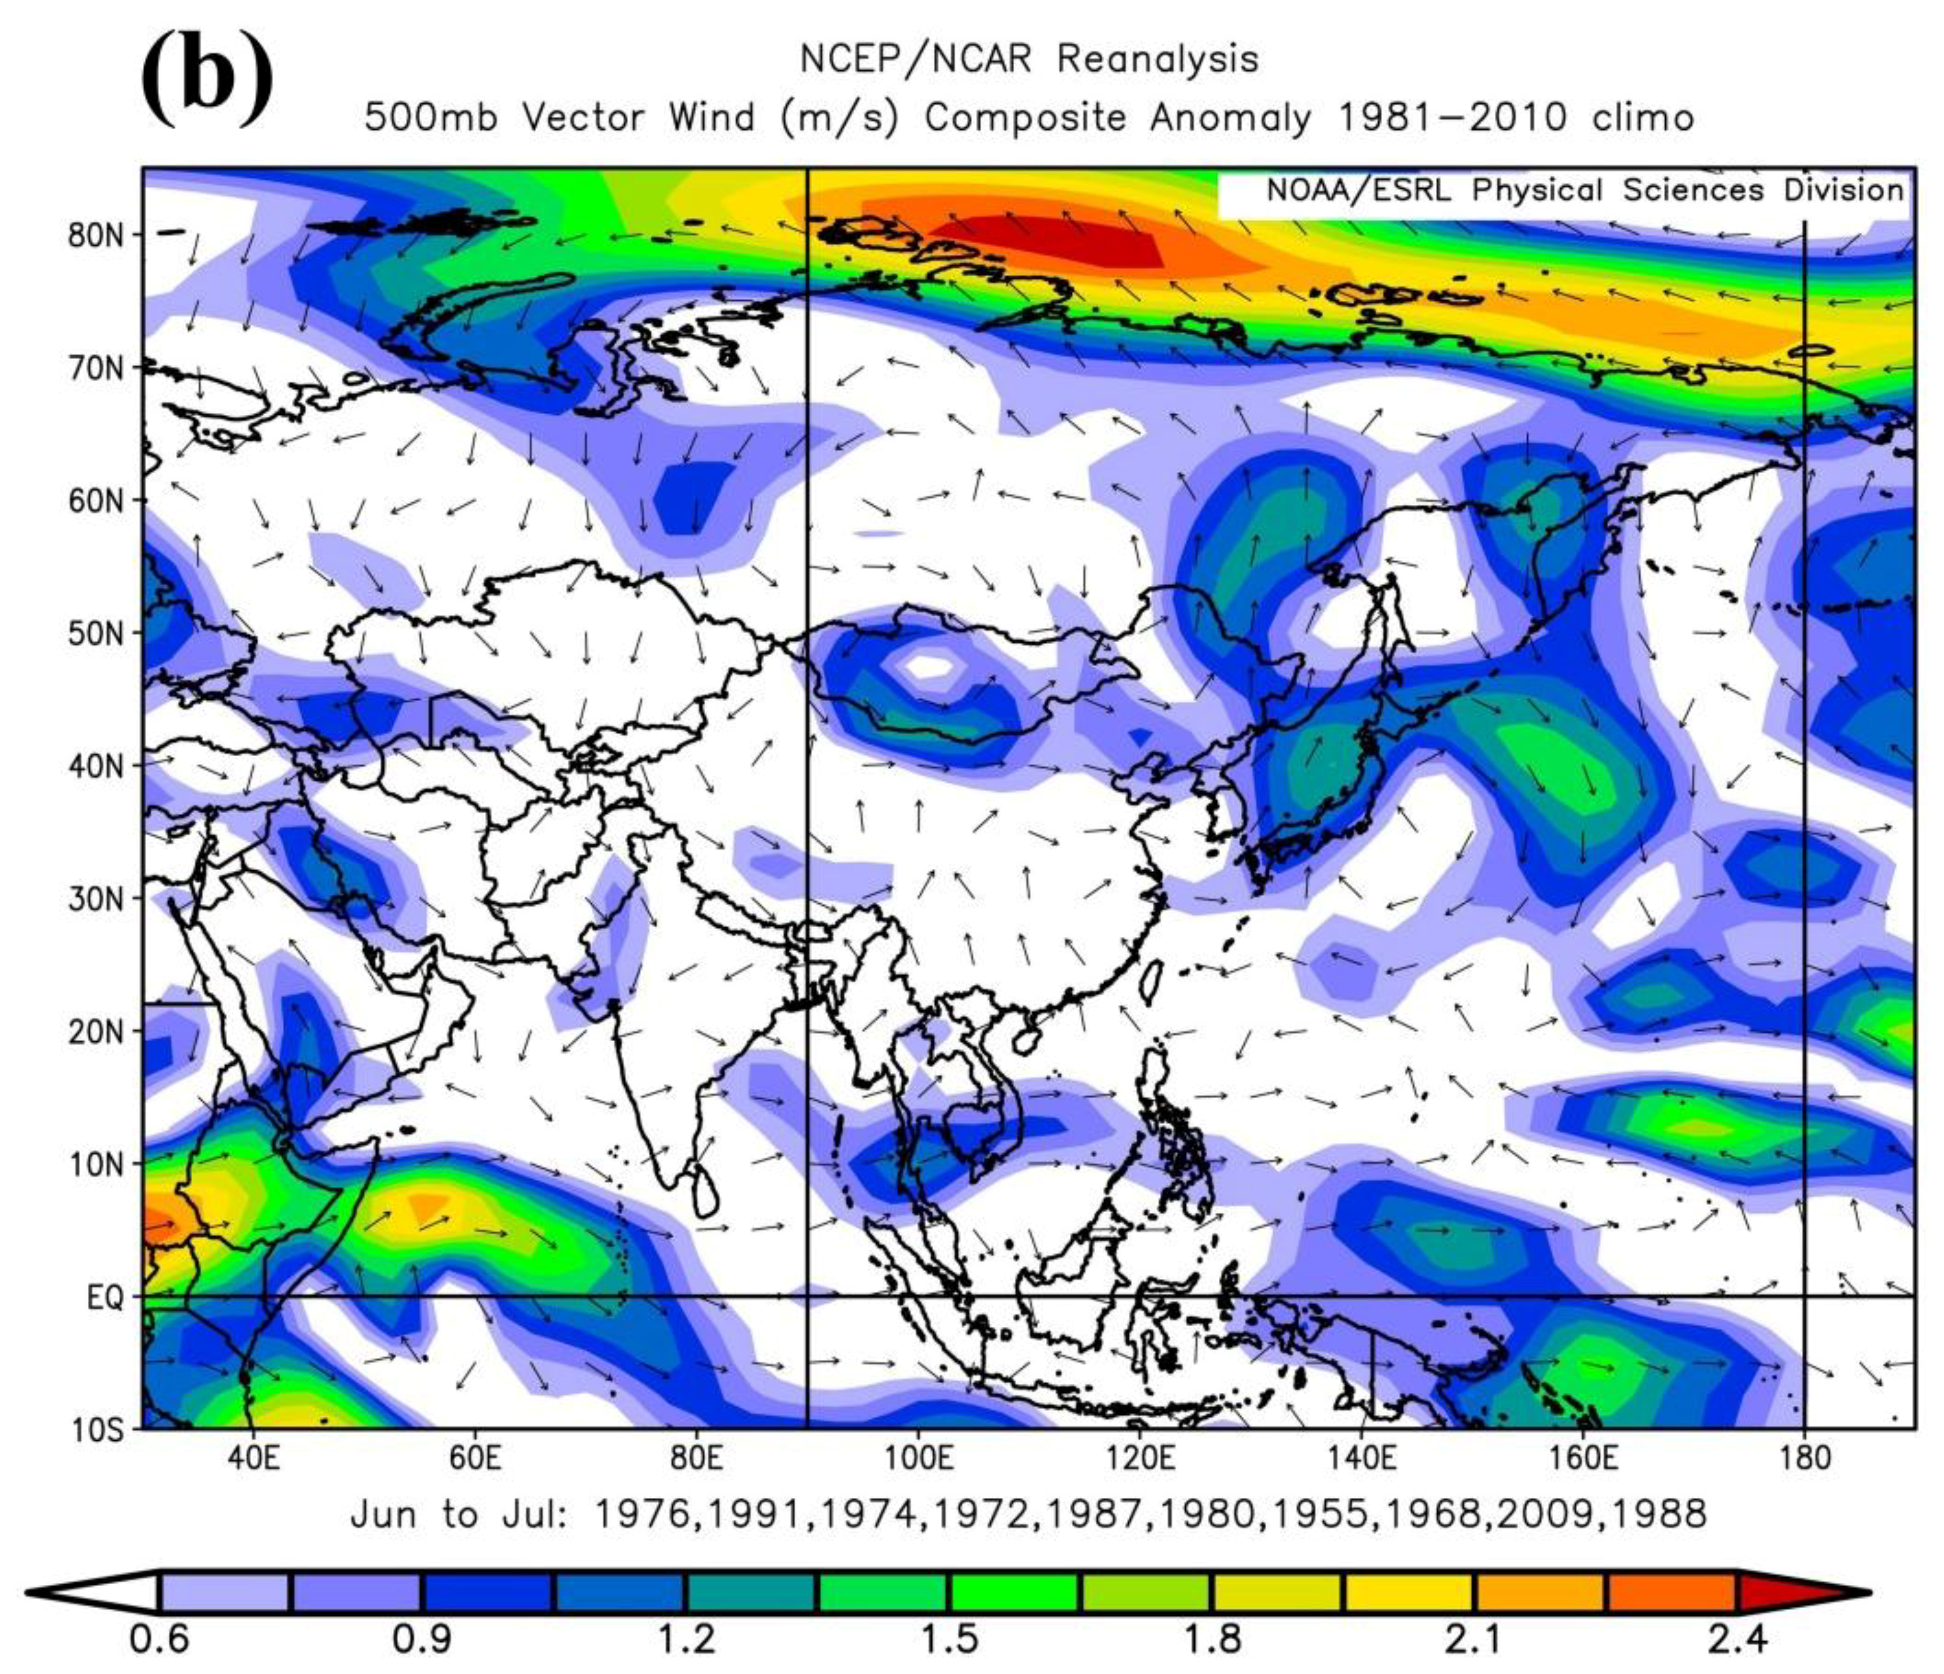
Another cycle of 37.7–42.6 years is similar to the NAO [35]. This is consistent with early studies that showed influences of the NAO on the climatic changes of the Mongolian Plateau [7,45,46]. Such multidecadal oscillations have also been reported in the mean temperature reconstruction for the northern Daxing’anling Mountains [24]. Similar to the sunspot number variable, the arrows in Figure 10c show an anti-phase relationship between the PDSIp6-7 reconstruction and the NAO index during the 1800s–2000s on timescales of 35–65 years. Therefore, all these results imply possible impacts of the NAO on PDSIp6-7 variation, which is located at the margin of the East Asian monsoon area. The 500-hPa vector wind composite anomaly of the wettest years exhibited westerly and southwesterly flows over the study area (Figure 11a). This is consistent with a high-level transport of cold air (westerlies) from the mid-high latitude oceans. In addition, the enhanced high-latitude easterly flow brings abundant moisture of the northeastern Pacific Ocean across the Korean Peninsula, and travels further westward, causing rich precipitation in northeast Asia, facilitating the growth of P. sylvestris during the early growing season. In contrast, the 500 hPa vector wind composite anomaly of the dry years exhibits a strong southeasterly flow over our study area, which is consistent with the low-level transport of warm air from the remote oceans (Figure 11b). Overall, the variations of PDSIp6-7 in the northern Daxing’anling Mountains are related to various parts of remote oceans and the influences of the ENSO, solar activity, and NAO. However, it is very difficult to distinguish their influences due to complex atmospheric circulation, and our limited understanding among their possible interaction. Other studies still need to be done before understanding the physical mechanisms.
5. Conclusions
A robust tree-ring width chronology was developed from the northern Daxing’anling Mountains of Inner Mongolia. The most reliable interval of the chronology covered the 1792–2016 period. This chronology explained 38.6% of the actual PDSIp6-7 variance during 1955–2016. The high level of explained variance could be partly attributed to the environment of the sampling site, which was located on a steep, low-elevation slope with thin soils. All these factors led to the high sensitivity of tree growth to June–July PDSI at the sampling site. Our reconstruction revealed five dry periods and six wet periods during the past 225 years. The reconstruction PDSI series captured the severe drought event in the period 1903–1927, which occurred extensively across northern China. The results of spatial correlation analysis with a gridded PDSI dataset revealed that our PDSI reconstructions contain strong regional drought signals for the southern Stanovoy Range and the northern Daxing’anling Mountains. Overall, drought variability in the northern Daxing’anling Mountains and its relationship with the surrounding areas might be driven by climate oscillations of the Pacific and Atlantic oceans (e.g., ENSO and NAO). Those large-scale climate oscillations control the Asian monsoon which, in turn, affects temperature and precipitation regimes associated with local drought variations. The study in this paper provides valuable new information about climate change for the Mangui region in the northernmost area of China, and contributes to the tree-ring dataset. Longer and larger spatial coverage tree-ring chronologies are needed to better understand the drought variability and the drought effect on the ecological system in the study region.
Author Contributions
J.Y. and Q.L. conceived the idea; J.Y., S.S., G.Z., Z.X., and Q.L. sampled the tree cores; J.Y. measured the tree-ring width, conducted the analysis, and wrote the manuscript.
Funding
This research was funded by National Natural Science Foundation of China (No. 31670436).
Acknowledgments
The authors would like to thank the reviewers for their diligence in providing useful comments that improved this work.
Conflicts of Interest
The authors declare no conflict of interest.
References
- Dai, A.G. Drought under global warming: A review. Wiley Interdiscip. Rev. Clim. Chang. 2011, 2, 45–65. [Google Scholar] [CrossRef]
- Zhu, H.F.; Fang, X.Q.; Shao, X.M.; Yin, Z.Y. Tree ring-based February–April temperature reconstruction for Changbai Mountain in Northeast China and its implication for East Asian winter monsoon. Clim. Past 2009, 5, 661–666. [Google Scholar] [CrossRef] [Green Version]
- Chen, Z.J.; Zhang, X.L.; Cui, M.X.; He, X.Y.; Ding, W.H.; Peng, J.J. Tree-ring based precipitation reconstruction for the forest–steppe ecotone in northern Inner Mongolia, China and its linkages to the Pacific Ocean variability. Glob. Planet. Chang. 2012, 86–87, 45–56. [Google Scholar] [CrossRef]
- Liang, E.Y.; Liu, X.H.; Yuan, Y.J.; Qin, N.S.; Fang, X.Q.; Huang, L.; Zhu, H.F.; Wang, L.L.; Shao, X.M. The 1920s drought reconstructed by tree rings and historical documents in the semi-arid and arid areas of northern China. Clim. Chang. 2006, 79, 403–432. [Google Scholar] [CrossRef]
- Piao, S.L.; Ciais, P.; Huang, Y.; Shen, Z.H.; Peng, S.S.; Li, J.S.; Zhou, L.P.; Liu, H.Y.; Ma, Y.C.; Ding, Y.H.; et al. The impacts of climate change on water resources and agriculture in China. Nature 2010, 467, 43–51. [Google Scholar] [CrossRef] [PubMed]
- Yue, Y.; Shen, S.H.; Wang, Q. Trend and Variability in Droughts in Northeast China Based on the Reconnaissance Drought Index. Water 2018, 10, 318. [Google Scholar] [CrossRef]
- Bao, G.; Liu, Y.; Liu, N.; Linderholm, H.W. Drought variability in eastern Mongolian Plateau and its linkages to the large-scale climate forcing. Clim. Dyn. 2015, 44, 717–733. [Google Scholar] [CrossRef]
- Huang, J.G.; Zhang, Q.B. Tree rings and climate for the last 680 years in Wulan area of northeastern Qinghai-Tibetan Plateau. Clim. Chang. 2007, 80, 369–377. [Google Scholar] [CrossRef]
- Liang, E.Y.; Shao, X.M.; Xu, Y. Tree-ring evidence of recent abnormal warming on the southeast Tibetan Plateau. Theor. Appl. Climatol. 2009, 98, 9–18. [Google Scholar] [CrossRef] [Green Version]
- Shao, X.M.; Xu, Y.; Yin, Z.Y.; Liang, E.Y.; Zhu, H.F.; Wang, S.Z. Climatic implications of a 3585-year tree-ring width chronology from the northeastern Qinghai-Tibetan Plateau. Quatern. Sci. Rev. 2010, 29, 2111–2122. [Google Scholar] [CrossRef]
- Davi, N.K.; D’Arrigo, R.; Jacoby, G.C.; Cook, E.R.; Anchukaitis, K.J.; Nachin, B.; Rao, M.P.; Leland, C. A long-term context (931–2005 C.E.) for rapid warming over Central Asia. Quatern. Sci. Rev. 2015, 121, 89–97. [Google Scholar] [CrossRef] [Green Version]
- Yu, J.; Zhou, G.; Liu, Q.J. Tree-ring based summer temperature regime reconstruction in XiaoXing Anling Mountains, northeastern China since 1772 CE. Palaeogeogr. Palaeoclimatol. Palaeoecol. 2018, 495, 13–23. [Google Scholar] [CrossRef]
- Zheng, Y.H.; Zhang, Y.; Shao, X.M.; Yin, Z.Y.; Zhang, J. Temperature variability inferred from tree-ring widths in the Dabie Mountains of subtropical central China. Trees 2012, 26, 1887–1894. [Google Scholar] [CrossRef]
- Cai, Q.F.; Liu, Y. Climatic response of Chinese pine and PDSI variability in the middle Taihang Mountains, north China since 1873. Trees 2013, 27, 419–427. [Google Scholar] [CrossRef]
- Liang, E.Y.; Shao, X.M.; Qin, N.S. Tree-ring based summer temperature reconstruction for the source region of the Yangtze River on the Tibetan Plateau. Glob. Planet. Chang. 2008, 61, 313–320. [Google Scholar] [CrossRef]
- Liang, H.X.; Lyu, L.X.; Wahab, M. A 382-year reconstruction of August mean minimum temperature from tree-ring maximum latewood density on the southeastern Tibetan Plateau, China. Dendrochronologia 2016, 37, 1–8. [Google Scholar] [CrossRef]
- Garfin, G.M.; Hughes, M.K.; Liu, Y.; Burns, J.M.; Touchan, R.; Leavitt, S.W.; An, Z.S. Exploratory Temperature and Precipitation Reconstructions from the Qinling Mountains, North-Central China. Tree-Ring Res. 2005, 61, 59–72. [Google Scholar] [CrossRef] [Green Version]
- Chen, F.; Yuan, Y.J.; Wei, W.S.; Yu, S.L.; Shang, H.M.; Zhang, T.W.; Zhang, R.B.; Wang, H.Q.; Qin, L. Tree-ring based temperature reconstruction for the west Qinling Mountains (China): Linkages to the High Asia, solar activity and Pacific-Atlantic Ocean. Geochronometria 2014, 41, 234–244. [Google Scholar] [CrossRef]
- Zhang, R.B.; Yuan, Y.J.; Gou, X.H.; He, Q.; Shang, H.M.; Zhang, T.W.; Chen, F.; Ermenbaev, B.; Yu, S.L.; Qin, L.; et al. Tree-ring-based moisture variability in western Tianshan Mountains since A.D. 1882 and its possible driving mechanism. Agric. For. Meteorol. 2016, 218–219, 267–276. [Google Scholar] [CrossRef]
- Jiang, P.; Liu, H.Y.; Wu, X.C.; Wang, H.Y. Tree-ring-based SPEI reconstruction in central Tianshan Mountains of China since A.D. 1820 and links to westerly circulation. Int. J. Climatol. 2017, 37, 2863–2872. [Google Scholar] [CrossRef]
- Chen, F.; Yuan, Y.J.; Wei, W.S.; Yu, S.L.; Wang, H.Q. Tree-ring response of subtropical tree species in southeast China on regional climate and sea-surface temperature variations. Trees 2013, 29, 17–24. [Google Scholar] [CrossRef]
- Shi, J.F.; Lu, H.Y.; Li, J.B.; Shi, S.Y.; Wu, S.Y.; Hou, X.Y.; Li, L.L. Tree-ring based February–April precipitation reconstruction for the lower reaches of the Yangtze River, southeastern China. Glob. Planet. Chang. 2015, 131, 82–88. [Google Scholar] [CrossRef] [Green Version]
- Liu, Y.; Bao, G.; Song, H.M.; Cai, Q.F.; Sun, J.Y. Precipitation reconstruction from Hailar pine (Pinus sylvestris var. mongolica) tree rings in the Hailar region, Inner Mongolia, China back to 1865 AD. Palaeogeogr. Palaeoclimatol. Palaeoecol. 2009, 282, 81–87. [Google Scholar]
- Zhang, T.W.; Yuan, Y.J.; Wei, W.S.; Yu, S.L.; Zhang, R.B.; Shang, H.M.; Chen, F.; Fan, Z.A.; Qin, L. Tree-ring-based temperature reconstruction for the northern Greater Higgnan Mountains, China, since A.D. 1717. Int. J. Climatol. 2013, 33, 422–429. [Google Scholar] [CrossRef]
- Zhang, T.W.; Yuan, Y.J.; Wei, W.S.; Yu, S.L.; Zhang, R.B.; Chen, F.; Shang, H.M.; Qin, L. A tree-ring based precipitation reconstruction for the Mohe region in the northern Greater Higgnan Mountains, China, since AD 1724. Quatern. Res. 2014, 82, 14–21. [Google Scholar] [CrossRef]
- Zhang, X.L.; He, X.Y.; Li, J.B.; Davi, N.; Chen, Z.J.; Cui, M.X.; Chen, W.; Li, N. Temperature reconstruction (1750–2008) from Dahurian larch tree-rings in an area subject to permafrost in Inner Mongolia, Northeast China. Clim. Res. 2011, 47, 151–159. [Google Scholar] [CrossRef]
- Chen, Z.J.; Zhang, X.L.; He, X.Y.; Davi, N.K.; Cui, M.X.; Peng, J.J. Extension of summer (June–August) temperature records for northern Inner Mongolia (1715–2008), China using tree rings. Quatern. Int. 2013, 283, 21–29. [Google Scholar] [CrossRef]
- Shi, Z.J.; Xu, L.H.; Dong, L.S.; Gao, J.X.; Yang, X.H.; Lv, S.H.; Feng, C.Y.; Shang, J.X.; Song, A.Y.; Guo, H.; et al. Growth–climate response and drought reconstruction from tree-ring of Mongolian pine in Hulunbuir, Northeast China. J. Plant Ecol. 2015, 9, 51–60. [Google Scholar] [CrossRef] [Green Version]
- Stokes, M.A.; Smiley, T.L. An Introduction to Tree-Ring Dating; University of Arizona Press: Tucson, AZ, USA, 1968. [Google Scholar]
- Holmes, R.L. Computer-assisted quality control in tree-ring dating and measurement. Tree-Ring Bull. 1983, 43, 69–95. [Google Scholar]
- Cook, E.R.; Holmes, R.L. User’s Manual for Program ARSTAN; Laboratory of Tree-Ring Research, University of Arizona: Tucson, AZ, USA, 1986. [Google Scholar]
- Wigley, T.; Briffa, K.R.; Jones, P.D. On the average value of correlated time series, with applications in dendroclimatology and hydrometeorology. J. Clim. Appl. Meteorol. 1984, 23, 201–213. [Google Scholar] [CrossRef]
- Dai, A.G.; Trenberth, K.E.; Qian, T. A global dataset of palmer drought severity index for 1870–2002: Relationship with soil moisture and effects of surface warming. J. Hydrometeorol. 2004, 5, 1117–1130. [Google Scholar] [CrossRef]
- Braganza, K.; Gergis, J.L.; Power, S.B.; Risbey, J.S.; Fowler, A.M. A multiproxy index of the El Nino-Southern Oscillation, A.D. 1525–1982. J. Geophys. Res. Atmos. 2009, 114, D05106. [Google Scholar] [CrossRef]
- Trouet, V.; Esper, J.; Graham, N.E.; Baker, A.; Scourse, J.D.; Frank, D.C. Persistent positive North Atlantic oscillation mode dominated the medieval climate anomaly. Science 2009, 324, 78–80. [Google Scholar] [CrossRef] [PubMed]
- Michaelsen, J. Cross-validation in statistical climate forecast models. J. Clim. Appl. Meteorol. 1987, 26, 1589–1600. [Google Scholar] [CrossRef]
- Fritts, H.C. Tree Rings and Climate; Academic Press: London, UK, 1976. [Google Scholar]
- Chen, Z.J.; He, X.Y.; Davi, N.K.; Zhang, X.L. A 258-year reconstruction of precipitation for southern Northeast China and the northern Korean peninsula. Clim. Chang. 2016, 139, 609–622. [Google Scholar] [CrossRef]
- Cook, E.R.; Anchukaitis, K.J.; Buckley, B.M.; D’Arrigo, R.D.; Jacoby, G.C.; Wright, W.E. Asian monsoon failure and megadrought during the last millennium. Science 2010, 328, 486–489. [Google Scholar] [CrossRef] [PubMed]
- Mann, M.E.; Lees, J. Robust estimation of background noise and signal detection in climatic time series. Clim. Chang. 1996, 33, 409–445. [Google Scholar] [CrossRef]
- Torrence, C.; Compo, G.P. A practical guide to wavelet analysis. Bull. Am. Meteorol. Soc. 1998, 79, 61–78. [Google Scholar] [CrossRef]
- Sun, B.; Liu, Y.; Lei, Y.; Guo, L. Warm-induced aridification in eastern Inner Mongolia evidenced by tree rings. Dendrochronologia 2017, 42, 73–79. [Google Scholar] [CrossRef]
- Cai, Q.F.; Liu, Y.; Lei, Y.; Bao, G.; Sun, B. Reconstruction of the March–August PDSI since 1703 AD based on tree rings of Chinese pine (Pinus tabulaeformis Carr.) in the Lingkong Mountain, southeast Chinese loess Plateau. Clim. Past 2014, 10, 509–521. [Google Scholar] [CrossRef]
- Liang, E.Y.; Shao, X.M.; Liu, H.Y.; Eckstein, D. Tree-ring based PDSI reconstruction since AD 1842 in the Ortindag Sand Land, east Inner Mongolia. Chin. Sci. Bull. 2007, 52, 2715–2721. [Google Scholar] [CrossRef]
- Liu, Y.; Zhang, X.J.; Song, H.M.; Cai, Q.F.; Li, Q.; Zhao, B.Y.; Liu, H.; Mei, R.C. Tree-ring-width-based PDSI reconstruction for central Inner Mongolia, China over the past 333 years. Clim. Dyn. 2017, 48, 867–879. [Google Scholar] [CrossRef]
- Zhang, X.J.; Liu, Y.; Song, H.M.; Cai, Q.F.; Li, Q.; Zhao, B.Y.; Liu, H.; Mei, R.C. Interannual variability of PDSI from tree-ring widths for the past 278 years in Baotou, China. Trees 2017, 5, 1531–1541. [Google Scholar] [CrossRef]
- Zhang, X.L.; Cui, M.X.; Ma, Y.J.; Wu, T.; Chen, Z.J.; Ding, W.H. Larix gmelinii tree-ring width chronology and its responses to climate change in Kuduer, Great Xing’ an Mountains. J. Appl. Ecol. 2010, 21, 2501–2507, (In Chinese with English Abstract). [Google Scholar]
- Liu, N.; Liu, Y.; Bao, G.; Bao, M.; Wang, Y.C.; Ge, Y.X.; Zhang, L.Z.; Bao, W.; Tian, H. A tree-ring based reconstruction of summer relative humidity variability in eastern Mongolian Plateau and its associations with the Pacific and Indian Oceans. Palaeogeogr. Palaeoclimatol. Palaeoecol. 2015, 438, 113–123. [Google Scholar] [CrossRef]
- Li, Y.J.; Wang, S.Y.; Niu, J.J.; Fang, K.Y.; Chao, Y.; Li, X.L.; Li, Y.H. Tree-ring-based reconstruction of drought variability (1792–2011) in the middle reaches of the Fen River, North China. Dendrochronologia 2016, 40, 1–11. [Google Scholar] [CrossRef]
- Meehl, G.A. The annual cycle and interannual variability in the tropical Pacific and Indian Ocean regions. Mon. Weather Rev. 1987, 115, 27–50. [Google Scholar] [CrossRef]
- Labitzke, K.G.; van Loon, H. The Stratosphere: Phenomena, History and Relevance; Springer: Berlin, Germany, 1999. [Google Scholar]
- Sun, F.H.; Yuan, J.; Lu, S. The Change and Test of Climate in Northeast China over the Last 100 Years. Clim. Environ. Res. 2006, 11, 101–108, (In Chinese with English Abstract). [Google Scholar]
Figure 1.
(a) Positions of P. sylvestris sampling locations (red solid triangle) and the meteorological stations (green solid square) in the northern Daxing’anling Mountains of Inner Mongolia, northeastern China. Upright shows the geoposition in China; (b) Photograph of a typical P. sylvestris tree and the slope at the study site.

Figure 2.
Plot of new ring width standard chronologies from the Hexi Forest Farm site ((a); HXL), the Ningcui Mountain Park site ((b); NCS), and the PC#1 of tree-ring width ((c); PC#1RW). Arrow denotes the starting year with SSS > 0.80.
Figure 2.
Plot of new ring width standard chronologies from the Hexi Forest Farm site ((a); HXL), the Ningcui Mountain Park site ((b); NCS), and the PC#1 of tree-ring width ((c); PC#1RW). Arrow denotes the starting year with SSS > 0.80.

Figure 3.
Monthly mean temperature, maximum temperature, minimum temperature, and precipitation over the common period 1959–2015 for the northern Daxing’anling Mountains of Inner Mongolia, derived from meteorological records in Mohe.
Figure 3.
Monthly mean temperature, maximum temperature, minimum temperature, and precipitation over the common period 1959–2015 for the northern Daxing’anling Mountains of Inner Mongolia, derived from meteorological records in Mohe.
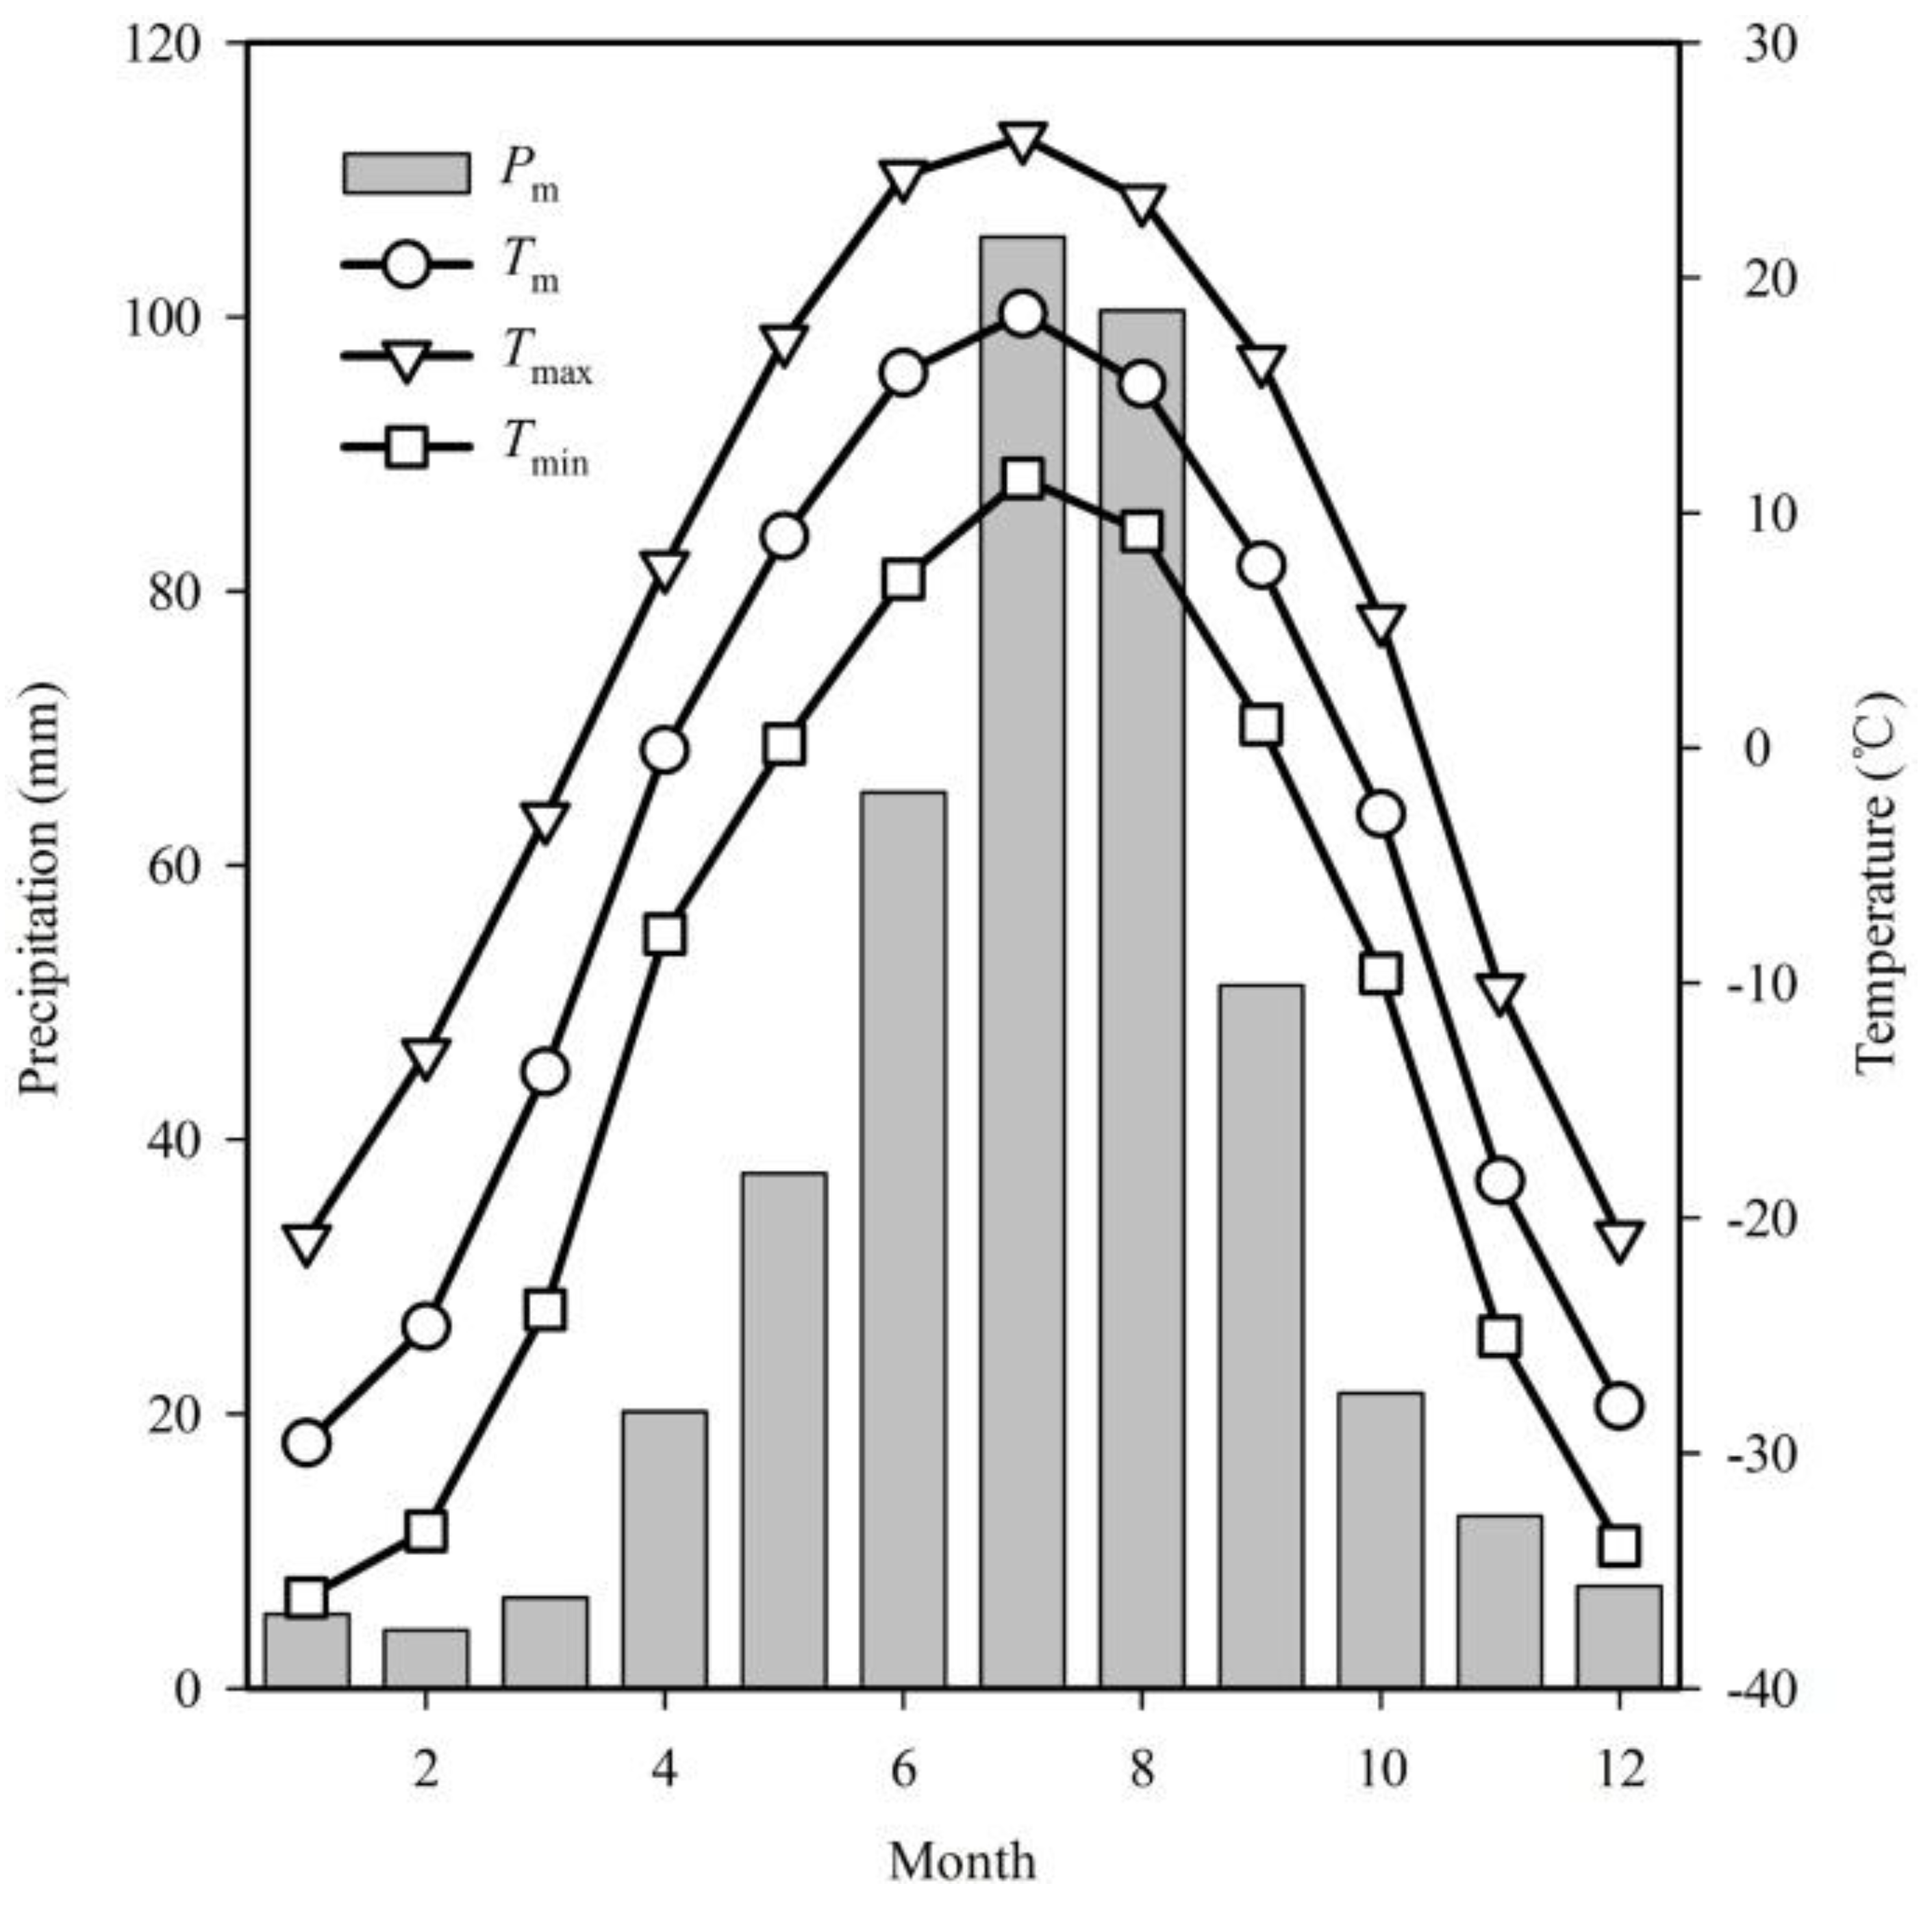
Figure 4.
Correlation coefficients (a,c) and first-order difference correlation (b,d) of the PC#1RW of P. sylvestris with climate factors including monthly mean temperatures, precipitation, and Palmer drought severity index (PDSI) from 1955 to 2016. Horizontal dashed lines indicate the 95% significance levels.
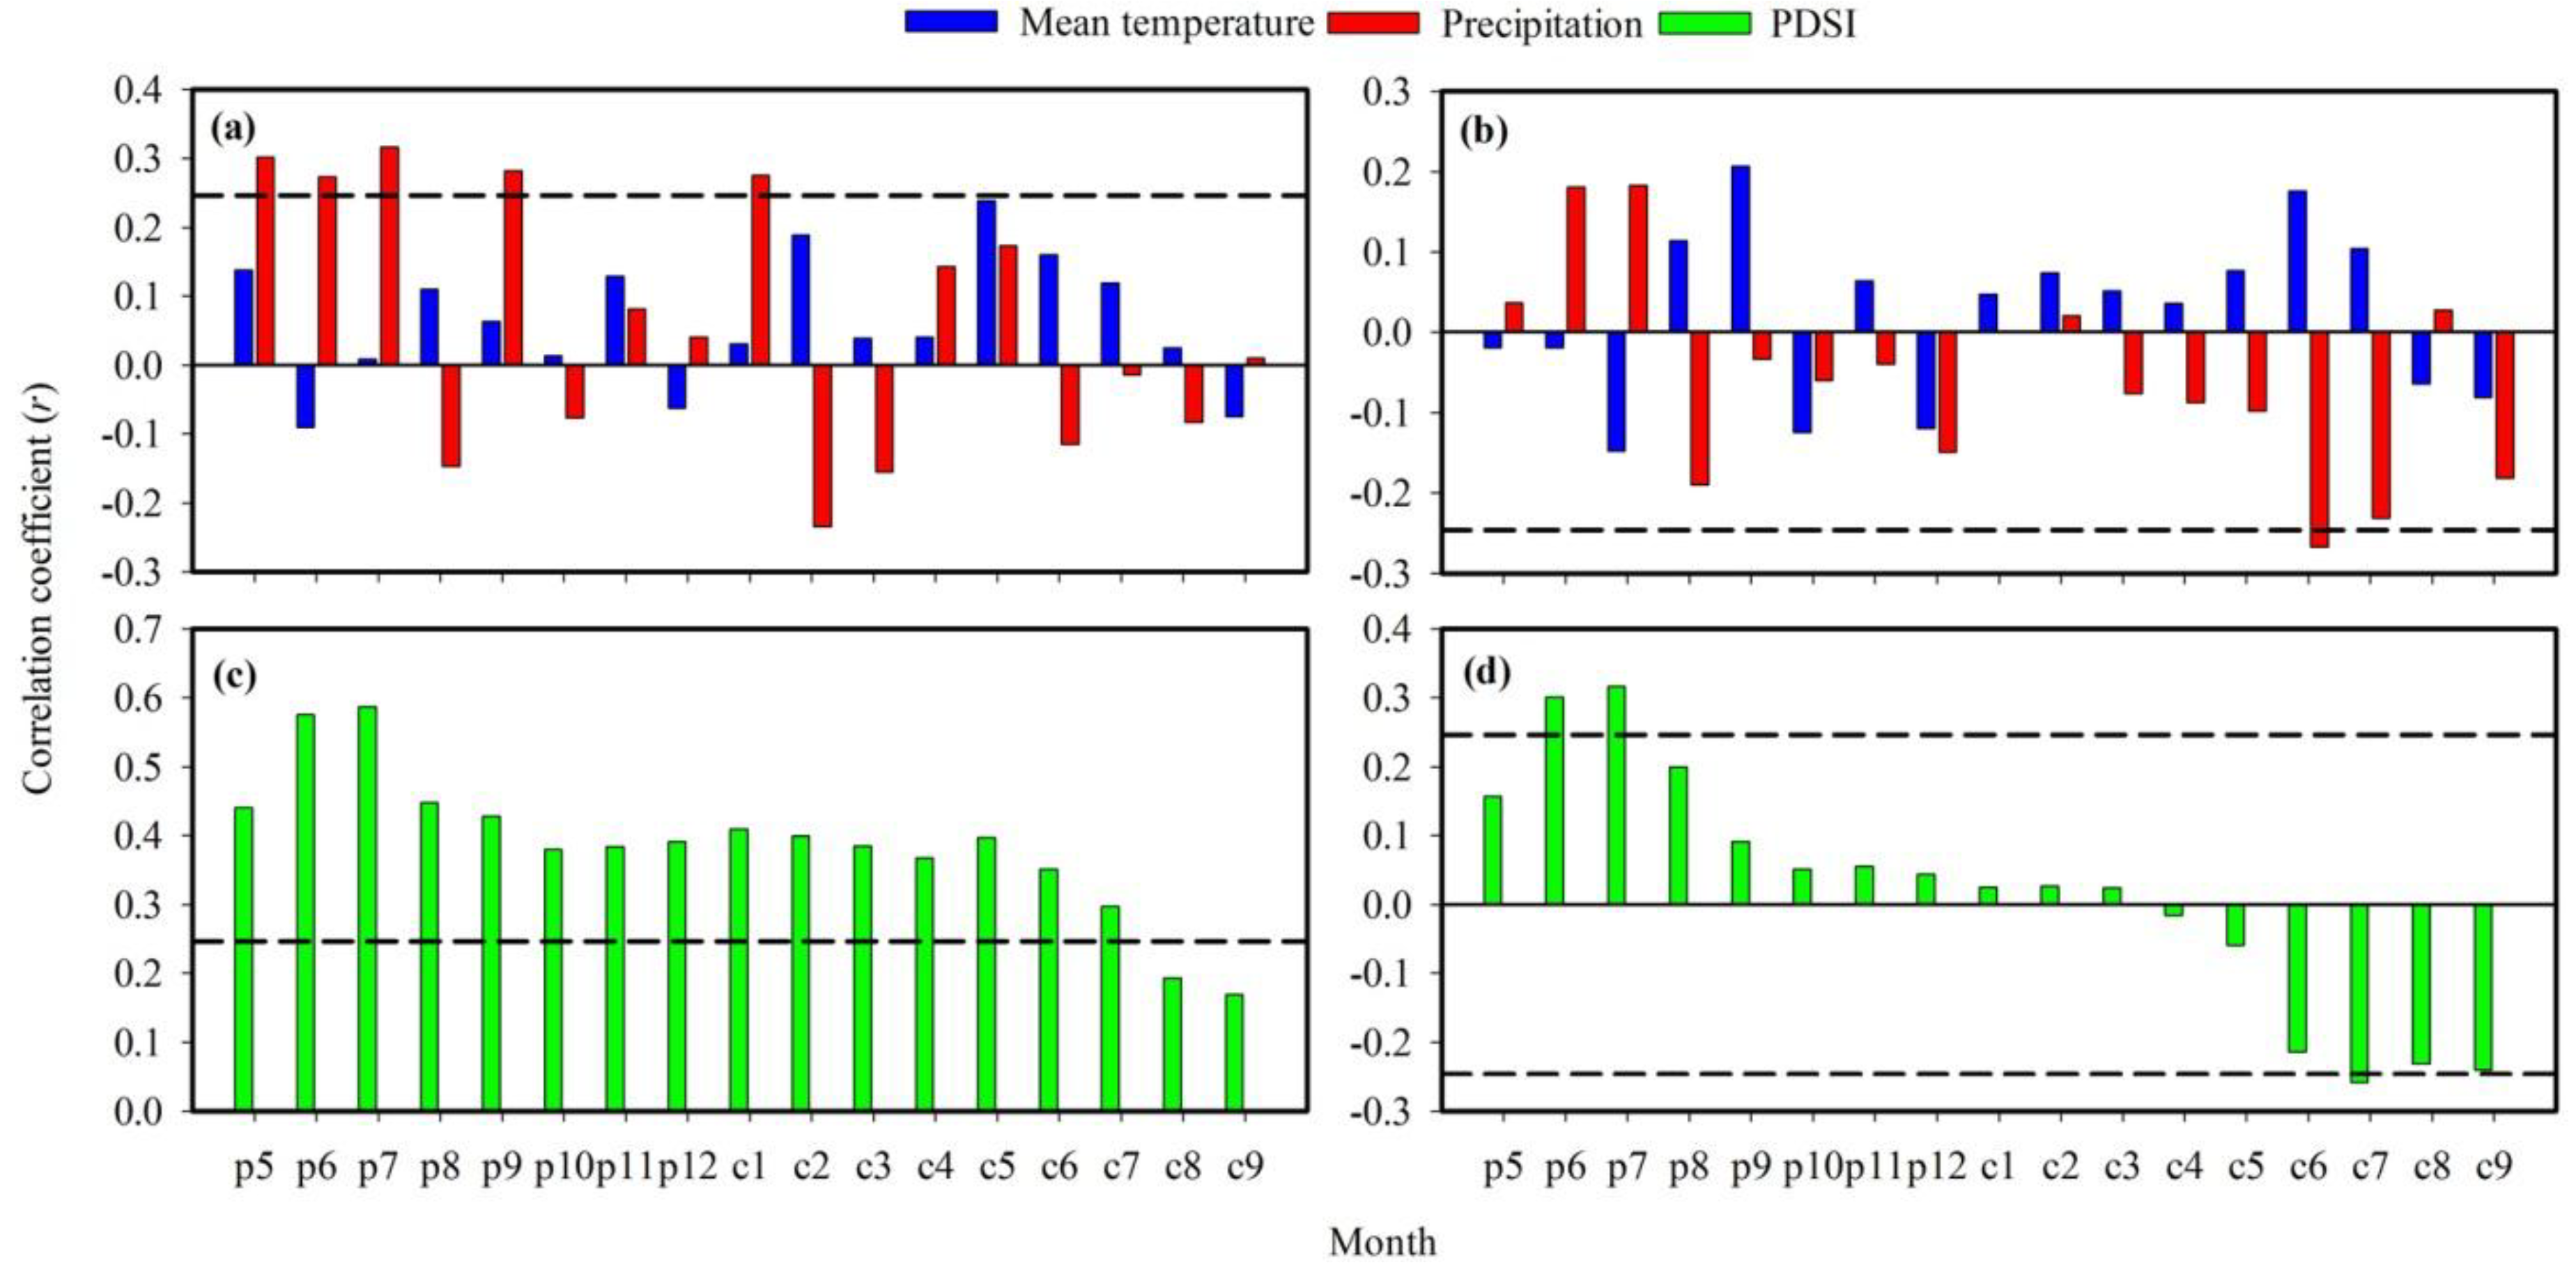
Figure 5.
Result of the 21-year moving correlation between the PC#1RW and PDSIp6-7 during instrumental period (1955–2016).
Figure 5.
Result of the 21-year moving correlation between the PC#1RW and PDSIp6-7 during instrumental period (1955–2016).
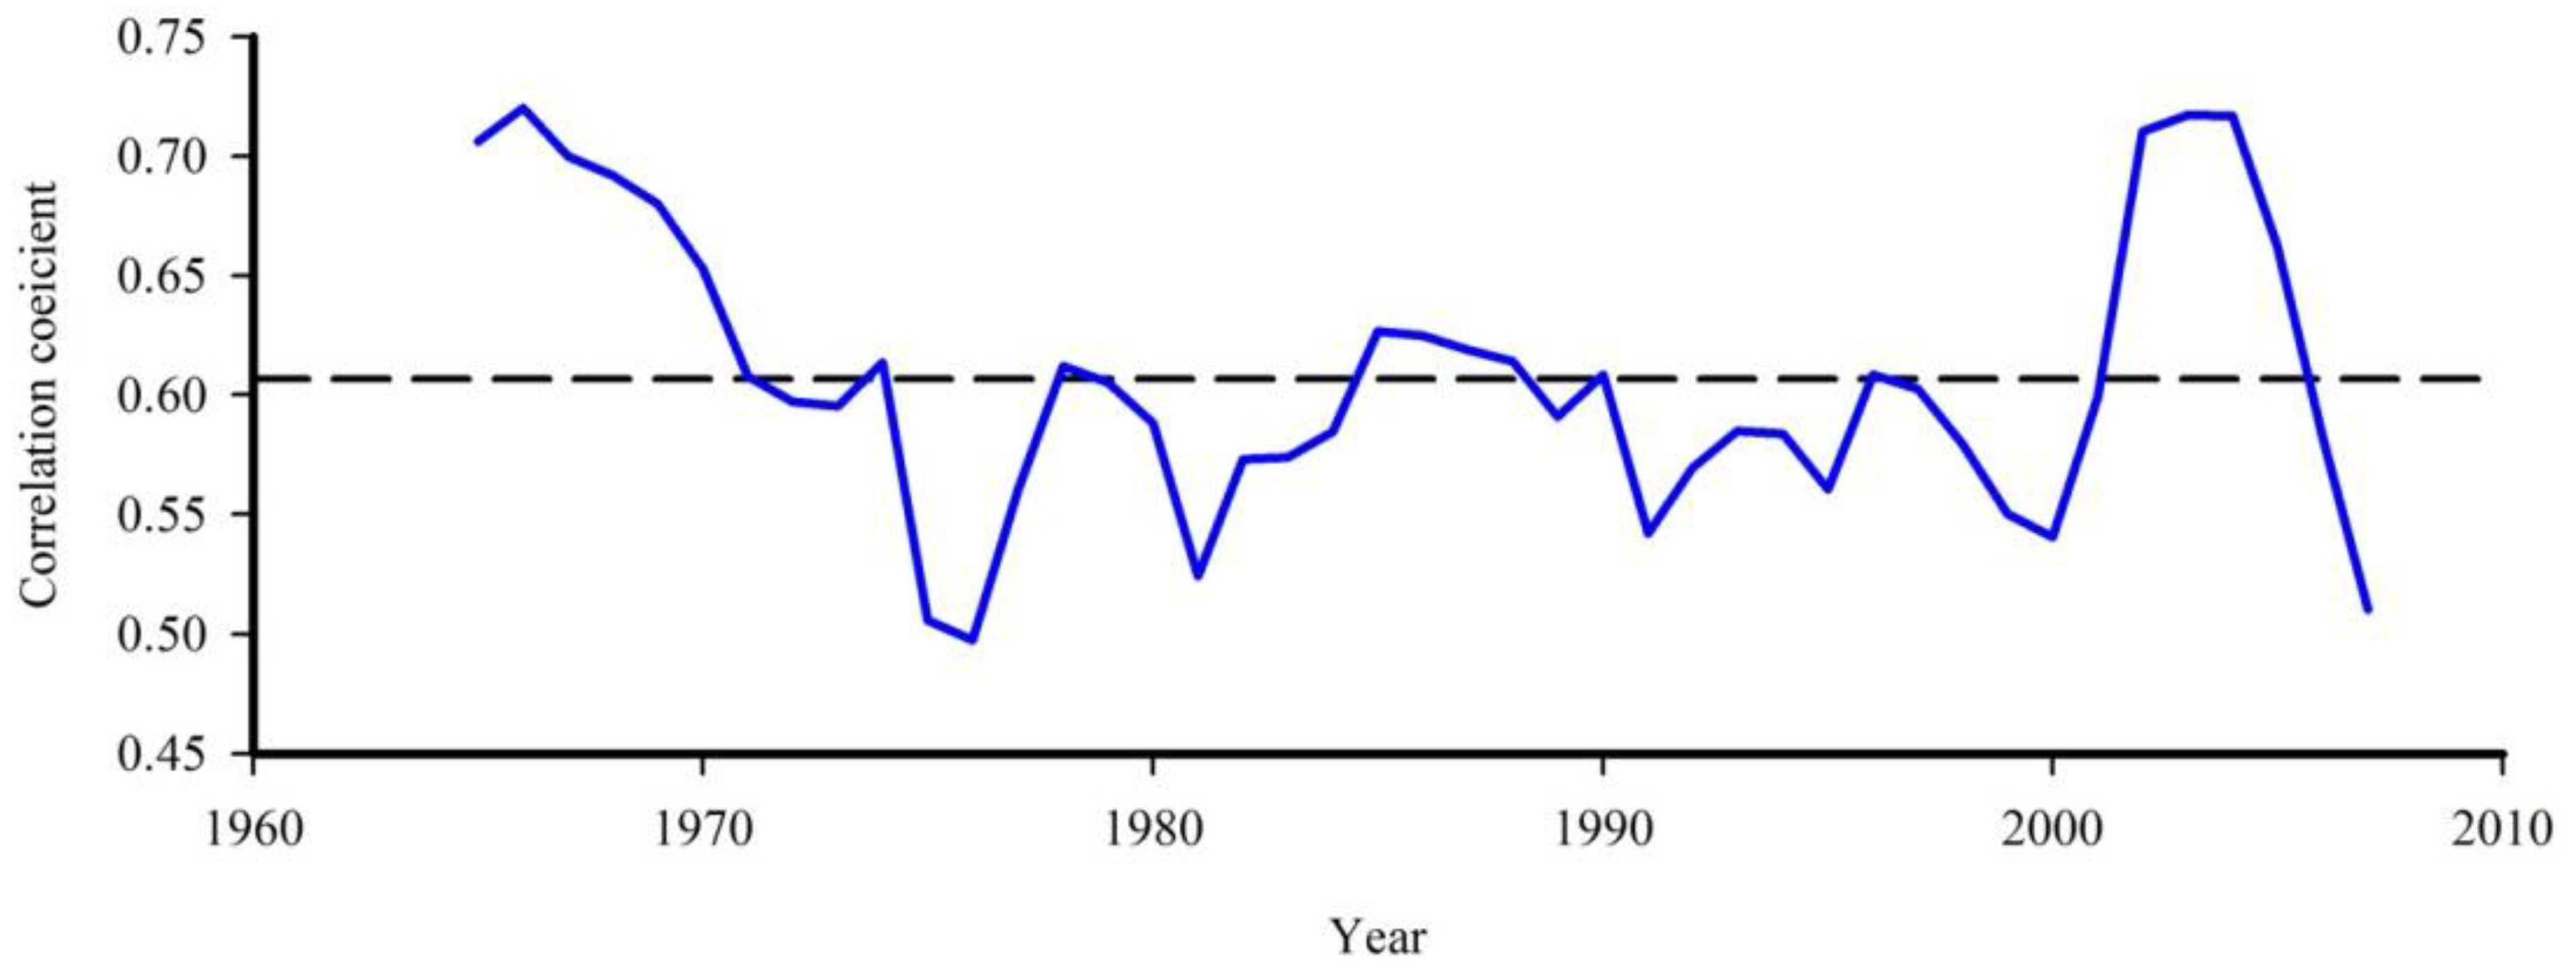
Figure 6.
Comparisons between reconstructed and observed PDSIp6-7 (a) and the comparison between the first-order difference during 1955–2016 (b); and the reconstruction of PDSIp6-7 over the period 1792–2016 ((c); the black curve). Bold red line represents the 20-year fast Fourier transform (FFT) low-pass filter. The central horizontal solid line shows the mean of the reconstructed values and the short dash line represents mean ± 1.5 standard deviations.
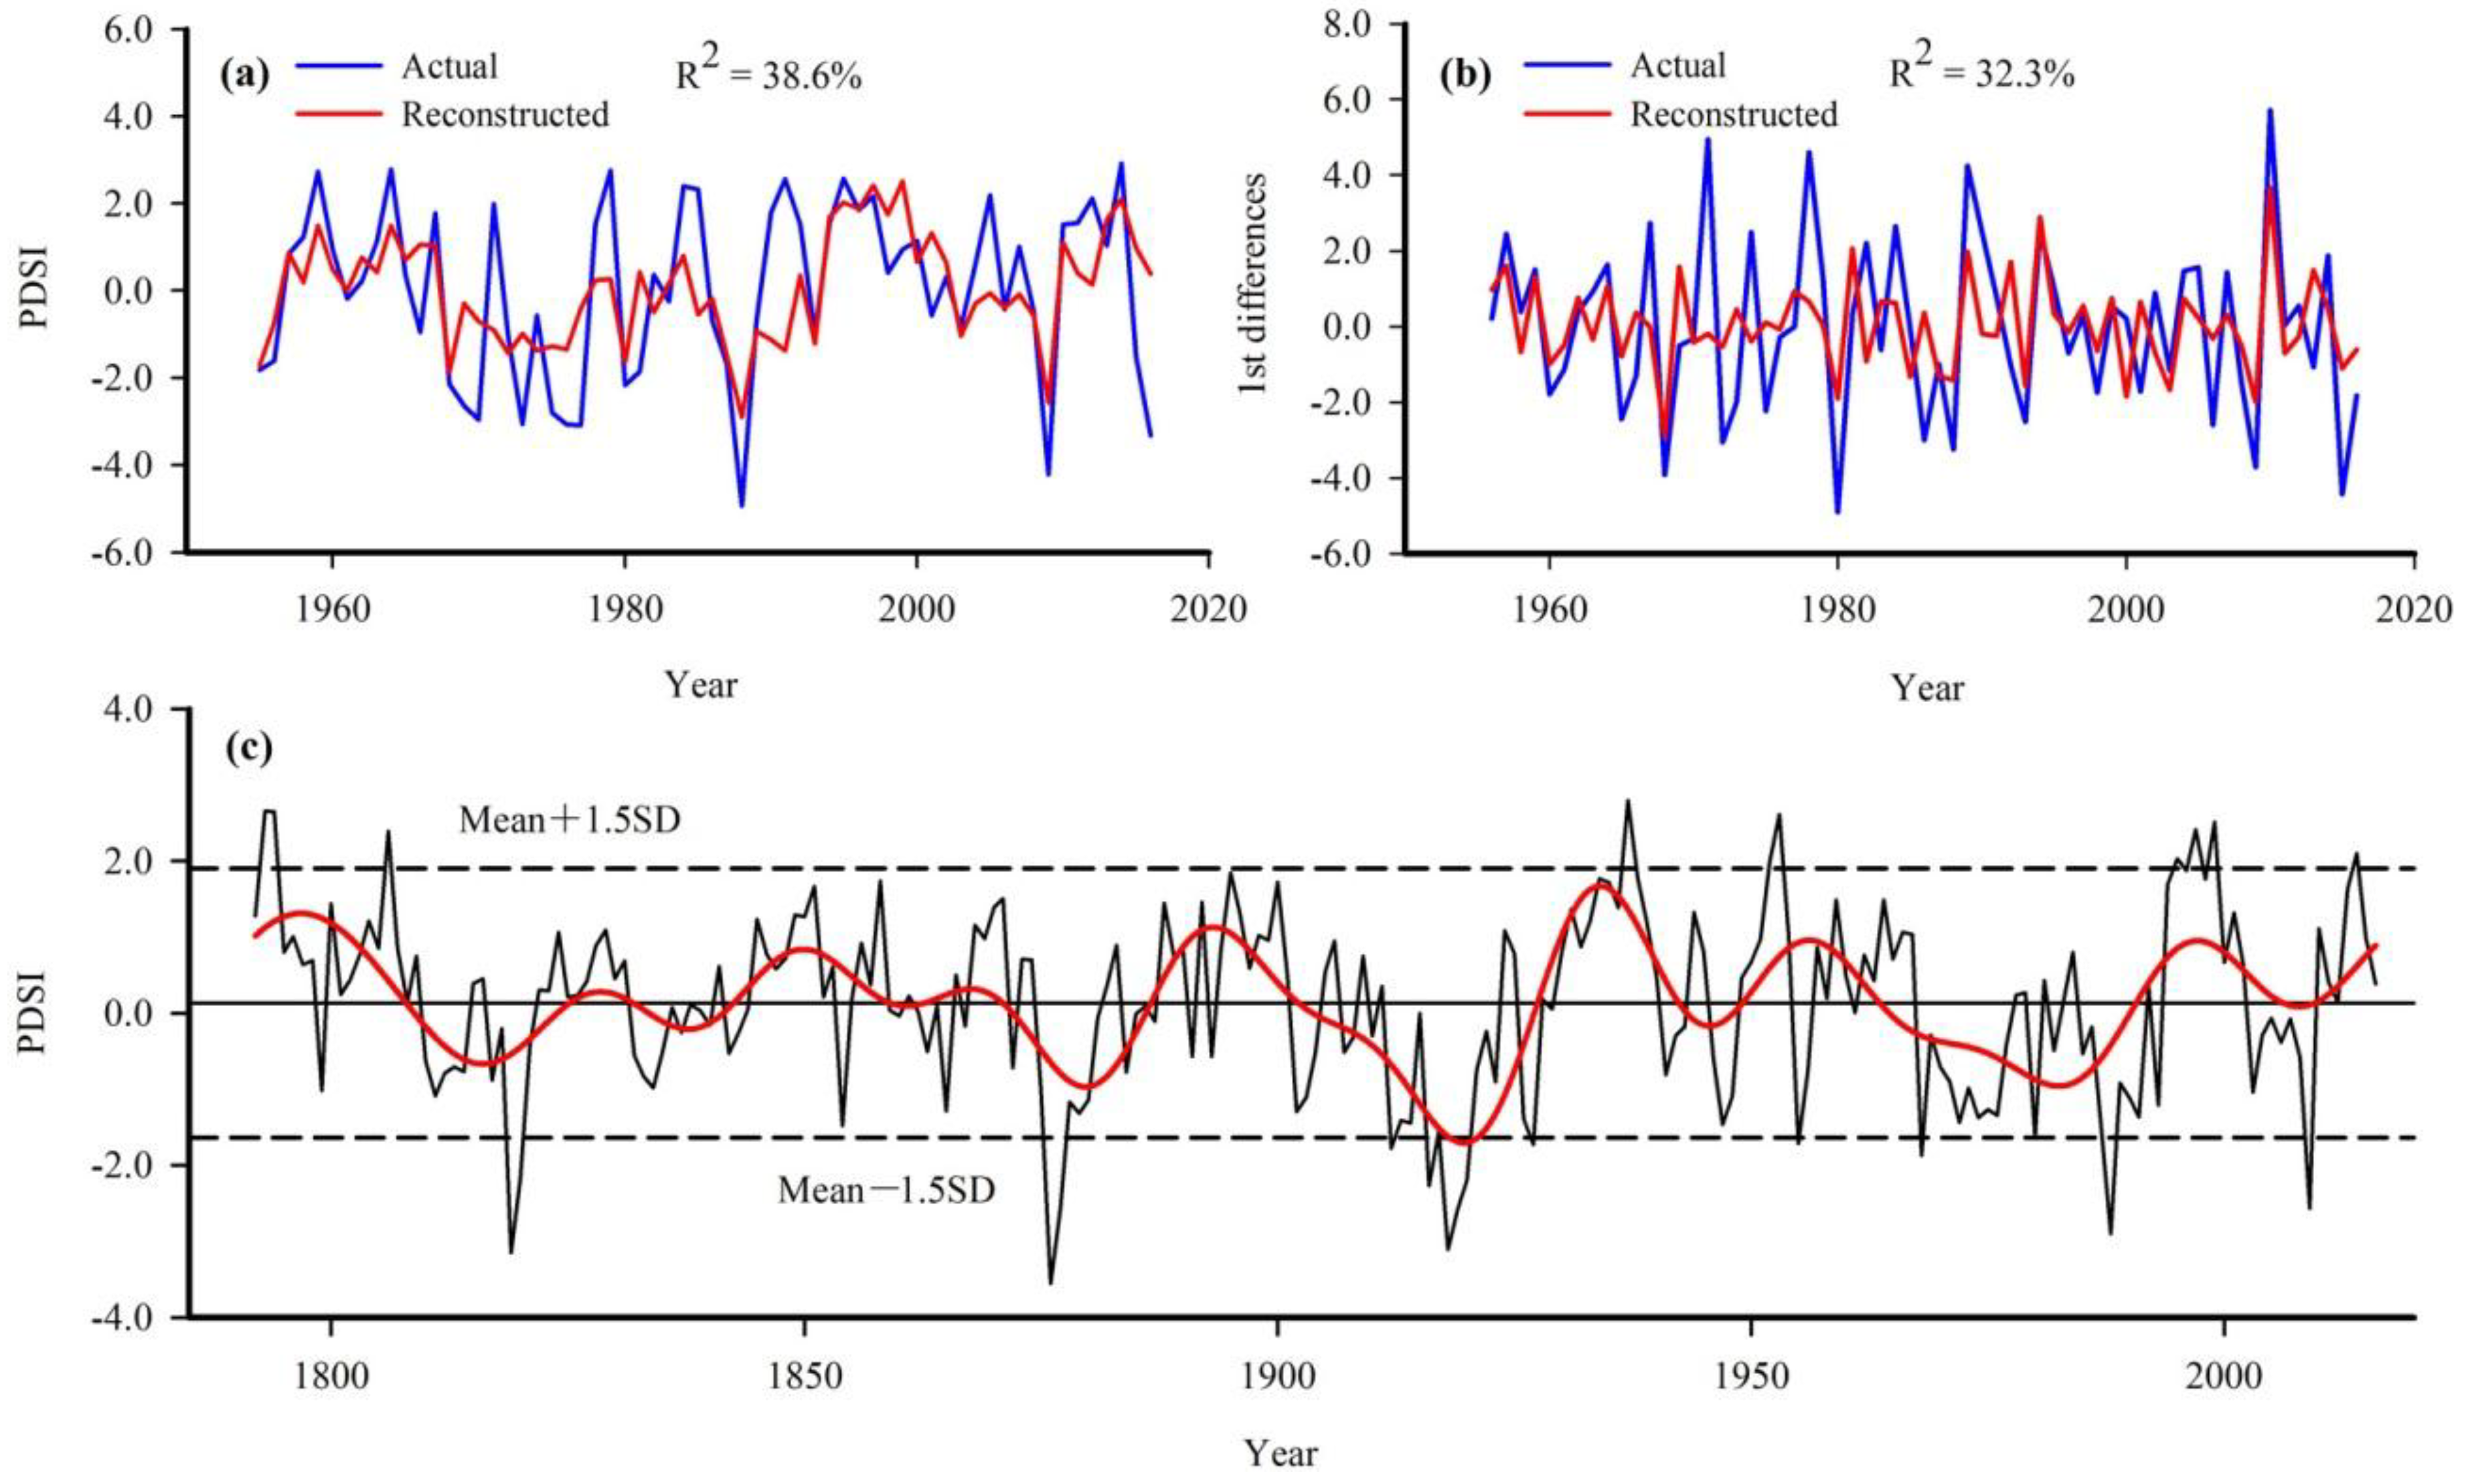
Figure 7.
Spatial correlation patterns between (a) instrumental and (b) reconstructed PDSIp6-7 and the Climatic Research Unit (CRU) gridded PDSI for the period 1955–2016. Correlation analysis was performed using the KNMI climate explorer.
Figure 7.
Spatial correlation patterns between (a) instrumental and (b) reconstructed PDSIp6-7 and the Climatic Research Unit (CRU) gridded PDSI for the period 1955–2016. Correlation analysis was performed using the KNMI climate explorer.

Figure 8.
Multitaper method (MTM) power spectrum of the reconstructed PDSIp6-7 for the period 1792 to 2016. The 95% confidence levels relative to red noise are shown, and the numbers refer to the significant period in years (a). Wavelet power spectra for the PDSIp6-7 reconstruction. The black contour represents the 95% significance level, using a red-noise background spectrum (b).

Figure 9.
Comparison of PDSIp6-7 reconstruction with reported PDSI and precipitation records from surrounding regions. (a) PDSIp6-7 reconstruction in this study; (b) October–September precipitation reconstruction in southern northeast China and the northern Korean Peninsula [38]; (c) August–July precipitation reconstruction for the Mohe region in the northern Daxing’anling Mountains [25]; (d) August–June precipitation reconstruction for the forest–steppe ecotone in northern Inner Mongolia, China [3]; (e) drought reconstruction of “Cook” from the same PDSI grid derived from the Monsoon Asia Drought Atlas [39]. All series were smoothed with 20-year FFT smoothing to emphasize long-term fluctuations (low frequency). Blue (dry) shading are low PDSI zones with good agreements.
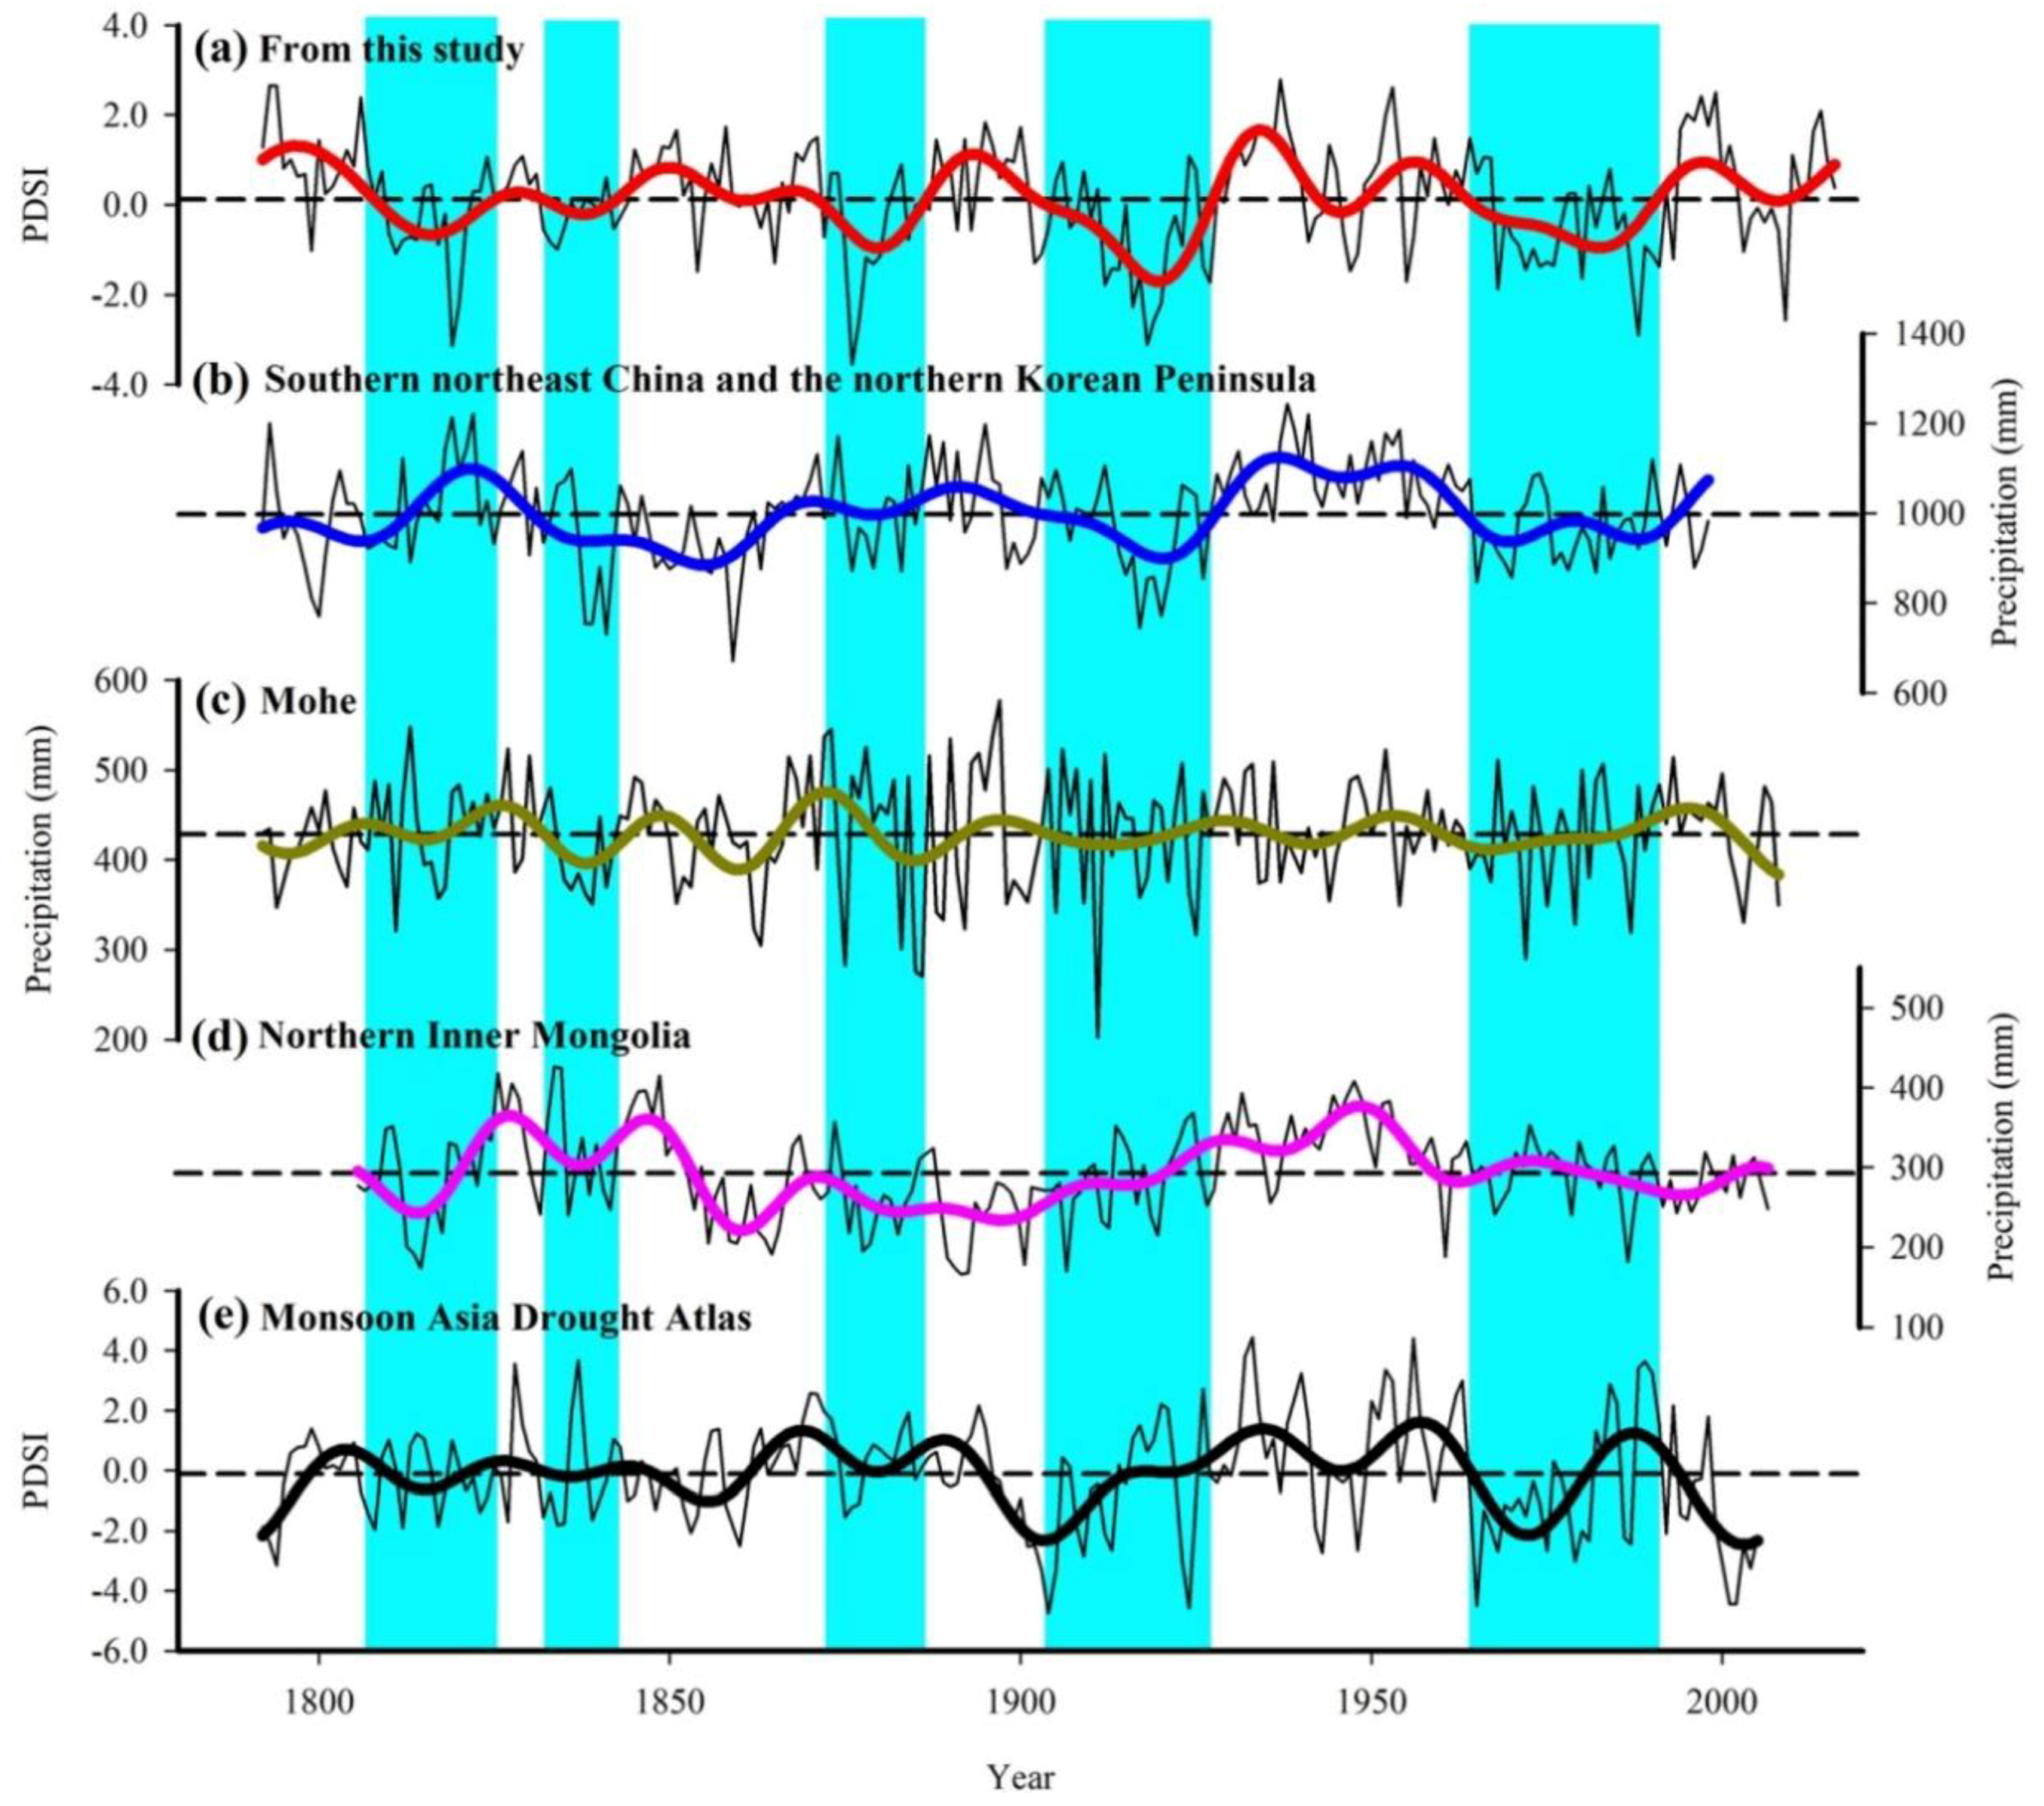
Figure 10.
Cross-wavelet transform of the reconstructed PDSIp6-7 of the northern Daxing’anling Mountains region with (a) El Niño-Southern Oscillation (ENSO) index; (b) sunspot number (www.sidc.be/silso/datafiles); and (c) North Atlantic Oscillation (NAO) index. The 5% significance level against red noise is shown as a thick contour. The relative phase relationship is shown as arrows (with in-phase pointing right, anti-phase pointing left).
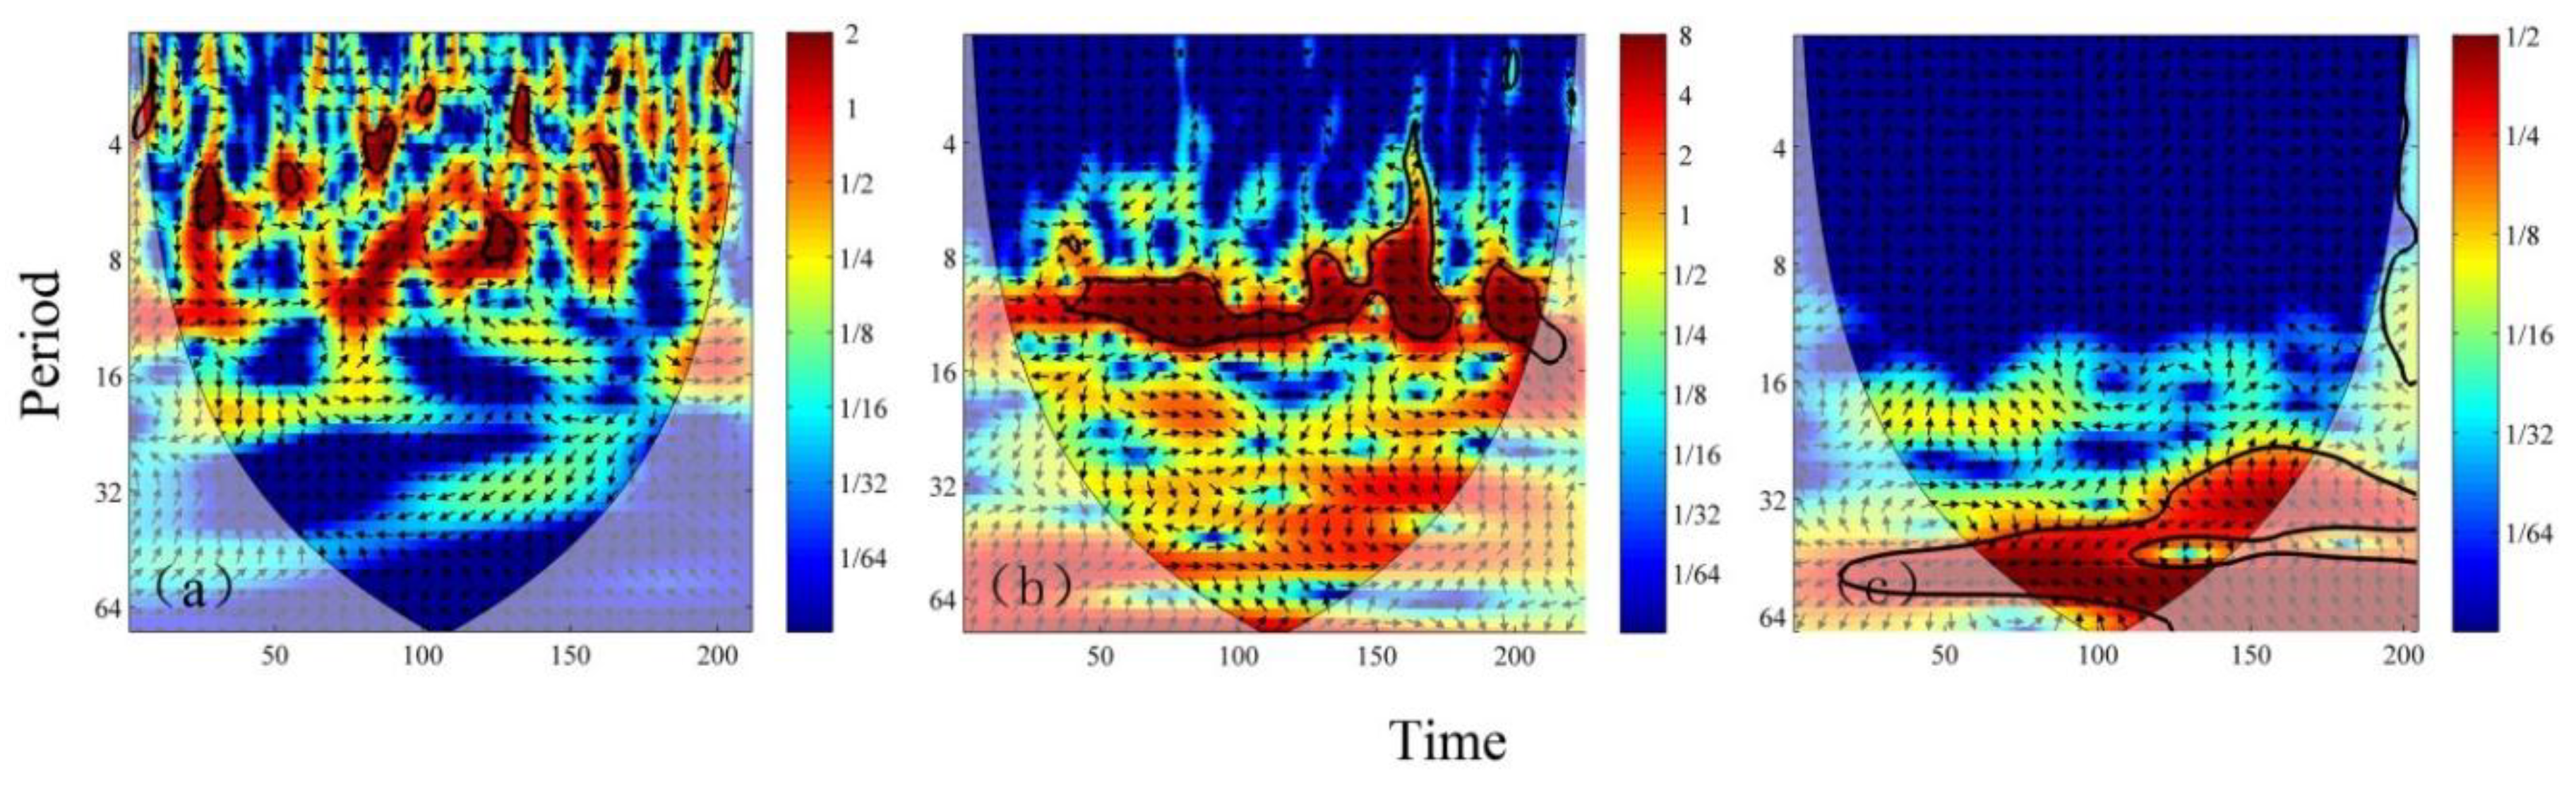
Figure 11.
Composite anomaly maps of 500 hPa vector wind (PDSIp6-7) for the 10 wettest (a) and 10 driest (b) years for the northern Daxing’anling Mountains of Inner Mongolia during the period 1948–2018.
Figure 11.
Composite anomaly maps of 500 hPa vector wind (PDSIp6-7) for the 10 wettest (a) and 10 driest (b) years for the northern Daxing’anling Mountains of Inner Mongolia during the period 1948–2018.

Table 1.
Information about the two sampling sites in the northern Daxing’anling Mountains.
| Site Code | Species | Latitude (N) | Longitude (E) | Elevation (m) | Cores Number | Aspect | Slope |
|---|---|---|---|---|---|---|---|
| HXL | P. sylvestris | 52°12′21.18″ | 122°14′49.22″ | 739 | 34 | S | 30° |
| NSC | P. sylvestris | 52°02′40.47″ | 122°06′02.75″ | 789 | 32 | S | 25° |
Table 2.
Statistics of the leave-one-out calibration results for the common period of 1955–2016.
| Period | R | R2 | R2adj | r | RE | ST | RMSE | PMT |
|---|---|---|---|---|---|---|---|---|
| 1955–2016 | 0.620 | 0.386 | 0.375 | 0.589 | 0.346 | 48/14 | 1.588 | 2.114 |
ST: sign test; RE: reduction of error; RMSE: root mean squared error; PMT: product mean test. All of the statistics are significant at the 95% confidence level.
© 2018 by the authors. Licensee MDPI, Basel, Switzerland. This article is an open access article distributed under the terms and conditions of the Creative Commons Attribution (CC BY) license (http://creativecommons.org/licenses/by/4.0/).
Share and Cite
MDPI and ACS Style
Yu, J.; Shah, S.; Zhou, G.; Xu, Z.; Liu, Q. Tree-Ring-Recorded Drought Variability in the Northern Daxing’anling Mountains of Northeastern China. Forests 2018, 9, 674. https://doi.org/10.3390/f9110674
AMA Style
Yu J, Shah S, Zhou G, Xu Z, Liu Q. Tree-Ring-Recorded Drought Variability in the Northern Daxing’anling Mountains of Northeastern China. Forests. 2018; 9(11):674. https://doi.org/10.3390/f9110674
Chicago/Turabian StyleYu, Jian, Sher Shah, Guang Zhou, Zhenzhao Xu, and Qijing Liu. 2018. "Tree-Ring-Recorded Drought Variability in the Northern Daxing’anling Mountains of Northeastern China" Forests 9, no. 11: 674. https://doi.org/10.3390/f9110674
Note that from the first issue of 2016, this journal uses article numbers instead of page numbers. See further details here.