Species Mixing Regulation with Respect to Forest Ecosystem Service Provision


Forest Growth and Yield Science, Center of Life and Food Sciences Weihenstephan, Technical University of Munich, Hans-Carl-von-Carlowitz-Platz 2, D-85354 Freising, Germany
*
Author to whom correspondence should be addressed.
Forests 2018, 9(10), 632; https://doi.org/10.3390/f9100632
Submission received: 8 August 2018
/
Revised: 9 October 2018
/
Accepted: 10 October 2018
/
Published: 11 October 2018
(This article belongs to the Special Issue Decision Support to Address Multiple Ecosystem Services in Forest Management Planning)
Abstract
:The control and maintenance of species composition of mixed stands is a highly relevant objective of forest management in order to provide multifunctionality and climatic resilience. In contrast to this requirement there is, however, an evident lack of quantitative methods for mixture regulation. In this context, we propose an approach for the regulation of mixture proportions that has been implemented in a forest management model. The approach considers species-specific growth characteristics and takes into account the mixing effect on stand density. We present five exemplary simulations that apply the regulation. Each simulation maintains one of five desired species compositions. In these simulations, we consider the species European beech and Norway spruce under good site conditions, thus representing the most prominent mixed stands in Central Europe. Based on this model experiment, we analyze the potential benefit of controlled mixing regulation for achieving desired levels and combinations of ecosystem service provision, in particular productivity, diversity, and groundwater recharge. We found that a constant 50% basal area share of beech (equivalent growing space share of 80% to 70% depending on stand age) provided the most balanced supply of ecosystem services. Prominently, groundwater recharge considerably decreased when beech basal area shares were held below 50%. We discuss the ecological and practical implications of the regulation approach and different mixing shares.
1. Introduction
In the course of recent decades, it has become a prominent goal of forest policy worldwide that future forests provide a broad spectrum of ecosystem services. Coincidentally, private forest stakeholder groups call for targeted usage of subsidies to pay forest owners for the provision of ecosystem services other than the traditional one of wood production [1].
Mixed species stands are widely accepted to provide a broad range of benefits. They can minimize the risk of calamities [2]. They can be more stable and more economical than monospecific stands [3]. Thus, in many cases, they are better suited for the multifunctional provision of ecosystem services than monocultures [4]. However, this depends on the identity of species and on the ecological context in which the mixed species stands are embedded [5].
Pretzsch and Forrester [6] underpin that the ecosystem service productivity of mixed stands depends on the shares of the contributing species. Mixture regulation, thus, is an obvious instrument for controlling the provision of ecosystem services. Within that scope, the tradeoff between groundwater recharge, tree species and structural diversity, and wood production is crucial. Because drought incidents will likely become more frequent in the future [7,8], groundwater recharge might then become a limiting process for public water supply. Diversity is a criterion of risk mitigation towards climate change as well as a forest management goal itself. Wood production provides renewable raw materials and preserves jobs. However, the specific effect of mixing proportions on these prominent ecosystem services has, to our knowledge, not been studied so far.
Due to the rapid paradigm shift towards mixed stands within Central Europe, there is a strong requirement for novel methods that control the development of mixed species forest stands [9]. Under unmanaged conditions, mixture obviously converges towards a natural state that depends on the species-specific site suitability [10]. According to Gadow and Füldner [11], the crucial requirements for achieving sustainability can exclusively be met if criteria of objective control are created and subjected to a more detailed description and quantification. Given the increasing relevance of mixed species stands, the step from qualitative descriptions towards species-specific quantitative regulations is overdue [12,13]. Coll et al. [14] reveal key questions about mixed forest management through a survey conducted among forest managers. They point out a knowledge gap concerning the quantitative regulation of mixed species stands.
Quantitative silvicultural guidelines are largely limited to even-aged, homogeneous monospecific stand types [15,16], except for very few existing approaches for density management, for example [17,18]. However, most existing concepts, if any, typically emphasize the qualitative steering of the species composition [9,19,20]. Management planning, in contrast, requires regulation, i.e., the maintenance of quantitative target values of mixing proportions [9]. Most current guidelines for the management of mixing proportions apply steering principles [21,22,23,24]. Abetz and Ohnemus [18] define the number of trees as dependent on the production target, time and risk. Thus, the resulting growing space per tree does not consider the species-specific growing requirements like a typical development of the crown projection area. Rather, it considers only the requirements of the silvicultural actor and assumes a dynamic adjustment of the species’ growth requirements. A crucial aspect for mixing regulation is the ongoing availability of growing space per tree, considering species-specific typical stand and individual tree growth [16]. Typically, thinning actions, however, do not take into account varying conditions of individual tree growth at onward time scales [24]. Recent scientific advances increased the understanding of mixed species forests, but the extent to which this information is already suitable for consideration in practice is questionable [14]. Pretzsch and Zenner [9] stated that mixed species forest management guidelines should consider five aspects. When establishing mixed species stands, the temporal or spatial association of the species has to be designed: (i) a species combination with appropriate complementarity in mineral nutrients and water exploitation, as well as in space filling and light use, has to be chosen; (ii) according to mixing proportions; (iii) according to stand density; (iv) these have to be regulated during stand life; and (v) the final aspect in a quantitative management guideline for mixed species forests is the goal-oriented initiation of regeneration by volume reduction in the overstory.
Therefore, first and foremost, in the study at hand we present an approach for the quantitative regulation of mixture proportions. In order to evaluate our approach, we implemented it in the forest management model SILVA [25]. This enabled us to exemplarily simulate the development of mixed-species stands with different desired species shares. To this end, we chose the species Norway spruce (Picea abies (L.) H. Karst.) and European beech (Fagus sylvatica L.) on a fertile site which represented a very typical Central European setting so we could investigate the differential effect of the basal area shares on groundwater recharge, diversity, and wood production.
The study’s key objectives were:
- To propose a quantitative, growing space-based approach for regulation of mixture proportions in mixed stands;
- To demonstrate the efficiency of the approach by means of scenario simulations for a highly prominent tree species mixture in Central Europe;
- To assess the effect of mixture regulation on the provision of the wood production, diversity, and groundwater recharge ecosystem services.
2. Material and Methods
2.1. Approach for the Regulation of Mixture Proportion
Our approach aims to provide species-specific tree number guide curves in a mixed forest stand of two tree species. For both tree species, a mean diameter stem number guide curve is derived, which guarantees the desired basal area shares. The desired species shares are expressed as basal area shares for practical reasons. The biological key to mixing regulation, however, are the growing space shares. That is why both have to be connected. Thus, the basic idea is the consideration of the species-specific individual tree growing space requirement, including its change along mean diameter growth. This method determines the number of trees that are needed to produce a desired basal area composition. In the course of this, the stand area is optimally utilized by providing each individual tree, on average, with its biologically-based growing space requirement oriented by crown projection area.
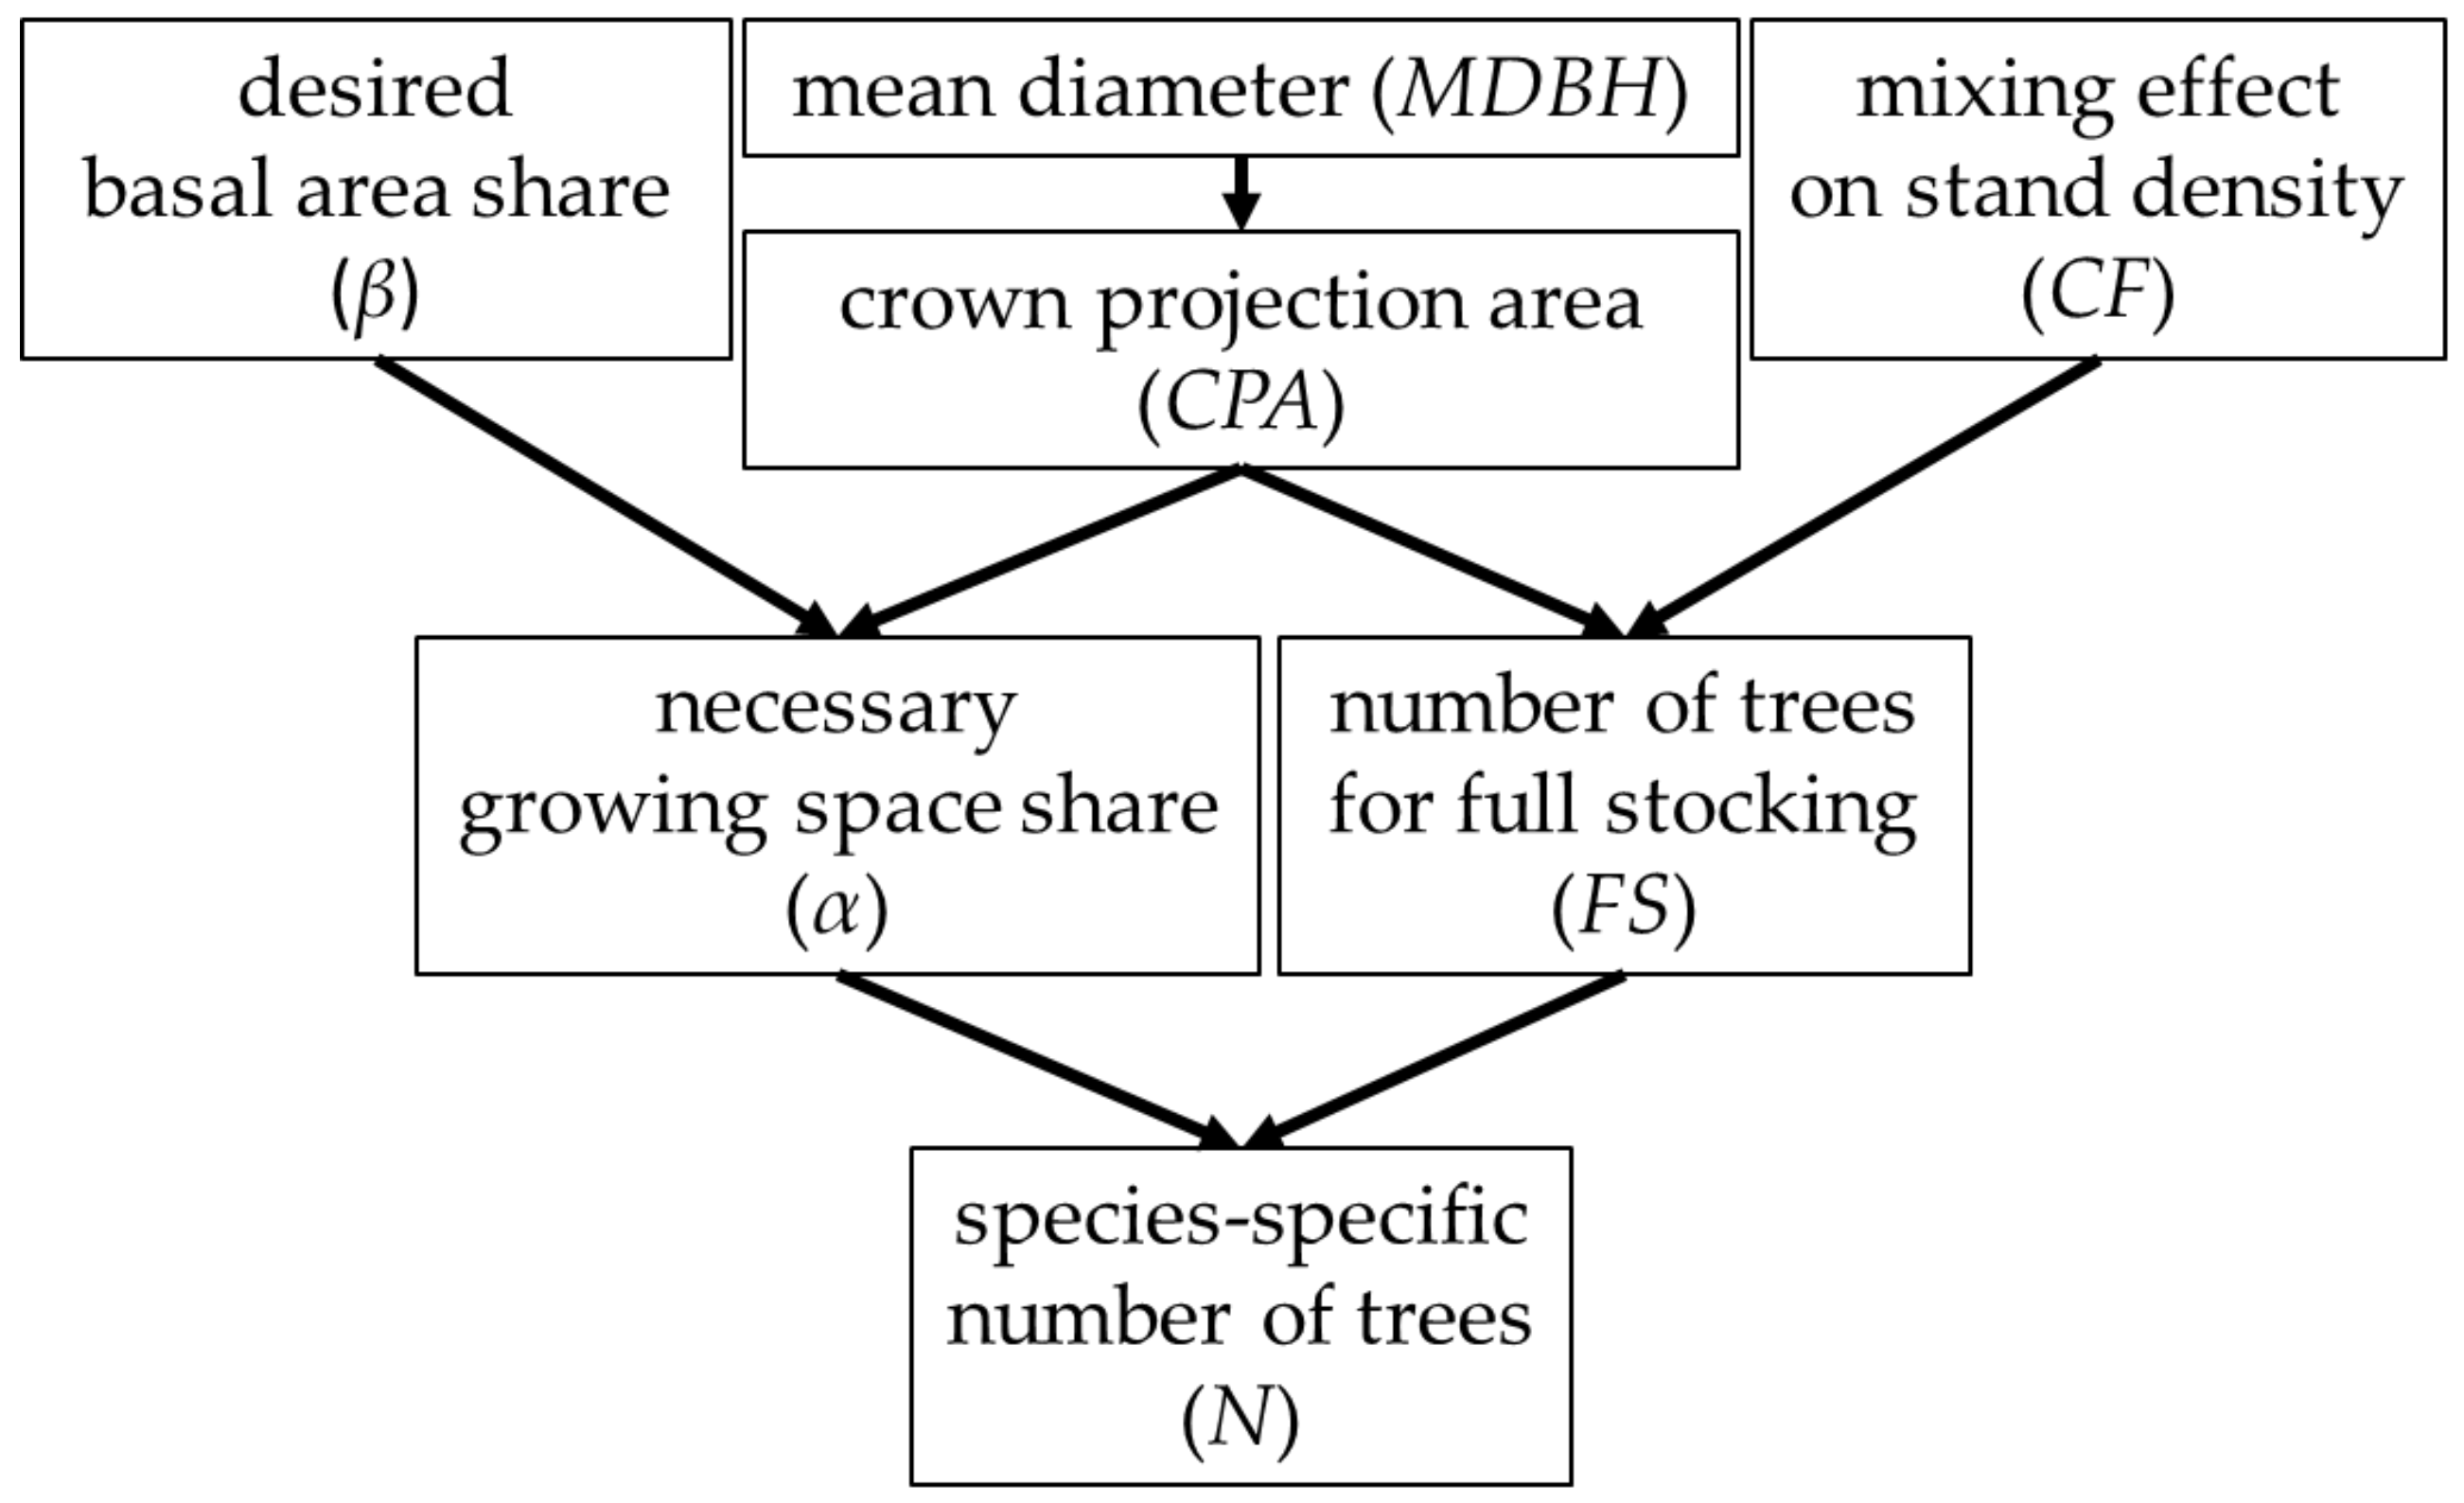
The growing space share (α) and the species-specific number of trees for full stocking (FS) are both needed to calculate the species-specific number of trees (N) (Figure 1). We get α from the crown projection area (CPA) and the desired basal area share (β). We get FS from the CPA and the mixing effect on stand density (CF). The CPA is related to the species-specific mean diameter at breast height (MDBH) of the stand at each stand age.
CF is available from the literature and β can be arbitrarily chosen. Thus, at first, (i) we derived the relation between MDBH and CPA, then (ii) we showed how to calculate FS and (iii) α for finally (iv) getting N.
2.1.1. Mean Diameter at Breast Height-Related Crown Projection Area (CPA)
In order to adapt the regulation approach to species-specific growth characteristics, we provide a species-typical value of required growing space to an average tree of the stand with MDBH. Therefore, we use the crown projection area. The following allometry describes the growth of the crown projection area (CPA (m2)) as dependent on the mean diameter at breast height (MDBH (cm)).
where c and d are species-specific parameters. In order to obtain parameters for Equation (1), the equation was linearized and fitted to data from the network of long-term observation plots in Bavaria [26]. The database from the network of long-term observation contains 28,802 data sets with species-specific single tree information about crown projection area and diameter at breast height. Parameters were obtained that way for the European beech (Fagus sylvatica L.) and Norway spruce (Picea abies (L.) H. Karst, Scots pine (Pinus sylvestris L.), and sessile oak (Quercus petraea (Mattuschka) Liebl.).
2.1.2. Number of Trees for Full Stocking (FS)
Out of the CPA related to the MDBH, we can calculate the stem density at crown closure in a monoculture. However, recent research has shown that facilitation effects between tree species increase the maximum density within a mixed-species stand [27,28,29]. Correction factors for this density increase have been proposed by Pretzsch et al. [30] based on long-term observation data of the four main Central European tree species and each combination of them (Table 1).
That effect is likely due to a more efficient sharing of the canopy space among species. It results in a stem density higher than the one at total crown closure with negligible crown overlap [31,32] (Equation (2)). This information allows us to estimate the stem number per ha at full stocking FS for each species in a mixed stand more realistically:
with CPA being the crown projection area according to Equation (1).
2.1.3. Necessary Growing Space Share (α)
The necessary growing space share that corresponds to a desired basal area share results from the species-specific and stand age-dependent relation between crown projection area and basal area on tree and stand level. The tree’s investment of growing-space-into basal area (IT) describes the average basal area a tree has on one unit of its growing space (Equation (3)):
where MBA (m2) is the mean basal area of a tree and CPA (m2) is the corresponding crown projection area. The stand’s investment of growing space into basal-area (IS) describes the basal area a tree species in a stand has on one unit of its growing space (Equation (4)):
where BAS (m2) is the basal area of one species on stand scale and A (m2) is the sum of the crown projection areas of one species on stand scale. We assume that the relation between the growing-space investments (Equations (3) and (4)) of the two species (1 and 2) is independent of whether we consider just two individual average trees or whole stands (Equation (5)):
where each index value refers to exactly one species and IT and IS are defined as in Equations (3) and (4). Inserting Equation (3) for IT and Equation (4) for IS into Equation (5), we thus obtain:
The mean basal area MBA depends on the mean diameter at breast height (MDBH):
Inserting Equation (1) for CPA and Equation 7 for MBA in Equation (6), we obtain Equation (8):
Equation (8) describes the ratio of the absolute growing space values of basal area and growing space. Equations (9) and (10) describe the relative values respectively, the percentages of basal area share and growing space share of species 1:
Defining α2 and β2 accordingly, we may write Equation (8) using relative shares of growing space and basal area instead of absolute ones. Hence, we obtain the relative growing space share (α) of one species, as dependent on its relative basal area share (Equation (11)):
This equation depends on the mean diameter at breast height (MDBH) of both species considered, namely species 1 and 2.
2.1.4. Species-Specific Stem Number (N) Guide Curves
For obtaining the species-specific number of trees (N), we fill the necessary growing space share (α) required for the desired basal area share (β) until the number of trees for full stocking (FS) is prevalent:
We replace the variables α and FS, using Equation (2) (FS), Equation (1) (CPA) and Equation (11) (α). Furthermore, we consider the mean diameter development as depending on time t (where the MDBH of both species is given). Thus, we obtain the stem number (per ha) guide curve equation, using the example of species 1 (Equation (13)):
For both species in a mixed stand, this equation allows us to calculate an age- or diameter- dependent stem number per ha that guarantees the desired basal area share while keeping the stand fully stocked.
2.2. Example Calibration of the Species Mixing Regulation
We applied the method for developing stem number guide curves for a mixed stand of Norway spruce and European beech. In order to reach a desired basal area share, we calibrated Equation (13) according to the fitted values for c and d from Section 2.1.1 (relation between MDBH and CPA).
Additionally, in order to calibrate guide curves for spruce and beech, a species-specific development of MDBH is required. For this purpose, we assume a stand with even-aged tree species. This approach could also be calibrated with any other diameter development of two tree species, such as for stands with delay in the age of one species. Additionally, two single values of MDBH could be used, for example, to get the number of trees needed in an existing stand for a wanted basal area mixture. Equation (14) describes the species-specific relation between stand age and MDBH:
where we consequently consider time t as species-specific stand age. For comparing the species-specific growth potential, we used sites of best yield class in Germany for both tree species, taken from the German National Forest Inventory (NFI) [33]. This dataset was used to fit the species-specific parameters v and p of Equation (14).
In order to implement the curves into the single tree-based forest simulation model SILVA [25,34], additionally we derived the species-specific relation of top height (i.e., average height of the 100 highest trees per hectare) to stand age:
Therefore, we fitted the species-specific parameters w, u and k according to the best yield class from the German NFI.
2.3. Simulation Study with Exemplary Calibrated Mixing Regulation
2.3.1. Intention of the Simulation Study
In order to demonstrate an application of the mixing regulation approach in the context of multifunctional forestry, we conducted a simulation study about the provision of selected ecosystem services in relation to different species mixture proportions. This simulation study expands on the exemplary guide curve calibration (Section 2.2) for the Norway spruce/European beech mixture. Five simulation runs were executed. Therefore, the applied desired basal area shares (β) of both species were 0%, 20%, 50%, 80% and 100%, which considered both species’ monospecific stands as extreme combinations. Each simulation run covers a time span of 100 years. The simulation outcomes were evaluated with respect to the ecosystem services of (i) wood production (using stand volume growth as indicator variable); (ii) diversity (with the species profile index [34] as proxy variable); and (iii) groundwater recharge (quantified with a new approach by Schwaiger et al. [35]).
2.3.2. Forest Management Model Settings
For the simulation study, we used the single tree-based forest management model SILVA [25,34]. The site conditions of the model were set to the MDBH and h100 development of beech and spruce assumed and calculated in Section 2.2. All simulation runs used the thinning kind of selective thinning and therefore the stand density was regulated according to the guide curves from the regulation approach of the study at hand and calibrated in Section 2.2.
2.3.3. Calculation of the Ecosystem Services: Diversity, Productivity and Groundwater Recharge
The species profile index (K) [36] is a combined measure of a stand’s richness in both species and vertical structure. Basically, it is an extension of the concept of the Shannon Species Diversity Index [37]. In a single layered monoculture, its value is 0, while its maximum value for a two-species mixture is ln(6) ≈ 1.79, which would indicate both species being equally represented in and among the stand’s upper, middle, and understory.
Stand volume growth was used as a proxy for the ecosystem service productivity. The stand volume was calculated by summing up the single tree volumes. Volume increment was defined as the difference between the stand volume in a simulation step and the volume in the timestep before.
The ecosystem service groundwater recharge (GWR) was calculated according to a novel approach of Schwaiger et al. [35] already implemented in SILVA. Based on extensive simulation studies with an ecophysiological forest simulation model, Schwaiger et al. [35] propose a linear function for estimating GWR (in mm/year) based on indicators of stand structure (Equation (16)).
where GWR, within a first step, is the estimated groundwater recharge of a monoculture, MH is the stand’s arithmetic mean height, VH is the variation coefficient of tree height and SDI [38] is the stand density index. The variables a, r, o and m are species- and site-specific parameters. The approach of Schwaiger et al. [35] applies to the site of best yield class Augsburg Western Forests in Bavaria. The site conditions set for the simulation study of this article at hand are assumed to represent one average site of best yield class in Germany. Thus, the site assumptions of both studies are comparable and therefore the groundwater approach of Schwaiger et al. [35] can be used for this simulation study. Schwaiger et al. [35] suggest the parameter values a = 418.72, r = 5.61, o = 234.46, m = −0.28 for Norway spruce, and a = 463.71, r = 0, o = 154.61, and m = 0 for European beech.
GWR = a + r MH + o⋅VH + m⋅SDI
Each of these two species-specific contributions, in a further step, was weighted by the mixing proportion as growing space share GSS in order to estimate the whole stand’s groundwater recharge GWRtotal (Equation (17)):
GWRtotal = GSSspruce GWRspruce + GSSbeech GWRbeech
3. Results
3.1. Exemplary Guide Curve Calibration
3.1.1. Assumed Diameter and Top Height over Stand Age
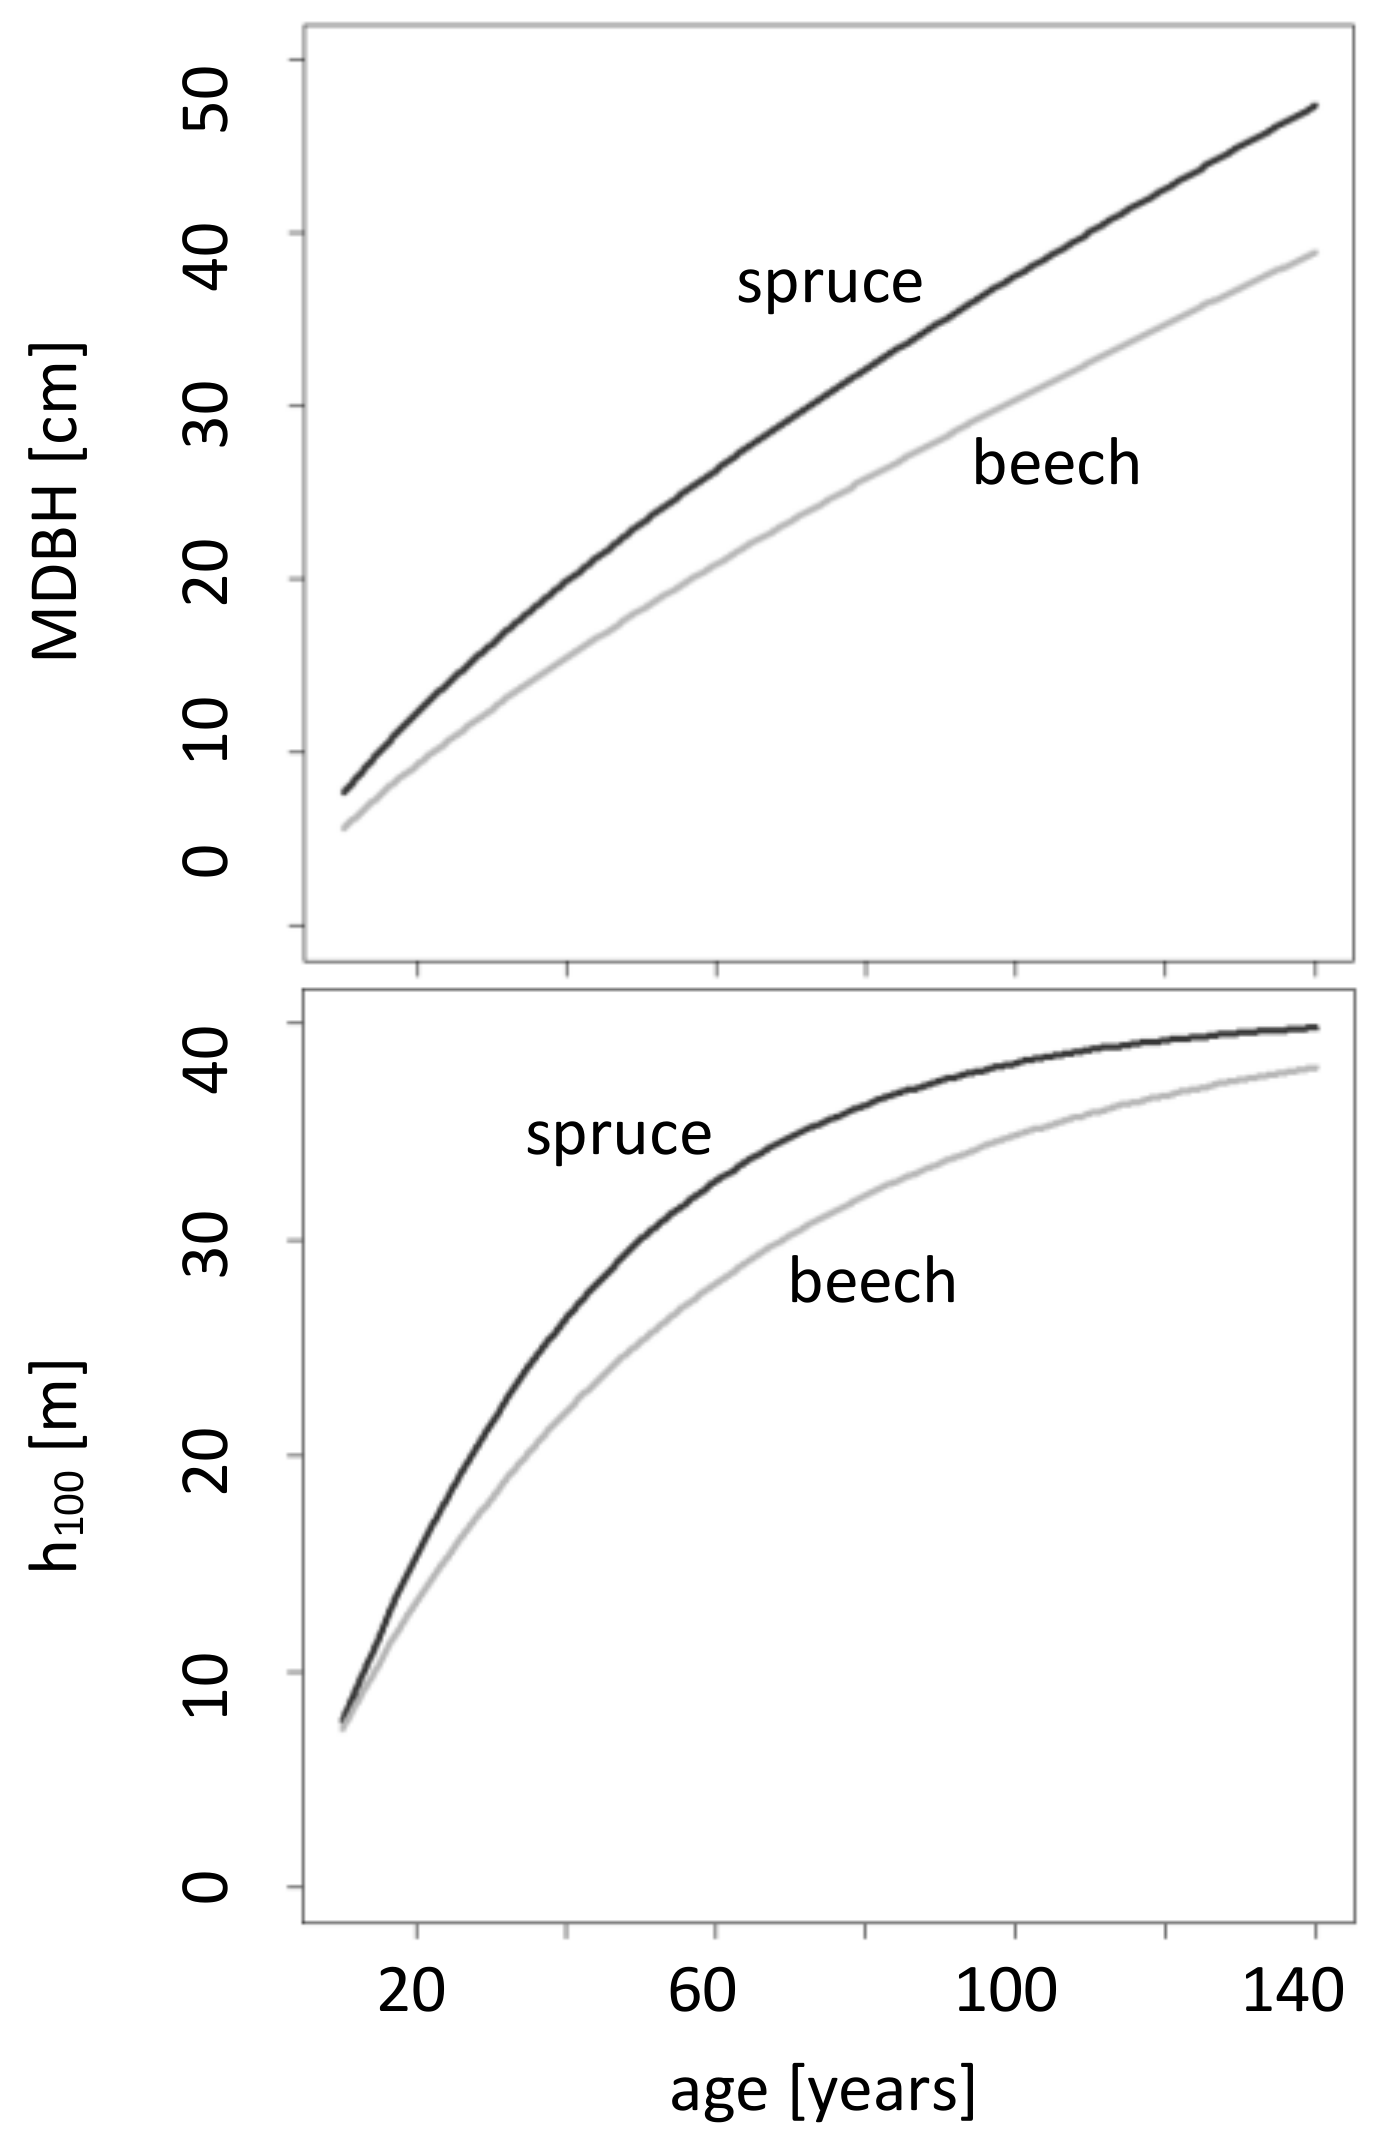
Assuming or knowing the relation of MDBH and h100 to stand age is a basis for calibration of the presented regulation approach. We exemplarily assume values for beech and spruce (calculation in Section 2.2) to calibrate the approach for the simulation study.
Growth of top height and diameter at breast height is higher in the case of spruce compared to beech (Figure 2). At age 100, the prevalent top height for beech is 35 m and 38 m for spruce. Moreover, in a 100-year-old stand, a mean beech diameter at breast height of 30 cm and a mean spruce diameter at breast height of 37 cm can be assumed.
The fitted values (Table 2 and Table 3) describe the species-specific curves of MDBH and h100 in Figure 2 and thus reveal the exact difference between the assumed growth mean diameter at breast height and top height of spruce and beech. To sum up, we can say that the assumed growth potential of spruce regarding h100 and MDBH is higher compared to beech.
3.1.2. Diameter Related Crown Projection Area
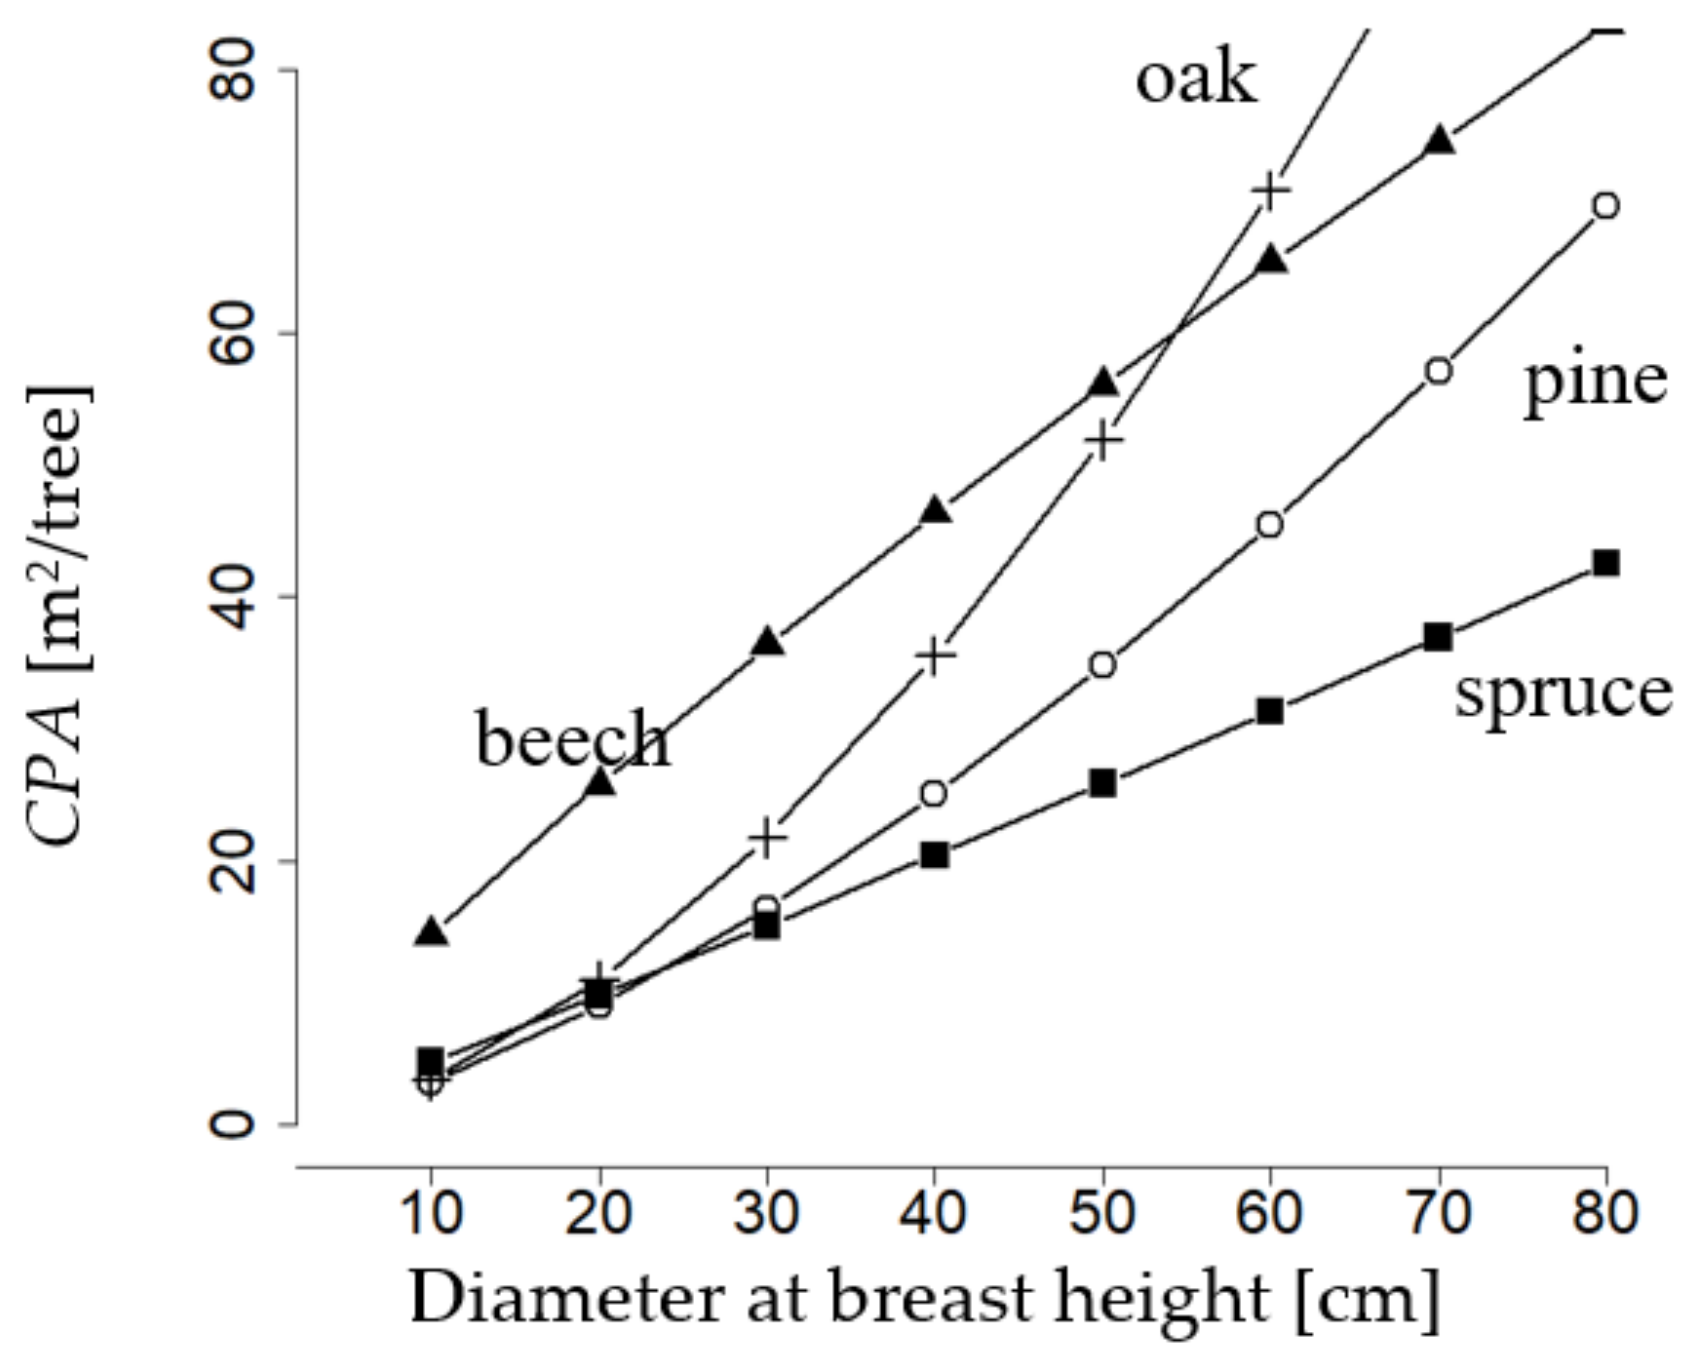
The diameter related crown projection area (Figure 3) is a basis for the presented regulation approach. Those values are suitable for the parametrization of the mixing regulation concerning the four most important tree species in Germany. Thus, they generalize our approach beside the exemplary simulation.
Norway spruce, European beech, sessile oak, and Scots pine, notably differ in their parameters (Table 4) obtained through fitting of the crown projection area function (Section 2.1.1, Equation (1)). That of European beech starts with a large value of about 15 m2 at diameter at breast height of 10 cm, while the one of the remainder species is at only 5 m2. The crown projection area of European beech, starting from low values of diameter at breast height and throughout the whole diameter at breast height range, is markedly larger than that of Scots pine and Norway spruce. Up to a diameter at breast height of 50 cm, it also surpasses that of sessile oak. However, the slope of the crown projection area over diameter at breast height of beech decreases with diameter at breast height. Conversely, that of oak strongly increases. Thus, at a diameter at breast height of more than 50 cm, oak outruns the crown projection area of all other species. Pine, which like oak, is a light-demanding species, has a similar course of crown projection area over diameter at breast height as oak and approximates the values of beech at a diameter at breast height of 80 cm. Spruce has the lowest crown projection area over the whole range of diameter at breast height and one that constantly increases with diameter at breast height. To sum up, we can say that the species-specific relations between diameter and crown projection area are very different, even intersections are visible. Consequently, this relationship is of fundamental importance for the mixture regulation approach of this study.
3.1.3. Exemplary Guide Curve Calculation
The difference between the number of trees for full stocking in monoculture and mixture is one essential intermediate result at the calculation of the guide curve. The exemplary calibrated curves we calculated for a mixture of spruce and beech consider the following difference. Full stocking at crown closure without overlap in monoculture (Section 2.1.2, Equation (2)) has just slightly lower values as the one under assumption of overlapping crowns resp. with mixture adjustment (Figure 4). This is true for both tree species we focus on. However, beech stands have a stem density that is about 50% of that of spruce stands, a direct consequence of the MDBH-CPA relations shown in Figure 3. That proportion continues over the whole stand age.
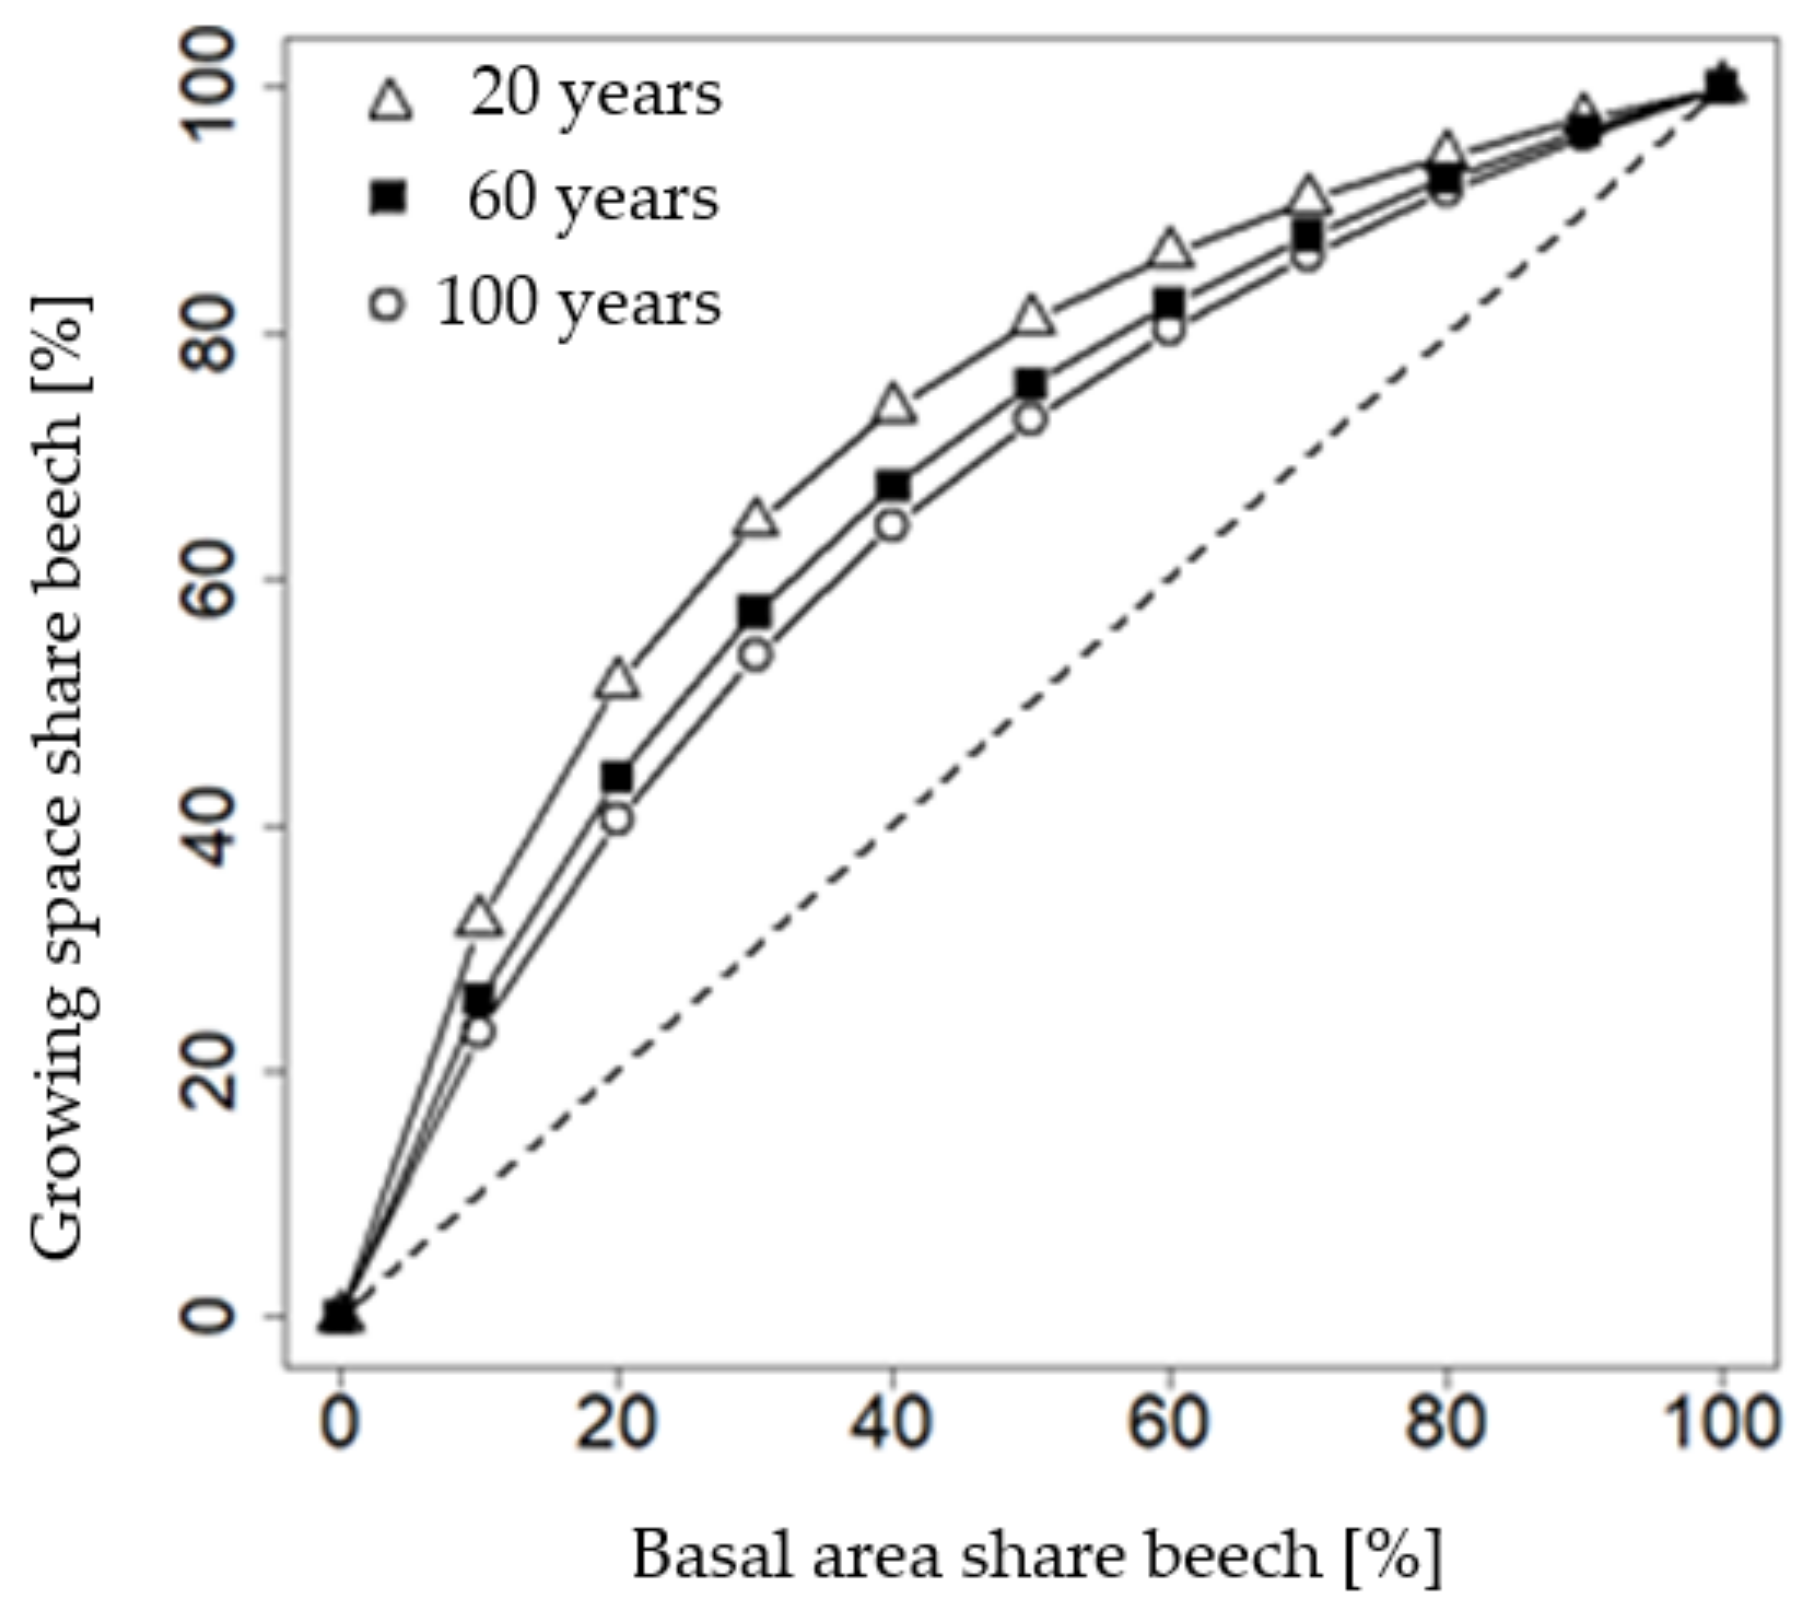
The growing space share of beech mixed with spruce is larger than its basal area share at any mixture proportion of both species being considered (Figure 5). For example, 50% of basal area share requires a beech growing space share of 80% in a 20-year-old stand. This ratio depends on the age of the stand. In an approximately 120 year-old stand, a 50% basal area mixture requires only 70% of the growing space.
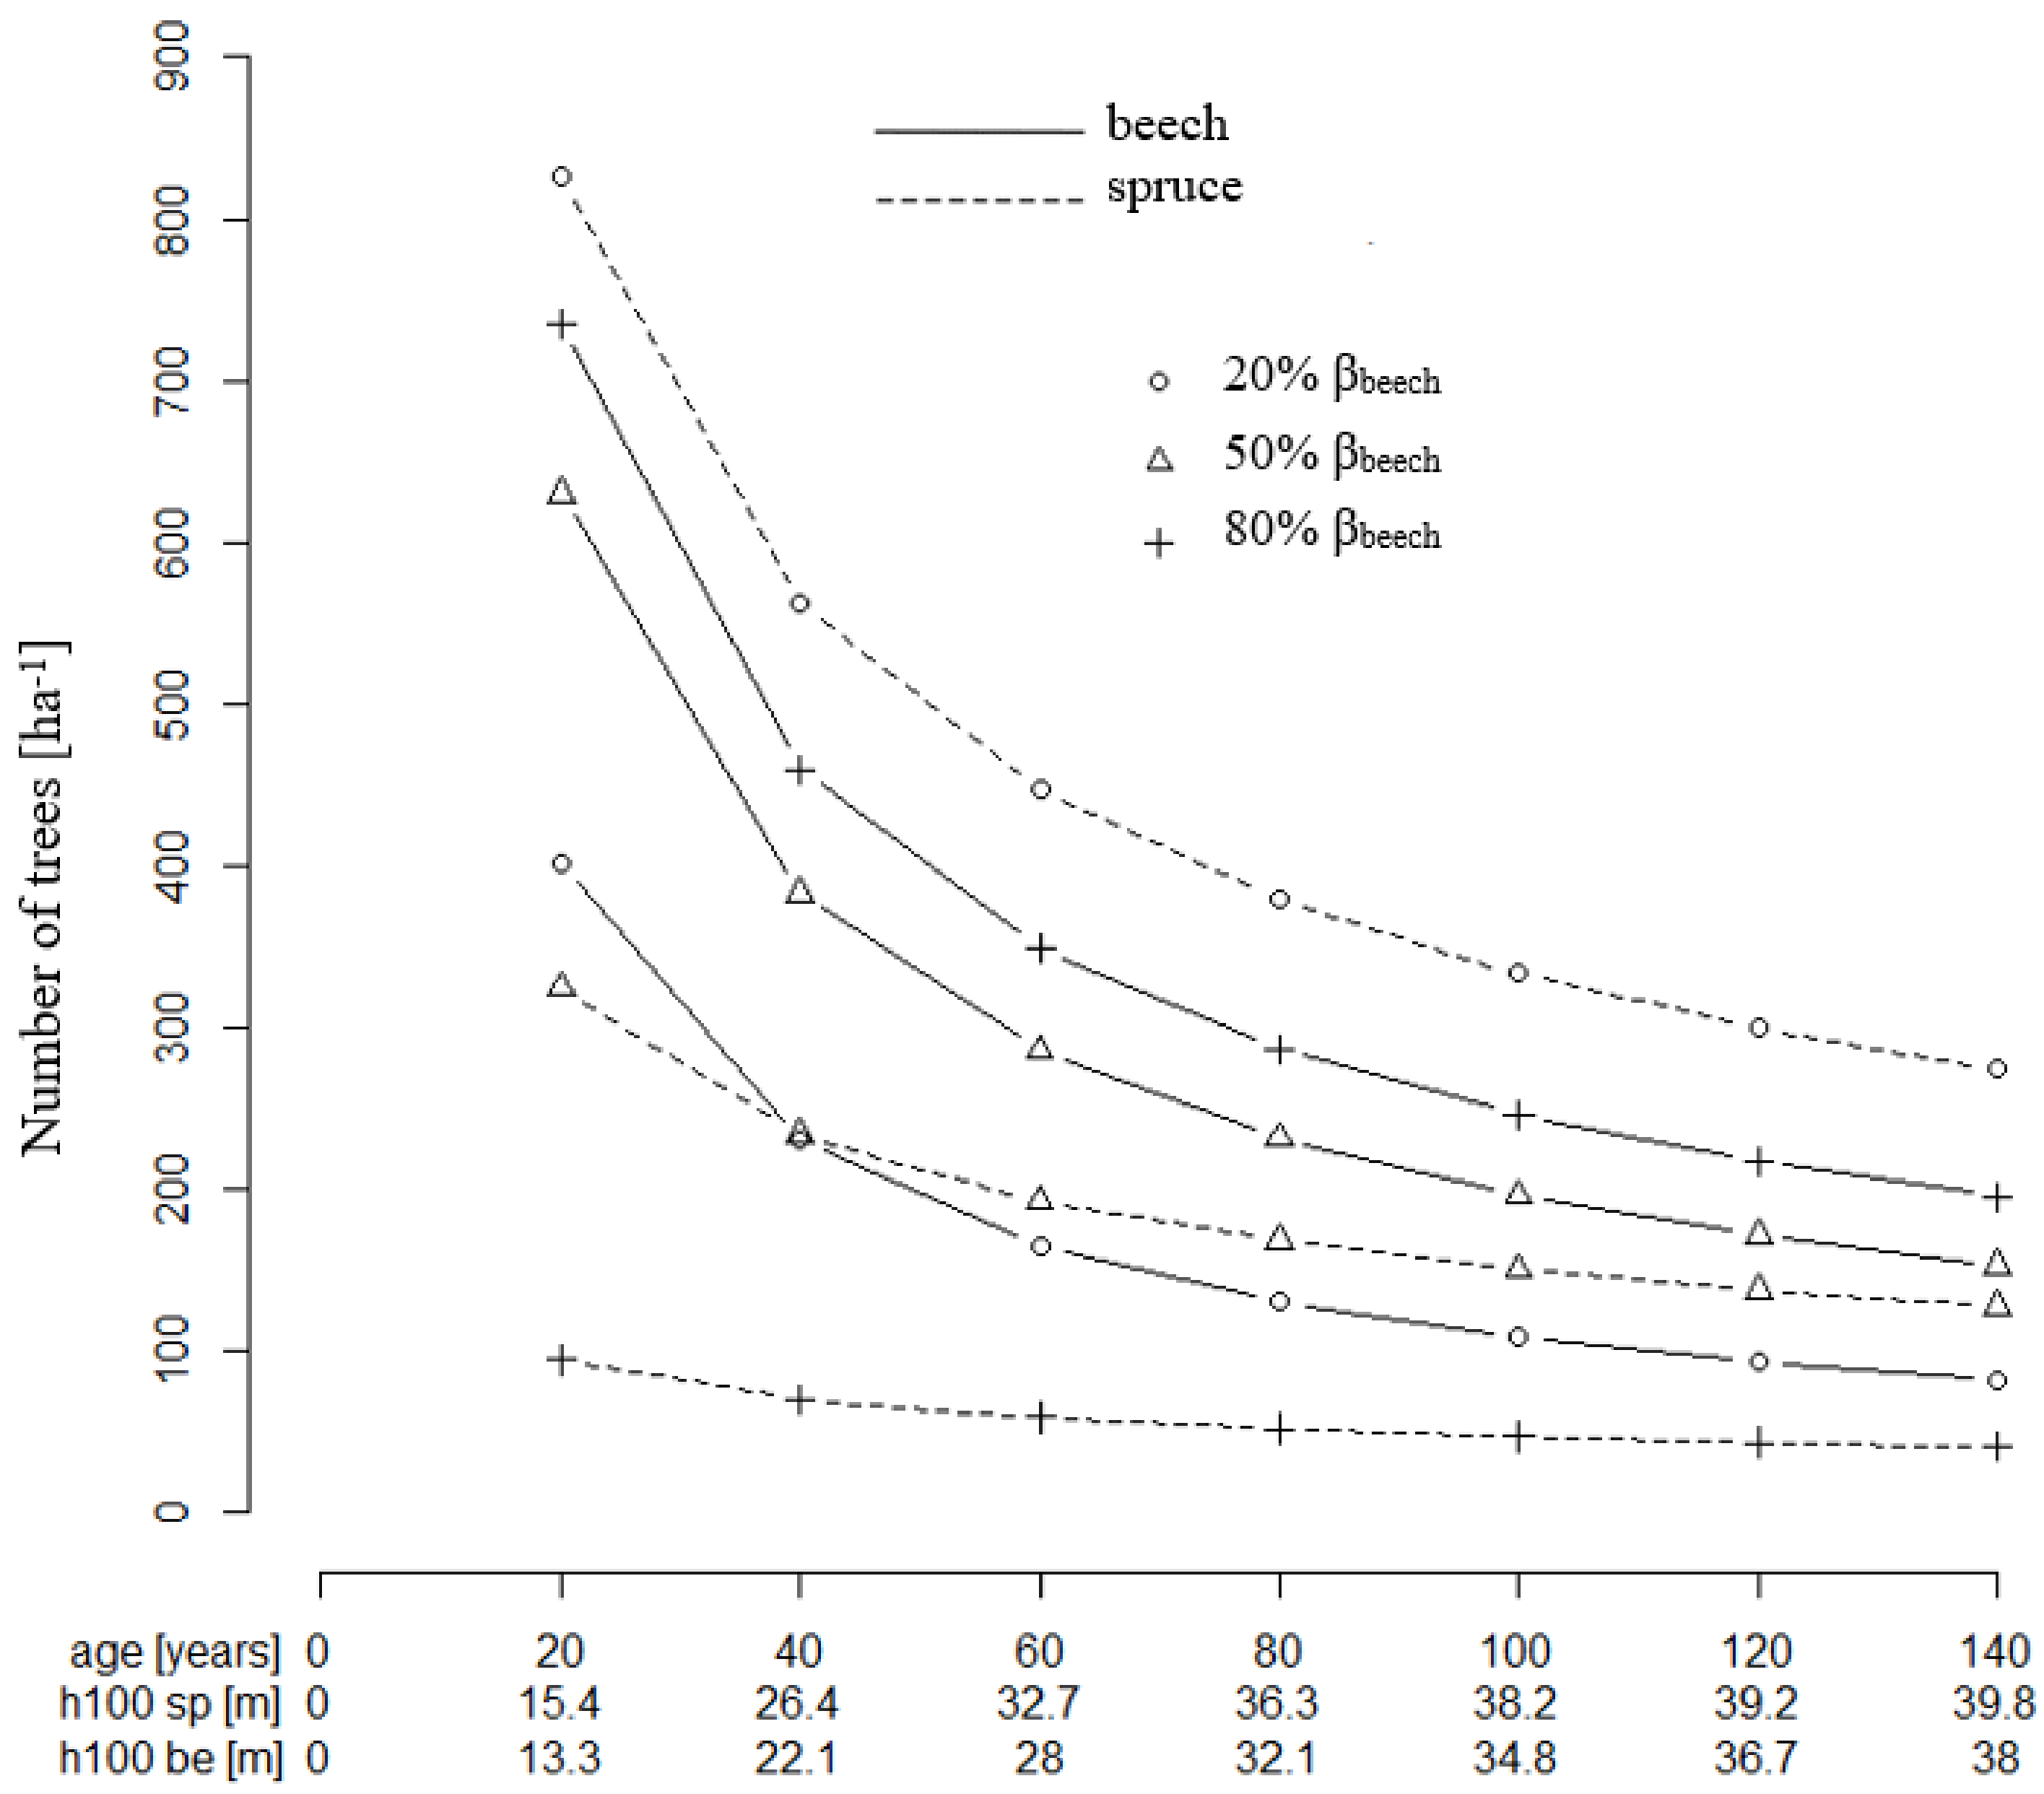
The resulting tree number guide curve (Equation (13)) for European beech and a 50% basal area mixture are marked by a strong decrease of the tree number per ha from age 20 to 140 (Figure 6), which is the typical behavior of stem number curves in even-aged stands. While the beech growing space decreases overtime, the number of trees accordingly drops from about 630 to about 160 (beech) and 320 to about 150 (spruce), respectively. Thus, for equal basal area shares, twice as many beech trees as spruces are required in the beginning, while in an old stand with equal basal area shares, the tree numbers are about balanced. This results from the shifting relation between basal area and growing space shares, as shown above.
3.2. Simulation Study Quantifying Ecosystem Services Provision Depending on Species Shares
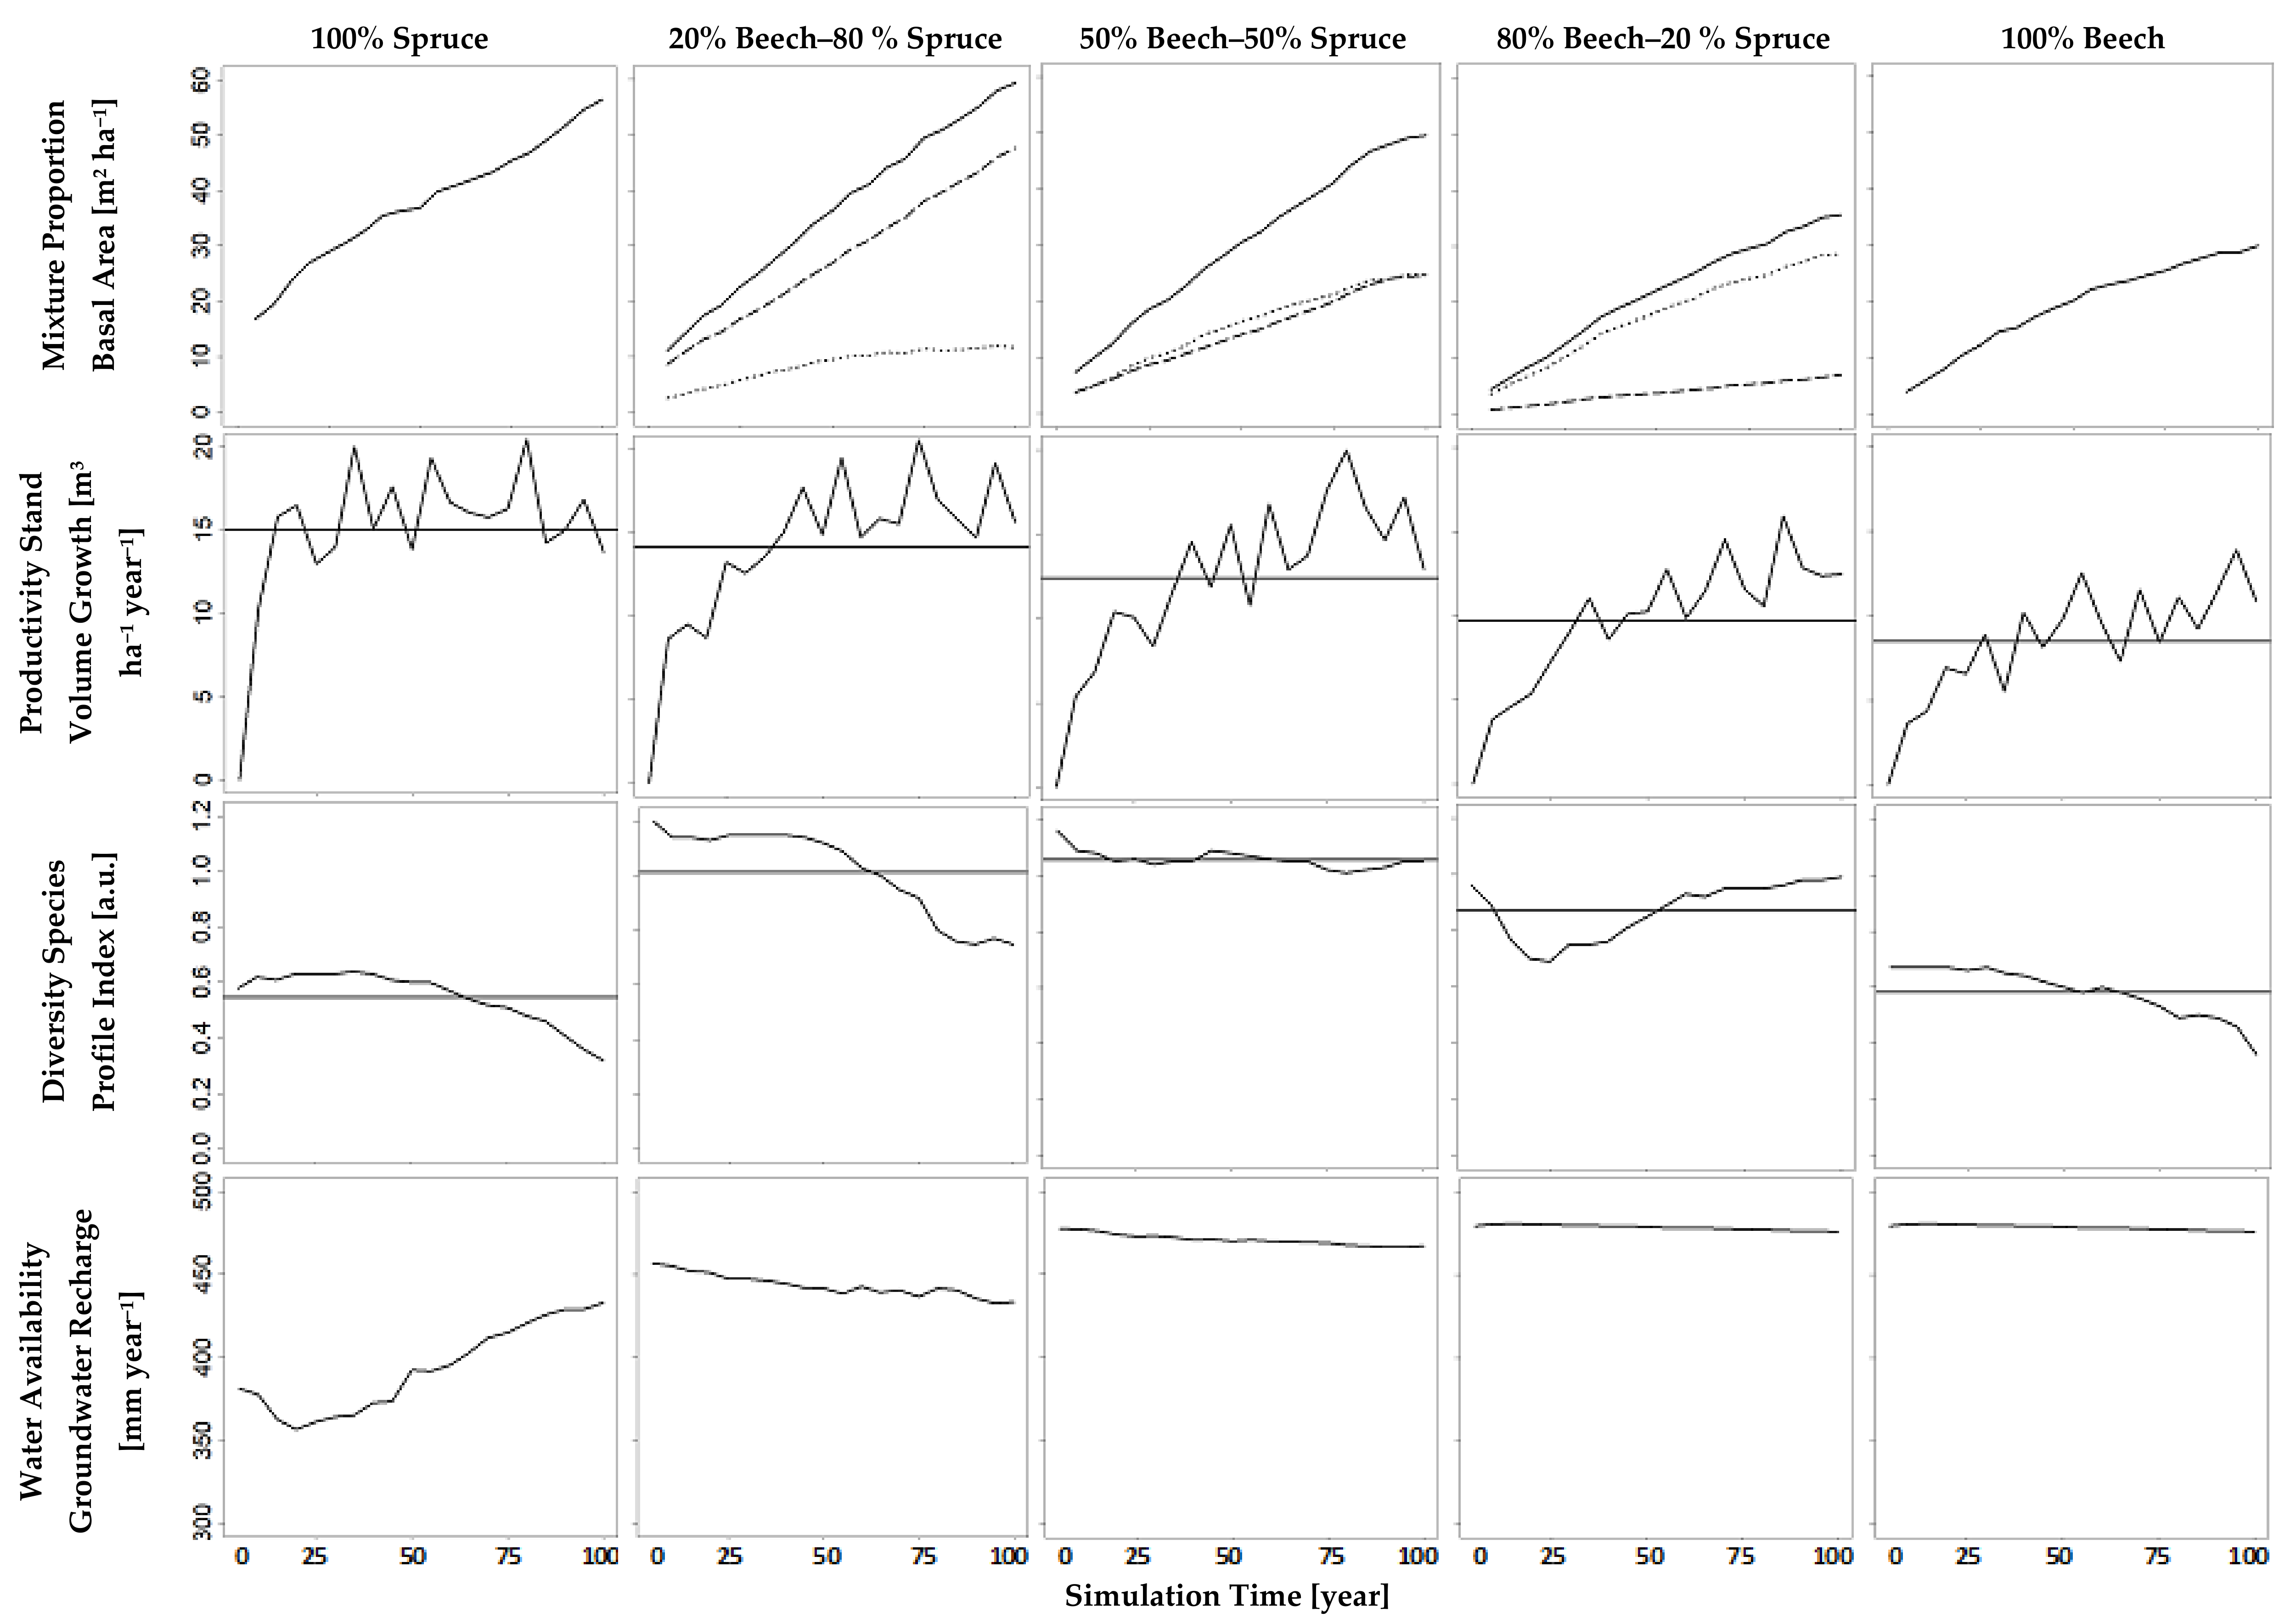
The results of our simulation runs show that the indicators for the ecosystem services we focus on, namely water availability (groundwater recharge), diversity (species profile index), and productivity (stand volume growth), notably depended on the mixture proportions (Figure 7). The latter were defined as the desired basal area shares of beech and spruce, controlled in the simulations using the method developed above. Over the whole simulation period, the simulated beech basal area shares (Figure 7, first row, dotted lines) had an average of 23%, 52%, and 82%, when the tree number guide curves had been adapted to a basal area share of 20%, 50% respectively 80% (Table 5) which we deem reasonably close to the desired values. The resulting simulated growing space shares and basal area shares can be compared with the default desired basal area shares in Table 5.
An increasing basal area share of beech reduced the stand’s total basal area (Figure 7, first row). Accordingly, it caused a reduction of stand volume growth, i.e., productivity. Conversely, an increasing basal area share of that deciduous species markedly fostered groundwater recharge, i.e., water availability; but a beech share higher than 50% did not increase groundwater recharge anymore (Figure 7, bottom row). The results show that groundwater recharge, within that study, is not very sensitive above a beech basal area share over 50%. This is due to the fact that even small basal area shares of beech result in large growing space shares (Table 5). At a basal area share beech of 50%, the indicator of diversity, species profile index was highest.
The curves in Figure 7 illustrate a trade-off between productivity and water availability with changing mixture proportions. Water availability may be aggravated in the future through the choice of a tree species that aims at increasing forest productivity; 100% spruce maximizes productivity and minimizes groundwater recharge; 100% beech maximizes groundwater recharge and minimizes productivity. The optimized provision of both ecosystem services can be reached with a beech share between 20% and 50% in a mixed stand with spruce.
Hence, the results reveal an advantage of monocultures regarding the maximization of single ecosystem services. However, they also point out disadvantages of a monocultural stand. In the simulation study of this paper, even small shares of a secondary tree species considerably increase two ecosystem services, whereas coincidentally only one ecosystem service slightly decreases. Small basal area shares of spruce in beech stands increase productivity and diversity. That increase is being paid for by only a minute decrease of groundwater recharge. In turn, small basal area shares of beech in spruce stands increase groundwater recharge and diversity. This is being paid for by an only slightly decreasing productivity.
Comparing diversity with productivity, we see a trade-off in spruce-dominated stands (100% to 50% spruce) and a synergy in beech-dominated (50% to 100% beech) stands. Furthermore, a change from a synergy to a trade-off is visible comparing diversity with groundwater recharge. In spruce-dominated stands, there is a synergy between diversity and groundwater recharge and in beech-dominated stands, there is a trade-off.
In a real decision making situation, such results based on controlled mixture proportions could be presented to stakeholders. Clearly, it would depend on the stakeholders’ value judgements which mixture proportions they prefer. Productivity-oriented stakeholders like large private forest owners e.g., would typically prefer the spruce monoculture or a 20% beech share at most, because the latter still maintains a high level of wood increment while already profiting from the benefits coming along with having a small share of beech. Multifunctional- and diversity-oriented stakeholders like state forest managers would prefer the 50% mixture because the provision of all ecosystem services considered is the most balanced one. A stakeholder who is responsible for guaranteeing water supply, e.g., a forest owning municipality with own wells, would possibly also prefer the composition with 50% beech shares due to a sparsely decreasing groundwater recharge with higher shares of beech. Coincidentally, the other ecosystem services would decrease with higher beech shares than 50% basal area.
4. Discussion
4.1. The Approach Contributes to Develop Quantitative Guidelines for Mixed Species Forests
According to Pretzsch and Zenner [9], the proposed regulation approach of this study contributes to the development of quantitative guidelines for mixed species forests. Therefore, the approach helps to bridge the gap from science to practice. The approach of this article considers two of five aspects required for quantitative guidelines (temporal or spatial association of the species has to be designed (i); species combination with appropriate complementarity in mineral nutrients and water exploitation, space filling and light use has to be chosen (ii); mixing proportions (iii) and stand density (iv) have to be regulated during stand life; goal-oriented initiation of regeneration by volume reduction in the overstory (v)). The tree number guide curves are suitable for regulation of mixture proportion (aspect iii) and stand density (aspect iv) in thinning interventions. The exemplary simulations show that the method was effective in achieving the desired mixture proportions throughout the whole simulation time of 100 years. The tree number guide curves constructed with our method are based on the stand age and species-specific growing space requirements, which explicitly include species-mixing effects.
4.2. Mixing Proportions Are Crucial for Managing the Ecosystem Services Provision
By steering species mixture proportions, forest management influences the provision of ecosystem services. Multifunctional forestry is highly relevant, especially in European state forests. Nevertheless, forest stakeholders often focus on a small set or only one ecosystem service like wood production without the effects on other services being considered [39,40,41]. Trade-offs between ecosystem services are often caused by different tree species that provide different ecosystem services [4,42]. There are results that reveal that tree diversity influences the delivery of ecosystem services [41,43]. However, from the perspective of operational forest management, there is still uncertainty about the extent and quantity. Hence, it is important to better evaluate the effect of tree species mixing, i.e., tree species diversity, on ecosystem service provision [5,44]. Two recently published review papers call for more research concerning this topic to enable substantiated consulting for forest management and policy to broaden the consideration of ecosystem service provision in practice [44,45]. Combined with proxies for ecosystem services, the approach results in added value for practice, as the present simulation study has shown.
As an attempt towards attaining unambiguous species share regulation in practice and regarding modelling tools, we propose our approach for regulating the basal area share per species within mixed species stands. The results of applying it in the framework of an exemplary simulation study underpin that the approach presented is suitable for identifying trade-offs between various ecosystem services at a mixing proportion being considered. We see an important advantage in being able to directly and closely control species shares for such purposes. Investigations by Pretzsch et al. [30] pertaining to the mixing effects on forest stand productivity consider tree species shares. Further studies that investigate other ecosystem services as related to mixing ratios are rare.
From a stakeholder’s or decision maker’s point of view, such an approach allows to choose species compositions more rationally depending on the envisaged ecosystem services. Forest management influences ecosystem service trade-offs and thus influences the multifunctionality of forests [46]. We obtain the tradeoffs between ecosystem services by varying species shares in our plausible exemplary simulation studies and mostly as expected in a qualitative sense. In a quantitative sense, however, they allow us to check where exactly a desired optimum, which is a considerable support for planning, can be found. When a certain range of mixture proportions turns out to be of special interest, finer subdivisions of species shares can be applied and investigated for their effects on ecosystem service provision.
4.3. Important Considerations within the Regulation Approach
The suggested calculation of the tree number guide curves in this study is based on site- and species-specific development of height, diameter, and crown projection area. Generally, known ecological strategies of the tree species are recognizable in the crown-diameter allometry results, as shown in Figure 3. Vieilledent et al. [47] found higher CPA for spruce compared to the results of this study. But additionally, it is known that crown-allometry is quite variable. Thus, we think that an approximation to species-specific mean values is conceivable and should be tried. By allowing the implementation of such allometries straightforwardly from whatever species, our approach directly takes into account the consequences for silvicultural mixture regulation arising from the contributing species’ ecology.
The age-dependent growing space proportion that a species requires for the desired basal area share can be calculated by the aforementioned allometric developments. Pretzsch and Schütze [48] stated that beech uses its growing space not as efficiently as spruce for biomass production. On the one hand, at the same diameter at breast height, a beech tree occupies more growing space than a spruce. On the other hand, beech stems are thinner than spruce stems at the same age. This combination causes spruce to require just 20% growing space share in a spruce-beech mixed forest in order to have a basal area share of 50%. This illustrates how little growing space has to be available for spruce to be not only the secondary but co-dominating tree species.
In a 50% basal area mixture, the stem number ratio between the species approximates from two beeches to one spruce to almost one beech to one spruce. The tree number ratio in a stand with 50% growing space mixture is almost two spruces to one beech all the time. Those relationships are the most important ones to enable the quantitative regulation of the desired mixture proportions.
4.4. Weaknesses, Limitations, Further Development
Mori et al. [45] stated that it is not trivial to bridge gaps between science and practice. However, forest research is expected to support managing, conserving, and restoring mixed species forest ecosystems [45]. We conclude that the approach presented in this article represents such a bridge between practice and research. Because it allows a clear, unambiguous control of the mixture proportions and takes into account new scientific findings such as the mixing effect on stand density. However, there are also some weaknesses and potential to include more recent scientific advances and knowledge about mixed species forests. The usage of recent scientific advance in this article is expandable concerning three issues: implementation of knowledge about mixed species forests (i) and uneven-aged forests (ii) into the regulation approach, and ecosystem service assessment (iii).
The study at hand introduces an approach for implementing scientific knowledge about mixed species stands within an algorithm for quantitative control of species proportions at optimal utilization of growing space. Within that scope it exemplifies a set of variables that is pivotal and, thereby, sensitizes for the level of detail that deserves consideration in practice. The approach includes mixing effects on stand density as a result of recent research that strongly contributes to quantitative mixed stand management. However, it is open for refinements that likely will result from ongoing work on the effects of mixture on stand development. In particular, there are clues that the aforementioned mixing effects are not constant but dependent on site quality (SQ), mixing proportions (β), and stand age (t) [49]. The improvement of highest priority will thus be an extended definition of the correction factors (CF) through functions that use the three influencing variables as predictors. A well-reasoned candidate for implementing that relation is a multiple non linear model CF (SQ, β, t). Furthermore, research might refine the estimates of species specific allometric coefficients. Crown allometrics are different in mixed species stands than in monocultures, as investigations with modern technology like terrestrial laser scanning have revealed [31]. Therefore, additional correction factors could be implemented for adjustment of the correlation between mean diameter at breast height (MDBH) and crown projection area (CPA). However, the authors point out that management approaches should not become overly complex in practice. When transferring knowledge into practice, the principle of “as complex as necessary and as simple as possible” should be followed. This means the sensitivity of the output of the approach regarding additional detail and knowledge from further research has to be in an order of magnitude which is relevant for decision making in practice.
In addition to knowledge about mixed species stands, knowledge about structure should also be implemented. It was beyond the scope of this study to take into account uneven-aged stands but we see the potential to calibrate the approach for any temporal or spatial association of the species according to the claims of Pretzsch and Zenner [9] (Section 4.1 (i)). So, further development of the approach could concentrate on the application and modification not only for MDBH over the same stand age for both species. Additionally, diameter distributions instead of one single MDBH would be an opportunity for further improvement with respect to enlargement.
Since mixture regulation itself is at the forefront of this article, the assessments of the ecosystem services are rather subordinate. Therefore, the effort to assess the ecosystem services was kept practicable. Existing variables should be used. Estimation of the productivity of a system was assessed by the use of volume increment. The species profile index results from the tree number per height class and species. Based on the concept of entropy that is a well-established proxy of ecological diversity, that index identifies the highest level if all tree species are distributed equally across the three vertical stand strata. It may indicate diversity in scenarios which produce identical basal-area proportions per species on stand level. However, that effect is not mechanically determined, because on the one hand the species profile index considers vertical structure, and on the other hand our approach regulates basal area shares which is not the same as the tree number proportions that the index is based on. We are aware that the species profile index is only one of many possible indicators for biodiversity, but as it covers two important aspects of diversity (species and structural richness) in one number, we deemed it especially applicable for the study at hand. However, a practical extension of that method will certainly comprise a complementary set of biodiversity indicators, such as a deadwood metric or a metric based on very large trees [50]. The predictors of groundwater recharge are overall structural attributes of the mixed stand being considered. That way, the method takes into account the collective spatial stand structure that results from occupation of the stand’s canopy per species. Thus, it presumes a horizontally homogeneous crown distribution pattern among all tree species per canopy layer, as a differentiation by attributes of spatial clustering is likely impracticable. In order to account for species-specifity of the relation between structure and groundwater recharge, groundwater recharge prediction applies the structural attributes to statistical models (Equation (16)) that had been fitted on a per-species basis in pure stands, and weights the outcome by species proportion. These models were derived from extensive systematic simulation runs with an ecophyisological forest growth model. However, it should be noted anyway that this approach [35] is a method that is designed for enabling a forest management simulation model roughly to estimate groundwater recharge which was—to the best of our knowledge—not possible before.
5. Conclusions
The novel thinning approach of this study enables a quantitative and precise regulation of mixture proportions in real and simulated mixed species stands. The study underpins the benefit of maintaining a desired mixture proportion for a controlled provision of ecosystem services. The proposed approach is not limited to the species chosen as an example in this study. It is efficient for conducting simulation studies for forest practice, especially in the context of the very modern question of multiple ecosystem service provision. An exemplary simulation study suggests that monocultures are ideal for the provision of one major ecosystem service. However, even small basal area proportions of admixed species may notably increase the provision of other services, while just sparsely decreasing the provision of the stand’s major service.
Author Contributions
Conceptualization, F.S.; Supervision, H.P.; Writing—original draft, F.S.; Writing—review and editing, W.P., P.B. and H.P.
Funding
Special thanks are due to the European Union for support of this study through funding of project ALTERFOR within the Horizon 2020 research and innovation program under grant agreement No. 676754. Additionally, we thank the European Union for supporting this study through funding of the project ClusterWIS within the European Regional Development fund under grant agreement EFRE-080003. This work was supported by the German Research Foundation (DFG) and the Technical University of Munich (TUM) in the framework of the Open Access Publishing Program.
Acknowledgments
We thank the Bavarian State Ministry of Nutrition, Agriculture and Forestry for the permanent support of project W07 “Long-term experimental plots for forest growth and yield research” (#7831-22209-2013). We also thank the Thünen Institut Eberswalde for supplying National Forest Inventory data.
Conflicts of Interest
The authors declare no conflict of interest. Responsibility for the information and views set out in this article/publication lies entirely with the authors.
Appendix A. Stand Density Correction Factors
The stand density correction factors shown in Table 1 result from evaluations made in the context of the publication [30] written in German.
Table A1 below shows the full set of values calculated by the authors of [30] who kindly permitted us to publish this table and corresponding results, which we briefly explain.

Table A1.
Number of trees per ha (N) in mixed-species stands in relation to the neighboring monocultures calculated separately for five selected species assemblages (as resulting from evaluations in the context of [30] and kindly provided by the authors). Ratios mixed/mono above/below 1.00 indicate a superiority/inferiority of the species’ performance in mixed-species stands versus monocultures. Ratios in bold numbers indicate significant differences (p < 0.05) between mixed-species stands and monocultures.
| Variable | Species Combination | n | Species 1 Mixed/Mono (±SE) | Species 2 Mixed/Mono (±SE) | Total Stand Mixed/Mono (±SE) |
|---|---|---|---|---|---|
| Number of trees N (trees ha−1) | |||||
| spruce/pine | 7 | 1.78 (± 0.38) | 1.06 (± 0.12) | 1.44 (± 0.25) | |
| spruce/larch | 10 | 2.72 (± 1.62) | 1.07 (± 0.20) | 1.57 (± 0.54) | |
| spruce/beech | 52 | 0.90 (± 0.05) | 1.20 (± 0.06) | 1.03 (± 0.06) | |
| pine/beech | 17 | 1.22 (± 0.10) | 1.59 (± 0.13) | 1.40 (± 0.09) | |
| oak/beech | 24 | 1.23 (± 0.08) | 1.27 (± 0.13) | 1.25 (± 0.10) | |
The investigation focused on single-layered mixed-species stands consisting of two tree species. It considered combinations of datasets from mixed and monospecific stands of the corresponding species at equal site conditions. Therefore, that previous work included a total of nine species combinations. The study exclusively included stands representing maximum densities which were not or only weakly treated. The datasets come from an extensive network of long-term observation plots [26] complemented with temporary investigation plots. In total, the data comprise 141 neighboring combinations of mixed and monospecific stands. The included combinations of monospecific and mixed stands are predominantly situated in Germany, but also represent other regions in Central Europe.
For comparing the number of trees per ha regarding both species in total (Table A1), the measured values of the mixed stands were set in relation to the values from the adjacent monospecific stands weighted to the mixing proportions prevalent in the mixed stand being compared. Therefore, the resulting weighted value formed the reference for comparison with the corresponding observed value of the adjacent mixed stand. For that comparison on the level of the tree species (Species 1 and Species 2 in Table A1), the contribution per tree species to the mixed stand was scaled up to one hectare with the mixing proportion and then compared with the corresponding neighboring monospecific stand.
To compare the mean values, the corresponding values of the mixed stand were divided by those of the monospecific stand of the same species [30]. The mean quotient over all combinations then serves to check whether the values in the mixed stands are greater than those in the monospecific stands. If 1.0 was beyond the confidence intervals of the average quotients, the differences between mixed and monospecific stands were significant at the level p ≤ 0.05. If the confidence interval is above 1.0, the mixed stand is superior to the monospecific stand(s); if the confidence interval is below 1.0, the mixed stand is inferior to the monospecific stand.
Appendix B
Appendix B.1. Diameter-Related Crown Projection Area
The relation between mean stand diameter and the corresponding crown projection area as expressed in Equation (1) is crucial for the mixing regulation approach proposed in this study. We present the parameter values and their standard errors in Table 4. The data we used for estimating these parameter values come from the network of long-term observation plots in Bavaria [26], which comprises about 300 trials where the oldest date back to the 1870ies.
Equation (1) may be straightforwardly linearized by taking the equation’s logarithm to estimate the parameters c (ln(c)) and d from intercept and slope. We calibrated Equation (1) based on individual tree data. The parameters of that crown projection area function were obtained by fitting the linearized Equation (1) with ordinary least squares (OLS) regression separately for the tree species European beech, Norway spruce, Scots pine, and sessile oak. Additional characteristics of the diameter-dataset provides Table A2. The dataset contains a dbh range from 0.7 cm to 131.9 cm and a cpa range from 0.20 m2 to 431.7 m2 and thus the magnitudes necessary for application purposes in this study are covered. The sample size for spruce and beech were highs.
Table A2.
Characteristics of the crown projection area-dataset used for fitting Equation (1).
| Tree Species | Min | Median | Max | n | |
|---|---|---|---|---|---|
| spruce | cpa (m2) | 0.22 | 11.80 | 251.95 | 9.997 |
| dbh (cm) | 0.7 | 24.3 | 109.7 | ||
| pine | cpa (m2) | 0.26 | 10.05 | 151.36 | 4.520 |
| dbh (cm) | 5.1 | 21.5 | 85.5 | ||
| beech | cpa (m2) | 0.29 | 26.04 | 431.70 | 10.348 |
| dbh (cm) | 3.1 | 18.5 | 127.6 | ||
| oak | cpa (m2) | 0.20 | 19.39 | 348.03 | 3.937 |
| dbh (cm) | 3.6 | 29.6 | 131.9 |
cpa = crown projection area, dbh = diameter at breast height.
Appendix B.2. Diameter over Stand Age
We required two typical mean diameter developments over age. This was necessary for exemplarily inferring crown projection area development from diameter development within the exemplary calibration and demonstration of the approach.
In order to obtain a generic relation of mean tree diameter to age that covers most common conditions of site and thinning, we analyzed the data of the third NFI [33]. We formed one subset of the NFI data per tree species and age in years. Per subset, we formed the weighted average diameter. In order to obtain the diameter-to-age relation, we fitted Equation (14) to the resulting data set. Therefore we used OLS-regression Additional characteristics of the diameter-dataset provides Table A3. The dataset contains a dbh range from 7 cm to 51.7 cm and an age range from 9 to 140 years and thus the magnitudes necessary for application purposes in this study are covered. The sample size for spruce is more than twice as high as for beech.
Table A3.
Characteristics of diameter-dataset used for fitting Equation (14).
| Tree Species | Min | Median | Max | n | |
|---|---|---|---|---|---|
| beech | age (year) | 9 | 74.50 | 140 | 54,512 |
| dbh (cm) | 7.0 | 23.3 | 46.5 | ||
| spruce | age (year) | 9 | 74.50 | 140 | 122,743 |
| dbh (cm) | 8.4 | 29.7 | 51.7 |
dbh = diameter at breast height.
Appendix B.3. Top Height over Stand Age
The relation of top height over stand age (Equation (15)) was exclusively used for controlling the time per thinning intervention in SILVA that has to be defined per top height within the model preferences. In order to obtain a species-specific data set of top height to age we first formed the top height as the 95% height quantile per plot. In beech-dominated plots, we considered that top height as the one of beech. In spruce-dominated plots we defined it as the one of spruce. In order to gain early and frequent interventions during simulation, we calibrated Equation (15) to the 90% quantile of top height over age that results in a relatively young age per given top height. Therefore, we used a non-linear regression. Additional characteristics of the height dataset are provided in Table A4. The dataset contains a top height range from 3.1 m to 46.6 m and an age range from 9 to 140 years, and thus the magnitudes necessary for application purposes in this study are covered. The sample size for spruce is more than twice as high as for beech.
Table A4.
Characteristics of height dataset used for fitting Equation (15).
| Tree Species | Min | Median | Max | n | |
|---|---|---|---|---|---|
| beech | age (year) | 10 | 83.00 | 140 | 54,512 |
| top height (m) | 3.1 | 26.4 | 46.1 | ||
| spruce | age (year) | 9 | 60.00 | 140 | 122,743 |
| top height (m) | 3.6 | 27.0 | 46.6 |
References
- DFWR. Wahlprüfsteine zur Bundestagswahl 2017. Deutsch Forstwirtsch AFZ-Der Wald 2017, 11–16, 16–21. [Google Scholar]
- Jactel, H.; Brockerhoff, E.G. Tree diversity reduces herbivory by forest insects. Ecol. Lett. 2007, 10, 835–848. [Google Scholar] [CrossRef] [PubMed]
- Knoke, T.; Ammer, C.; Stimm, B.; Mosandl, R. Admixing broadleaved to coniferous tree species: A review on yield, ecological stability and economics. Eur. J. For. Res. 2008, 127, 89–101. [Google Scholar] [CrossRef]
- Gamfeldt, L.; Snäll, T.; Bagchi, R.; Jonsson, M.; Gustafsson, L.; Kjellander, P.; Ruiz-Jaen, M.C.; Fröberg, M.; Stendahl, J.; Philipson, C.D.; et al. Higher levels of multiple ecosystem services are found in forests with more tree species. Nat. Commun. 2013, 4, 1340. [Google Scholar] [CrossRef] [PubMed] [Green Version]
- Schuler, L.J.; Bugmann, H.; Snell, R.S. From monocultures to mixed-species forests: Is tree diversity key for providing ecosystem services at the landscape scale? Landsc. Ecol. 2017, 32, 1499–1516. [Google Scholar] [CrossRef]
- Pretzsch, H.; Forrester, D.I. Stand Dynamics of Mixed-Species Stands Compared with Monocultures. In Mixed-Species Forests: Ecology and Management; Pretzsch, H., Forrester, D.I., Bauhus, J., Eds.; Springer: Berlin, Germany, 2017; pp. 117–209. [Google Scholar]
- Spinoni, J.; Vogt, J.V.; Naumann, G.; Barbosa, P.; Dosio, A. Will drought events become more frequent and severe in Europe? Int. J. Climatol. 2018, 38, 1718–1736. [Google Scholar] [CrossRef]
- Turral, H.; Burke, J.J.; Faurès, J.M. Climate Change, Water and Food Security; Food and Agriculture Organization of the United Nations: Rome, Italy, 2011. [Google Scholar]
- Pretzsch, H.; Zenner, E.K. Toward managing mixed-species stands: From parametrization to prescription. For. Ecosyst. 2017, 4, 19. [Google Scholar] [CrossRef]
- Biber, P.; Knoke, T.; Pretzsch, H. Eine Waldwachstumskundlich-Ökonomische Simulationsstudie zu Effekten der Baumartenmischung Fichte-Buche: Konzept und Erste Ertragskundliche Ergebnisse. Available online: Sektionertragskunde.fvabw.de/2013/Beitrag_13_09.pdf (accessed on 20 September 2018).
- Von Gadow, K.; Füldner, K. New ways of describing a thinning. Forstwiss. Cent. 1995, 114, 151. [Google Scholar]
- Pretzsch, H.; Forrester, D.I.; Bauhus, J. Mixed-Species Forests. Ecology and Management; Springer: Berlin, Germany, 2017. [Google Scholar]
- Pretzsch, H.; Knoke, T.; Paul, C.; Bauhus, J.; Forrester, D.I. Perspectives for Future Research on Mixed-Species Systems. In Mixed-Species Forests: Ecology and Management; Pretzsch, H., Forrester, D.I., Bauhus, J., Eds.; Springer: Berlin, Germany, 2017; pp. 579–606. [Google Scholar]
- Coll, L.; Ameztegui, A.; Collet, C.; Löf, M.; Mason, B.; Pach, M.; Verheyen, K.; Abrudan, I.; Barbati, A.; Barreiro, S.; et al. Knowledge gaps about mixed forests: What do European forest managers want to know and what answers can science provide? For. Ecol. Manag. 2018, 407, 106–115. [Google Scholar] [CrossRef]
- Bauhus, J.; Forrester, D.I.; Gardiner, B.; Jactel, H.; Vallejo, R.; Pretzsch, H. Ecological Stability of Mixed-Species Forests. In Mixed-Species Forests: Ecology and Management; Pretzsch, H., Forrester, D.I., Bauhus, J., Eds.; Springer: Berlin, Germany, 2017; pp. 337–382. [Google Scholar]
- Bauhus, J.; Forrester, D.I.; Pretzsch, H.; Felton, A.; Pyttel, P.; Benneter, A. Silvicultural Options for Mixed-Species Stands. In Mixed-Species Forests: Ecology and Management; Pretzsch, H., Forrester, D.I., Bauhus, J., Eds.; Springer: Berlin, Germany, 2017; pp. 433–501. [Google Scholar]
- Long, J.N.; Shaw, J.D. A Density Management Diagram for Even-Aged Sierra Nevada Mixed-Conifer Stands. West. J. Appl. For. 2012, 27, 187–195. [Google Scholar] [CrossRef]
- Abetz, P.; Ohnemus, K. Der Z-Baum-Bestockungsgrad (Definition, Herleitung, Anwendung). AFJZ 1994, 165, 177–185. [Google Scholar]
- Oliver, C.D.; Larson, B.C. Forest Stand Dynamics; Wiley: New York, NY, USA, 1996. [Google Scholar]
- Ammer, C. Konkurrenzsteuerung—Anmerkungen zu einer Kernaufgabe des Waldbaus beim Aufbau vielfältiger Wälder. Eberswalder Forstliche Schriftenreihe 2008, 36, 21–26. [Google Scholar]
- Utschig, H.; Neufanger, M.; Zanker, T. Das 100-Baum-Konzept als Einstieg für Durchforstungsregeln in Mischbeständen. Allgemeine Forstzeitschrift für Waldwirtschaft und Umweltvorsorge 2011, 21, 4–6. [Google Scholar]
- Hansen, J.; Nagel, J. Das Paket Silviculture für die Automatisierte Simulation Waldbaulicher Szenarien. Available online: http://sektionertragskunde.fvabw.de/2016/07_Hansen_Nagel.pdf (accessed on 11 October 2018).
- Schröpfer, R.; Utschig, H.; Zanker, T. Das Fichten-Konzept der BaySF. LWF Aktuell 2009, 68, 7. [Google Scholar]
- Ammann, P. Biologische Rationalisierung. Teil 4: Baumartenmischung und Anwendungsbereich. Wald HOLZ 2005, 4, 35–37. [Google Scholar]
- Pretzsch, H.; Biber, P.; Ďurský, J. The single tree-based stand simulator SILVA: Construction, application and evaluation. For. Ecol. Manag. 2002, 162, 3–21. [Google Scholar] [CrossRef]
- Pretzsch, H.; Uhl, E.; Nickel, M.; Steinacker, L.; Schütze, G. Die lange Geschichte der ertragskundlichen Versuchsflächen in Bayern. LWF Wissen 2014, 76, 7–30. [Google Scholar]
- Pretzsch, H. Ertragstafel-Korrekturfaktoren für Umwelt- und Mischungseffekte. AFZ Der Wald 2016, 14, 47–50. [Google Scholar]
- Pretzsch, H.; Biber, P. Tree species mixing can increase maximum stand density. Can. J. For. Res. 2016, 46, 1179–1193. [Google Scholar] [CrossRef] [Green Version]
- Thurm, E.A.; Pretzsch, H. Improved productivity and modified tree morphology of mixed versus pure stands of European beech (Fagus sylvatica) and Douglas-fir (Pseudotsuga menziesii) with increasing precipitation and age. Ann. For. Sci. 2016, 73, 1047–1061. [Google Scholar] [CrossRef]
- Pretzsch, H.; Schütze, G.; Biber, P. Zum Einfluss der Baumartenmischung auf die Ertragskomponenten von Waldbeständen. Allg. For. Jagdztg 2016, 187, 122–135. [Google Scholar]
- Bayer, D.; Seifert, S.; Pretzsch, H. Structural crown properties of Norway spruce (Picea abies L. Karst.) and European beech (Fagus sylvatica L.) in mixed versus pure stands revealed by terrestrial laser scanning. Trees 2013, 27, 1035–1047. [Google Scholar] [CrossRef]
- Pretzsch, H. Canopy space filling and tree crown morphology in mixed-species stands compared with monocultures. For. Ecol. Manag. 2014, 327, 251–264. [Google Scholar] [CrossRef]
- Dritte Bundeswaldinventur—Ergebnisdatenbank. Available online: https://bwi.info (accessed on 25 February 2017).
- Pretzsch, H.; Kahn, M. Konzeption und Konstruktion des Wuchsmodells SILVA 2.2—Methodische Grundlagen. In Forschungsvorhaben “Konzeption und Konstruktion von Wuchs- und Prognosemodellen für Mischbestände in Bayern”: Abschlussbericht Projekt W 28 Teil 2.; Lehrstuhl für Waldwachstumskunde der Ludwig-Maximilians-Universität München: Freising, Germany, 1998. [Google Scholar]
- Schwaiger, F.; Poschenrieder, W.; Rötzer, T.; Biber, P.; Pretzsch, H. Groundwater recharge algorithm for forest management models. Ecol. Model. 2018, 385, 154–164. [Google Scholar] [CrossRef]
- Pretzsch, H. Strukturvielfalt als Ergebnis waldbaulichen Handelns. Allg. For. Jagdztg 1996, 167, 213–221. [Google Scholar]
- Shannon, C.E. The mathematical theory of communication. In The Mathematical Theory of Communication; Shannon, C.E., Weaver, W., Eds.; University of Illinois Press: Urbana, OH, USA, 1948. [Google Scholar]
- Reineke, L.H. Perfecting a stand density index for even aged forests. J. Agric. Res. 1933, 46, 627–638. [Google Scholar]
- Chhatre, A.; Agrawal, A. Trade-offs and synergies between carbon storage and livelihood benefits from forest commons. Proc. Natl. Acad. Sci. USA 2009, 106, 17667–17670. [Google Scholar] [CrossRef] [PubMed] [Green Version]
- Verkerk, P.J.; Mavsar, R.; Giergiczny, M.; Lindner, M.; Edwards, D.; Schelhaas, M.J. Assessing impacts of intensified biomass production and biodiversity protection on ecosystem services provided by European forests. Ecosyst. Serv. 2014, 9, 155–165. [Google Scholar] [CrossRef]
- Duncker, P.S.; Raulund-Rasmussen, K.; Gundersen, P.; Katzensteiner, K.; de Jong, J.; Ravn, H.P.; Smith, M.; Eckmüllner, O.; Spiecker, H. How Forest Management Affects Ecosystem Services, including Timber Production and Economic Return: Synergies and Trade-Offs. Ecol. Soc. 2012, 17, 228–244. [Google Scholar] [CrossRef]
- Van der Plas, F.; Manning, P.; Allan, E.; Scherer-Lorenzen, M.; Verheyen, K.; Wirth, C.; Zavala, M.A.; Hector, A.; Ampoorter, E.; Baeten, L.; et al. Jack-of-all-trades effects drive biodiversity-ecosystem multifunctionality relationships in European forests. Nat. Commun. 2016, 7, 11109. [Google Scholar] [CrossRef] [PubMed] [Green Version]
- Isbell, F.; Calcagno, V.; Hector, A.; Connolly, J.; Harpole, W.S.; Reich, P.B.; Scherer-Lorenzen, M.; Schmid, B.; Tilman, D.; van Ruijven, J.; et al. High plant diversity is needed to maintain ecosystem services. Nature 2011, 477, 199–202. [Google Scholar] [CrossRef] [PubMed] [Green Version]
- Brockerhoff, E.G.; Barbaro, L.; Castagneyrol, B.; Forrester, D.I.; Gardiner, B.; González-Olabarria, J.R.; Lyver, P.O.B.; Meurisse, N.; Oxbrough, A.; Taki, H.; et al. Forest biodiversity, ecosystem functioning and the provision of ecosystem services. Biodivers. Conserv. 2017, 26, 3005–3035. [Google Scholar] [CrossRef] [Green Version]
- Mori, A.S.; Lertzman, K.P.; Gustafsson, L.; Cadotte, M. Biodiversity and ecosystem services in forest ecosystems: A research agenda for applied forest ecology. J. Appl. Ecol. 2017, 54, 12–27. [Google Scholar] [CrossRef]
- Langner, A.; Irauschek, F.; Perez, S.; Pardos, M.; Zlatanov, T.; Öhman, K.; Nordström, E.-M.; Lexer, M.J. Value-based ecosystem service trade-offs in multi-objective management in European mountain forests. Ecosyst. Serv. 2017, 26, 245–257. [Google Scholar] [CrossRef]
- Vieilledent, G.; Courbaud, B.; Kunstler, G.; Dhôte, J.-F.; Clark, J.S. Individual variability in tree allometry determines light resource allocation in forest ecosystems: A hierarchical Bayesian approach. Oecologia 2010, 163, 759–773. [Google Scholar] [CrossRef] [PubMed] [Green Version]
- Pretzsch, H.; Schütze, G. Crown allometry and growing space efficiency of Norway spruce (Picea abies L. Karst.) and European beech (Fagus sylvatica L.) in pure and mixed stands. Plant Biol. 2005, 7, 628–639. [Google Scholar] [CrossRef] [PubMed]
- Zhang, Y.; Chen, H.Y.H.; Reich, P.B. Forest productivity increases with evenness, species richness and trait variation: A global meta-analysis. J. Ecol. 2012, 100, 742–749. [Google Scholar] [CrossRef]
- Lafond, V.; Cordonnier, T.; Mao, Z.; Courbaud, B. Trade-offs and synergies between ecosystem services in uneven-aged mountain forests: Evidences using Pareto fronts. Eur. J. For. Res. 2017, 136, 997–1012. [Google Scholar] [CrossRef]
Figure 1.
Conceptual diagram of the approach for the regulation of mixture proportion and of the computation of tree number guide curves. To obtain the number of trees (N), we filled the necessary growing space share (α) required for the desired basal area share (β) until full stocking. The number of trees per hectare for full stocking (FS) results from the species-specific crown projection area (CPA) and a correction factor (CF) for suitability in mixed species stands. The necessary growing space share results from the desired basal area share and the stand age dependent diameter (MDBH) related crown projection area.

Figure 2.
Assumed development of top height and mean diameter at breast height (MDBH) for the parametrization of the regulation approach within the exemplary simulation; parameters in Table 2 and Table 3 (more detailed database information, see Appendix B.2 and Appendix B.3).
Figure 2.
Assumed development of top height and mean diameter at breast height (MDBH) for the parametrization of the regulation approach within the exemplary simulation; parameters in Table 2 and Table 3 (more detailed database information, see Appendix B.2 and Appendix B.3).

Figure 3.
Crown projection area (CPA) over diameter at breast height for sessile oak (cross), European beech (triangle), Scots pine (circle), Norway spruce (square), as expected with the fitted model after Equation (1), parameters in Table 4 (more detailed database information, see Appendix B.1).
Figure 3.
Crown projection area (CPA) over diameter at breast height for sessile oak (cross), European beech (triangle), Scots pine (circle), Norway spruce (square), as expected with the fitted model after Equation (1), parameters in Table 4 (more detailed database information, see Appendix B.1).

Figure 4.
Number of trees at full stocking per ha (FS) over stand age (t) based on Equation (2), given for Norway spruce (sp) and European beech (be); given in addition to over top height h100. Curves shown with a solid line refer to monospecific stands and therefore assume a mixture adjustment CF of 1.0 in Equation (2) (Section 2.1.2); curves shown with a dotted line assume that crowns overlap according to a mixture adjustment CF of 1.03 in Equation (2) (Section 2.1.2, Table 1). The mean diameter at breast height in Equation (2) was taken according to the stand age (Figure 2); crown projection parameters (c, d) from Table 4.

Figure 5.
Conversion between growing space share (α) and basal area share (β) in a mixed stand of European beech (be) and Norway spruce (sp). Each line presents one stand age (t): triangle = 20 years, square = 60 years, circle = 100 years. α was calculated as α1 from Equation (11) and as dependent on the basal area share given as β1 in Equation 11. The diameter at breast height in Equation (2) was taken according to the stand age (Figure 2); parameters c1 and c2 in Equation (11) were taken from Table 4.

Figure 6.
Guide curves of tree number per ha over age calculated with Equation (13) for Norway spruce (sp) and European beech (be) and each of three different basal area shares (βspecies = 20%, 50% and 80%); The diameter at breast height was taken according to the stand age (Figure 2); parameters c1 and c2 in Equation (13) were taken from Table 3.

Figure 7.
Influence of basal area composition on water availability, diversity and productivity based on simulation runs within a mixed stand of European beech and Norway spruce (Section 2.3); each column refers to exactly one run; that run presumed a relation of beech vs. spruce basal area as given by the column header; dotted line—beech, dashed line—spruce, horizontal line—average, solid line—total stand.

Table 1.
Correction factors for species combinations of four tree species (values resulting from evaluations in the context of [30], see Appendix A). European beech, Norway spruce, Scots pine and sessile oak.
Table 1.
Correction factors for species combinations of four tree species (values resulting from evaluations in the context of [30], see Appendix A). European beech, Norway spruce, Scots pine and sessile oak.
| Species Combination | Correction Factor (CF) |
|---|---|
| spruce/pine | 1.44 |
| spruce/beech | 1.03 |
| pine/beech | 1.40 |
| oak/beech | 1.25 |
Table 2.
Estimates of the MDBH functions for European beech, Norway spruce (Equation (14); Section 2.2; more detailed database information, see Appendix B.2).
Table 2.
Estimates of the MDBH functions for European beech, Norway spruce (Equation (14); Section 2.2; more detailed database information, see Appendix B.2).
| Tree Species | v | p | n | ||
|---|---|---|---|---|---|
| Estimate | Std. Error | Estimate | Std. Error | ||
| Beech | 0.04223 | 0.07 | 0.73227 | 0.02 | 54,512 |
| Spruce | 0.4462 | 0.04 | 0.6904 | 0.01 | 122,743 |
Table 3.
Estimates of the h100-functions for European beech, Norway spruce (Equation (15); Section 2.2; more detailed database information, see Appendix B.3).
Table 3.
Estimates of the h100-functions for European beech, Norway spruce (Equation (15); Section 2.2; more detailed database information, see Appendix B.3).
| Tree Species | w | u | k | n | |||
|---|---|---|---|---|---|---|---|
| Estimate | Std. Error | Estimate | Std. Error | Estimate | Std. Error | ||
| Beech | 40.72 | 0.46 | 0.01916 | 0.00 | 0.9808 | 0.03 | 54,512 |
| Spruce | 40.45 | 0.20 | 0.03106 | 0.00 | 1.2549 | 0.03 | 122,743 |
Table 4.
Estimates of the crown projection area functions for European beech, Norway spruce, Scots pine and sessile oak (Equation (1); Section 2.1.1; more detailed database information, see Appendix B.1).
Table 4.
Estimates of the crown projection area functions for European beech, Norway spruce, Scots pine and sessile oak (Equation (1); Section 2.1.1; more detailed database information, see Appendix B.1).
| Tree Species | ln(c) | d | |||
|---|---|---|---|---|---|
| Estimate | Std. Error | Estimate | Std. Error | n | |
| Beech | 0.712 | 0.03 | 0.85 | 0.01 | 10,348 |
| Spruce | −0.8921 | 0.03 | 1.06 | 0.01 | 9997 |
| Pine | −2.21 | 0.05 | 1.48 | 0.02 | 4520 |
| Oak | −2.66 | 0.05 | 1.70 | 0.01 | 3937 |
Table 5.
Average values over simulation time of 100 years with default desired basal area shares.
| Desired Beech Basal Area Share (%) | Average of Simulated Beech Basal Area Share (%) | Average of Simulated Beech Growing Space Share (%) |
|---|---|---|
| 0 | 0 | 0 |
| 20 | 23 | 52 |
| 50 | 52 | 79 |
| 80 | 82 | 94 |
| 100 | 100 | 100 |
© 2018 by the authors. Licensee MDPI, Basel, Switzerland. This article is an open access article distributed under the terms and conditions of the Creative Commons Attribution (CC BY) license (http://creativecommons.org/licenses/by/4.0/).
Share and Cite
MDPI and ACS Style
Schwaiger, F.; Poschenrieder, W.; Biber, P.; Pretzsch, H. Species Mixing Regulation with Respect to Forest Ecosystem Service Provision. Forests 2018, 9, 632. https://doi.org/10.3390/f9100632
AMA Style
Schwaiger F, Poschenrieder W, Biber P, Pretzsch H. Species Mixing Regulation with Respect to Forest Ecosystem Service Provision. Forests. 2018; 9(10):632. https://doi.org/10.3390/f9100632
Chicago/Turabian StyleSchwaiger, Fabian, Werner Poschenrieder, Peter Biber, and Hans Pretzsch. 2018. "Species Mixing Regulation with Respect to Forest Ecosystem Service Provision" Forests 9, no. 10: 632. https://doi.org/10.3390/f9100632
Note that from the first issue of 2016, this journal uses article numbers instead of page numbers. See further details here.